Social support networks and type of neurotic symptom among adults in British households
12
Social support networks and type of neurotic symptom among adults in British households T. S. BRUGHA, 1 Z. MORGAN, P. BEBBINGTON, R. JENKINS, G. LEWIS, M. FARRELL AND H. MELTZER From the Department of Psychiatry, University of Leicester ; Department of Psychiatry and Behavioural Sciences, University College London Medical School, Institute of Psychiatry and Office for National Statistics, London ; and Department of Psychological Medicine, University of Wales College of Medicine, Cardiff ABSTRACT Background. Current knowledge about associations between psychosocial factors and non- psychotic symptoms provide little information about their relationship to specific types of neur- otic symptoms such as symptoms of fatigue, worry, phobic anxiety and obsessional symptoms. Method. The British National Survey of Psychiatric Morbidity was based on a cross-sectional random sample of 10 108 householders. Neurotic symptoms were established by lay interviewers using the revised fully structured Clinical Interview Schedule (CIS-R). Subjects were asked about perceived social support, the size of their close primary social network and sociodemographic attributes. To assess possible associations between specific types of neurotic symptoms and psychosocial risk factors multivariate Huber logistic models (a modified form of repeated measures design modelling) was used taking account of correlation between symptom types and sampling design including clustering. Results. After controlling for sociodemographic factors the risk of having a high total CIS-R score (o12) was approximately doubled for both types of poor social functioning. Specific types of neurotic symptoms were associated both with a small primary group and with inadequate per- ceived social support. Depression, depressive ideas and panic symptoms had a higher prevalence in multivariate models. Poverty was associated with low support. Conclusions. Associations with deficiencies in social support and self-reported neurotic symptoms are better explained by symptom type and in particular by depression than by the total number of symptoms. If confirmed by longitudinal study findings this knowledge could be used to inform the development of interventions to improve social support in order to reduce specific neurotic symptom types. INTRODUCTION A major purpose of community psychiatric surveys is to examine those associations be- tween risk factors and psychiatric disorders in the general population that have been found in patients in receipt of clinical services. De- ficiencies in social support and the protective effect of social support have been the subject of investigation in clinical and small community surveys since the theoretical case for conducting such investigations was set out (Cassel, 1976 ; Cobb, 1976 ; Tolsdorf, 1976 ; Henderson, 1977). Progress since has been documented in various reviews (House et al. 1988; Brugha, 1995). Interest in social support rests not only upon its potential importance as a cause of ill health but in particular upon the possible public health benefit of developing interventions to modify risk and thus to prevent mental disorders in the general population (Mrazek & Haggerty, 1994 ; 1 Address for correspondence : Professor T. S. Brugha, University of Leicester, Section of Social and Epidemiological Psychiatry, Department of Psychiatry, Brandon Mental Health Unit, Leicester General Hospital, Gwendolen Road, Leicester LE5 4PW. 307 Psychological Medicine, 2003, 33, 307–318. f 2003 Cambridge University Press DOI : 10.1017/S0033291702006505 Printed in the United Kingdom
Transcript of Social support networks and type of neurotic symptom among adults in British households

Social support networks and type of neurotic symptomamong adults in British households
T. S. BRUGHA,1 Z. MORGAN, P. BEBBINGTON, R. JENKINS, G. LEWIS,M. FARRELL AND H. MELTZER
From the Department of Psychiatry,University of Leicester ;Department of Psychiatry and Behavioural Sciences,University College London Medical School, Institute of Psychiatry and Office for National Statistics, London ;
and Department of Psychological Medicine, University of Wales College of Medicine, Cardiff
ABSTRACT
Background. Current knowledge about associations between psychosocial factors and non-psychotic symptoms provide little information about their relationship to specific types of neur-otic symptoms such as symptoms of fatigue, worry, phobic anxiety and obsessional symptoms.
Method. The British National Survey of Psychiatric Morbidity was based on a cross-sectionalrandom sample of 10 108 householders. Neurotic symptoms were established by lay interviewersusing the revised fully structured Clinical Interview Schedule (CIS-R). Subjects were asked aboutperceived social support, the size of their close primary social network and sociodemographicattributes. To assess possible associations between specific types of neurotic symptoms andpsychosocial risk factors multivariate Huber logistic models (a modified form of repeated measuresdesign modelling) was used taking account of correlation between symptom types and samplingdesign including clustering.
Results. After controlling for sociodemographic factors the risk of having a high total CIS-Rscore (o12) was approximately doubled for both types of poor social functioning. Specific typesof neurotic symptoms were associated both with a small primary group and with inadequate per-ceived social support. Depression, depressive ideas and panic symptoms had a higher prevalencein multivariate models. Poverty was associated with low support.
Conclusions. Associations with deficiencies in social support and self-reported neurotic symptomsare better explained by symptom type and in particular by depression than by the total numberof symptoms. If confirmed by longitudinal study findings this knowledge could be used to informthe development of interventions to improve social support in order to reduce specific neuroticsymptom types.
INTRODUCTION
A major purpose of community psychiatricsurveys is to examine those associations be-tween risk factors and psychiatric disorders inthe general population that have been foundin patients in receipt of clinical services. De-ficiencies in social support and the protectiveeffect of social support have been the subject of
investigation in clinical and small communitysurveys since the theoretical case for conductingsuch investigations was set out (Cassel, 1976;Cobb, 1976; Tolsdorf, 1976; Henderson, 1977).Progress since has been documented in variousreviews (House et al. 1988; Brugha, 1995).
Interest in social support rests not only uponits potential importance as a cause of ill healthbut in particular upon the possible public healthbenefit of developing interventions to modifyrisk and thus to prevent mental disorders in thegeneral population (Mrazek & Haggerty, 1994;
1 Address for correspondence: Professor T. S. Brugha, Universityof Leicester, Section of Social and Epidemiological Psychiatry,Department of Psychiatry, Brandon Mental Health Unit, LeicesterGeneral Hospital, Gwendolen Road, Leicester LE5 4PW.
307
Psychological Medicine, 2003, 33, 307–318. f 2003 Cambridge University PressDOI: 10.1017/S0033291702006505 Printed in the United Kingdom
Harris et al. 1999). Valuable information aboutthe role of social support in the inception ofpsychiatric disorder comes from community-based prospective studies (Brown et al. 1986).
Most research focuses on either symptomsof depression or on non-specific psychologicaldistress in accordance with a dimensional viewof neurosis (Goldberg & Huxley, 1992). Thisis the most parsimonious model of neurosisdisturbance, but it might yet be the case that thedistribution of specific neurotic disorder offersa better description of clinical reality. However,there is insufficient comparative informationabout the nature of risk factors for the develop-ment of specific forms of symptomatology suchas fatigue, worry and nervous tension, phobicanxiety and obsessive–compulsive symptoms.Psychological and other biological mechanismsunderlying these may differ in relation to socialrisk factors. Such information would providepotentially valuable public health informationas a forerunner to the development and evalu-ation of targeted prevention and health pro-motion interventions (Mrazek & Haggerty,1994). By way of illustration, suppose the riskfactor ‘small social network’ primarily pre-dicted social anxiety (and secondarily depres-sion) the development of an intervention toprevent depression could begin by consideringsuch a mechanism.
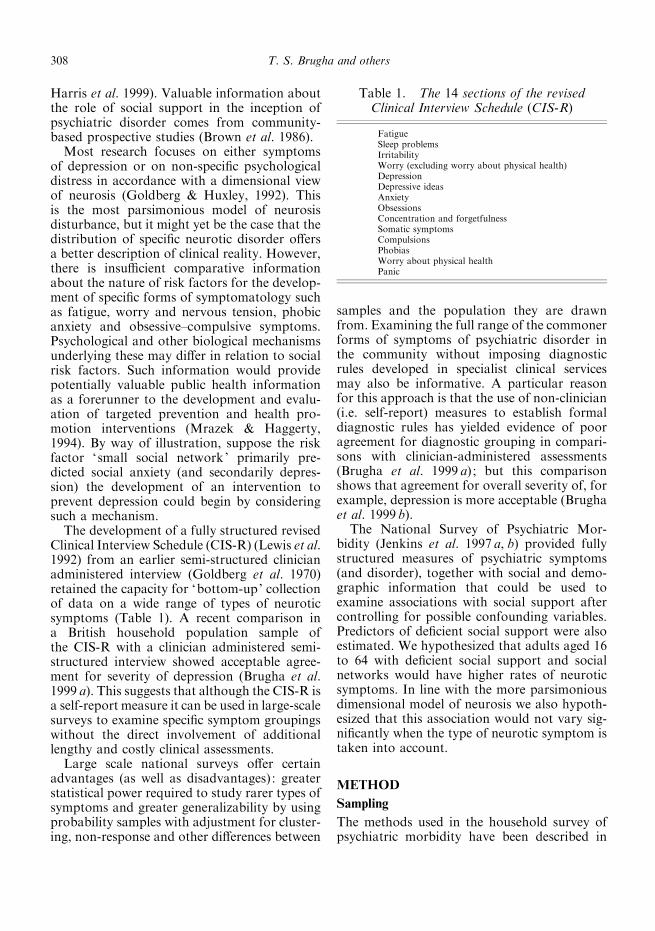
The development of a fully structured revisedClinical Interview Schedule (CIS-R) (Lewis et al.1992) from an earlier semi-structured clinicianadministered interview (Goldberg et al. 1970)retained the capacity for ‘bottom-up’ collectionof data on a wide range of types of neuroticsymptoms (Table 1). A recent comparison ina British household population sample ofthe CIS-R with a clinician administered semi-structured interview showed acceptable agree-ment for severity of depression (Brugha et al.1999 a). This suggests that although the CIS-R isa self-report measure it can be used in large-scalesurveys to examine specific symptom groupingswithout the direct involvement of additionallengthy and costly clinical assessments.
Large scale national surveys offer certainadvantages (as well as disadvantages) : greaterstatistical power required to study rarer types ofsymptoms and greater generalizability by usingprobability samples with adjustment for cluster-ing, non-response and other differences between
samples and the population they are drawnfrom. Examining the full range of the commonerforms of symptoms of psychiatric disorder inthe community without imposing diagnosticrules developed in specialist clinical servicesmay also be informative. A particular reasonfor this approach is that the use of non-clinician(i.e. self-report) measures to establish formaldiagnostic rules has yielded evidence of pooragreement for diagnostic grouping in compari-sons with clinician-administered assessments(Brugha et al. 1999 a) ; but this comparisonshows that agreement for overall severity of, forexample, depression is more acceptable (Brughaet al. 1999 b).
The National Survey of Psychiatric Mor-bidity (Jenkins et al. 1997 a, b) provided fullystructured measures of psychiatric symptoms(and disorder), together with social and demo-graphic information that could be used toexamine associations with social support aftercontrolling for possible confounding variables.Predictors of deficient social support were alsoestimated. We hypothesized that adults aged 16to 64 with deficient social support and socialnetworks would have higher rates of neuroticsymptoms. In line with the more parsimoniousdimensional model of neurosis we also hypoth-esized that this association would not vary sig-nificantly when the type of neurotic symptom istaken into account.
METHOD
Sampling
The methods used in the household survey ofpsychiatric morbidity have been described in
Table 1. The 14 sections of the revisedClinical Interview Schedule (CIS-R)
FatigueSleep problemsIrritabilityWorry (excluding worry about physical health)DepressionDepressive ideasAnxietyObsessionsConcentration and forgetfulnessSomatic symptomsCompulsionsPhobiasWorry about physical healthPanic
308 T. S. Brugha and others

greater detail elsewhere (Meltzer et al. 1995 a,b, c ; Jenkins et al. 1997 a, b). The field-work wascarried out in 1993. The sample was drawn usingthe small area Postcode Address File as thesampling frame (Wilson & Elliot, 1987). Twohundred postal sectors covering all of GreatBritain, except the Highlands and Islands ofScotland, were selected at random with a prob-ability proportional to the number of deliverypoints. Within each of these, 90 delivery pointswere randomly selected to generate a sampleof 18 000 delivery points. From among theseaddresses, private households with at least oneperson aged 16 to 64 were identified. In all,15 765 private households were identified: 12 730adults were eligible for interview, of whom10 108 agreed to take part in the survey. Onlyone eligible adult (i.e. aged 16–64) was inter-viewed in each household, randomly selectedby the Kish grid method (Kish, 1965). Prob-ability weights were used to take account ofthis sampling procedure and also to renderthe sample representative of the demographiccharacteristics of the population in Britain.
Interviewers and interviewer training
The interviews were carried out by two hundredinterviewers from the Social Survey Divisionfieldwork team of the British Office for Popu-lation Censuses and Surveys (now the SocialSurvey Division of the Office for NationalStatistics). These interviewers had a minimumof 3 years’ prior interviewing experience andattended for a 1 day training programme inthe use of the survey instruments, including therevised Clinical Interview Schedule (CIS-R)(Lewis et al. 1992). Field-work was closelymonitored by supervisors in the field and byheadquarters staff.
Assessment
Neurotic psychiatric symptoms and disorderswas assessed using the CIS-R. This has advan-tages that made it suitable for the NationalSurvey. It is designed to be administered bynon-clinically trained interviewers, and thiswas straightforward for the experienced ONSinterviewers used in the survey. Moreover, theinterview itself is relatively short (ranging from15 to 30 min) compared with other methods ofassessment.
The CIS-R was used to establish an overallsymptom score. It has 14 sections (panel) scoredfrom 0 to 4 (except for the section on DepressiveIdeas, which has a maximum score of 5). Withineach section symptoms are regarded as severe ifthey have a score ofo2. A summed (total) scoreis also available that can in theory range be-tween 0 and 57. The overall threshold score forsignificant psychiatric morbidity is 12 (Lewiset al. 1992).
Perceived social support was assessed fromrespondents’ answers to seven questions takenfrom the 1987 Health and Lifestyle survey(Cox et al. 1987). These questions were alsoasked in the Health Survey for England (Breezeet al. 1994), providing additional comparativedata. The seven questions take the form ofstatements which individuals could say were nottrue, partly true, or certainly true of their familyand friends. Scores of 1–3 were obtained foreach question and overall scores ranged from7 to 21. The maximum score of 21 indicatedno lack of social support, scores of 18 to 20indicated a moderate lack of social support andscores off17 showed that individuals perceiveda severe lack of social support. The seven state-ments are:
There are people I know – amongst my familyor friends –
(1) who do things to make me happy;(2) who make me feel loved;(3) who can be relied on no matter what
happens;(4) who would see that I am taken care of if
I needed to be;(5) who accept me just as I am;(6) who make me feel an important part of
their lives ;(7) who give me support and encouragement.The size of an individual’s primary support
group was assessed with a series of questionsfocused on the numbers of friends and relatives(aged o16) respondents felt close to (Brughaet al. 1987). Data were collected about threegroups of people:
(1) adults who lived with respondents thatrespondents felt close to;
(2) relatives who did not live with respon-dents that they felt close to;
(3) friends or acquaintances who did not livewith respondents but who would be described asclose or good friends.
Social support networks and British households 309

Close friends and relatives form an individ-ual’s ‘primary support group’ (Henderson et al.1978; Brugha et al. 1982) ; adults with a totalprimary group size of three people or fewer havepreviously been shown to be at greatest risk ofpsychiatric morbidity (Brugha et al. 1993).
Information was sought about variables thatmight confound in the association betweenneurotic disorder and social support deficits.Respondents completed questions covering em-ployment status, type of family unit (householdcomposition), long-standing physical ill health,location in a rural, semi-rural versus an urbanarea (Paykel et al. 2000) and access to a car.Employment status covered four groups: work-ing full-time; working part-time; unemployed;and economically inactive. Because only thatpart of the sample who were classified as havinga mental disorder were asked specific questionsabout their financial circumstances, the avail-ability of a car was used as a proxy for income.We have used this variable effectively before(Lewis et al. 1998). The type of family unit wasdivided into five categories : one person familyunits ; couples with children; couples withoutchildren; single-parent households; and, re-spondents living with parents (Meltzer & Gill,1993). Long-standing ill health was establishedby asking respondents if they suffered fromany long-standing illness, disability or infirmity(Meltzer & Gill, 1993). All adults interviewedin the survey were asked whether they hadexperienced one of 11 stressful life events duringthe past 6 months because such events mayconfound the association between social sup-port deficits and psychiatric disorders (Brughaet al. 1990 a). The events and problems weretaken from the List of Threatening Experiences(Brugha et al. 1985). They were: personallysuffering a serious illness ; injury or assault ; aclose relative suffering a serious illness, injury orassault ; death of a parent, spouse/partner, child,brother or sister ; death of a close family friendor another relative ; marital separation/break-upof steady relationship; serious problem with aclose friend, neighbour or relative ; redundancy/sacking from job; unsuccessfully seeking workfor more than 1 month; major financial crisis,such as losing the equivalent of 3 monthsincome; problems with the police involving acourt appearance ; something valued being lostor stolen. In this paper, we examine stressful life
events in terms of the presence of one or moreevents experienced in the 6-month period priorto interview.
Analysis
Analyses were based on all respondents whowere directly interviewed in the NationalSurvey: 271 subjects assessed by proxy werenot included, as there were no CIS-R data onthem. Analyses were based on weighted dataperformed using the survey commands inSTATA 6.0 (STATA Corp, 1999), which givesmore accurate precision of parameter estimateswith the use of survey data incorporating prob-ability weights to take account of samplingdesign including geographic clustering. Weestimated the population proportion with twoor more items endorsed within each neuroticsymptom type according to the level of per-ceived social support and the grouped primarygroup size. We used logistic regression (forsurvey data) to examine sociodemographic pre-dictors of deficient social support. A total CIS-Rscore of o12 was employed as the dependentvariable in a logistic regression model withsocial support, other sociodemographic factorsand recent threatening life events as predictors.Standard statistical methods could not be usedto investigate the association between socialsupport networks and non-psychotic symptomsindividually, as they are non-independent. Forexample you can not build a prediction modelfor fatigue in the absence of other neuroticsymptoms; ignoring this will almost certainlylead to poor estimates of the standard errors.The problem is similar to that of a multiple(repeated) measures outcome design. Therefore,we used multivariate Huber logistic regressionto analyse data for all 14 symptoms simul-taneously, in an effort to establish whether ornot social support networks are commonly as-sociated with all symptoms or whether or notsocial support networks are selectively associ-ated with particular symptoms. We employedXTGEE (STATA Corp, 1999) as suggested andused by (Zahner & Daskalakis, 1997; Hortonet al. 1999), specifying the within-group corre-lation structure, and obtained estimated oddsratios and 95% confidence intervals for multi-variate Huber logistic models (robust varianceestimater). The estimates presented are adjustedfor clustering on each individual (i.e. correlated
310 T. S. Brugha and others
observations) and also incorporate samplingweights (full details available from the authors).
RESULTS
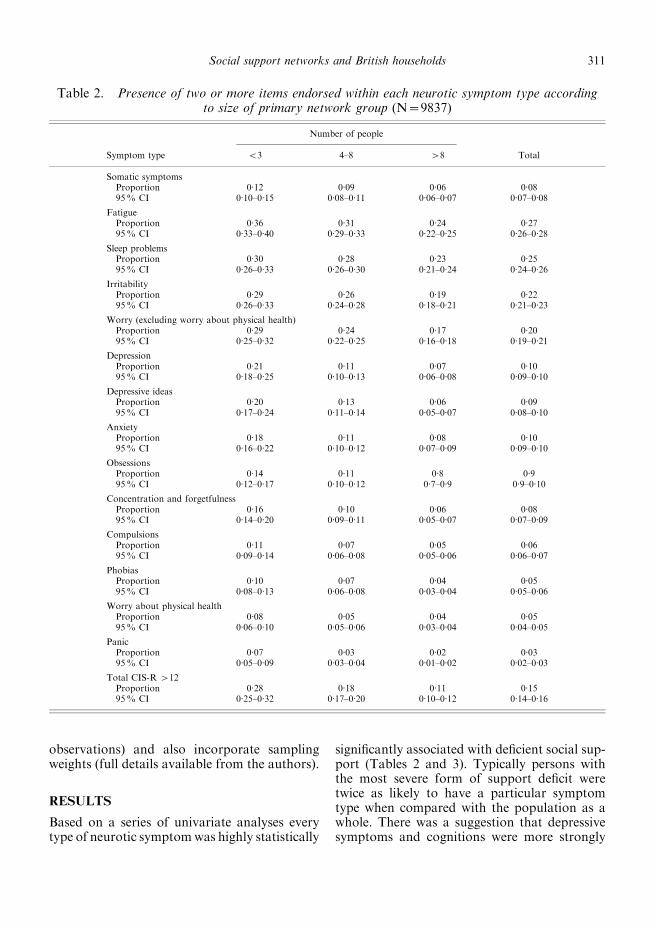
Based on a series of univariate analyses everytype of neurotic symptomwas highly statistically
significantly associated with deficient social sup-port (Tables 2 and 3). Typically persons withthe most severe form of support deficit weretwice as likely to have a particular symptomtype when compared with the population as awhole. There was a suggestion that depressivesymptoms and cognitions were more strongly
Table 2. Presence of two or more items endorsed within each neurotic symptom type accordingto size of primary network group (N=9837)
Number of people
Symptom type <3 4–8 >8 Total
Somatic symptomsProportion 0.12 0.09 0.06 0.0895% CI 0.10–0.15 0.08–0.11 0.06–0.07 0.07–0.08
FatigueProportion 0.36 0.31 0.24 0.2795% CI 0.33–0.40 0.29–0.33 0.22–0.25 0.26–0.28
Sleep problemsProportion 0.30 0.28 0.23 0.2595% CI 0.26–0.33 0.26–0.30 0.21–0.24 0.24–0.26
IrritabilityProportion 0.29 0.26 0.19 0.2295% CI 0.26–0.33 0.24–0.28 0.18–0.21 0.21–0.23
Worry (excluding worry about physical health)Proportion 0.29 0.24 0.17 0.2095% CI 0.25–0.32 0.22–0.25 0.16–0.18 0.19–0.21
DepressionProportion 0.21 0.11 0.07 0.1095% CI 0.18–0.25 0.10–0.13 0.06–0.08 0.09–0.10
Depressive ideasProportion 0.20 0.13 0.06 0.0995% CI 0.17–0.24 0.11–0.14 0.05–0.07 0.08–0.10
AnxietyProportion 0.18 0.11 0.08 0.1095% CI 0.16–0.22 0.10–0.12 0.07–0.09 0.09–0.10
ObsessionsProportion 0.14 0.11 0.8 0.995% CI 0.12–0.17 0.10–0.12 0.7–0.9 0.9–0.10
Concentration and forgetfulnessProportion 0.16 0.10 0.06 0.0895% CI 0.14–0.20 0.09–0.11 0.05–0.07 0.07–0.09
CompulsionsProportion 0.11 0.07 0.05 0.0695% CI 0.09–0.14 0.06–0.08 0.05–0.06 0.06–0.07
PhobiasProportion 0.10 0.07 0.04 0.0595% CI 0.08–0.13 0.06–0.08 0.03–0.04 0.05–0.06
Worry about physical healthProportion 0.08 0.05 0.04 0.0595% CI 0.06–0.10 0.05–0.06 0.03–0.04 0.04–0.05
PanicProportion 0.07 0.03 0.02 0.0395% CI 0.05–0.09 0.03–0.04 0.01–0.02 0.02–0.03
Total CIS-R >12Proportion 0.28 0.18 0.11 0.1595% CI 0.25–0.32 0.17–0.20 0.10–0.12 0.14–0.16
Social support networks and British households 311

associated with deficient social support (Tables2 and 3) but the overall impression was of thesimilarity of associations with a deficiency inprimary group size and perceived social sup-port across symptom types (Tables 2 and 3).
Given the lack of firm and consistentassociations with any specific type of neurotic
symptom in univariate analyses, the total CIS-Rscore (o12 versus fewer neurotic symptoms ofany type) was used in logistic regression models(Table 4). There was a higher prevalence ofneurotic disorder in those with a primarysupport group of f3 (odds ratio, 2.4; 95%CI, 2.0 to 3.0) compared with a larger primary
Table 3. Presence of two or more items endorsed within each neurotic symptom type accordingto level of perceived social support deficit (N=9708)
Perceived social support score grouped
Symptom type Severe Moderate No lack Total
Somatic symptomsProportion 0.11 0.08 0.07 0.0795% CI 0.09–0.14 0.07–0.09 0.06–0.07 0.07–0.08
FatigueProportion 0.33 0.28 0.25 0.2795% CI 0.30–0.37 0.26–0.30 0.24–0.27 0.26–0.28
Sleep problemsProportion 0.31 0.26 0.23 0.2595% CI 0.28–0.35 0.24–0.28 0.22–0.25 0.24–0.26
IrritabilityProportion 0.29 0.26 0.20 0.2295% CI 0.26–0.32 0.24–0.28 0.19–0.21 0.21–0.23
Worry (excluding worry about physical health)Proportion 0.30 0.21 0.18 0.2095% CI 0.26–0.32 0.20–0.23 0.17–0.19 0.19–0.21
DepressionProportion 0.21 0.10 0.08 0.0995% CI 0.18–0.24 0.09–0.12 0.07–0.08 0.09–0.10
Depressive ideasProportion 0.18 0.11 0.07 0.0995% CI 0.16–0.21 0.09–0.13 0.06–0.08 0.08–0.10
AnxietyProportion 0.17 0.10 0.08 0.0995% CI 0.14–0.19 0.09–0.11 0.08–0.09 0.09–0.10
ObsessionsProportion 0.14 0.10 0.08 0.0995% CI 0.12–0.16 0.09–0.11 0.08–0.09 0.09–0.10
Concentration and forgetfulnessProportion 0.15 0.09 0.07 0.0895% CI 0.13–0.18 0.08–0.10 0.06–0.07 0.07–0.09
CompulsionsProportion 0.08 0.07 0.06 0.0695% CI 0.07–0.10 0.06–0.08 0.05–0.06 0.06–0.07
PhobiasProportion 0.09 0.06 0.04 0.0595% CI 0.07–0.11 0.05–0.07 0.04–0.05 0.05–0.06
Worry about physical healthProportion 0.09 0.04 0.04 0.0595% CI 0.07–0.11 0.03–0.05 0.04–0.05 0.04–0.05
PanicProportion 0.06 0.02 0.02 0.0295% CI 0.05–0.08 0.02–0.03 0.02–0.03 0.02–0.03
Total CIS-R >12Proportion 0.27 0.15 0.12 0.1595% CI 0.24–0.30 0.14–0.17 0.11–0.14 0.14–0.16
312 T. S. Brugha and others

group; the odds ratio for severe lack of per-ceived social support was 2.4 (95% CI, 2.0 to2.8). The association with social support deficitwas hardly affected by including in an adjustedlogistic model other factors that might explainthe association with deficient social support,including unemployment, an index of poverty(lack of car ownership), reporting a threateninglife event in the previous 6 months, living as asingle parent with one or more children, femalegender and information on long-term physicalhealth problems (Table 4). After controlling forthese potential confounders, respondents with asevere deficit in perceived social support werestill more than twice as likely to have a highCIS-R score (Table 4). Respondents with a pri-mary support group off3 were just under twiceas likely to have a high CIS-R score when com-pared with those with a larger primary group(Table 4). Additional analysis also showed thatthe association was not altered by taking intoaccount living in an urban area and difficultieswith carrying out activities of daily living, whichare strongly associated with neurotic disorder(Bebbington et al. 2000; Paykel et al. 2000).
Table 5 presents the estimated odds ratios and95% confidence intervals for six multivariateHuber logistic models. Models 1 and 2 areunadjusted for any other covariates. Models3 and 4 are adjusted for low perceived socialsupport/small primary support group, unem-ployment, sex, family unit type, no use of car, nolongstanding illness and any threatening lifeevents in past year. Models 5 and 6 are adjustedfor low perceived social support/small primary
support group, living in an urban area, diffi-culties in carrying out activities of daily living,unemployment, sex, family unit type, no use ofcar, no longstanding illness and any threateninglife events in past year.
As the effects of primary support groupdiffered by symptom (i.e. interactions betweenprimary support group size and symptoms weresignificant at the 5% level), separate effects wereestimated for each symptom; these results arepresented in models 1, 3 and 5 in Table 5.
Associations between primary support groupsize and neurotic symptoms varied by symptomtype. In Model 1, a significant interaction be-tween primary support group size and symptomtype indicated higher prevalence of somaticsymptoms, problems with concentration/forget-fulness, worrying about physical health, de-pression, depressive ideas, anxiety, phobias andpanic symptoms, for subjects with a primarygroup size of f3 compared with subjects witha larger primary support group. Other thanphobias, these findings were not affected byadjustment for low perceived social support,unemployment, sex, family unit type, no use ofcar, no longstanding illness and any threateninglife events in past year (Table 5, Model 3). Whenadjustments were made for low perceived socialsupport, living in an urban area, difficulties incarrying out activities of daily living, unemploy-ment, sex, family unit type, no use of car, nolongstanding illness and any threatening lifeevents in past year (Model 5), higher prevalenceof problems with concentration/forgetfulness,depression, depressive ideas, anxiety and panic
Table 4. Survey logistic regression on CIS-R total score o12
Predictor variable OR 95% CI Adjusted OR 95% CI
Primary support group f3 2.43 2.01–2.93 1.89 1.53–2.33Perceived social support low (v. adequate) 2.40 2.03–2.84 2.06 1.7–2.49Employment status : (unemployed v. FT/PT/economically inactive) 1.98 1.64–2.38 1.42 1.14–1.76Family type:Couple with no children — — 1.0 —Couple with children 1.21 1.03–1.42 1.31 1.11–1.55Lone parent with o1 children 2.64 2.16–3.23 1.80 1.42–2.27One person in household 1.73 1.45–2.05 1.47 1.20–1.79Adult living with one parent 0.73 0.54–0.99 0.81 0.59–1.11Adult living with both parents 1.17 0.77–1.79 1.10 0.69–1.76
Sex (female v. male) 1.79 1.58–2.03 1.91 1.66–2.21No use of car 1.95 1.70–2.23 1.31 1.11–1.56No longstanding illness of disability 0.32 0.28–0.37 0.40 0.30–0.39Any threatening life event in past year (v. none) 2.61 2.27–2.99 2.35 2.04–2.72
Number of observations 9837; F 12, 173=64.6; P=0.0000.
Social support networks and British households 313

Table 5. Odds Ratio (95%CI ) for multivariate Huber logistic models of each symptom type taking account of each other symptom type
Somatic Fatigue
Conc/
Forget Sleep Irritability
Worry/
Physical
health Depression
Depressive
ideas Worry Anxiety Phobias Panic Compulsion Obsessions
Models 1 and 2
Primary support
group f3
1.61
(1.28, 2.00)*
1.34
(0.86, 2.08)
2.22
(1.38, 3.56)*
1.39
(0.87, 2.22)
1.38
(0.87, 2.17)
2.16
(1.32, 3.54)*
2.69
(1.68, 4.29)*
2.42
(1.52, 3.87)*
1.69
(1.08, 2.65)
2.10
(1.32, 3.32)*
1.99
(1.17, 3.37)*
3.13
(1.80, 5.42)*
1.41
(0.83, 2.39)
1.54
(0.94, 2.52)
Perceived social
support low
(v. adequate)
1.65
(1.28, 2.12)*
1.56
(0.94, 2.59)
2.45
(1.42, 4.23)*
1.32
(0.78, 2.21)
1.45
(0.86, 2.42)
1.89
(1.05, 3.41)
2.82
(1.63, 4.84)*
2.68
(1.55, 4.62)*
1.66
(0.99, 2.76)
2.27
(1.33, 3.85)*
2.35
(1.30, 4.25)*
3.27
(1.72, 6.20)*
2.05
(1.14, 3.66)*
1.67
(0.94, 2.93)
Models 3 and 4
Primary support
group f3
1.41
(1.12, 1.75)*
1.21
(0.76, 1.89)
1.98
(1.22, 3.20)*
1.25
(0.77, 2.02)
1.23
(0.77, 1.97)
1.89
(1.14, 3.13)*
2.43
(1.50, 3.92)*
2.17
(1.34, 3.50)*
1.53
(0.96, 2.42)
1.87
(1.16, 2.99)*
1.74
(1.01, 2.98)
2.72
(1.55, 4.76)*
1.23
(0.71, 2.10)
1.35
(0.81, 2.23)
Perceived social
support low
(v. adequate)
1.30
(1.00, 1.68)
1.28
(0.76, 2.16)
1.97
(1.12, 3.46)*
1.06
(0.62, 1.81)
1.17
(0.68, 2.00)
1.49
(0.81, 2.73)
2.30
(1.31, 4.02)*
2.17
(1.23, 3.81)*
1.35
(0.79, 2.28)
1.83
(1.05, 3.16)
1.87
(1.01, 3.44)
2.58
(1.33, 4.97)*
1.63
(0.89, 2.97)
1.32
(0.73, 2.32)
Models 5 and 6
Primary support
group f3
1.32
(1.05, 1.65)
1.15
(0.73, 1.81)
1.88
(1.15, 3.05)*
1.19
(0.73, 1.93)
1.17
(0.73, 1.88)
1.78
(1.07, 2.95)
2.32
(1.43, 3.76)*
2.07
(1.27, 3.34)*
1.46
(0.92, 2.32)
1.78
(1.10, 2.86)*
1.63
(0.94, 2.81)
2.55
(1.45, 4.47)*
1.15
(0.66, 1.97)
1.27
(0.76, 2.12)
Perceived social
support low
(v. adequate)
1.23
(0.95, 1.60)
1.24
(0.72, 2.11)
1.89
(1.06, 3.36)
1.02
(0.58, 1.76)
1.12
(0.65, 1.94)
1.41
(0.76, 2.62)
2.21
(1.24, 3.92)*
2.09
(1.17, 3.71)*
1.29
(0.75, 2.22)
1.75
(0.99, 3.06)
1.78
(0.95, 3.32)
2.45
(1.25, 4.77)*
1.55
(0.84, 2.87)
1.26
(0.69, 2.29)
Models 1 and 2: unadjusted for any other covariates.Models 3 and 5: adjusted for low perceived social support/small primary support group, unemployment, sex, family unit type, no use of car, no longstanding illness and any threatening life
events in past year.Models 5 and 6: adjusted for low perceived social support/small primary support group, living in an urban area, difficulties in carrying out activities of daily living, unemployment, sex, family
unit type, no use of car, no longstanding illness and any threatening life events in past year.*P<0.05.
314
T.S.Brughaandothers

symptoms were indicated for subjects with aprimary group size of f3 compared with sub-jects with a larger primary support group.
As the effects of perceived social supportdiffered by symptom (i.e. interactions betweenperceived social support and symptoms weresignificant at the 5% level), separate effectswere estimated for each symptom; these resultsare presented in models 2, 4 and 6 in Table 5.
Associations between perceived social sup-port and neurotic symptoms also varied bysymptom type. In Model 2, a significant inter-action between perceived social support andsymptom type indicated higher prevalence ofsomatic symptoms, problems with concentra-tion/forgetfulness, depression, depressive ideas,anxiety, phobias, panic symptoms and compul-sions, for subjects with low perceived socialsupport compared with subjects with adequateperceived social support. Other than somaticsymptoms, anxiety, phobias and compulsions,these findings were not affected by adjustmentfor small primary support group, unemploy-ment, sex, family unit type, no use of car, nolongstanding illness and any threatening lifeevents in past year (Model 4). When adjust-ments were made for small primary supportgroup, living in an urban area, difficulties incarrying out activities of daily living, unemploy-ment, sex, family unit type, no use of car, nolongstanding illness and any threatening lifeevents in past year (Model 6), higher prevalenceof depression, depressive ideas and panic symp-toms were indicated for subjects with low per-ceived social support compared with subjectswith adequate perceived social support.
In summary, depression, depressive ideasand panic symptoms have higher prevalence(significant) in subjects with deficits in socialsupport networks, in all six models. No otherinteractions between symptoms and other socio-demographic predictors were examined.
Logistic regression models were also used todetermine predictors of social support deficits.We report here only associations with prob-ability values<1% (detailed tables available onrequest). Having a primary group size of f3was found to be predicted by male gender, long-term physical ill health, lack of car ownershipand living either as a single parent or as an adultliving with both parents only. Neither unem-ployment nor recent stressful life events were
associated. However, a severe deficit in per-ceived social support was associated with all ofthese variables. It was also associated with allfamily unit types apart from living as a couple(with or without children).
DISCUSSION
In this study, using an appropriate multivariatestatistical model, we have shown that theassociation between deficits in social supportand neurotic symptoms is better explained byassociations conditional upon the type ofsymptom assessed. We have also been able toidentify factors associated with deficits in socialsupport that might be informative in designingrisk factor reduction programmes to preventspecific types of neurotic symptoms in thecommunity, depression and depressive ideasbeing the most consistently predicted by lowsocial support.
A number of study limitations need to beconsidered. First, no causal inference can bemade of the association of social support deficitswith specific types of neurotic symptoms re-ported here. Clearly longitudinal research withinsuch samples is required in order to betterunderstand these findings, including examiningthe alternative conclusion that such symptomscause low support. Elsewhere we report findingsfrom an earlier national survey (Grainge et al.2000) in men assessed prospectively in whichthe same measure of perceived social supportpredicted respondents’ overall depressive symp-tom levels 7 years later even when priorsymptoms were controlled for in the analysis ;among women the effect of perceived socialsupport was weaker and possibly attributable tothe play of chance. We discuss other relevantlongitudinal studies of different indices of socialsupport below. However, we are encouraged inthinking that at least some important element ofthe direction of causality is from social riskfactors to symptoms because our findings standup when we control for other environmentaland individual factors that would be expectedto act as confounders, such as difficulties incarrying out activities of daily living and thepresence of longstanding illness (Table 5) bothof which would be expected to reduce the abilityof an individual to maintain their supportsystem.
Social support networks and British households 315
A second possible limitation in the presentstudy was that only self-report measures ofrisk factors and neurotic symptoms were used,albeit administered by experienced survey inter-viewers. The utility of such self-report methodshas been investigated very little. When geneticand environmental risk factors for depressionin the preceding month were examined in acomparison of the semi-structured SCID-Iand self report SCL in female twins the betweentwin monozygotic and dizygotic correlationsfor depression were 0.26 and 0.03 for the SCLand 0.43 and 0.19 for the SCID (Foley et al.2001). When Andrews & Brown (1993) com-pared two measures of low self-esteem in astudy of depression in women, the investigator-rated Self-Esteem and Social Support scales(SESS) and a self-report measure, they foundthat the SESS accounted for unique vari-ance when the two measures were consideredtogether and current depression was con-trolled (Andrews & Brown, 1993). With regardto our findings firmer conclusions might bepossible by integrating information from thepresent self-report measures with data pro-vided by instruments employing clinical ratingsor investigator judgements (Brugha et al.1999 b).
However, we have been able to address afurther major potential methodological limi-tation by appropriately modelling predictorsof non-independent multiple dependent (or out-come) variables. This method has only beenapplied previously on one occasion to ourknowledge and in a somewhat simpler case toidentify factors associated with service use forchild psychopathology in just three settings :mental health, general health, and school(Zahner & Daskalakis, 1997; Horton et al.1999). Had we not made use of this method wecould have reached the misleading conclusionthat our social risk factors predict all neuroticsymptom types essentially equivalently asTables 2 and 3 appear to suggest. The findingsin Table 5 point interestingly to the conclusionthat deficits in social network size and social sup-port predict specifically psychological/cognitiveaspects of neurotic disorder and not its somaticand physical health correlates. This would seemto fit with theory suggesting that the cognitiveand not the somatic aspects of depression arepredicted by social risk factors. However, we
have yet to examine this in relation to otherrisk measures of interest to us such as stress-ful life events (Brugha & Conroy, 1985;Bebbington et al. 1988).
A previous report from the present surveyfound that depressive symptoms were notspecifically associated with socio-economicindicators after adjustment for the total scoreon the CIS-R (Lewis et al. 1998). This is incontrast, for example, with work suggestingthat life events involving loss and dangerrespectively are more likely to be associatedwith depressive and anxiety disorders respec-tively (Finlay-Jones & Brown, 1981; Brownet al. 1992, 1995). However, neither of theseearlier studies made use of the modellingspecifications employed here (Table 5).
Comment is also warranted by our findingthat, of our two indices of social support, thesize of the close social network (‘primary groupsupport ’ (Table 5)) is significantly associatedwith a slightly wider range of symptom typesthan the presumably more subjective indexof perceived social support. Surprisingly, thesimple to collect variable primary group size hasbeen of little interest to other social supportresearchers over the past three decades (Brugha,1988; Brugha et al. 1998). The importance ofperceived or subjective social support has beenendorsed in a wide range of social supportstudies, but few researchers have focused onthe size of the person’s primary social network.Nevertheless, as in this study, our work repeat-edly shows that these two variables functionindependently of one another. Two early case–control studies (Henderson et al. 1978; Brughaet al. 1982) were followed by other studiesshowing the importance of network size inpredicting recovery from depression (Brughaet al. 1990 b) but curiously not in the onset ofpostnatal depression (Brugha et al. 1998). Wehope that other researchers will be encouragedto investigate this further. A clue to possiblefuture directions for this work came from astudy that showed that primary group sizepredicts recovery not in a first or second episodebut in later episodes of depression (Brugha et al.1997). One possible explanation put forwardwas that adults who had recurrent depressiveepisodes will perforce have learnt who they cantruly rely upon as a source of close support ;it may be that their replies to such a social
316 T. S. Brugha and others

network interview generate more valid infor-mation about the construct.
Environmental and individual influencesboth need to be considered in researching the‘causes’ of social support including develop-mental (Champion, 1995), and cognitive aspects(Brewin, 1995). If longitudinal research sup-ports the suggestion that levels of social supportpredict specific types of neurotic symptoms, thisshould be followed by the development of inter-ventions that could then be evaluated usingexperimental designs (Brugha et al. 2000). Thedevelopment of effective risk reduction inter-ventions is likely to depend on the identificationof malleable risk and protective factors (Mrazek& Haggerty, 1994) and of their causes. Tworelated factors appear to be associated with thesocial support deficits found in the presentstudy: poverty; and, living in a household eitheralone or in the role of a single carer. Both ofthese factors might be amenable to action atdifferent levels of input ranging from individualto community support and the provision ofmaterial and welfare support at a wider societallevel. But from the point of view of the preven-tion of future neurotic symptoms, the presentdata do suggest that the development of inter-ventions designed to improve social supportcould turn out to operate differently in relationto specific types of symptoms. Thus, depressionand possibly generalized anxiety and panicappear to be associated with social support defi-cits but not phobias or obsessive–compulsivephenomena suggesting that different riskfactors and mechanisms apply to those formsof psychopathology (Table 5). Both theor-etical and empirical research will be neededtherefore.
In conclusion, highly significant associationshave been found between specific types ofneurotic symptoms, particularly depressivesymptoms, and social network variables, andthese are not removed when account is takenof other psychosocial confounders. Infor-mation about the possible causes of social sup-port deficits should inform the developmentof risk reducing interventions at the popu-lation and individual level. The developmentand evaluation of such interventions maylead to better informed prevention policiesand improved mental health in the generalpopulation.
REFERENCES
Andrews, B. & Brown, G. W. (1993). Self-esteem and vulnerability todepression: the concurrent validity of interview and questionnairemeasures. Journal of Abnormal Psychology 102, 565–572.
Bebbington, P., Brugha, T., Meltzer, H., Farrell, M., Ceresa, C.,Jenkins, R. & Lewis, G. (2000). Psychiatric disorder anddysfunction in the UK national survey of psychiatric morbidity.Social Psychiatry and Psychiatric Epidemiology 35, 191–197.
Bebbington, P. E., Brugha, T., MacCarthy, B., Potter, J., Sturt, E.,Wykes, T., Katz, R. & McGuffin, P. (1988). The CamberwellCollaborative Depression Study. I. Depressed probands: adversityand the form of depression. British Journal of Psychiatry 152,754–765.
Breeze, E., Maidment, A., Bennett, N., Flatley, J. & Carey, S. (1994).Health Survey for England 1992. HMSO: London.
Brewin, C. R. (1995). Cognitive aspects of social support processes.In Social Support and Psychiatric Disorder: Research Findings andGuidelines for Clinical Practice (ed. T. S. Brugha), pp. 96–116.Cambridge University Press : Cambridge.
Brown, G. W., Andrews, B., Harris, T., Adler, Z. & Bridge, L.(1986). Social Support, self-esteem and depression. PsychologicalMedicine 16, 813–831.
Brown, G. W., Lemyre, L. & Bifulco, A. (1992). Social factors andrecovery from anxiety and depressive disorders : a test ofspecificity. British Journal of Psychiatry 161, 1–54.
Brown, G. W., Harris, T. O. & Hepworth, C. (1995). Loss,humiliation and entrapment among women developing depres-sion: a patient and non patient sample. Psychological Medicine 25,7–21.
Brugha, T. (1988). Social Psychiatry. In The Instruments ofPsychiatric Research (ed. C. Thompson), pp. 253–270. Wiley:Chichester.
Brugha, T. S. (1995). Social support and psychiatric disorder : over-view of evidence. In Social Support and Psychiatric Disorder:Research Findings and Guidelines for Clinical Practice (ed. T. S.Brugha), pp. 1–40. Cambridge University Press : Cambridge.
Brugha, T. S. & Conroy, R. (1985). Categories of depression:reported life events in a controlled design. British Journal ofPsychiatry 147, 641–646.
Brugha, T., Conroy, R., Walsh, N., Delaney, W., O’Hanlon, J.,Dondero, E., Daly, L., Hickey, N. & Bourke, G. (1982). Socialnetworks, attachments and support in minor affective disorders :a replication. British Journal of Psychiatry 141, 249–255.
Brugha, T., Bebbington, P., Tennant, C. & Hurry, J. (1985). The Listof Threatening Experiences : a subset of 12 life event categorieswith considerable long-term contextual threat. PsychologicalMedicine 15, 189–194.
Brugha, T. S., Sturt, E., MacCarthy, B., Potter, J., Wykes, T. &Bebbington, P. E. (1987). The Interview Measure of SocialRelationships: the description and evaluation of a surveyinstrument for assessing personal social resources. SocialPsychiatry 22, 123–128.
Brugha, T. S., Bebbington, P. E., Sturt, E., MacCarthy, B. &Wykes, T. (1990 a). The relation between life events and socialsupport networks in a clinically depressed cohort. SocialPsychiatry and Psychiatric Epidemiology 25, 308–313.
Brugha, T. S., Bebbington, P. E.,MacCarthy, B., Sturt, E., Wykes, T.& Potter, J. (1990 b). Gender, social support and recovery fromdepressive disorders : a prospective clinical study. PsychologicalMedicine 20, 147–156.
Brugha, T. S., Wing, J. K., Brewin, C. R., MacCarthy, B. &Lesage, A. (1993). The relationship of social network deficitswith deficits in social functioning in long-term psychiatricdisorders. Social Psychiatry and Psychiatric Epidemiology 28,218–224.
Brugha, T. S., Bebbington, P. E., Stretch, D. D., MacCarthy, B. &Wykes, T. (1997). Predicting the short-term outcome of firstepisodes and recurrences of clinical depression: a prospectivestudy of life events, difficulties, and social support networks.Journal of Clinical Psychiatry 58, 298–306.
Social support networks and British households 317

Brugha, T. S., Sharp, H. M., Cooper, S. A.,Weisender, C., Britto, D.,Shinkwin, R., Sherrif, T. & Kirwan, P. H. (1998). The Leicester500 Project. Social support and the development of postnataldepressive symptoms, a prospective cohort survey. PsychologicalMedicine 28, 63–79.
Brugha, T. S., Bebbington, P., Jenkins, R., Meltzer, H., Taub, N. A.,Janas, M. & Vernon, J. (1999 a). Cross validation of a householdpopulation survey diagnostic interview: a comparison of CIS-Rwith SCAN ICD-10 diagnostic categories. Psychological Medicine29, 1029–1042.
Brugha, T. S., Bebbington, P. E. & Jenkins, R. (1999 b). A differencethat matters : comparisons of structured and semi-structureddiagnostic interviews of adults in the general population.Psychological Medicine 29, 1013–1020.
Brugha, T. S., Wheatley, S., Taub, N. A., Culverwell, A., Freidman,T., Kirwan, P. H., Jones, D. R. & Shapiro, D. A. (2000).Pragmatic randomized trial of antenatal intervention to preventpostnatal depression by reducing psychosocial risk factors.Psychological Medicine 30, 1273–1281.
Cassel, J. (1976). The contribution of the social environment to hostresistance. American Jouranl of Epidemiology 104, 107–123.
Champion, L. (1995). A developmental perspective on social supportnetworks. In Social Support and Psychiatric Disorder: ResearchFindings and Guidelines for Clinical Practice (ed. T. S. Brugha),pp. 61–95. Cambridge University Press : Cambridge.
Cobb, S. (1976). Social support as a moderator of life stress.Psychosomatic Medicine 38, 300–314.
Cox, B. D., Blaxter, M., Buckle, A. L. J., Fenner, N. P.,Golding, J. F., Gore, M., Huppert, F. A., Nickson, J., Roth,M., Stark, J., Wadsworth, M. E. J. & Wichelow, M. (1987).The Health and Lifestyle Survey. Health Promotion ResearchTrust : London.
Finlay-Jones, R. & Brown, G. W. (1981). Types of stressful life eventand the onset on anxiety and depressive disorders. PsychologicalMedicine 11, 803–816.
Foley, D. L., Neale, M. C. & Kendler, K. S. (2001). Genetic andenvironmental risk factors for depression assessed by subject-ratedSymptom Check List versus Structured Clinical Interview.Psychological Medicine 31, 1413–1423.
Goldberg, D. & Huxley, P. (1992). A dimensional model forneurosis. In Common Mental Disorders. A Bio-social Model (ed.D. Goldberg and P. Huxley), pp. 65–81. Routledge: London.
Goldberg, D. P., Cooper, B., Eastwood, M. R., Kedward, H. B. &Sheperd, M. (1970). A standardised psychiatric interview for usein community surveys. British Journal of Preventive and SocialMedicine 24, 18–23.
Grainge, M. J., Brugha, T. S. & Spiers, N. A. (2000). Social support,personality and depressive symptoms over 7 years: the Health andLifestyle cohort. Social Psychiatry and Psychiatric Epidemiology35, 366–374.
Harris, T., Brown, G. W. & Robinson, R. (1999). Befriending asan intervention for chronic depression among women in an innercity. 1: Randomised controlled trial. British Journal of Psychiatry174, 219–224.
Henderson, S. (1977). The social network, support and neurosis.British Journal of Psychiatry 131, 185–191.
Henderson, S., Duncan Jones, P., McAuley, H. & Ritchie, K. (1978).The patient’s primary group. British Journal of Psychiatry 132,1–86.
Horton, N. J., Bebchuk, J. D., Jones, C. L., Lipsitz, S. R., Catalano,P. J., Zahner, G. E. & Fitzmaurice, G. M. (1999). Goodness-of-fit
for GEE: an example with mental health service utilization.Statistical Medicine 18, 213–222.
House, J. S., Landis, K. R. & Umberson, D. (1988). Socialrelationship and health. Science 241, 540–545.
Jenkins, R., Lewis, G., Bebbington, P., Brugha, T., Farrell, M.,Gill, B. & Meltzer, H. (1997 a). The national psychiatric morbiditysurveys of Great Britain – initial findings from the householdsurvey. Psychological Medicine 27, 775–789.
Jenkins, R., Bebbington, P., Brugha, T., Farrell, M., Gill, B., Lewis,G., Meltzer, H. & Petticrew, M. (1997 b). The national psychiatricmorbidity surveys of Great Britain – strategy and methods.Psychological Medicine 27, 765–774.
Kish, L. (1965). Survey Sampling. John Wiley & Sons Ltd: London.Lewis, G., Pelosi, A. J., Araya, R. & Dunn, G. (1992). Measuringpsychiatric disorder in the community : a standardized assessmentfor use by lay interviewers. Psychological Medicine 22, 465–486.
Lewis, G., Bebbington, P., Brugha, T., Farrell, M., Gill, B., Jenkins,R. & Meltzer, H. (1998). Socioeconomic status, standard of livingand neurotic disorder. Lancet 352, 605–608.
Meltzer, H. & Gill, B. (ed.) (1993). Office of Population Censuses& Surveys Social Survey Division. OPCS Surveys of PsychiatricMorbidity in Great Britain. Report of a pilot study conducted amongadults living in private households. Office of Population Censuses& Surveys Social Survey Division: London.
Meltzer, H., Gill, B., Petticrew, M. & Hinds, K. (ed.) (1995 a). Officeof Population Censuses & Surveys Social Survey Division. OPCSSurveys of Psychiatric Morbidity in Great Britain. Report 1: Theprevalence of psychiatric morbidity among adults living in privatehouseholds. Appendix B. Algorithms for production of ICD-10diagnoses of neurosis from the CIS-R. OPCS Surveys of PsychiatricMorbidity in Great Britain. Office for National Statistics SocialSurvey Division, HMSO: London.
Meltzer, H., Gill, B., Petticrew, M. & Hinds, K. (ed.) (1995 b). Officeof Population Censuses & Surveys Social Survey Division. OPCSSurveys of Psychiatric Morbidity in Great Britain. Report 2:Physical complaints, service use and treatment of adults withpsychiatric disorder. OPCS Surveys of Psychiatric Morbidity inGreat Britain, HMSO: London.
Meltzer, H., Gill, B., Petticrew, M. & Hinds, K. (ed.) (1995 c). Officeof Population Censuses & Surveys Social Survey Division. OPCSSurveys of Psychiatric Morbidity in Great Britain. Report 3:Economic activity and social functioning of adults with psychiatricdisorders. OPCS Surveys of Psychiatric Morbidity in GreatBritain, HMSO: London.
Mrazek, P. J. & Haggerty, R. J. (1994). Reducing Risks for MentalDisorders: Frontiers for Preventive Intervention Research. NationalAcademy of Medicine: Washington DC.
Paykel, E. S., Abbott, R. D., Jenkins, R., Brugha, T. & Meltzer, H.(2000). Urban–rural mental health differences in Great Britain :findings from the National Morbidity Survey. PsychologicalMedicine 30, 269–280.
STATA Corp. (1999). Stata Statistical Software, Release 6.0.STATA Corp. : College Station, TX.
Tolsdorf, C.C. (1976). Social networks, support and coping: anexploratory study. Family Process 15, 407–417.
Wilson, P. R. & Elliot, D. J. (1987). An evaluation of the PostcodeAddress File as a sampling frame and its use within OPCS. Journalof the Royal Statistical Society Series A (General ) 150, 230–240.
Zahner, G. E. & Daskalakis, C. (1997). Factors associated withmental health, general health, and school-based service use forchild psychopathology. American Journal of Health 87, 1440–1448.
318 T. S. Brugha and others