Social security health insurance for the informal sector in Nicaragua: A randomized evaluation
26
HEALTH ECONOMICS Health Econ. 19: 181–206 (2010) Published online 30 June 2010 in Wiley InterScience (www.interscience.wiley.com). DOI: 10.1002/hec.1635 SOCIAL SECURITY HEALTH INSURANCE FOR THE INFORMAL SECTOR IN NICARAGUA: A RANDOMIZED EVALUATION REBECCA L. THORNTON a, , LAUREL E. HATT b , ERICA M. FIELD c , MURSALEENA ISLAM b , FREDDY SOLI ´ S DIAZ d and MARTHA AZUCENA GONZA ´ LEZ d a University of Michigan, Economics, Ann Arbor, MI, USA b PSP-One Project, Abt Associates Inc., Washington, DC, USA c Harvard University, Economics, Cambridge, MA, USA d ALVA Consultores, Managua, Nicaragua SUMMARY This article presents the results from an experimental evaluation of a voluntary health insurance program for informal sector workers in Nicaragua. Costs of the premiums as well as enrollment location were randomly allocated. Overall, take-up of the program was low, with only 20% enrollment. Program costs and streamlined bureaucratic procedures were important determinants of enrollment. Participation of local microfinance institutions had a slight negative effect on enrollment. One year later, those who received insurance substituted toward services at covered facilities and total out-of-pocket expenditures fell. However, total expenditures fell by less than the insurance premiums. We find no evidence of an increase in health-care utilization among the newly insured. We also find very low retention rates after the expiration of the subsidy, with less than 10% of enrollees still enrolled after one year. To shed light on the findings from the experimental results, we present qualitative evidence of institutional and contextual factors that limited the success of this program. Copyright r 2010 John Wiley & Sons, Ltd. Received 21 April 2009; Revised 20 May 2010; Accepted 25 May 2010 KEY WORDS: health insurance; randomized experiment; Nicaragua; microfinance institutions 1. INTRODUCTION In recent years, interest has grown in providing health insurance programs to poor and vulnerable populations throughout the world as a means of increasing access to priority health services and protecting families from catastrophic health-care costs. 1 Implementation of such programs, however, may be difficult. Research suggests that take-up of voluntary health insurance among the poor is typically low (Behrman and Knowles, 1999; Jowett, 2003; Morduch, 1999; Chankova et al., 2008; Gine et al., 2007; Alderman and Paxson, 1994; Fafchamps, 1999; Pauly et al., 2008). Moreover, collecting payments from this population, who are generally employed in the informal sector, is challenging (Abel- Smith, 1992). Finally, if the program is not carefully designed and marketed, insurance schemes targeted to the poor may be particularly prone to adverse selection, disproportionately attracting those who are relatively sick. *Correspondence to: Department of Economics, 611 Tappan St., Ann Arbor, MI 48109, USA. E-mail: [email protected] 1 There are a growing number of health insurance programs and academic evaluations of these programs in developing countries. See, for example, Abel-Smith (1992); Barros (2009); Dow and Schmeer (2003); Duflo et al. (2004); Gakidou et al. (2006); Gertler and Gruber (2002); Gertler and Solon (2002); GTZ et al. (2005); King et al. (2009); Kremer et al. (2006); Miller et al. (2009); Panopoulus and Ve´lez (2001): Pauly et al. (2006); Pauly et al. (2008); Wagstaff (2007). See also Dercon et al. (2008). Copyright r 2010 John Wiley & Sons, Ltd.
-
Upload
independent -
Category
Documents
-
view
1 -
download
0
Transcript of Social security health insurance for the informal sector in Nicaragua: A randomized evaluation
HEALTH ECONOMICSHealth Econ. 19: 181–206 (2010)Published online 30 June 2010 in Wiley InterScience (www.interscience.wiley.com). DOI: 10.1002/hec.1635
SOCIAL SECURITY HEALTH INSURANCE FOR THEINFORMAL SECTOR IN NICARAGUA: A RANDOMIZED
EVALUATION
REBECCA L. THORNTONa,�, LAUREL E. HATTb, ERICA M. FIELDc, MURSALEENA ISLAMb,
FREDDY SOLIS DIAZd and MARTHA AZUCENA GONZALEZd
aUniversity of Michigan, Economics, Ann Arbor, MI, USAbPSP-One Project, Abt Associates Inc., Washington, DC, USA
cHarvard University, Economics, Cambridge, MA, USAdALVA Consultores, Managua, Nicaragua
SUMMARY
This article presents the results from an experimental evaluation of a voluntary health insurance program forinformal sector workers in Nicaragua. Costs of the premiums as well as enrollment location were randomlyallocated. Overall, take-up of the program was low, with only 20% enrollment. Program costs and streamlinedbureaucratic procedures were important determinants of enrollment. Participation of local microfinance institutionshad a slight negative effect on enrollment. One year later, those who received insurance substituted toward servicesat covered facilities and total out-of-pocket expenditures fell. However, total expenditures fell by less than theinsurance premiums. We find no evidence of an increase in health-care utilization among the newly insured. We alsofind very low retention rates after the expiration of the subsidy, with less than 10% of enrollees still enrolled afterone year. To shed light on the findings from the experimental results, we present qualitative evidence of institutionaland contextual factors that limited the success of this program. Copyright r 2010 John Wiley & Sons, Ltd.
Received 21 April 2009; Revised 20 May 2010; Accepted 25 May 2010
KEY WORDS: health insurance; randomized experiment; Nicaragua; microfinance institutions
1. INTRODUCTION
In recent years, interest has grown in providing health insurance programs to poor and vulnerablepopulations throughout the world as a means of increasing access to priority health services andprotecting families from catastrophic health-care costs.1 Implementation of such programs, however,may be difficult. Research suggests that take-up of voluntary health insurance among the poor istypically low (Behrman and Knowles, 1999; Jowett, 2003; Morduch, 1999; Chankova et al., 2008; Gineet al., 2007; Alderman and Paxson, 1994; Fafchamps, 1999; Pauly et al., 2008). Moreover, collectingpayments from this population, who are generally employed in the informal sector, is challenging (Abel-Smith, 1992). Finally, if the program is not carefully designed and marketed, insurance schemes targetedto the poor may be particularly prone to adverse selection, disproportionately attracting those who arerelatively sick.
*Correspondence to: Department of Economics, 611 Tappan St., Ann Arbor, MI 48109, USA. E-mail: [email protected] are a growing number of health insurance programs and academic evaluations of these programs in developing countries.See, for example, Abel-Smith (1992); Barros (2009); Dow and Schmeer (2003); Duflo et al. (2004); Gakidou et al. (2006); Gertlerand Gruber (2002); Gertler and Solon (2002); GTZ et al. (2005); King et al. (2009); Kremer et al. (2006); Miller et al. (2009);Panopoulus and Velez (2001): Pauly et al. (2006); Pauly et al. (2008); Wagstaff (2007). See also Dercon et al. (2008).
Copyright r 2010 John Wiley & Sons, Ltd.
Despite the recent and increasing interest in health insurance programs for excluded populations indeveloping countries (Preker et al., 2002; Gumber and Kulkarni, 2000; Franco et al., 2008; Smith andSulzbach, 2008), there is little rigorous evidence on the optimal design of voluntary health insuranceschemes targeting the informal sector in terms of their ability to attract a large enough pool ofindividuals or to increase utilization of quality health services. For instance, in many developingcountries, existing synergies between the delivery of financial services and health services to clients in theinformal sector have led policy-makers to believe that microfinance institutions (MFIs) may be apromising delivery agent to extend health insurance to low-income and other vulnerable groups (Matinet al., 2002; Churchill, 2003; Churchill and Cohen, 2006), particularly in settings where MFI penetrationis high. Despite this belief, however, to date no evidence supports the utility of using MFIs in marketingand delivering insurance products.
In addition to the lack of evidence of the effects of alternative insurance schemes and delivery, thereis also a dearth of evidence on the effects of voluntary insurance among the poor on utilization,expenditures, and health. This may be largely in part due to the difficulty in making causal inferencesfrom cross-sectional or panel studies. Nonexperimental studies that aim to measure the impact ofvoluntary health insurance coverage are prone to omitted variable bias. For instance, if those who aremore likely to be sick or utilize health services are more likely to purchase health insurance,unobservable differences between the insured and the uninsured will confound estimates of the effect ofinsurance, although the direction of the bias is ambiguous.
This article evaluates a voluntary public health insurance program targeted to informal sectorworkers in Nicaragua and provides experimental evidence on the determinants of enrollment, aswell as the causal effects of insurance on health-care expenditures, outcomes, and patterns of utilizationamong informal sector workers. In January 2007, the government of Nicaragua initiated ademonstration project that extended the Nicaraguan Social Security Institute’s (INSS’s) healthinsurance program for formal sector employees to informal sector workers using MFIs asdelivery agents.
To evaluate the impact of the program, we randomly varied the costs and convenience of enrolling inthe new health insurance program across a large sample of market vendors in Managua. To study theeffectiveness of MFIs as delivery agents, we randomly assigned individuals to purchase the insurance ateither the INSS central office or the branch offices of three participating MFIs. We then used baselineand follow-up surveys to examine changes in health and health-care utilization.
Differences in take-up rates across treatment arms provide evidence on the extent to which thefinancial cost and the convenience of enrollment procedures influence enrollment and retention in theinsurance program, as well as the effectiveness of MFIs as health insurance delivery agents. In turn,variation in take-up by treatment assignment generates random variation in insurance coverage,allowing us to measure the effects of the insurance using baseline and follow-up surveys conducted oneyear apart. In addition to the quantitative analysis of the demand for and effects of health insurance, wealso conducted a series of focus groups and in-depth interviews to better understand take-up of theinsurance program, retention, and utilization of health services.
We find that while insured individuals switched from using services at private and Ministry of Healthfacilities to visiting covered health facilities, insurance coverage did not appear to substantially increasetheir overall utilization of services. Meanwhile, although total out-of-pocket (OOP) expenditures fellwhen individuals were insured, average OOP savings were lower than the equivalent unsubsidizedinsurance premiums. More fundamentally, we find very low take-up and retention rates, with only 20%enrolling at baseline and fewer than 10% of those enrollees still enrolled in the insurance program afterone year. While there are various possible explanations for the failure of the program to attract andretain clients, the finding is consistent with case studies from developing countries, which suggest that, insettings in which individuals have lower levels of discretionary income, insurance is often perceived as anet gain only for those with health-care costs above the price of insurance. Nonetheless, 11% of
R. L. THORNTON ET AL.182
Copyright r 2010 John Wiley & Sons, Ltd. Health Econ. 19: 181–206 (2010)
DOI: 10.1002/hec
respondents who did not enroll had higher baseline health expenditures for themselves andchildren under 12 than the cost of the annual premium, which suggests that uncertainty, lack ofinformation, or distrust of the insurance product may have also played a role in reducing demand forcoverage.
There was a slight negative effect (5.4 percentage points) on enrollment among those assigned to theMFIs, suggesting that in this instance, MFIs were not a more effective health insurance delivery agentthan the government. Qualitative data point to a number of obstacles in working with MFIs that mustbe addressed before similar strategies are successful, including bureaucratic and administrativechallenges and those related to promotion and marketing.2
The findings from Nicaragua provide valuable evidence for other developing countries interested inexpanding public health insurance programs to the informal sector. Although the insurance productconsidered in this evaluation has several context-specific design features that may affect thegeneralizability of our findings, the program in Nicaragua is in most ways a very typical governmenthealth insurance scheme, comparable to public sector programs for formal sector workers in many partsof the world. Hence, our study provides useful evidence on the efficacy of extending existing publicinsurance programs in many developing countries to the informal sector. Such an approach has thepotential to be particularly cost effective since governments already have a broad risk pool ofmandatory insured workers and higher volumes may reduce the overall cost of service delivery.Similarly, although this program was not designed to reach the ultrapoor (for instance, by requiringnontrivial premiums and a fair amount of paperwork), it is a logical first step for a governmentinterested in extending its existing program to the self-employed.
The article proceeds as follows: Section 2 presents the background and program description for thehealth insurance product in Nicaragua. Section 3 presents the quantitative methodology and empiricalstrategy, and Section 4 discusses the quantitative results of the evaluation. Section 5 discusses contextualfindings and qualitative results, and Section 6 concludes.
2. BACKGROUND AND PROGRAM DESCRIPTION
Latin America has the highest proportion of countries in which private health insurance contributesover 5% to total health expenditure (Laver, 2000) and there has been a great focus on reforms andprovision of health services in many of these countries. In Nicaragua, private insurance accounts foronly 2.1% of total health expenditure (and 4% of private health expenditure). OOP payments as apercentage of total health expenditure is large (47.9%) and makes up almost all (93.1%) of privatehealth expenditures (Sekhri and Savedoff, 2005). Increasing access to health insurance in Nicaraguamay help to mitigate the OOP costs.
Before the expansion of health insurance to informal sector workers in January 2007, only formalsector workers and government employees in Nicaragua were eligible for INSS health insurance andhealth services provided at 17 INSS-contracted facilities. This participation represented just 18.5% of
2Perhaps the most similar study to this one is a recent evaluation by King et al. (2009), where the authors evaluated a healthinsurance program in Mexico that randomized encouragement to sign up for insurance across health facilities. Similar to ourstudy, they measured the shorter term effects (after 10 months) and found a reduction in health expenditures; there were no effectson health outcomes or overall utilization (King et al., 2007, 2009). Another study similar to ours evaluated the expansion ofgovernment health insurance to the informal sector in Mexico in 2002 (Barros, 2009). Barros found, as we did, a substitution ofvisits to service providers and a reduction in out of pocket expenditures. See also Wang et al. (2009). Other studies have evaluatedthe effects of health insurance in Columbia and have also found increased utilization and reduced out-of pocket expenditure(Giedion et al., 2007). Our study differs from these and others in two main ways. First, we evaluate a randomized experiment thatallows for causal inference for a variety of research questions without the usual concerns of selection bias or endogenous programtake-up. Second, our quantitative results are complemented with in-depth qualitative research that explores the influence ofcontextual factors on both take-up rates and efficacy of the insurance program in Nicaragua.
SOCIAL SECURITY HEALTH INSURANCE 183
Copyright r 2010 John Wiley & Sons, Ltd. Health Econ. 19: 181–206 (2010)
DOI: 10.1002/hec
the economically active population in Nicaragua. Individuals working in the informal sector, the self-employed, and the unemployed were eligible only for care at a handful of Ministry of Health (MINSA)facilities, which were under-resourced and lacked the infrastructure, staff, and medications needed torespond adequately to the population’s health needs. Focus groups with informal sector workersconducted in 2006 revealed that they perceived MINSA facilities as offering significantly lower qualityof care than INSS-contracted facilities and other private health providers, including very long waittimes and stock-outs (Magnoni et al., 2005). As a result, workers reported that they tended to avoidMINSA facilities and instead generally went directly to pharmacies for basic care. In other cases, theypreferred paying private doctors or avoiding care altogether, incurring the risk of more extensive (andexpensive) procedures down the line.3
Microentrepreneurs in Nicaragua, as in many parts of the developing world, are vulnerable to familyhealth crises in terms of their impacts on household income and business cash flows (Dercon, 2002).They typically divert resources from their businesses to meet immediate health-care needs at the expenseof investing in their business and its future growth, which in turn can have a significant impact on futurehousehold income (McIntyre et al., 2006; Morduch and Sharma, 2002; Narayan et al., 2000; Russell,2004). In these cases, therefore, health insurance serves to reduce financial risk for small businesses, aswell as for informal workers and their families.
The health insurance provided through the Nicaraguan government’s social security system (INSS)extends care to formal sector workers based on mandatory payroll and employer contributions. INSScontracts with commercial, not-for-profit, and public providers (formerly Empresas MedicasPrevisionales and referred to in this article as EMPs), purchasing services on a capitated basis. TheINSS insurance provides all subscribers with a comprehensive package of preventive, diagnostic, andcurative health services, including primary and specialist care, medication and laboratory exams,hospitalization, 24-hour emergency care, prenatal care, childbirth and postnatal care, infant care andvaccinations, child wellness visits through age 5, pediatric care through age 11, voluntary familyplanning counseling and contraception, breast and cervical cancer screenings, HIV and STD counseling,and prevention and treatment of dengue fever and malaria. In addition to the subscriber, thesubscriber’s wife is eligible for maternity services, including deliveries, and dependent children up to theage of 12 are also fully covered.
In 2007, a parallel version of this health insurance was made available to informal sector workersthrough a voluntary mechanism known as Seguro Facultativo de Salud. Although the program for thissector was voluntary, the coverage and cost were designed to be as similar as possible to thoseassociated with the program for workers employed in the formal sector. In this program, individualshad the opportunity to pay a flat monthly fee for a wide range of covered services without copayment atthe time of service. The cost of the program was structured such that the monthly fee was higher in thefirst two months, at approximately 18 dollars per month, and then fell to approximately 15 dollars permonth in subsequent months. When subscribers unenrolled, they would continue to be covered during a3-month grace. Enrolled individuals could make monthly payments directly at the INSS office orthrough most banks in the country.
Given the high rate of MFI use among informal sector workers in Nicaragua, policymakershypothesized that it would be convenient for these workers to enroll and make health insurancepayments at MFIs, perhaps concomitant with making payments on MFI loans.4 The governmentcontracted three MFIs to market the new insurance scheme and collect premiums: ACODEP, BancoProCredit, and Findesa. Each MFI received technical assistance with management information systems,
3Other research also indicated widespread dissatisfaction with the quality of services, although there have been attempts atreforming the health system (Jack, 2003).
4In Nicaragua, there are over 200 MFIs with over 20 that cover the majority of the unbanked market, offering a variety forpublic–private partnerships in health insurance delivery.
R. L. THORNTON ET AL.184
Copyright r 2010 John Wiley & Sons, Ltd. Health Econ. 19: 181–206 (2010)
DOI: 10.1002/hec
operations, enrollment procedures, and marketing health insurance to informal workers.5 The MFIssigned a one-year contract with INSS in October 2006 for registering subscribers and collectingpayments in exchange for which they received a small fee for each enrolled worker.
Over the course of the evaluation, a number of institutional and political changes took place thatinfluenced project implementation. Importantly, the MFI partnerships were established under thegovernment of Enrique Bolanos, who was replaced in January 2007 by incoming PresidentDaniel Ortega – representing an administration with a radically different political ideology.In October 2007, INSS chose not to renew the contracts with the three MFIs for registeringsubscribers and collecting payments. Interviews with senior INSS officials suggested that this decisionwas motivated by a number of factors, including INSS’s perspective that this was a low-priority projectand a political backlash against MFIs, which were being accused of predatory lending by thegovernment. We discuss more details about these institutional changes and their implications for ourresearch in Section 6.
3. RESEARCH DESIGN
3.1. Data collection and study design
To measure the determinants of insurance enrollment as well as the causal effects of having insurance,we implemented an evaluation that randomly varied the costs (financial, informational, andconvenience) of signing up for health insurance for each individual. Data collection involved a baselineand one-year follow-up survey of a sample of eligible participants in addition to consolidatedadministrative data on insurance affiliation from INSS.
Appendix A presents a summary of the project timeline. Between March and June 2007, a fewmonths after the insurance program was rolled out to informal sector workers, a baseline survey wasadministered to a representative sample of vendors in the three largest open-air markets in centralManagua. These markets were chosen because they were likely to contain a large population ofuninsured informal sector workers who were microfinance clients. Although clearly this method did notproduce a population-representative sample of individuals eligible for the insurance product, samplingthe largest markets was a cost-effective means of locating a relatively representative subpopulation ofinformal sector vendors. Moreover, since these workers are slightly better off than either vendors in verysmall markets or informal sector workers outside of the retail market, they were presumed to be a keytarget group of the new insurance scheme. However, it is important to bear in mind that our conclusionspertain to this specific subpopulation.
The baseline survey collected information in two rounds on demographic characteristics, prior andcurrent health services utilization, socioeconomic characteristics, and health-care expenditures.Government ID numbers were collected to match respondents to health insurance enrollment datasubsequently provided by the government. The first round of the baseline survey was conducted inMarch and April 2007 in a section of the Mercado Oriental, Managua’s largest marketplace. The secondround was conducted in June and July 2007 in the remaining portion of the Mercado Oriental and in theslightly smaller Mercados Huembes and Iven Montenegro marketplaces.6
5The USAID-funded Private Sector Partnerships-One project (PSP-One) supported the INSS in coordination and trainingactivities between July 2006 and March 2007. Initial trainings took place prior to the project’s expected roll out in July/August2006 and were replicated in October and November 2006 by the INSS. The project was actually rolled out in January 2007, duemainly to delays caused by the presidential elections in November 2006 and the initiation of the new administration in February2007.
6In addition, the baseline survey also included respondents in four other smaller markets; because these respondents were notfollowed over time, we do not include them in our analysis.
SOCIAL SECURITY HEALTH INSURANCE 185
Copyright r 2010 John Wiley & Sons, Ltd. Health Econ. 19: 181–206 (2010)
DOI: 10.1002/hec
Before the first round of the baseline survey, we conducted a census of market booths to define thesampling frame of possible respondents. Participants deemed eligible through the census were selectedrandomly and administered the full survey.7 Eligibility depended on age (between ages 18 and 54),having a government ID, being the owner of the booth, and lacking health insurance coverage.8 Thefirst two criteria were determined by government eligibility requirements, while the second two wereresearch design considerations intended to target those with relatively high demand for insurance.Appendix B, Panel A, presents the completion rates of the baseline survey. While overall completionrates were relatively low at 51 and 53% for the two rounds, the main reasons for nonparticipation wereinability to locate vendors at their booths (22%) and ineligibility of vendors on either the age criterionor their lack of an on-hand government ID (15.1%). Rates of refusal among eligible vendors who werefound at their booths were low (7.7%). Nonetheless, sample selection based on the availability ofrespondents and possession of IDs may affect the external validity of the study. In particular, those whowere available and carried government IDs might be relatively stable or cooperative types – and as such,perhaps more likely than the average informal worker to sign up for government-sponsored insurance.In this case, our results would overstate the impact of introducing a health insurance program to allworkers. Alternatively, absent workers may have higher demand for insurance if, for instance, they aresicker or have larger families. On the other hand, it may simply be the case that all workers periodicallytake days off from the market, making those missing on survey days a quasirandom sample. Hence,while sample selection bias may limit the generalizability of the study, it is also difficult to drawconclusions about the likely nature of the bias. In terms of internal validity, participation rates do notgenerate a bias since we randomly allocated subsidies for health insurance only after individuals hadagreed to participate, so selection is orthogonal to treatment assignment.
During the spring of 2008, 2807 respondents were approached for the follow-up survey, and 2610(93%) were successfully reinterviewed.9 The reasons for attrition are presented in Appendix B, Panel B.Information on enrollment – including whether at INSS or an MFI – was provided by administrativedata from INSS, and linked to our survey data via government ID numbers.
3.2. Sample characteristics
Our analysis is restricted to the respondents who completed interviews at both baseline and follow-upand had valid voucher data (2608). Table I presents key characteristics of the sample. In addition topresenting averages across the pooled sample, we show mean values separately for respondents whowere and were not MFI loan recipients at the time of the first survey.
The average respondent was 38 years old and had 9.3 years of education. About 35% of respondentswere male and 70% were married or had a common-law spouse, a proportion higher than the nationalaverage of 56% (ENDESA household survey, Nicaragua, 2006). Respondents had two children onaverage, with two-thirds having at least one child under age 12, the maximum age for coverage ofdependents by the INSS health insurance. Only 3% of the sample was pregnant or had a spouse whowas pregnant.
MFI clients were about 2 years older on average than non-MFI clients, and were more likely to befemale (72 vs 61%, respectively). In addition, MFI clients had slightly more children.
7In round one, the census of the Mercado Oriental recorded all of individuals who worked in a booth in the past 12 months. Themarket was divided into 98 blocks using a map of the market; 25 blocks were excluded from the sample either because they weredangerous or had no businesses. We then randomly selected eligible respondents stratified by gender, marital status, and MFIclient status. To oversample MFI clients, all booths identified in the census as containing an eligible MFI client were selected.
8Participants were required to display their government ID cards or a legible copy of their card. Surveyors offered vendors theopportunity to bring their cards on a subsequent day if they were interested in participating and revisited vendors three timesbefore disqualifying them as ineligible.
9Baseline characteristics do not vary systematically between the full sample of baseline respondents and the 2610 who wereinterviewed one year later and used for the analysis in this paper (results not shown).
R. L. THORNTON ET AL.186
Copyright r 2010 John Wiley & Sons, Ltd. Health Econ. 19: 181–206 (2010)
DOI: 10.1002/hec

Respondents had an average monthly income of US$274 (Panel B).10 Average monthly disposableincome after business and household expenses was reported at US$25. However, only 29% declaredhaving disposable income at month end. Almost 58% had an outstanding loan, and about one-thirdhad a loan with an MFI (not reported). MFI clients reported higher monthly income (by approximatelyUS$38), but their likelihood of savings and average savings balance were about the same as non-MFIclients. MFI clients spent about US$8 more on health care for themselves than did their counterparts.
In terms of health status, 80% of those surveyed reported being sick in the year before the baselinesurvey, with a mean value of 2.6 episodes (Table II, Panel A). Many respondents reported chronic orcommon recurring conditions such as kidney problems, diabetes, hypertension, respiratory problems,vision or hearing problems, stress, headaches, or allergies. Table II (Panel B) summarizes informationon the last illness respondents reported experiencing in the previous 12 months. Almost half were relatedto allergies or respiratory illnesses such as cold or flu and 60% reported suffering from flu symptoms inthe previous year. The majority of reported illnesses were minor conditions. Only 11% missed morethan a week of work due to their last illness and the majority (57%) missed zero days of work (notreported). Our data do not point to any significant advantage of targeting MFI clients (or non-MFIclients) for microinsurance programs based on relative health status. Although MFI clients were slightlymore likely than non-MFI clients to report having diabetes, stress, and hypertension in the year beforethe baseline, they were less likely to report smoking.
In terms of baseline health service utilization, pharmacies were the most visited of any health facility,with 73% of all respondents reporting at least one visit. Of those who visited, the average was threepharmacy visits in the prior year (Table III). Private sector facilities were utilized more than public sectorfacilities, with 29% reporting visits to private doctors and 15% to private clinics/hospitals in the prior
Table I. Baseline sample characteristics
All (N5 2608) MFI client (N5 1013) Non-MFI client (N5 1595)
Panel A: Demographic characteristics Mean SD Mean SD Mean SD Difference
Age 37.79 9.28 39.05 8.57 36.98 9.63 2.07���
Male 0.35 0.48 0.28 0.45 0.39 0.49 �0.11���
Years education 9.26 4.22 9.25 4.15 9.27 4.27 �0.02Married 0.70 0.46 0.70 0.46 0.70 0.46 0.00Number of children 2.04 1.52 2.22 1.52 1.93 1.52 0.29���
With under 12 children 0.66 0.47 0.66 0.48 0.67 0.47 �0.01Pregnant 0.03 0.18 0.03 0.18 0.03 0.17 0.00
All MFI client Non-MFI client
Panel B: Economic characteristics Mean SD Mean SD Mean SD Difference
Monthly income 273.89 380.34 297.22 404.12 258.77 363.45 38.44���
Proportion with savings 0.29 0.46 0.28 0.45 0.30 0.46 �0.02Monthly savings 25.11 158.51 23.40 157.89 26.19 158.95 �2.78Last year’s savings Balance 145.73 574.94 141.45 609.66 148.45 551.85 �7.00owns home 0.76 0.42 0.80 0.40 0.74 0.44 0.06���
Total household health-care costs 84.46 171.62 88.67 174.38 81.78 169.85 6.89Total health-care costs for respondent 46.50 114.44 51.68 128.77 43.20 104.20 8.48�
Last visit cost for respondent 17.77 59.98 20.79 82.05 15.86 39.95 4.93��
Proportion MFI Clients 0.39 0.49
Notes: This table presents sample statistics from 2608 respondents baseline survey data. The last column presents differences inmeans of each variable between MFI Clients and non-MFI clients. �Significant at 10%; ��significant at 5%; ���significant at 1%.
10Reported income for respondents and their spouse was reported in Nicaraguan Cordoba was converted to US Dollars at the rateof US$15 18.7 NIO.
SOCIAL SECURITY HEALTH INSURANCE 187
Copyright r 2010 John Wiley & Sons, Ltd. Health Econ. 19: 181–206 (2010)
DOI: 10.1002/hec
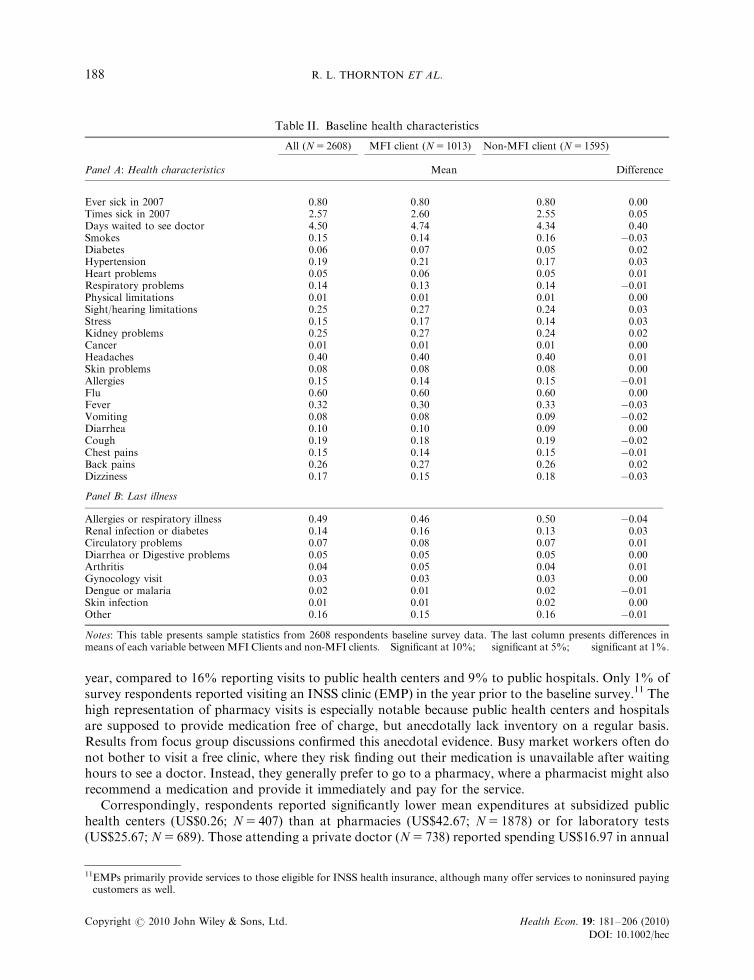
year, compared to 16% reporting visits to public health centers and 9% to public hospitals. Only 1% ofsurvey respondents reported visiting an INSS clinic (EMP) in the year prior to the baseline survey.11 Thehigh representation of pharmacy visits is especially notable because public health centers and hospitalsare supposed to provide medication free of charge, but anecdotally lack inventory on a regular basis.Results from focus group discussions confirmed this anecdotal evidence. Busy market workers often donot bother to visit a free clinic, where they risk finding out their medication is unavailable after waitinghours to see a doctor. Instead, they generally prefer to go to a pharmacy, where a pharmacist might alsorecommend a medication and provide it immediately and pay for the service.
Correspondingly, respondents reported significantly lower mean expenditures at subsidized publichealth centers (US$0.26; N5 407) than at pharmacies (US$42.67; N5 1878) or for laboratory tests(US$25.67; N5 689). Those attending a private doctor (N5 738) reported spending US$16.97 in annual
Table II. Baseline health characteristics
All (N5 2608) MFI client (N5 1013) Non-MFI client (N5 1595)
Panel A: Health characteristics Mean Difference
Ever sick in 2007 0.80 0.80 0.80 0.00Times sick in 2007 2.57 2.60 2.55 0.05Days waited to see doctor 4.50 4.74 4.34 0.40Smokes 0.15 0.14 0.16 �0.03�
Diabetes 0.06 0.07 0.05 0.02��
Hypertension 0.19 0.21 0.17 0.03��
Heart problems 0.05 0.06 0.05 0.01Respiratory problems 0.14 0.13 0.14 �0.01Physical limitations 0.01 0.01 0.01 0.00Sight/hearing limitations 0.25 0.27 0.24 0.03Stress 0.15 0.17 0.14 0.03��
Kidney problems 0.25 0.27 0.24 0.02Cancer 0.01 0.01 0.01 0.00Headaches 0.40 0.40 0.40 0.01Skin problems 0.08 0.08 0.08 0.00Allergies 0.15 0.14 0.15 �0.01Flu 0.60 0.60 0.60 0.00Fever 0.32 0.30 0.33 �0.03Vomiting 0.08 0.08 0.09 �0.02Diarrhea 0.10 0.10 0.09 0.00Cough 0.19 0.18 0.19 �0.02Chest pains 0.15 0.14 0.15 �0.01Back pains 0.26 0.27 0.26 0.02Dizziness 0.17 0.15 0.18 �0.03��
Panel B: Last illness
Allergies or respiratory illness 0.49 0.46 0.50 �0.04Renal infection or diabetes 0.14 0.16 0.13 0.03Circulatory problems 0.07 0.08 0.07 0.01Diarrhea or Digestive problems 0.05 0.05 0.05 0.00Arthritis 0.04 0.05 0.04 0.01Gynocology visit 0.03 0.03 0.03 0.00Dengue or malaria 0.02 0.01 0.02 �0.01Skin infection 0.01 0.01 0.02 0.00Other 0.16 0.15 0.16 �0.01
Notes: This table presents sample statistics from 2608 respondents baseline survey data. The last column presents differences inmeans of each variable between MFI Clients and non-MFI clients. � Significant at 10%; �� significant at 5%; ��� significant at 1%.
11EMPs primarily provide services to those eligible for INSS health insurance, although many offer services to noninsured payingcustomers as well.
R. L. THORNTON ET AL.188
Copyright r 2010 John Wiley & Sons, Ltd. Health Econ. 19: 181–206 (2010)
DOI: 10.1002/hec
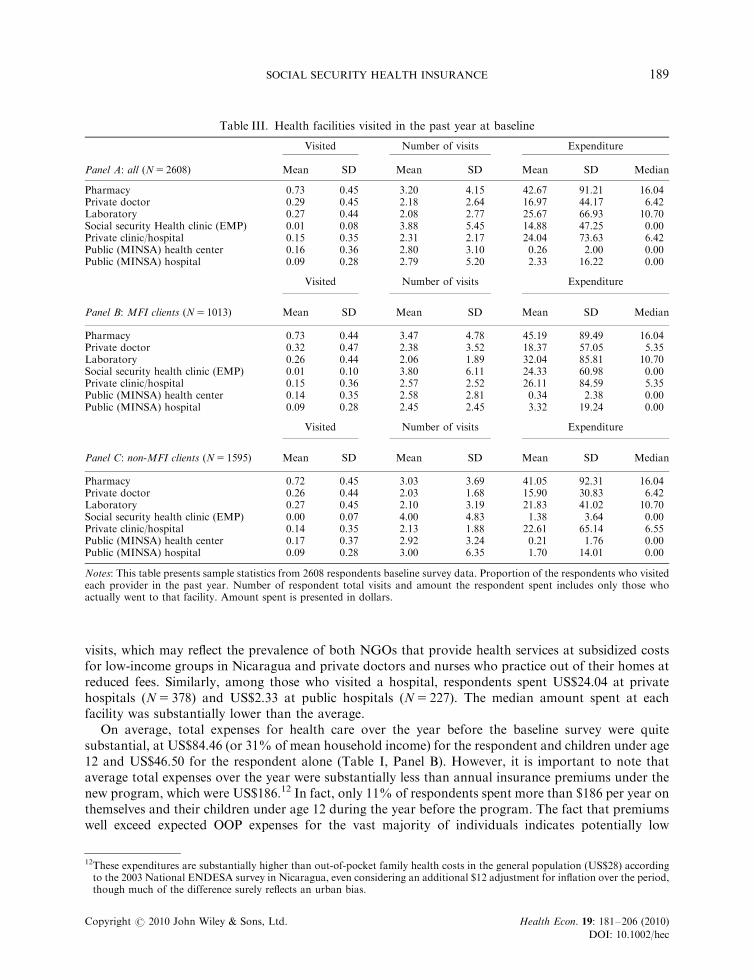
visits, which may reflect the prevalence of both NGOs that provide health services at subsidized costsfor low-income groups in Nicaragua and private doctors and nurses who practice out of their homes atreduced fees. Similarly, among those who visited a hospital, respondents spent US$24.04 at privatehospitals (N5 378) and US$2.33 at public hospitals (N5 227). The median amount spent at eachfacility was substantially lower than the average.
On average, total expenses for health care over the year before the baseline survey were quitesubstantial, at US$84.46 (or 31% of mean household income) for the respondent and children under age12 and US$46.50 for the respondent alone (Table I, Panel B). However, it is important to note thataverage total expenses over the year were substantially less than annual insurance premiums under thenew program, which were US$186.12 In fact, only 11% of respondents spent more than $186 per year onthemselves and their children under age 12 during the year before the program. The fact that premiumswell exceed expected OOP expenses for the vast majority of individuals indicates potentially low
Table III. Health facilities visited in the past year at baseline
Visited Number of visits Expenditure
Panel A: all (N5 2608) Mean SD Mean SD Mean SD Median
Pharmacy 0.73 0.45 3.20 4.15 42.67 91.21 16.04Private doctor 0.29 0.45 2.18 2.64 16.97 44.17 6.42Laboratory 0.27 0.44 2.08 2.77 25.67 66.93 10.70Social security Health clinic (EMP) 0.01 0.08 3.88 5.45 14.88 47.25 0.00Private clinic/hospital 0.15 0.35 2.31 2.17 24.04 73.63 6.42Public (MINSA) health center 0.16 0.36 2.80 3.10 0.26 2.00 0.00Public (MINSA) hospital 0.09 0.28 2.79 5.20 2.33 16.22 0.00
Visited Number of visits Expenditure
Panel B: MFI clients (N5 1013) Mean SD Mean SD Mean SD Median
Pharmacy 0.73 0.44 3.47 4.78 45.19 89.49 16.04Private doctor 0.32 0.47 2.38 3.52 18.37 57.05 5.35Laboratory 0.26 0.44 2.06 1.89 32.04 85.81 10.70Social security health clinic (EMP) 0.01 0.10 3.80 6.11 24.33 60.98 0.00Private clinic/hospital 0.15 0.36 2.57 2.52 26.11 84.59 5.35Public (MINSA) health center 0.14 0.35 2.58 2.81 0.34 2.38 0.00Public (MINSA) hospital 0.09 0.28 2.45 2.45 3.32 19.24 0.00
Visited Number of visits Expenditure
Panel C: non-MFI clients (N5 1595) Mean SD Mean SD Mean SD Median
Pharmacy 0.72 0.45 3.03 3.69 41.05 92.31 16.04Private doctor 0.26 0.44 2.03 1.68 15.90 30.83 6.42Laboratory 0.27 0.45 2.10 3.19 21.83 41.02 10.70Social security health clinic (EMP) 0.00 0.07 4.00 4.83 1.38 3.64 0.00Private clinic/hospital 0.14 0.35 2.13 1.88 22.61 65.14 6.55Public (MINSA) health center 0.17 0.37 2.92 3.24 0.21 1.76 0.00Public (MINSA) hospital 0.09 0.28 3.00 6.35 1.70 14.01 0.00
Notes: This table presents sample statistics from 2608 respondents baseline survey data. Proportion of the respondents who visitedeach provider in the past year. Number of respondent total visits and amount the respondent spent includes only those whoactually went to that facility. Amount spent is presented in dollars.
12These expenditures are substantially higher than out-of-pocket family health costs in the general population (US$28) accordingto the 2003 National ENDESA survey in Nicaragua, even considering an additional $12 adjustment for inflation over the period,though much of the difference surely reflects an urban bias.
SOCIAL SECURITY HEALTH INSURANCE 189
Copyright r 2010 John Wiley & Sons, Ltd. Health Econ. 19: 181–206 (2010)
DOI: 10.1002/hec
willingness to pay for the new health insurance plan, which is likely to be the fundamental reason for thelow rates of enrollment and retention found. On the other hand, if individuals had perceived that theinsurance would provide access to shorter waiting times, higher quality, or more convenient services, wemight have seen a higher demand for the insurance product.
Baseline differences between MFI clients’ and non-MFI clients’ health expenditures were smalloverall. MFI clients were less likely to use public facilities, and as a result reported slightly higherhealth-care expenditures (approximately US$8 more; Table I Panel B), mainly driven by laboratorycosts.
3.3. Randomization process
To evaluate factors influencing health insurance enrollment and also generate random variation ininsurance coverage, our research design randomly assigned individuals to treatment arms with differingprices and enrollment procedures. Randomization was conducted at the individual level. At the end ofthe baseline survey, participants were invited to choose a lottery ticket out of a stack of unmarked,presealed envelopes. The possible lottery prizes included a blank ticket (no prize); an INSS brochuredetailing the insurance product; a brochure accompanied by a 6-month insurance subsidy withinstructions to sign up at the INSS office; or a brochure accompanied by a 6-month insurance subsidywith instructions to sign up at an MFI office.13 The 6-month subsidy was worth approximately US$96and was provided in the form of a voucher; respondents were told that payments would be made ontheir behalf directly to the INSS. The distribution of lottery tickets is presented in Appendix C, whichalso presents the attrition rates by randomization group.
In addition, immediately following the second round of the baseline survey, a random sample of 112respondents who had been offered a 6-month subsidy and 63 respondents who had been offered nosubsidy – none of whom had yet subscribed – were offered the opportunity to sign up for healthinsurance at their market booth. Surveyors were trained to fill out the registration forms on site andwere accompanied by a photographer who took required photos.
4. EMPIRICAL STRATEGY
Most cross sectional or panel studies that examine the impact of being insured suffer from potentialomitted variable bias, in which an individual’s unobservable propensity to purchase insurance is relatedto his/her underlying health profile or risk preferences. This makes causal inference of the impact ofhealth insurance on health and related outcomes difficult because if those who have a greater risk ofillness are both more likely to enroll in health insurance and more likely to be sick, the observed impactof having insurance is biased. A randomized study design such as that used in this evaluation reducespotential bias due to selection effects by guaranteeing that, in expectation, comparison groups arecomposed of the same underlying types. Indeed, Appendix D verifies that random assignment in thiscase achieved comparison groups that were similar on observable baseline characteristics. There aresome differences between insurance subsidy and control groups; however, these differences are small inmagnitude. The results are similar across MFI clients and non-MFI clients (results not shown), which isunsurprising given that the sample was stratified by MFI membership prior to randomization.
13There were also two additional treatment arms that gave a brochure accompanied by a two-month insurance subsidy withinstructions to sign up at the INSS office and one that gave a brochure accompanied by a two-month insurance subsidy withinstructions to sign up at an MFI. These individuals were not interviewed at the follow-up survey and we do not include them inthe analysis of this article. In the second round, only three prizes were offered: an INSS brochure, a 6-month insurance subsidy(instructed to sign up at INSS office), and a 6-month subsidy (instructed to sign up at MFI).
R. L. THORNTON ET AL.190
Copyright r 2010 John Wiley & Sons, Ltd. Health Econ. 19: 181–206 (2010)
DOI: 10.1002/hec
To measure the determinants of insurance enrollment, including the amount of subsidy received andthe assigned location for enrollment, we estimate the following regression equation:
Insurancei ¼ a1b1Informationi1b26MonthsðINSSÞi1b36MonthsðMFIÞiX0im1ei ð1Þ
where ‘Insurance’ is an indicator if respondent ‘i’ signed up for health insurance. ‘Information,’‘6Months(INSS),’ and ‘6Months(MFI )’ are indicators of the randomized lottery received. The purecontrol group is the omitted category. The vector of control variables, X, includes age, age squared,gender, years of education, marital status, and market fixed effects. In some specifications, we alsocontrol for baseline health expenditures and health status indicators. Data are pooled from bothrounds of baseline surveys and round fixed effects are included. To test whether MFI clientsrespond differentially to affiliation assignment, we also estimate Equation 1 separately by MFIclient status.
In the second stage, we evaluate the effects of health insurance on health-care utilization andexpenditures. The randomized first stage predicting health insurance enrollment – specification (1)above – allows for an instrumental variables (IV) analysis of the effects of insurance. In the secondstage, we estimate
Yi ¼ a1b1Insurancei1X 0im1ei ð2Þ
where ‘Y’ is the outcome variable of interest (health expenditures or number of health-care visits atfollow-up) and ‘Insurance’ enrollment is instrumented with the vector of treatment indicators (blankticket/no-incentive control; INSS brochure/information only; subsidy for enrollment at INSS office;subsidy for enrollment at MFI office). The F-statistic of the excluded instruments is large, at 213.33,indicating a strong first-stage effect of the subsidies. It is important to keep in mind that an IV modelestimates a local average treatment effect, or the mean effect of insuring those on the margin of enrollingif offered a subsidy, rather than the population average effect. Hence, these estimates do not tell us theexpected impact of providing insurance coverage to all informal sector workers.
To estimate the determinants of retention, we re-estimate (1) with the dependent variable indicatingwhether the respondent was still paying for health insurance at the follow-up survey and only includethe 530 individuals who had enrolled in the health insurance program. We examine both the impact ofreceiving an insurance subsidy as well as potential differential effects of being an MFI client. Because ofthe small number of enrollees in the control and information-only treatment groups, we use only the6-month subsidy groups to study differential effects of signing up at an MFI on retention. It is worthnoting that while signing up at an MFI was randomized, estimating the effects of place of affiliation onretention is complicated by the fact that this specification is estimated only among those who chose tosign up for insurance – which is endogenously determined.
5. RESULTS
5.1. Take-up of insurance
Overall, 20.3% of our sample enrolled in the insurance scheme. Table IV presents the OLS regressionresults predicting take-up. Those receiving the informational brochure alone were approximately fivepercentage points less likely to enroll in the insurance program relative to the control group whoreceived nothing (Column 1). This potentially indicates that expectations about the product were overlyoptimistic, which is consistent with the fact that all those in the control group who enrolled dropped outof the program by the second year. Those receiving a 6-month subsidy and assigned to register at theINSS office were 33 percentage points more likely to purchase insurance than the control group, andthose receiving a 6-month subsidy and assigned to register at a participating MFI were 28 percentagepoints more likely to enroll relative to the controls.
SOCIAL SECURITY HEALTH INSURANCE 191
Copyright r 2010 John Wiley & Sons, Ltd. Health Econ. 19: 181–206 (2010)
DOI: 10.1002/hec
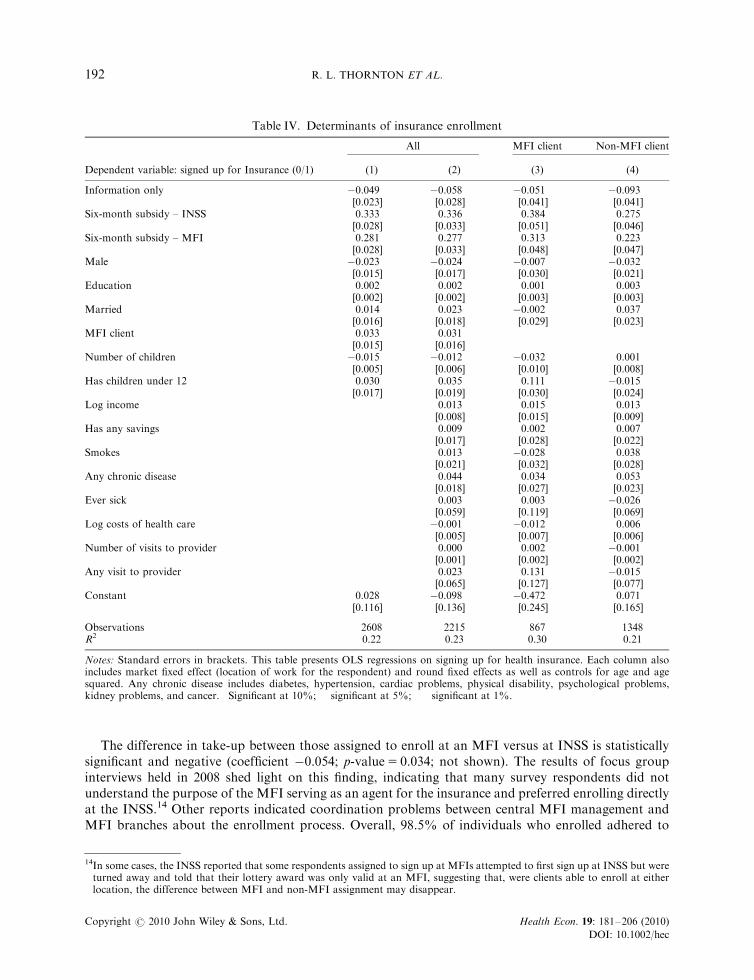
The difference in take-up between those assigned to enroll at an MFI versus at INSS is statisticallysignificant and negative (coefficient �0.054; p-value5 0.034; not shown). The results of focus groupinterviews held in 2008 shed light on this finding, indicating that many survey respondents did notunderstand the purpose of the MFI serving as an agent for the insurance and preferred enrolling directlyat the INSS.14 Other reports indicated coordination problems between central MFI management andMFI branches about the enrollment process. Overall, 98.5% of individuals who enrolled adhered to
Table IV. Determinants of insurance enrollment
All MFI client Non-MFI client
Dependent variable: signed up for Insurance (0/1) (1) (2) (3) (4)
Information only �0.049�� �0.058�� �0.051 �0.093��
[0.023] [0.028] [0.041] [0.041]Six-month subsidy – INSS 0.333��� 0.336��� 0.384��� 0.275���
[0.028] [0.033] [0.051] [0.046]Six-month subsidy – MFI 0.281��� 0.277��� 0.313��� 0.223���
[0.028] [0.033] [0.048] [0.047]Male �0.023 �0.024 �0.007 �0.032
[0.015] [0.017] [0.030] [0.021]Education 0.002 0.002 0.001 0.003
[0.002] [0.002] [0.003] [0.003]Married 0.014 0.023 �0.002 0.037
[0.016] [0.018] [0.029] [0.023]MFI client 0.033�� 0.031�
[0.015] [0.016]Number of children �0.015��� �0.012�� �0.032��� 0.001
[0.005] [0.006] [0.010] [0.008]Has children under 12 0.030� 0.035� 0.111��� �0.015
[0.017] [0.019] [0.030] [0.024]Log income 0.013 0.015 0.013
[0.008] [0.015] [0.009]Has any savings 0.009 0.002 0.007
[0.017] [0.028] [0.022]Smokes 0.013 �0.028 0.038
[0.021] [0.032] [0.028]Any chronic disease 0.044�� 0.034 0.053��
[0.018] [0.027] [0.023]Ever sick 0.003 0.003 �0.026
[0.059] [0.119] [0.069]Log costs of health care �0.001 �0.012� 0.006
[0.005] [0.007] [0.006]Number of visits to provider 0.000 0.002 �0.001
[0.001] [0.002] [0.002]Any visit to provider 0.023 0.131 �0.015
[0.065] [0.127] [0.077]Constant 0.028 �0.098 �0.472� 0.071
[0.116] [0.136] [0.245] [0.165]
Observations 2608 2215 867 1348R2 0.22 0.23 0.30 0.21
Notes: Standard errors in brackets. This table presents OLS regressions on signing up for health insurance. Each column alsoincludes market fixed effect (location of work for the respondent) and round fixed effects as well as controls for age and agesquared. Any chronic disease includes diabetes, hypertension, cardiac problems, physical disability, psychological problems,kidney problems, and cancer. �Significant at 10%; ��significant at 5%; ���significant at 1%.
14In some cases, the INSS reported that some respondents assigned to sign up at MFIs attempted to first sign up at INSS but wereturned away and told that their lottery award was only valid at an MFI, suggesting that, were clients able to enroll at eitherlocation, the difference between MFI and non-MFI assignment may disappear.
R. L. THORNTON ET AL.192
Copyright r 2010 John Wiley & Sons, Ltd. Health Econ. 19: 181–206 (2010)
DOI: 10.1002/hec
their randomly assigned location for enrollment.15 Of those who enrolled at an MFI, 47% went toProCredit, 15% went to Findesa, and 37% went to ACODEP (results not shown).16
There was no statistically significant difference in take-up between men and women; there was nosignificant difference in take-up between married and unmarried respondents. Controlling for the totalnumber of children in the family, having children under the age of 12 (the age of eligible dependents)increased the likelihood of take-up by approximately 3 percentage points; however, the total number ofchildren was negatively related to uptake. Conditional on the above variables, age (not shown) andeducation had no additional explanatory power.
Baseline health expenditures and utilization of health care had very little predictive power indetermining enrollment. Similarly, income had no statistically significant effect on insurance take-up,controlling for all other factors, which may reflect the high degree of correlation between income andother household characteristics. However, having a chronic or commonly recurring disease, such asdiabetes or hypertension, was positively associated with rates of uptake, increasing the likelihood ofenrollment by 4.4 percentage points and indicating some degree of adverse selection in this type ofvoluntary insurance program.
Certain markets were associated with significantly higher take-up than others. Vendors in theHuembes market had higher take-up rates than those in the Oriental market, an effect that remainssignificant after controlling for the respondents’ own income, indicating unobservable differences acrossmarketplaces in latent demand for health insurance. For instance, vendors in Huembes market tend tohave longer market tenure than vendors in other markets in Managua because of the reportedly betterconditions, greater safety, and more ‘upscale’ clientele. Additionally, Huembes market is anecdotallyassociated with a greater level of formalization (more officially registered businesses) than some of theother markets.
In total, the basic patterns in enrollment are relatively similar between MFI clients and non-MFIclients. Subsidies are the most important determinants of take-up. Having children under 12 was a moreimportant determinant among MFI clients than among non-MFI clients. Baseline costs of health carealso seem to have opposite relationships with take-up between MFI clients and non-MFI clients.However, these differences are small in magnitude.
5.2. On-site enrollment
Individuals enrolling, for insurance, at either the INSS central office or at an MFI were required toprovide photocopies of their government identification cards, two passport size photos, and birthcertificates of all beneficiaries. They also had to complete a registration form and then travel to the INSSor MFI office and wait in line to register in person. According to our survey, this process took aboutone day’s time, a substantial cost for small business owners who would need to find someone to watchtheir market booth or forego a day’s revenue.
Given the potential barriers to enrollment posed by these costs, a random sample of 175 nonenrolledrespondents (112 who had been offered a 6-month subsidy and 63 who had been offered no subsidy)
15Of those who were clients of a participating MFI, the majority of those receiving the 6 month subsidy and who were told to signup with an MFI signed up at their own institution (77 percent of ACODEP clients, 57 percent of Findesa clients, and 85 percentof ProCredit clients). Of those who were a client of a different MFI or who were not a MFI client, affiliation was fairly evenlysplit at ACODEP and Procredit, with low affiliation rates at Findesa.
16The higher uptake for ProCredit clients is likely influenced by the large and convenient branch located near the Oriental Marketwhere many respondents worked. In addition, key informant interviews and our monitoring of the MFIs’ activities related to theprogram revealed higher levels of effort in participating in the project, including training its staff and arranging events to marketthe program to its clients. Administrative problems may also have influenced the results. While ACODEP had a marketing effortin place, we learned that its branch manager in the Oriental Market was changed shortly after our baseline survey and that thenew manager was not informed of either the demonstration project nor of the MFI’s commitment to sign up survey respondents.As a result, many people were turned away when they tried to sign up.
SOCIAL SECURITY HEALTH INSURANCE 193
Copyright r 2010 John Wiley & Sons, Ltd. Health Econ. 19: 181–206 (2010)
DOI: 10.1002/hec
were given the opportunity to enroll for health insurance at their market booth. On-site enrollmenteliminated respondents’ travel costs and reduced the time costs related to taking photographs andmaking copies of their ID cards. In addition, it minimized potential psychological influences onenrollment such as procrastination or imperfect recall and addressed constraints imposed by uncertaintyregarding the enrollment process.
Providing respondents the convenience of signing up for insurance directly from their market stallhad a large effect on enrollment rates. Within the market that was chosen for the on-site enrollment,only 1% of those receiving information alone enrolled compared to 23% of those who also received theopportunity to enroll on the spot but no financial subsidy. Similarly, 34% of those offered the 6-monthsubsidy without on-site enrollment purchased insurance, compared to 70% of those offered both on-the-spot enrollment and the 6-month subsidy (results not shown). In sum, simply reducing the time costsof going to an office to sign up (without offering a subsidy) had more than half the effect of a 6-monthsubsidy worth approximately $100.17 See Thornton et al. (2007) for more details.
5.3. Effect of insurance: utilization and expenditures
We next use follow-up survey data to examine the effects of insurance coverage on health-careutilization and expenditures after one year.18 In light of the large differences in enrollment betweenthose offered 6-month subsidies versus information only, we instrument for insurance coverage usingtreatment assignment with specification (1), that is, having been offered a 6-month subsidy.19 The IVestimates are presented in Table V.
Overall, enrolling in health insurance did not lead to an increase in the probability of seeking anyhealth care from a provider, but it did significantly impact substitution away from the use of public andprivate facilities into EMP facilities covered by the insurance. Those who were insured were 42.7percentage points more likely to have visited an EMP in the prior year, 8.9 percentage points less likelyto have visited a private clinic, 6.3 percentage points less likely to have visited a public health center, and11.5 percentage points less likely to have visited a public hospital than the uninsured. No differencesbetween MFI and non-MFI clients were found in the general pattern of this substitution. Althoughmost pharmaceuticals were covered under the INSS insurance and could be obtained for free fromEMPs, visits to pharmacies did not change with health insurance enrollment, likely reflecting the neteffect of substitution away from pharmacies for primary care and increased demand for drugs coveredby insurance.20 Unfortunately, our data do not allow us to measure the total amount or types ofpharmaceuticals used, which would help determine whether the composition or the total value of drugconsumption changed in response to the insurance, although the fact that pharmacy visits remainedconstant suggests that it did not.
In terms of utilization, having health insurance increased the total number of health-care visits byalmost one visit per year (0.918), but this was not statistically significant (standard error 0.749). Therewas a similar amount of substitution away from public and private provider visits into free EMP visits
17The impressive take up of lottery winners who were approached in their booths suggests that this and similar projectinterventions that target this population may be underestimating the value of their time or the range of factors inhibitingenrollment.
18In particular, we measure utilization by asking ‘How many times this past year did you visit the each of the following for yourhealth? Private doctor, pharmacy, laboratory, EMP, private hospital/clinic/MINSA health center, and MINSA public hospital’.Results using ‘location of treatment of last illness’ as a dependent variable are consistent to the main results above. While theremay have been heterogeneous treatment effects by illness, we do not observe general patterns of this in the data for last illness.
19Note that almost all of the individuals in the analytic sample with insurance were those who had received a 6-month subsidy. Thewinners of the 2-month subsidy were not interviewed during the follow-up survey.
20The survey did not identify the ownership of pharmacies. Most pharmacies are independent private facilities, but respondentsmay have included some on-site EMP pharmacies within this category.
R. L. THORNTON ET AL.194
Copyright r 2010 John Wiley & Sons, Ltd. Health Econ. 19: 181–206 (2010)
DOI: 10.1002/hec
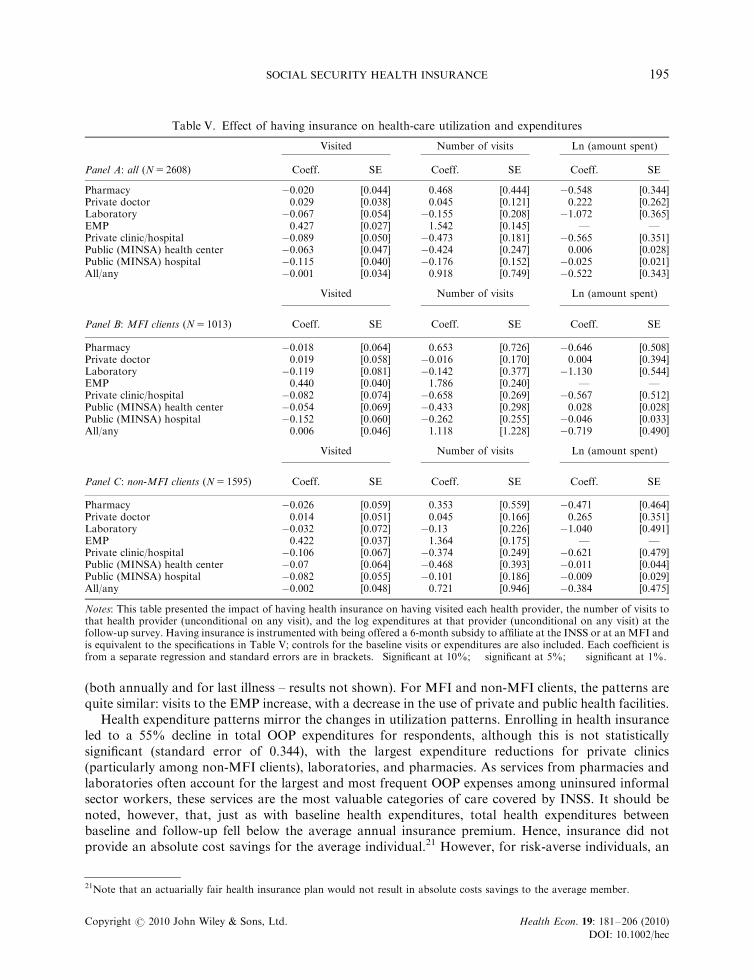
(both annually and for last illness – results not shown). For MFI and non-MFI clients, the patterns arequite similar: visits to the EMP increase, with a decrease in the use of private and public health facilities.
Health expenditure patterns mirror the changes in utilization patterns. Enrolling in health insuranceled to a 55% decline in total OOP expenditures for respondents, although this is not statisticallysignificant (standard error of 0.344), with the largest expenditure reductions for private clinics(particularly among non-MFI clients), laboratories, and pharmacies. As services from pharmacies andlaboratories often account for the largest and most frequent OOP expenses among uninsured informalsector workers, these services are the most valuable categories of care covered by INSS. It should benoted, however, that, just as with baseline health expenditures, total health expenditures betweenbaseline and follow-up fell below the average annual insurance premium. Hence, insurance did notprovide an absolute cost savings for the average individual.21 However, for risk-averse individuals, an
Table V. Effect of having insurance on health-care utilization and expenditures
Visited Number of visits Ln (amount spent)
Panel A: all (N5 2608) Coeff. SE Coeff. SE Coeff. SE
Pharmacy �0.020 [0.044] 0.468 [0.444] �0.548 [0.344]Private doctor 0.029 [0.038] 0.045 [0.121] 0.222 [0.262]Laboratory �0.067 [0.054] �0.155 [0.208] �1.072��� [0.365]EMP 0.427��� [0.027] 1.542��� [0.145] — —Private clinic/hospital �0.089� [0.050] �0.473��� [0.181] �0.565 [0.351]Public (MINSA) health center �0.063 [0.047] �0.424� [0.247] 0.006 [0.028]Public (MINSA) hospital �0.115��� [0.040] �0.176 [0.152] �0.025 [0.021]All/any �0.001 [0.034] 0.918 [0.749] �0.522 [0.343]
Visited Number of visits Ln (amount spent)
Panel B: MFI clients (N5 1013) Coeff. SE Coeff. SE Coeff. SE
Pharmacy �0.018 [0.064] 0.653 [0.726] �0.646 [0.508]Private doctor 0.019 [0.058] �0.016 [0.170] 0.004 [0.394]Laboratory �0.119 [0.081] �0.142 [0.377] �1.130�� [0.544]EMP 0.440��� [0.040] 1.786��� [0.240] — —Private clinic/hospital �0.082 [0.074] �0.658�� [0.269] �0.567 [0.512]Public (MINSA) health center �0.054 [0.069] �0.433 [0.298] 0.028 [0.028]Public (MINSA) hospital �0.152�� [0.060] �0.262 [0.255] �0.046 [0.033]All/any 0.006 [0.046] 1.118 [1.228] �0.719 [0.490]
Visited Number of visits Ln (amount spent)
Panel C: non-MFI clients (N5 1595) Coeff. SE Coeff. SE Coeff. SE
Pharmacy �0.026 [0.059] 0.353 [0.559] �0.471 [0.464]Private doctor 0.014 [0.051] 0.045 [0.166] 0.265 [0.351]Laboratory �0.032 [0.072] �0.13 [0.226] �1.040�� [0.491]EMP 0.422��� [0.037] 1.364��� [0.175] — —Private clinic/hospital �0.106 [0.067] �0.374 [0.249] �0.621 [0.479]Public (MINSA) health center �0.07 [0.064] �0.468 [0.393] �0.011 [0.044]Public (MINSA) hospital �0.082 [0.055] �0.101 [0.186] �0.009 [0.029]All/any �0.002 [0.048] 0.721 [0.946] �0.384 [0.475]
Notes: This table presented the impact of having health insurance on having visited each health provider, the number of visits tothat health provider (unconditional on any visit), and the log expenditures at that provider (unconditional on any visit) at thefollow-up survey. Having insurance is instrumented with being offered a 6-month subsidy to affiliate at the INSS or at an MFI andis equivalent to the specifications in Table V; controls for the baseline visits or expenditures are also included. Each coefficient isfrom a separate regression and standard errors are in brackets. �Significant at 10%; ��significant at 5%; ���significant at 1%.
21Note that an actuarially fair health insurance plan would not result in absolute costs savings to the average member.
SOCIAL SECURITY HEALTH INSURANCE 195
Copyright r 2010 John Wiley & Sons, Ltd. Health Econ. 19: 181–206 (2010)
DOI: 10.1002/hec
important component of the value of insurance is having coverage in cases of large unanticipated healthshocks, a benefit that accrues to all those covered regardless of utilization. Unfortunately, our sample istoo small and period of coverage too short to observe enough large health shocks and therefore measurethe benefit to individuals of being covered in such events in terms of avoiding foregone care, sale ofproductive assets, or entry into debt.
5.4. Effect of insurance: family planning and other services
An additional outcome of interest in this analysis was the association between insurance enrollment andutilization of reproductive health and family planning (RH/FP) services, especially at INSS-contractedEMP facilities. At baseline, 74.8% of the respondents had been sexually active in the previous 6 monthsand 75.4 of those (or 64% of the total sample) were using some form of birth control. We witnessed nodifference in use over time between those who enrolled in insurance and those who did not, and nosignificant change in use of EMPs as a source of FP (results not shown). Similarly, insurance coveragedid not significantly increase the likelihood of using RH services (defined to include antenatal care,delivery in a health facility, or receipt of RH screening tests; results not shown).
Among the 220 individuals in the sample who had been pregnant or had a pregnant partner in the 12months before the follow-up survey, we found no significant differences between insured andnoninsured on the likelihood of receiving prenatal care, receiving multivitamins, or having anultrasound, although rates of these services were already high. However, insured women were morelikely to receive prenatal attention from EMPs (28% of the insured individuals versus 7% of theuninsured), suggesting a potential improvement in quality of care. In addition, insured women weremore likely to have had their babies at an EMP (28% of the insured versus 8% of the uninsured). Thesestatistics should be viewed with caution given the small sample size of women who were pregnant orwho had a birth. We found no impact of being insured on the utilization of preventive tests (such as papsmears, prostate exams, mammograms, HIV tests, colonoscopy, vision, hearing, dental exams, bloodpressure, overall checkups, pregnancy tests, or malaria tests), nor on the likelihood of hospitalization(results not shown).
Finally, we found no significant effects on any measures of health status including any type ofsickness such as flu, fever, diarrhea, or on measures of length of time sick – for example, the number ofdays of missed work the last time the respondent was ill. This is consistent with finding no significanteffect of being insured on the likelihood of receiving shots or antibiotics at the time of last illness. Wealso found no significant effect of being insured on perceived health or perceived life expectancy (resultsnot shown). The absence of an effect of insurance coverage on health status suggests that quality of caredid not significantly improve as a result of shifting from public and private health-care providers toEMP clinics, although it is important to note that the period of study is very short for observing changesin crude measures of health status.
Overall, the most striking finding from this analysis is that the health insurance coverage did notappear to substantially change health-care utilization and, as a result, had little impact on health.Unfortunately, our data do not permit us to assess and compare the total value of health-careservices consumed over the period for the insured and uninsured, but the health-care utilization andhealth outcomes data show little difference between the insured and the uninsured in number ofvisits/tests/hospitalizations or health status measures, suggesting the quality of care was unchanged.The absence of an increase in health-care consumption in response to the insurance suggests boththat moral hazard is not an important feature of behavior in this segment of the market and that up-front payments do not pose a major barrier to health-care utilization among this population, forinstance, due to liquidity constraints. This result has important implications for the affordability ofhealth insurance schemes targeted to similar subpopulations. For instance, the result provides evidence
R. L. THORNTON ET AL.196
Copyright r 2010 John Wiley & Sons, Ltd. Health Econ. 19: 181–206 (2010)
DOI: 10.1002/hec
that copayments are not important for preventing ‘overconsumption’ of health care among theinsured.22
5.5. Retention
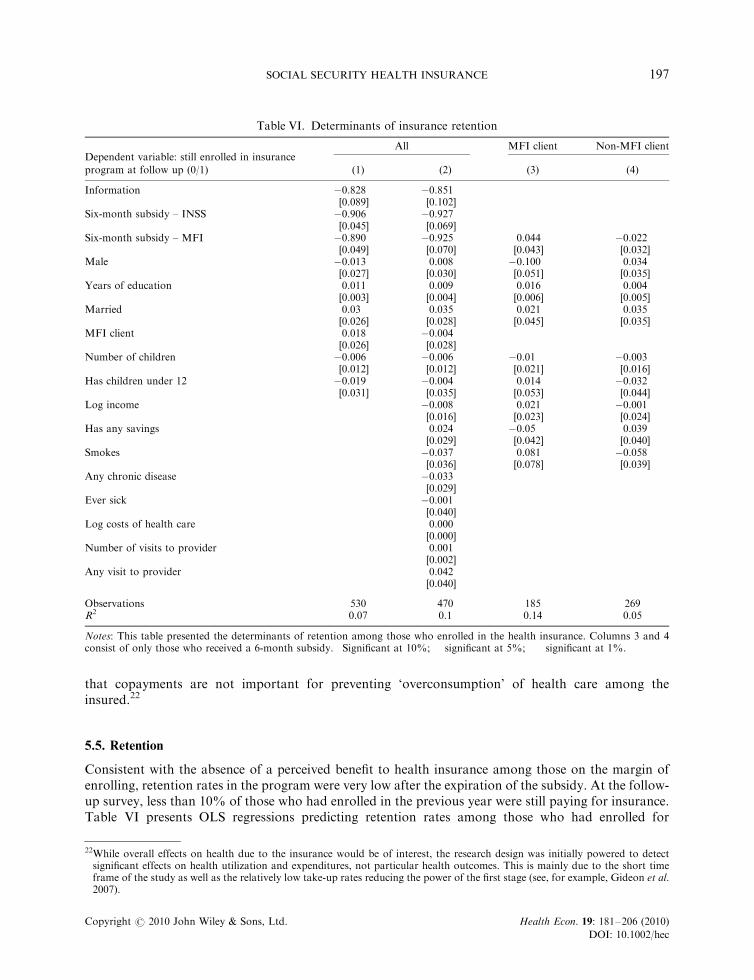
Consistent with the absence of a perceived benefit to health insurance among those on the margin ofenrolling, retention rates in the program were very low after the expiration of the subsidy. At the follow-up survey, less than 10% of those who had enrolled in the previous year were still paying for insurance.Table VI presents OLS regressions predicting retention rates among those who had enrolled for
Table VI. Determinants of insurance retention
Dependent variable: still enrolled in insuranceAll MFI client Non-MFI client
program at follow up (0/1) (1) (2) (3) (4)
Information �0.828��� �0.851���
[0.089] [0.102]Six-month subsidy – INSS �0.906��� �0.927���
[0.045] [0.069]Six-month subsidy – MFI �0.890��� �0.925��� 0.044 �0.022
[0.049] [0.070] [0.043] [0.032]Male �0.013 0.008 �0.100�� 0.034
[0.027] [0.030] [0.051] [0.035]Years of education 0.011��� 0.009�� 0.016��� 0.004
[0.003] [0.004] [0.006] [0.005]Married 0.03 0.035 0.021 0.035
[0.026] [0.028] [0.045] [0.035]MFI client 0.018 �0.004
[0.026] [0.028]Number of children �0.006 �0.006 �0.01 �0.003
[0.012] [0.012] [0.021] [0.016]Has children under 12 �0.019 �0.004 0.014 �0.032
[0.031] [0.035] [0.053] [0.044]Log income �0.008 0.021 �0.001
[0.016] [0.023] [0.024]Has any savings 0.024 �0.05 0.039
[0.029] [0.042] [0.040]Smokes �0.037 0.081 �0.058
[0.036] [0.078] [0.039]Any chronic disease �0.033
[0.029]Ever sick �0.001
[0.040]Log costs of health care 0.000�
[0.000]Number of visits to provider 0.001
[0.002]Any visit to provider 0.042
[0.040]
Observations 530 470 185 269R2 0.07 0.1 0.14 0.05
Notes: This table presented the determinants of retention among those who enrolled in the health insurance. Columns 3 and 4consist of only those who received a 6-month subsidy. �Significant at 10%; ��significant at 5%; ���significant at 1%.
22While overall effects on health due to the insurance would be of interest, the research design was initially powered to detectsignificant effects on health utilization and expenditures, not particular health outcomes. This is mainly due to the short timeframe of the study as well as the relatively low take-up rates reducing the power of the first stage (see, for example, Gideon et al.2007).
SOCIAL SECURITY HEALTH INSURANCE 197
Copyright r 2010 John Wiley & Sons, Ltd. Health Econ. 19: 181–206 (2010)
DOI: 10.1002/hec
insurance. Not surprisingly, the results suggest that those receiving the largest subsidies to signup for insurance were least likely to be retained over time; however, the differences in retentionare not statistically significant (not shown). Other baseline measures of health-care cost had nosignificant impact on the likelihood of remaining insured (Column 2). Smokers and those who had anychronic or recurring disease were less likely to continue on the plan (although this is not statisticallysignificant).
We find the same general pattern of determinants of retention comparing MFI clients andnon-MFI clients. Given the small sample size of those who purchased insurance (especially, forexample, among those receiving the informational brochure only), we restrict the sample tothose offered 6-month subsidies (columns 3 and 4) to test whether there were differences inretention by assignment to enroll at MFIs or at the INSS. MFI clients assigned to affiliate at anMFI branch were 4.4 percentage points more likely to remain insured (column 4) than those assignedto affiliate at the INSS, although the difference is not statistically significant. While this is suggestive ofthe convenience of MFIs as payment channels, it is important to note that, while place of enrollmentwas randomized, the above estimates are conditional on having purchased insurance, which isendogenous.
The patterns of retention in the program are arguably some of the most striking finding ofthe study and have important implications for the feasibility of creating sustainable healthinsurance programs for informal sector workers through voluntary schemes. If few people remain inthe program, or if those that remain are the most sick, the program will neither be effective inreaching the bulk of the uninsured nor sustainable from a cost perspective for the few that arereached. And while low enrollment rates may improve over time as information about theprogram spreads, low retention rates may be a much more a fundamental indicator of programfailure. Very low retention speaks to basic flaws in the program’s design that would need to bechanged to make the program viable. For instance, the program may have to increase the number andquality of providers or change the pay structure to a system with lower premiums and highercopayments.
6. CONTEXTUAL CONSIDERATIONS
To better understand our findings, we conducted a series of individual interviews and focus groupdiscussions to learn more about informal sector workers’ experiences with the INSS insurance. First, togain insight into reasons for nonenrollment, we conducted individual interviews with 40 randomlyselected Huembes market vendors who had won subsidies but not enrolled. To better understandwhether participating EMPs were meeting the standards necessary to attract and retain subscribers andproviding appropriate services to the informal sector, we also interviewed 20 participants who hadenrolled.
In total, we conducted nine focus group discussions among five strata of participants definedaccording to MFI client status, receipt of a subsidy, and enrollment in the insurance:
Won subsidy No subsidy
Enrolled Did not enroll Did not enroll
MFI client Stratum 1 Stratum 3 Stratum 5Non-MFI client Stratum 2 Stratum 4
R. L. THORNTON ET AL.198
Copyright r 2010 John Wiley & Sons, Ltd. Health Econ. 19: 181–206 (2010)
DOI: 10.1002/hec
With the exception of stratum 5, two focus group discussions were organized for each stratum, oneeach with vendors from the Oriental and Huembes markets.23 In total, 73 market vendors participatedin the discussions. Selected qualitative findings, grouped by theme, are discussed below. In addition tothese focus groups, we also conducted interviews with MFI representatives.
Time and convenience costs: Interviews with the 40 randomly selected vendors in the Huembesmarket who had not purchased insurance even after winning a 6-month subsidy revealed that 25intended to enroll. Half of these explained they had not found the time to do so. Other reasonsfor not signing up included problems obtaining all of the required documentation (photos, copyof ID card, children’s birth certificates, and subscription forms) and confusion about the enrollmentprocess.
Information: Few participants in our focus group discussions had heard of the INSS insuranceprogram for informal workers prior to the baseline survey. In the focus groups, some expressedconfusion about the insurance benefits; in particular, some participants thought that the insuranceprovided benefits during old age. This confusion may have been related to the fact that INSS formalsector coverage bundles pension, health insurance, and worker’s compensation into one package.Discussants also noted difficulties obtaining clear information about the program, particularly from theMFIs; 12 MFI clients said that they received no information about the program from their MFI. A fewwere skeptical of the program and its legitimacy, and worried that they might get ‘trapped’ into payingfor the insurance after the subsidy expired. The key recommendations suggested by participants forimproving the program were better provision of information about what benefits were covered, how toenroll, what fees would be charged, and how to make payments.
‘I think that is the reason that most people don’t pay into the insurance, we don’t know where to do itor with whom to do it. I think there needs to be more publicity y’
–MFI client who won a subsidy but did not enroll [Huembes market]
Eight participants reported that they never received proof of their enrollment in the insurance fromINSS. This led to confusion about whether the program was ‘real,’ whether they were indeed covered,and when they could start using services.24
‘I was told that y they would notify me when I could use the insurance, a thing that never happened.After a week passed, then two weeks, I said that it was a real joke because they never notified me.Then 8 months later, a statement arrived that owed two months of insurance payments.’
–Non-MFI client who enrolled [Oriental market]
Attitudes toward MFIs as insurance intermediaries: In contrast to researchers’ expectations, focusgroup discussants expressed a preference for enrolling in the insurance directly with INSS rather thanthrough MFIs. INSS was perceived as a more stable institution, whereas MFIs were potentially
23Respondents who had provided telephone numbers during the follow-up survey were selected randomly within each stratum.Researchers first contacted potential participants via telephone, and followed up with an in-person visit to the market stall toadminister an informed consent protocol to those who agreed to participate. Despite confirming their consent to participate,some did not attend. Only 2 out of 30 recruited Stratum 5 participants in the Oriental market showed up as planned, so thatdiscussion was cancelled. Focus group discussions were held at quiet locations near each market. All participants were paid atransportation stipend of approximately 5 dollars. A professional facilitator recruited the participants and moderated eachdiscussion. All discussions were tape recorded and transcribed.
24Another potential source of confusion about enrollment derived from the failure of INSS to deliver monthly billing statements.Under the traditional INSS (formal sector) insurance scheme, couriers on motorbikes hand-deliver monthly statements to eachemployer’s office; this system was administratively burdensome for the dispersed informal sector workers. While some workersreceived their statements, this was not always reliable and this may have caused more confusion.
SOCIAL SECURITY HEALTH INSURANCE 199
Copyright r 2010 John Wiley & Sons, Ltd. Health Econ. 19: 181–206 (2010)
DOI: 10.1002/hec
vulnerable to bankruptcy and possibly less trustworthy. Respondents noted that health insurance wasthe regular ‘business’ of INSS, whereas MFIs were not experts in health insurance:
‘INSS knows the benefits, what’s not covered, while the MFI is a lending institution and doesn’tunderstand [health]. Health is not its specialty; its thing is money.’
–MFI client that enrolled [Oriental market]
Several discussants expressed concern that MFIs might charge hidden fees or interest for providinginsurance services. However, a handful of participants expressed a preference to make routine paymentsat banks and MFIs, noting the long waiting lines at the INSS office.
One possible reason for poor service among the MFIs was conflict with the government over theirrole in the program. As described earlier, approximately 10 months into the program, INSS chosenot to renew their contracts with the participating MFIs. While the MFIs were engaged during the firstphase of the pilot and evaluation, once it became clear that INSS contracts with MFIs would not berenewed, MFIs halted their efforts to market the voluntary program and discontinued offeringpayment services on behalf of INSS. The change in the process, and the accompanying lack ofinformation, was likely to have been a source of confusion among participants who had signed up withan MFI. In the follow-up survey, 62% of participants claimed they did not know where to makeinsurance payments.
Role of EMPs: The individual interviews with 20 selected survey participants who had registered forinsurance indicated that a small number of EMP clinics were aggressively encouraging subsidy winnersto enroll in the insurance and register with their clinic. Indeed, two small EMPs had over 40% of themarket share. However, enrollees reported that these EMPs did not provide sufficient information onwhen they could begin to utilize services, and they expressed widespread dissatisfaction with the clinics’customer service and willingness to serve clients under the new insurance scheme. Hence, a key factor inimproving retention may be increasing provider quality of care and level of service.
Willingness to pay for insurance: Although many focus group participants reported that healthinsurance was worth buying, almost all indicated a preference for an insurance product with a lowerprice tag. Those who enrolled and had young children indicated that obtaining coverage for theirchildren under 12 was a key motivating factor. Other reported reasons for enrollment were ensuringaccess to regular medical checkups and getting protection in the case of future emergencies or surgeries.Reasons for nonenrollment, cited by those who received a subsidy but did not purchase the insurance,included the following: having children who were too old to be eligible; preference to visit a pharmacyrather than a doctor for most health care because it was faster and more convenient; concern that thepremium was too high to afford after the subsidy expired; and the time costs and inconvenienceassociated with the enrollment process. Given this, an important design consideration may becopayment versus flat fee for service.
MFI participation: Regarding involvement of MFIs in voluntary health insurance schemes for the poor,the challenges of a program fundamentally based on a public–private partnership cannot beunderestimated. First, it is challenging to coordinate programs between institutions that have substantialdifferences in culture, management styles, and processes. These differences can lead to miscommunicationand frustration among personnel on both sides and require significant coordination, transparency, andcommitment from senior management. Second, a lack of trust between INSS and the MFIs aboutincentives for participating in the program tainted the partnership. INSS’s suspicion that MFIs wouldunfairly profit from the program appears to have been unfounded, according to our interviews with MFIs.The initial investment by MFIs in operations, training, and marketing for the program were significant,and low volumes of sales meant thatMFIs recovered few of their costs. INSS argued thatMFIs would gainfinancially by having healthier clients who then repaid their loans more steadily, but given MFIs’ alreadyvery high loan repayment rates, this potential benefit was rather insignificant.
R. L. THORNTON ET AL.200
Copyright r 2010 John Wiley & Sons, Ltd. Health Econ. 19: 181–206 (2010)
DOI: 10.1002/hec
MFIs did have incentives to participate in the program, however. According to our interviews withMFI representatives, they saw the INSS insurance as a marketable complement to their existing creditservices. Strong competition in the microfinance sector in Nicaragua drives MFIs to seek new productsthat would give them a competitive advantage. In addition, the MFIs’ sense of social mission played animportant role in their decision to participate. MFIs were aware that their clients lacked access toquality health care and saw the INSS product as a cost-effective solution to improve this access. Theincentives faced by individual MFI staff members to support the demonstration project, however, wereless clear. Loan officers who were charged with selling the product found that closing a ‘sale’ ofinsurance could take two visits and over an hour.
7. CONCLUSIONS
This article presents the results from a randomized evaluation of the Nicaraguan government’s 2007pilot program to extend social security health insurance to the informal sector on a voluntary basis. Wefind overall, low rates of enrollment. Those who did enroll substituted toward services at coveredfacilities and total OOP expenditures fell. We find no evidence of an increase in health-care utilizationamong the newly insured. These main findings are similar to analysis of Mexico’s voluntary insuranceprogram (King et al., 2009), although our analysis sheds light on the effectiveness of some elements ofthe program’s design in terms of encouraging enrollment and retention and the program’s effects onhealth service utilization and expenditures. Our results provide important evidence on the challenges ofproviding health insurance coverage to informal sector workers in developing countries through theextension of an existing mandatory public sector program to a population for whom enrollment isvoluntary.
Ultimately, while the INSS program aimed at providing greater accessibility to informal sector workersby bringing the enrollment and payments processes closer to the physical location of these workers (viaMFIs), results from this study indicate that the Nicaraguan government did not succeed in creating asustainable health insurance program, largely because convenience and quality of care were notadequately addressed. We emphasize six central policy-relevant conclusions based on our findings.
First, if individuals are risk averse, they should be willing to pay at least as much for insurancepremiums as their anticipated annual health expenditures on services that would be covered by theinsurance. At the baseline, 11% of informal market vendors in Managua who did not enroll in theinsurance program had higher baseline annual health expenditures than the annual cost of flat fee (noco-payments) insurance coverage. The program was designed in order to increase quality services andreduce wait-times. However, focus group discussions suggest that both factors – utilization costs andquality concerns – were important. Low willingness to pay suggests that the average individual assignslittle value to insurance as a means of managing financial risk, that is, he/she is not willing to paypremiums much beyond what he/she expects to use over the course of the year. The price of theinsurance product may have indeed been too high; we do not know from our data to what extentdemand may have been greater at lower prices.
Second, although lowering the price of insurance through subsidies encouraged enrollment, very fewof subscribers on the margin of influence were willing to pay the full price of insurance once the subsidyran out, indicating that short-term price subsidies were not an effective means of promoting insuranceenrollment in the informal sector. The lower initial price was designed to increase demand for insuranceamong the previously uninsured. However, in this setting it appears that permanently lower prices (orhigher quality services) are needed to sustain a voluntary program. This is important evidence on thelimitations of using subsidies as a means of attracting new insurance customers. Instead, governmentsshould consider alternative payment structures, such as lowering premiums and introducing co-payments, to increase demand for the product. Furthermore, the low cost of private and public sector
SOCIAL SECURITY HEALTH INSURANCE 201
Copyright r 2010 John Wiley & Sons, Ltd. Health Econ. 19: 181–206 (2010)
DOI: 10.1002/hec
providers sought out by the uninsured – which kept OOP health-care costs below the cost of INSSinsurance premiums – suggests that respondents are combining available services more efficiently thanthe INSS. Further analysis might evaluate the quality of the services being used and determine whethera more efficient ‘package’ can be offered by the INSS or other insurers.
Third, streamlined enrollment procedures by offering on-site affiliation were valuable in attractingnew customers, indicating that time costs were important for Nicaraguan informal sector workers’decisions around health insurance. This is similar to other work in other developing countries, whichsuggests that transaction costs are important for insurance enrollment and health-care utilization(Pauly et al., 2008, 2006). Similar strategies may be necessary for launching a new health insuranceprogram in a comparable setting, both to bring the program to scale and broaden the risk pool. Oursurveys and focus group discussions indicated a strong preference for a more transparent andconvenient registration process. Time constraints were cited as an important reason for not enrolling inthe insurance, even when it was subsidized. Participants also criticized slow, ineffective distribution ofbilling statements. Further research might test the potential for automated registration proceduresthrough PDAs and other remote devices, as well as paperless billing through mechanisms such as SMSmessages on cell phones. Payment systems themselves could potentially bypass the MFI or bank ifsufficient technology is integrated into the process. Confusion about the location of payments andbilling problems also affected the retention of survey respondents who signed up for insurance.
Fourth, our results suggest that insurance coverage did not encourage overconsumption of health-care services. Contrary to what many governments fear when introducing flat-fee health insurancecoverage, those who enrolled in the program did not exhibit a significantly different pattern of health-care utilization than they did when they were uninsured. While we cannot completely rule out thepossibility that the insured increase their consumption of health care conditional on need, particularlygiven that that we do not have very precise measures of quality, the change in consumption is certainlynot significant enough to destabilize an insurance program.
Fifth, while using MFIs as delivery channels may be useful when government programs have limitedoutreach and infrastructure and when MFIs view mutual benefit in the association, offeringtransactions services through MFIs is not sufficient to bring workers in the door. Hence, it isimportant not to underestimate the complexity involved in working with MFIs. Suspicion aboutpossible profit-oriented motivations of MFIs in Nicaragua damaged the tone of their workingrelationship with INSS. Strong strategic leadership and commitment are needed within both sectors toensure that the operational arrangements are clear and incentives are well aligned. Finally,administrative procedures for both enrollment and premium payments need to be clearly delineatedand convenient for users.
Sixth, the theory that the INSS health insurance for informal sector workers would lessen the burdenon Ministry of Health resources may not have been founded. At baseline, informal sector workers inour sample were already more likely to use private sector providers than public providers. Enrolling inINSS health insurance resulted in significant switching out of use of both public and private facilitiesinto EMP services. Programs seeking to reduce the burden on public sector resources of public healthfacilities should consider that informal sector workers in Nicaragua spend significantly more out ofpocket on health care than the overall population and may not be among those placing the greatestburden on public resources. Segmentation of the informal sector may identify workers in the lowerincome brackets most likely to use public sector resources and perhaps able to pay smaller premiums forcomplementary insurance or for basic pre-paid private service packages in convenient locations. Forthose informal sector workers on the higher end of the income spectrum, who are already using privatehealth facilities and pharmacies, insurance programs need to take great care to differentiate themselvesin terms of price, convenience, and quality in order to ensure retention.
In sum, to ensure retention in an unsubsidized insurance program, benefit packages must be designedto balance informal workers’ preference for convenience and quality of care with their limited
R. L. THORNTON ET AL.202
Copyright r 2010 John Wiley & Sons, Ltd. Health Econ. 19: 181–206 (2010)
DOI: 10.1002/hec
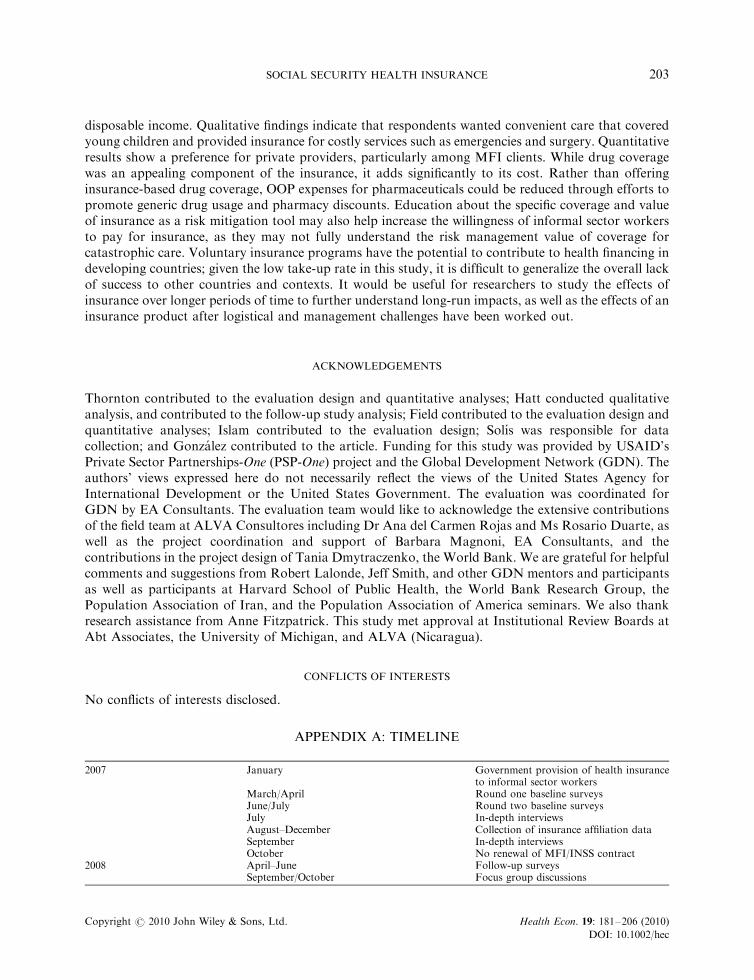
disposable income. Qualitative findings indicate that respondents wanted convenient care that coveredyoung children and provided insurance for costly services such as emergencies and surgery. Quantitativeresults show a preference for private providers, particularly among MFI clients. While drug coveragewas an appealing component of the insurance, it adds significantly to its cost. Rather than offeringinsurance-based drug coverage, OOP expenses for pharmaceuticals could be reduced through efforts topromote generic drug usage and pharmacy discounts. Education about the specific coverage and valueof insurance as a risk mitigation tool may also help increase the willingness of informal sector workersto pay for insurance, as they may not fully understand the risk management value of coverage forcatastrophic care. Voluntary insurance programs have the potential to contribute to health financing indeveloping countries; given the low take-up rate in this study, it is difficult to generalize the overall lackof success to other countries and contexts. It would be useful for researchers to study the effects ofinsurance over longer periods of time to further understand long-run impacts, as well as the effects of aninsurance product after logistical and management challenges have been worked out.
ACKNOWLEDGEMENTS
Thornton contributed to the evaluation design and quantitative analyses; Hatt conducted qualitativeanalysis, and contributed to the follow-up study analysis; Field contributed to the evaluation design andquantitative analyses; Islam contributed to the evaluation design; Solıs was responsible for datacollection; and Gonzalez contributed to the article. Funding for this study was provided by USAID’sPrivate Sector Partnerships-One (PSP-One) project and the Global Development Network (GDN). Theauthors’ views expressed here do not necessarily reflect the views of the United States Agency forInternational Development or the United States Government. The evaluation was coordinated forGDN by EA Consultants. The evaluation team would like to acknowledge the extensive contributionsof the field team at ALVA Consultores including Dr Ana del Carmen Rojas and Ms Rosario Duarte, aswell as the project coordination and support of Barbara Magnoni, EA Consultants, and thecontributions in the project design of Tania Dmytraczenko, the World Bank. We are grateful for helpfulcomments and suggestions from Robert Lalonde, Jeff Smith, and other GDN mentors and participantsas well as participants at Harvard School of Public Health, the World Bank Research Group, thePopulation Association of Iran, and the Population Association of America seminars. We also thankresearch assistance from Anne Fitzpatrick. This study met approval at Institutional Review Boards atAbt Associates, the University of Michigan, and ALVA (Nicaragua).
CONFLICTS OF INTERESTS
No conflicts of interests disclosed.
APPENDIX A: TIMELINE
2007 January Government provision of health insuranceto informal sector workers
March/April Round one baseline surveysJune/July Round two baseline surveysJuly In-depth interviewsAugust–December Collection of insurance affiliation dataSeptember In-depth interviewsOctober No renewal of MFI/INSS contract
2008 April–June Follow-up surveysSeptember/October Focus group discussions
SOCIAL SECURITY HEALTH INSURANCE 203
Copyright r 2010 John Wiley & Sons, Ltd. Health Econ. 19: 181–206 (2010)
DOI: 10.1002/hec
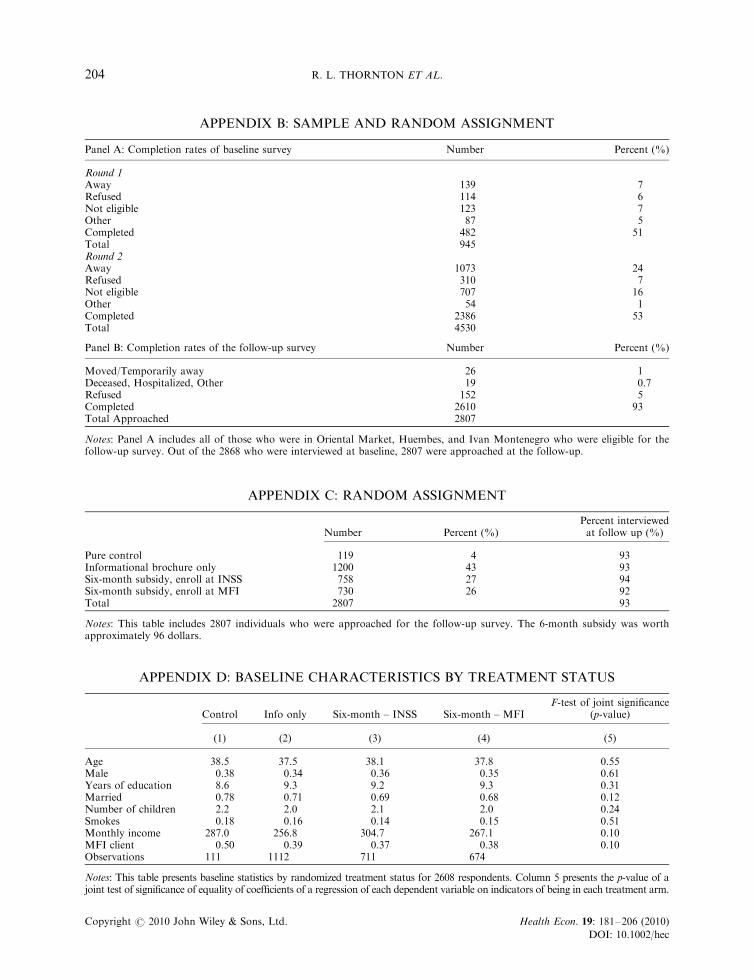
APPENDIX B: SAMPLE AND RANDOM ASSIGNMENT
Panel A: Completion rates of baseline survey Number Percent (%)
Round 1Away 139 7Refused 114 6Not eligible 123 7Other 87 5Completed 482 51Total 945Round 2Away 1073 24Refused 310 7Not eligible 707 16Other 54 1Completed 2386 53Total 4530
Panel B: Completion rates of the follow-up survey Number Percent (%)
Moved/Temporarily away 26 1Deceased, Hospitalized, Other 19 0.7Refused 152 5Completed 2610 93Total Approached 2807
Notes: Panel A includes all of those who were in Oriental Market, Huembes, and Ivan Montenegro who were eligible for thefollow-up survey. Out of the 2868 who were interviewed at baseline, 2807 were approached at the follow-up.
APPENDIX C: RANDOM ASSIGNMENT
Number Percent (%)Percent interviewedat follow up (%)
Pure control 119 4 93Informational brochure only 1200 43 93Six-month subsidy, enroll at INSS 758 27 94Six-month subsidy, enroll at MFI 730 26 92Total 2807 93
Notes: This table includes 2807 individuals who were approached for the follow-up survey. The 6-month subsidy was worthapproximately 96 dollars.
APPENDIX D: BASELINE CHARACTERISTICS BY TREATMENT STATUS
Control Info only Six-month – INSS Six-month – MFIF-test of joint significance
(p-value)
(1) (2) (3) (4) (5)
Age 38.5 37.5 38.1 37.8 0.55Male 0.38 0.34 0.36 0.35 0.61Years of education 8.6 9.3 9.2 9.3 0.31Married 0.78 0.71 0.69 0.68 0.12Number of children 2.2 2.0 2.1 2.0 0.24Smokes 0.18 0.16 0.14 0.15 0.51Monthly income 287.0 256.8 304.7 267.1 0.10MFI client 0.50 0.39 0.37 0.38 0.10Observations 111 1112 711 674
Notes: This table presents baseline statistics by randomized treatment status for 2608 respondents. Column 5 presents the p-value of ajoint test of significance of equality of coefficients of a regression of each dependent variable on indicators of being in each treatment arm.
R. L. THORNTON ET AL.204
Copyright r 2010 John Wiley & Sons, Ltd. Health Econ. 19: 181–206 (2010)
DOI: 10.1002/hec
REFERENCES
Abel-Smith B. 1992. Health insurance in developing countries: lessons from experience. Health Policy and Planning7(3): 215–226.
Alderman H, Paxson C. 1994. Do the poor insure? A synthesis of the literature on risk sharing institutions indeveloping countries. Economics in a Changing World: Proceedings of the Tenth World Congress of theInternational Economic Association. Macmillan Press: Moscow, London.
Barros R. 2009. Wealthier but not much healthier: effects of a health insurance program for the poor in Mexico.Stanford University, Working Paper.
Behrman J, Knowles J. 1999. The Demand for Health Insurance in Vietnam. Mimeo.Chankova S, Sulzbach S, Diop F. 2008. Impact of mutual health organizations: evidence from West Africa. Health
Policy and Planning 23(4): 264–276.Churchill C. 2003. Insurance work for microfinance institutions: a technical guide to developing and delivering
microinsurance. Focus Programme for Small Enterprise Development. International Labour Organization:Geneva.
Churchill C, Cohen M. 2006. Marketing microinsurance. In Protecting the Poor, A Microinsurance Compendium,Churchill C (ed.). International Labor Organization: Geneva.
Dercon S. 2002. Income risk, coping strategies and safety nets. The World Bank Research Observer 17(2): 141–166.Dercon S, Kirchberger M, Gunning JW, Platteau J. 2008. Literature review on microinsurance. European
Development Research Network (EUDN). Oxford University.Duflo E, Banerjee A, Deaton A. 2004. Wealth, health, and health services in rural Rajasthan. American Economic
Review Papers and Proceedings 94(2): 326–330.Dow W, Schmeer K. 2003. Health insurance and child mortality in Costa Rica. Social Science and Medicine 57(6):
975–986.Fafchamps M. 1999. Risk Sharing and Quasi-credit. The Journal of International Trade and Economic Development
8(3): 257–278.Franco L, Diop F, Burgert C, Kelley A, Makinen M, Simpara C. 2008. Effects of mutual health organizations on
use of priority health-care services in urban and rural Mali: a case-control study. Bulletin of the World HealthOrganization 86(11): 830–838.
Gakidou E et al. 2006. Assessing the effect of the 2001–2006 Mexican health reform: an interim report card. TheLancet 368: 1920–1935.
Gertler P, Gruber J. 2002. Insuring consumption against illness. American Economic Review 92(1): 5176.Gertler P, Solon O. 2002. Who benefits from social health insurance? Evidence from the Philippines. Unpublished
Manuscript, University of California, Berkeley and the University of the Philippines.Giedion U et al. 2007. The impact of subsidized health insurance on access, utilization and health status in
Colombia. iHEA 2007 6th World Congress: Explorations in Health Economics Paper. Available at SSRN: http://ssrn.com/abstract5 993919.
Gine X, Tonsend RM, Vickery J. 2007. Patterns of rainfall insurance participation in rural India. Policy ResearchWorking Paper Series 4408, The World Bank.
GTZ, ILO, WHO. 2005. Recommendations for action. The International Conference on Social Health Insurance inDeveloping Countries. GTZ, ILO, and WHO: Geneva.
Gumber A, Kulkarni V. 2000. Health insurance for informal sector: case study of Gujarat. Economic and PoliticalWeekly, Septermber 30.
Jack W. 2003. Contracting for health services: an evaluation of recent reforms in Nicaragua. Health Policy andPlanning 18(2): 195–204.
Jowett M. 2003. Do informal risk sharing networks crowd out public voluntary health insurance? Evidence fromVietnam. Applied Economics 35: 1153–1161.
King G et al. 2007. A ‘politically robust’ experimental design for public policy evaluation, with application to theMexican universal health insurance program. Journal of Policy Analysis and Management 26(3): 479–506.
King G et al. 2009. Public policy for the poor? A randomised assessment of the Mexican universal health insuranceprogramme. The Lancet 373: 1447–1454.
Kremer M et al. 2006. Contracting for health: evidence from Cambodia. Unpublished manuscript, Harvard University.Laver R. 2000. Private Health Care in Latin America: Emerging Opportunities. Institute of the Americas: La Jolla; 1–12.Magnoni B, Natilson N, Bolanos G. 2005. Estudio de Factibilidad de la Incorporacion del Sector Laboral
Independiente en el Seguro Facultativo de Salud del INSS. Original Feasibility Study submitted by the Banking onHealth Project to the INSS in 28 September 2005.
Matin I, Hulme D, Rutherford S. 2002. Finance for the poor: from microcredit to microfinancial services. Journal ofEconomic Development 14: 273–294.
SOCIAL SECURITY HEALTH INSURANCE 205
Copyright r 2010 John Wiley & Sons, Ltd. Health Econ. 19: 181–206 (2010)
DOI: 10.1002/hec
McIntyre D, Thiede M, Dahlgren G, Whitehead M. 2006. What are the economic consequences for households ofillness and of paying for health care in low- and middle-income country contexts? Social Science and Medicines62(4): 858–865.
Miller G, Pinto D, Vera-Hernandez M. 2009. Supply- vs. demand-side rationing in developing country healthinsurance: evidence from Colombia’s ‘Regimen Subsidiado’. Working Paper.
Morduch J. 1999. Between the state and the market: can informal insurance patch the safety net? The World BankResearch Observer 14: 187–207.
Morduch J, SharmaM. 2002. Strengthening Public Safety Nets from the Bottom Up. The World Bank: Washington, DC.Narayan D, Chambers R, Shah M, Petesch P. 2000. Voices of the Poor: Crying Out for Change. Oxford University
Press: New York.Panopoulus G, Velez CE. 2001. Subsidized health insurance, proxy means testing, and the demand for health care
among the poor in Colombia. Colombia Poverty Report, vol. 2. World Bank: Washington.Pauly M, Blavin F, Meghan S. 2008. Is there a market for voluntary health insurance in developing countries?
NBER Working Paper ]14095, Cambridge, MA.Pauly M, Zweifel P, Scheffler R, Preker A, Bassett M. 2006. Private health insurance in developing countries.
Health Affairs 25(2): 369–379.Preker AS, Carrin G, Dror DM, Jakab M, Hsaio W, Arhin D. 2002. Effectiveness of community health financing in
meeting the cost of illness. Bulletin of the World Health Organization 80(2): 143–150.Russell S. 2004. The economic burden of illness for households in developing countries: a review of studies focusing
on malaria, tuberculosis, and human immunodeficiency virus/acquired immunodeficiency syndrome. AmericanJournal of Tropical Medicine and Hygiene 71(Suppl. 2): 147–155.
Sekhri N, Savedoff W. 2005. Private health insurance: implications for developing countries. Bulletin of the WorldHealth Organization 83: 127–134.
Smith K, Sulzbach S. 2008. Community-based health insurance and access to maternal health services: evidencefrom three West African countries. Social Science and Medicines 66(12): 2460–2473.
Thornton R, Moncada MG, Islam M. 2007. Randomized evaluation of a program extending social security healthinsurance to the informal sector via MFIs in Nicaragua. Baseline Report, Private Sector Partnerships-OneProject (Abt Associates Inc.) and Global Development Network, Bethesda, MD.
Wagstaff A. 2007. Health insurance for the poor: initial impacts of Vietnam’s health care fund for the poor. PolicyResearch Paper Series Working Paper ]4134, The World Bank.
Wang H, Yip W, Zhang L, Hsiao W. 2009. The impact of rural mutual health care on health status: evaluation of asocial experiment in rural China. Health Economics 18(S2): S65–S82.
R. L. THORNTON ET AL.206
Copyright r 2010 John Wiley & Sons, Ltd. Health Econ. 19: 181–206 (2010)
DOI: 10.1002/hec