Analyzing wage gaps for indigenous in informal and formal labor markets in Latinamerica: The case of...
27
Analyzing wage gaps for indigenous in informal and formal labor markets in Latinamerica: The case of Bolivia, Brazil, Ecuador, Guatemala, Nicaragua and Perœ Gustavo Canavire-Bacarreza Andrew Young School of Policy Studies Georgia State University April 28, 2008 Abstract This paper analyzes the size, components and determinants of wage gaps in formal and informal labor markets in six Latin American coun- tries, emphazising on the indigenous wage gaps inside these employment sectors. To this aim household suveys carried out on 2001 are analyzed. The resultsfrom the decomposition are according to the literature and show that there exists large wage gaps between formal and informal sectors and against indigenous population. The unxplained portion of the wage gap tend to be high which could reect high levels of discriminatio. I also nd evidence that the unexplained wage gap is higher in informal sector of the labor market in all the countries, but is even higher in countries with high density of indigenous population. Regarding the determinants we nd that experience increases the unexplained wage gap in formal markets and de- creases it on informal markets in countries with higher levels of indigenous population,while education works in the opposite direction. Keywords: Discrimination, Indigenous, Latin America, Informality JEL Classication: J70, O17, 1
-
Upload
conflictanddevelopment -
Category
Documents
-
view
0 -
download
0
Transcript of Analyzing wage gaps for indigenous in informal and formal labor markets in Latinamerica: The case of...
Analyzing wage gaps for indigenous in informaland formal labor markets in Latinamerica: Thecase of Bolivia, Brazil, Ecuador, Guatemala,
Nicaragua and Perú
Gustavo Canavire-BacarrezaAndrew Young School of Policy Studies
Georgia State University
April 28, 2008
Abstract
This paper analyzes the size, components and determinants of wage
gaps in formal and informal labor markets in six Latin American coun-
tries, emphazising on the indigenous wage gaps inside these employment
sectors. To this aim household suveys carried out on 2001 are analyzed.
The results from the decomposition are according to the literature and show
that there exists large wage gaps between formal and informal sectors and
against indigenous population. The unxplained portion of the wage gap
tend to be high which could re�ect high levels of discriminatio. I also �nd
evidence that the unexplained wage gap is higher in informal sector of the
labor market in all the countries, but is even higher in countries with high
density of indigenous population. Regarding the determinants we �nd that
experience increases the unexplained wage gap in formal markets and de-
creases it on informal markets in countries with higher levels of indigenous
population,while education works in the opposite direction.
Keywords: Discrimination, Indigenous, Latin America, Informality
JEL Classi�cation: J70, O17,
1

1 Introduction
Over the past two decades informality became one of the most important prob-lems that developing countries face, due to its e¤ects on household wealth,inequality and poverty itself. The growth on informal sectors in developingcountries is due the lack of capacity of formal sectors to create jobs (Blunchet. al. 2001). In this line, the increase of the labor force in urban areas indeveloping countries (especially due to the population growth but also due tothe high migration from rural to urban areas) has overwhelmed the potentialjob creation of formal sectors . Interestingly, a big part of the migrants fromrural areas are indigenous, low educated and vulnerable groups that seek for abetter future. These factors in�uenced to create two types of wage gaps thathave been studied in the existing literature. The �rst is the wage di¤erences ex-isting between formal and informal sectors, and the second between indigenousand non indigenous population. Less attention has been paid to what happensinside these groups which is important in itself in policy and academic grounds.Wage gaps between formal and informal workers are seeing as barriers for
development and a major concern for governments and international organi-zations (World Bank 2007). These disparities have also been the focus of arecent literature.(Arias et. al. 2007, Maloney 1999, Pratap 2006). Based onthe existing literature it is not clear if these di¤erences are bigger or smallerinside employment sectors, for example there is no empirical evidence of thewage gaps inside the formal and informal employment sector, moreover there isnot evidence on the explained and unexplained components of the wage gapsinside these sectors. It is a general believe that the unexplained portion of thewage gap (generally referred as discrimination) is higher in formal sector forthose indigenous that have the possibility to get into this sector, and lower ininformal markets given that the workers tend to be less specialized and theirreservation wages do not vary among them. It is in this sense that the evalu-ation of the extend of wage gaps between informal and formal labor markets,and the existing wage gaps inside these employment sectors is important. It�salso important to evaluate if part of the unexplained wage gap is due to barriersto employment in the formal sector.The main goals of this paper are:
1. Analyze the wage gaps between formal and informal markets in LatinAmerican countries.
2. Evaluate the existence of indigenous discrimination (or unexplainedwage gap) in informal and formal labor markets and the extend of which eachcomponent a¤ect the unexplained wage gap.To achieve this two goals it is necessary to estimate what part of the dif-
ference between indigenous and non indigenous workers earnings cannot be ex-plained by di¤erences in their respective productive characteristics. Even thismethodology presents limitations due the fact that it is nearly impossible tocontrol for all the productive characteristics of the workers, it is the standardwage analysis.Over the paper I use two di¤erent ways to distinguish between indigenous or
2
non indigenous. I apply the distinction, between indigenous and non indigenous,using self identi�cation (Bolivia, Brazil, Guatemala, Nicaragua, Perú) or na-tive language when the self identi�cation was not available.(Ecuador).The yearsutilized on the study are listed on the appendix and are chosen based on theavailability of household surveys. The intention is not only to analyze the wagegap of indigenous population in formal and informal markets but also �nd thespeci�c components or sources of the unexplained part of income di¤erential inorder to draw policy implications.I �nd that there exist substantial income disparities between informal and
formal sectors, and between indigenous and non indigenous as well, as seeningthe existing literature. I extend the analysis of indigenous wage gap inside theformal and informal sectors, and �nd that the higher the indigenous population,the higher the unexplained wage gap. Moreover, the unexplained wage gapagainst indigenous in informal sector is higher in countries such as Bolivia orGuatemala where there is a big indigenous population.The following section presents a brief review of the existing literature on
informality and indigenous population in Latin America. Section 3 presentsa discussion of the utilized data and the methodology, section 4 explains theresults and section 5 presents the conclusions of the paper.
2 Where do I stand? Brief Review of Literature
Following I �rst present a brief review of literature on wage di¤erential betweenfor informal and formal workers and then between indigenous and non indige-nous population, to the best of my knowledge there is no empirical or theoreticalstudy that interacts both.Wage di¤erentials have been extensively studied over time in di¤erent con-
texts in developed and developing countries as well. The context in which wagedi¤erentials are analyzed vary between countries and context, but the mainfocus of the literature has been gender, race and regions. Latin American coun-tries have not been the exception, several studies on wage di¤erentials and theirdeterminants exist in for di¤erent groups. In what respects to formal and infor-mal labor markets in Latin America some authors have used rigorous data toshow that wage di¤erentials between these two sectors are statistically signi�-cant, even after controlling for several personal and household characteristics aswell as for selectivity bias. Gindling (1991) for Costa Rica, Funkhouser (1996)for the �ve Central American countries, Marcouiller et al (1997) for Mexico, ElSalvador and Perú, Saavedra and Chong (1999) for Perú and Orlando (2000)for Venezuela, Jimenez (1999) for Bolivia have failed to reject the hypothesisof no segmentation. All these studies �nd that the returns to education inthe informal sector are either insigni�cant or smaller than in the formal sector.This has been taken as evidence of labor market segmentation because the sameproductive characteristic, i.e. education, is being paid di¤erently across sectors.The evidence is not unanimous though. Tannen (1991) found no di¤erence
between formal and informal wages, after controlling for other variables and
3
selectivity, in Northeast Brazil. More subtly, Pradhan (1995) argues that signif-icant di¤erences in wages may be due to compensating di¤erentials rather thanto segmentation. In other words, individuals accept di¤erent wages in di¤erentsectors simply because non pecuniary characteristics di¤er between jobs. Evenfor one or other reason the fact is that the wage di¤erentials between informaland formal sector exists.As stated by Arias, Landa and Yañez (2007), the de�nition of informality
has not been universally agreed, nevertheless a wide consensus exists that italways relates to unprotected workers, avoidance of excessive regulation, lowproductivity, unfair competition, evasion of the rule of law, underpayment ornonpayment of taxes, and work �underground� or in the shadows. Studyingthis concept involves the recognition that whether the existence of formal sectorre�ects "barriers" or "choice", particularly the old and young, who would prefera job with standard labor protections, but are unable to get one "barriers" ; orworkers who have quit formal sector jobs to start a micro business to be theirown boss, make more money, and avoid paying social protection taxes; andwomen leaving formal salaried jobs for the �exibility of balancing home andincome-raising responsibilities "choice".According to the de�nition used by International Labour Organization (ILO)
informal labor can broadly be broken into two subsectors: informal salaried andindependent work, and formal sector is composed by salaried workers1 . Formalsalaried urban employment by this de�nition ranges from nearly 20 percent inBolivia, Paraguay, and Perú, to roughly 60 percent in Chile reaching almost40 percent for the region overall. Salaried informal work, including unpaid anddomestic workers (mostly women) comprises roughly 33 percent of urban em-ployment in the region, ranging from 17 percent in Chile to over 45 percent inEcuador, Nicaragua Paraguay, and Perú. Informal independent (self-employed)workers, comprising single-person �rms or owners employing other workers, rep-resent roughly 24 percent of the regional urban workforce, ranging from 18 per-cent in Chile to over 35 percent in Bolivia, Colombia, the Dominican Republic,Perú, and the República Bolivariana de Venezuela. Clearly, the relative pro-portions depend on conventions for allocating workers� for instance, the ILOcategorizes domestic workers as independent� or whether unpaid workers arecounted as �salaried.�Recently the World bank carried out surveys specialized on informality un-
fortunately are not yet publicly available. The surveys included,among otherthings, questions on the motivations or reasons for workers to be salaried orself-employed and to participate or not in labor bene�ts programs World bank(2007).They found that except for Colombia, over 70 percent of independent workers
are voluntary, in the sense that they would rather be independent if they wereable to choose their job. In Colombia, by a di¤erent measure, only 41 percent ofurban independent workers can be considered voluntary; they reportedly would
1Given the available information in the household surveys, we use this de�nition thouroughtthe paper.
4
not take a formal salaried job with earnings equal to the earnings in their currentjob. When asked if they would take the same formal job but with lower earn-ings (a stricter standard), 71 percent of the Colombian informal self-employedsaid they would not. These �ndings are also remarkably in line with those forMexico and Brazil based on very di¤erent surveys, as well as the �ndings ofthe sociological literature. For instance, more than two thirds of the Brazilianinformal self-employed in the early 1990s reported that they would not takea formal salaried job, and less than 20 percent in Mexico reported involuntaryreasons .19 Moreover, over half of salaried workers in Bolivia and the DominicanRepublic and close to one third in Argentina and Colombia have intrinsic pref-erences for independent work, consistent with Blanch�ower and Oswald�s (1998)�ndings for the United Kingdom, the United States, and Germany. The infor-mal salaried show somewhat stronger preferences for independent work than theformal salaried, especially in Bolivia.In contrast to the self-employed, the majority of informal salaried workers
appear to be involuntarily in their jobs, although not necessarily queuing forformal salaried employment. The inability to �nd a better job constitutes amuch higher fraction of the reported reasons for being in informal salaried jobsthan for the formal salaried: 48.4 versus 22.4 percent in Argentina; 64 versus 32percent in Bolivia; 43 versus 16 percent in Colombia; and 40 versus 22 percent inthe Dominican Republic. These are consistent with responses from the Brazilianinformal salaried in 1990 that roughly 70 percent would rather have had a formalsalaried job.On the other hand several studies tried to analyze the indigenous unex-
plained wage gap topic, among the most complete and recent ones is the bookpresented by Patrinos and Hall (2005) where they analyze indigenous charac-teristics, and unexplained wage gap among them. They do an outset of 1990s inUrban Bolivia, Guatemala, Mexico and Perú, the authors �nd that unexplainedwage gap (48-52%) and human capital explain earningsIndigenous peoples� visibility in Latin American society and politics ex-
panded during the 1990s, forcing the wider population to reexamine its atti-tudes towards indigenous peoples. That presence is being felt, �rst and fore-most, via increased political participation. While across the region indigenouspolitical representation has historically been minimal, substantial increases haveoccurred recently, with the most notable increases occurring after 1990. Indige-nous populations vary from .4 percent of the total population in Brazil to asmuch as 62 percent of the total population in Bolivia. According to the WorldDevelopment Indicators (2003), an estimate of 27.5 million can reasonably betaken as the lower-bound estimate for Latin America�s indigenous population.There are three basic ways to de�ne indigenous peoples: self-identi�cation,
language use and geographic location. The need to operationalize a de�nition forresearch purposes notwithstanding, we accept at the outset the right of peopleeverywhere to self-identify themselves as they wish (see, for example, Interna-tional Labour Organisation�s 1991 Convention No. 169 concerning indigenousand tribal peoples in independent countries (ILO 1991).Among Latin American countries, Bolivia, Guatemala, Perú and Ecuador
5
have a very complex and unusual multi-ethnic dimension; on the other handcountries such as Brazil, do not have a high indigenous population but have agreat black population, therefore I include this group in the analysis.Even informality and indigenous unexplained wage gaps are two important
problems for Latin America societies and economies, the combination of bothhas not been studied in any article known by this author. This paper pretends to�ll this hole in the literature addressing the extend, determinants of wage gapsin six Latin American countries. The importance of this topic has relevance notonly on academic arena but also on policy �eld.
3 Data and Methodology
The data used are household surveys from the respective countries, which hada process of homogenization of the main variables in order to make them themost comparable possible, for this reason the year 2001 was selected in mostof the countries except for Ecuador where year 2003 was selected. Given thecharacteristics of the labor markets in Latinamerica some considerations haveto be taken into account. The sample used from each survey are workers from�fteen to sixty �ve years in urban areas. This criteria is used due the de�nitionof informality to be used.The de�nition of informality used follows the standards of the ILO. I classify
as formal workers to those that work in �rms with �ve or more employeesand receive salaries, and self employed that make payments to social security.2 .The informal sector includes workers that are self employed but do not makepayments to social security, and workers that are in �rms with less than �veemployees. This de�nition is considered the standard given the availability ofdata.The de�nition of indigenous depends on the availability of data on the house-
hold surveys. For this reason one of the following two de�nitions of indigenouswill be used when available. The �rst is related to the language that the personlearned to speak when she/he was a child, the logic of this de�nition lies in thefact that if a person learns an indigenous language when is a child there is ahigh probability that this person belongs to the indigenous population. Thesecond de�nition is based on self identi�cation of the person which gives anapproximation of the indigenous condition.The main variable to decompose wage di¤erentials labor income per working
hour, this variable was constructed using available data in the household surveys;it includes wages and salaries, extra hours payments, and in kind payments.Given that a big part of the informal workers are self-employed I include themin the sample and estimate their incomes based on the reported incomes. Thisinformation is available for all the household surveys named above. On theother side, the independent variables that are used to analyze the extend ofunexplained wage gap are schooling, experience, experience-squared, marrieddummy, health dummy, migration, household members and sex.
2Note that in this group could exist white and blue collar workers.
6
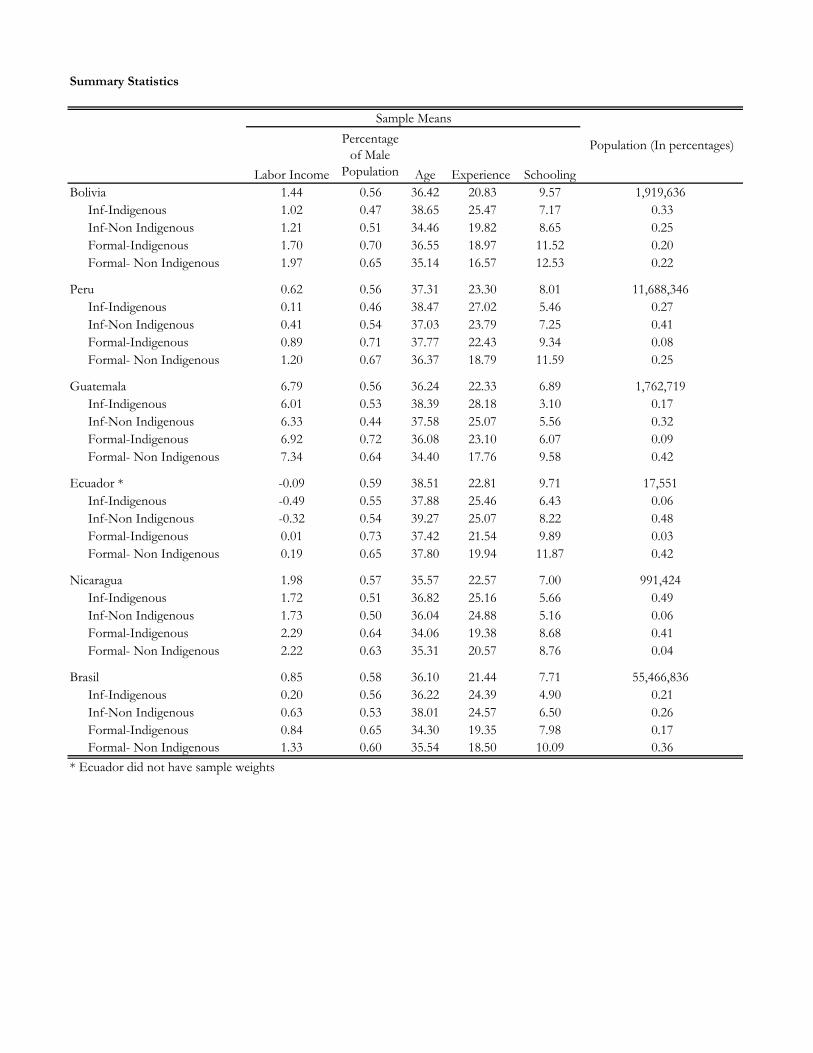
In order to set some stylized facts, next I present a summary table obtainedfrom the household surveys. This table divides workers between informal indige-nous, informal non indigenous, formal indigenous and formal non indigenous.The results di¤er slightly from the ones reported by national statistical o¢ ces,but the di¤erence are not more than three percentAs can be seen in Table 1, the percentage of male population is higher in
formal compared to informal sector in all the cases, this shows the presencein gender unexplained wage gap that exist in Latin American countries, thisdi¤erence is higher in countries like Bolivia, Peru and Guatemala; I do not �ndsigni�cant di¤erences when comparing the indigenous condition as a whole whichcould be a sign that in terms of gender the indigenous condition. Regarding theage of the workers, this variable does not re�ect signi�cant di¤erences betweenthe four groups, the mean ranges from 35 in Nicaragua to 38 in Ecuador, exceptfor Bolivia the lowest average is in the formal sector.Perhaps two of the most interesting variables and their relation with infor-
mality are experience and schooling, while experience is higher in the informalsectors, schooling shows he opposite direction, it lower in informal sectors. Thiscould be a sign of the screening process that goes on in formal and informalsectors, the skills required in each sector.
7
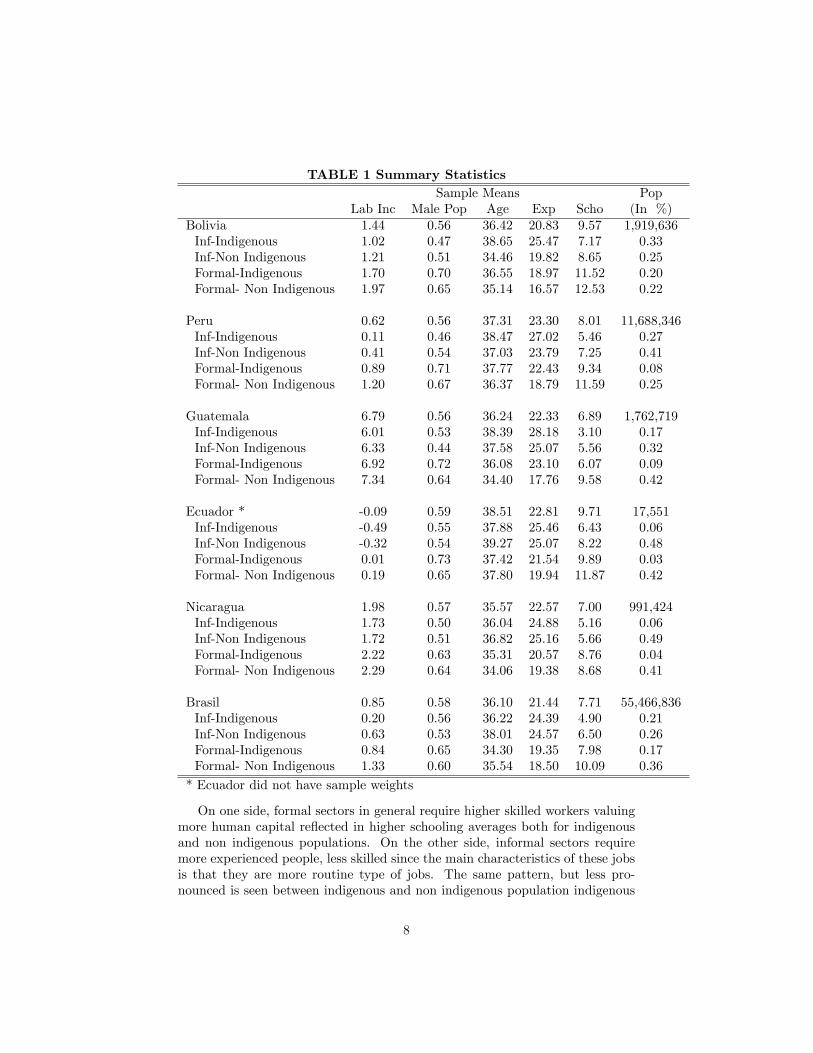
TABLE 1 Summary StatisticsSample Means Pop
Lab Inc Male Pop Age Exp Scho (In %)Bolivia 1.44 0.56 36.42 20.83 9.57 1,919,636Inf-Indigenous 1.02 0.47 38.65 25.47 7.17 0.33Inf-Non Indigenous 1.21 0.51 34.46 19.82 8.65 0.25Formal-Indigenous 1.70 0.70 36.55 18.97 11.52 0.20Formal- Non Indigenous 1.97 0.65 35.14 16.57 12.53 0.22
Peru 0.62 0.56 37.31 23.30 8.01 11,688,346Inf-Indigenous 0.11 0.46 38.47 27.02 5.46 0.27Inf-Non Indigenous 0.41 0.54 37.03 23.79 7.25 0.41Formal-Indigenous 0.89 0.71 37.77 22.43 9.34 0.08Formal- Non Indigenous 1.20 0.67 36.37 18.79 11.59 0.25
Guatemala 6.79 0.56 36.24 22.33 6.89 1,762,719Inf-Indigenous 6.01 0.53 38.39 28.18 3.10 0.17Inf-Non Indigenous 6.33 0.44 37.58 25.07 5.56 0.32Formal-Indigenous 6.92 0.72 36.08 23.10 6.07 0.09Formal- Non Indigenous 7.34 0.64 34.40 17.76 9.58 0.42
Ecuador * -0.09 0.59 38.51 22.81 9.71 17,551Inf-Indigenous -0.49 0.55 37.88 25.46 6.43 0.06Inf-Non Indigenous -0.32 0.54 39.27 25.07 8.22 0.48Formal-Indigenous 0.01 0.73 37.42 21.54 9.89 0.03Formal- Non Indigenous 0.19 0.65 37.80 19.94 11.87 0.42
Nicaragua 1.98 0.57 35.57 22.57 7.00 991,424Inf-Indigenous 1.73 0.50 36.04 24.88 5.16 0.06Inf-Non Indigenous 1.72 0.51 36.82 25.16 5.66 0.49Formal-Indigenous 2.22 0.63 35.31 20.57 8.76 0.04Formal- Non Indigenous 2.29 0.64 34.06 19.38 8.68 0.41
Brasil 0.85 0.58 36.10 21.44 7.71 55,466,836Inf-Indigenous 0.20 0.56 36.22 24.39 4.90 0.21Inf-Non Indigenous 0.63 0.53 38.01 24.57 6.50 0.26Formal-Indigenous 0.84 0.65 34.30 19.35 7.98 0.17Formal- Non Indigenous 1.33 0.60 35.54 18.50 10.09 0.36
* Ecuador did not have sample weights
On one side, formal sectors in general require higher skilled workers valuingmore human capital re�ected in higher schooling averages both for indigenousand non indigenous populations. On the other side, informal sectors requiremore experienced people, less skilled since the main characteristics of these jobsis that they are more routine type of jobs. The same pattern, but less pro-nounced is seen between indigenous and non indigenous population indigenous
8
population tend to have more experience compared to the non indigenous butless years of schooling. These patter may re�ect the fact that given the higherlevels of poverty of indigenous population these would have lower reservationwages and therefore would insert in labor markets faster compared to non in-digenous who value higher increases in human capital.Informal workers represent a signi�cant part of the population in the selected
countries in all of them the percentage of informal workers is higher tan 50resembling the high degree of informality in Latin America3 . For example, inBolivia and Peru the informal sector is around 60% of the workers. The othervariable of interest, indigenous, shows that in countries such as Guatemala,Bolivia, Peru or Brasil4 the proportion of indigenous; in the case of Ecuadorand Nicaragua the number of indigenous population is far less this could bedue to two reasons. The sampling of the surveys do not try to capture thecharacteristics of indigenous, and since most of the indigenous are in rural areasthe probability that the household survey captures the existence of indigenousis low; but it should be noted that the results are according to the informationprovided by the national statistical o¢ ces, and the reason to �nd few indigenousis that indigenous people do not report their correct conditions this could leadto underestimate the wage gaps for this two countries.The heterogeneity in the prototype informal and indigenous workers is re-
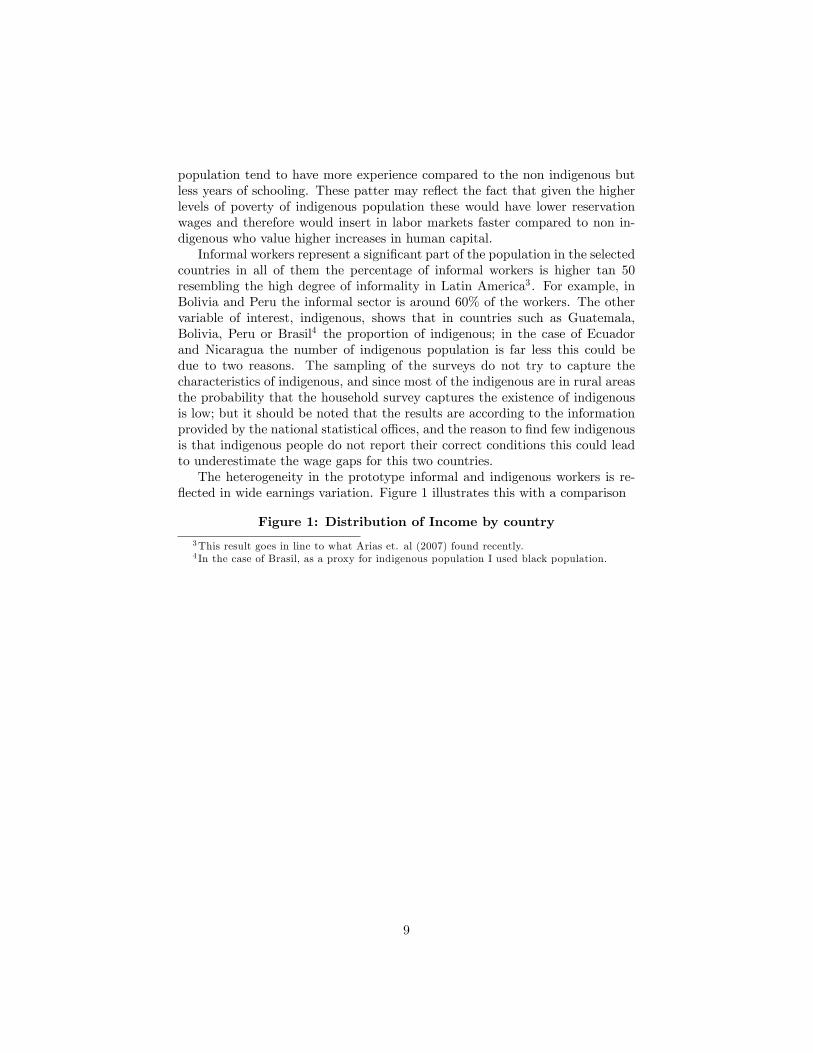
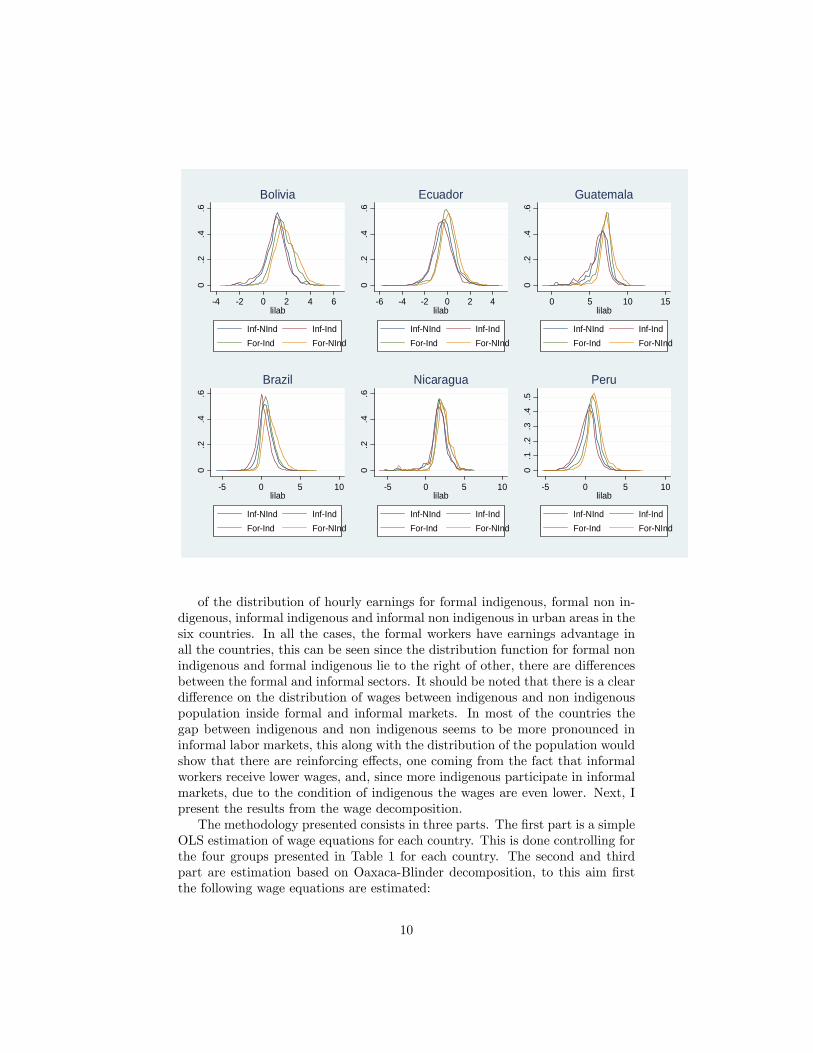
�ected in wide earnings variation. Figure 1 illustrates this with a comparison
Figure 1: Distribution of Income by country3This result goes in line to what Arias et. al (2007) found recently.4 In the case of Brasil, as a proxy for indigenous population I used black population.
9
0.2
.4.6
4 2 0 2 4 6lilab
InfNInd InfIndForInd ForNInd
Bolivia
0.2
.4.6
6 4 2 0 2 4lilab
InfNInd InfIndForInd ForNInd
Ecuador
0.2
.4.6
0 5 10 15lilab
InfNInd InfIndForInd ForNInd
Guatemala0
.2.4
.6
5 0 5 10lilab
InfNInd InfIndForInd ForNInd
Brazil0
.2.4
.6
5 0 5 10lilab
InfNInd InfIndForInd ForNInd
Nicaragua
0.1
.2.3
.4.5
5 0 5 10lilab
InfNInd InfIndForInd ForNInd
Peru
of the distribution of hourly earnings for formal indigenous, formal non in-digenous, informal indigenous and informal non indigenous in urban areas in thesix countries. In all the cases, the formal workers have earnings advantage inall the countries, this can be seen since the distribution function for formal nonindigenous and formal indigenous lie to the right of other, there are di¤erencesbetween the formal and informal sectors. It should be noted that there is a cleardi¤erence on the distribution of wages between indigenous and non indigenouspopulation inside formal and informal markets. In most of the countries thegap between indigenous and non indigenous seems to be more pronounced ininformal labor markets, this along with the distribution of the population wouldshow that there are reinforcing e¤ects, one coming from the fact that informalworkers receive lower wages, and, since more indigenous participate in informalmarkets, due to the condition of indigenous the wages are even lower. Next, Ipresent the results from the wage decomposition.The methodology presented consists in three parts. The �rst part is a simple
OLS estimation of wage equations for each country. This is done controlling forthe four groups presented in Table 1 for each country. The second and thirdpart are estimation based on Oaxaca-Blinder decomposition, to this aim �rstthe following wage equations are estimated:
10
lnWinf;i;j = �0j + 0jXinf;j + "ij
lnWfor;i;j = �1j + 1jXfor;j + "ij
Then, using a method akin to that developed by Oaxaca (1973), the di¤er-ence in average wage o¤ers can be further decomposed, giving
ln �Wfor;i;j � ln �Winf;i;j = ( �Xfor;j � �Xinf;;j)�D 1j + (1�D) 0j
�+�D �Xfor;j + (1�D) �Xinf;;j
� � 1j � 0j
�where D is a diagonal matrix of weights Note that ln �Wfor;i;j � ln �Winf;i;j ���Wfor;i;j � �Winf or;i;j
�and this decomposition will divide the percentage di¤er-
ence between the geometric means of the observed wage rates for the two groupsinto two parts: the �rst due to di¤erences in average characteristics of thegroups, including di¤erences in local price levels where members of the groupslive; and the second due to di¤erences in the parameters of the wage function,caused by labor market discrimination and other omitted factors. In general, wewill get di¤erent measures of the impact of unexplained wage gap, depending onthe choice of weights in the matrix D. This choice amounts to an assumptionabout what the wage function would be in the absence of discrimination (orunexplained wage gap) since employers�preference for the majority and theirdistaste for the minority no doubt distort both groups�wages, neither group�sobserved wage-o¤er function would be likely to exist in a non-discriminatoryworld. Instead, the no-discrimination wage function lies somewhere between 0and 1. Rimers (1983) for example uses a 0.5 as the midpoint other authors usethe proportion of each group. I use the proportion for each group as weightsin each decomposition. I also tested for di¤erent weights and even the resultsdi¤er when using the extreme cases (0 or 1) according to the existing literatureis more appropriate to use the proportions as weights.
4 Results
Following the methodology described previously I estimate the Oaxaca-Blinderdecomposition with weights. Initially I estimate the following wage equation5 in order de �nd the extend to which each group (employment sector andindigenous) a¤ect wages.
Wi;j = �j + �0jXij + �
1jD1j + �
2jD2j + �
3jD3j + "ij
where Wi;j are hourly earnings for worker i in country j ; Xij are the con-
5 It should be noted that this estimation and the wage decomposition were estimated withand without sampling weights in the surveys, but the results do not change substantially.Therefore the results using weights are presented.
11
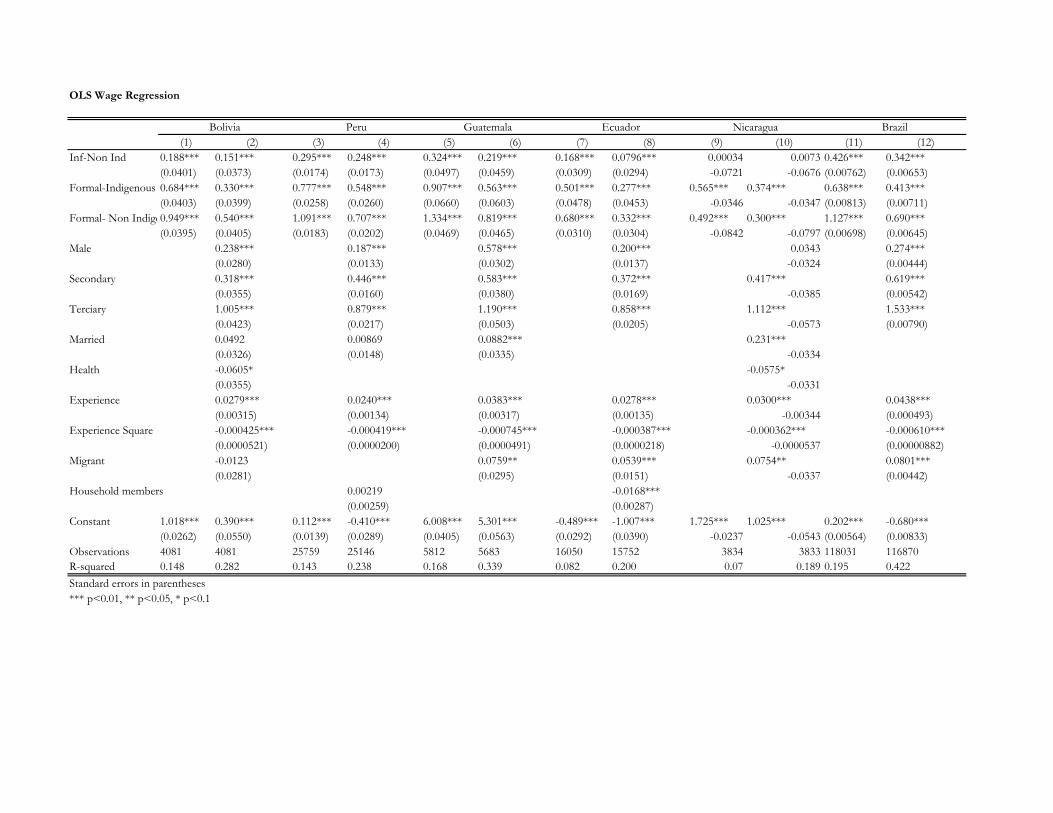
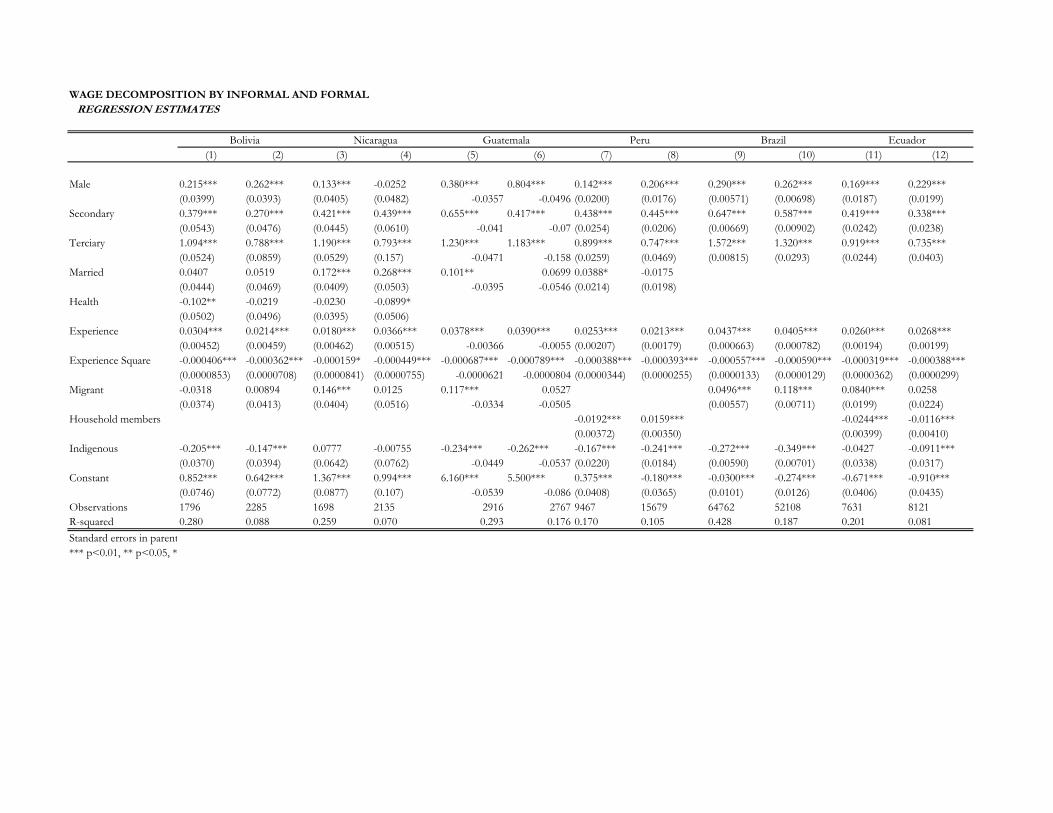
trol variables such as male, that is expected to be positive since males tend toearn higher wages in formal and informal sectors, secondary and tertiary edu-cation which is expected to be positive, assuming the theory of human capitalmore educated people would receive higher wages compared to those with lowereducation; married that is could be positive or negative and would depend onthe externalities that couples create; a dummy of health that takes the valueof 1 if the person has been sick in the period of reference6 , the coe¢ cient forthis dummy is expected to be positive since bad health would have bad e¤ectson productivity and therefore reduce wages; experience is expected to be posi-tive at a decreasing rate (experience square negative) according to the evidencefound in the exiting literature7 ; migrants variable are also included and �nallya variable for the number of household members is also included. The variablesDij are dummies for informal non indigenous, formal indigenous and formal nonindigenous. (Results are in the appendix, table 2)The results of the regression are presented in the appendix. These wage
equations are estimated for each country, �rst omitting all the controls andlater including the controls; as can be seen in the table the inclusion of thecontrols reduce the e¤ect of the dummies but these remain highly signi�cant.The controls behave as expected, being education variables the most importantexplaining wage in all the countries and married positive resembling positiveexternalities from being married. The dummies for the groups of employmentsector and indigenous all present positive e¤ects. The regression show that thereis a higher premium for formal non indigenous, and signi�cant di¤erences forindigenous and non indigenous inside each employment sector (i.e. for Boliviathe wage gap inside informal is 0.15 while in formal sector 0.21; while in Peruis 0.24 and 0.16 respectively). The premium for non indigenous are higher forcountries that have more indigenous population like Bolivia, Guatemala andBrasil and smaller for the other three countries.In order to corroborate, get more robust estimates and decompose the wage
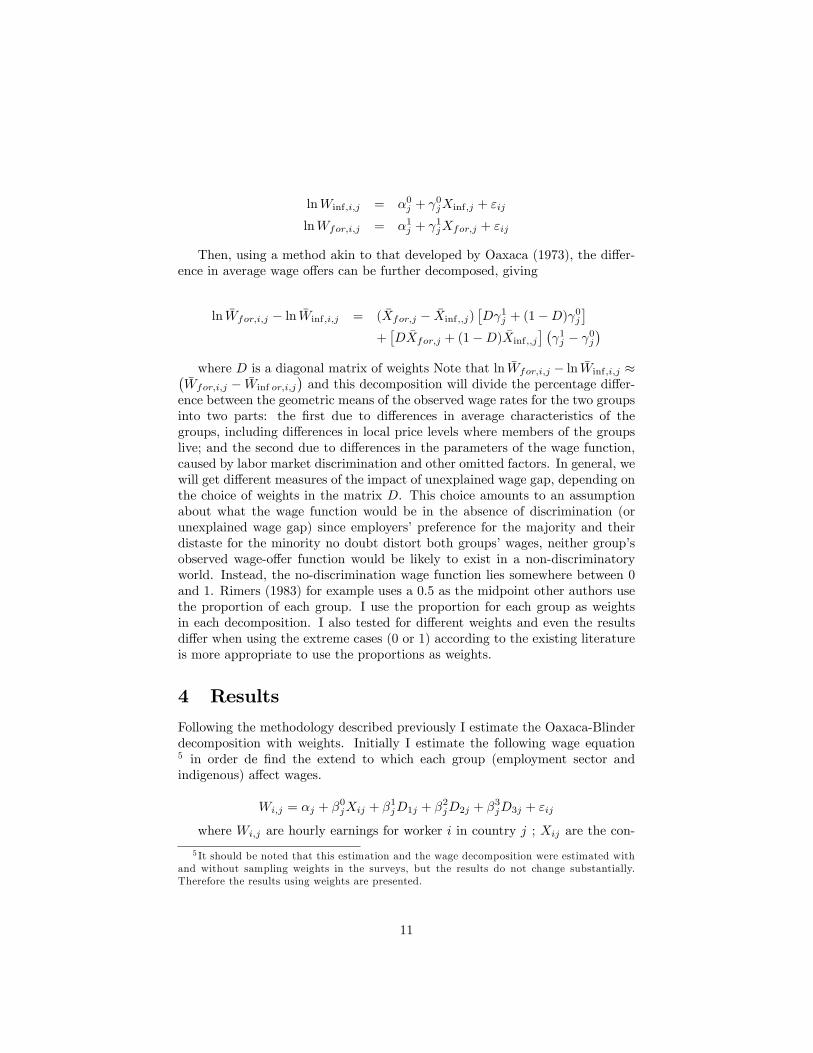
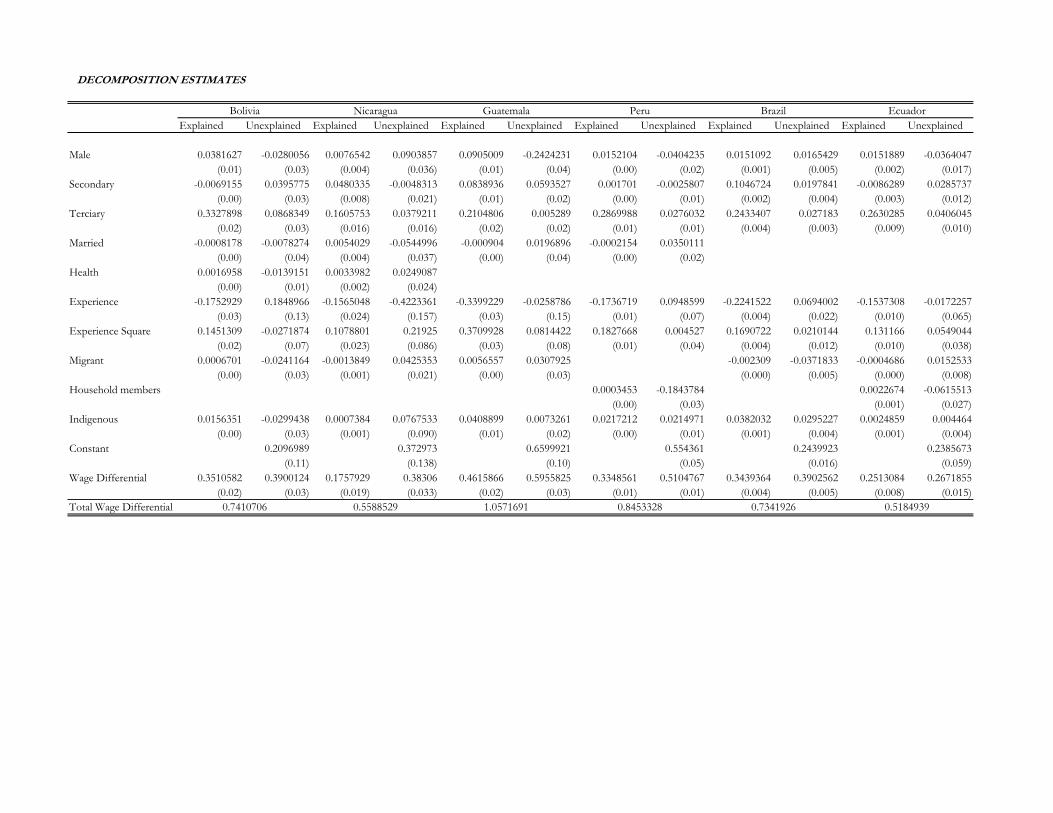
gap (between unexplained8 and explained portions) of the e¤ect of employmentsector and indigenous condition we perform next three Oaxaca-Blinder decom-positions. First I present the decomposition by employment sector with theusual control variables and the inclusion of a dummy variable for indigenouspopulation. The second and third decomposition are by indigenous conditionfor formal and informal labor markets9 . Figure 2 presents the main results forthe wage gap between informal and formal and the actual decomposition, clearlythe wage gap is bigger in Guatemala, Peru, Bolivia and Brazil. The decompo-sition show that the unexplained gap is bigger than the explained gap in all thecases. From the results shown in the appendix can be seen that in the �rst stageregressions there is a bigger impact of education on the wage functions, espe-cially in the formal sector, moreover, the e¤ect of tertiary education is higher for
6The period of reference in the surveys is last 3 months.7Mroz (1987) proves this e¤ect in wage equation with di¤erent especi�cations.8The unexplained gap is usually attributed as the discrimination part of the wage gap.9Again, due to space here we present the main results but the complete decomposition are
presented in the appendix.
12
all the countries. This is in line of what Arias et. al. (2007) found for Boliviaand Argentina. This result is quite intuitive since one would expect that mar-ket signalizing works better in a formally constituted environment, moreoverthis corresponds to the initial estimations. All the other variables behave asexpected, interestingly the migrant variable is positive when is signi�cant andnegative when its not signi�cant, this shows that migrants increase their wagescompared to non migrants. The indigenous dummy included has a signi�cante¤ect and negative e¤ect on the wages for both formal and informal sectorsmeaning that indigenous receive generally lower wages in both sectors.
Figure 2. Wage decomposition for informal and formal sector bycountry
0.2
.4.6
.81
Bolivia Brazil EcuadorGuatemala Nicaragua Peru
mean of total mean of explainedmean of unexplained
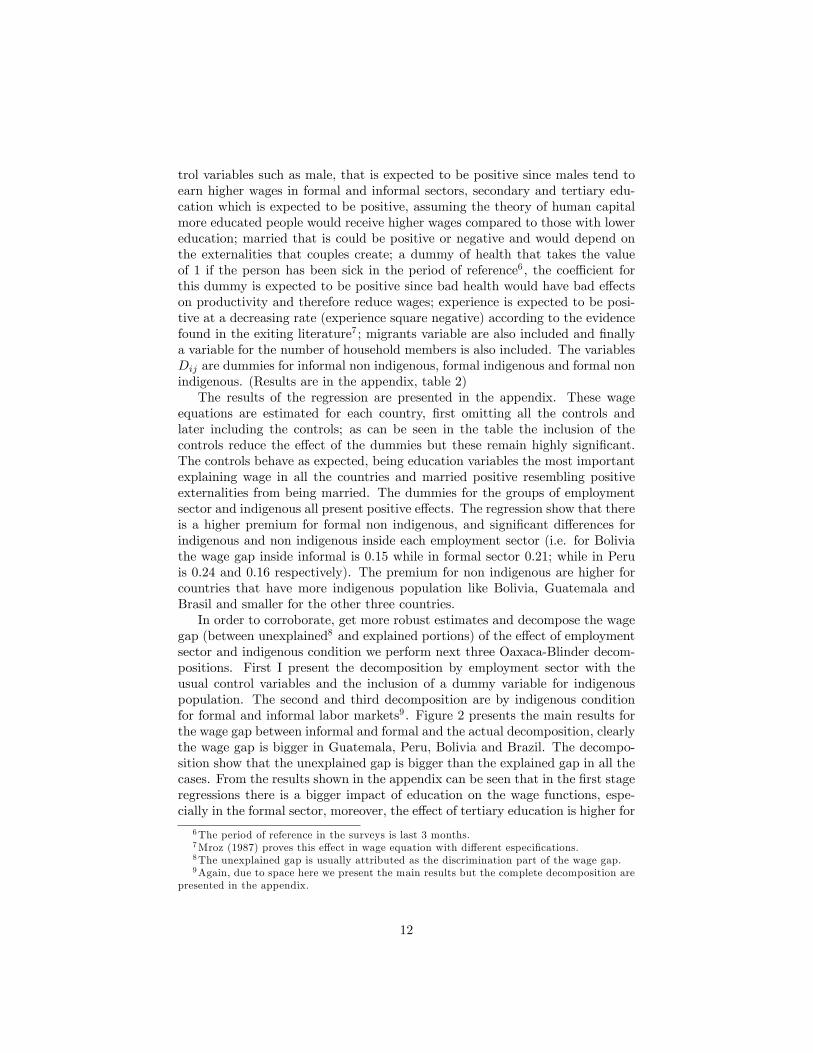
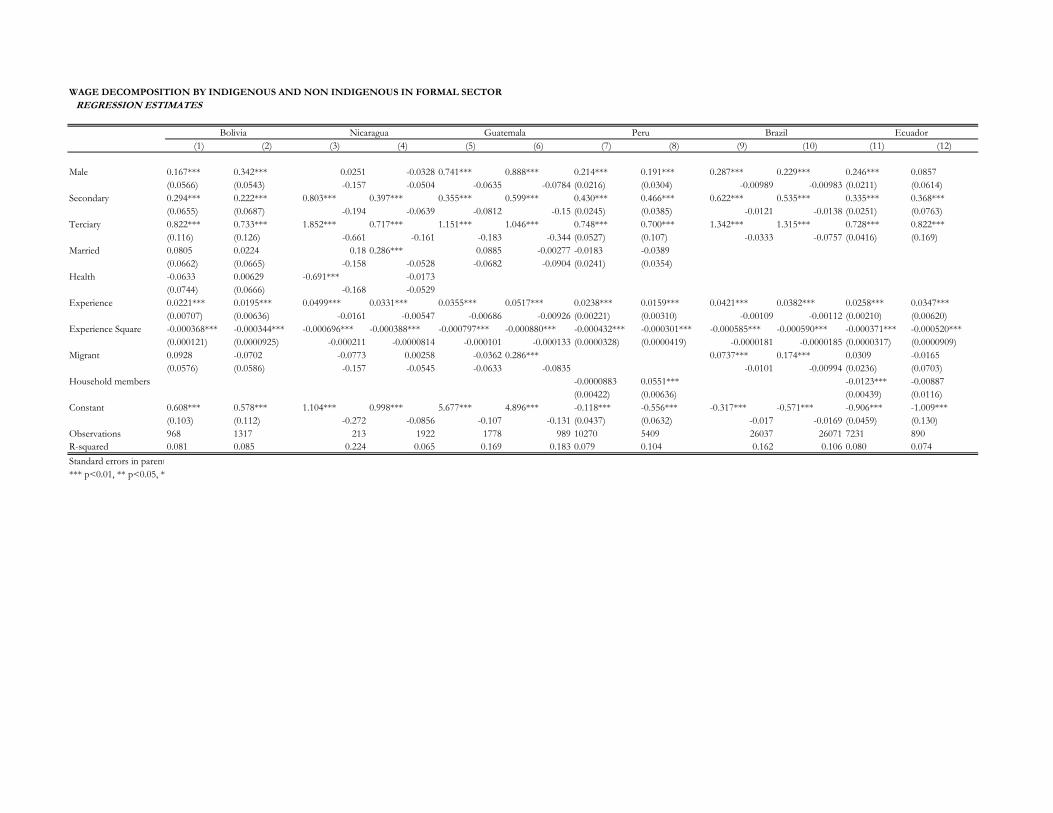
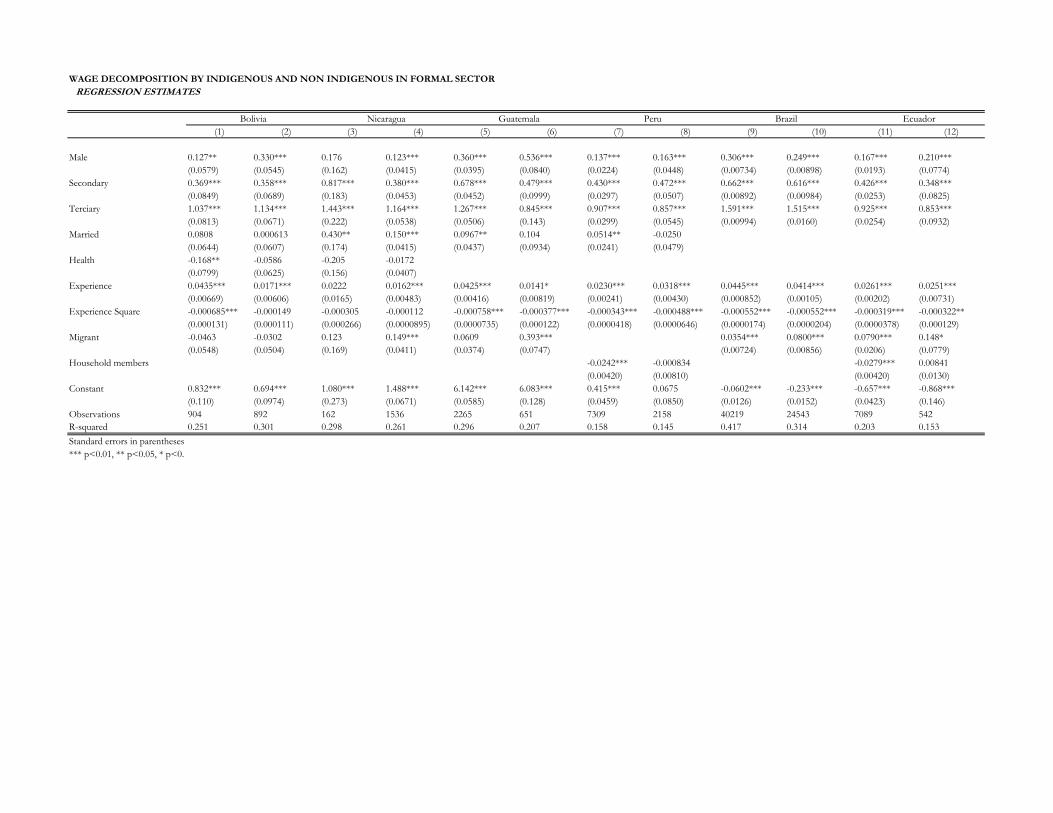
Next, I present results for the wage gap decomposition by indigenous and nonindigenous population for formal and informal employment sectors First stageregressions show that in general there is a bigger impact of education on wagefunctions, moreover is interesting to �nd out that the returns of having tertiaryeducation are higher in formal markets, this result is quite intuitive since onewould expect that market signalizing works better in a formally and constitutedenvironment. When one compares the indigenous and non indigenous there isno homogeneous e¤ect of the education Sex of the individual (de�ned as 1 ifthe person is male) shows a positive relation with incomes in all the groups10
as was expected and goes in accordance to most of the existing literature, theimpact ranges from 0.1 to 0.6. Even this range is quite big it was also found inthe existing literature11 .The results show that there the range of the income di¤erential between
indigenous and non indigenous is quite big (-0.07 to 0.46). Except for Bolivia,unexplained wage gap is higher in formal markets than in informal markets as
10Except for Nicaragua, non indigenous informal where its positive but insigni�cant.11For an extensive analysis please refer to Patrinos and Hall (2005).
13
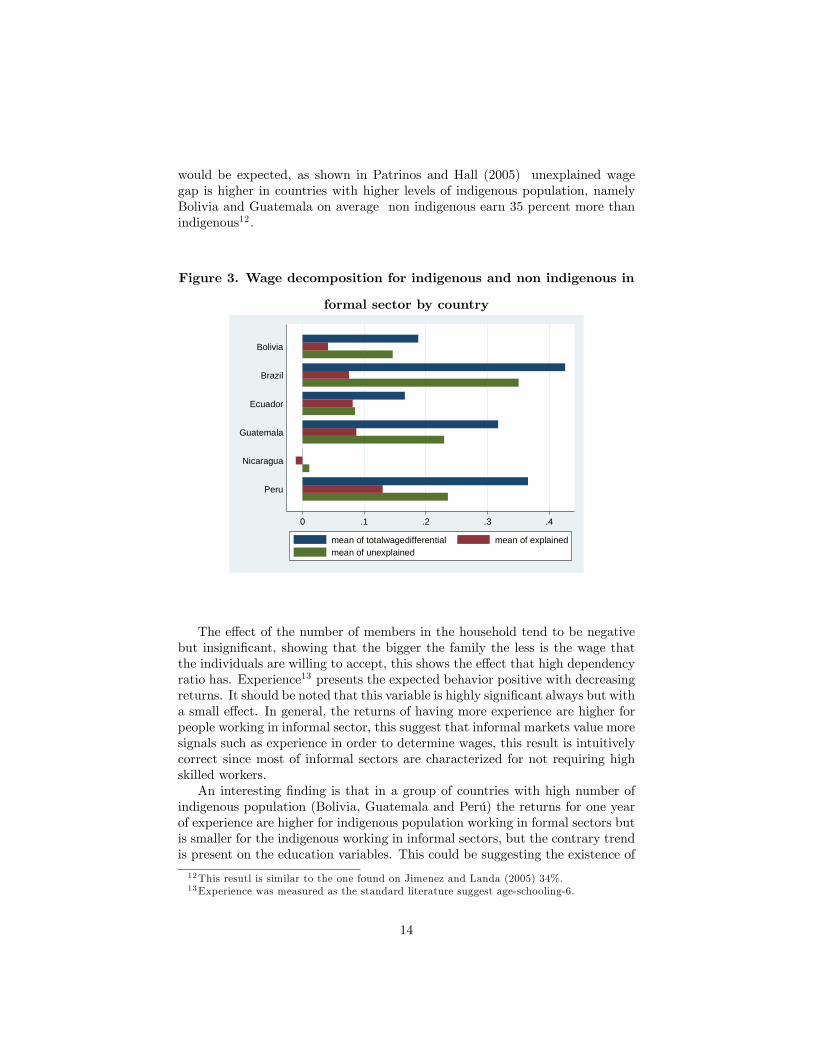
would be expected, as shown in Patrinos and Hall (2005) unexplained wagegap is higher in countries with higher levels of indigenous population, namelyBolivia and Guatemala on average non indigenous earn 35 percent more thanindigenous12 .
Figure 3. Wage decomposition for indigenous and non indigenous in
formal sector by country
0 .1 .2 .3 .4
Peru
Nicaragua
Guatemala
Ecuador
Brazil
Bolivia
mean of totalwagedifferential mean of explainedmean of unexplained
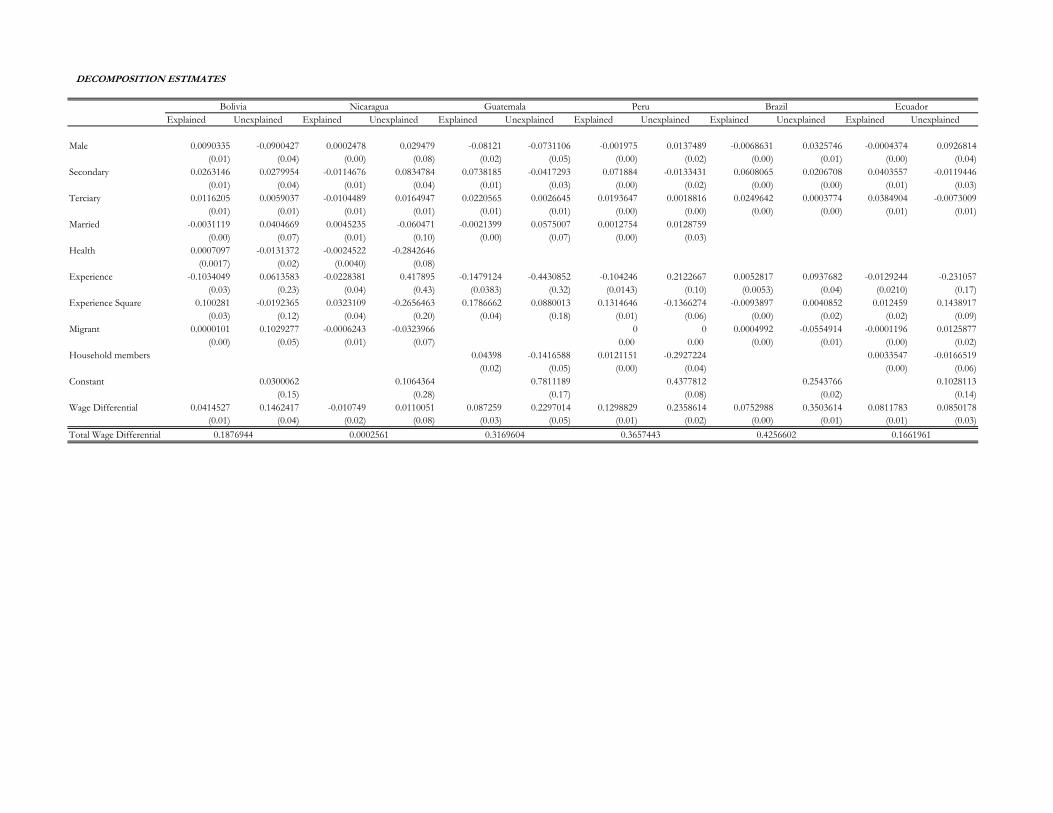
The e¤ect of the number of members in the household tend to be negativebut insigni�cant, showing that the bigger the family the less is the wage thatthe individuals are willing to accept, this shows the e¤ect that high dependencyratio has. Experience13 presents the expected behavior positive with decreasingreturns. It should be noted that this variable is highly signi�cant always but witha small e¤ect. In general, the returns of having more experience are higher forpeople working in informal sector, this suggest that informal markets value moresignals such as experience in order to determine wages, this result is intuitivelycorrect since most of informal sectors are characterized for not requiring highskilled workers.An interesting �nding is that in a group of countries with high number of
indigenous population (Bolivia, Guatemala and Perú) the returns for one yearof experience are higher for indigenous population working in formal sectors butis smaller for the indigenous working in informal sectors, but the contrary trendis present on the education variables. This could be suggesting the existence of
12This resutl is similar to the one found on Jimenez and Landa (2005) 34%.13Experience was measured as the standard literature suggest age-schooling-6.
14
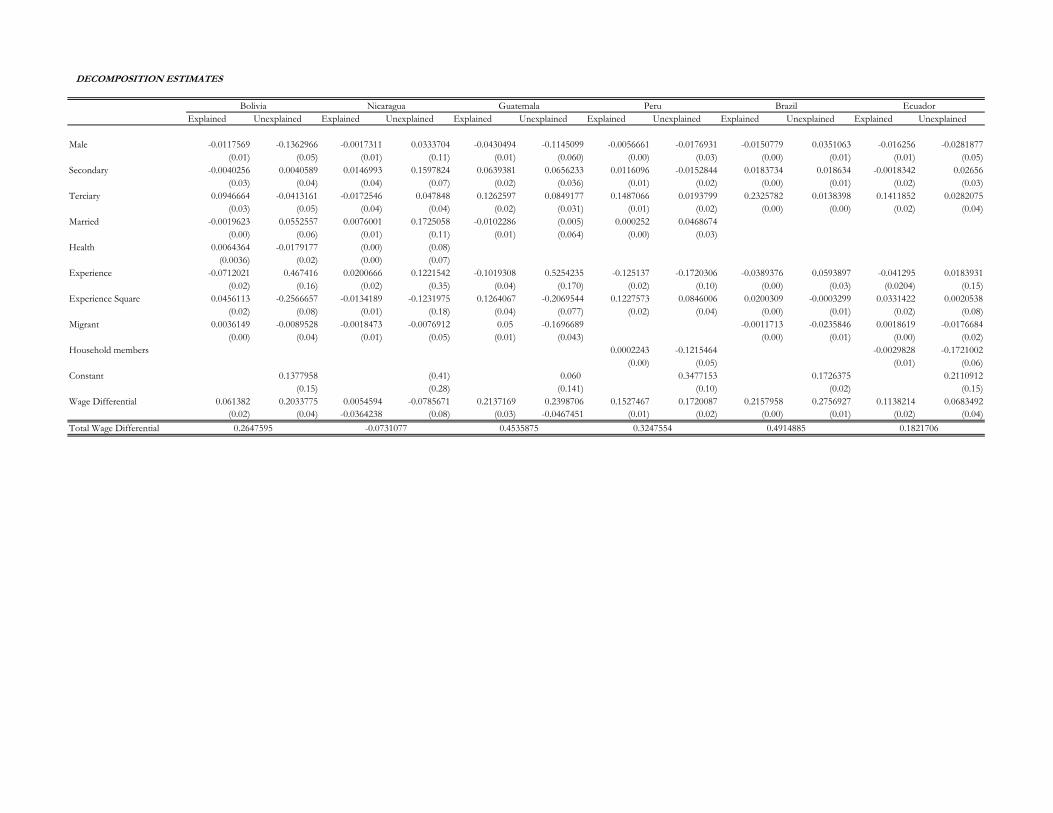
unexplained wage gap in both directions since formal markets are more popu-lated by non indigenous population and therefore value more the experience inindigenous population over the education.This result is very di¤erent when comparing the income di¤erential inside
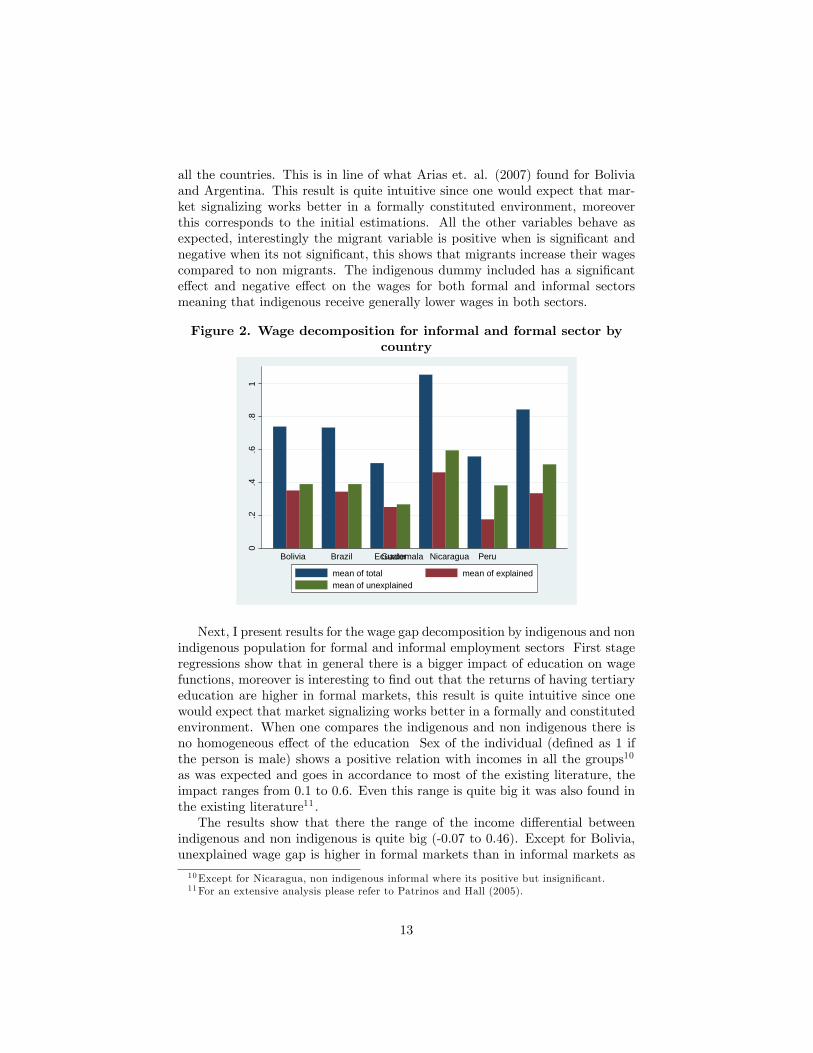
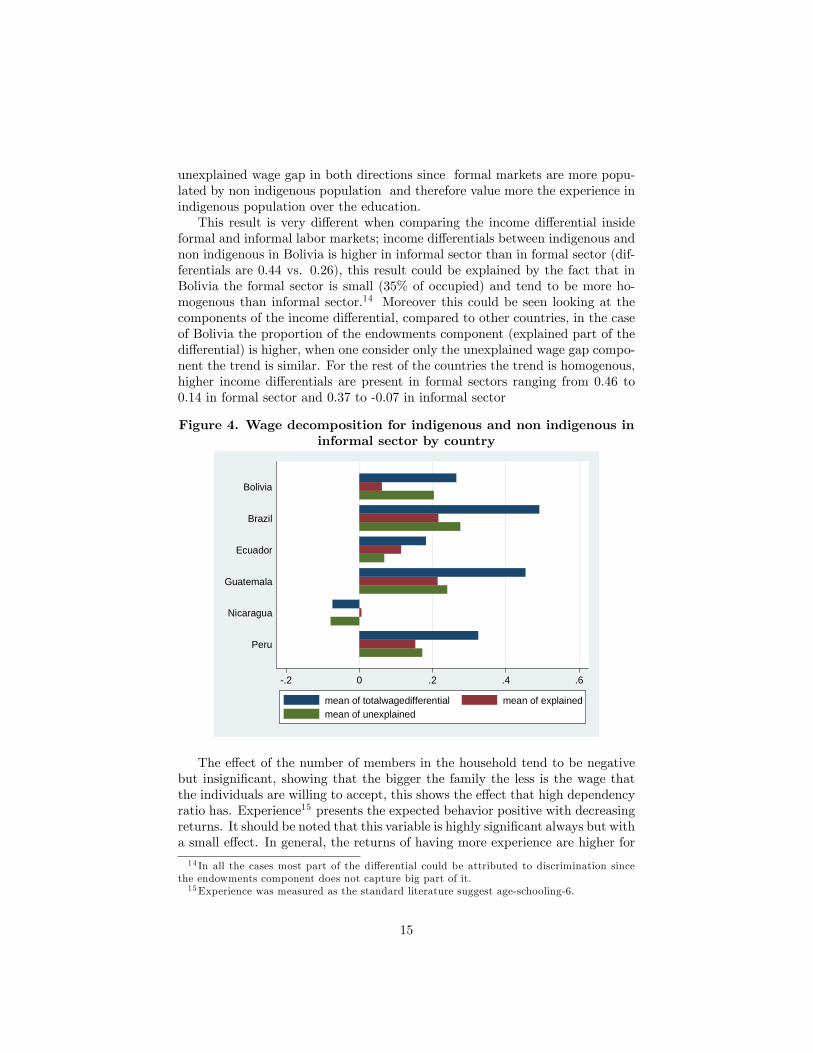
formal and informal labor markets; income di¤erentials between indigenous andnon indigenous in Bolivia is higher in informal sector than in formal sector (dif-ferentials are 0.44 vs. 0.26), this result could be explained by the fact that inBolivia the formal sector is small (35% of occupied) and tend to be more ho-mogenous than informal sector.14 Moreover this could be seen looking at thecomponents of the income di¤erential, compared to other countries, in the caseof Bolivia the proportion of the endowments component (explained part of thedi¤erential) is higher, when one consider only the unexplained wage gap compo-nent the trend is similar. For the rest of the countries the trend is homogenous,higher income di¤erentials are present in formal sectors ranging from 0.46 to0.14 in formal sector and 0.37 to -0.07 in informal sector
Figure 4. Wage decomposition for indigenous and non indigenous ininformal sector by country
.2 0 .2 .4 .6
Peru
Nicaragua
Guatemala
Ecuador
Brazil
Bolivia
mean of totalwagedifferential mean of explainedmean of unexplained
The e¤ect of the number of members in the household tend to be negativebut insigni�cant, showing that the bigger the family the less is the wage thatthe individuals are willing to accept, this shows the e¤ect that high dependencyratio has. Experience15 presents the expected behavior positive with decreasingreturns. It should be noted that this variable is highly signi�cant always but witha small e¤ect. In general, the returns of having more experience are higher for
14 In all the cases most part of the di¤erential could be attributed to discrimination sincethe endowments component does not capture big part of it.15Experience was measured as the standard literature suggest age-schooling-6.
15
people working in informal sector, this suggest that informal markets value moresignals such as experience in order to determine wages, this result is intuitivelycorrect since most of informal sectors are characterized for not requiring highskilled workers.An interesting �nding is that in a group of countries with high number of
indigenous population (Bolivia, Guatemala and Perú) the returns for one yearof experience are higher for indigenous population working in formal sectors butis smaller for the indigenous working in informal sectors, but the contrary trendis present on the education variables. This could be suggesting the existence ofunexplained wage gap in both directions since formal markets are more popu-lated by non indigenous population and therefore value more the experience inindigenous population over the education.This result is very di¤erent when comparing the income di¤erential inside
formal and informal labor markets; income di¤erentials between indigenous andnon indigenous in Bolivia is higher in informal sector than in formal sector (dif-ferentials are 0.44 vs. 0.26), this result could be explained by the fact that inBolivia the formal sector is small (35% of occupied) and tend to be more ho-mogenous than informal sector.16 Moreover this could be seen looking at thecomponents of the income di¤erential, compared to other countries, in the caseof Bolivia the proportion of the endowments component (explained part of thedi¤erential) is higher, when one consider only the unexplained wage gap compo-nent the trend is similar. For the rest of the countries the trend is homogenous,higher income di¤erentials are present in formal sectors ranging from 0.46 to0.14 in formal sector and 0.37 to -0.07 in informal sector
5 Conclusions and future research
Over the past 30 years a lot of research has been focused on indigenous pop-ulation, and more recently a lot of attention has been paid to informality inLatin America. Unfortunately these two topics have been covered as two com-pletely di¤erent topics even if its widely recognized that there exist close relationbetween them This paper present an initial approach to study indigenous un-explained wage gap inside formal and informal labor markets in Latin Americausing household surveys for six Latin American countries, namely the most in-digenously populated countries. To this aim Oaxaca Ramson decompositiontechniques have been applied.The results obtained from the decomposition show a di¤erential on income
between informal and formal markets, and between indigenous and non indige-nous as well. The unexplained wage gap of the wage di¤erential is higher oninformal than on formal markets in all the countries. An interesting case ofstudy is Bolivia where the income di¤erential between indigenous and non in-digenous population is higher in informal markets but the unexplained wage gapis higher in formal sector.
16 In all the cases most part of the di¤erential could be attributed to discrimination sincethe endowments component does not capture big part of it.
16
I found that countries with higher indigenous population have higher unex-plained wage gap in both sectors, compared to the rest of the countries. un-explained wage gap against indigenous in informal sector is higher in countrieswith higher indigenous population.The policy implications of the results come across to the elimination of un-
explained wage gap thought di¤erent policies that could be applied such ascontrols over contracts, penalties or law enforcement where the laws are alreadysettled.Future research can be done in this area, the next step is to re�ne the
estimations considering the potential endogeneity that the education variablemay have. After correcting this, counterfactual microsimulation techniques willbe applied in order to estimate the impact on poverty reduction of eliminatingthe unexplained wage gap component.
17
References
[1] Arias, Omar, and Monserrat Bustelo. (2007). �Pro�les and Dynamics of In-formal Employment in Latin America.�Photocopy. World Bank, Wash-ington, DC.
[2] Arias, Omar, Fernando Landa, and Patricia Yáñez. (2007). �MovilidadLaboral e Ingresos en el Sector Formal e Informal de Bolivia.�Docu-mento de Trabajo, UDAPE, La Paz, Bolivia.
[3] Blinder, A.S. 1973. �Wage discrimination: Reduced form and StructuralEstimates.�Journal of Human Resources 8(4):436-65.
[4] Card, D., and A. Krueger. (1992). �School Quality and Black-White Rela-tive Earnings: a Direct Assessment.�Quarterly Journal of Economics.107(1). 151-200.
[5] Funkhouser, Edward (1996), �The Urban Informal Sector in Central Amer-ica: Household Survey Evidence�, World Development, Vol.24, No.11,1737-1751.
[6] Gindling, T. H. 1991. �Labor Market Segmentation and the Determinationof Wages in the Public, Private-Formal, and Informal Sectors in SanJosé, Costa Rica�. Economic Development and Cultural Change. Abril,Vol. 39 (3): 585-605.
[7] Gillette Hall and Harry Anthony Patrinos (2006) "Indigenous People,Poverty and Human Development in Latin America: 1994-2004" World-bank
[8] Loayza, Norman (1996). �The Economics of the Informal Sector: A Sim-pleModel and Some Evidence from Latin America.�Carnegie-RochesterConference Series on Public Policy 45: 129�62.
[9] Loayza, Norman., and J. Rigolini. (2006). �InformalityTrends and Cycles.�Policy ResearchWorking Paper 4078,World Bank,Washington, DC.
[10] Marcouiller, D., Ruiz de Castilla, V. y C. Woodru¤ (1997): �Formal Mea-sures of the Informal Sector Wage Gap in Mexico, El Salvador y Perú�,Economic Development andCultural Change, Vol. 47, No 2, pp. 367-392.
[11] Oaxaca, R. L. and M. R. Ransom. 1989. �Overpaid Men and UnderpaidWomen: A Tale of the Gender Speci�c Wage E¤ects of Labor MarketDiscrimination.�Paper presented at the International Economic Asso-ciation World Congress, Athens, August 28-September 1, 1989.
[12] Oaxaca, R.L. and M.R. Ransom. 1994. �On discrimination and the decom-position of wage di¤erentials.�Journal of Econometrics 61: 5-21.
[13] Orlando, María Beatriz (2000) �El Sector Informal en Venezuela.¿Plataforma o barrera para la reducción de la pobreza?�Proyecto Po-breza, No.15, Universidad Católica Andrés Bello, Caracas.
18
[14] Psacharopoulos, G. and H.A. Patrinos. 1994. Indigenous People andPoverty in Latin America: An Empirical Analysis. Washington, DC.The World Bank.
[15] Saavedra and A. Chong (1999) �Structural Reform, institutions and earn-ings: Evidence from the formal and informal sectors in urban Perú�,The Journal of Developments Studies, Vol.35, N.4, 95-116
[16] Stiglitz, Joseph. (2000). �Formal and Informal Institutions.�In Social Cap-ital: A Multifaceted Perspective, ed. P. Dasgupta and I. Serageldin.Washington, DC: World Bank.
[17] Tannen, Michael B. (1991) �Labor Markets in North East Brazil: Doesthe Dual MarketModel Apply?�, Economic Development and CulturalChange, Vol.39, No.3, 567-584.
[18] Yamada, Gustavo (1996). �Urban Informal Employment and Selfemploy-ment in Developing Countries: Theory and Evidence.�Economic De-velopment and Cultural Change 44 (2): 289�314
[19] Worldbank (2007). "Informality Exit and Exclusion " Washington DC.World Bank
19
Summary Statistics
Labor Income
Percentage of Male
Population Age Experience SchoolingBolivia 1.44 0.56 36.42 20.83 9.57 1,919,636
Inf-Indigenous 1.02 0.47 38.65 25.47 7.17 0.33Inf-Non Indigenous 1.21 0.51 34.46 19.82 8.65 0.25Formal-Indigenous 1.70 0.70 36.55 18.97 11.52 0.20Formal- Non Indigenous 1.97 0.65 35.14 16.57 12.53 0.22
Peru 0.62 0.56 37.31 23.30 8.01 11,688,346Inf-Indigenous 0.11 0.46 38.47 27.02 5.46 0.27Inf-Non Indigenous 0.41 0.54 37.03 23.79 7.25 0.41Formal-Indigenous 0.89 0.71 37.77 22.43 9.34 0.08Formal- Non Indigenous 1.20 0.67 36.37 18.79 11.59 0.25
Guatemala 6.79 0.56 36.24 22.33 6.89 1,762,719Inf-Indigenous 6.01 0.53 38.39 28.18 3.10 0.17Inf-Non Indigenous 6.33 0.44 37.58 25.07 5.56 0.32Formal-Indigenous 6.92 0.72 36.08 23.10 6.07 0.09Formal- Non Indigenous 7.34 0.64 34.40 17.76 9.58 0.42
Ecuador * -0.09 0.59 38.51 22.81 9.71 17,551Inf-Indigenous -0.49 0.55 37.88 25.46 6.43 0.06Inf-Non Indigenous -0.32 0.54 39.27 25.07 8.22 0.48Formal-Indigenous 0.01 0.73 37.42 21.54 9.89 0.03Formal- Non Indigenous 0.19 0.65 37.80 19.94 11.87 0.42
Nicaragua 1.98 0.57 35.57 22.57 7.00 991,424Inf-Indigenous 1.72 0.51 36.82 25.16 5.66 0.49Inf-Non Indigenous 1.73 0.50 36.04 24.88 5.16 0.06Formal-Indigenous 2.29 0.64 34.06 19.38 8.68 0.41Formal- Non Indigenous 2.22 0.63 35.31 20.57 8.76 0.04
Brasil 0.85 0.58 36.10 21.44 7.71 55,466,836Inf-Indigenous 0.20 0.56 36.22 24.39 4.90 0.21Inf-Non Indigenous 0.63 0.53 38.01 24.57 6.50 0.26Formal-Indigenous 0.84 0.65 34.30 19.35 7.98 0.17Formal- Non Indigenous 1.33 0.60 35.54 18.50 10.09 0.36
* Ecuador did not have sample weights
Sample Means
Population (In percentages)
OLS Wage Regression
(1) (2) (3) (4) (5) (6) (7) (8) (9) (10) (11) (12)Inf-Non Ind 0.188*** 0.151*** 0.295*** 0.248*** 0.324*** 0.219*** 0.168*** 0.0796*** 0.00034 0.0073 0.426*** 0.342***
(0.0401) (0.0373) (0.0174) (0.0173) (0.0497) (0.0459) (0.0309) (0.0294) -0.0721 -0.0676 (0.00762) (0.00653)Formal-Indigenous 0.684*** 0.330*** 0.777*** 0.548*** 0.907*** 0.563*** 0.501*** 0.277*** 0.565*** 0.374*** 0.638*** 0.413***
(0.0403) (0.0399) (0.0258) (0.0260) (0.0660) (0.0603) (0.0478) (0.0453) -0.0346 -0.0347 (0.00813) (0.00711)Formal- Non Indige0.949*** 0.540*** 1.091*** 0.707*** 1.334*** 0.819*** 0.680*** 0.332*** 0.492*** 0.300*** 1.127*** 0.690***
(0.0395) (0.0405) (0.0183) (0.0202) (0.0469) (0.0465) (0.0310) (0.0304) -0.0842 -0.0797 (0.00698) (0.00645)Male 0.238*** 0.187*** 0.578*** 0.200*** 0.0343 0.274***
(0.0280) (0.0133) (0.0302) (0.0137) -0.0324 (0.00444)Secondary 0.318*** 0.446*** 0.583*** 0.372*** 0.417*** 0.619***
(0.0355) (0.0160) (0.0380) (0.0169) -0.0385 (0.00542)Terciary 1.005*** 0.879*** 1.190*** 0.858*** 1.112*** 1.533***
(0.0423) (0.0217) (0.0503) (0.0205) -0.0573 (0.00790)Married 0.0492 0.00869 0.0882*** 0.231***
(0.0326) (0.0148) (0.0335) -0.0334Health -0.0605* -0.0575*
(0.0355) -0.0331Experience 0.0279*** 0.0240*** 0.0383*** 0.0278*** 0.0300*** 0.0438***
(0.00315) (0.00134) (0.00317) (0.00135) -0.00344 (0.000493)Experience Square -0.000425*** -0.000419*** -0.000745*** -0.000387*** -0.000362*** -0.000610***
(0.0000521) (0.0000200) (0.0000491) (0.0000218) -0.0000537 (0.00000882)Migrant -0.0123 0.0759** 0.0539*** 0.0754** 0.0801***
(0.0281) (0.0295) (0.0151) -0.0337 (0.00442)Household members 0.00219 -0.0168***
(0.00259) (0.00287)Constant 1.018*** 0.390*** 0.112*** -0.410*** 6.008*** 5.301*** -0.489*** -1.007*** 1.725*** 1.025*** 0.202*** -0.680***
(0.0262) (0.0550) (0.0139) (0.0289) (0.0405) (0.0563) (0.0292) (0.0390) -0.0237 -0.0543 (0.00564) (0.00833)Observations 4081 4081 25759 25146 5812 5683 16050 15752 3834 3833 118031 116870R-squared 0.148 0.282 0.143 0.238 0.168 0.339 0.082 0.200 0.07 0.189 0.195 0.422Standard errors in parentheses*** p<0.01, ** p<0.05, * p<0.1
Bolivia Peru Guatemala Ecuador Nicaragua Brazil
WAGE DECOMPOSITION BY INFORMAL AND FORMALREGRESSION ESTIMATES
(1) (2) (3) (4) (5) (6) (7) (8) (9) (10) (11) (12)
Male 0.215*** 0.262*** 0.133*** -0.0252 0.380*** 0.804*** 0.142*** 0.206*** 0.290*** 0.262*** 0.169*** 0.229***(0.0399) (0.0393) (0.0405) (0.0482) -0.0357 -0.0496 (0.0200) (0.0176) (0.00571) (0.00698) (0.0187) (0.0199)
Secondary 0.379*** 0.270*** 0.421*** 0.439*** 0.655*** 0.417*** 0.438*** 0.445*** 0.647*** 0.587*** 0.419*** 0.338***(0.0543) (0.0476) (0.0445) (0.0610) -0.041 -0.07 (0.0254) (0.0206) (0.00669) (0.00902) (0.0242) (0.0238)
Terciary 1.094*** 0.788*** 1.190*** 0.793*** 1.230*** 1.183*** 0.899*** 0.747*** 1.572*** 1.320*** 0.919*** 0.735***(0.0524) (0.0859) (0.0529) (0.157) -0.0471 -0.158 (0.0259) (0.0469) (0.00815) (0.0293) (0.0244) (0.0403)
Married 0.0407 0.0519 0.172*** 0.268*** 0.101** 0.0699 0.0388* -0.0175(0.0444) (0.0469) (0.0409) (0.0503) -0.0395 -0.0546 (0.0214) (0.0198)
Health -0.102** -0.0219 -0.0230 -0.0899*(0.0502) (0.0496) (0.0395) (0.0506)
Experience 0.0304*** 0.0214*** 0.0180*** 0.0366*** 0.0378*** 0.0390*** 0.0253*** 0.0213*** 0.0437*** 0.0405*** 0.0260*** 0.0268***(0.00452) (0.00459) (0.00462) (0.00515) -0.00366 -0.0055 (0.00207) (0.00179) (0.000663) (0.000782) (0.00194) (0.00199)
Experience Square -0.000406*** -0.000362*** -0.000159* -0.000449*** -0.000687*** -0.000789*** -0.000388*** -0.000393*** -0.000557*** -0.000590*** -0.000319*** -0.000388***(0.0000853) (0.0000708) (0.0000841) (0.0000755) -0.0000621 -0.0000804 (0.0000344) (0.0000255) (0.0000133) (0.0000129) (0.0000362) (0.0000299)
Migrant -0.0318 0.00894 0.146*** 0.0125 0.117*** 0.0527 0.0496*** 0.118*** 0.0840*** 0.0258(0.0374) (0.0413) (0.0404) (0.0516) -0.0334 -0.0505 (0.00557) (0.00711) (0.0199) (0.0224)
Household members -0.0192*** 0.0159*** -0.0244*** -0.0116***(0.00372) (0.00350) (0.00399) (0.00410)
Indigenous -0.205*** -0.147*** 0.0777 -0.00755 -0.234*** -0.262*** -0.167*** -0.241*** -0.272*** -0.349*** -0.0427 -0.0911***(0.0370) (0.0394) (0.0642) (0.0762) -0.0449 -0.0537 (0.0220) (0.0184) (0.00590) (0.00701) (0.0338) (0.0317)
Constant 0.852*** 0.642*** 1.367*** 0.994*** 6.160*** 5.500*** 0.375*** -0.180*** -0.0300*** -0.274*** -0.671*** -0.910***(0.0746) (0.0772) (0.0877) (0.107) -0.0539 -0.086 (0.0408) (0.0365) (0.0101) (0.0126) (0.0406) (0.0435)
Observations 1796 2285 1698 2135 2916 2767 9467 15679 64762 52108 7631 8121R-squared 0.280 0.088 0.259 0.070 0.293 0.176 0.170 0.105 0.428 0.187 0.201 0.081Standard errors in parent*** p<0.01, ** p<0.05, *
BrazilBolivia PeruGuatemala EcuadorNicaragua
DECOMPOSITION ESTIMATES
Explained Unexplained Explained Unexplained Explained Unexplained Explained Unexplained Explained Unexplained Explained Unexplained
Male 0.0381627 -0.0280056 0.0076542 0.0903857 0.0905009 -0.2424231 0.0152104 -0.0404235 0.0151092 0.0165429 0.0151889 -0.0364047(0.01) (0.03) (0.004) (0.036) (0.01) (0.04) (0.00) (0.02) (0.001) (0.005) (0.002) (0.017)
Secondary -0.0069155 0.0395775 0.0480335 -0.0048313 0.0838936 0.0593527 0.001701 -0.0025807 0.1046724 0.0197841 -0.0086289 0.0285737(0.00) (0.03) (0.008) (0.021) (0.01) (0.02) (0.00) (0.01) (0.002) (0.004) (0.003) (0.012)
Terciary 0.3327898 0.0868349 0.1605753 0.0379211 0.2104806 0.005289 0.2869988 0.0276032 0.2433407 0.027183 0.2630285 0.0406045(0.02) (0.03) (0.016) (0.016) (0.02) (0.02) (0.01) (0.01) (0.004) (0.003) (0.009) (0.010)
Married -0.0008178 -0.0078274 0.0054029 -0.0544996 -0.000904 0.0196896 -0.0002154 0.0350111(0.00) (0.04) (0.004) (0.037) (0.00) (0.04) (0.00) (0.02)
Health 0.0016958 -0.0139151 0.0033982 0.0249087(0.00) (0.01) (0.002) (0.024)
Experience -0.1752929 0.1848966 -0.1565048 -0.4223361 -0.3399229 -0.0258786 -0.1736719 0.0948599 -0.2241522 0.0694002 -0.1537308 -0.0172257(0.03) (0.13) (0.024) (0.157) (0.03) (0.15) (0.01) (0.07) (0.004) (0.022) (0.010) (0.065)
Experience Square 0.1451309 -0.0271874 0.1078801 0.21925 0.3709928 0.0814422 0.1827668 0.004527 0.1690722 0.0210144 0.131166 0.0549044(0.02) (0.07) (0.023) (0.086) (0.03) (0.08) (0.01) (0.04) (0.004) (0.012) (0.010) (0.038)
Migrant 0.0006701 -0.0241164 -0.0013849 0.0425353 0.0056557 0.0307925 -0.002309 -0.0371833 -0.0004686 0.0152533(0.00) (0.03) (0.001) (0.021) (0.00) (0.03) (0.000) (0.005) (0.000) (0.008)
Household members 0.0003453 -0.1843784 0.0022674 -0.0615513(0.00) (0.03) (0.001) (0.027)
Indigenous 0.0156351 -0.0299438 0.0007384 0.0767533 0.0408899 0.0073261 0.0217212 0.0214971 0.0382032 0.0295227 0.0024859 0.004464(0.00) (0.03) (0.001) (0.090) (0.01) (0.02) (0.00) (0.01) (0.001) (0.004) (0.001) (0.004)
Constant 0.2096989 0.372973 0.6599921 0.554361 0.2439923 0.2385673(0.11) (0.138) (0.10) (0.05) (0.016) (0.059)
Wage Differential 0.3510582 0.3900124 0.1757929 0.38306 0.4615866 0.5955825 0.3348561 0.5104767 0.3439364 0.3902562 0.2513084 0.2671855(0.02) (0.03) (0.019) (0.033) (0.02) (0.03) (0.01) (0.01) (0.004) (0.005) (0.008) (0.015)
Total Wage Differential 0.5184939
Bolivia Nicaragua Guatemala Peru
0.7410706 0.5588529 1.0571691 0.8453328 0.7341926
Brazil Ecuador
WAGE DECOMPOSITION BY INDIGENOUS AND NON INDIGENOUS IN FORMAL SECTORREGRESSION ESTIMATES
(1) (2) (3) (4) (5) (6) (7) (8) (9) (10) (11) (12)
Male 0.167*** 0.342*** 0.0251 -0.0328 0.741*** 0.888*** 0.214*** 0.191*** 0.287*** 0.229*** 0.246*** 0.0857(0.0566) (0.0543) -0.157 -0.0504 -0.0635 -0.0784 (0.0216) (0.0304) -0.00989 -0.00983 (0.0211) (0.0614)
Secondary 0.294*** 0.222*** 0.803*** 0.397*** 0.355*** 0.599*** 0.430*** 0.466*** 0.622*** 0.535*** 0.335*** 0.368***(0.0655) (0.0687) -0.194 -0.0639 -0.0812 -0.15 (0.0245) (0.0385) -0.0121 -0.0138 (0.0251) (0.0763)
Terciary 0.822*** 0.733*** 1.852*** 0.717*** 1.151*** 1.046*** 0.748*** 0.700*** 1.342*** 1.315*** 0.728*** 0.822***(0.116) (0.126) -0.661 -0.161 -0.183 -0.344 (0.0527) (0.107) -0.0333 -0.0757 (0.0416) (0.169)
Married 0.0805 0.0224 0.18 0.286*** 0.0885 -0.00277 -0.0183 -0.0389(0.0662) (0.0665) -0.158 -0.0528 -0.0682 -0.0904 (0.0241) (0.0354)
Health -0.0633 0.00629 -0.691*** -0.0173(0.0744) (0.0666) -0.168 -0.0529
Experience 0.0221*** 0.0195*** 0.0499*** 0.0331*** 0.0355*** 0.0517*** 0.0238*** 0.0159*** 0.0421*** 0.0382*** 0.0258*** 0.0347***(0.00707) (0.00636) -0.0161 -0.00547 -0.00686 -0.00926 (0.00221) (0.00310) -0.00109 -0.00112 (0.00210) (0.00620)
Experience Square -0.000368*** -0.000344*** -0.000696*** -0.000388*** -0.000797*** -0.000880*** -0.000432*** -0.000301*** -0.000585*** -0.000590*** -0.000371*** -0.000520***(0.000121) (0.0000925) -0.000211 -0.0000814 -0.000101 -0.000133 (0.0000328) (0.0000419) -0.0000181 -0.0000185 (0.0000317) (0.0000909)
Migrant 0.0928 -0.0702 -0.0773 0.00258 -0.0362 0.286*** 0.0737*** 0.174*** 0.0309 -0.0165(0.0576) (0.0586) -0.157 -0.0545 -0.0633 -0.0835 -0.0101 -0.00994 (0.0236) (0.0703)
Household members -0.0000883 0.0551*** -0.0123*** -0.00887(0.00422) (0.00636) (0.00439) (0.0116)
Constant 0.608*** 0.578*** 1.104*** 0.998*** 5.677*** 4.896*** -0.118*** -0.556*** -0.317*** -0.571*** -0.906*** -1.009***(0.103) (0.112) -0.272 -0.0856 -0.107 -0.131 (0.0437) (0.0632) -0.017 -0.0169 (0.0459) (0.130)
Observations 968 1317 213 1922 1778 989 10270 5409 26037 26071 7231 890R-squared 0.081 0.085 0.224 0.065 0.169 0.183 0.079 0.104 0.162 0.106 0.080 0.074Standard errors in parent*** p<0.01, ** p<0.05, *
EcuadorBolivia Nicaragua Guatemala Peru Brazil
DECOMPOSITION ESTIMATES
Explained Unexplained Explained Unexplained Explained Unexplained Explained Unexplained Explained Unexplained Explained Unexplained
Male 0.0090335 -0.0900427 0.0002478 0.029479 -0.08121 -0.0731106 -0.001975 0.0137489 -0.0068631 0.0325746 -0.0004374 0.0926814(0.01) (0.04) (0.00) (0.08) (0.02) (0.05) (0.00) (0.02) (0.00) (0.01) (0.00) (0.04)
Secondary 0.0263146 0.0279954 -0.0114676 0.0834784 0.0738185 -0.0417293 0.071884 -0.0133431 0.0608065 0.0206708 0.0403557 -0.0119446(0.01) (0.04) (0.01) (0.04) (0.01) (0.03) (0.00) (0.02) (0.00) (0.00) (0.01) (0.03)
Terciary 0.0116205 0.0059037 -0.0104489 0.0164947 0.0220565 0.0026645 0.0193647 0.0018816 0.0249642 0.0003774 0.0384904 -0.0073009(0.01) (0.01) (0.01) (0.01) (0.01) (0.01) (0.00) (0.00) (0.00) (0.00) (0.01) (0.01)
Married -0.0031119 0.0404669 0.0045235 -0.060471 -0.0021399 0.0575007 0.0012754 0.0128759(0.00) (0.07) (0.01) (0.10) (0.00) (0.07) (0.00) (0.03)
Health 0.0007097 -0.0131372 -0.0024522 -0.2842646(0.0017) (0.02) (0.0040) (0.08)
Experience -0.1034049 0.0613583 -0.0228381 0.417895 -0.1479124 -0.4430852 -0.104246 0.2122667 0.0052817 0.0937682 -0.0129244 -0.231057(0.03) (0.23) (0.04) (0.43) (0.0383) (0.32) (0.0143) (0.10) (0.0053) (0.04) (0.0210) (0.17)
Experience Square 0.100281 -0.0192365 0.0323109 -0.2656463 0.1786662 0.0880013 0.1314646 -0.1366274 -0.0093897 0.0040852 0.012459 0.1438917(0.03) (0.12) (0.04) (0.20) (0.04) (0.18) (0.01) (0.06) (0.00) (0.02) (0.02) (0.09)
Migrant 0.0000101 0.1029277 -0.0006243 -0.0323966 0 0 0.0004992 -0.0554914 -0.0001196 0.0125877(0.00) (0.05) (0.01) (0.07) 0.00 0.00 (0.00) (0.01) (0.00) (0.02)
Household members 0.04398 -0.1416588 0.0121151 -0.2927224 0.0033547 -0.0166519(0.02) (0.05) (0.00) (0.04) (0.00) (0.06)
Constant 0.0300062 0.1064364 0.7811189 0.4377812 0.2543766 0.1028113(0.15) (0.28) (0.17) (0.08) (0.02) (0.14)
Wage Differential 0.0414527 0.1462417 -0.010749 0.0110051 0.087259 0.2297014 0.1298829 0.2358614 0.0752988 0.3503614 0.0811783 0.0850178(0.01) (0.04) (0.02) (0.08) (0.03) (0.05) (0.01) (0.02) (0.00) (0.01) (0.01) (0.03)
Total Wage Differential 0.1661961
Bolivia Nicaragua Guatemala Peru Brazil Ecuador
0.1876944 0.0002561 0.3169604 0.3657443 0.4256602
WAGE DECOMPOSITION BY INDIGENOUS AND NON INDIGENOUS IN FORMAL SECTORREGRESSION ESTIMATES
(1) (2) (3) (4) (5) (6) (7) (8) (9) (10) (11) (12)
Male 0.127** 0.330*** 0.176 0.123*** 0.360*** 0.536*** 0.137*** 0.163*** 0.306*** 0.249*** 0.167*** 0.210***(0.0579) (0.0545) (0.162) (0.0415) (0.0395) (0.0840) (0.0224) (0.0448) (0.00734) (0.00898) (0.0193) (0.0774)
Secondary 0.369*** 0.358*** 0.817*** 0.380*** 0.678*** 0.479*** 0.430*** 0.472*** 0.662*** 0.616*** 0.426*** 0.348***(0.0849) (0.0689) (0.183) (0.0453) (0.0452) (0.0999) (0.0297) (0.0507) (0.00892) (0.00984) (0.0253) (0.0825)
Terciary 1.037*** 1.134*** 1.443*** 1.164*** 1.267*** 0.845*** 0.907*** 0.857*** 1.591*** 1.515*** 0.925*** 0.853***(0.0813) (0.0671) (0.222) (0.0538) (0.0506) (0.143) (0.0299) (0.0545) (0.00994) (0.0160) (0.0254) (0.0932)
Married 0.0808 0.000613 0.430** 0.150*** 0.0967** 0.104 0.0514** -0.0250(0.0644) (0.0607) (0.174) (0.0415) (0.0437) (0.0934) (0.0241) (0.0479)
Health -0.168** -0.0586 -0.205 -0.0172(0.0799) (0.0625) (0.156) (0.0407)
Experience 0.0435*** 0.0171*** 0.0222 0.0162*** 0.0425*** 0.0141* 0.0230*** 0.0318*** 0.0445*** 0.0414*** 0.0261*** 0.0251***(0.00669) (0.00606) (0.0165) (0.00483) (0.00416) (0.00819) (0.00241) (0.00430) (0.000852) (0.00105) (0.00202) (0.00731)
Experience Square -0.000685*** -0.000149 -0.000305 -0.000112 -0.000758*** -0.000377*** -0.000343*** -0.000488*** -0.000552*** -0.000552*** -0.000319*** -0.000322**(0.000131) (0.000111) (0.000266) (0.0000895) (0.0000735) (0.000122) (0.0000418) (0.0000646) (0.0000174) (0.0000204) (0.0000378) (0.000129)
Migrant -0.0463 -0.0302 0.123 0.149*** 0.0609 0.393*** 0.0354*** 0.0800*** 0.0790*** 0.148*(0.0548) (0.0504) (0.169) (0.0411) (0.0374) (0.0747) (0.00724) (0.00856) (0.0206) (0.0779)
Household members -0.0242*** -0.000834 -0.0279*** 0.00841(0.00420) (0.00810) (0.00420) (0.0130)
Constant 0.832*** 0.694*** 1.080*** 1.488*** 6.142*** 6.083*** 0.415*** 0.0675 -0.0602*** -0.233*** -0.657*** -0.868***(0.110) (0.0974) (0.273) (0.0671) (0.0585) (0.128) (0.0459) (0.0850) (0.0126) (0.0152) (0.0423) (0.146)
Observations 904 892 162 1536 2265 651 7309 2158 40219 24543 7089 542R-squared 0.251 0.301 0.298 0.261 0.296 0.207 0.158 0.145 0.417 0.314 0.203 0.153Standard errors in parentheses*** p<0.01, ** p<0.05, * p<0.1
EcuadorBolivia Nicaragua Guatemala Peru Brazil
DECOMPOSITION ESTIMATES
Explained Unexplained Explained Unexplained Explained Unexplained Explained Unexplained Explained Unexplained Explained Unexplained
Male -0.0117569 -0.1362966 -0.0017311 0.0333704 -0.0430494 -0.1145099 -0.0056661 -0.0176931 -0.0150779 0.0351063 -0.016256 -0.0281877(0.01) (0.05) (0.01) (0.11) (0.01) (0.060) (0.00) (0.03) (0.00) (0.01) (0.01) (0.05)
Secondary -0.0040256 0.0040589 0.0146993 0.1597824 0.0639381 0.0656233 0.0116096 -0.0152844 0.0183734 0.018634 -0.0018342 0.02656(0.03) (0.04) (0.04) (0.07) (0.02) (0.036) (0.01) (0.02) (0.00) (0.01) (0.02) (0.03)
Terciary 0.0946664 -0.0413161 -0.0172546 0.047848 0.1262597 0.0849177 0.1487066 0.0193799 0.2325782 0.0138398 0.1411852 0.0282075(0.03) (0.05) (0.04) (0.04) (0.02) (0.031) (0.01) (0.02) (0.00) (0.00) (0.02) (0.04)
Married -0.0019623 0.0552557 0.0076001 0.1725058 -0.0102286 (0.005) 0.000252 0.0468674(0.00) (0.06) (0.01) (0.11) (0.01) (0.064) (0.00) (0.03)
Health 0.0064364 -0.0179177 (0.00) (0.08)(0.0036) (0.02) (0.00) (0.07)
Experience -0.0712021 0.467416 0.0200666 0.1221542 -0.1019308 0.5254235 -0.125137 -0.1720306 -0.0389376 0.0593897 -0.041295 0.0183931(0.02) (0.16) (0.02) (0.35) (0.04) (0.170) (0.02) (0.10) (0.00) (0.03) (0.0204) (0.15)
Experience Square 0.0456113 -0.2566657 -0.0134189 -0.1231975 0.1264067 -0.2069544 0.1227573 0.0846006 0.0200309 -0.0003299 0.0331422 0.0020538(0.02) (0.08) (0.01) (0.18) (0.04) (0.077) (0.02) (0.04) (0.00) (0.01) (0.02) (0.08)
Migrant 0.0036149 -0.0089528 -0.0018473 -0.0076912 0.05 -0.1696689 -0.0011713 -0.0235846 0.0018619 -0.0176684(0.00) (0.04) (0.01) (0.05) (0.01) (0.043) (0.00) (0.01) (0.00) (0.02)
Household members 0.0002243 -0.1215464 -0.0029828 -0.1721002(0.00) (0.05) (0.01) (0.06)
Constant 0.1377958 (0.41) 0.060 0.3477153 0.1726375 0.2110912(0.15) (0.28) (0.141) (0.10) (0.02) (0.15)
Wage Differential 0.061382 0.2033775 0.0054594 -0.0785671 0.2137169 0.2398706 0.1527467 0.1720087 0.2157958 0.2756927 0.1138214 0.0683492(0.02) (0.04) -0.0364238 (0.08) (0.03) -0.0467451 (0.01) (0.02) (0.00) (0.01) (0.02) (0.04)
Total Wage Differential 0.1821706
Bolivia Nicaragua Guatemala Peru Brazil Ecuador
0.2647595 -0.0731077 0.4535875 0.3247554 0.4914885