Social determinants of self-rated health and cardiovascular ...
174
FACULTY OF HEALTH SCIENCES DEPARTMENT OF COMMUNITY MEDICINE Social determinants of self-rated health and cardiovascular disease among the Sami and other Arctic indigenous peoples The SLiCA study and the SAMINOR study Bent-Martin Eliassen A dissertation for the degree of Philosophiae Doctor June 2013
-
Upload
khangminh22 -
Category
Documents
-
view
8 -
download
0
Transcript of Social determinants of self-rated health and cardiovascular ...

FACULTY OF HEALTH SCIENCES DEPARTMENT OF COMMUNITY MEDICINE
Social determinants of self-rated health and
cardiovascular disease among the Sami and
other Arctic indigenous peoples
The SLiCA study and the SAMINOR study
Bent-Martin Eliassen
A dissertation for the degree of Philosophiae Doctor June 2013


Social determinants of self-rated health and
cardiovascular disease among the Sami and other
Arctic indigenous peoples
The SLiCA study and the SAMINOR study
Bent-Martin Eliassen
Centre for Sami Health Research
Department of Community Medicine
University of Tromsø
Tromsø, Norway
2013


Table of contents Acknowledgements .......................................................................................................................... 7
Summary .......................................................................................................................................... 9
Sammendrag ................................................................................................................................... 11
List of papers .................................................................................................................................. 13
Abbreviations ................................................................................................................................. 14
1 Introduction ............................................................................................................................. 15
2 Background ............................................................................................................................. 19
2.1. The indigenous peoples: history and autonomy .............................................................. 19
2.1.1. The Iñupiat of Alaska ............................................................................................... 20
2.1.2. The Inuit of Greenland ............................................................................................. 20
2.1.3. The Sami of Norway ................................................................................................ 21
2.2. Cardiovascular disease and self-rated health, and their social determinants ................... 24
3 Aims of the thesis .................................................................................................................... 32
4. Material and methods .............................................................................................................. 344.1. Data sources and study population .................................................................................. 34
4.2. Paper I .............................................................................................................................. 34
4.2.1. Alaska ....................................................................................................................... 35
4.2.2. Greenland ................................................................................................................. 38
4.2.3. Norway ..................................................................................................................... 40
4.2.4. Questionnaire ........................................................................................................... 43
4.3. Papers II and III ............................................................................................................... 45
4.3.1. Questionnaires .......................................................................................................... 47
4.4. Statistical analyses ........................................................................................................... 51
4.5. Ethical aspects ................................................................................................................. 51
5. Summary of results ................................................................................................................. 535.1. Paper : Acculturation and self-rated health among Arctic indigenous peoples: a population-based cross-sectional study ...................................................................................... 53
5.2. Paper : Marginalisation and cardiovascular disease among rural Sami in NorthernNorway: a population-based cross-sectional study .................................................................... 54
5.3. Paper : Ethnic difference in the prevalence of angina pectoris in Sami and non-Samipopulations: the SAMINOR study ............................................................................................. 54
6. Discussion ............................................................................................................................... 56

6.1. Methodological considerations ........................................................................................ 56
6.2. Selection bias ................................................................................................................... 58
6.2.1. Paper I ...................................................................................................................... 58
6.2.2. Papers II and III ........................................................................................................ 62
6.3. Information bias ............................................................................................................... 65
6.3.1. Paper I ...................................................................................................................... 66
6.3.2. Papers II and III ........................................................................................................ 67
6.4. Confounding, intermediate variables and interaction ...................................................... 71
6.4.1. Paper I ...................................................................................................................... 72
6.4.2. Papers II and III ........................................................................................................ 74
6.5. External validity .............................................................................................................. 75
6.6. Statistical associations ..................................................................................................... 75
7. Brief discussion of main results and future research .............................................................. 778. Implications for future public health practice ......................................................................... 799. Errata ....................................................................................................................................... 81Literature ........................................................................................................................................ 82
Papers I, II and III
Appendices

Acknowledgements
The research leading up to this thesis was conducted at the Centre for Sami Health Research, Department of Community Medicine, Faculty of Health Science, University of Tromsø, Norway. The thesis is based on consecutive research from July 2009 to June 2013. My research was sponsored by a university grant.
I am very grateful to my main supervisor, Dr. Med Ann Ragnhild Broderstad, MD. Thank you for sharing your detailed knowledge on Sami population health and for guiding me through unfamiliar clinical “terrain”. You have always been available, even outside office hours. Your consistent encouragements in both good and bad times during this project have been invaluable to me.
I am also grateful to my co-supervisor Ketil Lenert Hansen, PhD. You have given me invaluable inputs on the social science perspectives of population health. Your vast and detailed knowledge on the social determinants of Sami population health has both been inspirational and important in my work.
This PhD project would not have been possible without the assistance of statistician Marita Melhus at the Centre for Sami Health Research. Thank you for administrating my data files. You have also shared your knowledge of statistics and mathematics from which I have learned a great deal. Your experience from assisting many PhD students and researchers at the Centre has given you great insight into population health research from which I have benefited greatly. I want to express my gratitude to all my colleagues at the Centre for Sami Health Research for invaluable inputs and educational discussions.
Special thanks go to Professor Sidsel Graff-Iversen and Professor Maja Lisa Løchen. Your authorships in the last paper of this thesis were invaluable. Your fresh perspectives were essential, educational and encouraging.
I would also like to thank Associate Professor Tonje Braaten for her contribution in the first paper of this thesis and for always being available to answer my many questions on statistics.
Special thanks to my colleague and friend Professor Jens-Ivar Nergård for introducing me to Sami related research questions and for much good advice and encouragement along the way.
Professor Bjarne Koster Jacobsen, thank you for always being available, for helpful advice and for the exhaustive answers to my many questions.
Thank you to my colleague and office mate Ammar Ali Hassan. Your knowledge of statistics and epidemiology has been helpful. Thank you also for your encouragement and kind advice in the writing-up process. I also appreciate the support and encouragements from Karina Standahl Olsen; working side-by-side with you in the writing-up process has been inspirational.
I am grateful for the administrative support at the Department of Community Medicine, and thanks to all other colleagues at the department and at the EPINOR research school.
I am also grateful for the help and assistance of the international research team of the Survey of Living Conditions in the Arctic, and especially Jack Kruse and Birger Poppel. Your in-depth knowledge of the Iñupiat people and Greenlandic Inuit has been invaluable to me. Thanks to all the field workers in Norway, Alaska and Greenland, and to Bente Augdal for helping in the administration of the data collection in Finnmark.
Thanks to the working group who made the SAMINOR study possible. The technical collaboration with the National Institute of Public Health has also been of great importance.
7

Above all, I want to express my gratitude to everyone who participated in SLiCA and SAMINOR and generously donated time and effort in the benefit of science.
Finally, I want to express my gratitude to my patient girlfriend Tine Marie. Thank you for all your support. My dear parents, thank you for the support and for always believing in me. To my brother Raimond and my sister Christina, thank you for always being there.
Tromsø, June 2013
Bent-Martin Eliassen
8

Summary
The post-World War II years in the Arctic were characterised by an intensification of sociocultural change. Previous studies among indigenous peoples show that colonialism, rapid modernisation and subsequent marginalisation and sociocultural change are accompanied by overall ill health and a negative cardiovascular risk profile and disease burden. The aims of this thesis were to explore the relationship between acculturation and self-rated health in the Sami population of Norway and the Inuit populations of Alaska and Greenland (Paper I), assess the relationship between marginalisation and burden of lifetime total cardiovascular disease by minority/majority status in the Sami population of northern Norway (Paper II), and measure the population prevalence of angina pectoris and explore potential ethnic disparity in its distribution with regard to traditional risk factors in areas with both Sami and non-Sami populations (Paper III). Self-rated health (SRH) and cardiovascular disease (CVD) are both considered important public health indicators.
Paper I was based on data from the international research project the Survey of Living Conditions in the Arctic (SLiCA). A total of 797, 1440 and 788 persons were invited in Alaska, Greenland, and Norway, respectively (Table 2). Among these, 663 (83.2%), 1197 (83.1%) and 445 (56.5%) individuals participated, respectively. This study showed that aggregate acculturation was a strong risk factor for poorer SRH among the Greenlandic Inuit and female Iñupiat of Alaska.
Papers II and III were based on data from the population-based survey in areas with Sami and non-Sami populations (SAMINOR), conducted in 2003-2004. In the age group 36-79 years, 27,151 were invited and 16,538 (60.9%) participated. Paper II (n=4027) showed that marginalised Sami living in Norwegian dominated areas were more than twice as likely (OR 2.10) as non-marginalised Sami from Sami majority areas to report lifetime CVD. Moderate to no intermediate effects were seen after including established CVD risk factors, which suggest little difference in lifestyle related factors. Chronic stress exposure following marginalisation may however be a plausible explanation for some of the observed excess of CVD.
Paper III (n=15,206) showed an excess of angina pectoris symptoms (APS), self-reported angina, and a combination of these in Sami women and men relative to non-Sami women and men. Total cholesterol, metabolic syndrome, smoking, family history of cardiovascular disease, and moderate alcohol consumption explained little or none of the ethnic variation in APS. The excess burden of APS was in Sami women principally due to known cases of angina pectoris. In men however the discrepancy in prevalent angina symptoms may be due to an excess burden of undiagnosed disease among the Sami. These results may indicate under-utilisation of health care services among Sami men which suggest that social determinants play a role in the distribution of APS in this population. The results in Paper II also suggest that marginalisation and subsequent chronic stress may be an additional driving force influencing the population burden of lifetime cardiovascular disease among the Sami.
The results in Papers II and III shed light on important social determinants of health in the Sami population of rural Norway that may be important in explaining some of the distribution of chronic disease within this group. These are issues that need to be addressed in future research
9

and perhaps in public health initiatives. The results found in Paper I also support further exploration of the social determinants of ill health in other indigenous populations.
10
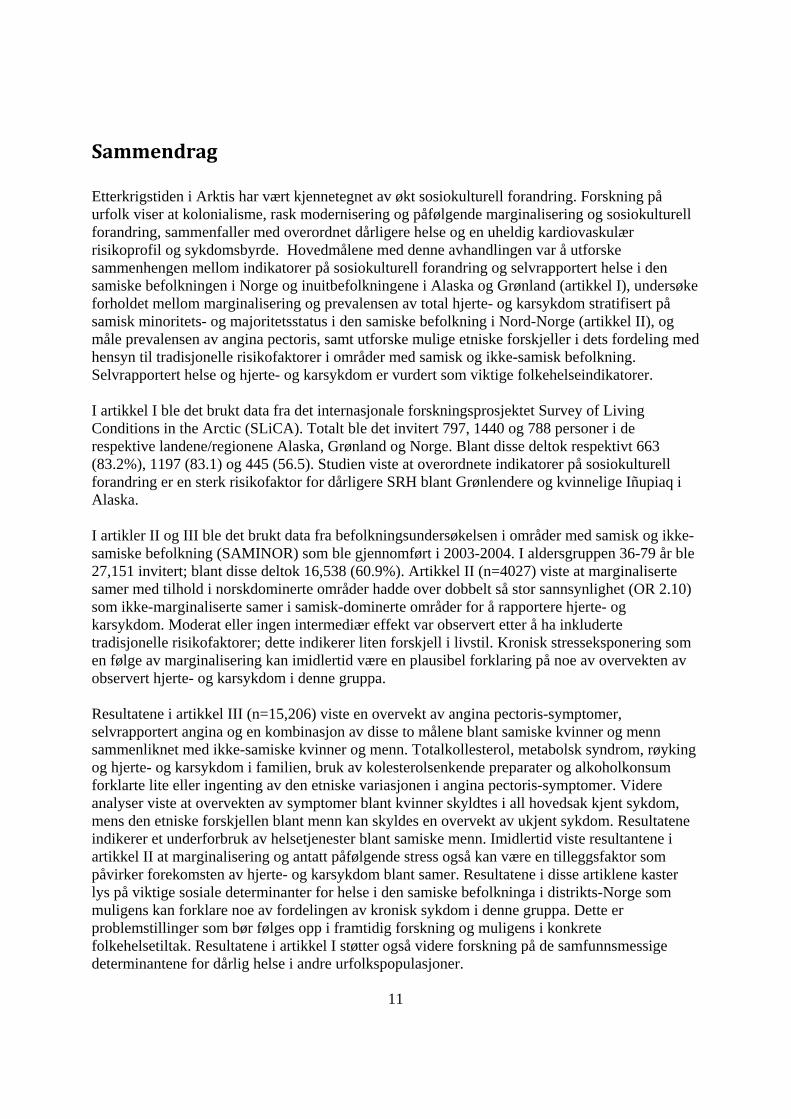
Sammendrag
Etterkrigstiden i Arktis har vært kjennetegnet av økt sosiokulturell forandring. Forskning på urfolk viser at kolonialisme, rask modernisering og påfølgende marginalisering og sosiokulturell forandring, sammenfaller med overordnet dårligere helse og en uheldig kardiovaskulær risikoprofil og sykdomsbyrde. Hovedmålene med denne avhandlingen var å utforske sammenhengen mellom indikatorer på sosiokulturell forandring og selvrapportert helse i den samiske befolkningen i Norge og inuitbefolkningene i Alaska og Grønland (artikkel I), undersøke forholdet mellom marginalisering og prevalensen av total hjerte- og karsykdom stratifisert på samisk minoritets- og majoritetsstatus i den samiske befolkning i Nord-Norge (artikkel II), og måle prevalensen av angina pectoris, samt utforske mulige etniske forskjeller i dets fordeling med hensyn til tradisjonelle risikofaktorer i områder med samisk og ikke-samisk befolkning. Selvrapportert helse og hjerte- og karsykdom er vurdert som viktige folkehelseindikatorer.
I artikkel I ble det brukt data fra det internasjonale forskningsprosjektet Survey of Living Conditions in the Arctic (SLiCA). Totalt ble det invitert 797, 1440 og 788 personer i de respektive landene/regionene Alaska, Grønland og Norge. Blant disse deltok respektivt 663 (83.2%), 1197 (83.1) og 445 (56.5). Studien viste at overordnete indikatorer på sosiokulturell forandring er en sterk risikofaktor for dårligere SRH blant Grønlendere og kvinnelige Iñupiaq i Alaska.
I artikler II og III ble det brukt data fra befolkningsundersøkelsen i områder med samisk og ikke-samiske befolkning (SAMINOR) som ble gjennomført i 2003-2004. I aldersgruppen 36-79 år ble 27,151 invitert; blant disse deltok 16,538 (60.9%). Artikkel II (n=4027) viste at marginaliserte samer med tilhold i norskdominerte områder hadde over dobbelt så stor sannsynlighet (OR 2.10) som ikke-marginaliserte samer i samisk-dominerte områder for å rapportere hjerte- og karsykdom. Moderat eller ingen intermediær effekt var observert etter å ha inkluderte tradisjonelle risikofaktorer; dette indikerer liten forskjell i livstil. Kronisk stresseksponering som en følge av marginalisering kan imidlertid være en plausibel forklaring på noe av overvekten av observert hjerte- og karsykdom i denne gruppa.
Resultatene i artikkel III (n=15,206) viste en overvekt av angina pectoris-symptomer, selvrapportert angina og en kombinasjon av disse to målene blant samiske kvinner og menn sammenliknet med ikke-samiske kvinner og menn. Totalkollesterol, metabolsk syndrom, røyking og hjerte- og karsykdom i familien, bruk av kolesterolsenkende preparater og alkoholkonsum forklarte lite eller ingenting av den etniske variasjonen i angina pectoris-symptomer. Videre analyser viste at overvekten av symptomer blant kvinner skyldtes i all hovedsak kjent sykdom, mens den etniske forskjellen blant menn kan skyldes en overvekt av ukjent sykdom. Resultatene indikerer et underforbruk av helsetjenester blant samiske menn. Imidlertid viste resultantene i artikkel II at marginalisering og antatt påfølgende stress også kan være en tilleggsfaktor som påvirker forekomsten av hjerte- og karsykdom blant samer. Resultatene i disse artiklene kaster lys på viktige sosiale determinanter for helse i den samiske befolkninga i distrikts-Norge som muligens kan forklare noe av fordelingen av kronisk sykdom i denne gruppa. Dette er problemstillinger som bør følges opp i framtidig forskning og muligens i konkrete folkehelsetiltak. Resultatene i artikkel I støtter også videre forskning på de samfunnsmessige determinantene for dårlig helse i andre urfolkspopulasjoner.
11

12

List of papers
The thesis is based on the following papers, hereafter referred in the text as Papers I, II and III.
Paper I
Eliassen BM, Braaten T, Melhus M, Hansen KL, Broderstad AR.Acculturation and self-rated health among Arctic indigenous peoples: a population-based cross-sectional study. BMC Public Health 2012, 12:948. PubMed: PMID 23127197
Paper II
Eliassen BM, Melhus M, Hansen KL, Broderstad AR.Marginalisation and cardiovascular disease among rural Sami in Northern Norway: apopulation-based cross-sectional study. BMC Public Health 2013, 13:522. PubMed: PMID 23718264
Paper III
Eliassen BM, Graff-Iversen S, Melhus M, Hansen KL, Løchen ML, Broderstad AR. Ethnic difference in the prevalence of angina pectoris in Sami and non-Sami populations: The SAMINOR study.[Submitted]
13

Abbreviations
SLiCA Survey of Living Conditions in the Arctic: Inuit, Sami and the indigenous peoples of Chukotka
SAMINOR Population-based study of health and living conditions in areas with both Sami and Norwegian populations
IHD Ischaemic heart diseaseMI Myocardial infarctionBMI Body max indexANCSA Alaska Native Claims Settlement ActWWII World War IISRH Self-rated healthCVD Cardiovascular diseaseHDL High-density lipoproteinPAR Population attributable riskRAQ Rose angina questionnaireNA Northwest ArcticNS North SlopeBS Bering StraitAIAN American Indians and Alaska NativesSILA Spoken indigenous language abilitySTATA StataCorp, College Station, TXOR Odds ratioCI Confidence intervalAPS Angina pectoris symptomsSAP Stable angina pectorisMRI Magnetic resonance imagingCT Computer tomographyTIA Transient ischaemic attackPPV Positive predictive valueGP General PractitionerMuI Multiple imputation
14

1 Introduction The overall aim of the thesis is to assess the effects of acculturation and marginalisation on health
among Arctic indigenous peoples with a special focus on the Sami of Norway, and measure the
prevalence of cardiovascular disease among the Sami of rural Norway. We used data from the
Survey of Living Conditions in the Arctic: Inuit, Sami and the indigenous peoples of Chukotka
(SLiCA) to assess the relationship between acculturation and self-rated health among the Iñupiaq
of northern Alaska, Inuit of Greenland and Sami of Norway. Data from the population-based
study of health and living conditions in areas with both Sami and Norwegian populations
(SAMINOR) was used to explore the relationship between marginalisation and cardiovascular
disease (CVD) by Sami minority/majority status in northern Norway. The SAMINOR data was
also applied to investigate potential differences in prevalence of angina pectoris in Sami and non-
Sami populations in rural Norway.
The thesis is influenced by theoretical perspectives in the fields of social anthropology, sociology
and social epidemiology (psychosocial theory, socio-political theory and social determinants of
health theory). The many frameworks and perspectives within social epidemiology have their
merits; these shall not be pinpointed but integrated in the text as a basis of the background
descriptions and discussions. They all emphasise the relevance of social structures and processes
in disease distribution in populations.
Arctic indigenous peoples share a common, though independently unique, history of colonialism
and have throughout history been victims of state and church driven forced assimilation [1-4].
Forced assimilation has resulted in loss or extensive change of traditional practices, native
languages, and norms and beliefs [5]. As part of this process, concentration of the populations in
larger settlements provided most circumpolar indigenous peoples with schooling, health care,
housing, water, sanitation, and imported foods and consumer products [4, 6, 7]. The post-World
War II years in the Arctic were characterised by an intensification of social and cultural change
[4]. Increasing urbanisation has taken place [4] and mining, industrial fishing and the discovery
of oil transformed – to a varying degree – the economies [8]. Today the transition from hunting
and small scale fishing to a mixed cash/harvesting economy is seen all across the Arctic [7]. This
development has resulted in a rapid decline in infectious diseases and a corresponding increase in
15

chronic diseases such as heart disease. This development is often termed the “epidemiological
transition” [9].
In the period 1959-75, ischaemic heart disease (IHD) mortality in Norway was highest in
Finnmark County [10]. This led to a total of six cardiovascular screenings, the first one being
conducted in 1974 and the latest in 1996. The last three surveys comprised municipalities mainly
from coastal areas in Finnmark. Thus, inland areas with large Sami populations were not included
[11]. In the first Finnmark study [12], Sami/Kven men aged 35-49 years reported on average a
40% higher cardiovascular risk score compared with Norwegians. The score was based on sex,
serum total cholesterol, systolic blood pressure and current cigarette smoking [12]. Despite this
risk profile, only 8.8 expected prevalent cases of previous myocardial infarction (MI) in Sami
were observed compared with 32.4 in Norwegians (p>0.05) [12]. Since then, several
cardiovascular screenings have been conducted; prevalence and follow-up data have shown no or
only minor differences in risk factors and risk of cardiovascular disease [13-17]. In these surveys,
Sami ethnicity was defined as having two or more grandparents of Sami origin.
As part of the seventh cardiovascular screening in Finnmark, the SAMINOR study has shown a
higher prevalence of obesity among Sami women compared with Norwegian women [18] and a
somewhat higher apoB/apoA-1 ratio and cholesterol level in middle-aged Sami men and women
compared with non-Sami men and women [11]. However, few general health discrepancies
between Sami and ethnic Norwegians are detected today [19].
Since the 1970s the mortality rate of cardiovascular diseases in Norway has decreased, especially
for myocardial infarction (MI) [20]. In terms of MI, a decrease in both mortality and morbidity
for those aged <80 years has been reported [21, 22]. This is mostly due to better treatment and an
overall reduction in cholesterol, smoking and blood pressure [23]. However, the mean body mass
index (BMI) and the amount of physical inactivity have increased. In Finnmark, the trend
towards a decrease in risk factors seems to be 10 to 15 years behind other Norwegian counties
and high values of cholesterol, a high smoking levels, and high consumption of unfiltered coffee
are still common [20].
16

In terms of mortality from CVD, conflicting results have been presented on the differences
between Sami and non-Sami; using Finnmark data from 1974-75, Tverdal [24] found a reduced
risk for cardiovascular death in Sami men compared with Norwegian men after controlling for
known risk factors. Linking the 1970 national census to the national death register, Tynes et al
[25] found a slightly increased risk in Sami men and women for death due to diseases of the
circulatory system. While Tverdal used the previously mentioned definition of Sami ethnicity,
Tynes et al adopted a much wider definition. In Sweden a somewhat higher Sami mortality rate
due to IHD in women has been reported [26, 27]. In Finland, however, a lower mortality rate
from CVD among Sami has been found compared with non-Sami [28, 29].
In the past 50 years the absolute burden of mortality and morbidity has decreased substantially in
the Inuit populations, measured in terms of life expectancy at birth, infant mortality rate, and in
the occurrence of infectious diseases. Though a great deal of variation exists across regions and
between communities, there are still considerable disparities between the health status of the
indigenous populations and the general population of the nation states to which they belong [30].
The key features of the health transition experienced by the Inuit are: 1) a rapid decline in
infectious diseases (such as tuberculosis), which have now stabilised at a level that remains
higher than in the general national populations and 2) a corresponding increase in chronic
diseases such as heart disease. The increase in chronic disease is in part due to an aging
population, greater reliance on imported junk food, a decreased level of physical activity and
increased prevalence of obesity [31]. However, among the most important health problems,
especially in those 35 years of age, are the so-called social pathologies: violence, accidents,
suicide, and alcohol and substance abuse [30].
The SLiCA study was initiated in 2003 and adopted by the Centre for Sami Health Research in
2006. SLiCA was not designed as an epidemiological study; the survey is an international
research project on health and other aspects of the living conditions of indigenous peoples in
Alaska, Canada, Greenland, Norway, Sweden and Russia. The motivation for launching SLiCA
was the ambition to describe these aspects with regard to indigenous language, traditions and
resource utilisation. Though disease-specific data is lacking in SLiCA, overall health measures
were collected such as self-rated health. Paper I in this thesis is based on data collected among
17

the Iñupiaq people (Alaska), Greenlandic Inuit and Sami of Norway as detailed information on
data collection and processing was available for these samples.
The Norwegian Institute of Public Health planned a seventh cardiovascular screening in
Finnmark in 2000. At the same time the Centre for Sami Health Research was established as
knowledge about the health and living conditions of the Sami population in Norway was limited.
The collaboration between these two institutes was initiated in the SAMINOR study with the
purpose of promoting more knowledge about the health issues of the Sami population which also
included areas south of Finnmark [11]. The SAMINOR study enables analyses of disease-specific
data.
18

2 Background
2.1. The indigenous peoples: history and autonomy
Indigenous livelihood systems in Northwest Alaska and Greenland are mixed cash-subsistence
economies; the economy is based on hunting, trapping and fishing as well as paid work [32].
Though there are regional differences, unemployment is a problem in many Inuit communities.
Hunting and fishing are values held high among the Sami also [33]. Most Sami today work in
service industries [34]; only about 3000 are associated with reindeer husbandry [35, 36].
However, the number working in the primary industries is higher among the Sami than in the
Norwegian population [34]. In 2004 unemployment was generally low in Norway but higher in
the northernmost regions compared with the national average [37]. The premises for good health
differ between these populations and great care has been taken in data collection (Chapter 4) and
analysis and interpretation of results (Chapter 6) in order to facilitate overall comparison in
SLiCA.
The Inuit are a number of close related indigenous population groups inhabiting the circumpolar
region in Greenland, Canada, Alaska and Siberia. In Alaska there are some 47,000 Inuit [38].
Approximately 30% of these are Iñupiat [38-40] inhabiting the northern and western coasts as far
south as Norton Sound [38]. Greenland is home to about 57,000 people, of which about 90% are
Kalaallit (Greenlandic Inuit). The majority of Greenland’s population liv on the south-central
west coast. Only 3500 live on the east coast and less than 1000 are located in the far north.
Kalaallisut (the Greenlandic language which is the official language in Greenland) is closely
related to the Iñupiaq language spoken by Iñupiat in Alaska [41].
The Sami are an indigenous people whose settlement area covers the northern parts of Norway,
Sweden and Finland, and Russia’s Kola Peninsula. The traditional Sami settlement area (Sápmi)
in Norway stretches from Finnmark in the north to Engerdal in Hedmark County in the south
[42]. No reliable or updated demographic record on the Sami exists. The very deficient estimates
of the total number of Sami in Norway usually vary between 40,000 and 50,000 [43]. Belonging
19
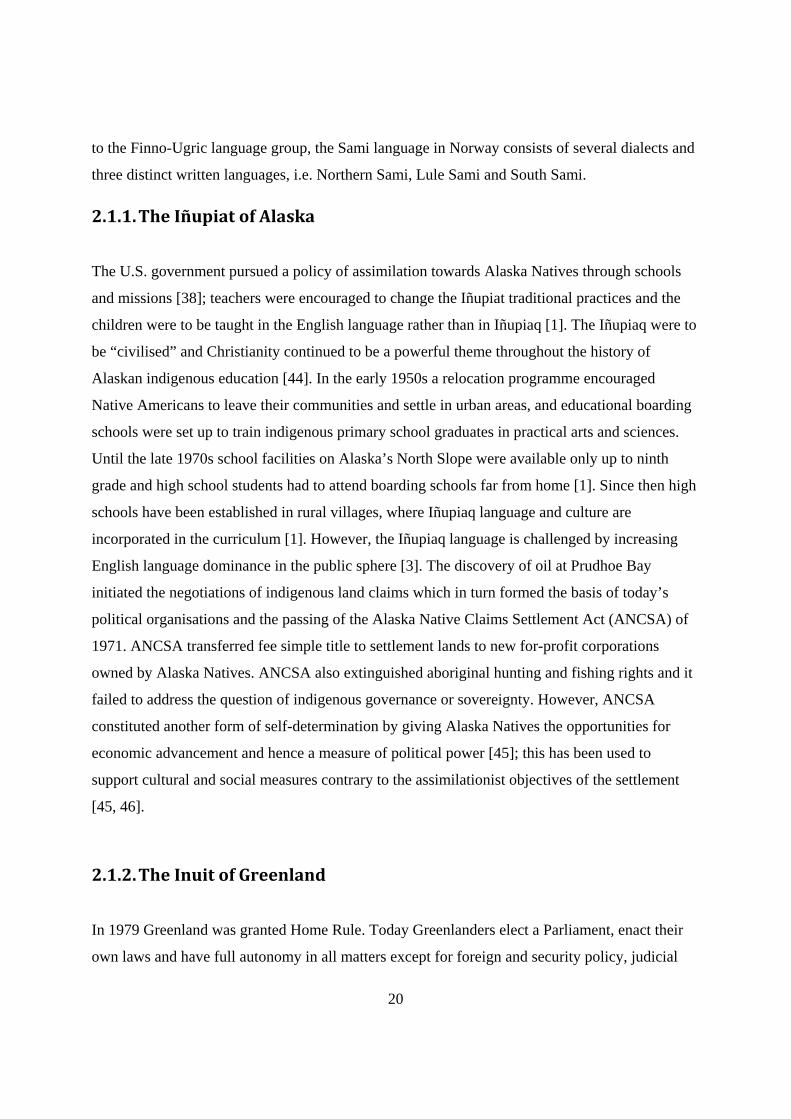
to the Finno-Ugric language group, the Sami language in Norway consists of several dialects and
three distinct written languages, i.e. Northern Sami, Lule Sami and South Sami.
2.1.1.The Iñupiat of Alaska
The U.S. government pursued a policy of assimilation towards Alaska Natives through schools
and missions [38]; teachers were encouraged to change the Iñupiat traditional practices and the
children were to be taught in the English language rather than in Iñupiaq [1]. The Iñupiaq were to
be “civilised” and Christianity continued to be a powerful theme throughout the history of
Alaskan indigenous education [44]. In the early 1950s a relocation programme encouraged
Native Americans to leave their communities and settle in urban areas, and educational boarding
schools were set up to train indigenous primary school graduates in practical arts and sciences.
Until the late 1970s school facilities on Alaska’s North Slope were available only up to ninth
grade and high school students had to attend boarding schools far from home [1]. Since then high
schools have been established in rural villages, where Iñupiaq language and culture are
incorporated in the curriculum [1]. However, the Iñupiaq language is challenged by increasing
English language dominance in the public sphere [3]. The discovery of oil at Prudhoe Bay
initiated the negotiations of indigenous land claims which in turn formed the basis of today’s
political organisations and the passing of the Alaska Native Claims Settlement Act (ANCSA) of
1971. ANCSA transferred fee simple title to settlement lands to new for-profit corporations
owned by Alaska Natives. ANCSA also extinguished aboriginal hunting and fishing rights and it
failed to address the question of indigenous governance or sovereignty. However, ANCSA
constituted another form of self-determination by giving Alaska Natives the opportunities for
economic advancement and hence a measure of political power [45]; this has been used to
support cultural and social measures contrary to the assimilationist objectives of the settlement
[45, 46].
2.1.2.The Inuit of Greenland
In 1979 Greenland was granted Home Rule. Today Greenlanders elect a Parliament, enact their
own laws and have full autonomy in all matters except for foreign and security policy, judicial
20
and financial matters. Autonomy was further expanded in 2009. Greenland’s economy has since
WWII increasingly become dependent upon commercial fishing, which represent 90% of the
region’s export income (in 2000) [3]. The economy is however dependent upon subsidies from
Denmark which amount to about 50% of public spending and export of fish and related products
in Greenland [3, 41]. As among the Iñupiat, there are regional disparities in personal income and
between Greenlanders and the non-indigenous inhabitants [41]. In the years leading up to Home
Rule, the Greenlanders experienced a period of profound change over which they felt little
control. Danish modernisation programmes of the 1950s and 1960s included shutting down many
small settlements so that residents there could become workers in fish-processing plants in larger
communities. During this period, the use of the Greenlandic language suffered at the expense of
Danish, which was emphasised in school teaching as a means to assimilating the Greenlandic [3].
2.1.3.The Sami of Norway
The traditional Sami settlement area in Norway is characterised by a variety in Sami population
structure, language situation and traditions. Reindeer husbandry and the combination of small-
scale fishing and agriculture have traditionally been the economic backbone in Sami communities
[47-49]. To this day these means of livelihood remain essential for the Sami economy, culture
and language. Like other indigenous peoples, the Sami have been exposed to great pressure of
colonisation and assimilation; from about 1850 the Norwegian government intensified their
minority policy; motivated by Social Darwinist and national romantic ideologies, the government
launched several initiatives whose endpoint was to assimilate the Sami and Kven populations
[50]. The efforts were first and foremost focused on the areas bordering Russia and Finland and
coastal Sami areas of Northern Troms and Finnmark [47, 49-51]. By the last half of the 19th
century Sami language was already in retreat from Ofoten and southwards [52]. Education
became the central stage of this policy; Sami language was banned in schools, and boarding
schools were set up as a means to remove Sami children from their cultural and linguistic
surroundings [2, 53]. Additional initiatives were also executed within several areas, and
Norwegianisation has later become the term referring to the various actions carried out in an
effort to assimilate the High North and its populations [50].
21

Compared with the Sami population of Inner Finnmark, the coastal Sami were more susceptible
to the government policy of assimilation. From 1835 to 1900 the total population in Finnmark
tripled, which can partly be explained by the authorities’ wish for a larger Norwegian population
in the county; legal amendments were passed to assimilate the Sami and increase immigration to
Finnmark. A large number of Norwegians settled in coastal Sami areas as fishers and farmers and
the coastal Sami soon became a minority in their traditional settlement areas [49]. Furthermore,
by the late 1800s and early 1900s the coastal Sami were rapidly being overpowered by the market
economy as the fishing fleet became increasingly mechanised [47, 54, 55].
The evacuation of the coastal population to the south at the end of WWII, coupled with the
intense modernisation process and structural changes in the workforce of post-war years, put
further pressure on the Sami language and culture [47, 49]. In coastal Sami areas, the proportion
employed in primary industries decreased, with a corresponding increase in the number of
workers in secondary and tertiary industries. Poor recruitment to the primary industries continues
today. New jobs were primarily found in local administrative centres, which were usually
dominated by ethnic Norwegians. The structural changes had an unintended effect; the
Norwegian-dominated administrative centres on the coast were strengthened while the Sami
communities were weakened in terms of job opportunities and resources. The changes in
employment opportunities did not only affect the settlement structure and the workforce in the
Sami communities, they also affected Sami culture and language. The new jobs in the public
sector and service industries were based on the Norwegian language and culture and to a large
extent staffed by monolingual Norwegians. These developments have thus resulted in a decrease
in settings where the Sami language dominates [49]. Tana and Nesseby are exceptions to the
general trend for Sami coastal communities, having managed to keep a stable fjord fishing fleet
in this period [56] and a relatively large proportion of Sami-speaking individuals. Nevertheless,
overall the number of registered fishers and production units in agriculture has decreased
dramatically since WWII. Less activity in Sami fjord fishing and agriculture has led to a
reduction in social settings where Sami language and culture have a natural place [49].
Most residents of Kautokeino, Karasjok, Nesseby and Tana were not evacuated to the south at the
end of the war [57], and were thus not subjected to the influences of Norwegian language and
22

culture to the same degree. However, the changes in the workforce experienced in the minority
areas were also seen initially in the majority areas. In a study of Karasjok from 1970, Aubert and
Mook [58] found that the new jobs that became available in the post-WWII years were by and
large staffed by the minority group of Norwegians. However, the pro-Sami movement of the
1960s and governmental policy changes were able to reverse this trend. Growing Sami awareness
was also instrumental in realising the building of Sami institutions in Karasjok and Kautokeino in
the 1970s [59]. These municipalities were also, together with Nesseby, Tana and Porsanger,
included from the start in the designated area of the Sami Development Fund (introduced in
1975) and the Sami Language Administrative Area (effectuated in 1992). The initial actions to
revitalise Sami language and culture generally took place in these areas [49].
Despite the overall strengthening of Sami language, culture and primary industries in Norway
since the 1970s, a growing Sami civil society today is perhaps more obvious in the majority area
than in the minority area; the establishment of important Sami institutions inland (e.g. the Sami
Parliament, Sami High School, Sami Research Centre, and Sami radio, newspapers and
museums) revitalised and strengthened the Sami language and culture. In the 1990s, several
culture and language centres were established both inland and at the coast. However, the majority
of institutions were formed inland (such as the Sami University College, Sami Theatre and
various resource centres). Furthermore, in terms of health care, specialist services such as
cardiology and psychiatry incorporating Sami culture and language are provided inland [60]. All
the institutions mentioned have been efficient tools to counter outmigration as they have provided
important services to the public and to some extent replaced the jobs lost in the primary
industries, as well as providing employment for young Sami with a university education and
fluency in the Sami language. In contrast, the minority areas are suffering from a strong
outmigration. The strengthening of the interior Sami areas has contributed to their growth and has
created a modern Sami society with various important functions for its population [49].
Nevertheless, while coastal Sami agriculture and fjord fishing are clearly struggling, the majority
areas have also seen problems such as continued pasture encroachments and difficulty in
recruiting personnel to reindeer husbandry. Also, tendencies towards adopting the Norwegian
language were apparent even in Karasjok and Kautokeino in the post-war years [49].
23

2.2. Cardiovascular disease and self-rated health, and their social determinants
The major factors that influence ethnic disparities in health are culture, environmental quality and
protection, and social, educational and economic status, and lifestyle factors; genetic factors
influence outcomes to a minor extent and only a small number of diseases are caused by genetic
factors [61]. Self-rated health and cardiovascular disease are both considered important public
health indicators [62].
Acculturation is for indigenous peoples [63] related to the process of colonisation over centuries
[5]. Being one of the most cited definitions [64], Redfield, Linton and Herskovits [65] define
acculturation as “those phenomena which result when groups of individuals having different
cultures come into continuous first-hand contact, with subsequent changes in the original culture
patterns of either or both groups” (p. 149). In health research the concept of acculturation has
usually been applied to assess the health effects resulting from contact between people belonging
to different ethnic groups; but the concept has also shown to be useful in exploring health
implications among people subjected to rapid modernisation and subsequent social and cultural
change [66]. As described by Turi [67], Berry [68, 69] and Sam [64] argue that individuals and
minority groups can choose among four different strategies in the process of acculturation. They
can be motivated either to assimilate (reject their own culture and participate in the new culture),
be culturally integrated (participate in both cultures), to be separated from it (reject the new
culture and maintain their heritage culture) or reject both cultures, which is called marginalisation
(p. 10). In this way, marginalisation and the other strategies may be perceived as dimensions of
acculturation. For some, the process of acculturation is assumed to cause acculturative stress and
thus contribute to producing health differences; integration is assumed to be associated with the
best psychosocial outcome among the four strategies [67]. The acculturation theory has however
been criticised for lacking consistency in study designs. Lack of consistency in results is also a
concern as the literature reflects that acculturation can have either positive or negative health
effects or no relationship at all. A further criticism of the acculturation theory is that it is
ethnocentric in nature; the theory rests on the assumption that it fits all contexts and all ethnic
groups [67].
24

The association between acculturation, determinants of health status, and health status is
conceptually thought to be mediated by health care use and health behaviours [70]. A relationship
between marginalisation and depression/anxiety was found in a study among rural Sami
adolescent males [71]. Similarly, in Greenland it was found that better mental health status was
associated with growing up in a town and being fully bilingual, as opposed to growing up in a
small village and only speaking Greenlandic [72]. Spein et al [73] found that more assimilated
Sami adolescents reported more smoking and drinking compared with less assimilated Sami
peers. Wolsko et al found that among Alaska Yup’ik, higher levels of acculturation was
associated with greater psychosocial stress, less happiness, and greater use of drugs and alcohol
[74, 75]. Wexler reports a relationship between loss of traditional knowledge, alcohol abuse, and
low education attainment among Iñupiat in Northwest Alaska [76]. Several studies have observed
a relationship between acculturation and CVD in immigrant groups [77]. All these studies
operationalised acculturation differently.
Although numerous studies have explored how acculturation is related to various health
outcomes, it still remains unclear how acculturation may be related to self- health (SRH)
[70]. As summarised by Hansen et al [78], even after a variety of physical, sociodemographic
and psychosocial health status indices are controlled for [79], SRH significantly predicts
mortality and morbidity and subsequent use of health services [80]. In sum, SRH conceptually
functions as a composite measure of mental and physical health [70], and becomes thus a
relevant variable in primary health care and in general public health assessments and monitoring
[81]. Recent studies have found acculturation to promote good SRH in Puerto Rican and
Hispanic populations in the US [70, 82].
Self-rated health (SRH) has in a number of studies been linked with cardiovascular disease
morbidity and mortality. In 2005, the World Health Organization projected that 60% of the
deaths worldwide would be caused by chronic diseases [83]. The top four chronic diseases are:
cardiovascular disease, cancer, chronic respiratory disease and diabetes [83]. CVDs are the
number one cause of death globally; one third of all global deaths is due to CVD [83]. This is
also the case in Norway (2008) [84]. On average, every fourth GP patient has CVD related
25

problems in Norway. In addition to these patients is the growing number of individuals at risk of
developing CVD [85]. It is thus safe to say that physical and mental strain, discomfort and
symptoms due to prevalent CVD represent a substantial part of people’s self-assessment of
health. Several studies support this; after controlling for conventional risk factors and several
potential confounders, Møller et al [86] found poorer SRH to be strongly and independently
associated with fatal and non-fatal IHD. Tibblin et al. [87] observed an association between SRH
and myocardial infarction, heart failure, and stroke. Angina pectoris affects a patient’s perceived
health, physical and psychosocial capacity, enjoyment and wellbeing [88]. Maeland and Havik
[89] found a reduction in SRH after myocardial infarction. In another study, Idler reported that
angina pectoris, heart attack, and stroke influenced patient’s perceived health [90]. Johnson and
Wolinsky [91] found a relationship between IHD and poor SRH. Among women with suspected
myocardial ischemia, self-rated health predicted major CVD events independent of demographic
factors, CVD risk factors, and angiogram-defined disease severity [92]; functional impairment
however seemed to explain much of the self-rated health association.
Only limited data are available explaining the relationship between biological processes relevant
to CVD and self-rated health. A strong association between inflammatory cytokines and poor
SRH [93-95] has been found and a consistent relationship between HDL cholesterol and good
SRH has been reported in the Oslo health study [96]. Todorova et al [82] found high allostatic
load to be significantly correlated with poor SRH after adjusting for a number of confounders.
Furthermore, a recent study among Canadian Inuit found associations between poor self-rated
health and CVD related biomarkers [97]. Another recent study found a significant relationship
between poorer self-rated health and increasing prevalence of stroke, ischaemic heart disease and
dyslipidaemia [98]. Idler et al. [99] compared the relationship between self-ratings of health and
mortality in various groups; within a healthy sample, there was no adjusted mortality hazard
difference between those with poor, fair, and good versus excellent self-rated health. Within the
circulatory system disorder group, adjusted mortality hazards for poor self-rated health
(compared to excellent) were higher for individuals with self-reported symptoms and history of
heart disease, and lower or absent for individuals newly diagnosed at the time of the physical
examination. Idler et al. thus concluded that the health and illness experience of a group
contributes to the quality of information in self-ratings.
26

Ischaemic heart disease and stroke are related to atherosclerosis. A strong relationship between
carotid atherosclerosis and atherosclerosis in the coronary arteries and the aorta has been
confirmed [100]. The first manifestations of atherosclerosis are the so-called fatty streaks, i.e. the
formation of cholesterol rich lesion build-up in the arteries. These gradually develop into
atherosclerotic plaques and stenosis which disrupts the blood flow through the arteries and causes
ischaemia (Figure 1) [101].
Figure 1. Science Photo Library, NTB Scanpix: http://ndla.no/nb/node/110181
Angina pectoris is a symptom of ischaemic heart disease (IHD) and reflects atherosclerotic build-
up in the coronary arteries that supply the heart with oxygen rich blood. Angina is accompanied
by discomfort located in the chest, jaw, shoulders or arms, usually experienced during physical
activity and abating within 10 minutes following cessation or use of nitro-glycerine [102].
27

Myocardial infarction (MI) is an acute coronary event most commonly caused by increasing
atherosclerotic build-up and atherosclerotic plaque rupture that interrupts blood supply to the
heart causing muscle damage or death [103]. The main risk factors for IHD are abnormal blood
lipids level, smoking, and high blood pressure, followed by diabetes, abdominal obesity and
physical inactivity [22]. The INTERHEART study have detected nine modifiable risk factors
which explain more than 95% of the population attributable risk (PAR) of acute MI among
women and men from all regions of the world (ApoB/ApoA-1 ratio, current smoking,
hypertension, diabetes, abdominal obesity, stress, physical activity, alcohol and high risk diet)
[104].
Stroke is a heterogeneous group of disorders and is classified into ischaemic stroke (cerebral
infarction) and haemorrhagic stroke. Cerebral infarction is the largest component (80-85%),
followed by primary intracerebral haemorrhage and subarachnoid haemorrhage [105]. The most
common cause of cerebral infarction is atherosclerosis in the pre-cerebral arteries [106]. High
blood pressure and cigarette smoking are the most important modifiable risk factors for stroke.
Serum cholesterol is positively associated with cerebral infarction, but not with intracerebral
haemorrhage [105].
Colonisation, ethnic discrimination, rapid modernisation and subsequent marginalisation are
increasingly being recognised as underlying factors in the development of ill health and
increasing chronic disease burden among indigenous peoples [107-109]. However, the
description of the epidemiological transition experienced among Arctic indigenous peoples
linking modernisation to a general shift from infectious diseases to chronic diseases in these
populations may be an oversimplification of the process; to perceive indigenous peoples as
helpless victims of modernity is to underestimate their possibility of independent and rational
choice. Even in situations of inferior power relations, people take initiative, make decisions and
strive to make the best of a challenging situation [110]. One may thus argue that a characteristic
of a vibrant culture is the ability to incorporate new technology and other elements which follow
from modernisation [111]. The trend of an epidemiological transition among Arctic indigenous
peoples is nevertheless evident; but instead of attributing this change to modernisation and a
subsequent change in lifestyle alone, one must rather ask why people choose to adopt elements of
28

lifestyles associated with ill health. Why individuals at risk of IHD or with a IHD diagnosis
would not take the necessary behavioural steps to eliminate the disease indicates an issue of
motivation or stress [112].
Marginalised individuals or groups of people are often subjected to inequity due to their social
status or “group memberships” [113]. This may again result in exclusion from economic, social
and political means of promoting personal health and well-being. Whole societies can be
marginalised at the global level while classes and communities can be marginalised from the
dominant social order. Similarly, ethnic groups, families or individuals can be marginalised in
particular localities [114]. Implicit for many indigenous peoples in this situation is increased
exposure to chronic and acculturative stress [5, 7]. Acculturative stress may be perceived as a
response to life events associated with acculturation and/or marginalisation [66]. However,
acculturation as a concept represents a simplification of the process to which it is referring, as
described above [115]. I am thus becoming increasingly sceptical towards using acculturation as
a concept and predictor of health and disease. Acculturation is nevertheless referring to complex
social processes that may be associated with increased stress and subsequent health effects.
An extensive and growing body of literature acknowledges chronic stress as a causal factor in the
development of ischaemic heart disease and other atherosclerotic manifestations, as well as in the
development of hypertension and metabolic disturbances which fuel the atherosclerotic process
[116]. However, biological stress responses do not act in isolation, but in combination with a
number of genetic, physiological and lifestyle risk factors [117]. Stress responses arise when
demands on people exceed their psychosocial resources or adaptive capacity [118]. Stress may be
acute and last for minutes to hours, or chronic, i.e. lasting for months to years [119]. Elements of
the biological response to stress that plausibly contribute to the progression of IHD are raised
blood pressure, reduced insulin sensitivity, increased haemostasis and endothelial dysfunction
[118]. Stress can also influence IHD risk indirectly by contributing to increased smoking, reduced
probability of smoking cessation, physical inactivity and exaggerated alcohol consumption. In
combination, these relationships suggest both direct and indirect mechanisms for the relationship
between chronic stress and IHD [118].
29

Figure 2 illustrates how some acute and chronic risk factors contribute to increasing the
probability of cardiac events. Triggers are defined as activities or stimuli that exacerbate the acute
physiological and pathophysiological processes that initiate cardiac events such as acute MI or
sudden cardiac death and stroke [118]. Triggers may include emotional stress, physical exertion,
exposure to air pollution, respiratory infection, heat and excessive alcohol consumption.
Triggering takes place against a background of advanced atherosclerosis, and is therefore rare in
people with little underlying IHD [118].
Figure 2. Acute and chronic risk factors combine to reach threshold for clinical cardiac events (myocardial ischaemia, myocardial infarction, arrhythmia) [120]. Republished with permission of Annual Review of Psychology, from Krantz, D.S. & McCeney, M., Annual Review of Psychology, 53, 341-369 (2002); permission conveyed through Copyright Clearance Center, Inc.
Epidemiological research is becoming increasingly focused on what Geoffrey Rose has termed
the causes of the causes; i.e. the social conditions driving the distribution of non-communicable
disease whether acting through unhealthy behaviours or through the effects of impossibly
stressful lives [121]. Brown et al [109] argue that exposure to many of the more important
cardiovascular risk factors at a group level is generated through social and behavioural factors
whose causation, persistence and reproduction are both complex and multi-layered. In the case of
30

indigenous peoples it is possible that these processes are both different from, and more complex
than, those that affect non-indigenous populations. Referring to several indigenous populations
they argue that there are temporal associations between the loss of traditional lifestyles and
culture and the adoption of Westernised lifestyles, with an associated increase in the prevalence
and sequelae of conventional risk factors for cardiovascular disease.
31

3 Aims of the thesis
The overall aim of this thesis is to assess the effects of acculturation and marginalisation on
health and measure the prevalence of cardiovascular disease in the rural Sami population of
Norway. The specific aims of the thesis are to:
a) Explore the relationship between acculturation and self-rated health in the Sami
population of Norway and Inuit populations of Alaska and Greenland.
b) Assess the relationship between marginalisation and prevalence of lifetime total
cardiovascular disease by minority/majority status in the Sami population of northern
Norway.
c) Measure the population prevalence of angina pectoris and explore potential ethnic
disparity in its distribution with regard to traditional risk factors in areas with both Sami
and non-Sami populations.
32

Tabl
e 1.
Dat
a so
urce
s
a The
Ros
e A
ngin
a Q
uest
ionn
aire
Pape
r I (
n=21
52)
Pape
r II
(n=
4027
)Pa
per
III (
n=15
,206
)
Proj
ect
The
SLiC
A st
udy
The
SAM
INO
R st
udy
The
SAM
INO
R st
udy
Stud
y de
sign
Cro
ss-s
ectio
nal
Cro
ss-s
ectio
nal
Cro
ss-s
ectio
nal
Too
lQ
uest
ionn
aire
-bas
ed in
terv
iew
Self-
adm
inis
tere
dqu
estio
nnai
re,
clin
ical
exa
min
atio
n
Self-
adm
inis
tere
dqu
estio
nnai
re,
cl
inic
al e
xam
inat
ion
Out
com
eSe
lf-ra
ted
heal
thSe
lf-re
porte
d lif
e-tim
e ca
rdio
vasc
ular
dis
ease
Self-
repo
rted
angi
na p
ecto
ris,
angi
na p
ecto
ris sy
mpt
oms
Mea
sure
men
tFi
ve-p
oint
Lik
ert i
tem
reco
ded
into
thre
e ca
tego
ries
Yes
/No
Yes
/No,
Tw
o-ite
m R
AQ
a
Mai
n ex
posu
reA
ggre
gate
acc
ultu
ratio
nM
argi
nalis
atio
n an
d Sa
mi
min
ority
/maj
ority
are
asC
ompa
rison
bet
wee
n di
ffere
nt
ethn
ic g
roup
sM
easu
rem
ent
Subs
iste
nce
scor
e &
lang
uage
abi
lity
Dic
hoto
mis
ed sc
ore
&
mun
icip
ality
Lang
uage
, eth
nic
back
grou
nd,
self-
perc
eive
d et
hnic
itySt
udy
popu
latio
nR
ural
Sam
i (N
orw
ay)
Urb
an/ru
ral K
alaa
llit (
Gre
enla
nd)
Rur
al S
ami (
Nor
way
)R
ural
Sam
i (N
orw
ay)
Rur
al n
on-S
ami (
Nor
way
)U
rban
/rura
l Iñu
piat
(Ala
ska)
33

4. Material and methods
4.1. Data sources and study population
This PhD project is based on two different population surveys, i.e. the SLiCA study and the
SAMINOR study.
4.2. Paper I
The sections in this chapter referring to the SLiCA study have been published elsewhere in a
somewhat modified form [122]. The principal method in all SLiCA countries was standardised
face-to-face interviews using a questionnaire (Appendix A). The SLiCA target population was
traditional settlements (Maps 1-3). The duration of each interview in Alaska, Greenland, and
Norway was approximately 1.5-2 hours, and the respondents were almost exclusively interviewed
in their homes. Most interviews in Greenland were conducted in Greenlandic. In Norway, a Sami
speaking interviewer was assigned to interviews where the interviewee preferred Sami; 45 of the
445 interviews were conducted in Sami. In Alaska, only the cue cards were translated.
A total of 797, 1440 and 788 persons were invited in Alaska, Greenland and Norway,
respectively (Table 2). Among these, 663 (83.2%), 1197 (83.1%) and 445 (56.5%) individuals
participated, respectively. A total of 135 participants in Greenland and 18 in Norway were
excluded due to non-indigenous backgrounds. Participation rates by age and sex are unavailable
in Norway and Alaska due to the sampling methods used.
Table 2*. Participation by region/countryCountry/region
Original sample
Total participants (%)
Indigenous sample
Indigenous participants (%)
Alaska 1151 797 663 (83.2)Greenland 1440 1197 (83.1) 1062Norway 788 445 (56.5) 427In Alaska non-indigenous persons were excluded prior to invitation. In Greenland and Norway, however, information on ethnic background was not known in advance. Thus, total participants include persons who did not report indigenous background. Of the 663 participants in Alaska, 67 in the Bering Strait and 2 in the Northwest Arctic reported exclusively Yupik background (data not shown). *Table adopted from Eliassen et al [122].
34

4.2.1.Alaska
Most of the Iñupiat communities can only be reached by boat and plane [123]. Interviewers
travelled by car within the regional centres while all respondents lived within walking distance in
the villages. Respondents were contacted by house visits and the interviewer gave a brief
description of the study to the person answering the door, and asked to speak to the person who
had the next birthday. If that person was not available, contact information (e.g. phone numbers)
would then be obtained and attempts made to contact the selected person. Those who failed to
attend scheduled interviews were contacted to reschedule.
Data collection took place from January 2002 to February 2003. In Alaska we did not have access
to the U.S. Census 2000 population lists. Thus, the sample frame consisted of four components,
i.e. regions and communities, blocks, housing units, and individuals. The sample is a probability
multi-stage sample [124]. The Iñupiat regions of Northwest Arctic (NA), North Slope (NS), and
Bering Strait (BS) were all selected in advance. In each of the three regions one started with two
strata, i.e. regional centres and villages. The regional centres of Kotzebue (NA), Barrow (NS),
and Nome (BS) were all included. Villages in Northwest Arctic and Bering Strait were sampled
and stratified as coastal or inland. All villages on the North Slope were included since there are
only eight. In the regional centres one applied a two-stage area probability sampling approach.
Firstly, a probability sample of blocks with probabilities proportionate to the number of Iñupiat
households was selected. Secondly, a probability sample of Inuit households in each sample
block was done. A local Innu colleague identified the Inuit households in the sample blocks.
Finally, Iñupiat adults within each sampled household were sampled according to the person with
the next birthday. We observed a bias in favour of females that was addressed as a final sampling
weight.
According to the U.S. Census 2000, a total of 4581, 3082, and 3505 persons lived in the regional
centres of Barrow, Kotzebue and Nome, respectively. The total population number in the villages
varied between 136 in Deering and 772 in Selawik [125]. In the villages the American
Indians/Alaska Natives (AIAN) make up close to 100% of the population. In Barrow, Kotzebue
35

and Nome 64%, 77%, and 59% of the population reported AIAN ethnicity, respectively. Here
and in the villages the AIAN category almost exclusively refers to people of Iñupiaq ethnicity.
36

Map
1. M
ap o
f Ala
ska
and
tow
ns/v
illag
es v
isite
d in
SLi
CA
. Des
igne
d by
Rod
Wol
sten
holm
e.

4.2.2.Greenland
In Greenland the towns and villages are isolated from one another and can only be reached by
boat or plane [126]. As in Alaska, cars were used for transport in the towns, while interviewers
could walk to interview appointments in the villages. Selected individuals were contacted and
invited to participate by phone. If contact was not established by phone, interviewers would
contact the person at home. Those not attending scheduled interviews were re-contacted and new
interviews were planned.
Data collection was performed from December 2003 to August 2006 by Statistics Greenland. The
project was later transferred to Ilisimatusarfik, the University of Greenland, in 2006.
The Greenlandic population may be divided according to place of birth, i.e. in or outside
Greenland. For the adult population, this variable roughly refers to an ethnic categorisation of
Greenlanders and Danes [127]. Based on the official regional division by Greenland Statistics,
eight municipalities and their main towns were selected in advance. The main towns were:
Nanotarlik, Qaqortoq, Paamiut, Nuuk, Aasiaat, Ilulissat, Upernavik and Tasiilaq. Villages were
chosen at random in the selected municipalities. In the selected towns and villages a random
sample of persons born in Greenland was drawn from the population register. As a minority of
Greenlanders live in small settlements of fewer than 500 inhabitants (17% in 2005) [41, 128], a
greater sample weight was given to this population [129]. In 2006 the total population in the main
towns varied from 1133 inhabitants in Upernavik to 14,583 in Nuuk, and in the villages from 47
in Saarloq to 404 in Kullorsuaq and Kuummiut [130]. In Greenland, town status is not
determined by population size but by the presence of the municipality headquarters, a hospital or
health centre, and a school [41]. The sampling in Greenland is also described elsewhere [129].
38

Map 2. Map of Greenland and towns/villages visited in SLiCA. Designed by Rod Wolstenholme.
3

4.2.3.Norway
Data collection was commenced by the Centre for Sami Studies, University of Tromsø, in 2003.
The study has been administered and run by the Centre for Sami Health Research since 2006. The
majority of the material was collected between June 2006 and June 2008 and a smaller amount
(n=67) in 2003. The areas included were chosen in advance, based on knowledge of Sami
settlement patterns.
Sami respondents in Finnmark were selected through the representative data base of the
SAMINOR study (see below). A random sample was drawn from the sample frame of all
SAMINOR participants in Kautokeino, Karasjok, and Nesseby who reported Sami ethnicity and
gave consent to be contacted in future studies. This method was unavailable in Sami settlement
areas south of Finnmark as permission to contact these participants was not obtained during
SAMINOR. Instead a non-probability snowball sampling technique [131, 132] was applied to list
Sami living in Sami settlement areas in Troms, Nordland and the Trøndelag counties. From this
sample frame random samples were drawn. This method was also applied in Finnmark to recruit
individuals in the youngest age strata, as SAMINOR only included participants aged 30 and 36-
79 years in 2003-2004. Sticking to a random sample became challenging in areas where the Sami
population is a minority and lives scattered across great distances. The South Sami area is one
such example. Due to funding issues, a scattered population structure and the few Sami living in
each community, we had to interview a certain number of persons in each place to reach an
adequate total number of completed interviews. Multi-stage probability sampling was not
possible for the same reasons. Except for Røros (N=5683), all the municipalities and
communities had fewer than 3000 inhabitants in 2008 [133].
All communities are accessible by car. In Norway invitation to participate in the study was
presented in two ways. Firstly, SAMINOR-sampled individuals in Finnmark received a letter of
invitation containing information on the study, a written consent form, and a return envelope
(Appendix A). The recipients were asked to return the signed consent form and provide their
telephone number. Those who consented were contacted by phone to schedule the time and date
for the interview. Those who did not return the consent form were tried contacted over the phone
if their telephone number was accessible. Secondly, south of Finnmark, people were invited by
40

phone only. During the phone conversation the study was presented and if preliminary consent
was obtained, time and place of the interview were agreed. Those who failed to attend scheduled
interviews were contacted by phone to reschedule.
Map 3. Map of Norway and municipalities visited in SLiCA and SAMINOR. Designed by Marita Melhus.
41

Figure 3. Study data in Paper I.
Total sampleN=3379
Attendedn=2305
Total participants in Paper I:n=2152
Excluded (n=153):Non-indigenous participants in Greenland (n=135) and Norway (n=18).
Invitedn=3025
Excluded (n=354):Non-indigenousindividuals in Alaska
42

4.2.4.Questionnaire
The core questionnaire consisted of four parts: the main questionnaire, three household charts
intended to facilitate responses to questions concerning household members, and a self-
administered questionnaire used for sensitive questions. The self-administered questionnaire was
not used in this study. Finally, cue cards were used to efficiently present respondents with
response choices. The core questionnaire was produced in collaboration with indigenous
representatives and field tested in all countries/regions. English was used as a common language
for questionnaire development. Country/region-specific questions were produced to address
issues, items and perspectives relevant to the respective country/region. All fieldworkers in
SLiCA were trained in interviewing techniques and procedures. An interview guide was
produced to optimise standardisation and training. In Norway and Greenland the core
questionnaire was translated into respectively Northern Sami and Kalaallisut (Greenlandic), while
only the cue cards were translated into Iñupiaq in Alaska.
The main questionnaire had the following main topics: 1) family, 2) language, 3) traditional
skills, 4) socioeconomic status, 5) health, 6) smoking, 7) housing and living conditions, 8) social
activities, 9) values, religion and spirituality and 10) the local community and environment. The
questions used in Paper I are found in Appendix A and are also listed in the paper.
In SLiCA, the respondents could report more than one ethnic backgrounds and Sami/Inuit
ethnicity was defined in Paper I as persons reporting Sami/Inuit ethnicity alone or in combination
with any other ethnicity. Information on ethnicity was gathered by reading the following: “In the
next set of questions, I’d like to ask about the people who currently live in this household (Hand
the respondent the household chart (Figure 4)). Here is what we call a household chart to help
complete this section. Starting with yourself, and then oldest to youngest, please tell me the first
names of each person currently living in your household. As you can see, for each person, I’d like
to know their relationship to you, their age, their gender, and what they consider their ethnic
background to be”.
Self-rated health was measured by the question: How would you describe your health in general:
Excellent, Very good, Good, Fair, or Poor? The labelling of categories varied somewhat in
43

Greenland, i.e. Very good, Good, Fair, Poor, Very poor. In Norway and Alaska the variable was
in the analyses coded: 0) Excellent, 1) Very good, 2) Good/Fair/Poor. In Greenland SRH was
coded: 0) Very good, 1) Good, 2) Fair/Poor/Very Poor. The consequence of this discrepancy is
discussed in detail in Paper I.
Established as essential Inuit and Sami culture values and identity markers, 12 standardised
ordered categorical variables (G1: a, b, c, d, f, g, h, i, k, l, n, o) measuring the importance
(0=Very important to 3=Not at all important) of certain traditional subsistence activities
(Appendix A), were chosen to measure acculturation. The items were selected in advance as they
were considered relevant in all three countries. A score ranging from 0 to 36 was produced by
adding the 12 variables, from which respective score averages were generated.
Spoken indigenous language ability (SILA) was included as language represents an integral part
of a person’s cultural identity [1]. In the analyses, SILA was dichotomised due to small sample
sizes; and as distributions differed, the variable was dichotomised differently. The question was:
How would you rate your ability to speak Inuit/Sami? In Norway and Greenland the recoding
was: 0) Very well, 1) Relatively well/With effort/A few words/Not at all. In Alaska the variable
was dichotomised into: 0) Very well/Relatively well 1) With effort/A few words/Not at all.
Figure 3 illustrate how the data file was prepared prior to the analysis.
44

Figure 4. Household chart.
4.3. Papers II and III
The SAMINOR study was designed as a cardiovascular screening study and was conducted in
2003-2004. The study was conducted by the Centre for Sami Health Research in collaboration
with the Norwegian Institute of Public Health. Its overall aim was to explore possible differences
in cardiovascular health and living conditions in areas with both Sami and non-Sami populations.
The participants are of Sami, Kven and Norwegian descent. The defined SAMINOR area
included municipalities and settlements which in the 1970 Census had 5-10% Sami population
density. Additionally, some census wards with a lower density were included as updated
ethnographic data showed a substantial Sami population. The study included five counties:
Finnmark, Troms, Nordland, Nord-Trøndelag and Sør-Trøndelag. With the exception of Alta
45

(N=17,000), the number of inhabitants in each included municipality and settlement
(Map 3) [11, 34].
In 2003, eligible inhabitants were born between 1925 and 1967 and in 1973. In 2004, residents
were included if born between 1925 and 1968 and in 1974. This generated age intervals of 30 and
36-78 years in 2003, and 30 and 37-79 years in 2004. A total of 27,987 persons were invited and
16,865 (60.3%) participated [11, 34].
The SAMINOR study included three questionnaires. The Centre for Sami Health Research
designed a two-page initial questionnaire (Q1) and an additional questionnaire consisting of four
pages (Q3). The Norwegian Institute of Public Health performed the screening, which included a
three-page questionnaire (Q2) and a clinical examination. The clinical examinations took place in
two buses travelling between the municipalities. The survey was launched in Finnmark in Tana,
Nesseby, Karasjok and Kautokeino. Here people received a letter of invitation containing the Q1.
Those who agreed to attend the screening returned the questionnaire to the Norwegian Institute of
Public Health. These later received an invitation to the clinical examination and the Q2. After the
consultation the participants were asked to complete the Q3 [11, 34].
Due to initial low response rates in these four municipalities, the study design was modified
somewhat. In the rest of the survey, the invitation with the time and date for the clinical
examination was sent together with a five-page questionnaire (the Q1 and Q2 combined). In
Finnmark and Troms, those who did not attend the first screening received a reminder prior to the
return of the buses; and participants in Tana, Nesseby, Karasjok and Kautokeino, who attended
the physical examinations and did not complete the Q1, received a short questionnaire concerning
language and ethnicity in the spring of 2006; only 106 of the 322 posted short questionnaires
were completed and returned. No reminder was sent in Nordland and Trøndelag. Different
response rates may be due to the varying procedures described. In Finnmark 63% attended, while
the response rates in Troms and Nordland were 60% and 46%, respectively. With no reminder,
however, the Trøndelag counties reached a response rate of 65% [11, 34].
46
4.3.1.Questionnaires
The initial questionnaire (Q1) included these main topics: 1) use of health and care services, 2)
injuries and accidents, 3) language and ethnicity, 4) socioeconomic status, 5) bullying and
discrimination, 6) smoking and tobacco use and 7) physical activity. The screening questionnaire
(Q2) had the following main questions: 8) current and/or previous disease, 9) mental health, 10)
family history of disease, 11) use of medication and 12) diet and alcohol consumption. The
additional questionnaire (Q3) included the following items: 13) various symptoms, 14) additional
questions concerning diet, 15) upbringing, family constellation and religion, 16) values and 17)
value questions specifically for those with Sami background [11, 34].
The questions measuring ethnicity were checked for consistency and missing values at the
physical examination. All questionnaires and the informed consent were available in the Sami
and Norwegian languages. The Sami questionnaire was translated by a professional and tested on
a few individuals; for some questions the lack of equivalent terminology in the Sami language
made certain items challenging to translate [11, 34]. However, only 1.6% of the participants
chose to use the Sami version of the questionnaire.
Ethnicity was ascertained by asking questions (Figure 6) concerning the language used at home,
ethnic background and self-perceived ethnicity. Based on these variables we generated two ethnic
categories, i.e. Sami and non-Sami. The Sami category included respondents reporting at least
one Sami identity mark (Sami language spoken by the respondent or at least one parent or
grandparent, or Sami ethnic background or self-perceived Sami ethnicity) while Norwegians and
Kvens were included in the non-Sami group. In Paper II the non-Sami group was excluded from
the analyses [11, 34].
Self-reported lifetime cardiovascular disease was measured by three questions: Do you have, or
have you had: “Myocardial infarction (heart attack)? (Yes/No)”, “Angina pectoris (heart cramp)?
(Yes/No)”, or “Cerebral stroke/brain haemorrhage (Yes/No)”? Missing values in Paper II (MI:
n=133; Angina pectoris: n=130; Cerebral stroke/brain haemorrhage: n=140) were considered
negative responses. In Paper III, missing values were also considered as negative responses
47

(n=636). Angina pectoris symptoms (APS) were measured by the following questions: 1) Do you
get pain or discomfort in the chest when walking up hills or stairs, or walking fast on level
ground? (Yes/No) and 2) Do you get such pain or discomfort even if you are resting? (Yes/No).
We defined APS as a positive response to the former and a negative one to the latter [134].
Missing values (n=526 and n=2240, respectively) were considered negative responses.
In Paper II, marginalisation was measured by asking the following three questions: Do you feel
you are being forced from your work/trade?: “To a large extent”, “To some extent”, “To a small
extent”, “Absolutely not”. Using the same response options, the second question was: Do you feel
that modern development displaces the Sami culture? The third and final question was: Have you
experienced bullying/discrimination due to your ethnic (Sami, Kven, Russian, Tamil, Norwegian,
etc.) background?: “Many times”, “Sometimes”, “Rarely”, “Never”. After recoding, the items
were combined in a score ranging from 0–9 which based on its distribution was dichotomised
into “unexposed to marginalisation” (scores 0–3) and “exposed to marginalisation” (scores 4–9).
Missing values were given the value “0” (null), provided that information was given on at least
two of the three variables. Where the information supplied was from fewer than two variables,
the data were coded as missing (n=262).
The laboratory analysis and anthropometric measurements are described in detail by Lund et al
and Nystad et al [11, 135]. Figure 5 illustrate how the data file was prepared prior to the analysis
in Paper II and III.
48

Figure 5. Study data in Papers II and III.
Total sampleN=28071
Invitedn=27987
Attendedn=16968
Total participantsn=16538
n=15237
Excluded (n=430):Participants = 30 years (n=328)No consent (n=102)
Excluded (n=1301):Missing initial questionnaire(n=207)Missing main questionnaire (n=785)Recent immigrants (n=257)Missing information onethnicity (n=52)
Excluded (n=11210)Missing additional questionnaire(n=2118)Norwegian ethnicity (n=7741)Kven ethnicity (n=998)Missing > 1 marginalisation question (n=262)Narvik/South Sami (n=91)
Excluded (n=31):Missing medical examination
Participants in Paper II:n=4027
Participants in Paper III:n=15206
Excluded (n=84):Deceased (n=62)Duplicated (n=19) Not included (n=3)
49

*Figure adopted from Lund et al. [34].
Figure 6.* Questions on language and ethnic background.
In Northern Norway there live people of different ethnic backgrounds. That is, they
speak different languages and have different cultures. Examples of ethnic background, or
ethnic groups are Norwegian, Sami and Kven.
What language do/did you, your parents and your grandparents use at home?
Norwegian Sámi Kven OtherMother’s father
Mother’s mother
Father’s father
Father’s mother
Father
Mother
Myself
What is your, your father’s and your mother’s ethnic background?
Norwegian Sámi Kven OtherMy ethnic background is
Father’s ethnic background is
Mother’s ethnic background is
Norwegian Sámi Kven OtherI consider myself
50

4.4. Statistical analyses
Data management and statistical analyses were performed using STATA version 12.0 (Paper I)
and 12.1 (Papers II and III) (StataCorp, College Station, TX). The significance level was chosen
at p<0.05. The statistical procedures are described in the respective papers. Post-estimation tests
of model fit were performed. In paper I, as sample sizes were small, multiple imputation (MuI)
was performed to improve precision. The complete regression model was applied throughout the
imputation process. Wald tests of regression parameters showed no evidence of systematic
differences between imputed and non-imputed data (data not shown).
4.5. Ethical aspects
In Norway, the SLiCA study was accredited by the Norwegian Social Science Data Service and
the National Committee for Research Ethics in the Social Sciences and the Humanities. In Alaska
the study was approved by the University of Alaska Institutional Review Board. In Greenland
approval from the Research Ethics Committee in Greenland was not obtained because this is
routinely only required for medical research projects. Being responsible for data collection,
Statistics Greenland guaranteed an ethical handling of individual data and that rules and
regulations ensuring confidentiality for respondents were followed.
Representatives of the Inuit Circumpolar Conference, the Sami Council, and the Russian
Association of Indigenous Peoples of the North have formed advisory boards to oversee the
SLiCA study [136]. Indigenous steering committees approved the final questionnaire [32].
Detailed information on the project was given to the participants orally and in writing, and
written informed consent was obtained before interviews took place. We obtained written
informed consent from parents or legal guardians before respondents under the age of 18 years
took part in the study (Appendix A).
The SAMINOR study was approved by the Regional Committee for Medical and Health
Research Ethics in Northern Norway and a Sami consultant did not have any objection. The
National Data Inspectorate gave permission to store the data material. All attendees gave signed
51

informed consent. The participants were asked whether the information they provided and/or
their blood samples could be used in future research (Appendix B).
52

5. Summary of results
5.1. Paper : Acculturation and self-rated health among Arctic indigenous peoples: a population-based cross-sectional study
In this study we explored how acculturation, operationalised as a score of Inuit and Sami culture
values and identity markers, and spoken indigenous language ability (SILA), was associated with
SRH by gender among the Iñupiat of Alaska, Kalaallit of Greenland, and Sami of Norway.
Acculturation significantly predicted poorer SRH in Greenland, and the relative effects of
acculturation were stronger for men than for women, though this modification of effects was not
significant (data not shown). An increased acculturation score gave an OR of 2.32 (P<0.001) for
reporting poorer SRH among Greenlandic men, while an increased score for Greenlandic women
generated an OR of 1.71 (P=0.01). Poorer SILA produced an OR of 1.59 in men (p=0.03) and
1.43 in women (p=0.07). In Alaska, no evidence of acculturation effects was detected among
Iñupiaq men. Among Iñupiaq women, an increased score represented increased odds of 73%
(p=0.026) for reporting poorer SRH. No significant effects of acculturation were detected in
Norway. However, SILA was close to significant (p=0.068) among Sami men, thus suggesting a
substantial effect of acculturation on SRH (OR=1.74).
Overall, no modifying effect of the subsistence score by levels of SILA was detected (data not
shown). Furthermore, we found no evidence of education confounding or modifying the effect of
acculturation (data not shown).
This study shows that aggregate acculturation is a strong risk factor for poorer SRH among the
Kalaallit of Greenland and female Iñupiat of Alaska, but our cross-sectional study design does
not allow any conclusion with regard to causality. However, limitations with regard to wording,
categorisations, assumed cultural differences in the conceptualisation of SRH, and confounding
effects of health care use, SES and discrimination, make it difficult to appropriately assess the
streangth of this effect. Acculturation is indeed a process that takes place over time; longitudinal
research and large samples are therefore required to examine the effect of acculturation on SRH
53

within multiple dimensions among these populations, while simultaneously exploring how SES
may play into this relationship.
5.2. Paper : Marginalisation and cardiovascular disease among rural Sami in Northern Norway: a population-based cross-sectional study
The primary objective of this study was to assess the relationship between exposure to
marginalisation and self-reported lifetime cardiovascular disease (CVD) by minority/majority
status in the rural Sami population of Norway. In this paper, CVD was used as an indicator of
overall health in the indigenous people of northern Norway.
No difference between the exposed and unexposed groups in the total burden of CVD was found
in women. Among men, a significant difference (p=0.02) was found among Sami settled in
Norwegian dominated areas (Sami minority areas). In the unexposed group, 10.0% reported
having ever had cardiovascular disease compared to 15.8% in the exposed group.
The regression showed a significant effect of exposed minority status when compared to
unexposed majority status (OR 2.19, 95% CI: 1.53-3.15). This effect continued after controlling
for confounding and intermediate variables (OR 2.10, 95% CI: 1.40-3.14). A moderate
confounding effect of leisure-time light physical activity was observed. Without the variable in
the model, the OR was attenuated to 1.83 (data not shown). The regression was not stratified by
sex, as initial analyses showed no significant sex difference (data not shown). Moderate to no
intermediate effects were seen after including established CVD risk factors, which suggests little
difference in lifestyle related factors. Chronic stress exposure following marginalisation may
however be a plausible explanation for some of the observed excess of CVD.
5.3. Paper : Ethnic difference in the prevalence of angina pectoris in Sami and non-Sami populations: the SAMINOR study
The primary objective of this study was to assess the relationship between ethnicity and the
prevalence of angina pectoris symptoms (APS) in the rural population of northern Norway by
54

using a two-item version of the Rose angina questionnaire (RAQ). If differences were found
between Sami and non-Sami populations, we aimed at evaluating the role of established
cardiovascular risk factors and educational attainment as mediating factors for such differences.
We also measured the burden of self-reported angina pectoris alone and in combination with the
RAQ. In this paper, angina pectoris was used as an indicator of overall health in the study
populations.
Overall ethnic differences in prevalence were found in men and women for angina pectoris
symptoms (APS), self-reported angina and a combination of these (p<0.001), and a pattern of
higher estimates in the Sami population was revealed in nearly all age strata in both men and
women. The combined burden of angina pectoris was 8.3% and 11.7% in non-Sami and Sami
men, respectively. In women, the rate for non-Sami was 6.2% and for Sami 9.0%.
Odds ratios (OR) for angina pectoris symptoms (APS) including all cases of self-reported angina
in Sami women were 1.42 (p<0.001) and in men 1.62 (p<0.001) after controlling for age (Model
1). When also controlling for moderate alcohol consumption (Model 2), no change was observed
in men, while in women the OR was reduced to 1.35 (p<0.01). Metabolic syndrome, total
cholesterol, use of statins, family history of cardiovascular disease and smoking explained little
or none of the relationship between APS and ethnicity (Model 3). When self-reported angina was
included in the model as a covariate, little difference was observed in men. In women, however,
the relationship between ethnicity and APS was attenuated (OR 1.21) and became insignificant
(p=0.08).
This study showed that the excess burden of APS was in Sami women principally due to known
cases of angina pectoris. In men, however, the discrepancy in prevalent angina symptoms may be
due to an excess burden of undiagnosed disease among the Sami which suggest that social
determinants play a role in the distribution of APS in this population.
55

6. Discussion
6.1. Methodological considerations
The cross-sectional design does not allow any causal inference; results from SLiCA and
SAMINOR can however generate new hypotheses that can be tested in prospective studies. As a
variable in itself, ethnicity is rarely a source of causal knowledge but is directly or indirectly
related to factors such as culture, socioeconomic status, diet, lifestyle, access to and concordance
with health care advice, and stress [61]. Thomas Hylland-Eriksen[137] defines ethnicity as…. “an
aspect of social relationship between persons who consider themselves as essentially distinctive
from members of other groups of whom they are aware and with whom they enter into
relationships. It can thus also be defined as a social identity…” (p.16-17). Ethnicity is socially
construed; it does not refer to “objective” cultural differences but rather to the social
communication of cultural differences. What constitutes a relevant ethnic difference may vary.
Criteria for what cultural differences are made relevant by people, i.e. what constitutes ethnicity,
may be classifications based on skin colour, clothing, economic adaptation, religion, language or
combinations of these [110].
The aim of any epidemiological study is to be valid. Validity is usually assessed with regard to
both the internal and external validity of the study. Internal validity indicates that the results are
correct for the sample of people being studied. An externally valid study can be generalised to
some other groups who were not actually studied [138]. Epidemiological studies are usually
hampered with two types of errors, i.e. systematic errors and random errors. Systematic errors,
i.e. bias, are errors that affect comparison groups unequally [139]. Bias may be introduced
through the ways individuals have been selected (selection bias), the way study variables have
been measured (information bias) or some confounding factor that is not completely controlled
[140]. Random errors affect the reliability of the measurements and the precision of the estimate.
These can be avoided by increasing the sample size [140].
Also, sensitive questions tend to produce comparatively higher non-response rates or larger
measurement error in responses than questions on other topics [141]. Sensitive questions may be
defined as being intrusive and invasive. Sensitive questions may also involve the threat of
56

disclosure; individuals may be concerned about the possible consequences of giving a truthful
answer should the information be revealed to a third party. A third aspect of question sensitivity
is closely related to the traditional concept of social desirability, i.e. the extent to which a
question elicits answers that are socially unacceptable or socially undesirable. Sensitive questions
are thought to affect three important survey outcomes: a) overall response rate, b) item non-
response rates and c) response accuracy, i.e. the percentage of respondents who answer the
question truthfully (information bias) [141].
In a recent PhD thesis [142] it was reported that Sami speaking persons in Finnmark prefer not to
speak about health and disease. To speak openly of these matters is regarded as disparaging and
diagnostic disease concepts are perceived as condemning. Local concepts that describe health and
disease are considered milder. Health and disease are issues approached indirectly and in silence
and there are also strong norms of independent coping among the Sami. Differences in how body
and disease are conceptualised, i.e. how illness is operationalised, may produce problems when
Sami patients experience the Norwegian health care system. I believe that these are issues that
may also affect results and participation in population-based epidemiological studies.
Body, health and disease are cultural phenomena; there is no universal connection between a
medical condition and the way it is experienced. It is thus useful to distinguish illness and disease
as related but opposing analytical concepts. The former refers to a patient’s experience of his or
her own symptoms, while the latter refers to the physician’s diagnosis [143]. People’s
experiences of body and disease vary as the concepts underlying these differ. Every life form or
cultural ordering generates concepts that shape experiences and self-perceptions. In some cultures
or societies body and disease are integrated into a cosmology wherein pain and wellness are
experienced differently from other cultures. Bodily experiences are conceptualised and dependent
upon culture; this does not mean that some people are without the ability to feel immediate
physical pain and react instantly to it; however, the experience and the subsequent
communication of this experience are culturally dependent. Our first experience of physical pain
is expressed authentically; we know that the baby feels pain or discomfort because it expresses it
through crying. The new-born only relates to the pain by crying as no other option exists; with
time, however, the child expresses discomfort through words, gestures etc. Our experiences
57

gradually and increasingly connect to concepts and language; and as we are gradually bounded
by our concepts, we thus become unable to access our original and authentic experiences [144].
Consequently, experiences, perceptions and communications of pain and wellness are contextual
and culturally constructed within realities constituted by their own logic.
The goal of standardised measurements is central to survey research and it has been considered
essential to keep the wording of questions constant across respondents [145]. But even the same
question may mean different things to different people which may produce bias. Culture
influences how information is processed and conceptualised [146] and meaning is by no means
determined by words alone [147]. These are issue that may influence both participation and
response accuracy in population studies.
6.2. Selection bias
Selection bias is present when individuals have different probabilities of being included in the
study sample according to relevant study characteristics, i.e. the exposure and the outcome of
interest [148]. This may generate biased prevalence estimates and distort the measure of the
association between exposures and the outcome studied.
6.2.1.Paper I
High overall participation rates were obtained in Greenland and Alaska, whilst a more
conventional rate was observed in Norway. Based on previous research [149] and the US Census
2000 [150, 151], few or no threats to validity are detected in the data from Alaska and Greenland.
This is explained by probability sampling and high participation rates.
A conventional participation rate and non-probability sampling may have introduced selection
bias in the Sami sample. Available literature stresses that person-to-person approaches usually
give higher participation rates than initial telephone contacts [124, 152]. The different methods
used in the recruitment phase may thus explain some of the observed discrepancy in participation
58

rates between the countries/regions. In Norway the participation rates in Finnmark were
systematically lower than the rates from Troms, Nordland, and Trøndelag (Table 5); the snowball
sampling may have led us to the more motivated respondents in these three counties.
The only information on Sami non-responders available to us is their sex and place of residence.
Nevertheless, it has been documented that the differences between responders and non-
responders generally are important but seldom so great that studies are irrevocably undermined
[139].
The Sami sample is a non-probability sample [122]. Those invited were not chosen at random;
we cannot rule out the possibility that our participants differ systematically from the population
we want our sample to reflect [153, 154]. Selection bias is generally a problem if the priority is to
describe the distribution of variables in the population [155]. In Paper I the objective was not to
present the distribution of SRH in the population but instead to explore the relationships between
health and indicators of sociocultural change. Nonetheless, any association may well be biased if
the study participants have a different distribution of confounding factors than the non-
participants (see Chapter 6.3) [155]. Preliminary assessments suggest, however, that selection
bias in the Sami sample is plausible but not a major threat when comparing educational
attainment with SAMINOR data.
59

Table 3*. Participation by region and town/village in Alaska, n = 663.Town/village/Region Sample Participants Participation
rate (%)Anaktuvuk Pass 15 10 66.7Atqasuk 11 11 100Barrow 122 100 82.0Kaktovik 16 13 81.3Nuiqsut 20 16 80.0Point Hope 30 26 86.7Point Lay 11 11 100Wainwright 34 25 73.5North Slope totals 259 212 81.9Deering 27 20 74.1Kivalina 22 20 90.9Kotzebue City 142 106 74.6Noorvik 23 21 91.3Selawik 22 21 95.5Shungnak 23 16 69.6Northwest Arctic totals 259 204 78.8Brevig Mission 21 21 100Koyuk 23 20 87.0Nome City 164 144 87.8Savoonga 28 25 89.3Stebbins 21 19 90.5Unalakleet 22 18 81.8Bering Strait totals 279 247 88.5
*Table adopted from Eliassen et al [122]
60

Table 4*. Participation by region and town/village in Greenland, n = 1197 Town/village/region Sample Participants Participation
rate (%)Qaqortoq 80 76 95.0Nanortalik 73 67 91.8Alluitsup Paa 38 29 76.3Tasiusaq (Nan) 8 7 87.5Aappilattoq (Nan) 14 11 78.6Saarloq 4 4 100.0Eqalugaarsuit 13 13 100.0South Greenland totals 230 207 90.0Paamiut 78 56 71.8Nuuk 481 382 79.4Arsuk 24 20 83.3Kapisillit 16 15 93.8Qeqertarsuatsiaat 63 54 85.7Mid Greenland totals 662 527 79.6Ilulissat 118 111 94.1Aasiaat 101 40 39.6Kitsissuarsuit 9 8 88.9Akunnaaq 10 7 70.0Ilimanaq 4 4 100.0Oqaatsut 3 3 100.0Qeqertaq 12 11 91.7Saqqaq 16 11 68.8Disko Bay totals 273 195 71.4Upernavik 25 25 100.0Kangersuatsiaq 37 37 100.0Innaarsuit 19 19 100.0Nuussuaq (Upernavik) 17 14 82.4Kullorsuaq 55 55 100.0North Greenland totals 153 150 98.0Tasiilaq 53 53 100.0Isortoq (Tas) 10 10 100.0Kulusuk 14 13 92.9Kuummiut 27 25 92.6Sermiligaaq 18 17 94.4East Greenland totals 122 118 96.7
*Table adopted from Eliassen et al [122]
61

Table 5*. Participation by municipality and county in Norway, n = 445.Municipality/Region Sample Participants Participation
rate (%)Kautokeino 192 99 51.6Karasjok 207 99 47.8Nesseby 81 46 56.8Finnmark totals a 480 244 50.8Kåfjord 84 51 60.7Gratangen 12 8 66.7Lavangen 12 4 33.3
Skånland/Evenes b 26 22 84.6Troms totals a 134 85 63.4Vassdalen c 5 3 60.0Tysfjord 72 43 59.7Grane/Majavatn 15 10 66.7Hattfjelldal 27 24 88.9Nordland totals a 119 80 67.2Snåsa 21 15 71.4Røros 34 21 61.8Trøndelag totals a 55 36 65.5
a The four northernmost counties in Norway. Trøndelag is in this table a joint category of the two counties Nord-Trøndelag and Sør-Trøndelag.b Evenes is located in the northernmost part of Nordland County. The Evenes Sami, however, are of the same people as the neighbouring Skånland Sami.c Vassdalen is a small community in the Municipality of Narvik.*Table adopted from Eliassen et al [122].
6.2.2.Papers II and III
The participation rate of 61% could have introduced non-response bias. The SAMINOR study
was announced as a cardiovascular screening which may have inspired the more health conscious
to participate; the observed prevalence rates of CVD may thus be underestimated. It is also
possible that the subjects participated because of a higher risk for cardiovascular disease since the
study was described as focusing on this particular group of diseases. Consequently, our
participants may contribute to either a higher or lower estimate of the burden of disease and
exposures in the population. It is difficult to assess the direction of the selection bias while we
lack information on the non-participants’ ethnicity, risk profile and disease status [11]. However,
62

if motivation for participating in SAMINOR was dependent upon ethnicity, the observed effect
measures may have been biased, either away from or toward the null.
We do not know the overall response rate by ethnicity but it is possible that the overall response
may be lower in the Sami population than in the non-Sami as health and disease issues may be a
more delicate subject in the former. Approximately 40% of the invited cohort did not participate.
Responders are often healthier and differ in lifestyle compared with non-responders [156]; the
observed difference between Sami and non-Sami in Paper III may thus be due to an alleged
higher response rate in the latter group. We are however able to assess if item non-response rates
differ by ethnicity among those who participated in SAMINOR. With regard to self-reported
angina and angina pectoris symptoms, we found no significant difference in the distribution of
item non-response when comparing Sami and non-Sami (data not shown). This may indicate that
the overall response rates would not necessarily differ.
63

Table 6. Characteristics of the invited cohort, participants and the sub groups analysed in the SAMINOR study.
a Participants completed at least one questionnaire or attended the clinical examination.b Participants in Narvik, Hattfjelldal and Grane were excluded.
Invited (%) Participants (%)a Ethnicity (%) Paper (%) Paper (%) Participants (n) 27,151 16,538 16,267 4027 15,206Attendance (%) 100 60.9 59.9 14.8 56.0Sex
Women 13037 (48) 8553 (52) 8413 (52) 2013 (50) 7884 (52)Men 14114 (52) 7985 (48) 7854 (48) 2014 (50) 7322 (48)
Age36-49 10748 (40) 6040 (37) 5955 (37) 1502 (37) 5488 (36)50-64 10534 (39) 6966 (42) 6852 (42) 1692 (42) 6443 (42)65-79 5869 (22) 3532 (21) 3460 (21) 833 (21) 3275 (22)
CountyTrøndelag 1501 (6) 984 (6) 973 (6) Excluded 963(6)Nordland 2605 (10) 1205 (7) 1203 (7) 119 (3)b 1188 (8)Troms 6556 (24) 3938 (24) 3921 (24) 921 (23) 3856 (25)Finnmark 16489 (61) 10411 (63) 10170 (63) 2987 (74) 9199 (61)
Marital statusSingle 6472 (24) 3202 (19) 3137 (19) 948 (24) 2847 (19)Married 15175 (56) 10259 (62) 10099 (62) 2356 (59) 9519 (63)Widow(er) 1826 (7) 1066 (6) 1040 (6) 226 (6) 978 (6)Divorced 3054 (11) 1704 (10) 1688 (10) 426 (11) 1584 (10)Separated 623 (2) 307 (2) 303 (2) 71 (2) 278 (2)
EthnicitySami 5796 (36) 4027 (100) 5187 (34)Kven 1176 (7) Excluded 1137 (8)Norwegian 9023 (55) Excluded 8882 (58)Foreigner 272 (2) Excluded Excluded
Education0-7 years 2472 (17) 808 (21) 2453 (17)8-12 years 7370 (51) 1833 (48) 7270 (51)13+ years 4706 (32) 1170 (31) 4552 (32)
64

6.3. Information bias
Bias in a study can arise because the information collected about or from study subjects is
erroneous [140]. Such information is often referred to as being misclassified. Misclassification
can be differential or non-differential. In terms of outcome misclassification, non-differential
misclassification is present if it is unrelated to the exposure of interest. Exposure
misclassification is non-differential if the misclassification is not associated with the outcome
[140]. Non-differential misclassification tends to bias the association toward the null hypothesis,
while differential misclassification may bias the association either toward or away from 1 [148].
Recall bias resulting from inaccurate recall of past exposure is common in cross-sectional studies
and may cause differential misclassification as people with the disease of interest report
exposures differently from people without the disease[140]. Misclassification of disease status
with regard to self-reported cardiovascular disease (Yes/No) and Rose angina is an issue that has
been debated in the literature to a great extent (Chapter 6.3.2).
Language problems may have been an issue in both SLiCA and SAMINOR. As mentioned
above, in SLiCA, most interviews in Greenland were conducted in Greenlandic. In Norway, a
Sami speaking interviewer was assigned to interviews where the interviewee preferred Sami; 45
of the 445 interviews were conducted in Sami. In Alaska, only the cue cards were translated but
most Iñupiat speak English. We believe that any language difficulties are of little importance in
SLiCA.
In SAMINOR language difficulties may also be a source of bias. Many elderly Sami have
difficulty in reading and writing both Norwegian and Sami. As mentioned previously, the
questionnaire was translated. However, only 1.6% of the participants chose to use the Sami
version of the questionnaire. In this particular study, language problems were probably of little
importance in SAMINOR.
Stress was in Papers I and II discussed as contributing factors to ill health. However, stress was
not measure but rather assumed to be involved. Advancements in stress research have enabled the
65

use of multidimensional assessments of both stressor and stress response. Stress may be
measured by complex questionnaires or through biological parameters. Instruments have been
developed that differentiate major life stressors, stressful events that occur on a daily basis, and
stress experienced during the course of a given day. Advancements on the biological level have
had major impact in expanding the set of measurable biological parameters. In addition to these
newly emerged biological stress indices, there have been significant improvements in the
assessment of more traditional ones; classic stress hormones, such as cortisol and the
catecholamines, epinephrine and norepinephrine, are amenable to increasingly precise
measurements based on an expanded set of sources [157]. We were unable to quantify the impact
of stress in our studies as biological parameters and appropriate questionnaire items were lacking.
6.3.1.Paper I
Multiple imputation (MuI) was performed to improve precision. The goal of MuI is to use all the
available information in the observed data to estimate the most probable values of the imputed
data [158]. This method is assumed to be more valid than conventional ad hoc imputation
methods. By using MuI we have been able to improve the sample size in the final analyses as
well as minimising the probability of introducing information bias.
Interviewer bias is a form of observer bias. Interviewer bias may be a consequence of trying to
“clarify” questions when such clarifications are not part of the study protocol, failing to follow
the protocol-determined probing, or skipping rules of questionnaires [148]. All field workers in
SLiCA were trained in interviewing techniques and procedures, and an interview guide was
produced to optimise standardisation and training [122]. Interviewer bias is thus unlikely.
A recent review article concluded that SRH appears to be a valid measure for assessing health
and health related quality of life in a number of indigenous populations [159]. There are however
potential cultural differences in how SRH is conceptualised and the determinants that factor into
self-assessments of health [159]. In that respect, caution must be shown when comparing the
relative distribution of SRH among the Sami, Iñupiat and Greenlanders. We know from Bongo’s
[142] thesis that the Sami and Norwegians may conceptualises health and disease somewhat
66

differently. These differences may however be more distinct among the middle-aged and the
elderly. Contemporary Inuit concepts of health, illness and the body have been reported to differ
from the concepts of their respective national majority populations [160]. However, very little has
been published on these matters [160] and no studies are available on the conceptualisation of
SRH in the Sami, Iñupiaq and Greenlandic populations. Thus, what constitutes poor and good
health in these populations may differ, which in turn may produce non-differential
misclassification with regard to ethnicity of SRH in this study, i.e. that SRH does not necessarily
reflect the same amount of risk and morbidity in the three populations compared.
As mentioned in Chapter 2.2, using acculturation as a predictor of health outcomes has received
criticism. Social and or cultural change is a complex process affected by a number of factors
[161]; using it as a single exposure is in many ways a simplification of the process. SLiCA was
not exclusively and specifically designed for conducting acculturation studies and measure
acculturation strategies; we thus had to settle for a conventional scale-based analysis. When
survey researchers aim at quantifying and “measuring” culture, there is often a danger of
stereotyping it [115]; the questions used to operationalise acculturation may have measured
completely different elements in the three samples regardless of the strong internal consistency
observed (see Paper I). The fact that acculturation only significantly predicted poorer SRH in
three out of six strata may suggest poor validity.
Ethnicity
In addition to the self-reported method used to measure ethnicity, we used language ability as a
way of ascertaining ethnic belonging. The participants excluded from the analysis did not
indicate any Sami or Inuit affiliation whatsoever.
6.3.2.Papers II and III
In these two papers we used ad hoc methods for imputing missing dichotomous outcome values;
those missing were coded “no”, i.e. not having cardiovascular disease. This may have introduced
information bias. However, everyone included in the analyses had completed the questionnaires
67

and it is plausible that the participants only ticked the boxes of the diseases they actually had or
had ever had. After consulting colleagues in the department I have been informed that this trend
has also been observed in other population studies. We thus decided to use this imputation
method in Papers II and III. We did not perform sensitivity analyses with and without imputed
data in paper II as sample sizes in some of the strata were extremely small. However, sensitivity
analyses in Paper III showed no difference between imputed and non-imputed data. Given the
plausible assumption made and the result of the sensitivity analyses in Paper III, I believe that
misclassification of outcome data due to imputation in these papers is improbable.
Papers II and III are especially prone to recall bias; the outcome in these studies was CVD and
was known to the subjects. This may have produced systematically different answers in the two
groups that could have under- or overestimated the association between risk factors and CVD.
Based on the above, it is also plausible that the Sami respondents may have perceived the
questions about cardiovascular disease as more intrusive than the non-Sami and thus
underreported actual disease. In that case it is possible that our estimates in Paper III are biased
toward the null. However, previous research assessing non-response in sensitive questions has
reported that this is more of an issue in interview surveys than in self-administered
questionnaires. What seems to make a difference is whether the respondent has to report his or
her answer to another person [141]. We thus believe that a differential ethnic misclassification of
disease outcome is unlikely in SAMINOR.
Studies of stable angina pectoris (SAP) prevalence have used a number of measures and the rates
have varied between 0.73-14.4% [162]. To what extent these estimates reflect true differences or
limitations of the different measures used is unclear. Epidemiological studies have usually used
one of three approaches to measure SAP: documented clinical diagnosis, self-reported diagnosis
or screening for probable SAP [162].
Several screening tools have been developed. The gold standard for diagnosing clinically relevant
However, this method is invasive and includes potentially harmful contrast. Non-invasive
68

coronary angiography (e.g. MRI and multislice CT) may replace invasive methods if issues
related to radiation exposure, image resolution and cost are resolved [162].
Many population-based studies have used questionnaires to survey the self-report of an SAP
diagnosis. This approach is less costly and is useful when access to records is not possible.
However, the self-reported method cannot detect people with undiagnosed symptoms and is also
limited by recall bias. About 30% of cardiovascular disease events are misclassified by
respondents, and people tend to confuse myocardial infarction and angina [162].
The Rose angina questionnaire (RAQ) was developed in the 1960s as a screening tool to detect
SAP in population studies. Since then, many versions of the RAQ have been used to identify
chest pain or discomfort consistent with SAP. Rose defined SAP as having chest pain or
discomfort that fulfilled the following four criteria: 1) the symptoms are located in either the
sternum or in the left arm and left anterior chest wall, 2) the symptoms are provoked by hurrying
or walking uphill, or occur when walking on level ground if the person never attempts more, 3)
the symptoms are relieved by rest or glyceryl nitrate and 4) the symptoms disappear
minutes when standing still. These criteria closely approximate the clinical classification of
typical angina. The four criteria originally defined by Rose are often referred to as constituting
definite Rose angina. An alternative classification of exertional chest pain has been used for
people who fulfil the three latter criteria. This definition invites variation in the presentation of
SAP and is especially useful for women, who can experience angina discomfort differently from
men [162].
The validity of the RAQ is very much debated; its sensitivity, specificity, and positive and
negative predictive value have varied depending on the gold standard used. Its validity for
women, in particular younger women, has been especially questioned. In spite of this, the
literature is convincing and suggests that positive Rose angina predicts major ischaemic heart
disease in men and mortality associated with IHD in men and women. For studies of lifetime
prevalence of SAP, the RAQ in combination with confirmed diagnosis and self-report of ever
having received a diagnosis of SAP are preferable, because these measures will identify the
majority of people who have ever experienced symptoms of SAP at some time during the course
69

of IHD [162]. In Paper III we used this approach but without having access to confirmed
diagnoses.
In Paper III we used a two-item version of the RAQ which to my knowledge has not been
validated. On the basis of our review above, we can assert that the estimate of total angina burden
in the Sami and non-Sami populations is probably overestimated as the two-item version also
invites further misclassification of disease, since the given symptoms may reflect positive cases
of several other diseases than the ones mentioned, e.g. cancer and gastric ulcer [163, 164].
Chronic bronchitis and bronchial asthma may be reasons for positive RAQ outcomes [165, 166].
Graff-Iversen et al [167] found that angina measured with a three-item version of the RAQ was
linked with lung symptoms and increased mortality from pulmonary disease. We found no effect
on our point estimates when controlling for self-reported chronic
bronchitis/emphysema/obstructive pulmonary disease. It is nevertheless plausible to assume that
the symptoms refer in the majority of cases to angina.
In Paper II we used self-reported stroke, MI and angina as a measure of total CVD. The reported
accuracy of these self-reported diagnoses is inconsistent in the literature, but population studies in
northern Norway support agreement between self-reported MI and medical records [168, 169].
Utsi et al [13] found self-reported angina and MI among Sami in Finnmark to correspond well
with medical records and ECG. This may provide some support to the validity of the self-
reported data.
There is more uncertainty with regard to the validity of self-reported strokes. Patients often
confuse stroke with transient ischaemic attack [170]. In a postal survey in Finnmark [168] one
found considerable over-reporting of strokes (only 65.5% were verified), largely explained by the
phrasing of the question to include (TIA). In the Tromsø study [170], sensitivity of self-report for
a combination of semi-structured interview, clinical examination, hospital medical records and
and 79%, respectively. Tretli et al [169] found poor agreement between self-reported stroke and
medical records in the Finnmark population.
70

In light of this, and results from previous studies using comparable formulation of questions in
similar populations [13, 169, 170], we believe that our estimates are valid, given that our
ambition was to identify individuals who have ever experienced angina, MI and/or stroke/brain
haemorrhage. We did not use Rose angina in our angina estimates in Paper II; this may have
resulted in an underestimation of the angina prevalence. However, due to a somewhat small
sample size and the danger of false positive Rose angina (due to the two-item version available),
we decided not to include this info. Considerable effort was made to adjust for misclassification
in Paper III as the sample size was large.
Ethnicity
In Papers II and III Sami participants were identified if they reported at least one Sami identity
mark (Sami language spoken by the respondent or at least one parent or grandparent, or Sami
ethnic background or self-perceived Sami ethnicity). In Paper III sensitivity analyses were
conducted by dichotomising Sami ethnicity into Sami I (Sami language used as home language
by all grandparents, parents and the participant) and Sami II (at least one Sami identity mark, i.e.
Sami language spoken by the respondent or at least one parent or grandparent, or Sami ethnic
background or self-perceived Sami ethnicity). Additionally, sensitivity analyses with regard to
geography were done by performing the analyses separately for inland and coastal municipalities.
Thus, some misclassification of ethnicity is probable but does not represent a major threat. As
both self-reported and objective language criteria were used in all three papers, I believe that
Sami ethnicity is comparable in these studies.
6.4. Confounding, intermediate variables and interaction
The term confounding refers to a situation in which a non-causal association between a given
exposure and an outcome is observed as a result of the influence of a third variable (or group of
variables), usually termed as a confounding variable, or merely a confounder [148]. The essential
nature of this phenomenon can be stated as follows: the confounding variable is causally
associated with the outcome and non-causally or casually associated with the exposure, but is not
an intermediate variable in the causal pathway between the exposure and the outcome [148].
71

It is inappropriate to adjust for intermediate variables. Exceptions to this rule of thumb may be
made when one wishes to explore alternative mechanisms that could explain the association
between the exposure and the outcome of interest [148].
Stratification and adjustment are used to assess the presence of confounding. The former involves
assessing the exposure-outcome association within the strata of the presumed confounding
variable; if the association seen in the crude analysis has the same direction and magnitude as the
association seen within the strata of the confounding variable, then confounding due to this third
variable is unlikely. The latter method involves controlling or adjusting for the presumed
confounding variable. If the crude and the adjusted estimate are similar, confounding is unlikely
[148]. The confounder can explain all or some of the observed associations. A general rule of
thumb states that if a change in estimate > 10% occurs when the covariate is included in the
model, the covariate may be classified as a confounder.
Sex and age are well known confounders. In all three papers, we used stratifications by sex and
age. Multivariable analyses were also used in all three papers with possible confounders and
intermediate variables included as covariates in the model.
6.4.1.Paper I
The overall comparability in this study is somewhat reduced as the populations differ with regard
to living conditions and the distribution of general risk factors; comparing the associations
between acculturation and SRH may be flawed if the Inuit and Sami differ with regard to the
distribution of confounding factors. This may however be statistically corrected for by adjusting
for known and relevant confounding variables [155]. We have assessed and accounted for several
potential major confounders, but not all. We adjusted for age, education, smoking, chronic
physical or mental health problem, housing condition and living in village or town/living in
Finnmark or not. In Norway, we did not control for housing condition as it was no variation in
this variable. We controlled for these variables as they to a varying degree are associated with
SRH and acculturation, and as these associations may vary in strength between the countries.
72

Infectious disease is for example relevant among the Iñupiat and Greenlandic Inuit but not among
the Sami. Thus, housing condition which is an important living condition parameter is also
associated with infectious disease such as tuberculosis.
Access to health care also differs; all three populations are provided publicly funded health care
but the combination of public and private health care is more common in Alaska. Greenland has a
poor infrastructure and is the largest island in the world, covering 2,2 million km2, of which 90%
is covered by ice [126]. The available daily service ranges from consulting a health worker with
very limited formal health training in the smaller villages to consulting a specialist at the national
hospital in Nuuk. Telecommunication has severely improved health care delivery but health
service is hampered by difficulties in recruiting personnel [126].
Alaska has also substantial challenges to providing access to health care in its remote
communities. Sixty percent of Alaska’s indigenous people live in small villages of 20-1700
people scattered across about 1,5 million km2 [171]. In Alaska, the tribal system partially
addresses access with its network of community, regional and tertiary care providers, but
preventive care and early treatment of disease, as well as timely treatment of acute disease,
continue to be compromised [172]. A 2007 study found vacancy rates among primary care
providers of 20% or higher and nursing vacancy rates above 15% in rural Alaska [172]. This
shortage exacerbates the geographical challenges [172]. Culturally sensitive health care is also to
a lesser degree implemented in Greenland and among the Iñupiaq which may impact access.
In Norway, local municipalities provide primary care and GPs are based in local health centres
and serve specific geographic areas. For specialised care, a health centre physician may refer to a
hospital within the municipality or to a centralised hospital [171]. The infrastructure is
completely different from Alaska and Greenland as distances are small in comparison and all
municipalities are reachable by car. Sami culture sensitive health care is established to a certain
degree. Differences in health care were in the analyses tried handled by controlling for “living in
town or village”. However, residual confounding is plausible as described in Paper I.
73

In sum, comparison of health between these three populations is difficult whens considering what
is described above. The premise for good health is rather diverse. We believe however that the
directions of the associations, or the qualitative relationships, between acculturation and SRH are
comparable as we controlled for several confounding factors.
The peoples involved represent a wide variety of ways of life with unique histories, experiences,
communities and languages. These are issues that have been addressed in SLiCA and a joint
effort from involved researchers and indigenous representatives have maximised consistency of
meaning in the questionnaire. Standardisation in SLiCA was also possible as the indigenous
peoples involved share common concepts with regard to the role of household production, their
strong ties to the environment, and the continuing role of extended informal and formal social
relationships [32].
6.4.2.Papers II and III
In these papers we conceptualised the conventional risk factors as intermediate (explanatory)
variables as ethnicity is rarely a source of causal knowledge in itself [61].
In Paper II, we found that marginalised minority Sami were more physically active than non-
marginalised majority Sami, as the OR for CVD was attenuated from 2.10 to 1.84 when the
variable was removed from the model. One may argue that the variable is an intermediate
variable in that it explains and does not confuse the relationship between ethnicity and CVD.
Leisure-time light physical activity was more common in the minority area, which afforded some
protection to the Sami living there. Further analysis showed that this effect was independent of
marginalisation status and largely due to a generally higher level of leisure-time light physical
activity in the minority area compared with the majority area (data not shown).
In Paper III we were unable to explain any of the differences between non-Sami and Sami in
men. In women we found a small intermediate effect due to moderate alcohol consumption; the
proportion of abstainers was significantly higher in Sami than in non-Sami which reduced the OR
74

from 1.42 to 1.35. The inclusion of self-reported angina explained the entire relationship between
ethnicity and APS in women.
Interaction is present when two or more risk factors modify the effect of each other with regard to
the occurrence or level of a given outcome [148]. There are two methods for assessing
interaction, i.e. including an interaction term in regression models or by stratification. A
significant interaction term or significant difference in level of effects by stratification indicates
true effect modification. In Paper II we found that the effect of marginalisation on CVD was
dependent on majority/minority status; marginalisation as an exposure had no effect in areas
dominated by Sami ethnicity. Mechanisms that may possibly explain this are described in the
respective paper (Paper II).
6.5. External validity
As described by Nystad [11], external validity or generalisability in SAMINOR refers to whether
the general population in the defined SAMINOR area systematically differs from the population
in general in northern Norway, and whether those who participated in the study systematically
differed from those not included. We believe that our results can be generalised to the Sami and
non-Sami living in the rural areas of Finnmark, Troms and Trøndelag (Map 3). However, they
may be less valid for the population in Nordland due to the low response rate in this region.
The external validity in SLiCA is more troublesome. The Norwegian sample differs most likely
somewhat from the Sami population in general in the municipalities included in the study. The
samples from Alaska and Greenland have a high external validity as a result of probability
sampling and high response rates.
6.6. Statistical associations
In Papers I and II we were hampered with small sample sizes which reduced the precision in the
estimates. However, due to other methodological issues in Paper I, we assured the reader at an
early stage that comparisons of effect estimates were unwise. Precision in small samples is
75

affected by random error, i.e. variability in the data that we cannot explain [140]. Increasing
sample sizes tend to reduce the amount of random errors. Thus, in Paper III, where the sample
was large (n=15,206), precision was increased and we had the statistical power to detect potential
small differences between the groups.
Statistical inference involves making a generalisation about a larger group of individuals based
on a subsample of that group. Statistical significance testing assesses whether chance (random
error) may account for the observed results. The p-value is a measure of the strength of evidence
against the null hypothesis. The confidence interval also provides information about the strength
of evidence against the null hypothesis as well as the precision of the point estimates [140].
76

7. Brief discussion of main results and future research
The respective results are discussed in detail in Papers I-III. The following discussion is focused
on what the papers collectively add to the knowledge of indigenous population health in Norway
and in the circumpolar region. The methodological discussions revealed some limitations which
should be considered when interpreting the findings.
In Paper I we found that acculturation was associated with poorer self-rated health among
Greenlandic men and women and Iñupiaq women. A close to significant relationship was found
for poorer language ability and poorer SRH in Sami men. These results indicate that rapid
modernisation and a history of colonisation may be important when assessing the overall burden
of ill health in Arctic circumpolar populations. The null results observed among Iñupiaq men and
Sami men and women may be because our operationalisation of acculturation measured the
phenomenon poorly in these strata. Acculturation, marginalisation and stress are related concepts
(Chapter 2.2). Both chronic stress and SRH have in earlier studies been shown to predict
cardiovascular disease morbidity which is high in most circumpolar populations, including the
Sami of Norway.
The newly established cardiovascular disease registry at the Norwegian Institute of Public Health
will in the future also provide reliable data on the burden of cardiovascular disease in Sami areas.
The results in Paper III indicate an excess of angina pectoris in the Sami population compared
with the non-Sami population in Norway; in men, this may be due to underuse of health care
services by the Sami. However, the findings in Paper II suggest that marginalisation and
subsequent chronic stress may be an additional driving force influencing the population burden of
lifetime cardiovascular disease among the Sami. The results in these two papers shed light on
important social determinants of health in the Sami population of Norway that may be important
in explaining the distribution of chronic disease within the Sami population and possible
differences in disease burden compared with the non-Sami population in rural Norway. The
findings in Paper I also support further explorations of the social determinants of ill health in
other indigenous populations.
77

Although a vast body of research has provided important findings in the field of the social
determinates of health, this effort must be intensified. In terms of Sami health, it is the
responsibility of the Centre for Sami Health Research to show the way. This implies that social
determinants are reflected in research questions and in the design stage of future population
studies and that sufficient funds are allocated to this field of research.
78

8. Implications for future public health practice
This study has shown that some social determinants may be important in explaining population
distribution of health and chronic disease among three Arctic indigenous populations. The history
of these peoples and subsequent consequences may explain some of the burden of disease and ill
health on a population level. To reduce the health differences between indigenous peoples and the
respective national population to which they belong, authorities must also recognise the latent
factors that in part drive the levels of the main risk factors. Health intervention can be directed at
high risk individuals only or be applied to the entire population (population strategy). The largest
benefit has been obtained through the population strategy [138]. This study indicates that public
health initiatives may in indigenous areas also be combined with continued support for
indigenous languages and culture through legislation and financial support. The planning of
health promotion depends also on the manageability and efficiency of primary health care.
Within such a scheme is the need for culture sensitive primary and specialist health care based on
indigenous language. This must be solved in context specific ways among the Iñupiaq,
Greenlandic Inuit and Sami of Norway.
Previous research in SAMINOR has found small ethnic differences in risk factors for CVD. The
close interaction and similar standard of living between the ethnic subgroups might be the
explanation. It is likely that the mentioned lifestyle changes have occurred in all parts of the rural
population in northern Norway independently of ethnicity [11]. In Papers II and III we found
however a rather clear-cut disease pattern within the Sami population and between the Sami and
non-Sami population which understandably could not be explained by the conventional risk
factors. We have suggested that social determinants may play a vital role in disease distribution
in these populations. In the Sami population special attention must be given to factors associated
with marginalisation, and under-utilisation of health care services. The stability of GPs in the
primary health care service has been poor in many Sami districts. Recruiting Sami-speaking GPs
to these areas has proven difficult. Nystad et al [173] have reported higher dissatisfaction with
health care services among the Sami-speaking population compared with Norwegians. Language
competent and stable GP services, and further support of Sami language, culture and subsistence
economy may have positive public health ramifications. The scope of this study does not allow
79

any suggestions for possible public health initiatives aimed at the Iñupiaq and Greenlandic Inuit.
However, increased support of local economic adaptations, and cultural and linguistic
infrastructure may also be a sound long-term investment in improved public health in these
populations.
80

9. Errata
One mistake has occurred in Paper I with regard to the sample size from Alaska. This mistake has
occurred during the multiple imputation process.
Paper I. Sample from Alaska
The multiple imputation was conducted separately for men and women as described in Paper I;
the single observation with item-non response in sex was included both in the imputation among
the men and among the women. This is unfortunate but does not affect the overall results since
this concerns only one observation. The only practical implication is that the total sample size has
increased by one observation (n=664).
Sex Participants Paper I (Table 3)
Men 283 284
Women 379 380
Missing 1 0
Total 663 664
81

Literature
1. Chance N: The Iñupiat and Arctic Alaska: An Ethnography of Development. Fort Worth: Holt, Rinehart and Winston; 1990.
2. Minde H: Assimilation of the Sami: Implementation and Consequences. Kautokeino: Resource Centre for the Rights of Indigenous Peoples; 2005.
3. Caulfield R: The Kalaallit of West Greenland. In: Endangered peoples of the Arctic : struggles to survive and thrive. edn. Edited by Freeman M. Westport, Conn.: Greenwood Press; 2000: 167-186.
4. Csonka Y, Schweitzer P: Societies and Cultures: Change and Persistence. In: Einarsson N, Larsen JN, Nilsson A, Young, OR, editors. Arctic Human Development Report. In. Akureyri: Stefansson Arctic Institute; 2004: 45-68.
5. Kvernmo S: Indigenous peoples. In: The Cambridge Handbook of Acculturation Psychology. edn. Edited by Sam D, Berry J. Cambridge: Cambridge University Press; 2006: 233-250.
6. Shephard R, Rode A: The Health Consequences of "Modernization": Evidence from Circumpolar Peoples. Cambridge: Cambridge University Press; 1996.
7. Curtis T, Kvernmo S, Bjerregaard P: Changing living conditions, life style and health.International journal of circumpolar health 2005, 64(5):442-450.
8. Duhaime G: Economic Systems. In: Arctic human development report. edn. Edited by Einarsson N, Larsen J, Nilsson A, Young O. Akureyri: Stefansson Arctic Institute; 2004: 69-84.
9. Young TK, Bjerregaard P: Introduction. In: Health transitions in arctic populations.edn. Edited by Young TK, Bjerregaard P. Toronto [Ont.]: University of Toronto Press; 2008: 3-19.
10. Bjartveit K, Foss O, Gjervig T, Lund-Larsen P: The Cardiovascular disease study in Norwegian counties: background and organization. Oslo: Statens skjermbildefotografering; 1979.
11. Nystad T: A population-based study on cardiovascular risk factors and self-reported type 2 diabetes mellitus in the Sami population. Tromsø: University of Tromsø, Faculty of Health Sciences, Department of Community Medicine, Centre of Sami Health Research; 2010.
12. Westlund K: The Cardiovascular study in Finnmark 1974-75: Report no. 25. In.Oulu: Nordic Council for Arctic Medical Research; 1979: 195 p.
13. Utsi E, Bonaa K: [Coronary heart diseases among Lapps and Norwegians in Finnmark]. Tidsskrift for den Norske laegeforening : tidsskrift for praktisk medicin, ny raekke 1998, 118(9):1358-1362.
14. Njølstad I, Arnesen E, Lund-Larsen P: Cardiovascular diseases and diabetes mellitus in different ethnic groups: the Finnmark study. Epidemiology 1998, 9(5):550-556.
15. Thelle DS, Førde OH, Arnesen E: Distribution of high-density lipoprotein cholesterol according to age, sex, and ethnic origin: cardiovascular disease study in Finnmark 1977. Journal of epidemiology and community health 1982, 36(4):243-247.
16. Thelle DS, Førde OH: The cardiovascular study in Finnmark county: coronary risk factors and the occurrence of myocardial infarction in first degree relatives and in
82

subjects of different ethnic origin. American journal of epidemiology 1979, 110(6):708-715.
17. Førde O, Thelle D, Miller N, Mjøs O: The Tromsø heart study. Distribution of serumcholesterol between high density and lower density lipoproteins in subjects of Norse,Finnish and Lappish ethnic origin. Acta Med Scand 1978, 203(1-2):21-26.
18. Nystad T, Melhus M, Brustad M, Lund E: Ethnic differences in the prevalence ofgeneral and central obesity among the Sami and Norwegian populations: theSAMINOR study. Scandinavian journal of public health 2010, 38(1):17-24.
19. Brustad M: Helse i samisk befolkning - en kunnskapsoppsummering av publiserteresultater fra befolkningsundersøkelser i Norge. In: Samiske tall forteller 3 :kommentert samisk statistikk 2010. edn. Guovdageaidnu - Kautokeino, Norway: Sámiallaskuvla - Sami University College; 2010: 16-73.
20. Jenum A, Graff-Iversen S, Selmer R, Sogaard A: [Risk factors for cardiovasculardisease and diabetes through three decades]. Tidsskrift for den Norske laegeforening :tidsskrift for praktisk medicin, ny raekke 2007, 127(19):2532-2536.
21. Reikvam A, Hagen TP: Markedly changed age distribution among patientshospitalized for acute myocardial infarction. Scandinavian cardiovascular journal :SCJ 2002, 36(4):221-224.
22. Graff-Iversen S, Jenum AK, Grotvedt L, Bakken B, Selmer RM, Sogaard AJ: [Riskfactors for myocardial infarction, stroke and diabetes in Norway]. Tidsskrift for denNorske laegeforening : tidsskrift for praktisk medicin, ny raekke 2007, 127(19):2537-2541.
23. Klemstad TO: Hjerte- og karsykdomemrs epidemiologi, etablerte og nyererisikofaktorer. In: Kardiologi: klinisk veileder. edn. Edited by Forfang K, Istad H. Oslo:Gyldendal akademisk; 2011: 119-125.
24. Tverdal A: Cohort study of ethnic group and cardiovascular and total mortality over15 years. Journal of clinical epidemiology 1997, 50(6):719-723.
25. Tynes T, Haldorsen T: Mortality in the Sami population of North Norway, 1970-98.Scandinavian journal of public health 2007, 35(3):306-312.
26. Hassler S, Johansson R, Sjölander P, Grönberg H, Damber L: Causes of death in theSami population of Sweden, 1961-2000. International journal of epidemiology 2005,34(3):623-629.
27. Sjölander P, Hassler S, Janlert U: Stroke and acute myocardial infarction in theSwedish Sami population: incidence and mortality in relation to income and level ofeducation. Scandinavian journal of public health 2008, 36(1):84-91.
28. Luoma PV, Nayha S, Sikkila K, Hassi J: High serum alpha-tocopherol, albumin,selenium and cholesterol, and low mortality from coronary heart disease in northernFinland. Journal of internal medicine 1995, 237(1):49-54.
29. Luoma P, Nayha S, Hassi J: High serum concentrations of vitamin E and cholesteroland low mortality from ischaemic heart disease in northern Finland. Arctic medicalresearch 1995, 54 Suppl 2:26-28.
30. Bjerregaard P, Young TK, Dewailly E, Ebbesson SO: Indigenous health in the Arctic:an overview of the circumpolar Inuit population. Scandinavian journal of publichealth 2004, 32(5):390-395.
31. Bjerregaard P, Young TK, Berner J: Improving the health of Arctic populations. In:Health transitions in arctic populations. edn. Edited by Young TK, Bjerregaard P.Toronto: University of Toronto Press; 2008: 405-417.
83

32. Kruse J, Poppel B, Abryutina L, et.al.: Survey of Living Conditions in the Arctic(SLiCA). Social Indic Res 2009, 33:107-134.
33. Hansen K: Ethnic discrimination and bullying in relation to self-reported physicaland mental health in Sami settlement areas in Norway : the SAMINOR study.elektronisk ressurs. Tromsø: University of Tromsø; 2011.
34. Lund E, Melhus M, Hansen K, et.al.: Population based study of health and livingconditions in areas with both Sami and Norwegian populations--the SAMINORstudy. International journal of circumpolar health 2007, 66(2):113-128.
35. Reindriftsforvaltningen: Ressursregnskap for reindriftsnæringen: for reindriftsåret1.april 2003- 31.mars 2004. Alta: Reindriftsforvaltningen; 2005.
36. Reindriftsforvaltningen: Ressursregnskap for reindriftsnæringen : for reindriftsåret1.april 2010- 31.mars 2011. Alta: Reindriftsforvaltningen; 2012.
37. Arbeids- og velferdsforvaltninga (NAV)[http://www.nav.no/Om+NAV/Tall+og+analyse/Arbeidsmarked/Annen+arbeidsmarkedsstatistikk/Historisk+statistikk]
38. Berner J: Alaska. In: Health Transitions in Arctic Populations. edn. Edited by Young TK,Bjerregaard P. Toronto: University of Toronto Press; 2008: 53-70.
39. Krauss M: Native Languages of Alaska. In: The Vanishing Languages of the PacificRim. edn. Edited by Sakiyama O, Miyaoka O, Krauss M. Oxford New York: OxfordUniversity Press; 2007: 406-417.
40. Iñupiaq [http://www.uaf.edu/anlc/languages/i/]41. Bjerregaard P, Stensgaard T: Greenland. In: Health Transitions in Arctic Populations.
edn. Edited by Young T, Bjerregaard P. Toronto: University of Toronto Press; 2008: 23-38.
42. Solbakk J: Samene - en håndbok. [Karasjok]: Davvi girji; 2004.43. Pettersen T: Out of the Backwater? Prospects for Contemporary Sami Demography
in Norway. In: Indigenous peoples and demography the complex relation betweenidentity and statistics. edn. Edited by Axelsson P, Sköld P. New York: Berghahn Books;2011: 185-196.
44. Barnhardt C: A History of Schooling for Alaska Native People. Journal of AmericanIndian Education 2001, 40(1):30.
45. Huhndorf RM, Huhndorf SM: Alaska Native Politics since the Alaska Native ClaimsSettlement Act. S Atl Q 2011, 110(2):385-401.
46. Bankes N: Legal Systems. In: The Arctic Human Development Report. edn. Edited byEinarsson N, Larsen J, Nilsson A, Young O. Akureyri, Iceland: Stefansson ArcticInstitute; 2004.
47. Bjørklund I: Fjordfolket i Kvænangen : fra samisk samfunn til norsk utkant 1550-1980. Tromsø: Universitetsforlaget; 1985.
48. Gjerde A, Mosli J: Samiske næringers plass i samfunnsplanlegginga. Guovdageaidnu:Sámi instituhtta; 1985.
49. NOU: 2008: 5: Retten til fiske i havet utenfor Finnmark. In: Norges offentligeutredninger (NOU). Oslo: Departementenes servicesenter, Informasjonsforvaltning; 2008:569 s.
50. Eriksen K, Niemi E: Den finske fare : sikkerhetsproblemer og minoritetspolitikk inord 1860-1940. Oslo: Universitetsforlaget; 1981.
84

51. Evjen B: Giftermål, næring og etnisk tilhørighet 1850-1930. In: Nordlands kulturellemangfold: Etniske relasjoner i historisk perspektiv. edn. Edited by Evjen B, Hansen L.Oslo: Pax Forlag; 2008: 239-271.
52. Hansen L, Evjen B: Kjært barn - mange navn: Om forskjellige betegnelser på densamiske befolkningen i Nordland gjennom århundrene. In: Nordlands kulturellemangfold: Etniske relasjoner i historisk perspektiv. edn. Edited by Evjen B, Hansen L.Oslo: Pax Forlag; 2008: s. 17-47.
53. Nergård J-I: Når slutter en koloniprosess? In: Hvor går Nord-Norge? Tidsbilder fra enlandsdel i forandring. edn. Edited by Jentoft S, Røvik K, Nergård J-I. Stamsund: Orkanaakademisk; 2011: 119-128.
54. Eyþórsson E: Ressurser, livsform og lokal kunnskap: Studie av en fjordbygd iFinnmark. Tromsø: [E. Eythorsson]; 1991.
55. Høgmo A: Sjøsamisk fornorskning og revitalisering. In: Hvor går Nord-Norge?Tidsbilder fra en landsdel i forandring. edn. Edited by Jentoft S, Røvik K, Nergård J-I.Stamsund: Orkana akademisk; 2011: 129-138.
56. Andersen S: Marin ressursforvaltning, lokal kunnskap og bærekraftige samfunn inord. In: Hvor går Nord-Norge? Tidsbilder fra en landsdel i forandring. edn. Edited byJentoft S, Nergård J, Røvik K. Stamsund: Orkana akademisk; 2011: 257-268.
57. Finne Ø: Tvangsevakueringen. In: Krigen som aldri slutter: Krigstraumer i etlivstidsperspektiv Eksemplet Finnmark 1940-46. edn. Edited by Finne Ø. Karasjok: Davvigirji; 2005: 89-121.
58. Aubert V, Mook R: Flyttemønsteret og lokalsamfunnets struktur : en undersøkelse iKarasjok. Tidsskr Samfunnsfor 1970(11):S. 13-31.
59. Stordahl V: Same i den moderne verden : endring og kontinuitet i et samisklokalsamfunn. Karasjok: Davvi Girji; 1996.
60. Hassler S, Kvernmo S, Kozlov A: Sami. In: Health transitions in arctic populations. edn.Edited by Young T, Bjerregaard P. Toronto: University of Toronto Press; 2008: 148-170.
61. Bhopal RS: Ethnicity, race, and health in multicultural societies : foundations forbetter epidemiology, public health and health care. Oxford: Oxford University Press;2007.
62. European Commission - European community health indicators[http://ec.europa.eu/health/indicators/echi/list/]
63. ILO: Convention No. 169 International Labour Organization (ILO); 1989.64. Sam D: Acculturation: conceptual background and core components. In: The
Cambridge Handbook of Accultuiration Psychology. edn. Edited by Sam D, Berry J.Cambridge, UK.: Cambridge University Press; 2006: 11-26.
65. Redfield R, Linton R, Herskovits M: Memorandum for the study of acculturation. AmAnthropol 1936, 38:149-152.
66. Berry JW, Lonner WJ: Field methods in cross-cultural research. Beverly Hills: Sage;1986.
67. Turi AL: Internalizing symptoms and health service use in indigenous Sami and non-indigenous adolescents in Arctic Norway. [Tromsø]: Department of Psychology,Faculty of Health Sciences, University of Tromsø; 2011.
68. Berry J: Contexts of acculturation. In: The Cambridge handbook of acculturationpsychology. edn. Edited by Berry J, Sam D. Cambridge: Cambridge University Press;2006: 27-42.
85

69. Berry J: Stress perspectives on acculturation. In: The Cambridge handbook of acculturation psychology. edn. Edited by Sam D, Berry J. Cambridge: Cambridge University Press; 2006: 43-57.
70. Johnson KL, Carroll JF, Fulda KG, Cardarelli K, Cardarelli R: Acculturation and self-reported health among Hispanics using a socio-behavioral model: the North Texas Healthy Heart Study. BMC public health 2010, 10:53.
71. Kvernmo S, Heyerdahl S: Acculturation strategies and ethnic identity as predictors of behavior problems in arctic minority adolescents. Journal of the American Academy of Child and Adolescent Psychiatry 2003, 42(1):57-65.
72. Bjerregaard P, Curtis T: Cultural change and mental health in Greenland: the association of childhood conditions, language, and urbanization with mental health and suicidal thoughts among the Inuit of Greenland. Soc Sci Med 2002, 54(1):33-48.
73. Spein AR, Sexton H, Kvernmo S: Substance use in young indigenous Sami: an ethnocultural and longitudinal perspective. Substance use & misuse 2007, 42(9):1379-1400.
74. Wolsko C, Mohatt GV, Lardon C, Burket R: Smoking, chewing, and cultural identity: prevalence and correlates of tobacco use among the Yup'ik-The Center for Alaska Native Health Research (CANHR) study. Cultur Divers Ethnic Minor Psychol 2009, 15(2):165-172.
75. Wolsko C, Lardon C, Mohatt GV, Orr E: Stress, coping, and well-being among the Yup'ik of the Yukon-Kuskokwim Delta: the role of enculturation and acculturation.International journal of circumpolar health 2007, 66(1):51-61.
76. Wexler LM: Inupiat youth suicide and culture loss: Changing community conversations for prevention. Soc Sci Med 2006, 63(11):2938-2948.
77. Sam DL: Acculturation and health. In: The Cambridge Handbook of Acculturation Psychology. edn. Edited by Sam DL, Berry JW. Cambridge: Cambridge University Press; 2006: 452-469.
78. Hansen K, Melhus M, Lund E: Ethnicity, self-reported health, discrimination and socio-economic status: a study of Sami and non-Sami Norwegian populations.International journal of circumpolar health 2010, 69(2):111-128.
79. Eriksson I, Unden AL, Elofsson S: Self-rated health. Comparisons between three different measures. Results from a population study. International journal of epidemiology 2001, 30(2):326-333.
80. Syed HR, Dalgard OS, Hussain A, Dalen I, Claussen B, Ahlberg NL: Inequalities in health: a comparative study between ethnic Norwegians and Pakistanis in Oslo, Norway. International journal for equity in health 2006, 5:7.
81. Schou MB, Krokstad S, Westin S: [How is self-rated health associated with mortality?]. Tidsskrift for den Norske laegeforening : tidsskrift for praktisk medicin, ny raekke 2006, 126(20):2644-2647.
82. Todorova IL, Tucker KL, Jimenez MP, Lincoln AK, Arevalo S, Falcon LM: Determinants of self-rated health and the role of acculturation: implications for health inequalities. Ethnicity & health 2013.
83. Tunstall-Pedoe H: Preventing chronic diseases. A vital investment: WHO global report. In. Geneva; 2005: 200p.
84. Forfang K, Istad H: Forord. In: Kardiologi: klinisk veileder. edn. Edited by Forfang K, Istad H. Oslo: Gyldendal akademisk; 2011: 7-8.
86

85. Hansen Å, Kimsås A: Kardiologi i allmennpraksis. In: Kardiologi : klinisk veileder.edn. Edited by Forfang K, Istad H. Oslo: Gyldendal akademisk; 2011: 19-23.
86. Møller L, Kristensen T, Hollnagel H: Self rated health as a predictor of coronary heartdisease in Copenhagen, Denmark. Journal of epidemiology and community health 1996,50(4):423-428.
87. Tibblin G, Cato K, Svardsudd K: Gøteborg quality of life study of men born in 1913and 1923--age, sex, job satisfaction and cardiovascular diseases. Scandinavian journalof primary health care Supplement 1990, 1:39-45.
88. Wiklund I, Sanne H, Vedin A, Wilhelmsson C: Psychosocial outcome one year after afirst myocardial infarction. Journal of psychosomatic research 1984, 28(4):309-321.
89. Maeland JG, Havik OE: Self-assessment of health before and after a myocardialinfarction. Soc Sci Med 1988, 27(6):597-605.
90. Idler EL: Age differences in self-assessments of health: age changes, cohortdifferences, or survivorship? Journal of gerontology 1993, 48(6):S289-300.
91. Johnson RJ, Wolinsky FD: The structure of health status among older adults: disease,disability, functional limitation, and perceived health. Journal of health and socialbehavior 1993, 34(2):105-121.
92. Rutledge T, Linke SE, Johnson BD, Bittner V, Krantz DS, Whittaker KS, Eastwood JA,Eteiba W, Cornell CE, Pepine CJ et al: Self-rated versus objective health indicators aspredictors of major cardiovascular events: the NHLBI-sponsored Women'sIschemia Syndrome Evaluation. Psychosomatic medicine 2010, 72(6):549-555.
93. Unden AL, Andreasson A, Elofsson S, Brismar K, Mathsson L, Ronnelid J, Lekander M:Inflammatory cytokines, behaviour and age as determinants of self-rated health inwomen. Clinical science 2007, 112(5-6):363-373.
94. Lekander M, Elofsson S, Neve IM, Hansson LO, Unden AL: Self-rated health is relatedto levels of circulating cytokines. Psychosomatic medicine 2004, 66(4):559-563.
95. Christian LM, Glaser R, Porter K, Malarkey WB, Beversdorf D, Kiecolt-Glaser JK:Poorer self-rated health is associated with elevated inflammatory markers amongolder adults. Psychoneuroendocrino 2011, 36(10):1495-1504.
96. Tomten SE, Hostmark AT: Self-rated health showed a consistent association withserum HDL-cholesterol in the cross-sectional Oslo Health Study. Internationaljournal of medical sciences 2007, 4(5):278-287.
97. Saudny H, Cao Z, Egeland GM: Poor self-reported health and its association withbiomarkers among Canadian Inuit. International journal of circumpolar health 2012,71.
98. Yamada C, Moriyama K, Takahashi E: Self-rated health as a comprehensive indicatorof lifestyle-related health status. Environmental health and preventive medicine 2012,17(6):457-462.
99. Idler E, Leventhal H, McLaughlin J, Leventhal E: In sickness but not in health: self-ratings, identity, and mortality. Journal of health and social behavior 2004, 45(3):336-356.
100. Johnsen S: Repeated ultrasound measurements of carotid artery plaques in a general population : the Tromsø Study 1994-2001. Tromsø: Department of Community Medicine, University of Tromsø; 2005.
101. Istad H: Aterosklerose og lipidsenkende behandling. In: Kardiologi: klinisk veileder.edn. Edited by Forfang K, Istad H. Oslo: Gyldendal akademisk; 2011: 101-118.
87

102. Forfang K, Aaberge L: Stabil angina pectoris. In: Kardiologi: klinisk veileder. edn. Edited by Forfang K, Istad H. Oslo: Gyldendal akademisk; 2011: 150-162.
103. Aaberge L, Forfang K: Akutt koronarsyndrom. In: Kardiologi: klinisk veileder. edn. Edited by Forfang K, Istad H. Oslo: Gyldendal akademisk; 2011: 163-173.
104. Anand SS, Islam S, Rosengren A, Franzosi MG, Steyn K, Yusufali AH, Keltai M, Diaz R, Rangarajan S, Yusuf S et al: Risk factors for myocardial infarction in women and men: insights from the INTERHEART study. European heart journal 2008,29(7):932-940.
105. Mathiesen EB, Njølstad I, Joakimsen O: [Risk factors for cerebral stroke]. Tidsskrift for den Norske laegeforening : tidsskrift for praktisk medicin, ny raekke 2007, 127(6):748-750.
106. Forfang K, Istad H: Kardiologi : klinisk veileder. Oslo: Gyldendal akademisk; 2011.107. Daniel M, Lekkas P, Cargo M, Stankov I, Brown A: Environmental risk conditions and
pathways to cardiometabolic diseases in indigenous populations. Annual review of public health 2011, 32:327-347.
108. Sotero M: A conceptual model of historical trauma: Implications for Public Health Practice and Research. Journal of Health Disparities Research and Practice 2006, 1(1):93-108.
109. Brown AD, Morrissey MJ, Sherwood JM: Uncovering the determinants of cardiovascular disease among Indigenous people. Ethnicity & health 2006, 11(2):191-210.
110. Eriksen TH, Frøshaug OB: Små steder - store spørsmål : innføring i sosialantropologi,2. utg. edn. Oslo: Universitetsforl.; 1998.
111. Sejersen F: Arktiske folk som statister og aktører på den globale scene. Tidsskriftet Antropologi 1996(32):41-56.
112. Bekkouche N, Holmes S, Whittaker K, Krantz D: Stress and the Heart: Psychosocial Stress and Coronary Heart Disease. In: The Handbook of Stress Science Biology, Psychology, and Health. edn. Edited by Contrada R, Baum A. New York: Springer Pub. Co.; 2010: 385-398.
113. Taket A, Crisp B, Nevill A, Lamaro G, Graham M, Barter-Godfrey S: Theorising Social Exclusion. London: Routledge; 2009.
114. Kagan C, Burns D, Burton M, Crespo I, Evans R, K. K, Lalueza J, Sixsmith J: Working with People who are marginalized by the social system: challenges for community psychological work. In.; 2004.
115. Hunt L, Schneider S, Comer B: Should "acculturation" be a variable in health research? A critical review of research on US Hispanics. Social Science & Medicine 2004, 59(5):973-986.
116. Hjemdahl P, Rosengren A, Steptoe A: Preface. In: Stress and Cardiovascular Disease.edn. Edited by Hjemdahl P, Rosengren A, Steptoe A. London: Springer London; 2012: v-vi.
117. Steptoe A, Rosengren A, Hjemdahl P: Introduction to Cardiovascular Disease, Stress and Adaptation. In: Stress and Cardiovascular Disease. edn. Edited by Hjemdahl P, Steptoe A, Rosengren A. London: Springer London; 2012: 1-14.
118. Steptoe A, Kivimaki M: Stress and cardiovascular disease. Nature reviews Cardiology 2012, 9(6):360-370.
88

119. Dhabhar F: Effects of stress on immune function: implications for immunoprotection and immunopathology. In: The Handbook of stress science : biology, psychology, and health. edn. Edited by Contrada RJ, Baum A. New York: Springer; 2011: 47-63.
120. Krantz DS, McCeney MK: Effects of psychological and social factors on organic Disease: A critical assessment of research on coronary heart disease. Annual review of psychology 2002, 53(1):341-369.
121. Marmot M: Social determinants of health inequalities. Lancet 2005, 365(9464):1099-1104.
122. Eliassen BM, Melhus M, Kruse J, Poppel B, Broderstad AR: Design and methods in a survey of living conditions in the Arctic - the SLiCA study. International journal of circumpolar health 2012, 71:17229.
123. Understanding Alaska's remote rural economy [http://www.iser.uaa.alaska.edu/Publications/researchsumm/UA_RS10.pdf]
124. Bowling A: Research methods in health : investigating health and health services, 3rd edn. Buckingham: Open University Press; 2009.
125. Demographic Profiles. [http://censtats.census.gov/pub/Profiles.shtml] 126. Niclasen B, Mulvad G: Health care and health care delivery in Greenland.
International journal of circumpolar health 2010, 69(5):437-447. 127. Dahl-Petersen I, Bjerregaard P: Om undersøgelsen. In: Befolkningsundersøgelsen i
Grønland 2005-2007: levevilkår, livsstil og helbred. edn. Edited by Bjerregaard P, Dahl-Petersen I. Copenhagen: Statens Institut for Folkesundhed; 2008.
128. Bjerregaard P: Childhood conditions and education as determinants of adult height and obesity among Greenland Inuit. American journal of human biology : the official journal of the Human Biology Council 2010, 22(3):360-366.
129. Poppel B: Some data sources on people, peoples, communities, regions and human activities in Greenland. In: The Political Economy of Northern Regional Development. Volume 1, edn. Edited by Winther G. Copenhagen: Nordic Council of Ministers; 2010: 287-320.
130. Grønlands befolkning 1. januar 2006 [http://www.stat.gl/dialog/main.asp?lang=da&version=200601&link=BE&subthemecode=p2&colcode=p]
131. Ringdal K: Enhet og mangfold : samfunnsvitenskapelig forskning og kvantitativ metode. Bergen: Fagbokforl.; 2001.
132. The Research Methods Knowledge Base [http://www.socialresearchmethods.net/kb/sampnon.php]
133. Statistisk årbok 2008 [http://www.ssb.no/aarbok/2008/tab/tab-056.html] 134. Rose G, McCartney P, Reid D: Self-administration of a questionnaire on chest pain
and intermittent claudication. British journal of preventive & social medicine 1977, 31(1):42-48.
135. Nystad T, Utsi E, Selmer R, Brox J, Melhus M, Lund E: Distribution of apoB/apoA-1 ratio and blood lipids in Sami, Kven and Norwegian populations: the SAMINOR study. International journal of circumpolar health 2008, 67(1):67-81.
136. Andersen T, Kruse J, Poppel B: Survey of living conditions in the Arctic: Inuit, Saami and the indigenous peoples of Chukotka (SLICA). Arctic 2002, 55(3):310-315.
137. Eriksen TH: Ethnicity and nationalism anthropological perspectives, 3rd ed edn. London New York: Pluto Press : Distributed in the United States of America exclusively by Palgrave Macmillan; 2010.
89

138. Young TK: Population health : concepts and methods, 2nd edn. New York, N.Y.: Oxford University Press; 2005.
139. Bhopal R: Concepts of epidemiology : integrating the ideas, theories, principles and methods of epidemiology, 2nd edn. Oxford: Oxford University Press; 2008.
140. Rothman KJ: Epidemiology : an introduction. Oxford: Oxford University Press; 2002.141. Tourangeau R, Yan T: Sensitive questions in surveys. Psychol Bull 2007, 133(5):859-
883.142. Bongo BA: "Samer snakker ikke om helse og sykdom" : samisk forståelseshorisont
og kommunikasjon om helse og sykdom : en kvalitativ undersøkelse i samisk kultur.[Tromsø]: Universitetet i Tromsø, Det helsevitenskapelige fakultet, Institutt for helse- og omsorgsfag; 2012.
143. Ingstad B: Medisinsk antropologi : en innføring. Bergen: Fagbokforl.; 2007.144. Nergård J-I: Samisk pasienters møte med norsk helsevesen. In: Hvor går Nord-Norge?
Et institusjonelt perspektiv på folk og landsdel. Volume 2, edn. Edited by Jentoft S, Nergård J-I, Røvik KA. Stamsund: Orkana akademisk; 2012: 47-56.
145. Converse JM, Presser S: Survey questions / handcrafting the standardized questionnaire. Beverly Hills, Calif.: Sage; 1986.
146. Schwarz N, Oyserman D, Peytcheva E: Cognition, Communication, and Culture: Implications for the Survey Response Process. In: Survey Methods in Multicultural, Multinational, and Multiregional Contexts. edn. Edited by Harkness J, Braun M, Edwards B, et.al. Hobokeb, New Jersey: Wiley & Sons, Inc.; 2010: 177-201.
147. Harkness J, Edwards B, Hansen S, Miller D, Villar A: Designing Questionnaires for Multipopulation Research. In: Survey Methods in Multicultural, Multinational, and Multiregional. edn. Edited by Harkness J, Braun M, Edwards B, et.al. Hoboken, New Jersey: John Wiley & Sons Inc; 2010: 33-57.
148. Szklo M, Nieto FJ: Epidemiology : beyond the basics, 2nd edn. Sudbury: Jones and Bartlett; 2007.
149. Bjerregaard P, Pedersen C, Pedersen J: Livsbetingelser og levevilkår. In: Befolkningsundersøgelsen i Grønland 2005-2007 Levevilkår, livsstil og helbred. Edited by Dahl-Petersen I, Bjerregaard P. Copenhagen: Statens Institutt for Folkesundhed; 2008: 21-49.
150. Census 2000: P148C. North Slope census subarea, North Slope Borough, Alaska. Sex by educational attainment for the population 25 years and over (American Indian and Alaska Native alone) [17] [http://factfinder.census.gov/servlet/DTTable?_bm=y&-context=dt&-ds_name=DEC_2000_SF3_U&-CONTEXT=dt&-mt_name=DEC_2000_SF3_U_P148C&-tree_id=403&-keyword=north%20slope&-all_geo_types=N&-geo_id=06000US0218555970&-search_results=01000US&-format=&-_lang=en&-SubjectID=17498112.]
151. Census 2000: P148C. Northwest Arctic census subarea, Northwest Arctic Borough, Alaska. Sex by educational attainment for the population 25 years and over (American Indian and Alaska Native alone) [17] [http://factfinder.census.gov/servlet/DTTable?_bm=y&-context=dt&-ds_name=DEC_2000_SF3_U&-CONTEXT=dt&-mt_name=DEC_2000_SF3_U_P148C&-tree_id=403&-keyword=north%20slope&-all_geo_types=N&-redoLog=true&-_caller=geoselect&-geo_id=06000US0218856270&-search_results=01000US&-format=&-_lang=en&-SubjectID=17498112]
152. Hartge P: Participation in population studies. Epidemiology 2006, 17(3):252-254.
90

153. Bjørndal A, Hofoss D: Statistikk for helse- og sosialfagene, 2. utg. edn. Oslo: Gyldendal akademisk; 2004.
154. Bethlehem J, Cobben F, Schouten B: Handbook of nonresponse in household surveys.Hoboken, N.J.: John Wiley & Sons; 2011.
155. Hjartåker A, Lund E: Kohortstudier. In: Epidemiologiske og kliniske forskningsmetoder.edn. Edited by Laake P, Hjartåker A, Thelle D, Veierød M. Oslo: Gyldendal akademisk; 2007: 185-209.
156. Thomson CA, Harris RB, Craft NE, Hakim IA: A cross-sectional analysis demonstrated the healthy volunteer effect in smokers. Journal of clinical epidemiology 2005,58(4):378-382.
157. Contrada R: Stress, Adaptation, and Health. In: The Handbook of stress science: biology, psychology, and health. edn. Edited by Contrada R, Baum A. New York: Springer; 2011: 1-9.
158. StataCorp: Stata Multivariate Statistics. Reference Manual. Release 12. In: StatisticalSoftware. College Station, TX: StataCorp LP.; 2011.
159. Bombak AE, Bruce SG: Self-rated health and ethnicity: focus on indigenous populations. International journal of circumpolar health 2012, 71:18538.
160. Møller H: “You need to be double cultured to function here”: Toward an anthropology of Inuit nursing in Greenland and Nunavut. Edmonton, Alberta: University of Alberta; 2011.
161. Barth F: Manifestasjon og prosess. Oslo: Universitetsforl.; 1994. 162. Russell M, Williams M, May E, Stewart S: The conundrum of detecting stable angina
pectoris in the community setting. Nature reviews Cardiology 2010, 7(2):106-113. 163. Aikens JE, Zvolensky MJ, Eifert GH: Differential fear of cardiopulmonary sensations
in emergency room noncardiac chest pain patients. Journal of behavioral medicine 2001, 24(2):155-167.
164. Fruergaard P, Launbjerg J, Hesse B, Jorgensen F, Petri A, Eiken P, Aggestrup S, Elsborg L, Mellemgaard K: The diagnoses of patients admitted with acute chest pain but without myocardial infarction. European heart journal 1996, 17(7):1028-1034.
165. Kiss D, Veegh W, Schragel D, Bachl C, Stollberger C, Sertl K: Bronchial asthma causing symptoms suggestive of angina pectoris. The European respiratory journal : official journal of the European Society for Clinical Respiratory Physiology 2003,21(3):473-477.
166. Rose GA: The diagnosis of ischaemic heart pain and intermittent claudication in field surveys. Bulletin of the World Health Organization 1962, 27:645-658.
167. Graff-Iversen S, Selmer R, Løchen ML: Rose angina predicts 23-year coronary heart disease mortality in women and men aged 40-49 years. Heart 2008, 94(4):482-486.
168. Njølstad I: Incidence of and risk factors for myocardial infarction, stroke, and diabetes mellitus in a general population: the Finnmark study 1974-1989. Tromsø: Institute of Community Medicine, University of Tromsø; 1998.
169. Tretli S, Lund-Larsen P, Foss O: Reliability of questionnaire information on cardiovascular disease and diabetes: cardiovascular disease study in Finnmark county. Journal of epidemiology and community health 1982, 36(4):269-273.
170. Engstad T, Bonaa K, Viitanen M: Validity of self-reported stroke : The Tromso Study.Stroke; a journal of cerebral circulation 2000, 31(7):1602-1607.
171. Golnick C, Asay E, Provost E, Van Liere D, Bosshart C, Rounds-Riley J, Cueva K, Hennessy TW: Innovative primary care delivery in rural Alaska: a review of patient
91

encounters seen by community health aides. International journal of circumpolar health 2012, 71:18543.
172. Anderson KJ: A review of health care reform in the United States and in Alaska.International journal of circumpolar health 2010, 69(5):424-436.
173. Nystad T, Melhus M, Lund E: Sami speakers are less satisfied with general practitioners' services. International journal of circumpolar health 2008, 67(1):114-121.
92

PAPER I
Eliassen BM, Braaten T, Melhus, M, Hansen KL, Broderstad AR. Acculturation and self-rated health among Arctic indigenous peoples: a population-based cross-sectional study. BMC Public Health 2012, 12:948.
PubMed: PMID 23127197


PAPER II
Eliassen BM, Melhus, M, Hansen KL, Broderstad AR. Marginalisation and cardiovascular disease among rural Sami in Northern Norway: a population-based cross-sectional study. BMC Public Health 2013, 13:522. PubMed: PMID 23718264


PAPER III
Eliassen BM, Graff-Iversen S, Melhus, M, Hansen KL, Løchen ML, Broderstad AR. Ethnic difference in the prevalence of angina pectoris in Sami and non-Sami populations: The SAMINOR study. [Submitted]


Appendix A
SLiCA
-Informed consent
- Mailed invitation letter used in
- Questionnaire


Forespørsel om å delta i forskningsprosjekt på levekår blant urfolk i Arktis
”Survey of Living Conditions in the Arctic: Inuit, Saami and the Indigenous Peoples of Chukotka (SLiCA) (Levekårsundersøkelse i Arktis: Inuitter, samer og urbefolkningen i Tsjukotka (SLiCA)) er et internasjonalt forskningsprosjekt på levekår blant urfolk i Arktis. Urfolk i Alaska, Canada, Grønland, Norge, Sverige, Finland og Russland overvåker prosjektet, og har hjulpet til med å utforme spørsmålene.
Ved å underskrive og returnere vedlagte samtykkeerklæring samtykker du i å bli kontaktet av en av medarbeiderne ved Senter for samisk helseforskning. I løpet av mai vil du da bli forespurt om å delta i forskningsprosjektet. Prosjektet vil foregå som et ansikt-til-ansikt intervju, der du svarer på spørsmål om dine levekår til en av våre ansatte intervjuere. I tillegg består intervjuet av et kort spørreskjema som du frivillig kan fylle ut. Spørsmålene som vil bli stilt omhandler samiske levekår; som bolig
og levestandard, arbeid og aktiviteter, familien, helse, alkohol og rusmidler.
Det er frivillig å delta i intervjuet; du kan til enhver tid trekke deg og få opplysningene om deg slettet. Opplysningene fra intervjuet er strengt konfidensielle og behandles anonymt. Intervjuet varer omtrent i én og en halv time.
Resultatene fra spørreundersøkelsen kan blant annet brukes til å påvirke både samiske og norske beslutningstakere. Etter at forskningsprosjektet er avsluttet, vil alle spørreskjemaer kondemneres etter at de er registrert i en datamatrise. Universitetet i Tromsø vil publisere resultatene fra undersøkelsen i anonymisert form. All data i datamatrisen anonymiseres og tallmaterialet fra undersøkelsen vil publiseres i form av rapporter som utgis i løpet av de kommende år. De anonymiserte rapportene vil gis tilbake til det samiske samfunnet; til organisasjoner som Arktisk Råd og samiske institusjoner.
Ditt hushold er et av de utvalgte i denne regionen. Dersom du ønsker å delta i forskningsprosjektet, ber vi om at du undertegner og daterer samtykkeerklæringen og returnerer den i vedlagte svarkonvolutt. Oppgi i så fall ditt telefonnummer, slik at vi kan kontakte deg og avtale tidspunkt og sted for intervjuet.
Prosjektet har tidligere mottatt støtte fra Kommunal- og regionaldepartementet og Landsdelsutvalget. Senter for samisk helseforskning ved Institutt for Samfunnsmedisin, Universitetet i Tromsø, administrerer, finansier og er i dag ansvarlig for prosjektet. Prosjektmedarbeiderne Bent-Martin Eliassen og Thomas Ole Andersen er ansatt i full stilling og jobber administrativt i prosjektet. Professor og prosjektleder Eiliv Lund har det faglige ansvaret for prosjektet.
På forhånd takk!
Thomas Ole Andersen, prosjektmedarbeider mobil: 95 74 95 21 jobb: 77646636 Bent-Martin Eliassen, prosjektmedarbeider mobil: 97 53 44 73 jobb: 77646636


SAMTYKKEERKLÆRING
Med å underskrive denne samtykkeerklæringa forstår og samtykker jeg i:
Å delta i forskningsprosjektet ”Survey of Living Conditions in the Arctic (SLiCA), (Forskningsprosjekt på levekår blant urfolk i Arktis (SLiCA)).” Jeg forstår at deltakelsen er frivillig og at jeg når som helst kan trekke meg fra undersøkelsen.
Alle personlige opplysninger om meg, min familie og hushold, vil holdes strengt konfidensielt. Etter at undersøkelsen er avsluttet, kondemneres alle opplysninger om meg. All informasjon som jeg gir vil bli analysert og publisert i anonymisert form.
Universitetet i Tromsø vil publisere resultatene fra undersøkelsen, og rapportene vil gis tilbake til det samiske samfunnet. Resultatene kan blant annet brukes til å påvirke samiske og norske beslutningstakere.
Respondentens signatur: _________________________
Dato: _______________
IER ID:___________ IV NR:____________ KONTROLLNUMMER:


SAMTYKKEERKLÆRING
Med å underskrive og returnere denne samtykkeerklæringen forstår jeg og gir mitt samtykke til:
Å bli kontaktet av representanter for Senter for samisk helseforskning med forespørsel om å delta i forskningsprosjektet ”Survey of Living Conditions in the Arctic (SLiCA), (Forskningsprosjekt på levekår blant urfolk i Arktis (SLiCA)).” Jeg forstår at deltakelsen er frivillig og at jeg når som helst kan trekke meg fra undersøkelsen.
Jeg forstår at alle personlige opplysninger om meg, min familie og hushold, vil holdes strengt konfidensielt. Etter at undersøkelsen er avsluttet, kondemneres alle opplysninger om meg. All informasjon som jeg gir vil bli analysert og publisert i anonymisert form.
Universitetet i Tromsø vil publisere resultatene anonymt fra undersøkelsen, og rapportene vil gis tilbake til det samiske samfunnet. Resultatene kan blant annet brukes til å påvirke samiske og norske beslutningstakere.
Vennligst returnerer dette skjema i vedlagte returkonvolutt.
Respondentens signatur: _________________________
Dato: _______________
Telefonnummer: _______________
IER ID:___________ IV NR:____________ KONTROLLNUMMER:


Appendix B
SAMINOR
-Invitation letter
- Informed consent- Questionnaire


Personlig innbydelse
Helse- oglevekårs-
undersøkelsen

1. EGEN HELSE
Hvordan er helsen din nå? (Sett bare ett kryss)
� Dårlig � Ikke helt god � God � Svært god1 2 3 4
Har du, eller har du hatt? Alder førsteJA NEI gang
Astma . . . . . . . . . . . . . . . . . . . . . . . . . . . . . . . . . . . . . . . . . . � �
Kronisk bronkitt/emfysem/KOLS . . . . . . . . . . . � �
Diabetes (sukkersyke) . . . . . . . . . . . . . . . . . . . . . . . � �
Fibromyalgi/kronisk smertesyndrom . . . . . . � �
Psykiske plager som du har søkt hjelp for � �
Hjerteinfarkt (sår på hjertet) . . . . . . . . . . . . . . . . � �
Angina pectoris (hjertekrampe) . . . . . . . . . . . . � �
Hjerneslag/hjerneblødning . . . . . . . . . . . . . . . . . � �
Multippel sklerose (MS) . . . . . . . . . . . . . . . . . . . . . � �
Ulcerøs kolitt . . . . . . . . . . . . . . . . . . . . . . . . . . . . . . . . . � �
Får du smerter eller ubehag i brystet når du: JA NEI
Går i bakker, trapper eller fort på flatmark? � �
Kan slike smerter opptre selv om du er i ro? � �
2. MUSKEL OG SKJELETTPLAGER
Har du i løpet av det siste året vært plagetmed smerter og/eller stivhet i muskler ogledd som har vart i minst 3 måneder JA NEI
sammenhengende? . . . . . . . . . . . . . . . . . . . . . . . . . . . . . . . . . . . . . . � �
Alder
Har du noen gang hatt: JA NEI siste gang
Brudd i håndledd/underarm? . . . . . . . . . . . . . . . � �
Lårhalsbrudd? . . . . . . . . . . . . . . . . . . . . . . . . . . . . . . . . � �
3. MAGE OG TARM SYMPTOMER
Har du hatt sure oppstøt, halsbrann eller JA NEI
brystbrann nesten daglig i minst en uke? � �
Har du noen gang hatt smerter eller verki magen som har vart i minst 2 uker? � �
Hvis JA, hvor i magen sitter smertene? (Sett ett kryss)
� Øvre del � Nedre del � Hele magen
Er smertene eller «verken» jevnt over tilstede? (Sett ett kryss)
I perioder av ukers varighet . . . . . . . . . . . . . . . . . . . . . . . . . . . . . . . . �
I perioder av måneders varighet . . . . . . . . . . . . . . . . . . . . . . . . . . �
Bestandig . . . . . . . . . . . . . . . . . . . . . . . . . . . . . . . . . . . . . . . . . . . . . . . . . . . . . �
Er du ofte plaget av oppblåsthet, rumling i JA NEI
magen eller rikelig luftavgang? � �
3. MAGE OG TARM SYMPTOMER (fortsettelse)
Er avføringen din vanligvis: (Sett ett eller flere kryss)
� Normal � Løs � Hard og perlete
� Vekslende hard og løs � Illeluktende
JA NEI
Har du i perioder tre eller flere avføringer daglig? � �
Har du hatt plager i mage/tarm etter inntak av melk? � �
Er det andre i familien som har de samme magesymptomene?� Mor � Far � Søsken � Barn � Ingen
4. ANDRE PLAGER
Under finner du en liste over ulike problemer. Har du opp-levd noe av dette den siste uken (til og med i dag)?(Sett ett kryss for hver plage)
Ikke Litt Ganske Veldigplaget plaget mye mye
Plutselig frykt uten grunn . . . . . . . . . � � � �
Føler deg redd eller engstelig . . . � � � �
Matthet eller svimmelhet . . . . . . . . . � � � �
Føler deg anspent eller oppjaget � � � �
Lett for å klandre deg selv . . . . . . . . � � � �
Søvnproblemer . . . . . . . . . . . . . . . . . . . . . � � � �
Nedtrykt, tungsindig . . . . . . . . . . . . . . . � � � �
Følelse av å være unyttig, lite verd � � � �
Følelse av at alt er et slit . . . . . . . . . . � � � �
Følelse av håpløshet mht. framtida� � � �
Tenkt på å gjøre slutt på livet ditt � � � �1 2 3 4
5. SYKDOM I FAMILIENVET
Har en eller flere av dine foreldre eller søsken JA NEI IKKE
hatt hjerteinfarkt eller angina pectoris? � � �
Kryss av for de slektningene som har eller har hatt noen avsykdommene og angi deres alder for når de fikk sykdom-mene. (Hvis flere søsken, før opp den som fikk det tidligst i livet)
Alder første Mor Far Søster Bror Barn Ingen gang
Hjerteinfarkt før 60-års alder . . . . . � � � � � �
Hjerteinfarkt etter 60 års-alder � � � � � �
Diabetes . . . . . . . . . � � � � � �
Hjerneslag . . . . . . . � � � � � �
Astma . . . . . . . . . . . . � � � � � �
Tykktarmskreft . . � � � � � �
Brystkreft . . . . . . . . � � � � � �
Eggstokkreft . . . . . . � � � � � �
Hvor mange søsken har du? Brødre Søstre

6. BRUK AV MEDISINER
Med medisiner mener vi her medisiner kjøpt på apotek.Kosttilskudd og vitaminer regnes ikke med her.
Bruker du? Nå Før, men ikke nå Aldri brukt
Medisin mot høyt blodtrykk . . . � � �
Kolesterolsenkende medisin . . . � � �
Insulin . . . . . . . . . . . . . . . . . . . . . . . . . . . . . � � �
Tabletter mot sukkersyke . . . . . . � � �
Hvor ofte har du i løpet av de siste 4 ukene brukt følgendemedisiner? (Sett ett kryss pr. linje)
Ikke Sjeldnerebrukt enn Hver uke,siste hver men ikke4 uker uke daglig Daglig
Smertestillende uten resept � � � �
Smertestillende på resept � � � �
Sovemedisin . . . . . . . . . . . . . . . . . . . � � � �
Beroligende medikamenter � � � �
Medisiner mot depresjon � � � �
Annen medisin på resept � � � �1 2 3 4
For de medisinene du har krysset av for i de to punkteneovenfor og som du har brukt i løpet av de siste 4 ukene:
Angi navnet og hvilken grunn det er til at du tar/har tatt disse(sykdom eller symptom):(Kryss av for hvor lenge du har brukt medisinen)
Navn på medisinen: Grunn til bruk Inntil 1 år (sett ett navn pr. linje) av medisinen: 1 år eller mer
� �
� �
� �
� �
� �
Dersom det ikke er nok plass her, kan du fortsette på eget ark som du leggerved.
7. MAT OG DRIKKE
Hvor ofte spiser du vanligvis disse matvarene?(Sett ett kryss pr. linje)
Sjelden/ 1-3 g. 1-3 g. 4-6 g. 1-2 g. 3 g. el.aldri pr.mnd pr. uke pr. uke pr. dag mer pr.
dag
Frukt . . . . . . . . . . . . . . . . . � � � � � �
Bær . . . . . . . . . . . . . . . . . . � � � � � �
Ost (alle typer) . . . . . � � � � � �
Poteter . . . . . . . . . . . . . . . � � � � � �
Kokte grønnsaker � � � � � �
Rå grønnsaker/salat � � � � � �1 2 3 4 5 6
7. MAT OG DRIKKE (fortsettelse)
Hva slags fett bruker du oftest? (Sett ett kryss pr. linje)
Bruker Meieri- Hard Myk/lett Oljer Annetikke smør margarin margarin
På brødet . . . . . . . . .� � � � � �
I matlagingen . . . .� � � � � �1 2 3 4 5 6
Bruker du følgende kosttilskudd:Ja, daglig Iblant Nei
Tran, trankapsler? . . . . . . . . . . . . . . . . . . . . . . . . . � � �
Fiskeoljekapsler (omega 3)? . . . . . . . . . . . . . � � �
Vitamin- og/eller mineraltilskudd? . . . . . � � �
Hvor mye drikker du vanligvis av følgende? (Sett ett kryss pr. linje)
Sjelden/ 1-6 1 2-3 4 glassaldri glass glass glass el. mer
pr. uke pr. dag pr. dag pr. dag
Helmelk, kefir, yoghurt . . � � � � �
Lettmelk, cultura,lett yoghurt . . . . . . . . . . . . . . . . � � � � �
Skummet melk (sur, søt) � � � � �
Ekstra lettmelk . . . . . . . . . . . . � � � � �
Fruktjuice . . . . . . . . . . . . . . . . . . � � � � �
Vann . . . . . . . . . . . . . . . . . . . . . . . . � � � � �
Brus/Cola med sukker . . . � � � � �
Brus/Cola uten sukker . . . � � � � �1 2 3 4 5
Hvor mange kopper kaffe og te drikker du daglig?(Sett 0 for de typene du ikke drikker daglig) Antall kopper
Filterkaffe . . . . . . . . . . . . . . . . . . . . . . . . . . . . . . . . . . . . . . .
Kokekaffe/trykkanne . . . . . . . . . . . . . . . . . . . . . . . . . . . . . . . . . .
Annen kaffe . . . . . . . . . . . . . . . . . . . . . . . . . . . . . . . . . . . . .
Te . . . . . . . . . . . . . . . . . . . . . . . . . . . . . . . . . . . . . . . . . . . . . . .
Omtrent hvor ofte har du i løpet av det siste året drukketalkohol? (Lettøl og alkoholfritt øl regnes ikke med)
Har aldri Har ikke Noen få Omtrent 1drukket drukket ganger gang ialkohol siste år siste år måneden� 1 � 2 � 3 � 4
2-3 ganger Ca. 1 gang 2-3 ganger 4-7 gangerpr. måned i uka i uka i uka� 5 � 6 � 7 � 8
Til dem som har drukket siste år:Når du har drukket, hvor mange glasseller drinker har du vanligvis drukket? Antall
Omtrent hvor mange ganger det sisteåret har du drukket så mye som minst Antall5 glass eller drinker i løpet av ett døgn? ganger
Når du drikker, drikker du da vanligvis: (Sett ett eller flere kryss)
� Øl � Vin � Brennevin
Hvor lenge?

BRUK AV HELSETJENESTER
Hvor mange ganger de siste 12 måneder har du selv brukt:(sett ett kryss for hver linje)
Ingen 1-3 ganger 4 eller flere
Kommunelege/fastlege � � �
Spesialist � � �
Legevakt � � �
Sykehus innleggelse � � �
Hjemmesykepleie � � �
Kommunal hjemmehjelp � � �
Fysioterapeut � � �
Kiropraktor � � �
Tannlege � � �
Alternativ behandler � � �
Hvor mange leger har du selv vært hos de siste 12 måneder?
(angi antall)
Har du fått tildelt navngitt fastlege? � Ja � Nei
Når du er til undersøkelse, hvilket språk kommuniserer duog legen på? (sett ett eller flere kryss)
� Norsk � Samisk � Bruker tolk � Annet språk
Tror du det skjer noen gang at du og legen misforstårhverandre p.g.a. språklige problemer?� Aldri � Sjelden � Av og til � Ofte � Usikker
Dersom det er behov for tolk, synes du at legen er flink noktil å be om det?� Ja, alltid � Ja, som regel � Nei, ikke alltid
� Nei, aldri � Jeg liker ikke å bruke tolk
Hvor fornøyd eller misfornøyd er du med følgende siderved den kommunale legetjenesten i din bostedskommune?(sett ett kryss per linje)
Meget Fornøyd Misfornøyd Meget Vetfornøyd misfornøyd ikke
Avstand til legen � � � � �
Legens tilgjengelighetpå telefon � � � � �
Ventetid på legetime � � � � �
Tid inne hos legen � � � � �
Mulighetene for å fåfortalt om dine plager � � � � �
Legens forståelse avdin kulturelle bakgrunn � � � � �
Legens informasjon omdine helseplager,undersøkelse ogbehandlingsopplegg � � � � �
BRUK AV HELSETJENESTER (fortsettelse)
Meget Fornøyd Misfornøyd Meget Vetfornøyd misfornøyd ikke
Legens språkbeherskelse(samisk eller norsk) � � � � �
Totalt sett, hvor fornøydeller misfornøyd er dumed den kommunalelegetjenesten? � � � � �
Hvor lenge er det siden du var hos lege sist? (angi i hele tall)
(år) (måneder)
Dersom du noen gang har benyttet alternative behandlere,hvilke har du brukt? (sett ett eller flere kryss)
� Helbreder (guvllár, leser, blåser, håndspålegger)
� Healer
� Akupunktør
� Soneterapeut, homeopat, kinesiolog osv.
Dersom du har benyttet en alternativ behandler, hvor lengeer det siden sist? (angi i hele tall)
(år) (måneder)
Tenk deg at du i dag skulle få behov for hjelp/bistand fraden kommunale helse- og sosialtjenesten (hjemmesykepleie,hjemmehjelp, sosiale tjenester, fysioterapi o.s.v.)
Vet du hvor du skal henvende deg?� Ja � Nei � Usikker
Er du trygg på at du får hjelp hvis du trenger det?� Ja � Nei � Usikker
Dersom du i dag får hjelp fra den kommunale helse- ogsosial tjenesten, er du fornøyd med tilbudet? � Ja � Nei � Usikker
SKADER/ULYKKER
Har du vært utsatt for noen ulykker som medførte behand-ling hos lege og/eller sykehusinnleggelse?
Lege � Ja � Nei antall ganger
Sykehus innleggelse � Ja � Nei antall ganger

SKADER/ULYKKER (fortsettelse)
Hvis ja, hva slags ulykke(r) er du blitt behandlet for?(sett ett eller flere kryss pr. linje)
Arbeid Hjem Fritid Ingen
Bil . . . . . . . . . . . . . . . . . . . � � � �
Motorsykkel . . . . . . � � � �
Snøscooter. . . . . . . . . � � � �
Firehjulssykkel . . . . � � � �
Traktor . . . . . . . . . . . . . . � � � �
Fallulykke. . . . . . . . . . � � � �
Kuttskade . . . . . . . . . . � � � �
Annet . . . . . . . . . . . . . . . � � � �
Har ulykken(e) ført til nedsatt arbeidsevne?� Helt � Delvis � Ikke i det hele tatt
FAMILIE OG SPRÅKBAKGRUNN
I Nord-Norge bor det folk med ulik etnisk bakgrunn. Det vilsi at de snakker ulike språk og har forskjellige kulturer.Eksempler på etnisk bakgrunn, eller etnisk gruppe er norsk,samisk og kvensk.
Hvilket hjemmespråk har/hadde du, dine foreldre og beste-foreldre? (sett ett eller flere kryss)
Norsk Samisk Kvensk Annet, beskriv
Morfar: � � � � . . . . . . . . . . . . . . . . . . . . .
Mormor: � � � � . . . . . . . . . . . . . . . . . . . . .
Farfar: � � � � . . . . . . . . . . . . . . . . . . . . .
Farmor: � � � � . . . . . . . . . . . . . . . . . . . . .
Far: � � � � . . . . . . . . . . . . . . . . . . . . .
Mor: � � � � . . . . . . . . . . . . . . . . . . . . .
Jeg selv: � � � � . . . . . . . . . . . . . . . . . . . . .
Hva er din, din fars og din mors etniske bakgrunn?(sett ett eller flere kryss)
Norsk Samisk Kvensk Annet, beskriv
Min etniske bakgrunn er: � � � � . . . . . . . . . . .
Fars etniske bakgrunn er: � � � � . . . . . . . . . . .
Mors etniske bakgrunn er: � � � � . . . . . . . . . . .
Hva regner du deg selv som? (sett ett eller flere kryss)
Norsk Samisk Kvensk Annet, beskriv
� � � � . . . . . . . . . . .
ARBEIDSLIV/ØKONOMI
Hvilken type arbeid/livsopphold har du? (sett ett eller flere kryss)
� Fastlønnet, heltid � Fastlønnet, deltid
� Sesongarbeid � Selvstendig næringsdrivende
� Arbeidsledig � Hjemmeværende
� Alderstrygd � Uføretrygd
� Annet (beskriv) ............................................................................................................
ARBEIDSLIV/ØKONOMI (fortsettelse)
Kunne du tenke deg å flytte fra din bostedskommune der-som du fikk tilbud om arbeid et annet sted?� Ja � Nei � Deler av året � Usikker
Dersom du er arbeidsledig, angi hvor lenge du har værtarbeidssøker: (angi i hele tall)
(år) (måneder)
Dersom du er selvstendig næringsdrivende, hvilken typenæring jobber du i? (sett ett eller flere kryss)
� Reindrift � Fiske � Jordbruk � Skogbruk
� Forretningsvirksomhet � Annet (spesifiser) . . . . . . . . . . . . .
Hvor mange personer bor det i din husstand?
(antall personer)
Hvor stor er familiens/husstandens bruttoinntekt per år?
� Under kr. 150000 � Kr. 150 000–300 000
� Kr. 301 000–450 000 � Kr. 451 000–600 000
� Kr. 601 000–750 000 � Over kr. 750 000
Hvor ofte spiller du på ulike pengespill slik som lotto, tip-ping, spilleautomater og lignende?
� Aldri/sjelden � 1-3 ganger i mnd.
� 1 gang i uka � 2-6 ganger i uka � Hver dag
Hvor mye spiller du for ukentlig i gjennomsnitt?
� Under kr. 100 i uka � Kr. 100-500 i uka
� Kr. 501–1000 i uka � Over kr. 1000 i uka
MOBBING
Med mobbing mener vi når en eller flere personer gjentatteganger sier eller gjør vonde ting mot deg, og du har vanske-ligheter med å forsvare deg.
Har du vært utsatt for mobbing?� Ja, de siste 12 mnd. � Ja, før � Nei
Dersom du har vært utsatt for mobbing, hvilken type mob-bing er du blitt utsatt for? (sett ett eller flere kryss)
� Baksnakking � Ignorering
� Diskriminerende bemerkninger � Annet
Kan du angi hvor dette foregår/foregikk?(sett ett eller flere kryss)
� På skolen � På skoleinternat � I yrkeslivet
� I lokalsamfunnet � Annet

8. RØYKING OG BRUK AV SNUS
Hvor lenge er du vanligvisdaglig i et røykfylt rom? Antall hele timer
Røykte noen av de voksne hjemme da du JA NEI
vokste opp? . . . . . . . . . . . . . . . . . . . . . . . . . . . . . . . . . . . . . . . . . . . . . . . � �
Bor du, eller har du bodd, sammen med noen JA NEI
dagligrøykere etter at du fylte 20 år? . . . . . . . . . . . . . . . . � �
Ja, nå Ja, før Aldri
Har du røykt/røyker du daglig? � � �
Hvis du røyker daglig nå, røyker du: JA NEI
Sigaretter? . . . . . . . . . . . . . . . . . . . . . . . . . . . . . . . . . . . . . . . . . . . . . . . . . � �
Sigarer/sigarillos/pipe? . . . . . . . . . . . . . . . . . . . . . . . . . . . . . . . . . . � �
Rulletobakk/rullings? . . . . . . . . . . . . . . . . . . . . . . . . . . . . . . . . . . . . � �
Hvis du har røykt daglig tidligere, hvorlenge er det siden du sluttet? Antall år
Hvis du røyker daglig nå, eller har røykt tidligere:Hvor mange sigaretter røyker/røyktedu vanligvis daglig? Antall sigaretter
Hvor gammel var du da du begynte årøyke daglig? Alder i år
Hvor mange år til sammen har durøykt daglig? Antall år
Ja, nå Ja, før Aldri
Har du brukt/bruker du snus daglig? � � �
Hvis du bruker/har brukt snus, hvormange år til sammen har du brukt snus? Antall år
9. MOSJON OG FYSISK AKTIVITET
Hvordan har din fysiske aktivitet i fritiden vært det sisteåret? (Tenk deg et ukentlig gjennomsnitt for året. Arbeidsveiregnes som fritid. Besvar begge spørsmålene)
T i m e r p r . u k e :Lett aktivitet Ingen Under 1 1-2 3 og mer
(Ikke svett/andpusten) . . . . .� � � �
Hard fysisk aktivitet(Svett/andpusten) . . . . . . . . .� � � �
1 2 3 4
Angi bevegelse og kroppslig anstrengelse i din fritid. Hvisaktiviteten varierer meget f. eks. mellom sommer og vinter,så ta et gjennomsnitt. Spørsmålet gjelder bare det siste året.(Sett kryss i den ruta som passer best)
Leser, ser på fjernsyn eller annenstillesittende beskjeftigelse? . . . . . . . . . . . . . . . . . . . . . . . . . . . � 1
Spaserer, sykler eller beveger deg på annen måte minst 4 timer i uka? . . . . . . . . . . . . . . . . . . . . . . . . . . . . . . � 2(Regn også med gang eller syklingtil arbeidsstedet, søndagsturer m.m.)
Driver mosjonsidrett, tyngre hagearbeid e.l.? . . . . . . � 3
(Merk at aktiviteten skal vare minst 4 timer i uka)
Trener hardt eller driver konkurranseidrettregelmessig og flere ganger i uka? . . . . . . . . . . . . . . . . . . . � 4
10. UTDANNING OG ARBEID
Hvor mange års skolegang har du gjennomført?(Ta med alle år du har gått på skole eller studert) Antall år
Hvordan trives du i din jobb?
1� Svært godt 2 � Godt 3 � Dårlig 4 � Veldig dårlig
Mener du at du står i fare for å miste dittnåværende arbeid eller inntekt de JA NEI
nærmeste 2 årene? . . . . . . . . . . . . . . . . . . . . . . . . . . . . . . . . . . . . . . � �
Mottar du noen av følgende ytelser? JA NEI
Sykepenger . . . . . . . . . . . . . . . . . . . . . . . . . . . . . . . . . . . . . . . . . . . . . . . . � �
Attføring . . . . . . . . . . . . . . . . . . . . . . . . . . . . . . . . . . . . . . . . . . . . . . . . . . . � �
Sosialhjelp/-stønad . . . . . . . . . . . . . . . . . . . . . . . . . . . . . . . . . . . . . . . � �
Overgangsstønad for enslige forsørgere . . . . . . . . . . . . . . � �
11. RESTEN AV SKJEMAET SKAL BARE BESVARES AV KVINNER
Hvor gammel var du da du fikkmenstruasjon aller første gang? Alder i år
Hvis du ikke lenger får menstruasjon,hvor gammel var du da den sluttet? Alder i år
Er du gravid nå? Over fruktbarJa Nei Usikker alder� 1 � 2 � 3 � 4
Hvor mange barn har du født? Antall barn
Hvis du har født barn, fyll ut hvert barns fødselsår, og hvormange måneder du ammet etter fødselen. (Hvis du ikke ammet, skriv 0) AmmetBarn: Fødselsår: antall mnd.:
1. barn . . . . . . . . . . . . . . . . . . . . .
2. barn . . . . . . . . . . . . . . . . . . . . .
3. barn . . . . . . . . . . . . . . . . . . . . .
4. barn . . . . . . . . . . . . . . . . . . . . .
5. barn . . . . . . . . . . . . . . . . . . . . .
(Hvis flere barn, bruk ekstra ark)
Bruker du, eller har du brukt? (Sett ett kryss for hver linje)Nå Før, men Aldri
ikke nå
P-pille/minipille/p-sprøyte . . . . . . . . . . . . . . . � � �
Hormonspiral (ikke vanlig spiral) . . . . . . � � �
Østrogen (tabletter eller plaster) . . . . . . . . � � �
Østrogen (krem eller stikkpiller) . . . . . . . . � � �
Hvis du bruker/har brukt reseptpliktig østrogen:Hvor lenge har du brukt dette? Antall år
Hvis du bruker p-pille, minipille, p-sprøyte, hormonspiraleller østrogen; hvilket merke bruker du?
Spesifiser:
Ikke skriv her
IN 2
513-
2040
-1 -
40.
000
- B
JØR
KM
AN
NS
TRY
KK
ERI 0
2.03

1. SYMPTOMER
JA NEI
Hoster du omtrent daglig i perioder av året? � �
Har du hatt slik hoste så lenge som i en3 måneders periode i begge de to siste år? � �
Hender det at du er plaget av søvnløshet? � �
Hvis ja, når er du mest plaget av søvnløshet?(Sett ett eller flere kryss)
� Hele året � Vår � Sommer � Høst � Vinter1 2 3 4 5
Har du det siste året vært plaget av søvnløshet JA NEI
slik at det har gått ut over arbeidsevnen? � �
Er du stort sett fornøyd med tilværelsen?1� Meget fornøyd2� Ganske fornøyd3� Litt misfornøyd4� Meget misfornøyd
Hender det at du i lengre perioder – JA NEI
i minst 14 dager- er trist og nedfor? � �
Har du i de siste 14 dager følt deg ute av stand til å takledine vanskeligheter?� Nei � Av og til � Ofte � Nesten hele tiden1 2 3 4
Hender det at du føler deg ensom? � Nei � Av og til � Ofte1 2 3
2. KOSTHOLD NÅ
Vi vil gjerne spørre deg om hvor ofte du pleier å spiseenkelte matvarer. Tenk på gjennomsnittet det siste året. Settett kryss pr. linje for antall ganger. Hvis du ikke husker nøy-aktig, fyll ut så godt du kan.
Hvor mange ganger i uken pleierdu å spise middag? Antall ganger
2. KOSTHOLD NÅ (fortsettelse)
Hvor ofte pleier middagen å inneholde:
Aldri/ 1 pr. 2-3 pr. 1 pr. 2 pr. 3 pr. 4 pr. 5+
sjelden mnd. mnd. uke uke uke uke pr. uke
Fisk . . . . . . . . . . . . . . . . . . � � � � � � � �
Kjøtt (helt, oppmalt) � � � � � � � �
Verken fisk el. kjøtt � � � � � � � �1 2 3 4 5 6 7 8
Hvor ofte spiser du kokt torsk og sei til middag?Aldri 1-11 1 pr. 2-3 pr. 1 pr. 2 pr. 3+ pr.
pr. år mnd. mnd. uke uke pr. uke
Torsk (f.eks. fersk,lettsaltet, røkt, bokna) � � � � � � �
Sei (f.eks. fersk, bokna) � � � � � � �1 2 3 4 5 6 7
Hvor mange ganger pr. år spiser du fiskeinnmat? 0 1-3 4-6 7-9 10+
Fiskelever . . . . . . . . . . . . . . . . . . � � � � �
Rogn . . . . . . . . . . . . . . . . . . . . . . . . � � � � �1 2 3 4 5
Hvor ofte spiser du annen kokt fisk til middag?Aldri 1-5 6-11 1 pr. 2-3 pr. 1 pr. 2+ pr.
pr. år pr. år mnd. mnd. uke uke
Fete fiskeslag . . . . . . � � � � � � �(f.eks. kokt laks,kveite, uer, røye,ørret, sik)
Magre fiskeslag . . . � � � � � � �(f.eks. kokt hyse/ 1 2 3 4 5 6 7kolje, abbor,gjedde, harr)
Hvor ofte spiser du stekt fisk til middag?Aldri 1-5 6-11 1 pr. 2-3 pr. 1 pr. 2+ pr.
pr. år pr. år mnd. mnd. uke uke
Fete fiskeslag � � � � � � �(f.eks. stekt laks,sild, røye, ørret, sik)
Magre fiskeslag � � � � � � �(f.eks. stekt sei, torsk, 1 2 3 4 5 6 7
abbor, gjedde, harr)
TILLEGGSSPØRSMÅL TIL HELSE- OGLEVEKÅRSUNDERSØKELSEN
Takk for fremmøte til helseundersøkelsen. På dennemåten har du bidratt til å skaffe ny viten om helse og leve-kår i områder med samisk og norsk bosetting. Hoved-formålet med undersøkelsen har vært å skaffe ny viten omhjerte- kar sykdommer for å kunne forebygge dem. I til-legg skal undersøkelsen gi oss kunnskap om andre syk-dommer og plager slik at vi kan lage en oversikt over folkshelse i fylket. Vi ber deg derfor svare på noen spørsmålom forhold som kan ha betydning for disse og andre syk-dommer.
Det utfylte skjemaet sendes i vedlagte svarkonvolutt.Portoen er betalt. På forhånd takk for hjelpen!
Med vennlig hilsen:Senter for samisk helseforskning og
Nasjonalt folkehelseinstitutt
Dato for utfylling:
Dag Måned År

2. KOSTHOLD NÅ (fortsettelse)
Hvor ofte spiser du fiskemat til middag?Aldri 1-5 6-11 1 pr. 2-3 pr. 1 pr. 2+ pr.
pr. år pr. år mnd. mnd. uke ukeFiskekaker/boller/pudding . . . . . . . . . . . . . . . � � � � � � �
Fiskegrateng,plukkfisk . . . . . . . . . . . . . . � � � � � � �
Fiskepinner,panert fisk . . . . . . . . . . . . . � � � � � � �
1 2 3 4 5 6 7
Hvor ofte spiser du fiskepålegg?Aldri 1-11 1 pr. 2-3 pr. 1-2 pr. 3-4 pr. 5+ pr.
pr. år mnd. mnd. uke uke uke
Speket/saltet fisk . . . � � � � � � �
Røkt fisk . . . . . . . . . . . . � � � � � � �
Makrell i tomat . . . . � � � � � � �
Nedlagt sild . . . . . . . . � � � � � � �
Kaviar . . . . . . . . . . . . . . . � � � � � � �
Annet fiskepålegg � � � � � � �1 2 3 4 5 6 7
Hvor ofte spiser du følgende retter?Aldri 1-5 6-11 1 pr. 2-3 pr. 1 pr. 2+ pr.
pr. år pr. år mnd. mnd. uke uke
Pizza . . . . . . . . . . . . . . . . � � � � � � �
Spagetti, pastaretter � � � � � � �
Hamburger i brød � � � � � � �
Kjøttkaker/
karbonader . . . . . . . . . � � � � � � �
Pølser . . . . . . . . . . . . . . . . � � � � � � �
Gryterett . . . . . . . . . . . . � � � � � � �
1 2 3 4 5 6 7
Hvor ofte spiser du kjøtt til middag (f.eks. koteletter, steik,grytekjøtt, biff, filet)?
Aldri 1-5 6-11 1 pr. 2-3 pr. 1 pr. 2+ pr.pr. år pr. år mnd. mnd. uke uke
Kylling . . . . . . . . . . . . . � � � � � � �
Svin . . . . . . . . . . . . . . . . . . � � � � � � �
Okse/storfe . . . . . . . . . � � � � � � �
Sau/lam . . . . . . . . . . . . . � � � � � � �
Elg . . . . . . . . . . . . . . . . . . . � � � � � � �
Hval . . . . . . . . . . . . . . . . . � � � � � � �1 2 3 4 5 6 7
Hvor mange egg fra sjøfugl spiser du pr. år? 0 1-3 4-6 7-9 10+
Antall egg � � � � �
1 2 3 4 5
Hvor ofte spiser du kjøtt av rein?Aldri 1-11 1 pr. 2-3 pr. 1 pr. 2 pr. 3+ pr.
pr. år mnd. mnd. uke uke uke
Kokt reinkjøtt . . . . . . � � � � � � �(buljong)
Stekt reinkjøtt . . . . . . � � � � � � �(helt, skavet, oppmalt)
2. KOSTHOLD NÅ (fortsettelse)
Hvor ofte spiser du kjøtt av rein? (fortsettelse)
Røkt reinkjøtt . . . . . . � � � � � � �
Tørket reinkjøtt . . . . � � � � � � �1 2 3 4 5 6 7
Hvor ofte spiser du andre matvarer av rein?Aldri 1-5 6-11 1 pr. 2-3 pr. 3+ pr.
pr. år pr. år mnd. mnd. uke
Blodmat av rein . . . � � � � � �
Margbein . . . . . . . . . . � � � � � �
Reintunge . . . . . . . . . . � � � � � �
Reinlever . . . . . . . . . . . � � � � � �1 2 3 4 5 6
Hvor ofte spiser du bær?Én gang tilsvarer 1 brødskive med syltetøy, tyttebær til 1 por-sjon middag, 1 porsjon dessert, 1 glass saft, eller en tur hvordu spiste friske bær.
Aldri 1-5 6-11 1 pr. 2-3 pr. 1-2 pr. 3+ pr.pr. år pr. år mnd. mnd uke uke
MolterFriske, frosne, rørte � � � � � � �
Kokt/kjøpt syltetøy � � � � � � �
Tyttebær
Friske, frosne, rørte � � � � � � �
Kokt/kjøpt syltetøy � � � � � � �
Blåbær
Friske, frosne, rørte � � � � � � �
Kokt/kjøpt syltetøy � � � � � � �
Saft . . . . . . . . . . . . . . . . . . . � � � � � � �
Krøkebær
Friske, frosne � � � � � � �
Saft . . . . . . . . . . . . . . . . . . . � � � � � � �
1 2 3 4 5 6 7
Hvordan pleier du/ditt hushold å skaffe følgende råvarer tileget bruk? (Sett ett eller flere kryss)
Spiser Helt Delvis Kjøper Kjøper Bytteraldri/ selv- selv- i butikk privat eller fårsjelden forsynt forsynt
Kjøtt
Rein . . . . . . . . . � � � � � �
Sau . . . . . . . . . . � � � � � �
Elg . . . . . . . . . . � � � � � �
Fisk
Ferskvann . . � � � � � �
Saltvann . . . . � � � � � �
Bær
Molter . . . . . . � � � � � �
Tyttebær . . . . � � � � � �
1 2 3 4 5 6

2. KOSTHOLD NÅ (fortsettelse)
Hvor ofte pleier du å jakte, fiske og plukke bær?Aldri Sjelden Av og til Mye av fritiden
Jakte rype/småvilt � � � �
Jakte storvilt . . . . . . . � � � �
Fiske . . . . . . . . . . . . . . . . � � � �
Plukke bær . . . . . . . . � � � �1 2 3 4
Hvor ofte har du spist et hovedmåltid fra ditt husholdsjakt/fiske siste år?
Aldri 1-5 6-11 1 pr. 2-3 pr. 1 pr. 2+ pr.pr. år pr. år mnd. mnd. uke uke
Hovedmåltid jakt � � � � � � �
Hovedmåltid fiske � � � � � � �
1 2 3 4 5 6 7
3.KOSTHOLD I OPPVEKSTEN
Tenk på maten du fikk hjemme før du flyttet for deg selv.Hvis du bodde mesteparten av året på skoleinternat, tenkpå maten du fikk der.
Bodde du på internat (statsinternat eller privat) da du gikkpå barne- og ungdomsskolen?1� Ja, ungdomsskolen2� Ja, barneskolen3� Ja, både barne- og ungdomsskolen4� Nei, ingen av delene
Hvis ja, hvor mange klassetrinn?
Hvor lenge var du på internat i snitt for hvert klassetrinn?� 1-3 mnd. � 4-6 mnd. � 7-9 mnd.
Hvor ofte spiste du fisk og reinkjøtt i oppveksten?
Aldri 1-11 1 pr. 2-3 pr. 1-2 pr. 3-4 pr. 5+ pr.pr. år mnd. mnd. uke uke uke
Kokt/stekt fisk . . . . . . � � � � � � �
Reinkjøtt . . . . . . . . . . . . � � � � � � �
1 2 3 4 5 6 7
Hvor ofte spiste du andre matvarer i oppveksten?
Aldri 1-11 1 pr. 2-3 pr. 1 pr. 2 pr. 3+ pr.pr. år mnd. mnd. uke uke uke
Blodmat . . . . . . . . . . . . � � � � � � �
Sauekjøtt . . . . . . . . . . . . � � � � � � �
Kjøttkaker, pølser . . � � � � � � �
Fiskemat . . . . . . . . . . . . � � � � � � �
Fiskelever og rogn � � � � � � �
Grøt, pannekaker � � � � � � �
1 2 3 4 5 6 7
JA NEI
Fikk du medisinsk tran i oppveksten? � �
Fikk du servert tran til for eksempel fisk � �
(i stedet for annet fett)?
3. KOSTHOLD I OPPVEKSTEN (fortsettelse)
Hvor ofte spiste du ville bær og planter i oppveksten?
Aldri 1-5 6-11 1 pr. 2-3 pr. 1-2 pr. 3+ pr.pr. år pr. år mnd. mnd uke uke
Ville bær . . . . . . . . . . . . � � � � � � �
Syregress . . . . . . . . . . . � � � � � � �
Kvann . . . . . . . . . . . . . . . � � � � � � �1 2 3 4 5 6 7
Er maten du spiser nå, forskjellig fra det du fikk i oppveksten?
1� Nei
2� Litt forskjellig
3� Ganske forskjellig
4� Veldig forskjellig
4.NATTSPISING
Våkner du ofte opp for å spise etter at du JA NEI
har lagt deg om kvelden? � �
Hvis «ja», besvar de neste 4 spørsmålene:
Når har du oftest plagene? (Sett ett eller flere kryss)
� Hele året � Vår � Sommer � Høst � Vinter1 2 3 4 5
Hva spiser du om natten? (Sett ett eller flere kryss)
� Kjøtt � Brødmat � Godteri � Annet1 2 3 4
Spiser du mer enn halvparten av døgnets JA NEI
matmengde etter kl. 20 om kvelden? � �
Er andre i familien plaget med nattspising?JA NEI VET IKKE
� � �JA NEI
Har du skiftarbeid, nattarbeid eller går vakter? � �
5. OPPVEKST, FAMILIE OG VENNER
I hvilken kommune har du bodd lengre enn ett år?Kommune:
1. Fødested:…………………...fra 0 år til år
2. ……………………………...fra år til år
3. ………………………………fra år til år
4. ………………………………fra år til år
5. ………………………………fra år til år
(Hvis du har bodd i flere kommuner, bruk eget ark.)
JA NEI
Bor du sammen med ektefelle/samboer? � �
Har du delt eller daglig omsorg for JA NEI
Barn? . . . . . . . . . . . . . . . . . . . . . . . . . . . . . . . . . . . . . . . . . . . . . . . . . . . . � �
Foreldre/andre? . . . . . . . . . . . . . . . . . . . . . . . . . . . . . . . . . . . . . . . . � �

Hvor mange gode venner har du?(De som du kan snakke fortrolig med ogsom kan gi deg hjelp dersom du trenger det.Tell ikke med de du bor sammen med.) Antall venner
Er du tilknyttet noen av de følgende menigheter/trossam-funn: (Sett ett eller flere kryss)
1� Medlem i statskirka2� Den Læstadianske menighet 3� Annen menighet4� Ikke medlem av noen menighet
Føler du at du kan påvirke det som skjer i lokalsamfunnetder du bor? (Sett bare ett kryss)
1� Ja, i stor grad 2� Ja, en del 3� Ja, i liten grad4� Nei 5� Har ikke forsøkt
6. VERDITILKNYTNING
TIL ALLE:Er det viktig for deg å ha kontakt med naturen?
Meget viktig Viktig Lite viktig Helt uviktig� � � �
1 2 3 4
Er utnytting av naturen gjennom fiske, jakt og bærplukkingviktig for deg?
Meget viktig Viktig Lite viktig Helt uviktig� � � �
1 2 3 4
Er bevaring av slekts- og familietradisjoner viktig for deg?Meget viktig Viktig Lite viktig Helt uviktig
� � � �1 2 3 4
Har du opplevd at du er blitt mobbet eller diskriminert pågrunn av din etniske (samisk, kvensk, russisk, tamilsk, norsk,etc.) bakgrunn?
Svært mange ganger Noen ganger En sjelden gang Aldri� � � �
1 2 3 4
Tror du at diskriminering av etniske minoriteter kan hanegative helsemessige konsekvenser?
I stor grad I noen grad I liten grad Absolutt ikke� � � �
1 2 3 4
Føler du deg presset ut av næringen din?I stor grad I noen grad I liten grad Absolutt ikke
� � � �1 2 3 4
7.TIL DEM MED SAMISK BAKGRUNN:
Er samiske klestradisjoner viktige for deg?Meget viktig Viktig Lite viktig Helt uviktig
� � � �1 2 3 4
Hvilken betydning har duodji for deg?
Meget stor Stor Liten Ingenbetydning betydning betydning betydning
� � � �1 2 3 4
Hva betyr bevaring og utvikling av det samiske språket fordeg?
Meget stor Stor Liten Ingenbetydning betydning betydning betydning
� � � �1 2 3 4
Er det viktig for deg å bo i et lokalsamfunn der du dagligkan møte andre samer?
Meget viktig Viktig Lite viktig Helt uviktig� � � �
1 2 3 4
Synes du at bevaring av typiske samiske næringer er viktig?
Meget viktig Viktig Lite viktig Helt uviktig� � � �
1 2 3 4
Er utviklingen av det moderne samiske skoleverket viktig fordeg?
Meget viktig Viktig Lite viktig Helt uviktig� � � �
1 2 3 4
Er det viktig for deg at samiske lokalsamfunn bør få et stør-re innslag av moderne arbeidsplasser?
Meget viktig Viktig Lite viktig Helt uviktig� � � �
1 2 3 4
Hva betyr samiske media (radio, TV, aviser, bøker) for deg?
Meget stor Stor Liten Ingenbetydning betydning betydning betydning� � � �
Hva betyr moderne samisk kunst (billedkunst, musikk, filmog teater) for deg?
Meget stor Stor Liten Ingenbetydning betydning betydning betydning
� � � �1 2 3 4
Hvordan ser du på at samisk samfunn og kultur med årenehar fått en sterkere internasjonal kontakt?
Meget viktig Viktig Lite viktig Helt uviktig� � � �
1 2 3 4
Hva betyr Sametinget for deg?Meget stor Stor Liten Ingenbetydning betydning betydning betydning
� � � �1 2 3 4
Opplever du forurensning av eller inngrep i naturen som entrussel mot din samiske tilværelse?
I stor grad I noen grad I liten grad Absolutt ikke� � � �
1 2 3 4
Føler du at den moderne utviklingen fortrenger den samiskekulturen?I stor grad I noen grad I liten grad Absolutt ikke
� � � �1 2 3 4
TAKK FOR HJELPEN!HUSK Å POSTLEGGE SKJEMAET I DAG!

Bovdehus
DEARVVASVUO�A -JA EALLINDILLE-ISKKADEAPMI

1. DU DEARVVASVUOHTA
Mo lea du dearvvasvuohta dál? (Russe dušše oktii)
� Heittot � Ii nu buorre � Buorre � Hirbmat buorre1 2 3 4
Ahki
Leago dus, dahje leago dus leamaš? vuosttas
JUO II geardde
Astma . . . . . . . . . . . . . . . . . . . . . . . . . . . . . . . . . . . . . . . . . . . � �
Bistevaš broŋkihtta/emfysema/KOLS . . . . . . � �
Diabetes (sohkardávda) . . . . . . . . . . . . . . . . . . . . . . � �
Fibromyalgia/bistevaš bávččassyndroma � �
Psykalaš váttut maidda leat jearran veahki � �
Váibmodohppehat (váibmohávvi) . . . . . . . . . � �
Angina pectoris (váibmogeasáhat) . . . . . . . . . � �
Vuoiŋŋašgáldnanvihki/vuoiŋŋašvardin . . . . � �
Multippel sklerose (MS) . . . . . . . . . . . . . . . . . . . . . � �
Ulcerøs kolitt . . . . . . . . . . . . . . . . . . . . . . . . . . . . . . . . . . � �
Bávččagastágo dahje unohastágo rattis go: Goarkŋut milliid, ráhpáid dahje váccát JUO II
jođánit dulbohagas? . . . . . . . . . . . . . . . . . . . . . . . . . . . . . . . . . . . . . . . � �
Sáhttágo ná bávččastit vaikke it lihkat? . . . . . . . . . . . . . . � �
2. DEAHKKE- JA DÁKTERIGGEGIVSSIT
Leatgo maŋimus jagi váivašuvvan bákčasiiguinja/dahje stirdun dehkiiguin ja lađđasiiguin mii JUO IN
lea bistán uhcimusat 3 mánu oktilaččat? . . . . . . . . . . . . . � �
Ahki
Leago dus goassige leamaš: maŋimusJUO II háve
Doddjon giehtalađas/giehtadieiggus? . . . . . � �
Doddjon noras? . . . . . . . . . . . . . . . . . . . . . . . . . . . . . . � �
3. ČOAVJE- JA ČOALLEDÁVDAMEARKKAT
Leago dus leamaš čáhcečolohagat,čottaboalddáhat dahje raddeboalddáhat JUO II
masá beaivválaččat uhcimusat vahku? . . . . . . . . . . . . . . . . . � �
Leatgo dus goassige leamaš čoavjjis bákčasatdahje várka mii lea bistán uhcimusat 2 vahku? . . . . . � �
Jus JUO, gokko čoavjjis dovdojit bákčasat? (Russe oktii)
� Bajit oasis � Vuolit oasis � Miehtá čoavjji
Dovdojitgo bákčasat dahje «várka» jámmat? (Russe oktii)
� Bistá ain vahkuid � Bistá ain mánuid � Čađat
Giksašuvatgo dávjá baggamiin, čoavješnjoarra- JUO IN
miin dahje hirbmat buoskkuhemiin? . . . . . . . . . . . . . . . . . . . � �
Leago du baika dábálaččat: (Russe oktii dahje moddii)
� Dábálaš � Njárbat � Garas ja gágirlágan� Vurohagaid garas ja njárbat � Guohca
Baikkátgo soames áiggiid golmma dahje eanet JUO IN
geardde beaivái? . . . . . . . . . . . . . . . . . . . . . . . . . . . . . . . . . . . . . . . . . . . � �
Leatgo giksašuvvan čovjjiin/čoliiguin go JUO IN
mielkki jugat? . . . . . . . . . . . . . . . . . . . . . . . . . . . . . . . . . . . . . . . . . . . . . . . � �
Leago earáin bearrašis seamma dávdamearkkat?Eatnis Áhčis Oappás/vieljas Mánáin Ii ovttasge� � � � �
4. EARÁ GIVSSIT
Vulobealde lea listu iešguđet váttisvuođain. Leatgo maŋimusvahku dáin ovttage dovdan (otnáš rádjai)? (Russe juohke givssi buohta) Veaháš
Ii giksa- giksa- Hirbmatšuvvan šuvvan Olu olu
Fáhkka ballu ákka haga . . . . . . . . . . . . � � � �
Dovdan balu dahje árgodaga . . . . . � � � �
Skurvvas dahje oaivejorran . . . . . . . . � � � �
Dovdan iežat čavgen dahje huššas� � � �
Álki iežat sivahallat . . . . . . . . . . . . . . . . . � � � �
Oađđinváttisvuođat . . . . . . . . . . . . . . . . . � � � �
Hurvvas, lossamiella . . . . . . . . . . . . . . . . � � � �
Dovdan leat ávkemeahttun,unnán árvvus . . . . . . . . . . . . . . . . . . . . . . . . . � � � �
Dovdan ahte visot lea lossat . . . . . . � � � �
Dovdan eahpedoaivvuboahtteáiggi ektui . . . . . . . . . . . . . . . . . . . � � � �
Jurddašan loahpahit eallima . . . . . . . � � � �1 2 3 4
5. BEARRAŠIS DÁVDDAT
Leago ovttas dahje máŋgasis du váhnemiin IN
dahje oappáin/vieljain leamaš váibmo- JUO II DIE�E
dohppehat dahje angina pectoris? . . . . . . . . . . . . . � � �
Russe daid fulkkiid buohta geain lea dahje lea leamaš muh-tun dáid dávddain ja almmut sin agi goas ožžo dávddaid.(Jus eanet oappát/vieljat, čále su gii áramusat eallimis danoaččui) Ahki
Eadni Áhčči Oabbá Viellja Mánná Ii oktage vuosttas
Váibmo- geardde
dohppehat ovdal60-jagi agi . . . . . . . . � � � � � �
Váibmo-dohppehatmaŋŋil 60-jagi . . . � � � � � �
Diabetes . . . . . . . . . . � � � � � �
Vuoiŋŋas-gáldnanvihki . . . . . � � � � � �
Astma . . . . . . . . . . . . . � � � � � �
Gassačoalle-borasdávda . . . . . . . � � � � � �
Čižžeborasdávda � � � � � �
Manneráksa-borasdávda . . . . . . . � � � � � �
Galle oappá/vielja leat dus? Vielja Oappá

6. DÁLKASIID GEAVAHEAPMI
Dálkasiiguin oaivvildat dás apotehkas oston dálkasiid.Biebmolasáhusat ja vitamiinnat eai lohkko dás mielde.
Geavahatgo? Dál Ovdal, muhto in dál In goassige
Dálkasa alla varradeddui . . . . � � �Kolesterolgeahpedeaddji
dálkasa . . . . . . . . . . . . . . . . . . . . . . . . � � �
Insuliinna . . . . . . . . . . . . . . . . . . . . . . . � � �
Tableahtaid sohkardávdii . . . . � � �
Man dávjá leat maŋimus 4 vahkus geavahan dáid dálkasiid?(Russe oktii juohke linnjás)
In atnán Hárvebut Juohke Beaivvá-maŋimuš go juohke vahku, laččat4 vahku vahku muhto in
beaivvá-laččatBávččasvuogiheaddji
reseptta haga . . . . . . . . . . . . . . . � � � �
Bávččasvuogiheaddjiresepttain . . . . . . . . . . . . . . . . . . . . � � � �
Oađđendálkasiid . . . . . . . . . . . . . � � � �
Ráfohandálkasiid . . . . . . . . . . . . � � � �
Dálkasiid hurvvi vuostá . . . . � � � �
Eará dálkasiid resepttain . . . � � � �1 2 3 4
Daid dálkasiidda maid leat russen bajábeal guovtti čuoggásja maid leat atnán maŋimus 4 vahku:
Bija nama ja manne daid geavahat/leat geavahan (dávdadahje dávdamearka): (Russe dasa man guhká leat dálkasa geavahan)
Gitta JagiDálkasa namma: Manne geavahan 1 jagi dahje(Ovtta nama juohke linnjái) dálkasa: guhkit
� �
� �
� �
� �
� �
Jus dás ii leat doarvái sadji, de sáhtát joatkit eará báhpárii, maid de bijatmielde.
7. BORRAMUŠ JA JUHKAMUŠ
Man dávjá borat dábálaččat dáid borramušaid?(Russe oktii juohke linnjás)
3 g. dahje
Hárve/ 1-3 g. 1-3 g. 4-6 g. 1-2 g. eanetin goassige mánnui vahkkui vahkkui beaivái beaivái
Šattuid . . . . . . . . . . . . . � � � � � �
Murjjiid . . . . . . . . . . . . � � � � � �
Vuosttá (buot šlájaid) � � � � � �
Buđehiid . . . . . . . . . .� � � � � �
Vuššon ruotnasiid � � � � � �
Varas ruotnasiid/saláhta . . . . . . . . . . . . . � � � � � �
1 2 3 4 5 6
Makkár vuoja anát dávjjimusat? (Russe oktii juohke linnjás)
In Mejeri- Garra Dipma/geahppa Oljjuid Eará
geavat vuoja margariinna margariinna
Láibbi alde . . . . . . .� � � � � �
Borramuš-ráhkadeamis . . . . .� � � � � �
1 2 3 4 5 6
Geavahatgo dáid biebmolasáhusaid:Juo, Soames
beaivváláččat háve In
Trána, tránatableahtaid . . . . . . . . . . . . . . . . � � �
Guollevuodjatableahtaid (omega 3) . . . � � �
Vitamiidna/minerálalasáhusaid . . . . . . � � �
Man olu jugat dábálaččat dáin: (Russe oktii juohke linnjás)
Hárve/ 1-6 1 2-3 4 gl.in goassige glása glása glása dahje
vahkkui beaivái beaivái eanetbeaiváiOllesmielkki, kefira,
yoghurta . . . . . . . . . . . . . . . . . . . � � � � �
Geahppamielkki, culturageahppa yoghurta . . . . . . . . � � � � �
Skummamielkki(suvrra, čielga) . . . . . . . . . . . . � � � � �
Liigegeahppamielkki . . . . . � � � � �
Šaddomáihlli . . . . . . . . . . . . . . � � � � �
Čázi . . . . . . . . . . . . . . . . . . . . . . . . � � � � �
Bruvssa/Cola sohkkariin � � � � �
Sohkkarhis bruvssa/Cola � � � � �1 2 3 4 5
Galle gohpa gáfe dahje deaja jugat beaivái?(Bija 0 daid šlájaide maid it juga beaivválaččat) Galle gohpa
Filttargáfe . . . . . . . . . . . . . . . . . . . . . . . . . . . . . . . . . . . . . . . . . . . . . . . . . . . .
Vuoššangáfe/deattagievnni . . . . . . . . . . . . . . . . . . . . . . . . . . . . . . . .
Eará gáfe . . . . . . . . . . . . . . . . . . . . . . . . . . . . . . . . . . . . . . . . . . . . . . . . . . . . .
Deaja . . . . . . . . . . . . . . . . . . . . . . . . . . . . . . . . . . . . . . . . . . . . . . . . . . . . . . . . .
Sullii man dávjá leat maŋimus jagi juhkan alkohola?(Geahppavuolla ja alkoholahis vuolla ii lohkko)
In goassige In juhkan Hui moatti Sullii oktii
juhkan alkohola maŋimuš jagi háve maŋimuš jagi mánnui
� 1 � 2 � 3 � 4
2-3 geardde Su. oktii 2-3 geardde 4-7 gearddemánnui vahkkui vahkkui vahkkui
� 5 � 6 � 7 � 8
Sidjiide geat leat juhkan maŋimus jagi: Go leat juhkan, galle glása dahjedriŋkka leat dábálaččat juhkan? Galle
Sullii gallii maŋimus jagi leat juhkannu olu go uhcimusat 5 glása dahjedriŋkka jándoris? Gallii
Go jugat, jugatgo dalle dábálaččat? (Russe oktii dahje moddii)
� Vuola � Viinni � Buolliviinni
Man guhká?

DEARVVASVUO�ABÁLVALUSAID GEAVAHEAPMI (joatkka)
Hirbmat Duhtavaš Duhta- Hirbmat Induhtavaš meahttun duhtameahttun dieđe
Doaktára giellamáhttu(sámegiella dahjedárogiella) . . . . . . . . . . . . . . . . � � � � �
Oppalohkái, manduhtavaš dahjeduhtameahttun leatdon gieldda doavtter-bálvalusain? . . . . . . . . . . . . . . � � � � �
Man guhká lea dassá go maŋimus fitnet doaktára luhtte?(almmut olles loguin)
(jagi) (mánu)
Jus goassige leat geavahan molssaevttolaš dálkkodeaddji,geaid leat geavahan? (russe oktii dahje moddii)
� Guvllára (lohkki, bossu, giehtadálkkodeaddji)
� Healera
� Akupunktora
� Soneterapevtta, homeopata, kinesiologa jna.
Jus leat geavahan molssaevttolaš dálkodeaddji, de goas leimaŋimus? (almmut olles loguin)
(jagi) (mánu)
Jurddaš mat ahte dál dárbbašat veahki gieldda dearvvas-vuođa- ja sosiálbálvalusas (ruovttubuohccedivššus, ruovt-tuveahkis, sosiála bálvalusain, fysioterapias jna.)
Dieđátgo geainna galggat váldit oktavuođa?� Juo � In � Eahpesihkar
Leatgo oadjebas ahte oaččut veahki jus dan dárbbašat?� Juo � In � Eahpesihkar
Jus dál oaččut veahki gieldda dearvvasvuođa- ja sosiálbál-valusas, leatgo duhtavaš dainna?� Juo � In � Eahpesihkar
VAHÁGAT/LIHKOHISVUO�AT
Leat go leamaš lihkohisvuođas man geažil fertejit doaktáralusa ja/dahje buohccivissui čálihuvvot?
Doaktára lusa � Juo � In Gallii
Buohccevissui čálihuvvot � Juo � In Gallii
DEARVVASVUO�ABÁLVALUSAID GEAVAHEAPMI
Gallii leat maŋimus 12 mánus ieš geavahan:(russe oktii juohke linnjás)
In oktiige 1-3 geardde 4 dahje eanet
Gielddadoaktára/fástadoaktára � � �
Spesialistta . . . . . . . . . . . . . . . . . . . . . . . . � � �
Doavttervávtta . . . . . . . . . . . . . . . . . . . . � � �
Buohccevissui sisačállima . . . . . . � � �
Ruovttubohccedivššu . . . . . . . . . . . . � � �
Gieldda ruovttuveahki . . . . . . . . . . � � �
Fysioterapevtta . . . . . . . . . . . . . . . . . . . . � � �
Kiropraktora . . . . . . . . . . . . . . . . . . . . . . . � � �
Bátnedoaktára . . . . . . . . . . . . . . . . . . . . � � �
Molssaevttolaš dálkkodeaddji � � �
Galle doaktára luhtte leat ieš leamaš maŋimus 12 mánu?(almmut galle)
Leatgo ožžon namahuvvot fástadoaktára? � Juo � In
Go leat iskkadeamis, makkár gillii gulahallabeahtti doaktáriin?(russe oktii dahje máŋgii)
� Dárogillii � Sámegillii � Gevahan dulkka
� Eará gillii
Jáhkátgo ahte doai doaktáriin eahppi áddehala giella-váttisvuođaid geažil?
� Ean goassige � Hárve � Duollet dálle � Dávjá
� Eahpesihkar
Jus dárbbašuvvo dulka, leago doavttir du mielas doarváičeahppi dan bivdit?
� Juo, álohii � Juo, dábálaččat � Ii álohii
� Ii goassige � In liiko dulkka geavahit
Man duhtavaš dahje duhtameahttun leat don gielddadoavtterbálvalusa čuovvovaš beliin du ássangielddas?(russe oktii juohke linnjás)
Hirbmat Duhtavaš Duhta- Hirbmat Induhtavaš meahttun duhtameahttun dieđe
Doaktára lusa gaska � � � � �
Doaktára fidnettelefovnnas . . . . . . . . . . . . . .� � � � �
Vuordináigi doaktáralusa . . . . . . . . . . . . . . . . . . . . . . . . .� � � � �
Áigi doaktára luhtte . . . . . .� � � � �
Beasat muitalit duváttuid birra . . . . . . . . . . . . . . .� � � � �
Doaktára áddejupmidu kulturduogážii . . . . . . . .� � � � �
Doaktára dieđiheapmidu dearvvasvuođa-váttuid, iskkadeamija dálkkodeami birra . . . . .� � � � �

VAHÁGAT/LIHKOHISVUO�AT (joatkka)
Jus juo, de makkár lihkohisvuođas(ide) leat dálkkoduvvon?(russe oktii dahje moddii juohke linnjái)
Bargu Ruoktu Asttoáigi In makkárge
Biila . . . . . . . . . . . . . . . . . . . . . . . . .� � � �
Mohtorsikkel . . . . . . . . . . . . .� � � �
Muohtaskohter . . . . . . . . . . . .� � � �
Njealjejuvllatsihkkel . . . . .� � � �
Traktor . . . . . . . . . . . . . . . . . . . . . .� � � �
Gahččanlihkohisvuođat � � � �
Čuohpadanvahágat . . . . . .� � � �
Eará . . . . . . . . . . . . . . . . . . . . . . . . .� � � �
Lea(t)go lihkohisvuohta(đat) geahpedan bargonávccaid?� Áibbas � Belohahkii � Ii/eai oppanassiige
BEARAŠ JA GIELLADUOGÁŠ
Davvi-Norggas ásset máŋgga čearddaduogáš olbmot. Dátmearkkaša ahte hállet máŋggalágan giela ja leat iešguđetkultuvrrat. Ovdamearkkat čearddalaš duogážii, dahje čerdiileat dáža, sámi ja kveana.
Makkár ruovttugiella lea/lei dus, du váhnemiin ja áhkuin/ádjáin? (russe oktii dahje máŋgii)
Dárogiella Sámegiella Kveanagiella Eará, čilge
Eatniáhčis: � � � � . . . . . . . . . . . . . .
Eatnieatnis: � � � � . . . . . . . . . . . . . .
Áhčiáhčis: � � � � . . . . . . . . . . . . . .
Áhčieatnis: � � � � . . . . . . . . . . . . . .
Áhčis: � � � � . . . . . . . . . . . . . .
Eatnis: � � � � . . . . . . . . . . . . . .
Mus: � � � � . . . . . . . . . . . . . .
Mii lea du, áhččát ja eadnát čearddaduogáš? (russe oktii dahje moddii
Dáru Sámi Kveana Eará, čilge
Mu čearddaduogáš lea: � � � � . . . . . . . . . . .
Áhči čearddaduogáš lea: � � � � . . . . . . . . . . .
Eatni čearddaduogáš lea: � � � � . . . . . . . . . . .
Maid logat iežat leat? (russe oktii dahje moddii)
Dáža Sámi Kveana Eará, čilge
� � � � . . . . . . . . . . .
BARGOEALLIN/RUHTADILLI
Makkár bargu/eallinbirgejupmi lea dus? (russe oktii dahje moddii)
� Fástabálká, ollesáigi � Fástabálká, oasseáigi
� Áigodatbargu � Iešbirgejeaddji ealáhusdoalli
� Bargguheapme � Ruovttus
� Boarrásiidoajus � Bargonávccahisvuođaruhta
� Eará (čilge) . . . . . . . . . . . . . . . . . . . . . . . . . . . . . . . . . . . . . . . . . . . . . . . . . . . . . . . . .
BARGOEALLIN/RUHTADILLI (joatkka)
Sáhtášitgo jurddašit fárret ássangielddastat jus fállo dutnjebargu eará báikkis? � Juo � In � Muhtun ráje jagis � Eahpesihkar
Jus leat bargguheapme, muital man guhká leat bargguohcan: (almmut olles loguin)
(jagi) (mánu)
Jus leat iešbirgejeaddji ealáhusdoalli, makkár ealáhusasbarggat? (russe oktii dahje moddii)
� Boazodilis � Guolásteamis � Eanadoalus
� Vuovdedoalus � Gávpedoaimmas
� Eará (čilge) . . . . . . . . . . . . . . . . . . . . . . . . . . . . . . . . . . . . . . . . . . . . . . . . . . . . . . . .
Gallis ásset du bearašgottis?
(galle olbmo)
Man stuoris lea bearraša/bearašgotti bruttosisaboahtu jahkái?
� Vuollel 150000 ru. � Ru. 150 000–300 000
� Ru. 301 000–450 000 � Ru. 451 000–600 000
� Ru. 601 000–750 000 � Badjel 750 000 ru.
Man dávjá spealat makkárnu ruhtaspealuin nugo lotto, tihp-pen, speallanautomáhtat ja sullasaččain?
� In goassige/hárve � 1–3 geardde mánnui
� Oktii vahkkui � 2–6 geardde vahkkui
� Juohke beaivvi
Man olu spealat gaskamearálaččat vahkkui?
� Vuollel 100 ru. vahkkui � 100–500 ru. vahkkui
� 501–1000 ru. vahkkui � Badjel 1000 ru. vahkkui
GIVSSIDEAPMI
Givssidemiin oaivvildat go okta dahje moattis dutnje baháidmáŋgii dadjet dahje dahket, ja dus lea váttis iežat bealuštit.
Leatgo goassige givssiduvvon? � Juo, maŋimus 12 mánu � Juo, ovdal � In
Jus leat givssiduvvon, de mo leat givssiduvvon?(russe oktii dahje moddii)
� Bostalemiin � Badjelgeahččamiin
� Vealaheaddji mearkkašumiiguin � Eará
Sáhtášitgo muitalit gos dát geavvá/geavai? (russe oktii dahje moddii)
� Skuvllas � Skuvlainternáhtas � Fidnoeallimis
� Báikegottis � Eará

8. BORGGUHEAPMI JA SNUVSSEN
Man guhká leat beaivái dábálaččatsuovvalanjas? Galle olles diimmu
Borgguhiigo oktage rávisolmmoš ruovttus JUO II
go bajásšaddet? � �
Ásatgo, dahje leatgo ássan, ovttas beaivválaš JUO IN
borgguheaddjiiguin maŋŋil go devdet 20 jagi? � �
Leatgo borgguhan/borgguhatgo beaivválaččat?� Juo, dál � Juo, ovdal � In
Jus borgguhat beaivválaččat dál, borgguhatgo: JUO IN
Sigareahtaid? . . . . . . . . . . . . . . . . . . . . . . . . . . . . . . . . . . . . . . . . . . . . . . . . � �
Sigáraid/sigarillos/biippu? . . . . . . . . . . . . . . . . . . . . . . . . . . . . . . . . � �
Geassanduhpáha/rullings? . . . . . . . . . . . . . . . . . . . . . . . . . . . . . . . . � �
Jus beaivválaččat leat borgguhan ovdal,man guhká lea dassá go heitet? Galle jagi
Jus borgguhat beaivválaččat dál, dahje leat borgguhan ovdal:Galle sigareahta borgguhat/borgguhit dábálaččat beaivái? Galle sigareahta
Man boaris ledjet go borgguhišgohtetbeaivválaččat? Ahki
Galle jagi leat oktiibuot borgguhanbeaivválaččat? Galle jagi
Leatgo snuvssen/snuvssetgo beaivválaččat? � Juo, dál � Juo, ovdal � In
Jus snuvsset/leat snuvssen, galle jagileat oktiibuot snuvssen? Galle jagi
9. LÁŠMMOHALLAN JA RUMAŠLAŠ LIHKADEAPMI
Mo lea du rumašlaš lihkadeapmi astoáiggis leamaš maŋimusjagi? (Jurddaš gaskameari vahkus jahkái. Mátki bargui lohkkoastoáigin. Vástit goappašiid gažaldagaid)
D i i m m u i d v a h k k u i :Ii ovttage Vuollel 1 1-2 3 dahje eanet
Gehppes lihkadeapmi(Ii bivastuvvo/šieđđaluvvo) . . . . . .� � � �Garra rumašlaš bargu(Bivastuvvo/šieđđaluvvo) . . . . . . . .� � � �
1 2 3 4
Almmut lihkadeami ja rumašlaš rahčamušaid du astoáiggis.Jus lea hui máŋggalágan lihkadeamit omd. gaskal geasi jadálvvi, de bija gaskameari. Gažaldat guoská dušše maŋimusjahkái. (Russe ruvttui mii buoremusat heive)
Logat, geahčat tv dahje earájaskačohkká buđaldus? . . . . . . . . . . . . . . . . . . . . . . . . . . . . . . . . . � 1
Váccát, sihkelasttát dahje lihkadat earáláhkai ainjuo 4 diimmu vahkkui?(Loga maid vázzima dahje sihkelastimabargui, sotnabeaimátkkiid jna.) . . . . . . . . . . . . . . . . . . . . . . . . . . . . . . . � 2
Lášmmohalat, barggat losit bealdobarggu js.?(Merke ahte lihkadeapmi galgá leat ainjuo4 diimmu vahkkui) . . . . . . . . . . . . . . . . . . . . . . . . . . . . . . . . . . . . . . . . . . � 3
Hárjehalat garrasit dahje gilvvohalatjeavddalaččat ja máŋgii vahkkui? . . . . . . . . . . . . . . . . . . . . � 4
10. OAHPPU JA BARGU
Galle jagi leat skuvllaid vázzán? (Bija buot
jagiid go leat skuvllaid vázzán dahje studeren) Galle jagi
Mo loavttát barggus?
1� Hirbmat bures 2� Bures
3� Heittogit 4� Hirbmat heittogit
Oaivvildatgo ahte orut massimin dálá barggut JUO IN
dahje sisaboađut lagamus 2 jagi? � �
Oaččutgo ovttage dáid doarjagiin? JUO IN
Buohcceruđa . . . . . . . . . . . . . . . . . . . . . . . . . . . . . . . . . . . . . . . . . . . . . . . . � �
Barguimáhcahandoarjaga . . . . . . . . . . . . . . . . . . . . . . . . . . . . . . . . . � �
Sosiálveahki/-doarjaga . . . . . . . . . . . . . . . . . . . . . . . . . . . . . . . . . . . . . � �
Gaskaboddosašdoarjaga ovttaskasfuolaheaddjiide . . . . . . . . . . . . . . . . . . . . . . . . . . . . . . . . . . . . . . . . . . . . . � �
11. DUŠŠE NISSONOLBMOT GALGET VÁSTIDIT DÁS RÁJES SKOVIS
Man boaris ledjet go vuosttas gearddeožžot mánnodávddaid? Ahki
Jus eai šat leat mánnodávddat, man boarisledjet go dat nohke? Ahki
Leatgo dál áhpeheapme?Juo In Eahpesihkkar Badjel sahkkoagi� 1 � 2 � 3 � 4
Galle máná leat riegádahttán? Galle máná
Jus leat máná riegádahttán, deavdde juohke máná riegádan-jagi, ja galle mánu njamahit maŋŋil riegádahttima?(Jus it njamahan, čále 0) Galle mánu
Mánná: Riegádanjahki: njamahan:
1. mánná . . . . . . . . . . . . . . . . . . . . .
2. mánná . . . . . . . . . . . . . . . . . . . . .
3. mánná . . . . . . . . . . . . . . . . . . . . .
4. mánná . . . . . . . . . . . . . . . . . . . . .
5. mánná . . . . . . . . . . . . . . . . . . . . .
(Jus eanet mánát, čále sierra árkii)
Geavahatgo, dahje leatgo geavahan? (Russe oktii juohke linnjás)
Dál Ovdal,muhto In
in dál goassige
P-pilla/minipilla/p-cirgganasa . . . . . . . . . . . .� � �
Hormonspirála (ii dábálaš spirála) . . . . . . . . . . .� � �
Østrogena (tableahtaid dahje plastera) . . . . . . . .� � �
Østrogena (vuoidasa dahje čuggestatpillaid) � � �
Jus geavahat/leat geavahan reseptageatnegasøstrogena: Man guhká leat dan geavahan? Galle jagi
Jus geavahat p-pilla, minipilla, p-cirgganasa, hormonspiráladahje østrogena: makkár mearkka geavahat?
Almmut:
IN 2
513-
2040
-3 -
13
000
– B
JØR
KM
AN
NS
TRY
KK
ERI 0
2.03
Ále čále dákko

1. DÁVDAMEARKKAT
Gosatgo masá beaivválaččat soames JUO IN
áiggiid jagis? . . . . . . . . . . . . . . . . . . . . . . . . . . . . . . . . . . . . . . . . . . . . . . . � �
Leatgo ná gossan nu guhká go 3 mánu guoktemaŋimus jagi? . . . . . . . . . . . . . . . . . . . . . . . . . . . . . . . . . . . . . . . . . . . . . . . � �
Dáhpáhuvvágo ahte giksašuvat nagirgeahtesvuođas? � �
Jus juo, goas giksašuvat eanemus nagirgeahtesvuođas? (Russe oktii dahje moddii)
� Miehtá jagi � Giđđat � Geassit� Čakčat � Dálvit
Leatgo maŋimus jagi giksašuvvon nagirgeahtes- JUO IN
vuođas nu ahte lea čuohcan bargonávccaide? � �
Leatgo eanaš duhtavaš iežat eallindiliin?
� Hirbmat duhtavaš � Hui duhtavaš� Veaháš duhtameahttun � Hirbmat duhtameahttun
Geavvágo ahte guhkit áiggi – ainjuo 14 beaivvi JUO IN
– leat váivvis ja šlunddas? . . . . . . . . . . . . . . . . . . . . . . . . . . . . . . . � �
Leatgo maŋimus 14 beaivvi dovdan ahte it nákce čoavditváttisvuođaidat?� In � Muhtumin � Dávjá � Masá oppa áigge
Dovddatgo goassige iežat okto?� In � Muhtumin � Dávjá
2. BORRAMUŠ DÁL
Áiggošeimmet dus jearrat ahte man dávjá lávet muhtun bor-ramušsorttaid borrat. Jurddas maŋimus jagi gaskameari.Russe juohke linnjái galle geardde. Jus ii muitte justa, dedeavdde nu bures go sáhtát.
Gallii vahkus lávet mállásiid borrat? Gallii
Man dávjá lea mállásiin: Ii goassige/ 1 g. 2-3 g. 1 g. 2 g. 3 g. 4 g. 5+
hárve mánnui mánnui vahkkui vahkkui vahkkui vahkkui vahkkui
Guolli . . . . . . . � � � � � � � �
Biergu . . . . . . . � � � � � � � �(obba,ferdnejuvvon) � � � � � � � �
Ii guolliiige biergu � � � � � � � �
Man dávjá borat vuššon dorski ja sáiddi mállásiidda?In goassige 1-11 g. 1 g. 2-3 g. 1 g. 2 g. 3+ g.
jahkái mánnui mánnui vahkkui vahkkui
Dorski (omd. varas, . . . . � � � � � � �veaháš sáltejuvvon,suovas, boahkis)
Sáiddi (omd. varas, . . . . � � � � � � �boahkis)
Man dávjá borat eará vuššon guoli mállásiidda? In goassige 1-5 g. 6-11 g. 1 g. 2-3 g. 1 g. 2+ g.
jahkái jahkái mánnui mánnui vahkkui vahkkuiBuoiddesguollesorttaid � � � � � � �(omd. luosa, báldá,háhká, rávddu,dápmoha, čuovžža)
Ruoidna guolle-sorttaid (omd. � � � � � � �divssu/juvssu, vuskona, hávgga,hárri)
Man dávjá borat báiston guoli mállásiidda?In goassige 1-5 g. 6-11 g. 1 g. 2-3 g. 1 g. 2+ g.
jahkái jahkái mánnui mánnui vahkkui vahkkuiBuoiddesguollesorttaid � � � � � � �(omd. báiston luosa,sallida,rávddu,dápmoha, čuovžža)
Ruoidnaguollesorttaid � � � � � � �(omd. báistonsáiddi, dorski,vuskkona, hávgga,hárri)
LASSIGAŽALDAGAT DEARVVASVUO�A- JA EALLIN-DILLEISKKADEAPMÁI
Giitu go bohtet dearvvasvuođaiskkadeapmái. Dán láhkaileat veahkehan háhkat ođđa dieđuid dearvvasvuođa jaeallindili birra guovlluin gos ásset sápmelaččat ja dážat. Iskkadeami váldoulbmil lea leamaš háhkat ođđa dieđuidváibmovarrasuotnadávddaid birra, vai daid sáhtášii easta-dit. Iskkademiin galgat dasa lassin oažžut máhtu earádávddaid ja givssiid birra, nu ahte sáhttit olbmuid dearv-vasvuođas fylkkas bidjat várdosa. Danne bivdit du vásti-dit soames gažaldaga diliin mat sáhttet leat mávssolaččatdáid ja eará dávddaide.
Devdon skovvi sáddejuvvo čuovvu vástidankonfaluhtas.Porto lea mákson. Giitu ovddalgihtii veahki ovddas!
Ustitlaš dearvvuođaiguin Sámi dearvvašvuođadutkama guovddáš ja
Nasjonalt folkehelseinstitutt
Beaivi goas deavddát:
Beaivi Mánnu Jahki

2. BORRAMUŠ DÁL (joatkka)
Man dávjá borat guolleborramuša mállásiidda?In goassige 1-5 g. 6-11 g. 1 g. 2-3 g. 1 g. 2+ g.
jahkái jahkái mánnui mánnui vahkkui vahkkui
Guollegáhkuid/bulláid/deartna � � � � � � �
Guollegra-tiinna/guollerutta . . . . . . � � � � � � �
Guollesákkiid/skávuhuvvonguoli . . . . . . . . . . . . . � � � � � � �
Man dávjá borat guollesuvlli? In goassige 1-11 g. 1 g. 2-3 g. 1-2 g. 3-4 g. 5+ g.
jahkái mánnui mánnui vahkkui vahkkui vahkkui
Spihke-/sálteguoli . . . . . . . . . . . . . � � � � � � �
Suovasguoli . . . . . . . . . . � � � � � � �
Makrealla tomáhtas � � � � � � �
Sallitsuvlli . . . . . . . . . . . . � � � � � � �(omd. suvrrasallit,
tomáhtasallit)
Meađđennjuvddus � � � � � � �
Eará guollesuvlli . . . . . � � � � � � �
Galle geardde jagis borat guollesiskkožiid? 0 1-3 4-6 7-9 10+
Guollevuoivasa . . . . . . . . . . . � � � � �
Meađđemiid . . . . . . . . . . . . . . . � � � � �
Man dávjá borat čuovvovaš borramušaid?In goassige 1-5 g. 6-11 g. 1 g. 2-3 g. 1 g. 2+ g.
jahkái jahkái mánnui mánnui vahkkui vahkkui
Pizza . . . . . . . . . . . . . . . . . . � � � � � � �
Spagetti,pastaborramušaid . . . � � � � � � �
Hamburgera láibbis � � � � � � �
Biergogáhkuid/karbonádaid . . . . . . . . . . � � � � � � �
Márffiid . . . . . . . . . . . . . . . � � � � � � �
Ruitoborramuša . . . . . � � � � � � �
Man dávjá borat obba bierggu mállásiidda (omd.čielgečaskásiid, čoarbeali, ruitobierggu, biffa, deahki)?
In goassige 1-5 g. 6-11 g. 1 g. 2-3 g. 1 g. 2+ g.
jahkái jahkái mánnui mánnui vahkkui vahkkui
Vuoncáčivgga . . . . . . . . � � � � � � �
Spiinni . . . . . . . . . . . . . . . . � � � � � � �
Vuoksá/šibiha . . . . . . . . � � � � � � �
Sávzza/lábbá . . . . . . . . . � � � � � � �
Ealgga . . . . . . . . . . . . . . . . . � � � � � � �
Fállá . . . . . . . . . . . . . . . . . . . � � � � � � �
Man dávjá borat bohccobierggu?In goassige 1-11 g. 1 g. 2-3 g. 1 g. 2 g. 3+ g.
jahkái mánnui mánnui vahkkui vahkkui vahkkuiVuššon bohcco-bierggu/liema . . . . . . . . � � � � � � �
Báiston bohcco-bierggu . . . . . . . . . . . . . . . . � � � � � � �
(Olles, cáhppon,fierdnejuvvon)
Suovasbierggu . . . . . . . � � � � � � �
Goikebierggu . . . . . . . . � � � � � � �
Man dávjá borat eará borramuša bohccos?In goassige 1-5 g. 6-11 g. 1 g. 2-3 g. 1 g. 2+ g.
jahkái jahkái mánnui mánnui vahkkui vahkkui
Bohccovarra-borramuša . . . . . . . . . . . . � � � � � � �
Ađđamiid . . . . . . . . . . . . . � � � � � � �
Bohcconjuokčama . . � � � � � � �
Bohccovuoivasa . . . . . � � � � � � �
Galle mearraloddemani borat jahkái? 0 1-3 4-6 7-9 10+
Galle mani . . . . . . . . . � � � � �
Man dávjá borat murjjid? Oktii vástida 1 láibevajahas muorjemeasttuin, joŋaid 1máleslihttái, 1 bajálušlihttái, 1 glása máihlli, dahje ovttamátkkis goas borret varas murjjiid.
In goassige 1-5 g. 6-11 g. 1 g. 2-3 g. 1-2 g. 3+ g.
jahkái jahkái mánnui mánnui vahkkui vahkkuiLuopmániid:
Varas, galmmihuvvon,firrojuvvon . . . . . . . . . . . . . � � � � � � �
Vuššon/oston meastu � � � � � � �
Joŋaid:
Varas, galmmihuvvon,firrojuvvon . . . . . . . . . . . . . � � � � � � �
Vuššon/oston meastu � � � � � � �
Sarridiid:
Varas, galmmihuvvon,firrojuvvon . . . . . . . . . . . . . � � � � � � �
Vuššon/oston meastu � � � � � � �
Máihlli . . . . . . . . . . . . . . . . . . � � � � � � �
Čáhppesmurjjiid:
Varas, galmmihuvvon � � � � � � �
Máihlli . . . . . . . . . . . . . . . . . . � � � � � � �
Mo lávet don/láve du dállodoallu háhkat čuovvovašvuođđoávdnasiid iežat/iežas atnui? (Russe oktii dahje moddii)
In bora Visot Belohahkii Oastit Oastit Lonuhatgoassige/ háhkat háhkat buvddas priváhta dahjehárve ieža ieža oažžutBierggu:
Bohcco . . . . . . � � � � � �
Sávzza . . . . . . . � � � � � �
Ealgga . . . . . . . . � � � � � �

In bora Visot Belohahkii Oastit Oastit Lonuhatgoassige/ háhkat háhkat buvddas priváhta dahjehárve ieža ieža oažžuGuoli:
Sáivaguoli . . . � � � � � �
Mearraguoli � � � � � �
Murjjiid:
Luopmániid � � � � � �
Joŋaid . . . . . . . . � � � � � �
Man dávjá lávet bivdit, guolástit ja murjet? In goassige Hárve Muhtumin Olu ástoáiggis
Bivdit rievssahiid/fuđožiid . . . . . . . . . . . . � � � �
Bivdit fuođđuid . . . � � � �
Guolástit . . . . . . . . . . . � � � �
Murjet . . . . . . . . . . . . . . � � � �
Man dávjá leat borran váldomállása iežat dállodoalu sállašismaŋimus jagi?
In goassige 1-5 g. 6-11 g. 1 g. 2-3 g. 1 g. 2+ g.
jahkái jahkái mánnui mánnui vahkkui vahkkui
Váldomállása bivddus � � � � � � �Váldomállásaguolásteamis . . . . . . . . . . . � � � � � � �
3. BORRAMUŠ BAJÁSŠADDAMIS
Jurddaš ruovttu borramuša birra ovdal go fárrejit sierra. Jusásset eanaš oasi jagis internáhtas, de jurddaš borramušabirra doppe.
Ássetgo internáhtas (stáhtainternáhtas dahje priváhta) govázzet mánáid- ja nuoraidskuvlla?
� Juo, nuoraidskuvllas� Juo, mánáidskuvllas� Juo, sihke mánáid- ja nuoraidskuvllas� In goappáge
Jus juo, galle luohká?
Man guhká ledjet internáhtas gaskamearálaččat juohkeluohkás? � 1-3 mánu � 4-6 mánu � 7-9 mánu
Man dávjá borret guoli ja bohccobierggu bajásšaddamis?
In goassige 1-11 g. 1 g. 2-3 g. 1-2 g. 3-4 g. 5+ g.
jahkái mánnui mánnui vahkkui vahkkui vahkkui
Vuššon/báiston guoli � � � � � � �
Bohccobierggu . . . . . . � � � � � � �
Man dávjá borret eará borramušaid bajásšaddamis?In goassige 1-11 g. 1 g. 2-3 g. 1 g. 2 g. 3+ g.
jahkái mánnui mánnui vahkkui vahkkui vahkkui
Varraborramuša . . . . . � � � � � � �
Sávzzabierggu . . . . . . . � � � � � � �
Biergogáhkuid,márffiid . . . . . . . . . . . . . . . � � � � � � �
Guolleborramuša . . . � � � � � � �
Guollevuoivasaja meađđemiid . . . . . . � � � � � � �
Suohkada,bánnogáhkuid . . . . . . . � � � � � � �
JUO IN
Ožžotgo medisiinnalaš trána bajásšaddamis? � �
Ožžotgo trána omd. guollái (eará vuoja sadjái)? � �
Man dávjá borret meahccemurjjiid ja šattuid bajásšaddamis?
In goassige 1-5 g. 6-11 g. 1 g. 2-3 g. 1-2 g. 3+ g.
jahkái mánnui mánnui vahkkui vahkkui vahkkui
Meahccemurjjiid . . . . � � � � � � �
Jupmuid . . . . . . . . . . . . . . � � � � � � �
Borranrási . . . . . . . . . . . . � � � � � � �
Leago borramuš maid dál borat earálágan go maid borretbajásšaddamis? � Ii � Veaháš earálágan� Hui earálágan � Hirbmat earálágan
4. IDJABORRAN
Morihatgo dávjá boradit maŋŋil go eahkedis JUO IN
leat velledan? . . . . . . . . . . . . . . . . . . . . . . . . . . . . . . . . . . . . . . . . . . . . . . � �
Jus "juo", vástit boahtte 4 gažaldaga:
Goas leat dus dávjjimusat givssit? (Bija ovtta dahje moadde ruossa)
� Miehtá jagi � Giđđat � Geassit� Čakčat � Dálvit
Maid borat ihkku? (Russe oktii dahje moddii)
� Bierggu � Láibeborramuša � Njálgáid � Eará
Boratgo eanet go beali jándora borramušas JUO IN
maŋŋil di. 20 eahkedis? . . . . . . . . . . . . . . . . . . . . . . . . . . . . . . . . . . � �
Givssiduvvojitgo earát bearrašis JUO EAI IN DIE�E
idjaborramiin? � � �
Leago dus bargovuorru, idjabargu dahje JUO INvuoruid váccát? . . . . . . . . . . . . . . . . . . . . . . . . . . . . . . . . . . . . . . . . . . . � �
5. BAJÁSŠADDAN, BEARAŠ JA USTIBAT
Man gielddas leat ássan guhkitgo ovtta jagi? Gielda: 1. Riegádanbáiki: . . . . . . . . . . . . . . . . . . . . . . . . . . 0 jagi rájes jahkái
2. . . . . . . . . . . . . . . . . . . . . . . . . . . . . . . . . jagi rájes jahkái
3. . . . . . . . . . . . . . . . . . . . . . . . . . . . . . . . . jagi rájes jahkái
4. . . . . . . . . . . . . . . . . . . . . . . . . . . . . . . . . jagi rájes jahkái
5. . . . . . . . . . . . . . . . . . . . . . . . . . . . . . . . . jagi rájes jahkái
JUO INÁsatgo ovttas náittosguimmiin/elošteaddjiin? � �
Leago dus beaivválaš dahje juhkkon fuolahus: JUO II
Mánnái/mánáide? . . . . . . . . . . . . . . . . . . . . . . . . . . . . . . . . . . . . . . . . . � �
Váhnemiidda/earáide? . . . . . . . . . . . . . . . . . . . . . . . . . . . . . . . . . . . . � �
Galle buori ustiba leat dus?(Geaiguin sáhtát oadjebasat hállat ja geatsáhttet du veahkehit jus dan dárbbašat.Ále loga sin geaiguin ovttas ásat,muhto eará fulkkiid gal) Galle ustiba

Gulatgo ovttage dáid searvegottiide/oskkuide?(Russe oktii dahje moddii)
� Stáhtagirku miellahttu
� Lestadiánalaš searvegoddái
� Eará searvegoddái
� In miellahttu ovttage searvegottis
Dovddatgo ahte sáhtát váikkuhit dan mii dáhpáhuvvá báike-gottis gos ásat? (Russe dušše oktii)
� Juo, hui olu � Juo, muhtun muddui� Juo, unnán � In � In leat geahččalan
6. ÁRVOČATNAŠUPMI
BUOHKAIDE: Leago dutnje dehálaš leat luonddus? Hirbmat Unnán Áibbasdehálaš Dehálaš dehálaš deattoheapme
� � � �
Leago luonddu ávkkástallan nugo guolásteapmi, bivdu jamurjen dutnje dehálaš? Hirbmat Unnán Áibbasdehálaš Dehálaš dehálaš deattoheapme
� � � �
Leatgo sohka- ja bearašárbevierut dutnje dehálaččat bisuhit?Hirbmat Unnán Áibbasdehálaš Dehálaš dehálaš deattoheapme
� � � �
Leatgo vásihan ahte leat givssiduvvon dahje vealahuvvon dučearddalaš duogáža (sámi, kveana, ruošša, tamila, dáža jna.)geažil?
Hui máŋgii Muhtumin Hárve In oppanassiige� � � �
Jáhkátgo ahte čearddalaš unnitloguid vealaheapmi sáhttádearvvasvuhtii čuohcat heajos guvlui?
Hui olu Muhtun láhkai Unnán Ii oppanassiige� � � �
Dovddatgo ahte ealáhusastis leat duvdojuvvomin eret?
Hui olu Muhtun láhkai Unnán Ii oppanassiige� � � �
7. SIDJIIDE GEAIN LEA SÁMI DUOGÁŠ:
Leatgo sámi bivttasvierut dutnje dehálaččat?
Hirbmat Unnán Áibbasdehálaš Dehálaš dehálaš deattoheapme
� � � �
Maid mearkkaša dutnje duodji?
Hirbmat stuorra Stuorra Unnán Ii makkárge mearkkašupmi mearkkašupmi mearkkašupmi mearkkašupmi
� � � �
Maid mearkkaša dutnje sámegiela seailluheapmi ja ovddi-deapmi?
Hirbmat stuorra Stuorra Unnán Ii makkárge mearkkašupmi mearkkašupmi mearkkašupmi mearkkašupmi
� � � �
Leago dutnje dehálaš ássat báikegottis gos beaivválaččatsáhtát deaivvadit eará sámiiguin?
Hirbmat Unnán Áibbasdehálaš Dehálaš dehálaš deattoheapme
� � � �
Leago du mielas dehálaš ahte mihtilmas sámi ealáhusatbisuhuvvojit?
Hirbmat Unnán Áibbasdehálaš Dehálaš dehálaš deattoheapme
� � � �
Leago dehálaš dutnje ahte ovddiduvvo ođđaáigásaš sámiskuvla?
Hirbmat Unnán Áibbasdehálaš Dehálaš dehálaš deattoheapme
� � � �
Leago dutnje dehálaš ahte sámi báikegottit berrešit oažžuteanet ođđaáigásaš bargosajiid?
Hirbmat Unnán Áibbasdehálaš Dehálaš dehálaš deattoheapme
� � � �
Maid mearkkašit dutnje sámi mediat (TV, aviissat, girjjit)? Hirbmat stuorra Stuorra Unnán Ii makkárge mearkkašupmi mearkkašupmi mearkkašupmi mearkkašupmi
� � � �
Maid mearkkaša dutnje ođđa sámi dáidda (govvadáidda,musihkka, filbma ja teáhter)? Hirbmat stuorra Stuorra Unnán Ii makkárge mearkkašupmi mearkkašupmi mearkkašupmi mearkkašupmi
� � � �
Mo du mielas lea go sámi servodat ja kultuvra jagiid mieldelea ožžon lagat riikkaidgaskasaš oktavuođaid?
Hirbmat Unnán Áibbasdehálaš Dehálaš dehálaš deattoheapme
� � � �
Maid mearkkaša dutnje Sámediggi? Hirbmat stuorra Stuorra Unnán Ii makkárge mearkkašupmi mearkkašupmi mearkkašupmi mearkkašupmi
� � � �
Dovddatgo ahte nuoskkideapmi luonddus dahje sisabahkkenlundui áitá du sámi eallima?
Hui olu Muhtun láhkai Unnán Ii oppanassiige� � � �
Dovddatgo ahte ođđaáigásaš ovdáneapmi duvdá eret sámikultuvrra? Hui olu Muhtun láhkai Unnán Ii oppanassiige
� � � �
GIITU VEAHKI OVDDAS!MUITTE SKOVI OTNE POSTET!


ISBN xxx-xx-xxxx-xxx-x