COMPANY UPDATE NOT RATED - Baroda E-Trade
24
COMPANY UPDATE BOB Capital Markets Ltd is a wholly owned subsidiary of Bank of Baroda Important disclosures, including any required research certifications, are provided at the end of this report. NOT RATED PRATAAP SNACKS | Packaged Foods | 21 December 2021 Emerging contender in booming snacks business ▪ Fast-growing player in savoury packaged snacks. Strengthening of processes (to stabilise RM cost) and distribution channels to spur growth Ruchitaa Maheshwari [email protected] Source: NSE | Price as of 20 Dec 2021 Stock performance Source: NSE ▪ Aggressive expansion into sweet snacks planned over the next 2-3 years – a relatively untapped high-margin, high-growth category ▪ Targeting 18‐20% revenue CAGR over three years and 8-10% margins. Trading at ~33x FY21 EV/EBITDA; we do not have a rating on the stock We interacted with the management of Prataap Snacks (PSL, Not Rated) to gain insights into the company’s efforts towards achieving stated growth and profitability targets. Key takeaways: Value for money + Innovations + Strong distribution reach to drive growth: PSL is one of the fastest growing organized players in the attractive savory segment. PSL has established itself in a highly competitive intensity by a) value for money player, b) constantly focussing on new innovations and expanding its product profile, c) streamlining its distribution channel (from 3 tier to 2 tier by removing super stockists), d) ~2mn retail outlets spread across 31 States & UT, e) faster market replenishment, f) emphasis on popular flavours, g) relevant marketing schemes and h) tapping newer geographies in order to accelerate its revenue growth trajectory. PSL has not only multiplied its market share (1% to ~6% from 2010 to 2020) in just ten years, but also expanded pan India. Management envisages these initiatives to lead to 18‐20% revenue CAGR and 8-10% EBITDA margin over FY21-FY24E. Geographical expansion to fuel growth: PSL has a strong presence in Madhya Pradesh, Mumbai, Delhi, Haryana, West Bengal and Orissa (+50% of revenue). It sees large, untapped potential in Uttar Pradesh, Bihar, Punjab, J&K and South India, and is looking to expand its footprint in these areas. Deepening distribution in existing markets: PSL is tapping potential outlets by enrolling new retailers through tele-calling. These additional outlets could provide a ~30% jump in revenue. Till now, PSL has tapped an additional 60,000 outlets and plans to add 250,000 by Apr’22. The tele-callers will also push other products which were not being sold earlier, thereby increasing traction across the product line. PLI scheme to bolster revenue: Under the government’s PLI scheme (base year 2019-20), PSL will receive an incentive of 7.5% of the incremental sales on all its products except potato chips for the first four years, followed by 6.75% in FY26 (base year FY22) and 6% in FY27 (base year FY23). As the company’s financials got impacted due to the covid, management expects benefit to flow in from FY23. 420 710 1,000 1,290 1,580 1,870 Dec-18 Mar-19 Jun-19 Sep-19 Dec-19 Mar-20 Jun-20 Sep-20 Dec-20 Mar-21 Jun-21 Sep-21 Dec-21 DIAMOND NSE Nifty (Relative) Ticker/Price DIAMOND IN/Rs 841 Market cap US$ 296.5mn Free float 29% 3M ADV US$ 0.4mn 52wk high/low Rs 855/Rs 485 Promoter/FPI/DII 72%/5%/21%
-
Upload
khangminh22 -
Category
Documents
-
view
0 -
download
0
Transcript of COMPANY UPDATE NOT RATED - Baroda E-Trade

COMPANY UPDATE
BOB Capital Markets Ltd is a wholly owned subsidiary of Bank of Baroda
Important disclosures, including any required research certifications, are provided at the end of this report.
NOT
RATED PRATAAP SNACKS | Packaged Foods | 21 December 2021
Emerging contender in booming snacks business
▪ Fast-growing player in savoury packaged snacks. Strengthening of
processes (to stabilise RM cost) and distribution channels to spur growth
Ruchitaa Maheshwari
Source: NSE | Price as of 20 Dec 2021
Stock performance
Source: NSE
▪ Aggressive expansion into sweet snacks planned over the next 2-3
years – a relatively untapped high-margin, high-growth category
▪ Targeting 18‐20% revenue CAGR over three years and 8-10% margins.
Trading at ~33x FY21 EV/EBITDA; we do not have a rating on the stock
We interacted with the management of Prataap Snacks (PSL, Not Rated) to
gain insights into the company’s efforts towards achieving stated growth and
profitability targets. Key takeaways:
Value for money + Innovations + Strong distribution reach to drive growth: PSL
is one of the fastest growing organized players in the attractive savory segment. PSL
has established itself in a highly competitive intensity by a) value for money player, b)
constantly focussing on new innovations and expanding its product profile, c)
streamlining its distribution channel (from 3 tier to 2 tier by removing super stockists),
d) ~2mn retail outlets spread across 31 States & UT, e) faster market replenishment, f)
emphasis on popular flavours, g) relevant marketing schemes and h) tapping newer
geographies in order to accelerate its revenue growth trajectory. PSL has not only
multiplied its market share (1% to ~6% from 2010 to 2020) in just ten years, but also
expanded pan India. Management envisages these initiatives to lead to 18‐20%
revenue CAGR and 8-10% EBITDA margin over FY21-FY24E.
Geographical expansion to fuel growth: PSL has a strong presence in Madhya
Pradesh, Mumbai, Delhi, Haryana, West Bengal and Orissa (+50% of revenue). It
sees large, untapped potential in Uttar Pradesh, Bihar, Punjab, J&K and South
India, and is looking to expand its footprint in these areas.
Deepening distribution in existing markets: PSL is tapping potential outlets by
enrolling new retailers through tele-calling. These additional outlets could provide a
~30% jump in revenue. Till now, PSL has tapped an additional 60,000 outlets and
plans to add 250,000 by Apr’22. The tele-callers will also push other products which
were not being sold earlier, thereby increasing traction across the product line.
PLI scheme to bolster revenue: Under the government’s PLI scheme (base year
2019-20), PSL will receive an incentive of 7.5% of the incremental sales on all its
products except potato chips for the first four years, followed by 6.75% in FY26
(base year FY22) and 6% in FY27 (base year FY23). As the company’s financials
got impacted due to the covid, management expects benefit to flow in from FY23.
420
710
1,000
1,290
1,580
1,870
Dec
-18
Mar
-19
Jun-
19
Sep
-19
Dec
-19
Mar
-20
Jun-
20
Sep
-20
Dec
-20
Mar
-21
Jun-
21
Sep
-21
Dec
-21
DIAMOND NSE Nifty (Relative)
Ticker/Price DIAMOND IN/Rs 841
Market cap US$ 296.5mn
Free float 29%
3M ADV US$ 0.4mn
52wk high/low Rs 855/Rs 485
Promoter/FPI/DII 72%/5%/21%

PRATAAP SNACKS
EQUITY RESEARCH 2 21 December 2021
Contents
Emerging player in packaged snacks ............................................................ 3
Diverse product portfolio, improving mix ........................................................ 3
Focus on innovation, value for money and premiumisation ........................... 4
Sweet snacks a nascent but large opportunity ............................................... 6
Strong distribution network and expanding footprint ...................................... 8
Optimisation of distribution channels to reduce cost and improve margin ..... 9
Strong distribution network coupled with expanding footprint via outsourcing ........................................................................................................................ 9
Synergy with Avadh Snacks ......................................................................... 10
Credible initiatives to contain margin volatility .............................................. 11
Financial Analysis ......................................................................................... 13
PLI scheme to augment revenues ................................................................ 13
High operating leverage with no major capex in pipeline ............................. 14
Working capital intensity inherently low........................................................ 14
Sequoia Capital’s investment in PSL ........................................................... 15
Indian snack industry booming .................................................................... 16
PSL vs. DFM Foods ..................................................................................... 16
Company Background ................................................................................... 18
Management profile ........................................................................................ 20
Financials ........................................................................................................ 21

PRATAAP SNACKS
EQUITY RESEARCH 3 21 December 2021
Emerging player in packaged snacks
We interacted with Amit Kumat, MD & CEO, and Sumit Sharma, CFO of PSL to gain
insights into the company’s growth plans and future outlook. Headquartered in Indore,
Madhya Pradesh, the company has established a sizeable presence across the
country, driven by a focus on product innovation, geographic expansion, effective
marketing and optimised distribution.
PSL currently sells more than 11mn packs per day and has multiplied its market share
from 1% to ~6% over 2010-20. Products are sold under three brands – the parent
‘Yellow Diamond’ brand for potato chips, extruded snacks and traditional Indian salty
snacks (namkeen), ‘Rich Feast’ for its recently launched sweet snacks, and the newly
acquired ‘Avadh’ (savoury) brand. The company has demonstrated the ability to
compete with regional players on their own turf and gain market leadership, which
reflects its strong brand positioning.
Diverse product portfolio, improving mix
PSL initially started out with chips/crisps under the Yellow Diamond brand and rapidly
expanded its product line. Today, it offers a bevy of snacks including crisps (katori),
pipes, samosas (trikon), rings, chips, sticks (namkeen chulbule), puffs and popcorn. In
October 2018, PSL acquired Gujarat-based Avadh Snacks which offers a
complementary salty snack portfolio, besides entering the sweet snack category in
H2FY18 with the launch of mini cakes.
Entry into newer categories has helped PSL achieve nearly double pace revenue
growth of 27% over FY13-FY17 (while catering to a wide range of taste preferences and
consumer segments, including adults and children), where snack industry grew by
14.7% CAGR during the same period. Per management, extruded snacks have the
highest margin as they are less volatile in terms of raw material pricing (corn, gram
flour), followed by potato chips (medium margin) and other savoury items (low margins
due to high regional competition).
The extruded and sweet categories – favorites among children – were hard hit during
the pandemic due to school closures. PSL aims to raise the contribution of sweet
snacks from the current ~3% of revenue to 7-8% by FY25. As these earn higher
gross margins than salty snacks, management expects the improving mix coupled with
opening up of the economy post pandemic to aid margin expansion from H2FY22.

PRATAAP SNACKS
EQUITY RESEARCH 4 21 December 2021
Fig 1 – PSL’s product portfolio and competitor profile
Category Launch PSL’s brand Flavours SKUs (Rs) Competitors
Potato Chips FY05 Yellow Diamond
Plain Salted, Cream ‘n’ Onion, Tom-Chi, Nimbu Masala, Yummy Masala,
Tangy Tomato, Plain Upvas, Black Pepper and Magic Masala 5, 10, 20, 50
Lays (Pepsico), Bingo (ITC), Balaji, Parle’s Wafers, Haldirams
Extruded Snacks
FY06 Chulbule Tangy Tomato, Teekha Tadka, Noodle Masala, Taza Tomato, Achari
Chatka, Tango Mango and Cream ‘N’ Onion 5, 10, 20, 50
Kurkure (Pepsico), Balaji, Crax (DFM Foods), Bingo (ITC), Taka Tak (Haldiram)
FY10 Wheels Chatpata Masala and Tomato Ketchup 5
FY10 Scoops Masala and Tomato 5
FY11 Puffs Cocktail, Tomato, Pudina and Punjabi Tadka 5
FY12 Rings Masala, Tomato, Mango Chutney, and Chilli Cheese 5, 10, 15
FY18 Seven Wonders
Lentil Crackers – Cumin & Black pepper, Lentil Crackers – Cream & Onion,
Lentil Crackers – Sweet Mango Chutney, Veggie Straws – Masala Tikka,
Veggie Straws – PeriPeri, Quinoa Chips – Cheese Garlic
30
FY18 Kurves Four Flavours 5
Namkeen 2012 Yellow Diamond
Moong Dal, Chhana Dal, Chana Masala –Heeng Jeera flavour, All-in-One,
Aloo Bhujiya, Bhujia Sev, Punjabi Tadka, Ratlami Sev, Tasty Shing Bhujia,
Mixture, Falahari Chivda – Meetha and sweet and salty flavours, Khatta
Meetha, Banana Wafers – Black Pepper and Mamra, Garlic Sev Mamra,
Masala Matar, Chana Choorand Salted flavours, Cornflake Mixture, Bhel,
Plain Sev Peanuts – Classic and Black Pepper flavours
5, 10, 30, 70 Haldirams, Lehar (Pepsico), Balaji, Bikaji Foods
Sweet Snacks
2018 Rich Feast Orange, Strawberry, Vanilla and Chocolate 5 Britannia, Lotte, Sunfeast, Monginis, Cadbury, Pilsbury, Moonfills
Source: Company, BOBCAPS Research
Focus on innovation, value for money and premiumisation
PSL focuses on understanding local consumer tastes and preferences through
innovative product launches at competitive prices. Its product portfolio extends across
strategic price points and pack sizes (over 100 SKUs), with prices ranging from
Rs 5 to Rs 100. This enables the company to target India’s large bottom-of-the-pyramid
population that is gradually shifting from the unorganised to the formal market.
Furthermore, the possibility of premiumisation of product portfolio also remains high
given new launches are now on the health and wellness platform which command
higher operating margin; its sweet snacks venture also commands higher gross margin.
Fig 2 – Portfolio spread across strategic price points and pack sizes
Source: Company, BOBCAPS Research

PRATAAP SNACKS
EQUITY RESEARCH 5 21 December 2021
Innovative launches
In order to tap regional markets, PSL plays with flavour profiles. For instance, the
company uses pepper-based variants (Ratlami) in the north and sweet variants in
the west. This has helped it garner nationwide acceptance for its products.
In a bid to attract the younger population (children), PSL offers toys inside snack
packets. In addition, it has tied up with the producers of cartoons to use characters
such as ‘Motu & Patlu’ for its promotional campaigns.
In 2017, PSL ventured into the healthy snacks category with its brand ‘7Wonders’.
This business has seen a slow pickup and hence there are no plans to launch the
brand in the near term. However, the company has the structure in place to remain
relevant in the event of a consumer shift towards healthier alternatives.
In 2018, the company launched ‘Nachos’ in four flavours at a unique price point of
Rs 10. This caused a major disruption in the market and prompted other players to
bring out offerings at the same price.
In H2FY18, the company entered into sweet snacks with the launch of ‘Yum Pie’
under the Rich Feast brand at a Rs 5 price point. This chocolate, jam-based snack
with a cake-like base differs from existing products in the market and is aimed at
consumers in the age group of 4-15. Further, to expand the sweet portfolio, the
company has launched ‘Yum Cake’, ‘Choco Vanila Cake’ and ‘Cookie Cake’ in
2019, followed by ‘Cup Cake, ‘Tiffin Cake’ and ‘Sandwich Cake’ in 2020.
In 2021, PSL introduced plain-cut chips, puffed crisp balls (puchka), noodle pellets
and rusks, with a goal to increase home consumption. Per management, customer
acceptance has been high in noodle pellets. To cater to the large audience, plans
are underway to roll out eggless Swiss rolls and cupcakes priced at Rs 10 each by
end-December 2021.
VFM (value for money) strategy
PSL focuses on delivering products that are either priced lower than bigger brands or
offer more per pack. The emphasis is on offering a value proposition to the price-
conscious consumer. For instance, when Frito-Lay was offering 22gm of potato chips in
a Rs 5 pack, PSL offered 30gm for the same amount – a strategy that has helped the
company grow at 20-25% in the past 5-6 years. Its pricing strategy has pushed several
bigger competitors to also offer value packs in an effort to stay ahead in the market.
Pack sizes also play a key role in conversion from unorganized to organized. Small
packs of Rs 5 and Rs 10 contribute 70-80% of sales in India’s snack market. For PSL,
~80% of sales come from products priced at Rs 5, 10-12% from Rs 10 products and the
balance from high-value packs. The company’s distribution strategy thus includes
establishing a strong base in tier B, C and D sales outlets where the Rs 5 SKU is a
bestseller.
PSL achieves this by (1) increasing its presence near schools and tuition centres for
sales of rings, wheels and sweet snacks which are a favourite amongst children, and
(2) selling namkeen at outlets near tobacco and liquor shops where uptake is higher.
This also increases the per-dealer offtake growth rate.

PRATAAP SNACKS
EQUITY RESEARCH 6 21 December 2021
Sweet snacks a nascent but large opportunity
The Indian sweet and candy market is valued at ~US$ 664mn, with sugar confectionery
holding a 70% share (US$ 461mn) and chocolate confectionery accounting for the
remainder (US$ 203mn).
There is a huge untapped growth opportunity in the sweet snacks segment on account
of current segmentation of offerings and changing lifestyles of consumers. Traditionally,
consumers seeking a sweet snack have had limited options such as chocolates or
traditional Indian sweets. Alternatives in a convenient size with attractive packaging
have not been comprehensively addressed in the Indian market. The volume weight
ratio for sweets snacks is favorable for manufacturers, leading to lower logistics cost
and relatively higher gross margin.
Given the potential of the industry had and has a global reach, a lot of brands in their
early days made a name for themselves in the space. A few of the renowned ones are
Haldirams, Balaji, Bikano, Bikaji, Prataap Snacks, Cornitos – the brands have not only
achieved local but also a global footprint. In fact, the branded segment covers about
30% of this market and is growing at 10-12%. With the use of automation and better
shelf life, the segment is all set to only grow further.
At the same time, consumers are exhibiting a growing preference for western sweets,
especially chocolate-based confectionaries, due to exposure to media and the internet
and higher living standards. In addition, concerns related to hygiene and quality due to
a lack of established processes to manufacture Indian sweets is also driving this shift.
Rich Feast brand garnering good response
At ~Rs 30bn, the sweet market is currently just 10% of salty snacks is expected to grow
more than 15% over the next 4-5 years. Within sweet snacks, cake is an evolving
category that has witnessed some major developments in formats, pricing and variants
in the last few years. PSL too has entered this segment under the Rich feast brand with
a launch of – (a) Cup Cake (b) Tiffin Cake (c) Sandwich Cake and (d) Cookie cakes, in
three different flavor- (Chocolate, Strawberry, Vanilla and Tuti fruity). The product has
evinced good response and demand is picking up. To enhance its sweet product basket
PSL is in the process of launching few more products in the market. The management
has maintained to launch only eggless sweet as the target audience is huge.
To make its presence felt and garner market share, management is following its
strategy of ‘more for less price’. For instance, Pillsbury Choco Cookie Cake offers 11gm
for Rs 5 and PSL offers 16gm at the same rate and same product profile. Given the
good response to its products, the company plans to roll out eggless Swiss rolls and
cupcakes priced at Rs 10 each by end-Dec’21.
PRATAAP SNACKS
EQUITY RESEARCH 7 21 December 2021
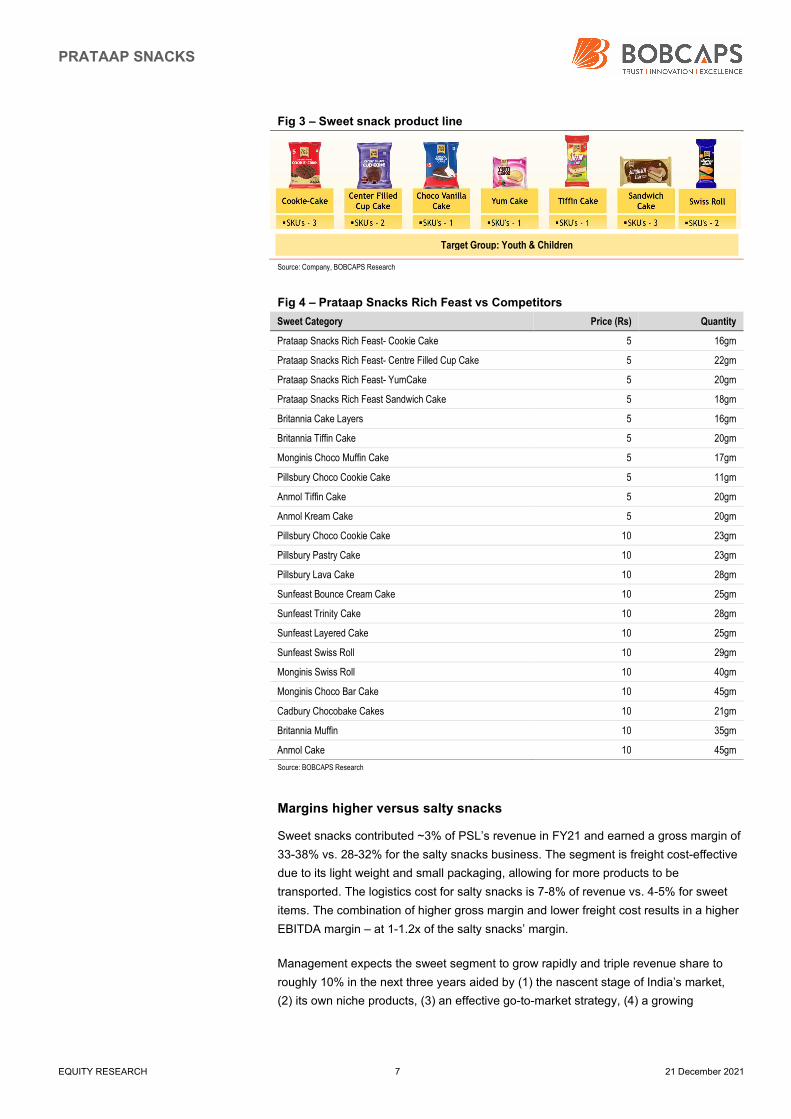
Fig 3 – Sweet snack product line
Source: Company, BOBCAPS Research
Fig 4 – Prataap Snacks Rich Feast vs Competitors
Sweet Category Price (Rs) Quantity
Prataap Snacks Rich Feast- Cookie Cake 5 16gm
Prataap Snacks Rich Feast- Centre Filled Cup Cake 5 22gm
Prataap Snacks Rich Feast- YumCake 5 20gm
Prataap Snacks Rich Feast Sandwich Cake 5 18gm
Britannia Cake Layers 5 16gm
Britannia Tiffin Cake 5 20gm
Monginis Choco Muffin Cake 5 17gm
Pillsbury Choco Cookie Cake 5 11gm
Anmol Tiffin Cake 5 20gm
Anmol Kream Cake 5 20gm
Pillsbury Choco Cookie Cake 10 23gm
Pillsbury Pastry Cake 10 23gm
Pillsbury Lava Cake 10 28gm
Sunfeast Bounce Cream Cake 10 25gm
Sunfeast Trinity Cake 10 28gm
Sunfeast Layered Cake 10 25gm
Sunfeast Swiss Roll 10 29gm
Monginis Swiss Roll 10 40gm
Monginis Choco Bar Cake 10 45gm
Cadbury Chocobake Cakes 10 21gm
Britannia Muffin 10 35gm
Anmol Cake 10 45gm
Source: BOBCAPS Research
Margins higher versus salty snacks
Sweet snacks contributed ~3% of PSL’s revenue in FY21 and earned a gross margin of
33-38% vs. 28-32% for the salty snacks business. The segment is freight cost-effective
due to its light weight and small packaging, allowing for more products to be
transported. The logistics cost for salty snacks is 7-8% of revenue vs. 4-5% for sweet
items. The combination of higher gross margin and lower freight cost results in a higher
EBITDA margin – at 1-1.2x of the salty snacks’ margin.
Management expects the sweet segment to grow rapidly and triple revenue share to
roughly 10% in the next three years aided by (1) the nascent stage of India’s market,
(2) its own niche products, (3) an effective go-to-market strategy, (4) a growing
Target Group: Youth & Children

PRATAAP SNACKS
EQUITY RESEARCH 8 21 December 2021
distribution network for salty products, and (5) a focus on the key Rs 5 price point and
on high-demand eggless products where the competition is less and market is huge.
Fig 5 – Sweet snacks: Portfolio synergies
Particulars Salty Snacks Sweet Snacks
Price Points Rs 5, 10, 20, 40, 80 Rs 5
Gross Margin 28-32% 33-38%
Volatility in Raw Material prices Medium to High Low
Freight Cost as a % of revenue 7-8% 4-5%
MRP on the vehicle (Rs) 16,000-20,000 30,000-35,000
Distributor Margin @ ~7.5% (Rs) 1,200-1,500 2,250-2,625
Variable Costs Same Same
Entry Barrier Low to Medium Medium to High
Source: Company, BOBCAPS Research
Fig 6 – With increasing contribution of sweets and streamlining of distribution channel, freight cost likely to decline
Source: Company, BOBCAPS Research
Strong distribution network and expanding footprint
PSL has a reach of ~2mn outlets and currently serves 31 states and union territories
across India. The company effectively uses these distribution network to increase its
penetration into the existing key markets North and West. The company is also
increasing its presence in Gujarat (highest snacks market in terms of per capita
consumption) and Southern markets as these markets are largely dominated by
regional players with highly competitive intensity. Further, the East market continues to
grow led by increasing demand in extruded snacks particularly rings and specific flavors
like cream and onion. PSL expects to replicate the same model in southern markets
and garner market share and brand loyalty going forward.
PSL is tapping potential outlets by enrolling new retailers through tele-calling.
These additional outlets could provide a ~30% jump in revenue, per management.
So far this year, the company has tapped an additional 60,000 outlets and plans
to add 250,000 more by Apr’22.
7.5
7.2
7.1 7.1
6.8
6.9
7.0
7.1
7.2
7.3
7.4
7.5
7.6
FY18 FY19 FY20 FY21
(%) Freight Cost as a % of Sales

PRATAAP SNACKS
EQUITY RESEARCH 9 21 December 2021
Optimisation of distribution channels to reduce cost and
improve margin
PSL follows a traditional three-tier distribution channel model (~95% of sales) of super
stockists, distributors and retailers. The company first distributes its product to super
stockists who are appointed to operate and maintain outlets/warehouses for sale to
distributors and dealers. Generally, these super stockists have formal agreement with
the company for 3-5 years. Currently, PSL has a network of 245 super stockists and
more than 4,300 distributors.
After strongly establishing itself, the company to follow two-tier distribution channel
model (just like its competitor Balaji Snacks) under which the company will do away with
the super stockists and will trade directly with distributors followed by retailers. This
move will start in the big city where the smaller distributors will be consolidated.
However, the company will continue to follow the three-tier distribution model in the
rural area as the job of super stockists is to replenish the distributor and retailers.
The company pays 2.5%-3% margin to the super stockists, and ~3% margin is
paid as a reimbursement of secondary freight. Distributor is paid 7.5%-8% margin
and retailers are paid to the tune of 15%-20% margin. After removing super
stockists from the scene, management expects to save huge cost of ~6% and
operating margin to improve by ~4%. As of now, management expects margin to
improve by 2-2.5% over a period of two years and will be visible from Q4FY22
onwards.
Strong distribution network coupled with expanding footprint
via outsourcing
PSL operates through 15 manufacturing facilities, of which 7 are in-house and 8 are on
contract manufacturing basis. The company follows asset light model where the
contract manufacturing which stood at ~4% in FY16 has increased to 24% in FY21
and 25% in H1FY22. The company is targeting the contribution to increase to 30%
in next 2-3 years. To enable optimum efficiency in the distribution and to reach
out to a more expansive market, the company is increasingly employing an asset-
light 3P (Production Preparation Process) third party manufacturing model. This
model is based on proximity to the target market, enabling faster replenishments,
and is expected to reduce freight costs. Along with lower logistics costs, the 3P
model results in lower capex. Going forward, this asset-light model will help in
yielding better margins and thereby drive higher return on capital employed.
Going forward, the company is expected to increase the 3P model as its lucrative in
terms of expanding rapidly without significant outlay, rapid innovation and rolling swiftly
in the market. However, the company will continue to manufacture innovation driven
products like Sweet snacks due to protection of intellectual property as well as the 3P’s
are inefficient to manufacture such products satisfactorily.

PRATAAP SNACKS
EQUITY RESEARCH 10 21 December 2021
Fig 7 – Strategically located manufacturing facilities to cater to regional demand
Source: Company, BOBCAPS Research
Synergy with Avadh Snacks
In October 2018, PSL acquired an 80% equity stake in Gujarat-based Avadh Snacks
Private Limited (Avadh) for Rs 1.5bn and its board has approved the acquisition of a
further 10.48% stake for Rs 330mn. The balance 9.52% is to be purchased in the next
year and a half. Avadh’s savoury products complement PSL’s existing portfolio and give
the company a foothold in Gujarat, India’s largest salty snacks market.
Access to India’s largest market for salty snacks
Started in 2010, Avadh’s product range includes traditional salty snacks (bhujia,
chevda, fafda and gathiya), and extruded pellets such as wheels, cups and pasta.
Avadh has a manufacturing facility at Rajkot and a well-established direct distribution
network in Gujarat. With a reach of 75,000-1,00,000 retail outlets in Gujarat, it is the
fourth largest player in the state with ~6% market share.
PSL will use this distribution strength to market its products into western India where it
has a limited presence. It aims to increase the capacity of Avadh’s Rajkot plant by
100%, with phase-1 (50% expansion) completed in Jun’20.
Avadh has also entered the states of Maharashtra, Madhya Pradesh and Rajasthan
which form 10% of its revenue and are targeted to contribute 20% in the next 2-3 years.
PSL plans to launch Avadh’s extensive range of pellet-based snacks pan-India by
leveraging Yellow Diamond’s manufacturing and distribution network. The company has
also been increasing its touch points in Gujarat and neighbouring markets by cross-
selling its popular Yellow Diamond products.

PRATAAP SNACKS
EQUITY RESEARCH 11 21 December 2021
Fig 8 – Avadh product portfolio
Source: Company, BOBCAPS Research
Targeting 15% growth in FY23-FY24
Avadh earns lower gross margins (~15% compared to ~30% for PSL) due to its super-
value offerings but garners similar EBITDA margins owing to cheaper distribution costs.
Management is targeting 15% revenue growth from the business in FY23 and FY24 and
is hopeful of replicating the success it has had with the Yellow Diamond brand (also
an acquisition).
Credible initiatives to contain margin volatility
PSL has volatile EBITDA margins and witnessed marked declines in recent years due
to bad potato crops and fluctuations in vegetable oil prices. Raw material forms ~72% of
the total revenue, of which Potatoes form 20% of cost of goods sold, palm oil 15-16%
and packaging 16-17%. To mitigate the risk, management has introduced various
structural changes (outlined below) and expects these initiatives coupled with an
improving product mix to aid 8-10% EBITDA margins over the next three years vs.
6.7%/5.4% in FY20/FY21.
Historically, edible palm oil prices have hovered at Rs 60-65/kg. However, since
Oct’19, prices have skyrocketed to a peak of Rs 142/kg in May’21 and currently
hover at ~Rs 120/kg. As per management, a Rs 5 movement in palm oil price has a
1% impact on EBITDA margin. PSL is mitigating the adverse margin impact
through process reengineering and cost optimisation. If inflationary pressure
persists, a change in grammage will be the last resort.
Being an essential commodity, the company believes that inflation is a short-term
issue and prices are likely to correct soon. The government has reduced customs
duty on palm oil to 30.25% from 35.75% which has already helped lower prices.
Management expects palm oil to settle at ~Rs 100/kg in coming months, giving the
company enough room to achieve double-digit EBITDA margins. While pricing
pressure would continue over the next two quarters due to labour shortages in
Malaysia and Indonesia and higher export duty, PSL believes that benefits from
rationalising its direct distribution channel would help cushion the volatility.

PRATAAP SNACKS
EQUITY RESEARCH 12 21 December 2021
Fig 9 – Crude Palm Oil Price
Source: Investing.com, BOBCAPS Research
In terms of distribution, PSL plans to deliver products directly from its factories to
distributors instead of taking the super-stockist route, to save on the second leg of
logistics cost. As per management, this will drive 2-2.5% margin improvement in
two years’ time, visible from Q4FY22 onwards.
In order to curb potato costs, the company has increased the duration of cold
storage and reduced open buying in the market from 3 months to 1 month to
alleviate price volatility.
To lower packaging costs, it now enters into long-term contracts of 9 months to a
year for laminates vs. short-term contracts earlier. However, off late the packaging
costs have risen massively, giving some knee jerk reaction in the EBITDA margin
volatility.
A&P spend is 1.1% of total revenue and unlikely to increase from this level. The
company is spending Rs 150-160mn on advertisements which will continue going
forward. Further, it is foraying into larger packs that have a different target audience
and hence plans to spend an additional Rs 100mn-120mn annually for the next two
years to build brand equity for umbrella brand ‘Yellow Diamond’.
Other initiatives taken to control cost include: (1) rationalisation of packet size,
(2) change in size of corrugated packing boxes, (3) reduction in trade margin by
0.5-1%, and (4) grammage reduction in non-core SKUs.
400
500
600
700
800
900
1,000
1,100
1,200
1,300
1,400
Jul
20
Aug
20
Sep
20
Oct
20
Dec
20
Jan
21
Feb
21
Apr
21
May
21
Jun
21
Aug
21
Sep
21
Oct
21
Dec
21
(Rs/metric tonne) Crude Palm Oil Price

PRATAAP SNACKS
EQUITY RESEARCH 13 21 December 2021
Financial Analysis
Fig 10 – Revenue Growth
Source: Company, BOBCAPS Research
Fig 11 – Gross Profit & Gross Margin Fig 12 – EBITDA/PAT and Margins
Source: Company, BOBCAPS Research Source: Company, BOBCAPS Research
PLI scheme to augment revenues
Under the PLI scheme approved by the government (base year 2019-20), PSL will
receive an incentive of 7.5% of the incremental sales on all its products except potato
chips for the first four years, followed by 6.75% in FY26 (base year FY22) and 6% in
FY27 (base year FY23). The incentives will be included in other operating income. The
company must meet the condition of a 10% revenue CAGR to enjoy these benefits. As
its financials were affected by Covid-19, management expects PLI benefits to flow from
FY23.
11,70613,938
11,71114.9 19.1
(16.0)
(25)
(20)
(15)
(10)
(5)
0
5
10
15
20
25
0
2,000
4,000
6,000
8,000
10,000
12,000
14,000
16,000
FY19 FY20 FY21
(%)(Rs mn) Net Revenue Growth (R)
3,502
3,991
3,280
29.9
28.628.0
24
25
26
27
28
29
30
31
32
33
34
3,000
3,200
3,400
3,600
3,800
4,000
4,200
FY19 FY20 FY21
(%)(Rs mn) Gross Profit Gross Margin (R)
832937
631446 469
142
7.16.7
5.4
3.83.4
1.20
2
4
6
8
10
0
200
400
600
800
1,000
1,200
1,400
FY19 FY20 FY21
(%)(Rs mn)EBITDA PAT
EBITDA margin (R) PAT margin (R)

PRATAAP SNACKS
EQUITY RESEARCH 14 21 December 2021
High operating leverage with no major capex in pipeline
The company had expensed significant capex of Rs 5.45bn over FY18- FY21 to support
its expanded product profile. Per management, this will provide high operating leverage
and enough room to expand volumes and reach without major capex for the next two
years. In addition, the company is increasing the use of contract manufacturing which
will enable it to expand rapidly without significant investment.
Fig 13 – With no major capex in offing, FCF & OCF to turn positive
Fig 14 – Return Ratios dampened in FY21 due to Covid
Source: Company, BOBCAPS Research Source: Company, BOBCAPS Research
Working capital intensity inherently low
Working capital intensity of the business remained low at 7.1% in FY20. Inventory days
are low due to the perishable nature of raw material and fast-moving finished goods. A
strong market position allows PSL to enjoy favourable terms with distributors where
dues are settled within a short duration of nine days. PSL also receives credit of ~25
days from its suppliers even though it operates on a cash-and-carry format.
Fig 15 – Ex-cash Working Capital as a % of sales Fig 16 – Working Capital efficiency
Source: Company, BOBCAPS Research Source: Company, BOBCAPS Research
The cash conversion cycle was at 12 days in FY19 which increased to 23 days in FY21
due to a higher inventory cycle. Amid Covid-19, inventory days shot up to 56 during
FY21 which resulted in an increase in ex-cash working capital to 9.6% of sales. The
inventory piled up because 18-20% of PSL’s total revenue comes from institutional
(955)
(509)
483
(301)
954844
(1,000)
(700)
(400)
(100)
200
500
800
1,100
FY19 FY20 FY21
(Rs mn) FCF CFO
7.7 8.0
2.9
8.3 8.0
2.3
7.86.4
1.4
0
2
4
6
8
10
12
14
FY19 FY20 FY21
(%) RoCE RoE RoIC
830
988
1,124
7.1 7.1
9.6
5
6
7
8
9
10
200
400
600
800
1,000
1,200
FY19 FY20 FY21
(%)(Rs mn) Working capital ex-cash WC as % sales (R)
34 32 34
5248
56
2824
30
9 8 8
0
10
20
30
40
50
60
FY19 FY20 FY21
(Days) Working capital days Inventory days Creditor days Debtor Days

PRATAAP SNACKS
EQUITY RESEARCH 15 21 December 2021
sales which includes bus depots, railways, schools, colleges and coaching centres – all
of which slowed down due to lockdown restrictions. Management expects the
vaccination drive and improving mobility to improve the cash conversion cycle.
Fig 17 – Cash Conversion Cycle expected to improve
Source: Company, BOBCAPS Research
Sequoia Capital’s investment in PSL
US-based venture capital firm Sequoia Capital, which has backed companies that now
control US$ 1.4tn of combined stock market value including Apple, Google, YouTube,
Instagram and WhatsApp, holds ~48% stake in PSL.
Fig 18 – Sequoia Capital investment over the years
Year Amount (Rs mn)
2011 620
2012 120
2013 300
2014 250
Source: Company, BOBCAPS Research
12
19
23
0
5
10
15
20
25
FY19 FY20 FY21
(Days) Cash Conversion Cycle
PRATAAP SNACKS
EQUITY RESEARCH 16 21 December 2021
Indian snack industry booming
The packed snacks such as instant and ready-to-cook snacking food items act as the
primary growth drivers for the snacks industry in India. The consumption of package
snacks is growing in India due to hygienic factors, easy availability, numerous choices,
and a rise in the citizens' personal disposable income.
Industry sources estimate India’s snack market at Rs 550bn in 2020, of which organised
players account for Rs 220bn-240bn. The potato chips, extruded and namkeen
segments account for Rs 60bn-75bn each and sweet snacks is a Rs 30bn market. The
country’s snack industry is expected to grow at a 13% CAGR over 2020-26 to reach
US$ 23.4bn.
Apart from a large unorganised sector, brands such as Prataap Snacks, Balaji Wafers,
ITC-Bingo, DFM Foods, Bikanervala, Haldiram’s and PepsiCo are the key players in
India. Indian consumers have diverse regional preferences and tastes, which makes it
important for companies to offer a mix of regional and national flavours and variants.
Packed snacks such as instant and ready-to-cook food items act as the primary growth
drivers for the industry in India.
Consumption of packaged food is growing due to hygiene factors, easy availability,
numerous choices and a rise in disposable income. The Covid-19 induced lockdown
also drove higher snacking as consumers were confined to their homes. When most
economic sectors were adversely hit, lifestyle changes wrought by the pandemic
positively impacted the snack market in India.
PSL vs. DFM Foods
DFM remains confined to North India
DFM Foods was among the first players to enter the extruded snack market and sells its
products under the ‘CRAX’ brand. The company was a pioneer in giving away free toys
with snacks to drive sales to children. However, it has been unable to scale up in terms
of products and geography, still deriving ~75% of its revenue from North India and the
Delhi market.
Southern markets form just 5% of DFM’s total revenue and are difficult to serve as its
plant is located in North India – posing a challenge in the highly competitive, freight-
intensive snacks category. In a bid to expand into different geographies, it is providing a
distributor margin of ~12% in non-northern markets compared to ~7% in North India.
PSL has pan-India reach and distribution
PSL entered the domestic snack market in 2005 with a facility in Indore, followed by an
entry into the western market of Mumbai and northern market of Delhi by taking
advantage of reverse logistics. After gaining critical scale, it further expanded its reach
into eastern states via Guwahati (Assam) and then ventured into South India via
outsourcing. Thus, PSL has uniform revenue contribution across geographies.

PRATAAP SNACKS
EQUITY RESEARCH 17 21 December 2021
The company enjoys a first-mover advantage in terms of early investment in a pan-India
distribution channel coupled with strategic plant locations that enable it to effectively
respond to market demands, evolving consumer preferences and competitive
pressures. In addition, it is streamlining its distribution channel which will reduce freight
cost and distributor margins going forward. In contrast, DFM’s expansion into different
geographies could attract higher freight cost and distributor margins.

PRATAAP SNACKS
EQUITY RESEARCH 18 21 December 2021
Company Background
Prataap Snacks Ltd. (PSL) is a leading Indian Snack Foods Company. It offers multiple
variants of products across categories of Potato Chips, Extruded Snacks, Namkeen
(traditional Indian snacks) under the popular and vibrant Yellow Diamond brand. It has
recently launched a range of sweet snacks under the distinctive Rich Feast brand. PSL
is focused on offering deep value to consumers through a variety of pack sizes at
attractive price points. Its products are present across 31 States and Union Territories in
India.
Headquartered in Indore, India; PSL operates 15 manufacturing facilities of which 7
facilities are in-house and 8 are on contract manufacturing basis. Its distribution network
includes 245 super stockists and more than 4,300 distributors allowing it extensive
reach across the country.
PSL has a wide presence that is equally spread in metro cities and urban clusters as
well as in rural areas and Tier 2 and 3 cities and towns. Its products are available at
independent grocers and small retail stores in the lanes and by-lanes of its key markets
and it is now building up its presence in supermarkets, hypermarkets and modern trade
outlets.
PSL continued to launch new products, new flavors and innovation in the market for its
target consumers. Having started with potato chips, the Company today has a
diversified product portfolio into various categories. It has more than 100 SKUs at
strategic price points and pack sizes - starting from Rs 5 till Rs 100. Currently, it sells
more than 11mn packets per day spread over 100 SKUs, which reflects its vibrant
product offerings.
The wide product portfolio of Avadh Snacks is complementary to PSLs existing salty
snack portfolio. Hence, the acquisition of Avadh Snacks has facilitated the Company in
providing a varied mix of regional and national flavors and variants. Further, on the
opportunity dynamics front, Gujarat has one of the highest per capita consumptions of
packaged snacks. All the products of Avadh Snacks are marketed under the brand
Avadh.
Fig 19 – Prataap Snacks timeline
Source: Company, BOBCAPS Research | Note: As per Financial Year

PRATAAP SNACKS
EQUITY RESEARCH 19 21 December 2021
Fig 20 – Prataap Snacks + Avadh Product Portfolio
Source: Company, BOBCAPS Research

PRATAAP SNACKS
EQUITY RESEARCH 20 21 December 2021
Management profile
Arvind Mehta, Chairman and Executive Director: Arvind Mehta was appointed
as an additional Director of the company in May’11. He has over 32 years of
experience in real estate along with over 17 years in the snacks industry and the
financing business. Mehta has a Bachelor’s degree in Commerce.
Amit Kumat, Managing Director and Chief Executive Officer: Amit Kumat was
appointed as an additional Director of the company in May’11 and made CEO in
Jun’16. Kumat has over 25 years of experience in the snacks industry. He has a
Bachelor’s degree in Engineering and a Master’s degree in Science.
Sumit Sharma, Chief Financial Officer: Sumit Sharma has over 19 years of
experience in finance, accounts and taxation. Prior to joining PSL, he worked with
Crompton Greaves during 2005‐06 and Case New Holland Construction (earlier
known as L&T‐Case Equipment) during 2006‐12. Sharma is responsible for the
accounting and reporting, financial planning and taxation functions of the company.
He has been a member of the Institute of Chartered Accountants of India since
Feb’02 and has a Bachelor’s degree in Commerce.
Apoorva Kumat, President – Operations: Prior to joining PSL, Apoorva Kumat
was associated with group company Prakash Snacks and Hello Agro Food
Products. He is involved in the production planning, logistics and sales functions of
the company. He has a Bachelor’s degree in Commerce.
Subhash Bhatt, Vice President – Production: Subhash Bhatt has been with PSL
since Sep’11. Prior to joining the company, he worked with group company
Prakash Snacks and Hello Agro Food Products. He is responsible for managing the
production function of the potato chips and namkeen segments. Bhatt has a
Bachelor’s degree in Technology.

PRATAAP SNACKS
EQUITY RESEARCH 21 21 December 2021
Financials
Income statement
Y/E 31 Mar (Rs mn) FY18 FY19 FY20 FY21
Revenue 10,184 11,706 13,938 11,711
Net Raw Materials 6,862 8,204 9,947 8,431
Power & Fuel Cost 259 269 274 293
Employee Cost 365 415 577 533
Contract labour 262 306 370 316
Freight & forwarding charges 769 841 985 831
Advt & Sales 254 172 150 129
Other Expenses 543 665 699 547
Total Expenditures 9,315 10,874 13,001 11,080
EBITDA 869 832 937 631
EBITDA % 8.5 7.1 6.7 5.4
Depreciation (304) (376) (617) (546)
Interest expense (29) (9) (75) (63)
Other income 80 109 92 88
Profit before tax 617 557 337 111
Taxes (175) (110) 132 31
Minorities and other 0 - - -
Reported Net profit 442 446 469 142
Other Comprehensive income 0 0 0 0
Net profit 442 446 469 142
Source: Company, BOBCAPS Research
Balance sheet summary
Y/E 31 Mar (Rs mn) FY18 FY19 FY20 FY21
Equity capital 117 117 117 117
Reserves 5,078 5,496 5,960 6,115
Net worth 5,195 5,614 6,078 6,232
Minority Interest 0 0 0 0
Debt 107 924 1,649 1,131
Deferred tax liab (net) -58 605 410 344
Total liabilities 5,245 7,143 8,137 7,706
Fixed assets 2,647 2,873 3,591 3,394
Capital Work In Progress 16 67 196 209
Other Intangible assets 44 1,927 1,825 1,726
Goodwill 0 461 461 461
Other non current assets 101 166 538 489
Inventories 897 1,195 1,323 1,307
Sundry debtors 204 308 326 266
Loans & Advances 164 168 187 194
Other current assets 201 231 170 161
Sundry creditors (997) (856) (875) (926)
Other current liabilities & Prov (326) (239) (192) (220)
Cash 2,144 819 538 304
Other Financial Assets 150 23 49 342
Total assets 5,245 7,143 8,137 7,706
Source: Company, BOBCAPS Research

PRATAAP SNACKS
EQUITY RESEARCH 22 21 December 2021
Cashflow summary
Y/E 31 Mar (Rs mn) FY18 FY19 FY20 FY21
Profit before tax 617 557 337 111
Depreciation 304 376 617 546
Tax paid (175) (110) 132 31
Working capital ∆ (143) (663) (132) 157
Other operating items - (461) - -
Operating cashflow 603 (301) 954 844
Capital expenditure (2,967) (654) (1,464) (362)
Free cash flow (2,364) (955) (509) 483
Equity raised 4,778 (4) 19 36
Investments - - - -
Others (295) (1,821) (296) (145)
Debt financing/disposal 107 817 726 (518)
Dividends paid (24) (24) (24) (24)
Equity Buy back - - - -
Capital subsidy - - - -
Other items (58) 663 (196) (66)
Net ∆ in cash 2,144 (1,325) (281) (234)
Opening Cash Flow - 2,144 819 538
Closing Cash Flow 2,144 819 538 304
Source: Company, BOBCAPS Research
Ratio analysis
Y/E 31 Mar FY18 FY19 FY20 FY21
Growth matrix (%)
Revenue growth 14.1 14.9 19.1 (16.0)
Op profit growth 112.5 (4.3) 12.6 (32.7)
EBIT growth 287.8 (12.5) (27.2) (57.9)
Net profit growth 419.6 1.1 5.2 (69.8)
Profitability ratios (%)
EBITDA margin 8.5 7.1 6.7 5.4
Net profit margin 4.3 3.8 3.4 1.2
RoCE 17.4 7.7 8.0 2.9
RoNW 17.0 8.3 8.0 2.3
RoA 8.4 6.2 5.8 1.8
Per share ratios (Rs)
EPS 18.8 19.0 20.0 6.0
Dividend per share 1.0 1.0 1.0 1.0
Cash EPS 31.8 35.1 46.3 29.3
Book value per share 221.5 239.4 259.1 265.7
Valuation ratios (x)
P/E 44.7 44.2 42.0 139.3
P/B 3.8 3.5 3.2 3.2
EV/EBIDTA 20.3 23.8 22.2 32.6
Liquidity ratios
Debtor days 7.3 9.5 8.4 8.2
Inventory days 35.1 52.4 47.9 55.8
Creditor days 39.1 28.4 24.2 30.1
Source: Company, BOBCAPS Research

PRATAAP SNACKS
EQUITY RESEARCH 23 21 December 2021
Disclaimer
Recommendation scale: Recommendations and Absolute returns (%) over 12 months
BUY – Expected return >+15%
HOLD – Expected return from -6% to +15%
SELL – Expected return <-6%
Note: Recommendation structure changed with effect from 21 June 2021
Our recommendation scale does not factor in short-term stock price volatility related to market fluctuations. Thus, our recommendations may not always be strictly in
line with the recommendation scale as shown above.
Rating distribution
As of 30 November 2021, out of 115 rated stocks in the BOB Capital Markets Limited (BOBCAPS) coverage universe, 57 have BUY ratings, 31 have HOLD ratings, 6
are rated ADD*, 2 are rated REDUCE* and 19 are rated SELL. None of these companies have been investment banking clients in the last 12 months. (*Our ADD and
REDUCE ratings are in the process of being migrated to the new recommendation structure.)
Analyst certification
The research analyst(s) authoring this report hereby certifies that (1) all of the views expressed in this research report accurately reflect his/her personal views about
the subject company or companies and its or their securities, and (2) no part of his/her compensation was, is, or will be, directly or indirectly, related to the specific
recommendation(s) or view(s) in this report. Analysts are not registered as research analysts by FINRA and are not associated persons of BOBCAPS.
General disclaimers
BOBCAPS is engaged in the business of Institutional Stock Broking and Investment Banking. BOBCAPS is a member of the National Stock Exchange of India Limited
and BSE Limited and is also a SEBI-registered Category I Merchant Banker. BOBCAPS is a wholly owned subsidiary of Bank of Baroda which has its various
subsidiaries engaged in the businesses of stock broking, lending, asset management, life insurance, health insurance and wealth management, among others.
BOBCAPS’s activities have neither been suspended nor has it defaulted with any stock exchange authority with whom it has been registered in the last five years.
BOBCAPS has not been debarred from doing business by any stock exchange or SEBI or any other authority. No disciplinary action has been taken by any regulatory
authority against BOBCAPS affecting its equity research analysis activities.
BOBCAPS has obtained registration as a Research Entity under SEBI (Research Analysts) Regulations, 2014, having registration No.: INH000000040 valid till
03 February 2025. BOBCAPS is also a SEBI-registered intermediary for the broking business having SEBI Single Registration Certificate No.: INZ000159332 dated 20
November 2017. BOBCAPS CIN Number: U65999MH1996GOI098009.
BOBCAPS prohibits its analysts, persons reporting to analysts, and members of their households from maintaining a financial interest in the securities or derivatives of
any companies that the analysts cover. Additionally, BOBCAPS prohibits its analysts and persons reporting to analysts from serving as an officer, director, or advisory
board member of any companies that the analysts cover.
Our salespeople, traders, and other professionals may provide oral or written market commentary or trading strategies to our clients that reflect opinions contrary to the
opinions expressed herein, and our proprietary trading and investing businesses may make investment decisions that are inconsistent with the recommendations
expressed herein. In reviewing these materials, you should be aware that any or all of the foregoing, among other things, may give rise to real or potential conflicts of
interest. Additionally, other important information regarding our relationships with the company or companies that are the subject of this material is provided herein.
This material should not be construed as an offer to sell or the solicitation of an offer to buy any security in any jurisdiction where such an offer or solicitation would be
illegal. We are not soliciting any action based on this material. It is for the general information of BOBCAPS’s clients. It does not constitute a personal recommendation
or take into account the particular investment objectives, financial situations, or needs of individual clients. Before acting on any advice or recommendation in this
material, clients should consider whether it is suitable for their particular circumstances and, if necessary, seek professional advice.
The price and value of the investments referred to in this material and the income from them may go down as well as up, and investors may realize losses on any
investments. Past performance is not a guide for future performance, future returns are not guaranteed and a loss of original capital may occur. BOBCAPS does not
provide tax advice to its clients, and all investors are strongly advised to consult with their tax advisers regarding any potential investment in certain transactions —
including those involving futures, options, and other derivatives as well as non-investment-grade securities —that give rise to substantial risk and are not suitable for all
investors. The material is based on information that we consider reliable, but we do not represent that it is accurate or complete, and it should not be relied on as such.
Opinions expressed are our current opinions as of the date appearing on this material only. We endeavour to update on a reasonable basis the information discussed
in this material, but regulatory, compliance, or other reasons may prevent us from doing so.
We and our affiliates, officers, directors, and employees, including persons involved in the preparation or issuance of this material, may from time to time have “long” or
“short” positions in, act as principal in, and buy or sell the securities or derivatives thereof of companies mentioned herein and may from time to time add to or dispose
of any such securities (or investment). We and our affiliates may act as market makers or assume an underwriting commitment in the securities of companies
discussed in this document (or in related investments), may sell them to or buy them from customers on a principal basis, and may also perform or seek to perform
investment banking or advisory services for or relating to these companies and may also be represented in the supervisory board or any other committee of these
companies.
For the purpose of calculating whether BOBCAPS and its affiliates hold, beneficially own, or control, including the right to vote for directors, one per cent or more of the
equity shares of the subject company, the holdings of the issuer of the research report is also included.
BOBCAPS and its non-US affiliates may, to the extent permissible under applicable laws, have acted on or used this research to the extent that it relates to non-US
issuers, prior to or immediately following its publication. Foreign currency denominated securities are subject to fluctuations in exchange rates that could have an
PRATAAP SNACKS
EQUITY RESEARCH 24 21 December 2021
adverse effect on the value or price of or income derived from the investment. In addition, investors in securities such as ADRs, the value of which are influenced by
foreign currencies, effectively assume currency risk. In addition, options involve risks and are not suitable for all investors. Please ensure that you have read and
understood the Risk disclosure document before entering into any derivative transactions.
In the US, this material is only for Qualified Institutional Buyers as defined under rule 144(a) of the Securities Act, 1933. No part of this document may be distributed in
Canada or used by private customers in the United Kingdom.
No part of this material may be (1) copied, photocopied, or duplicated in any form by any means or (2) redistributed without BOBCAPS’s prior written consent.
Company-specific disclosures under SEBI (Research Analysts) Regulations, 2014
The research analyst(s) or his/her relatives do not have any material conflict of interest at the time of publication of this research report.
BOBCAPS or its research analyst(s) or his/her relatives do not have any financial interest in the subject company. BOBCAPS or its research analyst(s) or his/her
relatives do not have actual/beneficial ownership of one per cent or more securities in the subject company at the end of the month immediately preceding the date of
publication of this report.
The research analyst(s) has not received any compensation from the subject company in the past 12 months. Compensation of the research analyst(s) is not based on
any specific merchant banking, investment banking or brokerage service transactions.
BOBCAPS or its research analyst(s) is not engaged in any market making activities for the subject company.
The research analyst(s) has not served as an officer, director or employee of the subject company.
BOBCAPS or its associates may have material conflict of interest at the time of publication of this research report.
BOBCAPS’s associates may have financial interest in the subject company. BOBCAPS’s associates may hold actual / beneficial ownership of one per cent or more
securities in the subject company at the end of the month immediately preceding the date of publication of this report.
BOBCAPS or its associates may have managed or co-managed a public offering of securities for the subject company or may have been mandated by the subject
company for any other assignment in the past 12 months.
BOBCAPS may have received compensation from the subject company in the past 12 months. BOBCAPS may from time to time solicit or perform investment banking
services for the subject company. BOBCAPS or its associates may have received compensation from the subject company in the past 12 months for services in
respect of managing or co-managing public offerings, corporate finance, investment banking or merchant banking, brokerage services or other advisory services in a
merger or specific transaction. BOBCAPS or its associates may have received compensation for products or services other than investment banking or merchant
banking or brokerage services from the subject company in the past 12 months.