“Sniffer”—a novel tool for chasing vehicles and measuring traffic pollutants
11
Atmospheric Environment 38 (2004) 3625–3635 ‘‘Sniffer’’—a novel tool for chasing vehicles and measuring traffic pollutants L. Pirjola a,b, *, H. Parviainen a , T. Hussein b,c , A. Valli a , K. Ha¨meri b,c , P. Aaalto b , A. Virtanen d , J. Keskinen d , T.A. Pakkanen e , T. Ma¨kela¨ e , R.E. Hillamo e a Department of Technology, Helsinki Polytechnic, P. O. Box 4020, Helsinki FIN-00099, Finland b Department of Physical Sciences, University of Helsinki, P. O. Box 64, FIN-00014, Finland c Department of Physics, Finnish Institute of Occupational Health, Topeliuksenkatu 41, Helsinki FIN-00250, Finland d Institute of Physics, Tampere University of Technology, P. O. Box 692, Tampere FIN-33101, Finland e Finnish Meteorological Institute, Air Quality Research, Sahaajankatu 20 E, Helsinki FIN-00810, Finland Received 16 October 2003; received in revised form 8 March 2004; accepted 15 March 2004 Abstract To measure traffic pollutants with high temporal and spatial resolution under real conditions a mobile laboratory was designed and built in Helsinki Polytechnic in close co-operation with the University of Helsinki. The equipment of the van provides gas phase measurements of CO and NO x , number size distribution measurements of fine and ultrafine particles by an electrical low pressure impactor, an ultrafine condensation particle counter and a scanning mobility particle sizer. Two inlet systems, one above the windshield and the other above the bumper, enable chasing of different type of vehicles. Also, meteorological and geographical parameters are recorded. This paper introduces the construction and technical details of the van, and presents data from the measurements performed during an LIPIKA campaign on the highway in Helsinki. Approximately 90% of the total particle number concentration was due to particles smaller than 50 nm on the highway in Helsinki. The peak concentrations exceeded often 200,000 particles cm 3 and reached sometimes a value of 10 6 cm 3 . Typical size distribution of fine particles possessed bimodal structure with the modal mean diameters of 15–20 nm and B150 nm. Atmospheric dispersion of traffic pollutions were measured by moving away from the highway along the wind direction. At a distance of 120–140 m from the source the concentrations were diluted to one-tenth from the values at 9 m from the source. r 2004 Elsevier Ltd. All rights reserved. Keywords: Urban aerosol; Size distribution; Exhaust gases; Mobile measurements 1. Introduction Urban air quality is mostly dominated by traffic emissions (e.g. Schauer et al., 1996; Harrison et al., 1999; Karppinen et al., 2000). The emissions are characterised by large number of sources with low source heights. Long-range transport, secondary aerosol formation, and resuspension from the road surface as well as meteor- ological conditions are also of importance. Automotive engines are major sources of fine particles. Due to the emission regulations and advanced technology, the specific mass emissions (in g km 1 ) have been decreased markedly, about one order of magnitude since the 1970s, both for passenger cars and heavy-duty engines (Ahlvik et al., 1998). Although particulate mass emissions from spark ignition engines with new technology are typically 10–100 times lower than those of diesel engines, considerable increase in the number concentrations of ARTICLE IN PRESS *Corresponding author. Tel.: +358-9-191-8718; fax: +358- 9-191-8318. E-mail address: liisa.pirjola@helsinki.fi (L. Pirjola). 1352-2310/$ - see front matter r 2004 Elsevier Ltd. All rights reserved. doi:10.1016/j.atmosenv.2004.03.047
Transcript of “Sniffer”—a novel tool for chasing vehicles and measuring traffic pollutants

Atmospheric Environment 38 (2004) 3625–3635
ARTICLE IN PRESS
*Correspond
9-191-8318.
E-mail addr
1352-2310/$ - se
doi:10.1016/j.at
‘‘Sniffer’’—a novel tool for chasing vehicles and measuringtraffic pollutants
L. Pirjolaa,b,*, H. Parviainena, T. Husseinb,c, A. Vallia, K. Hamerib,c, P. Aaaltob,A. Virtanend, J. Keskinend, T.A. Pakkanene, T. Makelae, R.E. Hillamoe
aDepartment of Technology, Helsinki Polytechnic, P. O. Box 4020, Helsinki FIN-00099, FinlandbDepartment of Physical Sciences, University of Helsinki, P. O. Box 64, FIN-00014, Finland
cDepartment of Physics, Finnish Institute of Occupational Health, Topeliuksenkatu 41, Helsinki FIN-00250, Finlandd Institute of Physics, Tampere University of Technology, P. O. Box 692, Tampere FIN-33101, Finland
eFinnish Meteorological Institute, Air Quality Research, Sahaajankatu 20 E, Helsinki FIN-00810, Finland
Received 16 October 2003; received in revised form 8 March 2004; accepted 15 March 2004
Abstract
To measure traffic pollutants with high temporal and spatial resolution under real conditions a mobile laboratory
was designed and built in Helsinki Polytechnic in close co-operation with the University of Helsinki. The equipment of
the van provides gas phase measurements of CO and NOx, number size distribution measurements of fine and ultrafine
particles by an electrical low pressure impactor, an ultrafine condensation particle counter and a scanning mobility
particle sizer. Two inlet systems, one above the windshield and the other above the bumper, enable chasing of different
type of vehicles. Also, meteorological and geographical parameters are recorded. This paper introduces the construction
and technical details of the van, and presents data from the measurements performed during an LIPIKA campaign on
the highway in Helsinki. Approximately 90% of the total particle number concentration was due to particles smaller
than 50 nm on the highway in Helsinki. The peak concentrations exceeded often 200,000 particles cm�3 and reached
sometimes a value of 106 cm�3. Typical size distribution of fine particles possessed bimodal structure with the modal
mean diameters of 15–20 nm and B150 nm. Atmospheric dispersion of traffic pollutions were measured by moving
away from the highway along the wind direction. At a distance of 120–140m from the source the concentrations were
diluted to one-tenth from the values at 9m from the source.
r 2004 Elsevier Ltd. All rights reserved.
Keywords: Urban aerosol; Size distribution; Exhaust gases; Mobile measurements
1. Introduction
Urban air quality is mostly dominated by traffic
emissions (e.g. Schauer et al., 1996; Harrison et al., 1999;
Karppinen et al., 2000). The emissions are characterised
by large number of sources with low source heights.
Long-range transport, secondary aerosol formation, and
ing author. Tel.: +358-9-191-8718; fax: +358-
ess: [email protected] (L. Pirjola).
e front matter r 2004 Elsevier Ltd. All rights reserve
mosenv.2004.03.047
resuspension from the road surface as well as meteor-
ological conditions are also of importance. Automotive
engines are major sources of fine particles. Due to the
emission regulations and advanced technology, the
specific mass emissions (in g km�1) have been decreased
markedly, about one order of magnitude since the 1970s,
both for passenger cars and heavy-duty engines (Ahlvik
et al., 1998). Although particulate mass emissions from
spark ignition engines with new technology are typically
10–100 times lower than those of diesel engines,
considerable increase in the number concentrations of
d.

ARTICLE IN PRESSL. Pirjola et al. / Atmospheric Environment 38 (2004) 3625–36353626
nanoparticles from spark ignition engine has been
recently reported (Baumgard and Johnson, 1996;
Kittelson, 1998). Particularly fine and ultrafine particles
have recently become of great interest due to their
adverse health effects (e.g. Dockery and Pope, 1994;
Donaldson et al., 1998; Pope et al., 2002).
Recent development in measurement technology has
enabled observations of particle size distribution with a
high temporal resolution by the scanning mobility
particle sizer (SMPS) and the electronic low pressure
impactor (ELPI). The number size distribution of fine
particles from diesel engine has been shown to follow a
bimodal structure; the nucleation and Aitken mode
particles in the 5–50 nm range dominate the number
concentration with a peak concentration at 20–30 nm,
the other peak is at around 100 nm. Nucleated particles
are formed from semi-volatile organic and sulphur
compounds during exhaust dilution and cooling (Kit-
telson et al., 2000; Khalek et al., 2000). Accumulation
mode particles are primarily composed of carbonaceous
agglomerates and adsorbed materials whereas the coarse
mode particles consist of asphalt aggregates and traction
sand (Pakkanen et al., 2001). The fraction of black and
organic carbons in particulate emissions depends on the
engine type (e.g. Kirchstetter et al., 1999).
Besides a high temporal resolution also a high spatial
resolution is needed to study traffic pollutions and
particle size distributions in real driving conditions.
Mobile laboratories have been shown to be useful tools
as recently reported by e.g. Kittelson et al. (2000),
Bukowiecki et al. (2002), Vogt et al. (2003), and Seakins
et al. (2002). A Finnish national project LIPIKA (Fine
particles from traffic and their relation to laboratory test
measurements) funded by the National Technology
Agency (TEKES) and the Ministry of Transport and
Communications Finland was initiated in September
2002 with the following objectives: (1) to investigate how
well the dynamometer measurements carried out in
laboratory conditions correlate with the real measure-
ments in street canyons and on roads, (2) to study the
effects of traffic emissions on urban air, especially to
investigate how necessary it is to measure number
concentrations of nucleation mode particles instead of
measuring only soot particles under traffic conditions,
(3) to study how sensitive the results are against
environmental conditions, different driving speeds and
different fuels, and (4) to build a mobile laboratory
(‘‘sniffer’’) for sampling on roads and highways, and
chasing in tunnels and underground sites. The partners
are Tampere University of Technology, Finnish Meteor-
ological Institute, University of Helsinki and Finnish
Institute of Occupational Health, Helsinki Polytechnic,
Technical Research Centre of Finland, and Helsinki
Metropolitan Area Council.
The aim of this work is to introduce the technical
solutions and the equipment of a novel mobile
laboratory, and present the first results of the LIPIKA
campaign performed at the highway in Helsinki. In this
paper, we focus only on aerosol measurements.
2. Mobile laboratory
2.1. Vehicle design
A mobile laboratory for the measurements of traffic
pollutants, called ‘‘sniffer’’, was designed and built by
the Laboratory of Automotive Engineering of Helsinki
Polytechnic. Construction of the sniffer is part of a
Finnish national project LIPIKA (September 2002–May
2005).
Unlike stationary measuring sites, the mobile labora-
tory enables measurements under real city traffic
conditions, chasing in tunnels and other underground
sites as well as surveys on roads and highways. It is also
useful for static measurements when the instruments
should be rapidly moved from site to site as for example,
in dispersion studies. A diesel vehicle, Volkswagen LT35
(length 5585mm, width 1933mm, height 2570mm, max
total weight 3550 kg) was selected as the platform of the
instrumentation. The walls in the boot space were
thermally insulated and overlaid, also the floor was
overlaid. One seat with a seat belt, a table and
dismountable racks for the analysers were installed in
the boot space. To decrease vibration and shock stresses
which might damage the analysers while driving,
vibration dampening by rubber was used. For different
meteorological conditions the van was equipped with
heating and air conditioning systems.
The power for the instruments (max 2.5 kW) is
provided by four 12V/230Ah batteries. Connecting
two of them in series gave 24V, then coupling two such
pairs in parallel produced a battery system whose
capacity 460Ah is enough for our instrumentation.
The DC voltage is inverted to 230V/50Hz AC by an
inverter Phoenix Multi (Victron Energy). The inverter
also recharges the batteries from an external 230V/
50Hz power network—this is also used for stationary
measurements. Full capacity of the batteries permits the
sniffer to operate for 5 h. To be able to measure
continuously while driving an extra 24V charger was
installed into the van engine system.
2.2. Inlets and chasing
Two different inlet systems opening towards the
driving direction were constructed, one above the
windshield at a height of 2.4m (main inlet) and
the other above the bumper at a height of 0.7m (chasing
inlet), shown in Fig. 1. Since exhaust tubes of different
type of cars lie in different positions, more or less in the
left or right side, to better catch exhaust gas the chasing

ARTICLE IN PRESS
Wind sensor RH,
Maininlet
Chasing inlet
Video camera
Pumpfor SMPS
Gas
Batteries
Inverter
Tools
SMPSELPI
NOX -analyser
CO -analyser
Flowmeter
GPS
Computers
CPC
Fig. 1. Phantom figure of the equipment of the mobile laboratory ‘‘sniffer’’.
L. Pirjola et al. / Atmospheric Environment 38 (2004) 3625–3635 3627
inlet was branching horizontally and centred into four
inlet tubes with intervals of 25, 60, and 25 cm. The total
length of the main inlet is 3.65m.
The particle inlet was manufactured of stainless steel
AISI 316. To avoid losses of larger particles by
impaction the tubes were bent with big radii. The
aerosol inlet dimensions were designed so that for
our present instrumentation flow is laminar in the tube.
The flow rate is 11.5 lpm and the tube diameter inside
the van is 27mm leading to the flow velocity of
0.32m s�1 and Reynolds number of 576 (o2000). The
mouth diameter of the main inlet is reduced to 5.3mm
so sampling at the inlet mouth is isokinetic at a relative
speed of 30 kmh�1 (driving speed with respect to air).
However, to require isokinetic sampling is not very
relevant for the LIPIKA campaign since we are more
interesting in smaller particles, especially nucleation
mode particles. The inner diameter of each chasing inlet
is 3mm and below the bumper the four inlets were
merged together.
The gas inlets were made of Teflon to minimise losses
in the inlet tube (inner diameter 4mm). The gas inlets
are located next to the particle inlets to get sampling
from the same exhaust plume.
A series of qualitative tests were performed under
controlled driving conditions to discern the optimum
inlet for various sources and conditions. The sniffer was
chasing an Euro 2 category bus (Volvo B10B LE) and
two different passenger cars (Mercedes Benz 200D and
Chrysler Voyager) in a special test lane that was closed
for other traffic. During the test day wind speed was low,
below 2m s�1. The exhaust plume was coloured with
orange and gray smoke (Brandax-O and Brandax-VS,
Bjornax). The smoke cartridges were fixed around the
exhaust tube of the chased vehicle, and after ignition
they burned for 4min. The distance of the sniffer and the
vehicle chased was kept constant by continuous record-
ings by a laser instrument (PD 28), the values between 5
and 15m were used. The tests were also performed with
different driving velocities (20–80 kmh�1), and the
situations were recorded by the digital video camera. It
was found that the most important factor determining
the dispersion of the exhaust plume was the type of the
car, especially the design of its rear, whereas the speed
ARTICLE IN PRESS
(a)
(b)
(c)
Fig. 2. Tests for the exhaust plume to reach the main inlet or
the chasing inlet. Chasing a bus with an exhaust tube in the
middle of the rear (a), a passenger car with an exhaust tube in
the left side of the rear (b) and a mini van with an exhaust tube
in the left side of the rear (c).
L. Pirjola et al. / Atmospheric Environment 38 (2004) 3625–36353628
and distance had only minor effect. The tests showed
that the chasing inlets are suitable for chasing passenger
cars, and the main inlets for chasing buses and mini
vans. As an example, Fig. 2 illustrates three still photos
of the dispersion of the exhaust plume when the sniffer
was chasing a bus with the exhaust tube in the middle of
the rear (a), a passenger car (b) and a mini van (c). The
passenger car and the mini van had the exhaust tubes in
the left side of the rear.
2.3. Instrumentation
The mobile laboratory provides measurements of
particles, some gaseous pollutants, meteorological and
geographical parameters with high spatial and time
resolutions. Particle size distribution is measured by the
electrical low pressure impactor (ELPI, Dekati Ltd.)
with flow rate of 10 lpm (Keskinen et al., 1992). The
ELPI with the electrical filter stage enables real time
particle size distribution in the size range of 7 nm–10 mm(aerodynamic diameter) with 12 channels. The particles
are charged, size classified by inertial impaction and
electrically detected. The offset currents were always
checked before and after the measurement. Especially,
the nucleation mode particle size distribution with the
high size resolution is measured by the Hauke-type
SMPS, where particles are first neutralised, then
classified by a DMA based on their electrical mobility,
and counted by a CPC 3025 (TSI, Inc.). Measurement
size range is 3–50 nm (mobility diameter), the number of
channels is 20 and the scan-up time mostly 30 s. The
sampling flow rate is 1.5 lpm. Sheat air and aerosol flows
were checked daily. Additionally, the total number
concentration of particles larger than 3 nm is detected by
an ultrafine condensation particle counter CPC 3025
(TSI, Inc.). Due to high traffic particle emissions a
passive clean air dilution system was installed. The
sample is divided into two flows, one flowing directly
and the other through a filter. After merging a dilution
ratio of the sample is 1:3 which has been experimentally
verified. All instruments were calibrated before the
campaign and as mentioned the flow rates were checked
daily.
Since the total length of the main inlet is 3.65m and
the flow velocity 0.32m s�1, the time delay of the
sampling air before ELPI is 11–12 s. Since the tube
length before the branching of SMPS and CPC is 2.20m
and after that the tube size is only 4mm, the air sample
residence time is somewhat shorter, about 7–8 s. Particle
deposition by diffusion when flowing through the tube
might be an important loss mechanism for ultrafine
particles. According to Hinds (1999) we calculated the
penetration, i.e. fraction of entering particles that exit,
for 5, 10 and 15 nm particles and the values were 86%,
94% and 97%. Consequently, the losses are considered
while analysing the results of SMPS.
The present instrumentation is applicable to observing
concentrations of carbon monoxide (CO), nitrogen
monoxide (NO) as well as nitrogen oxides (NOx)

ARTICLE IN PRESSL. Pirjola et al. / Atmospheric Environment 38 (2004) 3625–3635 3629
(=NO+NO2). The concentration of CO is measured by
a CO gas monitor (Model CO12M, Environnement
S.A.), based on the ability of a CO molecule to absorb
infrared radiation. Detection range is 0.05–20 ppm with
a time resolution of 30 s. In the NOx analyser (Model
APNA 360, Horiba) the measuring cycle is composed of
three different parts: NO-, NOx- and zero level
measurements. NO is measured by first oxidising the
sample gas by ozone, and then measuring the subse-
quent luminescent light emitted by NO2 molecules left in
an excited state after the reaction. The light intensity is
proportional to the concentration of NO molecules.
NOx is measured directing the sample to the reaction
chamber through a deoxidation converter, in which NO2
is first converted to NO. The NOx detection limit is
about 0.5 ppb and the measurement range reaches
up to 4 ppm with a time resolution of 20 s. Zero and
span checks were performed a couple of times per
day for both analysers. Both analysers were calibrated
with 5 different certified standard gas concentrations.
However, in this work we concern only particle
concentrations.
Since the sampling flow rate of both analysers is
1.0 lpm and since the diameter of the sampling tube is
4mm, the residence time inside the tube before the
analysers is only 1.4 s.
The weather station at the roof of the van provides the
meteorological parameters such as relative wind speed
and direction by an ultrasonic wind sensor (Model
WAS425AH, Vaisala) as well as temperature and
relative humidity by humidity and temperature probes
(Model HMP45A, Vaisala). Additionally, a global
position system (GPS V, Garmin) saves the van speed
and the driving route and a video camera in the cab
records the traffic situations useful for data analysis.
Always at the start of the measurements the clocks of all
instruments are checked according to the satellite time
given by GPS.
The analogical outputs of the meteorological sensors
and the gas analysers are connected to a data acquisition
card (PCMCIA, National Instruments Ltd.) via a
connector block. Data acquisition was performed by
an LABVIEW programme running on a PC. The same
computer also acquires GPS and video output. A second
PC runs the SMPS and CPC systems storing the total
number concentration and size distribution data, and a
third computer controls the ELPI. The data are always
stored every second but 1-min averages are calculated.
The PCs are connected with each other via local
network.
3. Results and discussion
The first campaign of the LIPIKA project was
carried out on a busy highway Itavayla in Helsinki area
on 10–26 February 2003. This suburban area with high
industrial capacity lies 5 km east from downtown and is
a passing-through area to the eastern centre of Helsinki.
In the morning, traffic is busy towards west 2290
vehicles h�1 (Hannu Seppala, person. comm.). The
sniffer measured traffic pollutants during rush hours
by driving on the highway and standing at bus stops at
the highway (Section 3.1). The sampling was taken by
the main inlet with the driving speed of 40 kmh�1. The
sniffer was not chasing any single vehicle, just sampling
particles from busy traffic. To investigate the dispersion
of traffic plumes along the wind direction also the
stationary measurements by the sniffer were performed
at different sites on the way of 140m away the highway
(Section 3.2). At the same location, there were two
stationary measurement sites, placed 9 and 65m from
the highway. The schematic map of the sampling sites is
presented in Fig. 3. Also shown is the background area
at the Saunalahti bay about 600m northwest of the
highway. During the selected days (17–20 February) the
prevailing wind direction was northwest and the wind
speed was mostly about 2m s�1 and always below
4m s�1. The mild winter temperature varied between
1�C and 4�C in daytime and the relative humidity
between 60% and 90%. Note that all times are local
Finnish winter times.
3.1. The morning rush time on Itavayla
The typical traffic volume during morning rush hours
on weekdays on Itavayla on both lanes is approximately
3065 vehicles h�1 (Hannu Seppala, person. comm.).
However, we counted for 16 vehiclesmin�1 in the lane
to east and 30 vehiclesmin�1 in the lane to west in
average, but should be noted that the campaign week
happened to be a winter holiday week of students at
schools and therefore many parents also had vacation
that week.
Fig. 4(a) depicts the total number concentration of
particles (Ntot) measured by ELPI and CPC during the
morning rush hours at 7:30–10:55. All values are
averages over 1min. The peak concentrations often
exceeded 105 cm�3 that is the maximum limit when CPC
is operated without dilution as was the case that day.
For comparison, also plotted is the particle number
concentration of the nucleation mode (3–50 nm) mea-
sured by SMPS and the number concentration of
particles larger then 56 nm measured by ELPI. The
latter values are at least one order of magnitude smaller
the total number concentration, and thus approximately
90% of the total particle concentration belong to the
nucleation mode. The filter stage of ELPI that records
particles in the size range of 7–30 nm seems to over-
estimate that concentration. The concentration of the
second stage (30–56 nm) compared quite well with the
concentration of SMPS in the size range of 30–50 nm.

ARTICLE IN PRESS
Urban back-ground, BG
N
S
EW
XXX X X
X
Bus stop, BS1
5 km to downtown 100 m
Dispersion studies
Sau
nal
ahti
Bus stop, BS2
Itävä
ylä
HERTTONIEMI
Fig. 3. The map of the measurement sites.
L. Pirjola et al. / Atmospheric Environment 38 (2004) 3625–36353630
Based on ELPI measurements, the concentration of the
accumulation mode particles (200 nm–1 mm) stayed
almost constant at around 103 cm�3.
The background concentration, BG in Fig. 4(a),
measured at the bay varies from 20,000–35,000
particles cm�3, covering the typical daytime range
during the campaign; at nighttime the concentration
used to reduce to a value of 10,000 cm�3, sometimes to a
20% lower value. The peak value in the background
concentration at 9:45 (the second BG range in Fig. 4(a))
is due to a snow plow, most of the particles staying in
the nucleation mode.
The peak concentrations detected while driving (DR)
or standing at the bus stops (BS1 to northeast, BS2 to
southwest) are due to individual vehicles or clusters of
vehicles; the highest peaks mainly came from heavy duty
vehicles, as recorded manually or can be seen from the
video file. For example, all peak concentrations in the
range of 200,000–500,000 cm�3 can be explained by a
bus or a truck accelerating in front of the sniffer. As a
curiosity, the maximum peak value of 1.3� 106 cm�3 at
8:51 was due to a very old motor home with a very
poorly tuned engine. Although the traffic density is
higher to the west direction the concentrations measured
at the bus stop on the lane to west (BS2) are lower than
at the bus stop to east (BS1). This might be due to the
wind direction from northwest that carries the traffic
emissions away from BS2 towards BS1 (Fig. 3).
In Fig. 4(b) average particle size distributions for BS1
and BS2 at two different time periods as well as for the
background concentration (BG at 9:48–9:58) are shown.
For this figure (as well as for Fig. 6(b) and (c)) the SMPS
data have been corrected by taking into account the
diffusion losses. As seen from Fig 4b the fine particle size
distributions are bimodal with the geometric mean
diameters located at 15–20 nm and around 150 nm.
Similar results that are typical for diesel aerosol
sampling have been reported by Kittelson et al. (2000),
Bukowiecki et al. (2002), Vogt et al. (2003), and Hussein
et al. (2004). The modal mean values are almost the
same for the background size distribution but the
concentrations of particles smaller than 300 nm are
clearly lower.
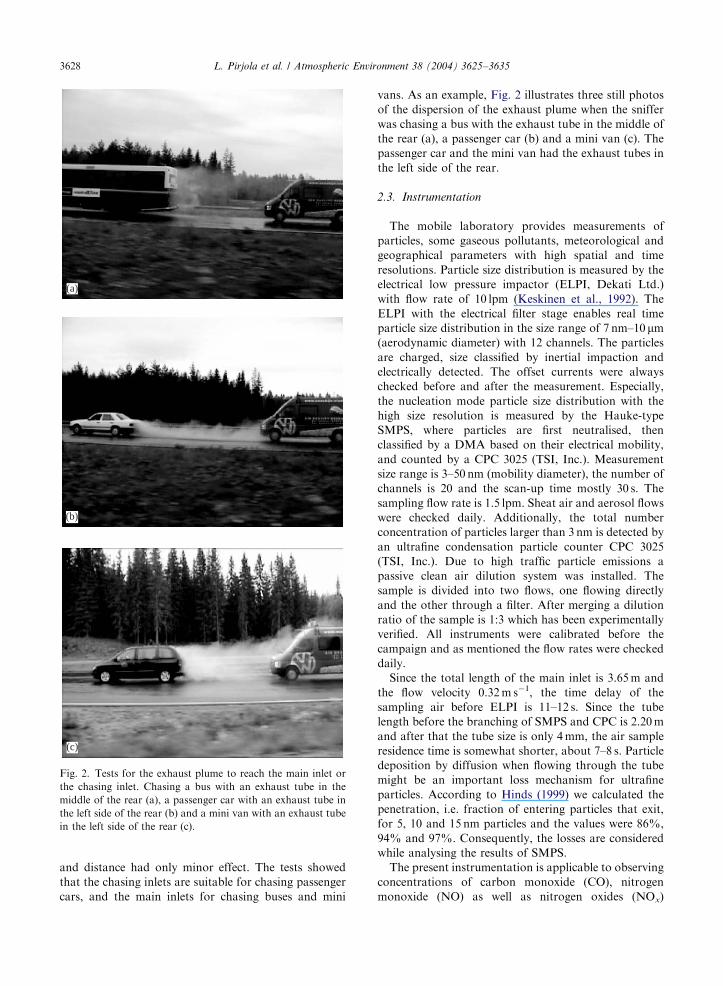
As stated by Bukowiecki et al. (2002) it is difficult to
estimate the emissions of single vehicles. Since the local
background concentration is expected to be rather high
in traffic-rich regions the measured concentrations do
not necessarily represent the emissions of a single
vehicle. Bukowiecki et al. determined the local back-
ground concentrations to be not the minimum value
over 1min concentration values but the 5% percentile
value (the mean value of the lowest values covering 5%
of all values). Their calculations showed that the
background values reach the range of 30,000–
50,000 cm�3 on busy main road, and consequently the
estimated traffic emissions caused the concentration to
reach up to 400,000 cm�3. In spite of much higher local
background concentrations in Fig. 5(a), also calculated
as 5% percentile, our results for peak concentrations
from traffic emissions plotted in Fig. 5(b) are in good
agreement with the results by Bukowiecki et al. (2002).
The highest peak 6.7� 105 cm�3 comes from the old
motor home and the next highest (2.8�4)� 105 cm�3
from buses.

ARTICLE IN PRESS
Fig. 4. (a) The total particle number concentration measured by ELPI (7 nm–10mm) and CPC (3 nm–1mm) on the highway Itavayla in
Helsinki, Finland, on 17 February 2003. Also shown is the number concentrations of nanoparticles (3 nm–50nm) measured by SMPS
and larger particles in the range of 56 nm–1mm measured by ELPI. All concentration values are averages over 1min. (b) The average
size distributions of particles at the bus stops and at the background site. BG=background site, DR=driving on Itavayla, BS1=bus
stop to northeast at Itavayla, BS2=bus stop to southwest at Itavayla.
L. Pirjola et al. / Atmospheric Environment 38 (2004) 3625–3635 3631
3.2. Dispersion
The dispersion of freshly emitted traffic particles to
southeast from Itavayla was measured on 19 February
2003. The mobile laboratory stood at 6–9 different sites
from 5m up to 140m away from the highway (Fig. 3)
downwind (nowthwest), and measured the particle size
distributions for 5min at each site. The whole measure-
ment cycle took about an hour, and two cycles were
conducted during the afternoon rush hour.
Fig. 6(a) reveals the average values of the total
particle number concentration along with the standard
deviation error bars at each sampling site measured by
ELPI and SMPS. Here the total particle concentration is
the sum of the SMPS concentration (particle diameter
o50 nm) and the total concentration of the stages 3–12
by ELPI (particle diameter >50 nm). During dispersion
the total number concentration reduces roughly one
order of magnitude, 83–85% as well as particles smaller
than 50 nm whereas particles smaller than 321 nm (50%
cut size) decrease about 50–60%. At the first site, 9m
from the highway, 92–96% of total particles were
smaller than 50 nm.
The evolution of the particle size distributions during
the measurement cycles are presented in Fig. 6(b).
Each curve represents the average size distribution
over 5min at the sites mentioned in the legend. Also
shown is the averaged background size distribution
ARTICLE IN PRESS
Fig. 5. (a) The ELPI raw data (1 s intervals) and 1min 5%-
percentile of the total number concentration. See details in the
text. (b) The instantaneous peak concentrations from the
vehicles emissions.
L. Pirjola et al. / Atmospheric Environment 38 (2004) 3625–36353632
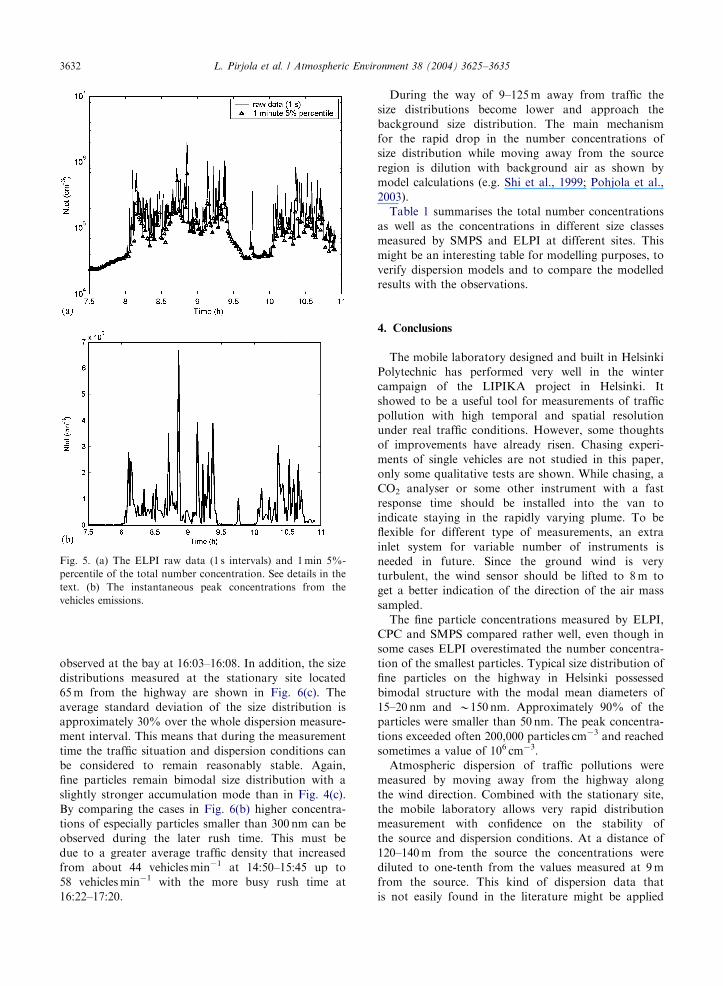
observed at the bay at 16:03–16:08. In addition, the size
distributions measured at the stationary site located
65m from the highway are shown in Fig. 6(c). The
average standard deviation of the size distribution is
approximately 30% over the whole dispersion measure-
ment interval. This means that during the measurement
time the traffic situation and dispersion conditions can
be considered to remain reasonably stable. Again,
fine particles remain bimodal size distribution with a
slightly stronger accumulation mode than in Fig. 4(c).
By comparing the cases in Fig. 6(b) higher concentra-
tions of especially particles smaller than 300 nm can be
observed during the later rush time. This must be
due to a greater average traffic density that increased
from about 44 vehiclesmin�1 at 14:50–15:45 up to
58 vehiclesmin�1 with the more busy rush time at
16:22–17:20.
During the way of 9–125m away from traffic the
size distributions become lower and approach the
background size distribution. The main mechanism
for the rapid drop in the number concentrations of
size distribution while moving away from the source
region is dilution with background air as shown by
model calculations (e.g. Shi et al., 1999; Pohjola et al.,
2003).
Table 1 summarises the total number concentrations
as well as the concentrations in different size classes
measured by SMPS and ELPI at different sites. This
might be an interesting table for modelling purposes, to
verify dispersion models and to compare the modelled
results with the observations.
4. Conclusions
The mobile laboratory designed and built in Helsinki
Polytechnic has performed very well in the winter
campaign of the LIPIKA project in Helsinki. It
showed to be a useful tool for measurements of traffic
pollution with high temporal and spatial resolution
under real traffic conditions. However, some thoughts
of improvements have already risen. Chasing experi-
ments of single vehicles are not studied in this paper,
only some qualitative tests are shown. While chasing, a
CO2 analyser or some other instrument with a fast
response time should be installed into the van to
indicate staying in the rapidly varying plume. To be
flexible for different type of measurements, an extra
inlet system for variable number of instruments is
needed in future. Since the ground wind is very
turbulent, the wind sensor should be lifted to 8m to
get a better indication of the direction of the air mass
sampled.
The fine particle concentrations measured by ELPI,
CPC and SMPS compared rather well, even though in
some cases ELPI overestimated the number concentra-
tion of the smallest particles. Typical size distribution of
fine particles on the highway in Helsinki possessed
bimodal structure with the modal mean diameters of
15–20 nm and B150 nm. Approximately 90% of the
particles were smaller than 50 nm. The peak concentra-
tions exceeded often 200,000 particles cm�3 and reached
sometimes a value of 106 cm�3.
Atmospheric dispersion of traffic pollutions were
measured by moving away from the highway along
the wind direction. Combined with the stationary site,
the mobile laboratory allows very rapid distribution
measurement with confidence on the stability of
the source and dispersion conditions. At a distance of
120–140m from the source the concentrations were
diluted to one-tenth from the values measured at 9m
from the source. This kind of dispersion data that
is not easily found in the literature might be applied

ARTICLE IN PRESS
Fig. 6. Two dispersion studies of traffic emissions measured by moving away from the source on Itavayla in Helsinki, Finland, on 19
February 2003. Shown are the total particle number concentration measured by ELPI and SMPS (a), and the average particle size
distributions as a function of the distance from the source in the afternoon rush hours (b). The stationary SMPS data at 65m away
from the highway is presented in (c).
L. Pirjola et al. / Atmospheric Environment 38 (2004) 3625–3635 3633
for modelling purposes, especially for comparison of
modelled results with observations and for help of the
evaluation of dispersion models. Future work is to
couple a road network dispersion model CAR-FMI
(Harkonen et al., 1995, 1996) and a monodisperse
aerosol dynamics model MONO32 (Pirjola and Kulma-
la, 2000; Pirjola et al., 2003) and compare the presented
data with simulations.
Acknowledgements
This work was funded by the National Techno-
logy Agency of Finland (TEKES), the FINE techno-
logy program LIPIKA (contract 629/31/02). We
wish to acknowledge Mr. Turo Tiilila, Mr. Kalle
Kalaja, Mr. Petri Ketonen, Mr. Juha Seppala and
Mr. Timo Lehtonen of Helsinki Polytechnic for their

ARTIC
LEIN
PRES
S
Table 1
The average total particle number concentration as well as the number concentrations of each stage and background site (BG) measured by ELPI at each site during the dispersion
cases
Site Ntot cm�3 3–20 nm
SMPS
20–50 nm
SMPS
73nm
ELPI
122 nm
ELPI
205 nm
ELPI
321 nm
ELPI
491nm
ELPI
772 nm
ELPI
1.25mmELPI
1.98mmELPI
3.13mmELPI
6U37mmELPI
19 February, 14:50–15:45
9m 1.19E+05 7.77E+04 3.68E+04 2.20E+03 1.61E+03 8.36E+02 2.43E+02 3.16E+01 5.49E+00 1.34E+00 2.39E�01 8.53E�02 7.63E�02
37m 9.89E+04 5.42E+04 3.85E+04 2.88E+03 2.01E+03 1.03E+03 2.68E+02 3.60E+01 6.10E+00 9.93E�01 1.52E�01 4.35E�02 4.14E�02
65m 6.30E+04 3.57E+04 2.26E+04 2.16E+03 1.49E+03 7.78E+02 1.96E+02 3.10E+01 5.15E+00 1.13E+00 1.44E�01 2.80E�02 3.21E�02
95m 5.00E+04 2.59E+04 2.03E+04 1.81E+03 1.19E+03 6.17E+02 1.55E+02 2.94E+01 4.65E+00 1.20E+00 1.88E�01 3.06E�02 2.10E�02
125m 2.60E+04 1.47E+04 0.88E+04 1.13E+03 8.28E+02 4.62E+02 1.07E+02 2.74E+01 4.23E+00 1.43E+00 2.55E�01 1.14E�02 3.02E�03
BG 2.02E+04 0.95E+04 0.82E+04 1.07E+03 7.98E+02 4.65E+02 9.88E+01 3.16E+01 5.63E+00 2.25E+00 6.41E�01 1.24E�01 2.11E�02
19 February, 16:22–17:20
9m 1.99E+05 1.04E+05 8.00E+04 7.16E+03 4.68E+03 2.25E+03 4.95E+02 5.37E+01 1.20E+01 2.14E+00 3.87E�01 1.08E�01 1.10E�01
24m 1.58E+05 1.06E+05 4.37E+04 3.59E+03 2.67E+03 1.37E+03 3.19E+02 4.22E+01 8.20E+00 1.63E+00 2.61E�01 4.55E�02 4.53E�02
39m 5.85E+04 3.06E+04 2.29E+04 2.31E+03 1.63E+03 8.37E+02 1.77E+02 3.46E+01 6.41E+00 1.86E+00 4.17E�01 4.86E�02 4.29E�02
65m 6.18E+04 3.56E+04 2.12E+04 2.29E+03 1.62E+03 8.28E+02 1.70E+02 3.33E+01 6.72E+00 2.14E+00 4.31E�01 1.94E�02 1.97E�02
125m 3.91E+04 1.61E+04 1.70E+04 2.73E+03 1.99E+03 1.02E+03 2.14E+02 3.55E+01 7.30E+00 2.87E+00 9.19E�01 2.06E�01 1.56E�01
BG 1.99E+04 0.91E+04 0.83E+04 1.07E+03 7.98E+02 4.65E+02 9.88E+01 3.16E+01 5.63E+00 2.25E+00 6.41E�01 1.24E�01 2.11E�02
The geometric mean diameters of the stages are shown. The concentrations of the two lowest stages of ELPI (7–56 nm) are replaced by the nanoparticle concentrations measured by
SMPS.
L.
Pirjo
laet
al.
/A
tmo
sph
ericE
nviro
nm
ent
38
(2
00
4)
36
25
–3
63
53634

ARTICLE IN PRESSL. Pirjola et al. / Atmospheric Environment 38 (2004) 3625–3635 3635
contribution while designing and constructing the
mobile laboratory.
References
Ahlvik, P., Ntziachristos, L., Keskinen, J., Virtanen, A., 1998.
Real time measurements of diesel particle size distribution
with on electrical low pressure impactor. SAE Paper No.
980410.
Baumgard, K.J., Johnson, J.H., 1996. The effect of fuel and
engine design on diesel exhaust particle size distributions.
SAE Paper No. 960131.
Bukowiecki, N., Dommen, J., Prevot, A.S.H., Richter, R.,
Weingartmenr, E., Valtensperger, U., 2002. A mobile
pollutant measurement laboratory—measuring gas phase
and aerosol ambient concentrations with high spatial
and temporal resolution. Atmospheric Environment 36,
5569–5579.
Dockery, D.W., Pope, C.A., 1994. Acute respiratory effects of
particulate air pollution. Annual Review of Public Health
15, 107–132.
Donaldson, K., Li, X.Y., MacNee, W., 1998. Ultrafine
(nanometer) particle mediated lung injury. Journal of
Aerosol Science 29, 553–560.
Harkonen, J., Valkonen, E., Kukkonen, J., Rantakrans, E.,
Jalkanen, L., Lahtinen, K., 1995. An operational dispersion
model for predicting pollution from a road. International
Journal of Environmental Pollution 5, 602–610.
Harkonen, J., Valkonen, E., Kukkonen, J., Rantakrans, E.,
Lahtinen, K., Karppinen, A., Jalkanen, L., 1996. A model
for the dispersion of pollution from a road network. Finnish
Meteorological Institute, Publication on Air Quality 23,
Helsinki, 34pp.
Harrison, R.M., et al., 1999. Measurements of the physical
properties of particles in the urban atmosphere. Atmo-
spheric Environment 33, 309–321.
Hinds, W.C., 1999. Aerosol Technology. Properties, Behaviour,
and Measurement of Airborne Particles 2nd Edition. Wiley,
New York.
Hussein, T., Hameri, K., Aalto, P.P., Paaatero, P., Kulmala,
M., 2004. Modal structure and spatial-temporal variations
of urban and suburban aerosols in Helsinki region. Atmo-
spheric Environment, submitted for publication.
Karppinen, A., Kukkonen, J., Elolahde, T., Konttinen, M.,
Koskentalo, T., Rantakrans, E., 2000. A modelling system
for predicting urban air pollution: model description and
applications in the Helsinki metropolitan area. Atmospheric
Environment 34, 3723–3733.
Keskinen, J., Pietarinen, K., Lehtimaki, M., 1992. Electrical
low pressure impactor. Journal of Aerosol Science 23,
353–360.
Khalek, I.A., Kittelson, D.B., Brear, F., 2000. Nanoparticle
growth during dilution and cooling of diesel exhaust:
experimental investigation and theoretical assessment.
SAE Paper No. 2000-01-0515.
Kirchstetter, T.W., Harley, R.A., Kreisberg, N.M., Stolzen-
burg, M.R., Hering S, V., 1999. On-road measurement of
fine particle and nitrogen oxide emissions from light- and
heavy-duty motor vehicles. Atmospheric Environment 33,
2955–2968.
Kittelson, D.B., 1998. Engines and nanoparticles: a review.
Journal of Aerosol Science 29, 575–588.
Kittelson, D, Johnson, J., Watts, W., Wei, Q., Drayton, M.,
Paulsen, D., Bucowiecki, N., 2000. Diesel aerosol sampling
in the atmosphere. SAE Paper No. 2000-01-2212.
Pakkanen, T., Loukkola, K., Korhonen, C.H., Aurela, M.,
Makela, T., Hillamo, R.E., Aarnio, P., Koskentalo, T.,
Kousa, A., Maenhaut, W., 2001. Sources and chemical
composition of atmospheric fine and coarse particles in the
Helsinki area. Atmospheric Environment 35, 5381–5391.
Pirjola, L., Kulmala, M., 2000. Aerosol dynamical model
MULTIMONO. Boreal Environmental Researches 5,
361–374.
Pirjola, L., Tsyro, S., Tarrason, L., Kulmala, M., 2003. A
monodisperse aerosol dynamics module—a promising
candidate for use in the Eulerian long-range transport
model. Journal of Geophysical Research 108 (D9), 4258
(doi:10.1029/2002JD002867).
Pohjola, M., Pirjola, L., Kukkonen, J., Kulmala, M., 2003.
Modelling of the influence of aerosol processes for the
dispersion of vehicular exhaust plumes in street environ-
ment. Atmospheric Environment 3, 339–351.
Pope III, C.A., Burnett, R.T., Thun, M.J., Calle, E.E., Krewski,
D., Ito, K., Thurnston, G.D., 2002. Lung cancer, cardio-
pulmonary mortality, and long-term exposure to fine
particulate air pollution. American Medical Association
287, 1132–1140.
Schauer, J.J., Rogge, W.F., Hildemann, L.M., Mazurek, M.A.,
Cass, G.R., Simoneit, B.R.T., 1996. Source apportionment
of airborne particulate matter using organic compounds as
tracers. Atmospheric Environment 30, 3837–3855.
Seakins, P.W., Lansley, D.L., Hodgson, A., Huntley, N., Pope,
F., 2002. New directions: mobile laboratory reveals new
issues in urban air quality. Atmospheric Environment 36,
1247–1248.
Shi, J.P., Khan, A.A., Harrison, R.M., 1999. Measurements of
ultrafine particle concentration and size distribution in the
urban atmosphere. The Science of the Total Environment
235, 51–64.
Vogt, R., Kirchner, U., Scheer, V., Hinz, K.P., Trimborn, A.,
Spengler, B., 2003. Identification of diesel exhaust particles
at an Autobahn, urban and rural location using single-
particle mass spectrometry. Journal of Aerosol Science 34,
319–337.