Sniffer Pro - Network Optimization and Troubleshooting Handbook
678
-
Upload
stiki-indonesia -
Category
Documents
-
view
2 -
download
0
Transcript of Sniffer Pro - Network Optimization and Troubleshooting Handbook


solutions@s y n g r e s s . c o m
With more than 1,500,000 copies of our MCSE, MCSD, CompTIA, and Ciscostudy guides in print, we continue to look for ways we can better serve theinformation needs of our readers. One way we do that is by listening.
Readers like yourself have been telling us they want an Internet-based ser-vice that would extend and enhance the value of our books. Based onreader feedback and our own strategic plan, we have created a Web sitethat we hope will exceed your expectations.
[email protected] is an interactive treasure trove of useful infor-mation focusing on our book topics and related technologies. The siteoffers the following features:
■ One-year warranty against content obsolescence due to vendorproduct upgrades. You can access online updates for any affectedchapters.
■ “Ask the Author” customer query forms that enable you to postquestions to our authors and editors.
■ Exclusive monthly mailings in which our experts provide answers toreader queries and clear explanations of complex material.
■ Regularly updated links to sites specially selected by our editors forreaders desiring additional reliable information on key topics.
Best of all, the book you’re now holding is your key to this amazing site.Just go to www.syngress.com/solutions, and keep this book handy whenyou register to verify your purchase.
Thank you for giving us the opportunity to serve your needs. And be sureto let us know if there’s anything else we can do to help you get the maximum value from your investment. We’re listening.
www.syngress.com/solutions
219_sniffer_FM.qxd 6/28/02 2:28 PM Page i

219_sniffer_FM.qxd 6/28/02 2:28 PM Page ii
1 YEAR UPGRADEB U Y E R P R O T E C T I O N P L A N
Robert J. Shimonski
Wally Eaton
Umer Khan
Yuri Gordienko
Sniffer ProN e t w o r k O p t i m i z a t i o n &
Tr o u b l e s h o o t i n g H a n d b o o k
219_sniffer_FM.qxd 6/28/02 2:28 PM Page iii

Syngress Publishing, Inc., the author(s), and any person or firm involved in the writing, editing, orproduction (collectively “Makers”) of this book (“the Work”) do not guarantee or warrant the resultsto be obtained from the Work.
There is no guarantee of any kind, expressed or implied, regarding the Work or its contents.The Workis sold AS IS and WITHOUT WARRANTY. You may have other legal rights, which vary from stateto state.
In no event will Makers be liable to you for damages, including any loss of profits, lost savings, orother incidental or consequential damages arising out from the Work or its contents. Because somestates do not allow the exclusion or limitation of liability for consequential or incidental damages, theabove limitation may not apply to you.
You should always use reasonable care, including backup and other appropriate precautions, whenworking with computers, networks, data, and files.
Syngress Media®, Syngress®,“Career Advancement Through Skill Enhancement®,” and “Ask theAuthor UPDATE®,” are registered trademarks of Syngress Publishing, Inc. “Mission Critical™,”“HackProofing®,” and “The Only Way to Stop a Hacker is to Think Like One™” are trademarks of SyngressPublishing, Inc. Brands and product names mentioned in this book are trademarks or service marks oftheir respective companies.KEY SERIAL NUMBER001 4KT53GR4T9002 VDKPR2MPE4003 N5SN5MEU63004 Z3PU7GD34B005 VHN7UFMY6N006 EM4GF34RN8007 R4ATBGBV3T008 56RHPBQR56009 EB4B33N5AS010 AJ25FCT6YH
PUBLISHED BYSyngress Publishing, Inc.800 Hingham StreetRockland, MA 02370Sniffer Network Optimization and Troubleshooting Handbook
Copyright © 2002 by Syngress Publishing, Inc.All rights reserved. Printed in the United States ofAmerica. Except as permitted under the Copyright Act of 1976, no part of this publication may bereproduced or distributed in any form or by any means, or stored in a database or retrieval system,without the prior written permission of the publisher, with the exception that the program listingsmay be entered, stored, and executed in a computer system, but they may not be reproduced forpublication.
Printed in the United States of America
1 2 3 4 5 6 7 8 9 0
ISBN: 1-931836-57-4Technical Editors: Robert J. Shimonski and Umer Khan Cover Designer: Michael KavishTechnical Reviewer: Randy Cook Page Layout and Art by: Shannon Tozier Acquisitions Editor: Catherine B. Nolan Copy Editor: Darlene BordwellDevelopmental Editor: Jonathan Babcock Indexer: Rich Carlson
Distributed by Publishers Group West in the United States and Jaguar Book Group in Canada.
219_sniffer_FM.qxd 6/28/02 2:28 PM Page iv

v
Acknowledgments
v
We would like to acknowledge the following people for their kindness and supportin making this book possible.
Ralph Troupe, Rhonda St. John, Emlyn Rhodes, and the team at Callisma for theirinvaluable insight into the challenges of designing, deploying and supporting world-class enterprise networks.
Karen Cross, Lance Tilford, Meaghan Cunningham, Kim Wylie, Harry Kirchner, KevinVotel, Kent Anderson, Frida Yara, Jon Mayes, John Mesjak, Peg O’Donnell, SandraPatterson, Betty Redmond, Roy Remer, Ron Shapiro, Patricia Kelly,Andrea Tetrick,Jennifer Pascal, Doug Reil, David Dahl, Janis Carpenter, and Susan Fryer of PublishersGroup West for sharing their incredible marketing experience and expertise.
Jacquie Shanahan,AnnHelen Lindeholm, David Burton, Febea Marinetti, and RosieMoss of Elsevier Science for making certain that our vision remains worldwide inscope.
David Buckland, Daniel Loh,Wendi Wong, Marie Chieng, Lucy Chong, Leslie Lim,Audrey Gan, and Joseph Chan of Transquest Publishers for the enthusiasm withwhich they receive our books.
Kwon Sung June at Acorn Publishing for his support.
Jackie Gross, Gayle Voycey,Alexia Penny,Anik Robitaille, Craig Siddall, DarleneMorrow, Iolanda Miller, Jane Mackay, and Marie Skelly at Jackie Gross & Associatesfor all their help and enthusiasm representing our product in Canada.
Lois Fraser, Connie McMenemy, Shannon Russell, and the rest of the great folks atJaguar Book Group for their help with distribution of Syngress books in Canada.
A special welcome to the folks at Woodslane in Australia! Thank you to David Scottand everyone there as we start selling Syngress titles through Woodslane in Australia,New Zealand, Papua New Guinea, Fiji Tonga, Solomon Islands, and the Cook Islands.
219_sniffer_FM.qxd 6/28/02 2:28 PM Page v

219_sniffer_FM.qxd 6/28/02 2:28 PM Page vi

vii
Contributors
Wally Eaton (CNX, BSCS, CCNP, CCDP, MCSE, MCP+I, NET-WORK+, FCC) is Chief Security Officer for the city of Jacksonville, FL.Previously,Wally held the position of Senior Systems Field Engineer forthe Unisys Corporation, retiring after 20 years.At Unisys his dutiesincluded installing, debugging, and maintaining hardware and system soft-ware for Unisys mainframe computers. He is currently enrolled in thegraduate program of Capitol College of Maryland, pursuing a master’s ofScience in Network Security.
Yuri Gordienko (CCNP, CCNA, CCDA, MCSE) is a BackboneEngineer with AT&T Canada, one of the largest Canadian ISPs. He isresponsible for engineering and support of the national backbone. Hisspecialties include Cisco routers and switches; network architecture andoptimization; design and rollout of Internet Data Centers (IDC) inMontreal,Toronto, and Vancouver; and deployment of AT&T Canadaroute servers.Yuri is also a part-time instructor at RCC College,Toronto,teaching a computer communications course. He has contributed to sev-eral Syngress certification books, including Cisco Certified Design AssociateStudy Guide and Cisco Certified Network Associate Study Guide, SecondEdition.Yuri holds a degree in Computation Physics.
Eric Ouellet (CISSP) is a Senior Partner with Secure Systems DesignGroup, a network design and security consultancy based in Ottawa,Ontario, Canada. He specializes in the implementation of networks andsecurity infrastructures from both a design and a hands-on perspective.Over his career he has been responsible for designing, installing, and trou-bleshooting WANs using Cisco, Nortel, and Alcatel equipment, configuredto support voice, data and video conferencing services over terrestrial,satellite relay, wireless and trusted communication links.
Eric has also been responsible for designing some of the leadingPublic Key Infrastructure deployments currently in use and for devisingoperational policy and procedures to meet the Electronic Signature Act
219_sniffer_FM.qxd 6/28/02 2:28 PM Page vii

viii
(E-Sign) and the Health Insurance Portability and Accountability Act(HIPAA). He has provided his services to financial, commercial, govern-ment, and military customers including United States FederalGovernment, Canadian Federal Government and NATO. He regularlyspeaks at leading security conferences and teaches networking and CISSPclasses. He co-authored Hack Proofing Your Wireless Network (SyngressPublishing, ISBN: 1-928994-59-8) and Building A Cisco Wireless LAN(Syngress Publishing, ISBN: 1-928994-58-X). Eric would like toacknowledge the understanding and support of his family and friendsduring the writing of this book, along with PK, FS, SJ, MW,ATN, SM,and “The Boys” for being who they are.
Randy Cook (MCSE, SCSA) is the Senior UNIX Systems Administratorand Network Engineer for Sapphire Technologies, one of the world’sleading staffing organizations. Randy supports a wide variety of operatingsystems and mission-critical applications in high-threat environments.Randy has been the co-author and technical editor for several Syngressbooks including the Sun Certified System Administrator for Solaris 8.0 StudyGuide (ISBN: 007-212369-9) and Hack Proofing Sun Solaris 8 (ISBN:1-928994-44-X). He has also published technical articles for IT industrymagazines and hosted a syndicated radio news program.
Contributor and TechnicalReviewer
219_sniffer_FM.qxd 6/28/02 2:28 PM Page viii
ix
Robert J. Shimonski (SCP, CCDP, CCNP, Nortel NNCSS, MCSE,MCP+I, Master CNE, CIP, CIBS, CWP, CIW, GSEC, GCIH, Server+,Network+, Inet+,A+, eBiz+,TICSA, SPS) is the Lead Network Engineerand Security Analyst for a leading manufacturer and provider of linearmotion products and engineering. One of Robert’s primary responsibili-ties is to use multiple network analysis tools (including Sniffer Pro) on adaily basis to monitor, baseline, and troubleshoot an enterprise networkcomprised of a plethora of protocols and media technologies. In Robert’smany years of performing high and low level network design and analysis,he has been able to utilize a methodology of troubleshooting and analysisfor not only large enterprises, but also for small to medium sized compa-nies looking to optimize their WANs, LANs, and security infrastructure.
Robert currently hosts an online forum for TechTarget.com and isreferred to as the “Network Management Answer Man,” where he offerssolutions on a daily basis to seekers of network analysis and managementadvice. Robert’s other specialties include network infrastructure designwith the Cisco and Nortel product line for enterprise networks. Robertalso provides network and security analysis using Sniffer Pro, Etherpeek,the CiscoSecure Platform (including PIX Firewalls), and Norton’sAntivirus Enterprise Software.
Robert has contributed to many articles, study guides, and certifica-tion preparation software, and Web sites and organizations worldwide,including MCP Magazine,TechTarget.com, Brainbuzz.com, andSANS.Org. Robert’s background includes positions as a NetworkArchitect at Avis Rent-A-Car and Cendant Information Technology.Robert holds a bachelor’s degree from SUNY, NY and is a part timeLicensed Technical Instructor for Computer Career Center in GardenCity, NY teaching Windows-based and Networking Technologies. Robertis also a contributing author for Configuring & Troubleshooting Windows XPProfessional (Syngress Publishing, ISBN: 1-928994-80-6) and BizTalkServer 2000 Developer’s Guide for .NET (Syngress, ISBN: 1-928994-40-7)
Technical Editors and Contributors
219_sniffer_FM.qxd 6/28/02 2:28 PM Page ix

x
Umer Khan (SCE, CCIE, MCSE, SCSA, SCNA, CCA, CNX) is theManager of Networking and Security at Broadcom Corporation(www.broadcom.com). Umer’s department is responsible for the designand implementation of global LAN/MAN/WAN solutions that are avail-able with 99.9% up time (planned and unplanned), as well as all aspects ofinformation security at Broadcom.Among other technologies, Broadcom’snetwork consists of Cisco switching gear end-to-end, dark fiber, OC-48SONET, DWDM, 802.11 wireless, multi-vendor VPNs, and VoIP.Theinformation security group deals with policies, intrusion detection andresponse, strong authentication, and firewalls. Umer received his bachelor’sdegree in Computer Engineering at the Illinois Institute of Technology.
219_sniffer_FM.qxd 6/28/02 2:28 PM Page x

Contents
xi
Foreword xxv
Chapter 1 Introduction to Sniffer Pro 1Introduction 2Understanding Network Analysis 2
Network Analysis Fundamentals 3Troubleshooting Methodology 5
The OSI Model, Protocols, and Devices 7The OSI Model and the DOD Model 8
TCP/IP 10IPX/SPX 17AppleTalk 20Ethernet 24Fast Ethernet and Gigabit Ethernet 30Token Ring 31
Other Protocols 34DECnet 35SNA 36Wireless Communication 36
Hubs and MAUs 36What Is a Hub? 37What Is a MAU? 39
Switches, Bridging, and NICs 40Switches, Bridges and Bridging 40Differences Between a Switch and
a Bridge 41Network Interface Cards 45
Routers and Gateways 46Routing Fundamentals and Protocols 46
Features of Sniffer Pro
■ It decodes for morethan 450 protocols.
■ It provides support formajor LAN, WAN, andnetworkingtechnologies.
■ It provides the abilityto filter packets at boththe bit and byte levels.
■ It provides expertanalysis and diagnosisof network problemsand recommendscorrective actions.
■ Switch Expert providesthe ability to pollstatistics from variousnetwork switches.
■ Network trafficgenerator can operateat Gigabit speeds.
219_sniffer_TOC.qxd 6/28/02 5:00 PM Page xi

xii Contents
Sniffer Pro Fundamentals 48Features of Sniffer Pro 48Other Sniffer Versions and Products 49Other Solutions and Products 50
EtherPeek 50Ethereal 50Agilent Advisor 50
Management and Return on Investment 50Charts and Reporting 51Proactive and Reactive Network
Maintenance 51Sniffer Pro:The Exam 52
Certification Testing and the Sniffer University 52Sniffer Certified Professional 52SCP, SCE, and SCM 54
Other Certifications and Tracks 54Summary 56Solutions Fast Track 56Frequently Asked Questions 58
Chapter 2 Installing Sniffer Pro 61Introduction 62Installing Sniffer Pro Step by Step 62
System Requirements for Sniffer ProInstallation 63
Minimum System Requirements forVersion 4.x 63
Internet Explorer 5 with the VirtualMachine 64
Minimum System Requirements forVersion 3.0 65
Installing Sniffer Pro 4.5 65Licensing 75Read the Readme.txt File 76
Installation of Version 3.x 77Installing Sniffer Pro on Other Platforms
and Hardware 81
Answers to YourFrequently AskedQuestions
Q: Does NAI recommenda particular brand ormodel of laptop onwhich to run SnifferPro?
A: No. Unlike the olderDOS versions of Sniffer,NAI recommends noparticular brand ormodel of system forSniffer Pro. Use yourbest judgment to buya stable and high-performance machine.
Q: Can I connect toSniffer Pro from aremote PC, using theDistributed Sniffer Proconsole?
A: No. Sniffer Pro isstandalone softwareand cannot beaccessed using theDistributed Sniffer Proconsole. To control aSniffer Pro systemremotely, you caninstall remote controlsoftware such as PCAnywhere, VNC, orCarbon Copy.
219_sniffer_TOC.qxd 6/28/02 5:00 PM Page xii

Contents xiii
Laptop Considerations 82Apple Considerations 83
Customizing the Installation 83Configuring Sniffer Pro for Remote Access 83Using a Tablet PC for Portability 84
Configuring Network Interfaces and Drivers 84The Promiscuous NIC 84
Selecting the NIC 85NetPod 86
Replacing Drivers 88Standard NDIS Drivers and Issues 88Sniffer Pro Network Drivers 88NAI Enhanced Drivers for Windows 2000 89Removing Previously Installed PnP
Network Drivers on Windows 98 90Disabling Unnecessary Services on
Ethernet Adapters Attached to Pods 91Changing Network Speeds After
Starting Sniffer Pro 91Enhancing Capture Performance 92Enhancing General System Performance 93Notebook Resource Problems 93Known Issues with Windows 2000 95Installing Gigabit Ethernet, HSSI,
and LM2000 Cards 95Troubleshooting the Installation 97
Failed Installation 97Drivers Not Installing 97
Installing on the Wrong Platform 98Error Messages 98Failing to Delete Sniffer.ini on
an Upgrade 99Building a Technician Tool Kit 99
Summary 101Solutions Fast Track 101Frequently Asked Questions 103
219_sniffer_TOC.qxd 6/28/02 5:00 PM Page xiii

xiv Contents
Chapter 3 Exploring the Sniffer Pro Interface 105
Introduction 106Exploring the Dashboard 106
Real-Time Statistics 106Utilization and Errors 107Setting Thresholds 112Configurable Dashboard Graphs 113
Understanding Menus 114The File Menu 114The Monitor Menu 115The Capture Menu 123The Display Menu 124The Tools Menu 125The Database Menu 125The Window Menu 126Help 127
Understanding the Toolbars 127Starting, Stopping, and Viewing a Capture 129Defining a Wizard 130Opening and Saving a Capture 130Printing 131Other Icons and Functions 132
Miscellaneous Sniffer Pro Tools 132Packet Generator and Loopback Mode 133The Bit Error-Rate Test 135Reporter 136Ping 136Trace Route 137DNS Lookup 138Finger 138WhoIs 138Address Book 139
The Expert 139The Capture 139
False Positives 140
The Global StatisticsToolbar
Bar
Pie
Reset
219_sniffer_TOC.qxd 6/28/02 5:00 PM Page xiv

Contents xv
The Decode Tab 140Matrix 143Host Table 145Protocol Distribution 147Statistics 148
Graphs, Charts, and Maps 148Top Talkers 149Heavy Protocol Distribution 149Creating a List of Hosts on Your Network 150
Using the Address Book 150Adding New Addresses 151Exporting the Address Book 153
Summary 154Solutions Fast Track 154Frequently Asked Questions 157
Chapter 4 Configuring Sniffer Pro to Monitor Network Applications 159
Introduction 160Basic Sniffer Pro Data Capture Operations 160
Starting and Stopping the Capture Process 161Viewing and Dissecting the Capture 166
Monitoring with the Summary,Details, and Hex Panes 166
Sniffer Pro Analyzer Placement 177Sniffer Pro Advanced Configuration 179
Switched Port Analyzer 180How to Set Port Spanning 181How to Set Port Spanning for a VLAN 181
Timestamping Procedures 183Timestamp Columns and Timestamping 183
Viewing and Using the Expert 186The Expert and Objects 187
Troubleshooting with the Expert System 188The Expert Layers 188Expert Alerts and Problems Indicators 193False Positives and Negatives 197
WARNING
Make sure you masterthe art of workingwith timestamps sothat you can trou-bleshoot how long alogin occurs or howlong it takes totransfer a file. Onceyou learn how to builda filter, use time-stamps to isolate aclient/server login tosee how long it takes.You must also masterthis information forthe SCP exam.
219_sniffer_TOC.qxd 6/28/02 5:00 PM Page xv

xvi Contents
Configuring Expert Options 198Application Response Time 205
Adding Custom Protocols to ART 208Configuring Sniffer Pro to Capture andAnalyze NetWare Traffic 209
Sniffer Pro Traffic Capture 210Analyzing the Summary Pane 210Analyzing the Details Pane 211Analyzing the Hex Pane 214
Configuring Sniffer Pro to Capture andAnalyze Microsoft Traffic 214
Sniffer Pro Traffic Capture 215Analyzing the Summary Pane 216Analyzing the Details Pane 216Analyzing the Hex Pane 224
Summary 225Solutions Fast Track 226Frequently Asked Questions 228
Chapter 5 Using Sniffer Pro to Monitor the Performance of a Network 231
Introduction 232Network Performance Issues 232Real-Time Performance Monitoring with
Sniffer Pro 236Using the Dashboard in Real Time 238
The Gauge Tab 239The Detail Tab 241The Network Graph 243The Detail Errors Graph 247The Size Distribution Graph 250Long- and Short-Term Analysis 251Customizing Your View 251
Setting Thresholds 252Baselining,Trending, and Change Management 256
Baselining Over Time 257Trending Tips 257
The Default Utilization% Dial
219_sniffer_TOC.qxd 6/28/02 5:00 PM Page xvi
Contents xvii
Change Management 258Analyzing Ethernet Performance with Sniffer Pro 259
Monitoring the Performance of the Ethernet 259Saturation Levels and Collisions 260Ethernet Framing Problems 262Hardware Problems 267STP Loops and Broadcast Storms 268
Analyzing Token Ring Performance withSniffer Pro 270
Monitoring the Performance of Token Ring 272Setting Up Sniffer Pro to AnalyzeToken Ring 272
Viewing the Dashboard with TokenRing 273
Common Token Ring PerformanceProblems 278
Configuring Thresholds 283Other Token Ring Performance
Solutions 283Analyzing LAN Routing Performance Issues 286
Routing Updates 287Realigning Your Network for Better Performance 289Summary 292Solutions Fast Track 292Frequently Asked Questions 296
Chapter 6 Capturing Network Data for Analysis 299
Introduction 300Capturing Traffic 300
How to Capture Traffic 301Taking Captures from the Menu and
the Toolbar 302Pulling Up the Capture Panel 303
Saving and Using Captures 305Saving Captures 306
File Types 311
Taking Captures fromthe Menu and theToolbar
There are a few differentways of taking captures:
■ By choosing Capture |Start from the Mainmenu
■ By pressing the F10 key
■ By pressing the Startbutton on the maintoolbar (it looks likethe Play button onyour VCR)
219_sniffer_TOC.qxd 6/28/02 5:00 PM Page xvii

xviii Contents
Retrieving and Loading Captures 311Capturing and Analyzing Address Resolution
Protocol 312Capturing ARP Traffic 313Analyzing the Capture 316
Capturing and Analyzing Internet ControlMessage Protocol 318
Capturing ICMP Traffic 318Analyzing the Capture 320
Capturing and Analyzing Transmission ControlProtocol 326
Capturing TCP Traffic 327Analyzing the Capture 329
Capturing and Analyzing User DatagramProtocol 333
Capturing UDP Traffic 334Analyzing the Capture 334
Summary 337Solutions Fast Track 338Frequently Asked Questions 341
Chapter 7 Analyzing Network Issues 343Introduction 344Hey! Why Is the Network So Slow? 344
Using Sniffer Pro to Troubleshoot a SlowNetwork 345
Excessive Collisions and CollisionDomains 345
Collisions on a Network Segment 347Ethernet Specifications 348Collision Domain 349Repeaters 350Ethernet Bridges 353Ethernet Switches 353Determining the Collision Domain 357
Half- and Full-Duplex Communication 358Late Collisions 360
NOTE
Remember, after 16consecutive collisions,the frame is discardedand the collision insome cases might notbe reported to theupper-layer protocols.Application timershave to expire beforea retransmissionattempt occurs. Thisstipulation can causeserious delays andprogram timeouts.
219_sniffer_TOC.qxd 6/28/02 5:00 PM Page xviii

Contents xix
Causes of Late Collisions 360Broadcasts from Hubs 361Broadcast Domains 361
What Does the Expert Say? 362Troubleshooting the Broadcast 363
Resetting Token Ring Networks 366Multi-MAU Configurations 367Token Passing 368
The Active Monitor 369The Standby Monitor 369
Ring Insertion 371Troubleshooting the Token 373
Using Sniffer Pro to Troubleshoot a ChatteringNetwork Interface Card 375
Alignment Errors 376Fragment Errors 378Jabber Errors 378
Using Sniffer Pro to Troubleshoot SmallPackets (Runts) 380
Using Sniffer Pro to Troubleshoot BrowsingBattles 381
Browser Elections 383Troubleshoot Browsing Battles 384Browser Communication 386Announcement! 389
Dynamic Host Configuration Protocol Failure 390BOOTP 390
DHCP Discover 391DHCP Offer 393DHCP Request 395DHCP Ack 396DHCP Release/Renew 397
DHCP Troubleshooting 399Summary 401Solutions Fast Track 402Frequently Asked Questions 404
219_sniffer_TOC.qxd 6/28/02 5:00 PM Page xix

xx Contents
Chapter 8 Using Filters 405Introduction 406What Is Filtering, and Why Filter? 406Using Predefined Filters 407
Filters Available to You by Default 407Creating Filters 409
Using the Filter Dialog Box 411Filter Dialog Box Tabs 411
Selecting Filters from the Main Menu 420Expert-Level Filtering 420
Filtering from One Node to Another 421MAC Address Filtering 423IP Address Filtering 428IPX Address Filtering 433
Troubleshooting with Filters 434Cisco Discovery Protocol 434Routing Information Protocol 437
Summary 439Solutions Fast Track 439Frequently Asked Questions 441
Chapter 9 Understanding and Using Triggers and Alarms 445
Introduction 446Introducing Triggers 448Configuring and Using Triggers 449
The Trigger Graphic Outline 449The Start and Stop Trigger Screens 450
Using the Date/Time Option 451Using the Alarm Option 452Using the Event Filter 453
Trigger Repeat Mode 454Configuring and Using Alarms 455
Alarm Log Display 456The Status Column 459The Alarm Type Column 459The Log Time Column 460
Filters
Sniffer Pro has four typesof filters:
■ Capture filters
■ Display filters
■ Monitor filters
■ Event filters
The Alarm TypeColumn
The Alarm Type columnindicates the type of nodeor the originator of thealarm as defined withinthe Address Book. Thesetypes can include servers,bridges, hubs, and othernetwork devices.
219_sniffer_TOC.qxd 6/28/02 5:00 PM Page xx

Contents xxi
The Severity Column 460The Description Column 460
Configuring Alarms Notifications 460Notification Using a Sound 460Associating an Action with Alarm
Severity 461Define Severity 461Define Actions Notification 462Managing Alarm Actions 463Defining an SMTP Mail Notification 464Defining a Pager Notification 465Defining a Beeper Notification 468
Modifying Alarm Threshold Levels 469Expert Alarm Thresholds 469Monitoring Alarm Thresholds 470
Application Response Time 472Summary 474Solutions Fast Track 476Frequently Asked Questions 479
Chapter 10 Reporting 481Introduction 482Reporting Fundamentals 482
Why You Should Consider Creatinga Report 484
Creating the Report Template 487Report Contents 487Tools of the Trade 488
Running and Exporting Reports 493Running Reports Under the Expert 494Running Reports Under the Matrix 497
Outline and Detail Views 497Top N Views 498
Running Reports Under Host Table 500Running Reports Under Protocol
Distribution 501Running Reports Under Global Statistics 502
NOTE
For the SnifferCertified Professionalexam, you might wantto pay attention fromwhere you can exporta report.
219_sniffer_TOC.qxd 6/28/02 5:00 PM Page xxi
Attacks: PasswordCapture and Replay
■ File Transfer Protocol(FTP) is the Internet’sfile exchange protocol.The protocol usesclient/serverarchitecture.
■ The client/serversession negotiation istransmitted in cleartext. The login andpasswords arecompletely visible toany would-be hackerwho has the price of acheap sniffingprogram. These itemscan be captured andreplayed with aminimum amount ofeffort.
■ Sniffer Pro can beconfigured to detectinvalid login orpassword attempts andmitigate the risk ofusing this clear-textprotocol.
xxii Contents
Other Exportable and Reportable Views 503Exporting from Your Address Book 504Exporting Data from Other Tools 504
HTML and CSV 505Creating a Full Report:“Network Is Slow” 506
“The Network Is Slow” 507Summary 509Solutions Fast Track 509Frequently Asked Questions 511
Chapter 11 Detecting and Performing Security Breaches with Sniffer Pro 513
Introduction 514Using Sniffer Pro to Find Holes in Your Network 514
Delivery and Payload 515Vulnerabilities in Detail 516
Code Red:The Exploit 516Nimda:The Exploit 524
Capturing Clear-Text Passwords 527IPv4 and Clear-Text Transfer of Information 527Telnet 528
Telnet Echo 529The Telnet Login Filter 530
SSH and Encryption 532Capturing E-Mail Logins 532
Attacks: Password Capture and Replay 534Capturing the Password, Step by Step 534Replaying the Password 536
FTP Password Guessing 536Simple Network Management Protocol 539
Domain Name Service Vulnerabilities 541DNS Basics 543
Resource Records 544DNS Recursion 545
Resolver 546DNS Zone Transfers 551Poisoning the DNS Cache 551
219_sniffer_TOC.qxd 6/28/02 5:00 PM Page xxii

Contents xxiii
DNS Cache Poisoning: How Does It Work? 552Cache Vulnerabilities 552
Server Message Block Vulnerabilities 555CIFS 556SMB and Its Flaws 556
Half the Story 556SMB Capture 557
SMB Signing 559Summary 560Solutions Fast Track 561Frequently Asked Questions 563
Chapter 12 Troubleshooting Traffic for Network Optimization 567
Introduction 568Fine Tuning Your Network and Performing
Proactive Maintenance 568Defining Key Elements of Quality
Network Performance 569Addressing Speed Issues 570Addressing Reliability Issues 572Addressing Security Issues 574
Proactive Management of NetworkResources with Sniffer Pro 576
AntiSniff:Who’s Sniffing Whom? 586Finding Unnecessary Protocols with the
Sniffer Pro 590Is TCP/IP Perfect? 594
Chatty Protocols 597AppleTalk 597IPX/SPX 599
Optimizing LAN and WAN Traffic Withthe Sniffer Pro 601
Broadcasts in Switched LAN Internetworks 601Spanning Tree Protocol 603
Attach Directly to a Switch for Analysis 606Optimizing with Sniffer Pro 611
TIP
If you want to test theuse of Sniffer Prorecording smallpackets, you can pingyourself with the fol-lowing:C:\> ping192.168.1.1 –t –l 50The –t will keep thepings continuousThe –l will set thelength of the packets,and the 50 is setting itto 50 bytes
219_sniffer_TOC.qxd 6/28/02 5:00 PM Page xxiii
xxiv Contents
Using Sniffer Pro to Find WAN Latency 613Solving Network Slowdowns with
Sniffer Pro 615More Slow Network Problems 617
Ethernet Optimization 618Ethernet Issues and the Need for
Optimization 618Collisions and Collision Domains 618CRC Errors 619Bottlenecks 619Unnecessary Broadcasts 620
NetWare Optimization and MicrosoftOptimization 621
Common NetWare Optimization Needs 622Common Microsoft Optimization Needs 624
Summary 627Solutions Fast Track 628Frequently Asked Questions 630
Index 633
219_sniffer_TOC.qxd 6/28/02 5:00 PM Page xxiv
In today’s business-based network infrastructures, problems arise almost every second.Either the network is too slow or something is not functioning properly.At theseproblematic times, many administrators use a troubleshooting technique not docu-mented in any textbook nor taught in any class nor found on any certification test. Itis the skill of pure clairvoyance. I know you have all seen it, watched your senior net-work administrator troubleshoot a network problem without performing any analysis.The administrator closes his or her eyes, tilts back in a chair, takes a few deep breaths,and a few seconds later, produces a solution:“It’s the NIC on the server—it has to beat least five years old. Maybe the drivers need to be replaced.” Have you ever seenthis feat achieved, or done it yourself? Chances are you have—it is very common.
As a network administrator, have you ever wanted to solve some of the deepestnetwork mysteries and figure out the most “Rubix cube-like” problems with nothingmore than a single glance at the cable coming out of the patch panel? If this is yourmodus operandi, this is the book for you. I used to tease my junior network adminis-trators by placing my finger in a free hub port, closing my eyes for a second, openingthem a few moments later, and blurting out a solution. Many times, they thought Iwas kidding—until I actually solved the problem.What they didn’t know was that Ihad spent the morning using the Sniffer Pro analyzer and some other tools to solvethe problems the network was experiencing.
What if you could stick your head into cabling, hubs, switches, or other networkgear and be able to tell exactly what the problem was? This book, along with theSniffer Pro Network Analysis software from Network Associates, can help you per-form network and protocol-level analysis. Sniffer Pro is a troubleshooting tool like noother, and in my opinion, it is not used as often as it should be.What if I told youthat with the Sniffer Pro tool, you could solve some of the biggest network problemsaround? Would you use it? Of course you would! This book was created to not onlyopen your eyes to the world of network analysis but also to teach you the finer
xxv
Foreword
219_sniffer_fore.qxd 6/28/02 5:01 PM Page xxv
xxvi Foreword
details of working with the tool that gets that essential packet-level data for you.Thattool is Sniffer Pro.You, using this book and Sniffer Pro, could easily become a net-work analysis technician and a Sniffer Certified Professional (SCP), a much betterchoice than the lord of clairvoyance by far.
Several years ago, purely out of frustration, I was inspired to write this book. Iwas having a problem with my network that I couldn’t figure out on my own, so Itraveled to my nearest bookstore. I walked aimlessly down the aisle looking for abook that might help me troubleshoot the mysterious network issues I was experi-encing back at work. I needed that one book that was going to help me solve myproblems—or at least point me in a better direction. I walked up and down eightaisles, but not even one book was to be found on network troubleshooting.Yikes!What to do now? I literally waded through 700+ books on HTML, MCSE, and allkinds of stuff that wasn’t going to help me. I called a friend who I hoped would beable to help and came up empty there, too. I couldn’t readily find what I hadassumed would be a common book for a common problem! What I wanted was abook on how to create a capture filter and analyze traffic based on patterns using theSniffer Pro Network Analyzer.That experience sent me on a mission to create theSniffer Pro Network Optimization and Troubleshooting Handbook.
The Sniffer Pro product has been the savior of both novice and experienced net-work administrators by being able to pick up clues about a network issue fromviewing a messy decode. However, many technicians have learned the wrong way touse it—capture everything and sift through it—and have quickly become frustratedwith not being able to learn how to accurately set up the application for proper anal-ysis.This book is meant to remedy that situation.
Sniffer Pro Network Optimization and Troubleshooting Handbook takes a building-block approach to getting the reader through both the mechanics of using Sniffer Proand the methodologies and techniques needed to deploy alongside Sniffer Pro. Donot make the mistake of thinking that this tool will solve your problems.You, as thenetwork analyst, will solve the problems with the help of the Sniffer Pro tool, andthe authors of this book have made sure that you are thinking that way every step ofthe way. For instance, in certain chapters you are asked to look at Ethernet problemssuch as excessive collisions with Sniffer Pro and arrive at a conclusion about what iswrong with the network. Not only will you learn about the problem and how to useSniffer Pro to uncover it, but the book also focuses on using other tools and tech-niques (all from the authors’ experience) on how to further diagnose the problemand come to full resolution.These techniques are important for you to master, andthis book will make sure that you do.
www.syngress.com
219_sniffer_fore.qxd 6/28/02 5:01 PM Page xxvi

www.syngress.com
Let’s look at a breakdown of the book by chapter:
■ Chapter 1,“Introduction to Sniffer Pro,” is a very detailed introduction tothe essentials of networking, what Sniffer Pro does for you, and the funda-mentals of the SCP certification exam.This is an important chapter becauseit covers many theories you will need to understand in order to use SnifferPro intelligently. It is meant also as a reference for you to return to whilereading the rest of the book to understand a concept you might not fullyunderstand, such as IPX addressing fundamentals or how to use hex-basedaddressing concepts.
■ Chapter 2,“Installing Sniffer Pro,” goes through the details of installing andconfiguring the Sniffer Pro application and the drivers required for it tofunction properly. Many technicians who know little about Sniffer Pro trulybelieve that installing Sniffer Pro on a workstation and running it will pro-vide them with solutions. Unfortunately, it is not that easy. For instance,using the wrong drivers hides collisions, preventing you from knowing youhave a problem. Furthermore, problems could be occurring downstreamfrom your place on the network, and you could be missing problematic datatransmissions because of your position on the network.This chapteraddresses these misconceptions as well as others.Additionally, this chaptercovers building a technician toolkit so that you know what to take with youto help augment Sniffer Pro and your troubleshooting skills.
■ Chapter 3,“Exploring the Sniffer Pro Interface,” explores the ins and outs ofthe Sniffer Pro interface.This chapter has three main goals. First, you needto know how to move around the application to be able to use it. Second,this chapter familiarizes you with basic configurations so you can create anduse the more advanced configurations later.As mentioned, this book takes abuilding-block approach so that you understand what you are doing as well asgoing through the mechanics of walking through the configuration steps.Lastly, you need to memorize the content of this chapter for the SCP exam.The exam contains many questions directly relating to how to get from oneplace to another and what can be done in each dialog box. It is essential thatyou fully review this chapter until it becomes second nature for you to walkthrough the configuration screens. Every time you perform network analysisis unique, so you should know how to use Sniffer Pro in any situation.
Foreword xxvii
219_sniffer_fore.qxd 6/28/02 5:01 PM Page xxvii
xxviii Foreword
■ Chapter 4,“Configuring Sniffer Pro to Monitor Network Applications,”builds on your newfound mastery of the Sniffer Pro interface and teachesyou how to monitor applications, especially applications running onMicrosoft and Novell NetWare networks. Basic Sniffer Pro capture processfundamentals are covered, followed by the nuances of capturing anddecoding traffic.Again, with a building-block approach, you will learn newtechniques within each chapter, building on the fundamentals learned insubsequent sections. Here, you learn to capture traffic and analyze it.Youneed to know how to position Sniffer Pro to capture specific conversationsbetween clients and how to analyze them.The chapter then walks youthrough capturing very specific protocols and how to analyze the decodes.You will look at (but are not limited to) SAP, NCP, Microsoft logins, mailslots, and NetBIOS.The contents of this chapter are your wakeup call towhat’s inside that wire.
■ Chapter 5,“Using Sniffer Pro to Monitor the Performance of a Network,”takes you down the path of performance monitoring, real-time monitoring,baselining, and trending.You must be very proficient with these techniquesfor network and performance analysis.This chapter lays out a problem net-work, then walks you through the detailed steps of how to monitor andrepair performance for that specific problem.At the end of the chapter, youhave a chance to look at the redesigned network functioning at peak perfor-mance.This chapter is very important for any technician who wants to beable to use the Sniffer Pro for performance analysis. It covers the dashboardin real time for both Ethernet and Token Ring networks, and it looks atLAN-based performance problems you will find on improperly designedand poorly configured networks.
■ Chapter 6,“Capturing Network Data for Analysis,” provides an in-depthexplanation of how to capture data with Sniffer Pro, how to save captures,and the fundamentals of building basic filters and profiles—all throughexamples with protocols such as ARP and TCP.
■ Chapter 7,“Analyzing Network Issues,” goes into the more advanced net-work problems and, more important, how you can use Sniffer Pro to find,analyze, and possibly eliminate these problems.This chapter goes into theanalysis of NIC chatter, slow network access and logins, DHCP problems,Token Ring problems, and more.This is an advanced chapter.
www.syngress.com
219_sniffer_fore.qxd 6/28/02 5:01 PM Page xxviii
Foreword xxix
■ Chapter 8,“Using Filters,” builds on the information in Chapter 6 thattaught you the fundamentals of building filters for network traffic captureand analysis. One of the most common problems technicians face is how tounderstand and build filters. It looks easy—until you start building patternsand using offsets.This chapter gives you the ammunition you need tounderstand how to build a filter and takes a look at the mechanics ofbuilding your own.The chapter ends with a look at Cisco CDP and RIPanalysis.
■ Chapter 9,“Understanding and Using Triggers and Alarms,” starts to showyou some of the additional, but usually unexplored, functionalities of SnifferPro.This chapter covers in detail how to use triggers and alarms.
■ Chapter 10,“Reporting,” provides additional details on how to report thedata you have analyzed. Sniffer Pro has great functionality in helping youbuild network analysis reports for the purpose of explaining what is hap-pening on the network to managers or clients.
■ Chapter 11,“Troubleshooting Network Traffic and Applications withSecurity in Mind,” takes a look at the darker side of analysis using SnifferPro.You might have heard that Sniffer Pro can be used to hack a network.Here is where you can see it happen and learn how to protect your networkfrom such threats.This chapter looks at the analysis of viruses and worms,Telnet, SNMP, e-mail, and any other clear-text password protocol and itsdangers. Here we examine a DNS zone transfer capture as well as eaves-dropping and replaying.
■ Chapter 12,“Troubleshooting Traffic for Network Optimization,” ties up theconcepts covered in the book by looking at how to use all the features ofSniffer Pro to find a problem on your network and optimize your networkwith those findings. Every network has some form of problem, and in thischapter, all of what you have learned throughout the book is tied togetherwith detailed looks at optimizing a network problem from start to finishusing Sniffer Pro.
All in all, this book was a great experience to both write and produce for the ITcommunity at large.As with any topic that attempts to cover the wide breadth ofnetwork analysis, this book, unfortunately, does not contain every answer to everyquestion. However, we hope that this book will empower you to use the Sniffer ProNetwork Analysis application to find and research your questions for further analysis.
www.syngress.com
219_sniffer_fore.qxd 6/28/02 5:01 PM Page xxix
xxx Foreword
The authors who helped produce this work are all highly experienced and havewritten their chapters using their own on-the-job experiences, where network anal-ysis is learned via trial by fire.As you’ll see, network analysis and troubleshooting arelearned skills that take time to develop.
Network analysis and troubleshooting are also a great deal like warfare.When youstep into combat, you want to arm yourself with the very best weapons.Would youtry to analyze your network using a slingshot? I didn’t think so. Sniffer Pro is a betterchoice. So when your next network battle arises, arm yourself with your skills, SnifferPro, and this book. I guarantee victory.
—Robert J. ShimonskiCCDP, CCNP, SCP, NNCSS, MCSE, MCP+I,Master CNE, CIP, CIBS, CWP, CIW, GSEC, GCIH,A+, Inet+, Server+, Network+, eBiz+,TICSA
www.syngress.com
219_sniffer_fore.qxd 6/28/02 5:01 PM Page xxx
Introduction toSniffer Pro
Solutions in this chapter:
■ Understanding Network Analysis
■ The OSI Model, Protocols, and Devices
■ Sniffer Pro Fundamentals
■ Sniffer Pro: The Exam
Chapter 1
1
! Summary
! Solutions Fast Track
! Frequently Asked Questions
219_sniffer_01.qxd 6/28/02 12:43 PM Page 1
2 Chapter 1 • Introduction to Sniffer Pro
IntroductionImagine it is 4:00 P.M. and you are sitting at your desk with three books spreadacross your lap.You are hard at work trying to figure out why performance onyour company’s file server has dropped sharply over the past eight hours. Of the200 users in your company, nearly 100 of them have called to complain aboutslow connection times and hung sessions.You are highly stressed because one ofthe callers today was the CEO.The company’s main file server (a NetWare 5server) performed without issue for the past year.This box never gave you aproblem.You examine the system monitor, CPU utilization, and cache buffersand determine that all three are within their normal limits.You even run brand-new virus updates and signatures on the box, just to be sure.You have nowresorted to cracking open all the reference books you shelved a year ago. Blowingthe dust off them, you dig in, ready for a long night trying to figure out thesource of this dilemma.
What if figuring out this problem were as easy as popping open a laptop andrunning an application to look at the connection between your server and theswitch port? What if you saw from your analysis that the network interface cardhas a problem because it is old and is now chattering or malfunctioning, which inturn is inhibiting connections? You might even be surprised to know thatsomeone on your internal network “could” be sending your server a Ping ofDeath or some other type of Denial of Service (DoS) attack. How in the worldcould you even figure that out? Quite easily, it turns out—with the NetworkAssociates Sniffer Pro product, that’s how.
Understanding Network Analysis Electronic distribution of information is becoming increasingly important, andthe complexity of the data exchanged between systems is increasing at a rapidpace. Computer networks today carry all kinds of data, voice, and video traffic.Network applications require full availability without interruption or congestion.
As the information systems in a company grow and develop, more networkingdevices are deployed, resulting in large physical ranges covered by the networkedsystem. It is crucial that this networked system operate as effectively as possible,because downtime is both costly and an inefficient use of available resources.
Network analysis is a range of techniques that network engineers and designersemploy to study the properties of networks, including connectivity, capacity, andperformance. Network analysis can be used to estimate the capacity of an existing
www.syngress.com
219_sniffer_01.qxd 6/28/02 12:43 PM Page 2
www.syngress.com
network, look at performance characteristics, or plan for future applications andupgrades.
One of the best tools for performing network analysis is a network analyzersuch as Sniffer Pro.A network analyzer is a device that gives you a very good ideaof what is happening on a network by allowing you to look at the actual datathat travels over it, packet by packet.A typical network analyzer understandsmany protocols, which enables it to display conversations taking place betweenhosts on a network.
Network analyzers typically provide the following capabilities:
■ Capture and decode data on a network
■ Analyze network activity involving specific protocols
■ Generate and display statistics about the network activity
■ Perform pattern analysis of the network activity
Network Analysis FundamentalsHow many times has a customer come to you and said that the network is slow?Or has a programmer claimed that there is a network problem? Even if it is not anetwork problem, how do you prove it’s not? This is where the art of networkanalysis comes in.
A network analyzer is a troubleshooting tool that is used to find and solvenetwork communication problems, plan network capacity, and perform networkoptimization. Network analyzers can capture all the traffic that is going across yournetwork and interpret the captured traffic to decode and interpret the differentprotocols in use.The decoded data is shown in a format that makes it easy tounderstand.A network analyzer can also capture only traffic that matches onlythe selection criteria as defined by a filter.This allows a technician to capture onlytraffic that is relevant to the problem at hand.A typical network analyzer displaysthe decoded data in three panes:
■ Summary Displays a one-line summary of the highest-layer protocolcontained in the frame, as well as the time of the capture and the sourceand destination addresses.
■ Detail Provides details on all the layers inside the frame.
■ Hex Displays the raw captured data in hexadecimal format.
Introduction to Sniffer Pro • Chapter 1 3
219_sniffer_01.qxd 6/28/02 12:43 PM Page 3
4 Chapter 1 • Introduction to Sniffer Pro
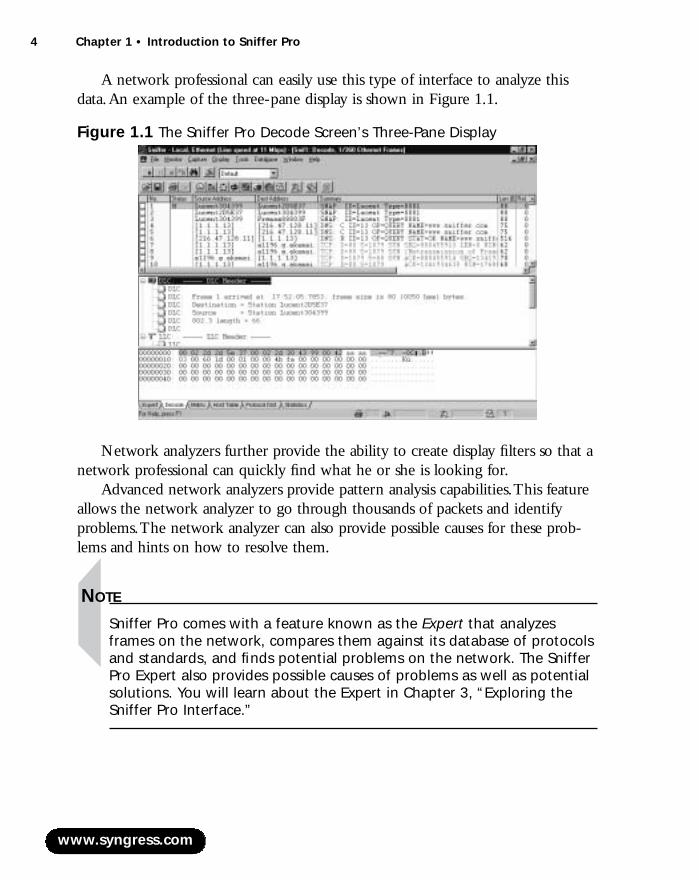
A network professional can easily use this type of interface to analyze thisdata.An example of the three-pane display is shown in Figure 1.1.
Network analyzers further provide the ability to create display filters so that anetwork professional can quickly find what he or she is looking for.
Advanced network analyzers provide pattern analysis capabilities.This featureallows the network analyzer to go through thousands of packets and identifyproblems.The network analyzer can also provide possible causes for these prob-lems and hints on how to resolve them.
NOTE
Sniffer Pro comes with a feature known as the Expert that analyzesframes on the network, compares them against its database of protocolsand standards, and finds potential problems on the network. The SnifferPro Expert also provides possible causes of problems as well as potentialsolutions. You will learn about the Expert in Chapter 3, “Exploring theSniffer Pro Interface.”
www.syngress.com
Figure 1.1 The Sniffer Pro Decode Screen’s Three-Pane Display
219_sniffer_01.qxd 6/28/02 12:43 PM Page 4

Introduction to Sniffer Pro • Chapter 1 5
Troubleshooting MethodologyThe key to successful troubleshooting is knowing how the network functions undernormal conditions.This knowledge allows a network professional to quickly recog-nize abnormal operations. Using a strategy for network troubleshooting, theproblem can be approached methodically and resolved with minimum disruption tocustomers. Unfortunately, sometimes even network professionals with years of expe-rience have not mastered the basic concept of troubleshooting; a few minutes spentevaluating the symptoms can save hours of time lost chasing the wrong problem.
A good approach to problem resolution involves these steps:
1. Recognizing symptoms and defining the problem
2. Isolating and understanding the problem
3. Identifying and testing the cause of the problem
4. Solving the problem
5. Verifying that the problem has been resolved
NOTE
A very important part of troubleshooting is performing research. TheInternet can be a valuable source of information on a variety of networktopics and can provide access to tutorials, discussion forums, and refer-ence materials. As a part of your troubleshooting methodology, you canuse the Internet as a tool to perform searches on errors or symptomsthat you see on your network.
The first step toward trying to solve a network issue is to recognize thesymptoms.You might hear about a problem in one of many ways: an end usermight complain that he or she is experiencing performance or connectivityissues, or a network management station might notify you about it. Compare theproblem to normal operation. Determine whether something was changed onthe network just before the problem started. In addition, check to make sure youare not troubleshooting something that has never worked before.Write down aclear definition of the problem.
Once the problem has been confirmed and the symptoms identified, the nextstep is to isolate and understand the problem.When the symptoms occur, it isyour responsibility to gather data for analysis and to narrow down the location of
www.syngress.com
219_sniffer_01.qxd 6/28/02 12:43 PM Page 5

6 Chapter 1 • Introduction to Sniffer Pro
the problem.The best approach to reducing the problem’s scope is to use divide-and-conquer methods.Try to figure out if the problem is related to a segment ofthe network or a single station. Determine if the problem can be duplicated else-where on the network.
The third step in problem resolution is to identify and test the cause of theproblem and test your hypothesis.You can use network analyzers and other toolsto analyze the traffic.After you develop a theory about the cause of the problem,you must test it.
Once a resolution to the problem has been determined, it should be put inplace.The solution might involve upgrading hardware or software. It may call forincreasing LAN segmentation or upgrading hardware to increase capacity.The final step is to ensure that the entire problem has been resolved by havingthe end customer test for the problem. Sometimes a fix for one problem creates anew problem.At other times, the problem you repaired turns out to be asymptom of a deeper underlying problem. If the problem is indeed resolved, youshould document the steps you took to resolve it. If, however, the problem stillexists, the problem-solving process must be repeated from the beginning.Theproblem resolution flowchart is shown in Figure 1.2.
www.syngress.com
Figure 1.2 Problem Resolution Flowchart
Recognize Symptomsand Define the Problem
Isolate and Understandthe Problem
Identify and Test theCause of the Problem
Solve the Problem
Verify ProblemResolution
Do problemsymptoms
stop?
Document Steps
Problem Solved
No
Yes
219_sniffer_01.qxd 6/28/02 12:43 PM Page 6

Introduction to Sniffer Pro • Chapter 1 7
The OSI Model, Protocols, and Devices To understand network analysis, it is very important to learn the theory behindhow networks operate. For a network to work, the computers running on it needto agree on a set of rules. Such a set of rules is known as a protocol.A protocol innetworking terms is very similar to a language in human terms.Two computersusing different protocols to talk to each other would be like someone trying tocommunicate in Japanese to another person who did not understand that lan-guage. It simply would not work!
Many protocols exist in today’s world of network communication. In the earlydays of networking, each networking vendor wrote their own protocols. Eventually,standards were developed so that devices from multiple vendors could communi-cate with each other using a common protocol. Examples of these protocolsinclude Transmission Control Protocol/Internet Protocol (TCP/IP), InternetworkPacket Exchange/Sequence Packet Exchange (IPX/SPX), and AppleTalk.
NOTE
To be a successful network troubleshooter, you need a strong under-standing of network protocols. Understanding different protocols andtheir characteristics will help you recognize abnormal behavior when itoccurs in your network.
Network protocols can be classified as connection-oriented or connection-less. Connection-oriented protocols establish a channel between the source and desti-nation machines before any data is transmitted.The protocol ensures that packetsarrive at the receiving station in the same sequence in which they were trans-mitted. If a packet is lost in transit, it is retransmitted by the source.The destina-tion host acknowledges data sent from the source to the destination. Because ofall these features, connection-oriented protocols are also known as reliable proto-cols. Connectionless protocols provide no assurance that data sent from the sourcewill reach the destination.They provide “best-effort” delivery.There is no guar-antee that a packet will reach its destination or that it will be in order.Thesedetails are handled by upper-layer protocols. Connection-less protocols areknown as unreliable protocols. However, they require less overhead and are gener-ally faster than connection-oriented protocols.
www.syngress.com
219_sniffer_01.qxd 6/28/02 12:43 PM Page 7
8 Chapter 1 • Introduction to Sniffer Pro
NOTE
This book will show you, in detail, how to capture, view, decode, filter,and dissect many different protocol suites with the Sniffer Pro networkanalyzer.
The OSI Model and the DOD ModelIn the early 1980s, the International Standards Organization (ISO) created theOpen Systems Interconnection (OSI) model, which describes how network pro-tocols and components work together.The OSI reference model divides networkprotocol functions into seven layers. Each layer represents a group of related spec-ifications, functions, and activities.
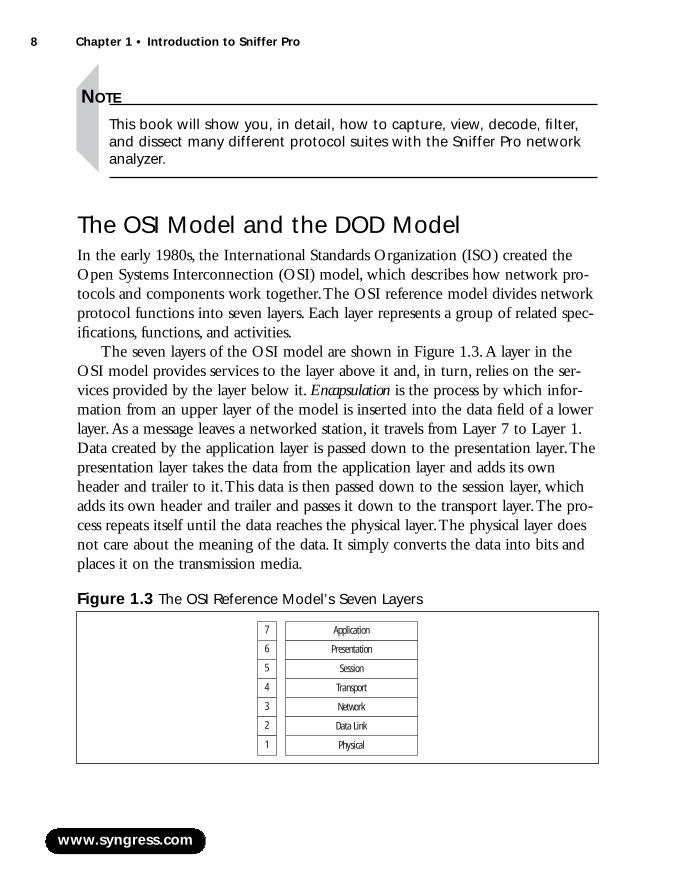
The seven layers of the OSI model are shown in Figure 1.3.A layer in theOSI model provides services to the layer above it and, in turn, relies on the ser-vices provided by the layer below it. Encapsulation is the process by which infor-mation from an upper layer of the model is inserted into the data field of a lowerlayer.As a message leaves a networked station, it travels from Layer 7 to Layer 1.Data created by the application layer is passed down to the presentation layer.Thepresentation layer takes the data from the application layer and adds its ownheader and trailer to it.This data is then passed down to the session layer, whichadds its own header and trailer and passes it down to the transport layer.The pro-cess repeats itself until the data reaches the physical layer.The physical layer doesnot care about the meaning of the data. It simply converts the data into bits andplaces it on the transmission media.
www.syngress.com
Figure 1.3 The OSI Reference Model’s Seven Layers
7
6
5
4
3
2
1
Network
Physical
Data Link
Transport
Session
Presentation
Application
219_sniffer_01.qxd 6/28/02 12:43 PM Page 8
Introduction to Sniffer Pro • Chapter 1 9
NOTE
The data that comes from an upper layer to a lower layer, including theupper layer headers and trailers, is known as the payload for the lowerlayer.
When the data arrives at its destination, the receiving station’s physical layerpicks it up and performs the reverse process (also known as decapsulation).Thephysical layer converts the bits back into frames to pass on to the data link layer.The data link layer removes its header and trailer and passes the data on to thenetwork layer. Once again, this process repeats itself until the data reaches all theway to the application layer.
The layers of the OSI model are:
■ Application layer This topmost layer of the OSI model is responsiblefor managing communications between network applications.This layeris not the application itself, although some applications may performapplication layer functions. Examples of application layer protocolsinclude File Transfer Protocol (FTP), Hypertext Transfer Protocol(HTTP), Simple Mail Transfer Protocol (SMTP), and Telnet.
■ Presentation layer This layer is responsible for data presentation,encryption, and compression.
■ Session layer The session layer is responsible for creating and managingsessions between end systems.The session layer protocol is often unusedin many protocols. Examples of protocols at the session layer includeNetBIOS and Remote Procedure Call (RPC).
■ Transport layer This layer is responsible for communication betweenprograms or processes. Port or socket numbers are used to identify these unique processes. Examples of transport layer protocols includeTransmission Control Protocol (TCP), User Datagram Protocol (UDP),and Sequence Packet Exchange (SPX).
■ Network layer This layer is responsible for addressing and deliveringpackets from the source node to the destination node.The network layertakes data from the transport layer and wraps it inside a packet or data-gram. Logical network addresses are generally assigned to nodes at thislayer. Examples of network layer protocols include IP and IPX.
www.syngress.com
219_sniffer_01.qxd 6/28/02 12:43 PM Page 9
10 Chapter 1 • Introduction to Sniffer Pro
■ Data link layer This layer is responsible for delivering frames betweennetwork interface cards (NICs) on the same physical segment.Communication at the data link layer is generally based on hardwareaddresses.The data link layer wraps data from the network layer inside aframe. Examples of data link layer protocols include Ethernet,TokenRing, and Point-to-Point Protocol (PPP). Devices that operate at thislayer include bridges and switches.
■ Physical layer This layer defines connectors, wiring, and the specifica-tions on how voltage and bits pass over the wired (or wireless) media.Devices at this layer include repeaters, concentrators, and hubs. Devicesthat operate at the physical layer do not have an understanding of paths.
The OSI model is very generic and can be used to explain virtually any net-work protocol.Various protocol suites are often mapped against the OSI modelfor this purpose.A solid understanding of the OSI model aids tremendously innetwork analysis, comparison, and troubleshooting. However, it is also importantto remember that not all protocols map nicely to the OSI model. For example,TCP/IP was designed to map to the U.S. Department of Defense (DoD) model.
In the 1970s, the DoD developed its four-layer model.The core Internet pro-tocols adhere to this model.The DoD model is merely a condensed version ofthe OSI model. Its four layers are:
■ Process layer This layer defines protocols that implement user-levelapplications such as mail delivery, remote login, and file transfer.
■ Host-to-host layer This layer handles the connection, data flow man-agement, and retransmission of lost data.
■ Internet layer This layer is responsible for delivering data from sourcehost to destination host across a set of different physical networks thatconnect the two machines.
■ Network access layer This layer handles the delivery of data over aparticular hardware media.
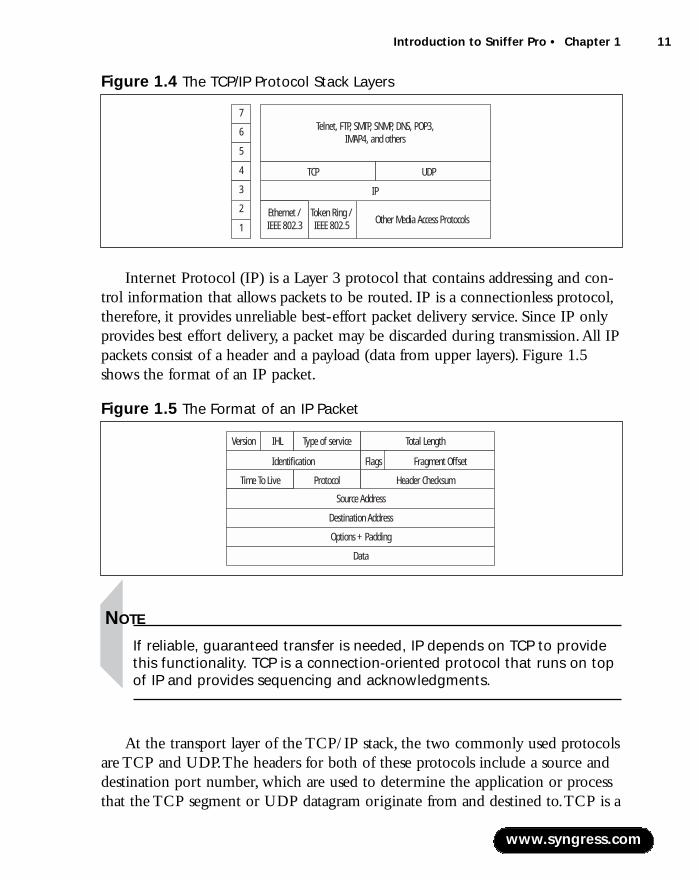
TCP/IP TCP/IP, developed by the Defense Advanced Research Projects Agency (DARPA),is the most widely used routed protocol today. Figure 1.4 shows how the layers ofthe TCP/IP stack map against the seven layers of the OSI reference model.
www.syngress.com
219_sniffer_01.qxd 6/28/02 12:43 PM Page 10
Introduction to Sniffer Pro • Chapter 1 11
Internet Protocol (IP) is a Layer 3 protocol that contains addressing and con-trol information that allows packets to be routed. IP is a connectionless protocol,therefore, it provides unreliable best-effort packet delivery service. Since IP onlyprovides best effort delivery, a packet may be discarded during transmission.All IPpackets consist of a header and a payload (data from upper layers). Figure 1.5shows the format of an IP packet.
NOTE
If reliable, guaranteed transfer is needed, IP depends on TCP to providethis functionality. TCP is a connection-oriented protocol that runs on topof IP and provides sequencing and acknowledgments.
At the transport layer of the TCP/IP stack, the two commonly used protocolsare TCP and UDP.The headers for both of these protocols include a source anddestination port number, which are used to determine the application or processthat the TCP segment or UDP datagram originate from and destined to.TCP is a
www.syngress.com
Figure 1.4 The TCP/IP Protocol Stack Layers
Ethernet /IEEE 802.3
Telnet, FTP, SMTP, SNMP, DNS, POP3,IMAP4, and others
7
6
5
4
3
2
1
IP
Token Ring /IEEE 802.5 Other Media Access Protocols
UDPTCP
Figure 1.5 The Format of an IP Packet
Time To Live
Source Address
Destination Address
Options + Padding
Data
Protocol Header Checksum
Identification
Version IHL Type of service Total Length
Flags Fragment Offset
219_sniffer_01.qxd 6/28/02 12:43 PM Page 11

12 Chapter 1 • Introduction to Sniffer Pro
connection-oriented protocol, and UDP is a connectionless protocol.The TCPheader includes sequence and acknowledgment numbers for reliable delivery.TCP can also use the sliding window principle.The sliding window algorithmallows a buffer to be placed between the application program and the networkdata flow. Data received from the network is placed into this buffer until theapplication is ready to read it.The window is the amount of data that can befetched into the buffer before an acknowledgment must be sent.
Examples of applications that use TCP include FTP,Telnet, Network FileSystem (NFS), SMTP, HTTP, Domain Name System (DNS), and Network NewsTransfer Protocol (NNTP). Examples of applications that use UDP include DNS,Routing Information Protocol (RIP), NFS, Simple Network ManagementProtocol (SNMP), and Dynamic Host Configuration Protocol/Boot Protocol(DHCP/BOOTP).As you can see, some applications (such as DNS and NFS)can use both protocols.
IP AddressingTCP/IP uses IP addresses to send messages to their proper destinations. EveryTCP/IP host in the network requires a unique IP address on each of its NICs. IPaddresses are assigned by the network administrator, either manually or through adynamic addressing protocol such as Reverse Address Resolution Protocol(RARP), BOOTP, or DHCP.The current IP addressing scheme (IPv4) defines anIP address as a 32-bit binary number—for example:
11000111 00011010 10101100 01010011
To make it more convenient for us, the IP address is divided into four 8-bitoctets (bytes):
11000111.00011010.10101100.01010011
These octets are then converted from binary to decimal numbers and written asfollows (four decimal digits separated by periods):
199.26.172.83
When this number is entered into a computer, the machine automatically con-verts it to a 32-bit binary number, with no regard for the individual octets or thedecimals.
An IP address has two portions, a network ID and a host ID.The network IDis shared amongst all the stations on a segment and must be unique across the
www.syngress.com
219_sniffer_01.qxd 6/28/02 12:43 PM Page 12
Introduction to Sniffer Pro • Chapter 1 13
entire network.The host ID identifies a specific device (host) within a segmentand must be unique on a particular segment.
NOTE
The IP system in common use today is known as IPv4, for Internet Protocolversion 4. A newer system, IPv6, or Internet Protocol version 6, has beendeveloped and exists today in small deployments. IPv6 allows for moreaddresses by increasing the address size from 32 bits to 128 bits.
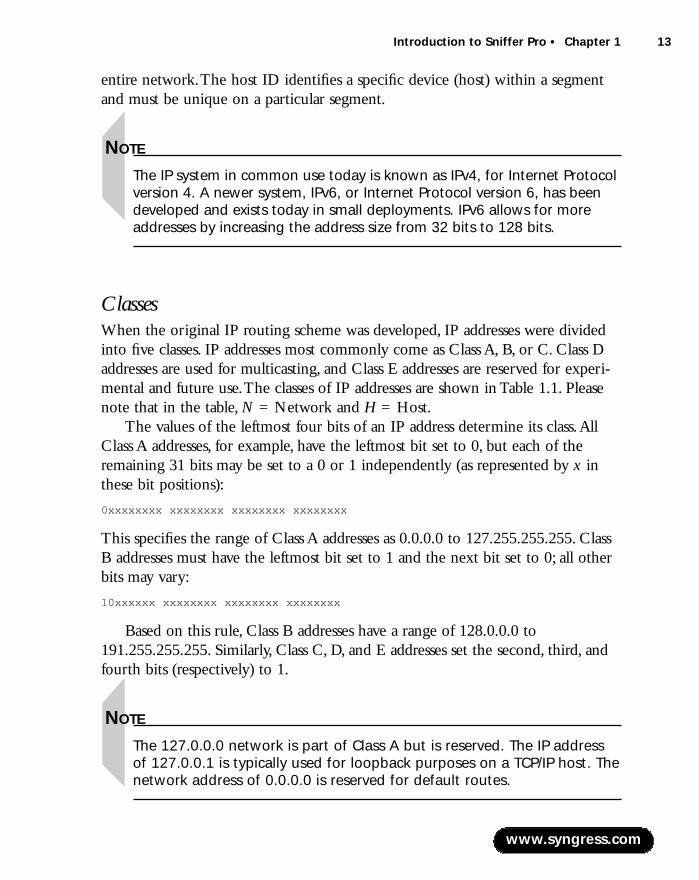
ClassesWhen the original IP routing scheme was developed, IP addresses were dividedinto five classes. IP addresses most commonly come as Class A, B, or C. Class Daddresses are used for multicasting, and Class E addresses are reserved for experi-mental and future use.The classes of IP addresses are shown in Table 1.1. Pleasenote that in the table, N = Network and H = Host.
The values of the leftmost four bits of an IP address determine its class.AllClass A addresses, for example, have the leftmost bit set to 0, but each of theremaining 31 bits may be set to a 0 or 1 independently (as represented by x inthese bit positions):
0xxxxxxxx xxxxxxxx xxxxxxxx xxxxxxxx
This specifies the range of Class A addresses as 0.0.0.0 to 127.255.255.255. ClassB addresses must have the leftmost bit set to 1 and the next bit set to 0; all otherbits may vary:
10xxxxxx xxxxxxxx xxxxxxxx xxxxxxxx
Based on this rule, Class B addresses have a range of 128.0.0.0 to191.255.255.255. Similarly, Class C, D, and E addresses set the second, third, andfourth bits (respectively) to 1.
NOTE
The 127.0.0.0 network is part of Class A but is reserved. The IP addressof 127.0.0.1 is typically used for loopback purposes on a TCP/IP host. Thenetwork address of 0.0.0.0 is reserved for default routes.
www.syngress.com
219_sniffer_01.qxd 6/28/02 12:43 PM Page 13

14 Chapter 1 • Introduction to Sniffer Pro
Classes A, B, and C define a default subnet mask for the addresses in theirranges.A subnet mask separates the network portion of an IP address from thehost portion. In a Class A address, the first octet represents the network ID, andthe last three octets represent the host ID. In a Class B address, the first two octetsrepresent the network ID, and the last two octets represent the host ID. In ClassC addresses, the first three octets are used for the network ID, and the last octet isthe host ID.
Table 1.1 IP Address Classes
Range Network/Host Default Class Leftmost Bits (first octet) Portions Subnet Mask
A 0xxxxxxx 0–127 N.H.H.H 255.0.0.0B 10xxxxxx 128–191 N.N.H.H 255.255.0.0C 110xxxxx 192–223 N.N.N.H 255.255.255.0D 1110xxxx 224–239 Not applicable Not applicableE 1111xxxx 240–255 Not applicable Not applicable
NOTE
Classless interdomain routing (CIDR) was introduced on the Internet toimprove the scalability of the Internet routing system and to allow formore efficient allocation of addresses. CIDR uses variable-length subnetmasks (VLSMs) and eliminates the concept of classful networks. This isalso known as classless routing.
Binary to Hex to Decimal TranslationWe generally use the base10 (also known as decimal) numbering system, whichuses 10 values (0, 1, 2, 3, 4, 5, 6, 7, 8, 9) to represent numbers.
Computers use the base2 (also known as binary) numbering system to repre-sent data.The binary numbering system uses two values, 0 and 1, to representnumbers.This is because a computer only recognizes two states: the presence orabsence of an electrical charge. Even if a computer is showing you decimal num-bers, it is merely a translation of the binary numbers inside the machine.A singlebinary digit (0 or 1) is called a bit.The term octet is used to describe a unit of
www.syngress.com
219_sniffer_01.qxd 6/28/02 12:43 PM Page 14

Introduction to Sniffer Pro • Chapter 1 15
8 bits. Most modern computers also have 8 bits in a byte. In the early days ofcomputers, the word byte was also used to describe other quantities of bits.Theterm nibble is equal to half a byte and is therefore 4 bits, in most cases.
Hexadecimal is base16 and therefore uses 16 values (0, 1, 2, 3, 4, 5, 6, 7, 8, 9,A, B, C, D, E, F) to represent numbers.The hexadecimal system is useful becausea byte (8 bits) of binary data can be represented using just two hexadecimaldigits.This makes it easier for humans to read or write large numbers in hexadec-imal rather than binary format.
We will first learn how to convert a decimal number into binary.A popularmethod for converting a decimal number into binary is to divide the number by 2repeatedly. Let’s take the decimal number 35 as an example. Figure 1.6 shows howthis decimal number can be converted into binary format. Here are the steps:
1. Divide the original number by 2.The remainder becomes the least significant bit in the binary number.
2. Divide the result of the division from Step 1 by 2.The remainderbecomes the next most significant bit of the binary number.
3. Repeat the division process until the result is 0.The remainders formthe binary number.
Let’s now look at binary-to-decimal conversion. Here we simply multiply thebinary digits by increasing powers of 2, starting from the right. Let’s walk throughthe steps involved in converting the binary number 101 into decimal format:
1. The rightmost digit is a 1, so you multiply it by 2 to the 0th power (or 1): 1 × 1 = 1.
2. Multiply the next digit to the left (0) by 2 to the first power (or 2):0 × 2 = 0.
www.syngress.com
Figure 1.6 Conversion of the Decimal Number 35 into Binary Format
35 divided by 2 = 17 Remainder 1
17 divided by 2 = 8 Remainder 1
8 divided by 2 = 4 Remainder 0
4 divided by 2 = 2 Remainder 0
2 divided by 2 = 1 Remainder 0
1 divided by 2 = 0 Remainder 1 0 0 0 1 1
219_sniffer_01.qxd 6/28/02 12:43 PM Page 15

16 Chapter 1 • Introduction to Sniffer Pro
3. Multiply the next digit to the left (1) by 2 to the second power (or 4):1 × 4 = 4.
4. Now, to find the decimal number, you find the sum of these products:1 + 0 + 4 = 5.Therefore, 101 in binary equals 5 in base 10.
Hexadecimal-to-binary conversion is easily accomplished by converting eachhexadecimal digit to decimal first and then converting each of these decimalvalues into binary.As an example, take the hexadecimal number 05DC:
1. Convert each digit to decimal, one by one.This results in the decimalvalues 0, 5, 13, and 12.
2. Convert each of these decimal numbers into 4 bits of binary.This givesus the binary values 0000, 0101, 1101, and 1100.
3. Put these binary values next to each other.We get 0000010111011100.
To convert binary to hexadecimal, reverse this method. Group the binarynumber into 4-bit nibbles, and convert each group into decimal. Finally, replaceeach decimal number with its hex equivalent.As an example, take the binaryvalue 1101101101010110:
1. When we divide the value into 4-bit nibbles, we get 1101, 1011, 0101,and 0110 (the first line in Figure 1.7).
2. Convert each nibble into its decimal equivalent.This results in 13, 11, 5,and 6 (the second line in Figure 1.7).
3. Replace each decimal number with its hex equivalent.This results in thefinal value of DB56 (the third line in Figure 1.7).
www.syngress.com
Figure 1.7 Converting the Binary Number 1101101101010110 intoHex Format
1 1 0 1 1 0 1 1 0 1 0 11 0 1 1 0
13 11 5 6
D B 5 6
219_sniffer_01.qxd 6/28/02 12:43 PM Page 16
Introduction to Sniffer Pro • Chapter 1 17
NOTE
You will find that knowing how to perform base conversion is essentialto a network analyst’s job. Computer data, including networking proto-cols, is often represented in binary or hexadecimal format.
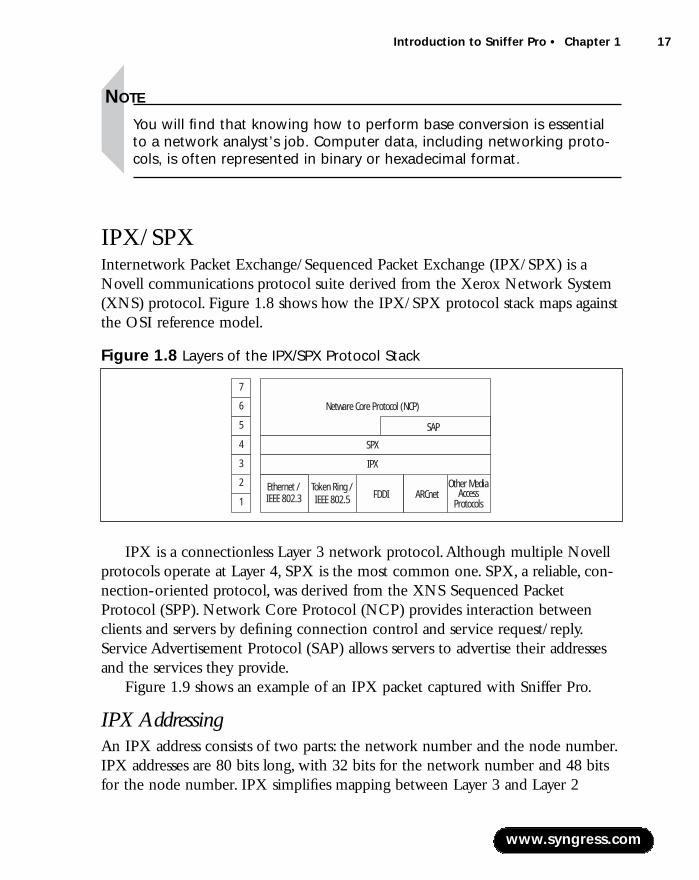
IPX/SPX Internetwork Packet Exchange/Sequenced Packet Exchange (IPX/SPX) is aNovell communications protocol suite derived from the Xerox Network System(XNS) protocol. Figure 1.8 shows how the IPX/SPX protocol stack maps againstthe OSI reference model.
IPX is a connectionless Layer 3 network protocol.Although multiple Novellprotocols operate at Layer 4, SPX is the most common one. SPX, a reliable, con-nection-oriented protocol, was derived from the XNS Sequenced PacketProtocol (SPP). Network Core Protocol (NCP) provides interaction betweenclients and servers by defining connection control and service request/reply.Service Advertisement Protocol (SAP) allows servers to advertise their addressesand the services they provide.
Figure 1.9 shows an example of an IPX packet captured with Sniffer Pro.
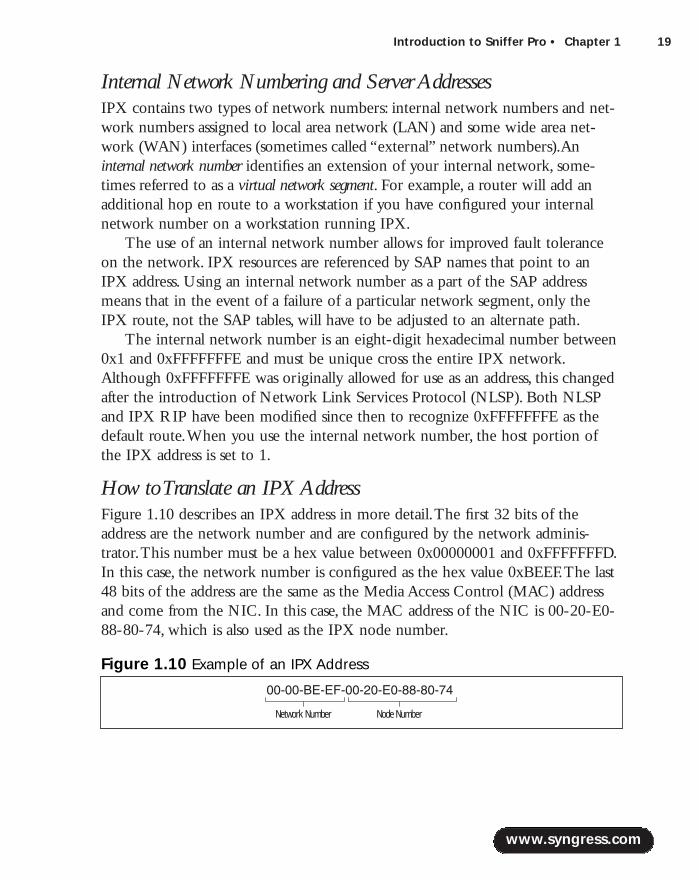
IPX AddressingAn IPX address consists of two parts: the network number and the node number.IPX addresses are 80 bits long, with 32 bits for the network number and 48 bitsfor the node number. IPX simplifies mapping between Layer 3 and Layer 2
www.syngress.com
Figure 1.8 Layers of the IPX/SPX Protocol Stack
Ethernet /IEEE 802.3
Netware Core Protocol (NCP)
7
6
5
4
3
2
1
SAP
SPX
IPX
Token Ring /IEEE 802.5 FDDI ARCnet
Other MediaAccess
Protocols
219_sniffer_01.qxd 6/28/02 12:43 PM Page 17

18 Chapter 1 • Introduction to Sniffer Pro
addresses, using the Layer 2 address as the host portion of the Layer 3 address.This eliminates the need for an address resolution protocol such as AddressResolution Protocol (ARP) for IP. IPX addresses are generally written as hex-adecimal digits in the network.node format.
Unlike IP, IPX has no concept of subnetworking.The IPX network numberis manually assigned and must be unique for each network segment. Each nodenumber on a given IPX network segment must be unique.
NOTE
IPX supports multiple Ethernet frame types: Ethernet II, IEEE 802.3, IEEE802.3 SNAP, and Novell 802.3 RAW. (Frame types are discussed in detaillater in the chapter.) It is possible to use multiple encapsulation types ona single network segment as long as a unique network number isassigned to each encapsulation type. It is important to note that hoststhat use different encapsulation types will not be able to directly com-municate with each other.
Node numbers do not have to be unique across networks because the net-work number and node number are used together to identify a particular host.
www.syngress.com
Figure 1.9 IPX Packet Captured on Sniffer Pro
219_sniffer_01.qxd 6/28/02 12:43 PM Page 18
Introduction to Sniffer Pro • Chapter 1 19
Internal Network Numbering and Server AddressesIPX contains two types of network numbers: internal network numbers and net-work numbers assigned to local area network (LAN) and some wide area net-work (WAN) interfaces (sometimes called “external” network numbers).Aninternal network number identifies an extension of your internal network, some-times referred to as a virtual network segment. For example, a router will add anadditional hop en route to a workstation if you have configured your internalnetwork number on a workstation running IPX.
The use of an internal network number allows for improved fault toleranceon the network. IPX resources are referenced by SAP names that point to anIPX address. Using an internal network number as a part of the SAP addressmeans that in the event of a failure of a particular network segment, only theIPX route, not the SAP tables, will have to be adjusted to an alternate path.
The internal network number is an eight-digit hexadecimal number between0x1 and 0xFFFFFFFE and must be unique cross the entire IPX network.Although 0xFFFFFFFE was originally allowed for use as an address, this changedafter the introduction of Network Link Services Protocol (NLSP). Both NLSPand IPX RIP have been modified since then to recognize 0xFFFFFFFE as thedefault route.When you use the internal network number, the host portion ofthe IPX address is set to 1.
How to Translate an IPX AddressFigure 1.10 describes an IPX address in more detail.The first 32 bits of theaddress are the network number and are configured by the network adminis-trator.This number must be a hex value between 0x00000001 and 0xFFFFFFFD.In this case, the network number is configured as the hex value 0xBEEF.The last48 bits of the address are the same as the Media Access Control (MAC) addressand come from the NIC. In this case, the MAC address of the NIC is 00-20-E0-88-80-74, which is also used as the IPX node number.
www.syngress.com
Figure 1.10 Example of an IPX Address
Network Number Node Number
219_sniffer_01.qxd 6/28/02 12:43 PM Page 19
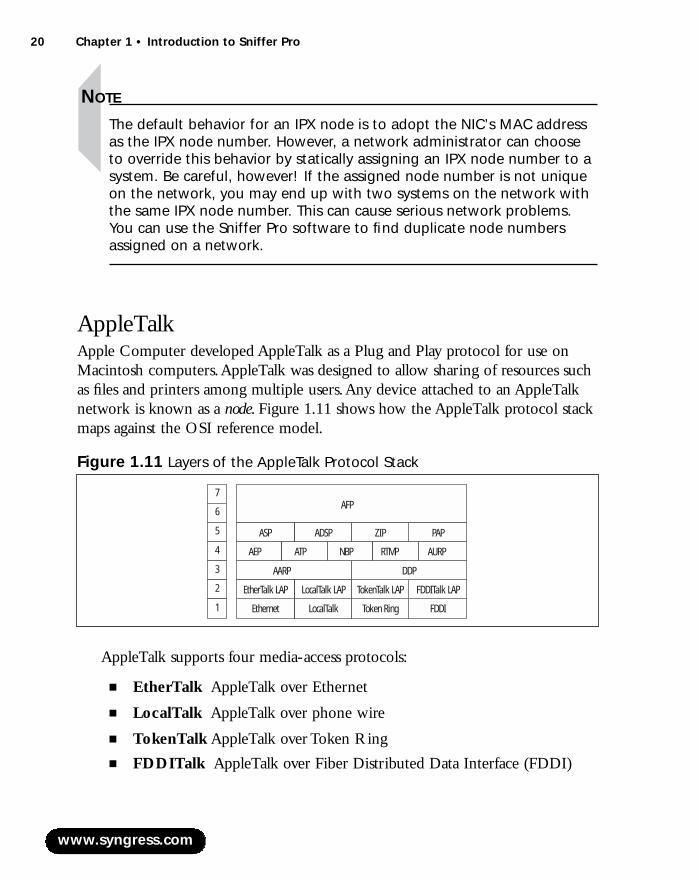
20 Chapter 1 • Introduction to Sniffer Pro
NOTE
The default behavior for an IPX node is to adopt the NIC’s MAC addressas the IPX node number. However, a network administrator can chooseto override this behavior by statically assigning an IPX node number to asystem. Be careful, however! If the assigned node number is not uniqueon the network, you may end up with two systems on the network withthe same IPX node number. This can cause serious network problems.You can use the Sniffer Pro software to find duplicate node numbersassigned on a network.
AppleTalkApple Computer developed AppleTalk as a Plug and Play protocol for use onMacintosh computers.AppleTalk was designed to allow sharing of resources suchas files and printers among multiple users.Any device attached to an AppleTalknetwork is known as a node. Figure 1.11 shows how the AppleTalk protocol stackmaps against the OSI reference model.
AppleTalk supports four media-access protocols:
■ EtherTalk AppleTalk over Ethernet
■ LocalTalk AppleTalk over phone wire
■ TokenTalk AppleTalk over Token Ring
■ FDDITalk AppleTalk over Fiber Distributed Data Interface (FDDI)
www.syngress.com
Figure 1.11 Layers of the AppleTalk Protocol Stack
7
6
5
4
3
2
1
AARP
FDDIToken RingLocalTalkEthernet
FDDITalk LAPTokenTalk LAPLocalTalk LAPEtherTalk LAP
DDP
AEP ATP NBP RTMP AURP
PAPZIPADSPASP
AFP
219_sniffer_01.qxd 6/28/02 12:43 PM Page 20

Introduction to Sniffer Pro • Chapter 1 21
At the data link layer, each of these physical media technologies has its owncorresponding Link Access Protocol (LAP): EtherTalk LAP (ELAP), LocalTalkLAP (LLAP),TokenTalk LAP (TLAP), and FDDITalk LAP (FLAP).
At the network layer of AppleTalk are two protocols:AppleTalk AddressResolution Protocol (AARP), and Datagram Delivery Protocol (DDP).AARPcan be compared to ARP in TCP/IP, and DDP can be compared to IP inTCP/IP. DDP is responsible for transmitting and receiving packets and providessocket-to-socket connectivity between nodes.
Five key protocols exist at AppleTalk’s transport layer:
■ AppleTalk Echo Protocol (AEP) This protocol is responsible fortesting the reachability of network nodes.
■ AppleTalk Transaction Protocol (ATP) This protocol is responsiblefor ensuring that communications between a source and destinationsocket occur without any loss.
■ Name Binding Protocol (NBP) This protocol is responsible for map-ping user-friendly entity names to numeric network addresses.
■ Routing Table Maintenance Protocol (RTMP) This distance-vectorrouting protocol for AppleTalk is based on IP RIP.
■ AppleTalk Update-Based Routing Protocol (AURP) This protocolis an extension to RTMP that allows two noncontiguous AppleTalk net-works to talk to each other by tunneling their traffic through IP usingUDP encapsulation.
The session layer of AppleTalk consists of four protocols:
■ AppleTalk Session Protocol (ASP) This protocol is responsible forestablishing and maintaining logical connections between clients andservers.ASP runs on top of ATP.
■ AppleTalk Data Stream Protocol (ADSP) This protocol is respon-sible for reliable transmission of data after a session has been establishedbetween two nodes.ADSP runs directly on top of DDP.
■ Zone Information Protocol (ZIP) This protocol maintains network-to-zone-number mappings.
■ Printer Access Protocol (PAP) This protocol is used to establishconnections between clients and servers (usually print servers). PAP runson top of ATP.
www.syngress.com
219_sniffer_01.qxd 6/28/02 12:43 PM Page 21
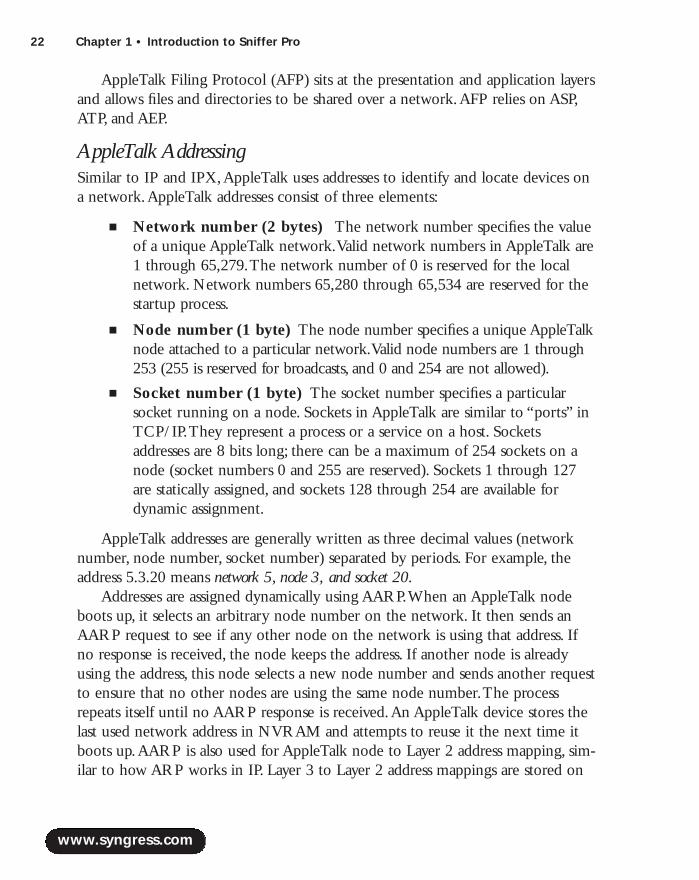
22 Chapter 1 • Introduction to Sniffer Pro
AppleTalk Filing Protocol (AFP) sits at the presentation and application layersand allows files and directories to be shared over a network.AFP relies on ASP,ATP, and AEP.
AppleTalk AddressingSimilar to IP and IPX,AppleTalk uses addresses to identify and locate devices ona network.AppleTalk addresses consist of three elements:
■ Network number (2 bytes) The network number specifies the valueof a unique AppleTalk network.Valid network numbers in AppleTalk are1 through 65,279.The network number of 0 is reserved for the localnetwork. Network numbers 65,280 through 65,534 are reserved for thestartup process.
■ Node number (1 byte) The node number specifies a unique AppleTalknode attached to a particular network.Valid node numbers are 1 through253 (255 is reserved for broadcasts, and 0 and 254 are not allowed).
■ Socket number (1 byte) The socket number specifies a particularsocket running on a node. Sockets in AppleTalk are similar to “ports” inTCP/IP.They represent a process or a service on a host. Socketsaddresses are 8 bits long; there can be a maximum of 254 sockets on anode (socket numbers 0 and 255 are reserved). Sockets 1 through 127are statically assigned, and sockets 128 through 254 are available fordynamic assignment.
AppleTalk addresses are generally written as three decimal values (networknumber, node number, socket number) separated by periods. For example, theaddress 5.3.20 means network 5, node 3, and socket 20.
Addresses are assigned dynamically using AARP.When an AppleTalk nodeboots up, it selects an arbitrary node number on the network. It then sends anAARP request to see if any other node on the network is using that address. Ifno response is received, the node keeps the address. If another node is alreadyusing the address, this node selects a new node number and sends another requestto ensure that no other nodes are using the same node number.The processrepeats itself until no AARP response is received.An AppleTalk device stores thelast used network address in NVRAM and attempts to reuse it the next time itboots up.AARP is also used for AppleTalk node to Layer 2 address mapping, sim-ilar to how ARP works in IP. Layer 3 to Layer 2 address mappings are stored on
www.syngress.com
219_sniffer_01.qxd 6/28/02 12:43 PM Page 22
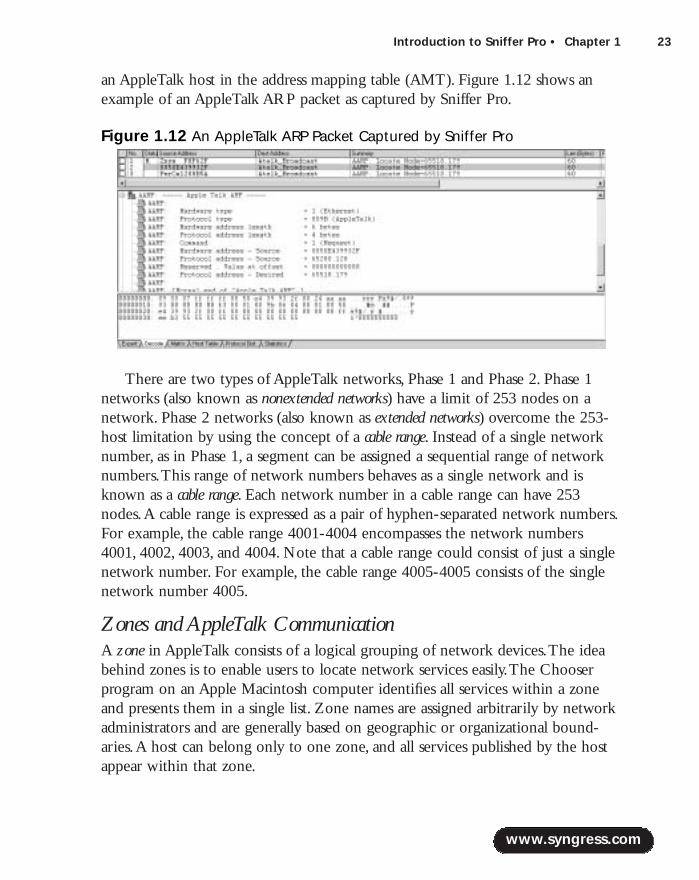
Introduction to Sniffer Pro • Chapter 1 23
an AppleTalk host in the address mapping table (AMT). Figure 1.12 shows anexample of an AppleTalk ARP packet as captured by Sniffer Pro.
There are two types of AppleTalk networks, Phase 1 and Phase 2. Phase 1networks (also known as nonextended networks) have a limit of 253 nodes on anetwork. Phase 2 networks (also known as extended networks) overcome the 253-host limitation by using the concept of a cable range. Instead of a single networknumber, as in Phase 1, a segment can be assigned a sequential range of networknumbers.This range of network numbers behaves as a single network and isknown as a cable range. Each network number in a cable range can have 253nodes.A cable range is expressed as a pair of hyphen-separated network numbers.For example, the cable range 4001-4004 encompasses the network numbers4001, 4002, 4003, and 4004. Note that a cable range could consist of just a singlenetwork number. For example, the cable range 4005-4005 consists of the singlenetwork number 4005.
Zones and AppleTalk CommunicationA zone in AppleTalk consists of a logical grouping of network devices.The ideabehind zones is to enable users to locate network services easily.The Chooserprogram on an Apple Macintosh computer identifies all services within a zoneand presents them in a single list. Zone names are assigned arbitrarily by networkadministrators and are generally based on geographic or organizational bound-aries.A host can belong only to one zone, and all services published by the hostappear within that zone.
www.syngress.com
Figure 1.12 An AppleTalk ARP Packet Captured by Sniffer Pro
219_sniffer_01.qxd 6/28/02 12:43 PM Page 23

24 Chapter 1 • Introduction to Sniffer Pro
A single zone can span one ore more networks, and multiple zones can existon a single network. Zone Information Protocol (ZIP) operates at the sessionlayer and is responsible for mapping networks to zone names throughout the net-work.When a host boots up on the network, ZIP provides it a list of zone names.
Ethernet Ethernet is the most widely deployed LAN technology in use today. Ethernetmaps to the first and second layers of the OSI model.Work on Ethernet origi-nally began in 1972 when Robert Metcalfe and David Boggs were working atthe Xerox Palo Alto Research Center (PARC). In 1979, it was decided that astandard should be developed for Ethernet; in 1980, Digital, Intel, and Xeroxreleased one. In 1982, Digital, Intel, and Xerox (known collectively as DIX)released a new version of Ethernet, called Ethernet II.
Each Ethernet adapter is globally assigned a unique hardware address.Thisaddress is known by many names: a MAC address, a burned-in address (BIA), aphysical address, or simply the Ethernet address.This address is a 48-bit binarynumber generally written as 12 hexadecimal digits (six groups of two digits, thegroups separated by dashes or colons).The address is set at the time of the NIC’smanufacture.
NOTE
Some NICs allow a network administrator to override the burned-in MACaddress and use an administrator-assigned MAC address.
The least significant bit of the most significant byte of the destination MACaddress is known as the individual/group address (I/G) bit. If the bit is set to 0, itindicates that the frame is destined for a single station. If the I/G bit is set to 1, itindicates that the frame is destined for a group of stations.
The second least significant bit of the most signifcant byte MAC address isknown as the universal or locally administered address (U/L) bit. If this bit is set to 0,the address is administered universally.This means that the address was assigned bythe Institute of Electrical and Electronics Engineers (IEEE) and is unique acrossthe globe. If the bit is set to 1, it indicates that the address was selected locally bya network administrator (overriding the NIC’s BIA).
Three types of MAC addresses are used for data communications on a network:
www.syngress.com
219_sniffer_01.qxd 6/28/02 12:43 PM Page 24
Introduction to Sniffer Pro • Chapter 1 25
■ Unicast A unicast address represents a unique network adapter on anetwork.
■ Multicast A multicast address represents a group of network adapterson a network.A single frame sent to a multicast address is received by allthe NICs in that particular multicast group and is ignored by the hoststhat do not belong to that multicast group.
■ Broadcast The destination address of all 1s (ff:ff:ff:ff:ff:ff in hexadec-imal) is reserved for broadcasts. Broadcast frames are received by all NICson an Ethernet segment.
CSMA/CDEthernet is based on the Carrier Sense Multiple Access/Collision Detect(CSMA/CD) protocol. CSMA/CD defines the access method used by Ethernet.The term multiple access refers to the fact that many stations attached to the samecable have the opportunity to transmit. Each station is given an equal opportu-nity; no station has priority over any other. Carrier sense describes how anEthernet station listens to the channel before transmitting.The station ensuresthat there are no other signals on the channel before it transmits.An Ethernet sta-tion also listens while transmitting to ensure that no other station transmits dataat the same time.When two stations transmit at the same time, a collision occurs.Since Ethernet stations listen to the media while they are transmitting, they areable to identify the presence of others through their collision detection circuitry. If acollision occurs, the transmitting station will wait a random amount of timebefore retransmitting.This function is known as random backoff.
Traditionally, Ethernet operation has been half duplex.This means that a sta-tion may either transmit or receive data, but it cannot do both at the same time.If more than one station on a segment tries to transmit at the same time, a colli-sion occurs, as per CSMA/CD.When a crossover cable is used to connect twostations or a single device is attached to a switch port, only two stations on thedata link need to transmit or receive.The collision detection circuitry is thereforeno longer necessary, so machines can be placed in full-duplex mode of operation.This mode allows machines to transmit and receive at the same time, therebyincreasing performance.
www.syngress.com
219_sniffer_01.qxd 6/28/02 12:43 PM Page 25

26 Chapter 1 • Introduction to Sniffer Pro
Ethernet Frame TypesThe original Ethernet II frame format created by DIX is shown in Figure 1.13.This frame consists of six fields:
1. Preamble The preamble consists of 8 bytes of alternating 0s and 1s andends in 11.This synchronization sequence is used to signal the beginningof a frame to all the stations on the Ethernet segment.
www.syngress.com
Configuring Ethernet DuplexAutonegotiation is an optional function of the IEEE 802.3u standardthat allows directly connected Ethernet devices to automaticallyexchange information about their speed and duplex abilities. Theautonegotiation process determines the best speed and duplex at whichto operate. In the past, many network engineers recommended againstusing autonegotiation because it often did not work. However, autone-gotiation has developed into a mature technology and is now consid-ered a good practice.
One of the most common causes of performance issues on10/100Mbps Ethernet links is duplex mismatch. This happens when twostations are running at the same speed, but one side of the link is oper-ating at half duplex while the other is running at full duplex. This setupcan cause cyclic redundancy check (CRC) errors, alignment errors, andrunts, all of which result in a significant degradation of network perfor-mance. A common misconception about autonegotiation is that manu-ally configuring one link partner for 100Mbps full duplex and usingautonegotiation on the other side will result in 100Mbps full-duplexoperation on both hosts.
By default, most NICs and switches are configured to autonegotiateboth speed and duplex parameters. It is recommended that you keepthem configured this way.
Configuring & Implementing…
Figure 1.13 The Ethernet II Frame
Preamble DestinationAddress
SourceAddress
EtherType Data FCS
219_sniffer_01.qxd 6/28/02 12:43 PM Page 26
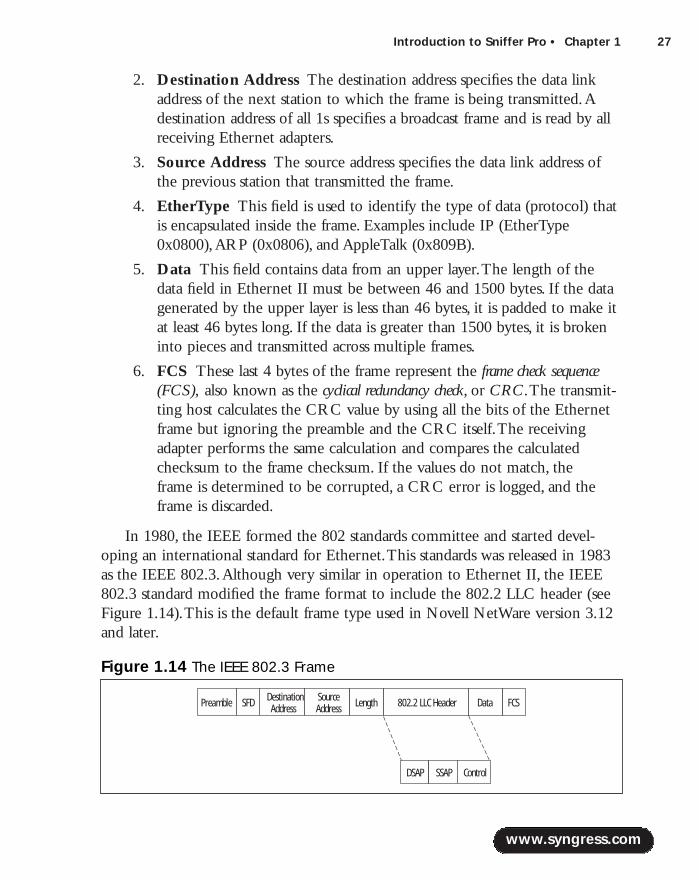
Introduction to Sniffer Pro • Chapter 1 27
2. Destination Address The destination address specifies the data linkaddress of the next station to which the frame is being transmitted.Adestination address of all 1s specifies a broadcast frame and is read by allreceiving Ethernet adapters.
3. Source Address The source address specifies the data link address ofthe previous station that transmitted the frame.
4. EtherType This field is used to identify the type of data (protocol) thatis encapsulated inside the frame. Examples include IP (EtherType0x0800),ARP (0x0806), and AppleTalk (0x809B).
5. Data This field contains data from an upper layer.The length of thedata field in Ethernet II must be between 46 and 1500 bytes. If the datagenerated by the upper layer is less than 46 bytes, it is padded to make itat least 46 bytes long. If the data is greater than 1500 bytes, it is brokeninto pieces and transmitted across multiple frames.
6. FCS These last 4 bytes of the frame represent the frame check sequence(FCS), also known as the cyclical redundancy check, or CRC.The transmit-ting host calculates the CRC value by using all the bits of the Ethernetframe but ignoring the preamble and the CRC itself.The receivingadapter performs the same calculation and compares the calculatedchecksum to the frame checksum. If the values do not match, the frame is determined to be corrupted, a CRC error is logged, and theframe is discarded.
In 1980, the IEEE formed the 802 standards committee and started devel-oping an international standard for Ethernet.This standards was released in 1983as the IEEE 802.3.Although very similar in operation to Ethernet II, the IEEE802.3 standard modified the frame format to include the 802.2 LLC header (seeFigure 1.14).This is the default frame type used in Novell NetWare version 3.12and later.
www.syngress.com
Figure 1.14 The IEEE 802.3 Frame
Preamble SFD DestinationAddress
SourceAddress Length FCS802.2 LLC Header Data
DSAP SSAP Control
219_sniffer_01.qxd 6/28/02 12:43 PM Page 27
28 Chapter 1 • Introduction to Sniffer Pro
The IEEE 802.3 frame format consists of the following fields:
■ Preamble The IEEE decided to break the preamble into two pieces.The first 7 bytes are alternating 0s and 1s.The last byte is called the start-of-frame delimiter (SFD).
■ Start-of-Frame Delimiter (SFD) This byte has a bit pattern of10101011.
■ Destination Address Same as the Ethernet II destination address.
■ Source Address Same as the Ethernet II source address.
■ Length Specifies the length of the frame in bytes.This field replacedthe EtherType field in the Ethernet II frame.This brings about an inter-esting question: How can we distinguish between an Ethernet II frameand an IEEE 802.3 frame, if one places length in this part of the frameand the other uses EtherType? To ensure that the two were compatible,all EtherTypes have a value greater than 05DC hex or 1500 decimal.Since the maximum data size in Ethernet is 1500 bytes, there is nooverlap between EtherTypes and lengths. If the field following the sourceaddress is greater than 1500 bytes, it is identified as an Ethernet II frame.Otherwise, it is an IEEE frame type.
■ 802.2 Logical Local Control (LLC) Header The purpose of theLLC header is to identify the sending and receiving protocols.Thisheader consists of three fields:
■ Destination Service Access Point (DSAP) The DSAP is a 1-byte value that is used to specify the receiving process at the destination station.
■ Source Service Access Point (SSAP) The SSAP is a 1-bytevalue that is used to specify the sending process at the source station.
■ Control The control is a 1-byte field used for various control infor-mation and specifies the type of LLC frame.
■ Data This field contains data from an upper layer.The length of thedata in an 802.3 Ethernet frame must be between 43 and 1497 bytes.
■ FCS Same as the Ethernet II FCS.
In 1983, Novell NetWare was released and it used a proprietary Ethernet frameformat based on a preliminary release of the IEEE 802.3 spec (see Figure 1.15).
www.syngress.com
219_sniffer_01.qxd 6/28/02 12:43 PM Page 28
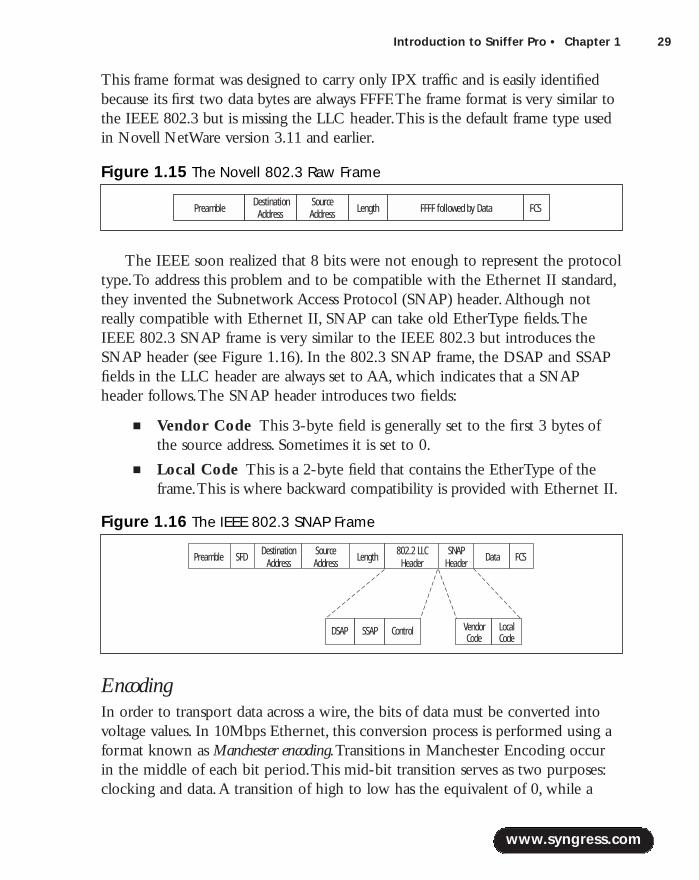
Introduction to Sniffer Pro • Chapter 1 29
This frame format was designed to carry only IPX traffic and is easily identifiedbecause its first two data bytes are always FFFF.The frame format is very similar tothe IEEE 802.3 but is missing the LLC header.This is the default frame type usedin Novell NetWare version 3.11 and earlier.
The IEEE soon realized that 8 bits were not enough to represent the protocoltype.To address this problem and to be compatible with the Ethernet II standard,they invented the Subnetwork Access Protocol (SNAP) header.Although notreally compatible with Ethernet II, SNAP can take old EtherType fields.TheIEEE 802.3 SNAP frame is very similar to the IEEE 802.3 but introduces theSNAP header (see Figure 1.16). In the 802.3 SNAP frame, the DSAP and SSAPfields in the LLC header are always set to AA, which indicates that a SNAPheader follows.The SNAP header introduces two fields:
■ Vendor Code This 3-byte field is generally set to the first 3 bytes ofthe source address. Sometimes it is set to 0.
■ Local Code This is a 2-byte field that contains the EtherType of theframe.This is where backward compatibility is provided with Ethernet II.
EncodingIn order to transport data across a wire, the bits of data must be converted intovoltage values. In 10Mbps Ethernet, this conversion process is performed using aformat known as Manchester encoding.Transitions in Manchester Encoding occurin the middle of each bit period.This mid-bit transition serves as two purposes:clocking and data.A transition of high to low has the equivalent of 0, while a
www.syngress.com
Figure 1.15 The Novell 802.3 Raw Frame
PreambleDestination
AddressSourceAddress Length FFFF followed by Data FCS
Figure 1.16 The IEEE 802.3 SNAP Frame
Preamble SFD DestinationAddress
SourceAddress Length FCS802.2 LLC
Header Data
DSAP SSAP Control
SNAPHeader
VendorCode
LocalCode
219_sniffer_01.qxd 6/28/02 12:43 PM Page 29
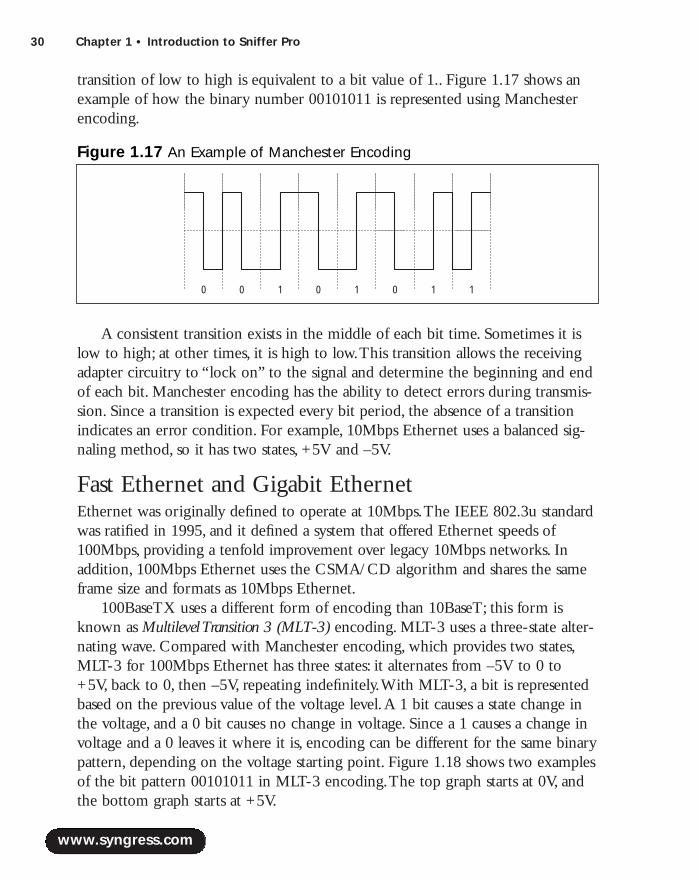
30 Chapter 1 • Introduction to Sniffer Pro
transition of low to high is equivalent to a bit value of 1.. Figure 1.17 shows anexample of how the binary number 00101011 is represented using Manchesterencoding.
A consistent transition exists in the middle of each bit time. Sometimes it islow to high; at other times, it is high to low.This transition allows the receivingadapter circuitry to “lock on” to the signal and determine the beginning and endof each bit. Manchester encoding has the ability to detect errors during transmis-sion. Since a transition is expected every bit period, the absence of a transitionindicates an error condition. For example, 10Mbps Ethernet uses a balanced sig-naling method, so it has two states, +5V and –5V.
Fast Ethernet and Gigabit EthernetEthernet was originally defined to operate at 10Mbps.The IEEE 802.3u standardwas ratified in 1995, and it defined a system that offered Ethernet speeds of100Mbps, providing a tenfold improvement over legacy 10Mbps networks. Inaddition, 100Mbps Ethernet uses the CSMA/CD algorithm and shares the sameframe size and formats as 10Mbps Ethernet.
100BaseTX uses a different form of encoding than 10BaseT; this form isknown as Multilevel Transition 3 (MLT-3) encoding. MLT-3 uses a three-state alter-nating wave. Compared with Manchester encoding, which provides two states,MLT-3 for 100Mbps Ethernet has three states: it alternates from –5V to 0 to+5V, back to 0, then –5V, repeating indefinitely.With MLT-3, a bit is representedbased on the previous value of the voltage level.A 1 bit causes a state change inthe voltage, and a 0 bit causes no change in voltage. Since a 1 causes a change involtage and a 0 leaves it where it is, encoding can be different for the same binarypattern, depending on the voltage starting point. Figure 1.18 shows two examplesof the bit pattern 00101011 in MLT-3 encoding.The top graph starts at 0V, andthe bottom graph starts at +5V.
www.syngress.com
Figure 1.17 An Example of Manchester Encoding
0 0 1 0 1 0 1 1
219_sniffer_01.qxd 6/28/02 12:43 PM Page 30

Introduction to Sniffer Pro • Chapter 1 31
In 1998, the IEEE 802.3z standard defined Gigabit Ethernet, which specifiesoperation at 1000Mbps. Gigabit Ethernet provides 10 times the performance of100Mbps Ethernet and can run in either half- or full-duplex mode.
NOTE
The IEEE 802.3ae Task Force is working actively on a standard for 10Gigabit Ethernet over fiber. This standard is expected to be approved inthe first half of 2002. The standard preserves the 802.3/Ethernet frameformat, the IEEE 802.3 MAC protocol, and the minimum and maximumIEEE 802.3 frame size. However, unlike the previous versions of Ethernet,10 Gigabit Ethernet eliminates the use of the CSMA/CD protocol by pro-viding only full-duplex operation.
Token RingToken Ring is a LAN protocol first developed by IBM in the 1970s and thenstandardized as IEEE 802.5 in 1985.Token Ring supports two bandwidth options:4Mbps and 16Mbps. Unlike Ethernet,Token Ring was designed to deal with theproblem of collisions that occur when two stations transmit at the same time.Thissolution is accomplished by creating a closed ring and using an electronic “token,”
www.syngress.com
Figure 1.18 MLT-3 Encoding Examples
0 0 1 0 1 0 1 1
0 0 1 0 1 0 1 1
219_sniffer_01.qxd 6/28/02 12:43 PM Page 31

32 Chapter 1 • Introduction to Sniffer Pro
which is passed around from host to host in the ring. Only the host that holds thetoken is allowed to transmit.When a station captures the token, it changes the freetoken into a busy token frame so that data can be sent.
A relatively new protocol, known as Fast Token Ring, can transmit at datarates up to 100Mbps. Fast Token Ring uses multimode fiber for transmission.Sniffer Pro does not provide support for Fast Token Ring.
Frame DetailA free token frame consists of three 1-byte fields:
■ Starting Delimiter (SD) Signals the beginning of the token frame.
■ Access Control (AC) Contains the priority field, reservation field, atoken bit, and a monitor bit.
■ Ending Delimiter (ED) Signals the end of the token frame.
A data/command (busy token) frame format is shown in Figure 1.19.
A busy token has the following fields in its frame:
■ Starting Delimiter (SD) A 1-byte field that signals the beginning ofthe token frame.
■ Access Control (AC) A 1-byte field that contains the priority field,reservation field, a token bit, and a monitor bit.
■ Frame Control (FC) A 1-byte field that contains two frame type bits(used to indicate whether this is a MAC or LLC frame), two reservedbits (reserved for future use), and four control bits (used to indicatewhether the frame is to be processed by the normal buffer or a high-priority buffer).
■ Destination Address (DA) A 6-byte field that indicates the address ofthe network adapter for which the frame is intended.
■ Source Address (SA) A 6-byte field that indicates the address of thenetwork adapter that originated the frame.
■ Data This field contains data from upper layers.
www.syngress.com
Figure 1.19 Token Ring Frame Format
SD DataAC FC DA SA EDFCS FS
219_sniffer_01.qxd 6/28/02 12:43 PM Page 32

Introduction to Sniffer Pro • Chapter 1 33
■ Frame Check Sequence (FCS) This 4-byte field contains a CRC-32error check performed on the FC, DA, SA, and the data.This field is notat the frame’s end because both ED and frame status (FS) contents maybe changed by any station while passing the ring. If FCS was the lastfield, the checksum would have to be calculated by every ring stationagain, resulting in lower performance.
■ Ending Delimiter (ED) A 1-byte field that signals the end of thetoken frame.The ending delimiter also contains bits that can indicate adamaged frame and identify the frame that is last in a logical sequence.
■ Frame Status (FS) A 1-byte field that indicates to the transmittingstation whether this frame has been copied by the destination station.This consists of the address recognized indicator (ARI) bit, the framecopied indicator (FCI) bit, and two bits set to 0. Since this field is notused to calculate the CRC, these four bits are repeated.
Token Ring has two different types of frames: LLC frames, which are used foruser data, and MAC frames, which are used for adapter-to-adapter communica-tions. MAC frames do not cross bridges, routers, switches, and gateways. Examplesof MAC frames include Active Monitor Present, Ring Purge, Standby MonitorPresent, Claim Token, and Beacon. LLC frames carry user data and include theLLC header with the upper-layer protocol data.As discussed with Ethernet, theLLC header includes the DSAP, SSAP, and Control fields.
Token PassingWhen a station needs to transmit a frame, it first has to wait for a token. Once itreceives the token, it starts data transmission in a busy frame.As the data movesaround the ring, it passes through each station on its way to the destination station.Each station copies the frame to its local buffer and then acts as a repeater andregenerates the frame onto the ring, to be picked up by the next station.When thedata arrives at its final destination, it is copied into the Token Ring card’s buffer.The destination station sets the frame copied indicator and address recognized indi-cator bits to 1 and puts the frame back on the ring.The frame continues to bepassed around the ring until it returns to its source.The source is responsible forremoving the frame and introducing a new free token onto the network.You canconfigure an optional setting, called early token release, which allows a token to bereleased by the transmitting station as soon as it has sent its data frame, rather thanhaving to wait for the frame to return from the destination. Early token releaseallows for multiple frames on the ring, thereby improving performance.
www.syngress.com
219_sniffer_01.qxd 6/28/02 12:43 PM Page 33

34 Chapter 1 • Introduction to Sniffer Pro
Active MonitorToken Ring is designed with built-in management to constantly monitor andcontrol the ring.This task is performed by a designated station on the ringknown as the active monitor.The active monitor is selected based on an electionprocess known as claim token process. Once elected, the active monitor is respon-sible for resolving certain error conditions that might occur on the ring, such aslost tokens and frames, or clocking errors. One function of the active monitor isto remove any continuously floating frames from the ring. If a device that hasalready put a token on the network fails, the frame might continue circulatingthrough the ring forever.The active monitor detects such a frame, removes itfrom the ring, and generates a new token.The standby monitor is responsible fordetecting an active monitor failure and starting the monitor contention process.
Ring purges are generally performed by an active monitor after a recoveryoperation, such as monitor contention, has occurred and immediately before thegeneration of a new token.The active monitor can cause a ring purge operationby sending out a ring purge frame, with the purpose of resetting the ring to aknown state.Any station receiving the ring purge frame stops what it is doingimmediately, resets its timers, and enters bit-repeat mode.When the active mon-itor receives its own ring purge frame back, it knows that every station on thering is now in bit-repeat mode and is waiting for a token.
Beaconing is used to isolate a fault domain so that recovery actions can takeplace.The beacon process consists of transmitting beacon MAC frames every 20ms without needing a token.The beaconing station uses the clock based on itsown internal crystal oscillator and not the clock recovered from its receiver port.When a station receives a beacon MAC frame, it either enters the beacon repeatmode or the beacon transmit mode.A station in the insertion process will termi-nate its open command with an error and will remove itself from the ring.
Figure 1.20 shows an example of a Token Ring frame, the Active MonitorPresent frame.The active monitor places an Active Monitor Present frame on thenetwork every 7 seconds.Analyzing this frame, we can determine that the activemonitor on this network is the station with MAC address 00-00-83-20-44-8c.
Other ProtocolsHundreds of protocols are used for network communications.They include WANprotocols (for example, frame relay,T-1, HDLC, PPP, ISDN), wireless protocols(802.11a, 802.11b, HomeRF), and others (DECnet, NetBEUI, SNA).
www.syngress.com
219_sniffer_01.qxd 6/28/02 12:43 PM Page 34
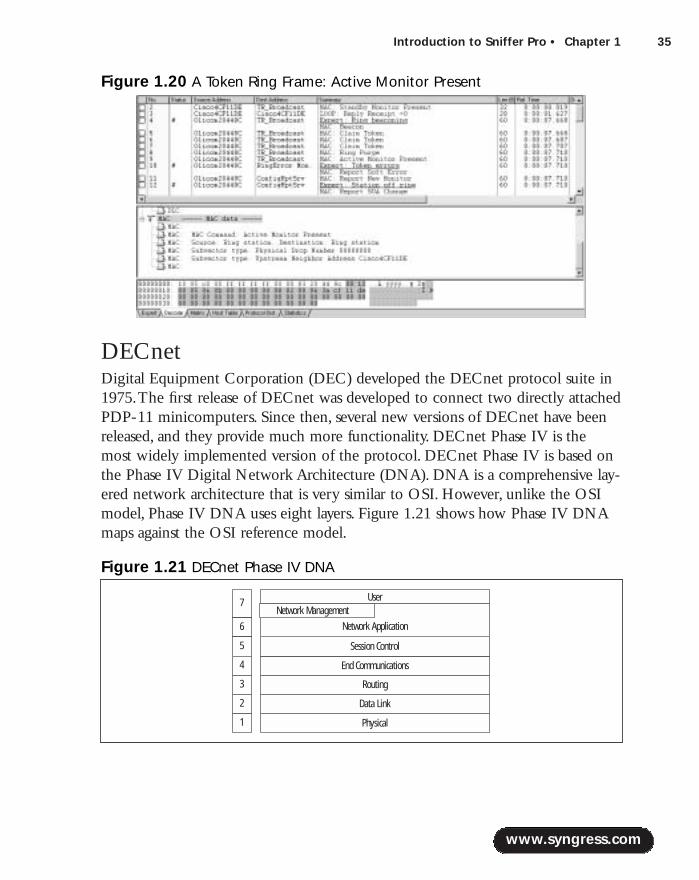
Introduction to Sniffer Pro • Chapter 1 35
DECnetDigital Equipment Corporation (DEC) developed the DECnet protocol suite in1975.The first release of DECnet was developed to connect two directly attachedPDP-11 minicomputers. Since then, several new versions of DECnet have beenreleased, and they provide much more functionality. DECnet Phase IV is themost widely implemented version of the protocol. DECnet Phase IV is based onthe Phase IV Digital Network Architecture (DNA). DNA is a comprehensive lay-ered network architecture that is very similar to OSI. However, unlike the OSImodel, Phase IV DNA uses eight layers. Figure 1.21 shows how Phase IV DNAmaps against the OSI reference model.
www.syngress.com
Figure 1.20 A Token Ring Frame: Active Monitor Present
Figure 1.21 DECnet Phase IV DNA
7
6
5
4
3
2
1
Routing
Physical
Data Link
End Communications
Session Control
Network Application
Network ManagementUser
219_sniffer_01.qxd 6/28/02 12:43 PM Page 35
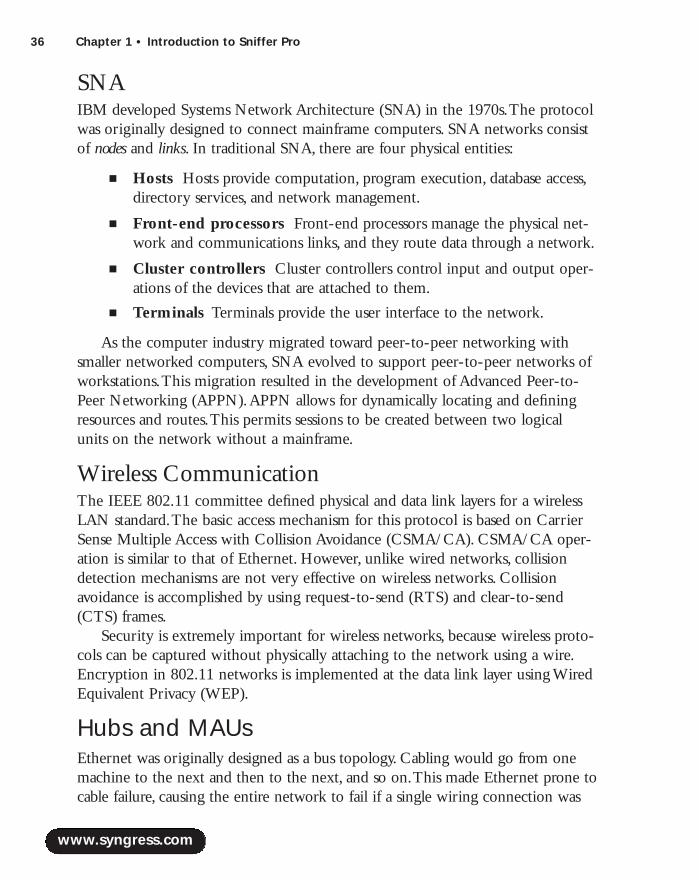
36 Chapter 1 • Introduction to Sniffer Pro
SNAIBM developed Systems Network Architecture (SNA) in the 1970s.The protocolwas originally designed to connect mainframe computers. SNA networks consistof nodes and links. In traditional SNA, there are four physical entities:
■ Hosts Hosts provide computation, program execution, database access,directory services, and network management.
■ Front-end processors Front-end processors manage the physical net-work and communications links, and they route data through a network.
■ Cluster controllers Cluster controllers control input and output oper-ations of the devices that are attached to them.
■ Terminals Terminals provide the user interface to the network.
As the computer industry migrated toward peer-to-peer networking withsmaller networked computers, SNA evolved to support peer-to-peer networks ofworkstations.This migration resulted in the development of Advanced Peer-to-Peer Networking (APPN).APPN allows for dynamically locating and definingresources and routes.This permits sessions to be created between two logicalunits on the network without a mainframe.
Wireless CommunicationThe IEEE 802.11 committee defined physical and data link layers for a wirelessLAN standard.The basic access mechanism for this protocol is based on CarrierSense Multiple Access with Collision Avoidance (CSMA/CA). CSMA/CA oper-ation is similar to that of Ethernet. However, unlike wired networks, collisiondetection mechanisms are not very effective on wireless networks. Collisionavoidance is accomplished by using request-to-send (RTS) and clear-to-send(CTS) frames.
Security is extremely important for wireless networks, because wireless proto-cols can be captured without physically attaching to the network using a wire.Encryption in 802.11 networks is implemented at the data link layer using WiredEquivalent Privacy (WEP).
Hubs and MAUsEthernet was originally designed as a bus topology. Cabling would go from onemachine to the next and then to the next, and so on.This made Ethernet prone tocable failure, causing the entire network to fail if a single wiring connection was
www.syngress.com
219_sniffer_01.qxd 6/28/02 12:43 PM Page 36
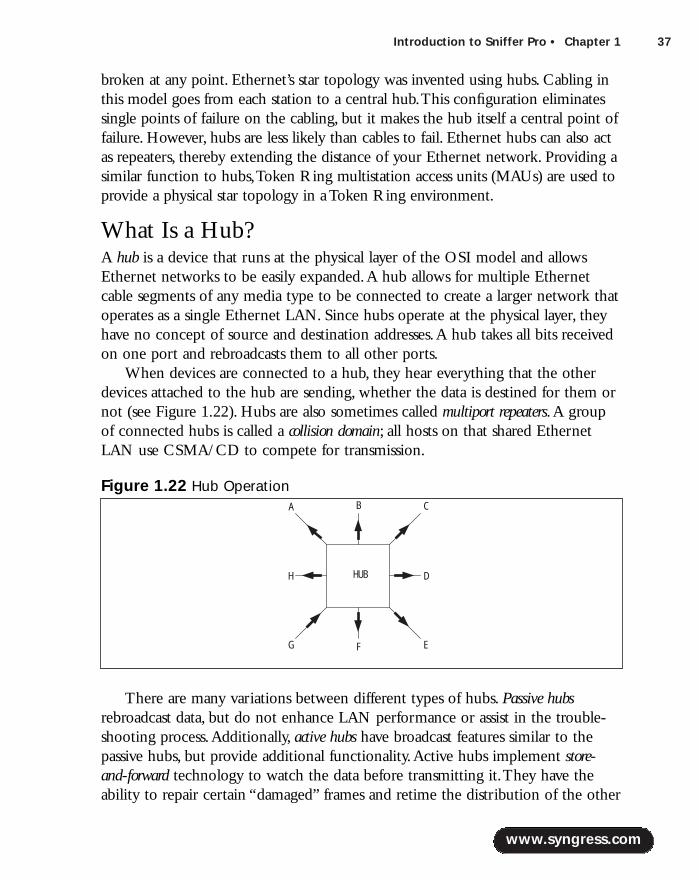
Introduction to Sniffer Pro • Chapter 1 37
www.syngress.com
broken at any point. Ethernet’s star topology was invented using hubs. Cabling inthis model goes from each station to a central hub.This configuration eliminatessingle points of failure on the cabling, but it makes the hub itself a central point offailure. However, hubs are less likely than cables to fail. Ethernet hubs can also actas repeaters, thereby extending the distance of your Ethernet network. Providing asimilar function to hubs,Token Ring multistation access units (MAUs) are used toprovide a physical star topology in a Token Ring environment.
What Is a Hub?A hub is a device that runs at the physical layer of the OSI model and allowsEthernet networks to be easily expanded.A hub allows for multiple Ethernetcable segments of any media type to be connected to create a larger network thatoperates as a single Ethernet LAN. Since hubs operate at the physical layer, theyhave no concept of source and destination addresses.A hub takes all bits receivedon one port and rebroadcasts them to all other ports.
When devices are connected to a hub, they hear everything that the otherdevices attached to the hub are sending, whether the data is destined for them ornot (see Figure 1.22). Hubs are also sometimes called multiport repeaters.A groupof connected hubs is called a collision domain; all hosts on that shared EthernetLAN use CSMA/CD to compete for transmission.
There are many variations between different types of hubs. Passive hubsrebroadcast data, but do not enhance LAN performance or assist in the trouble-shooting process.Additionally, active hubs have broadcast features similar to thepassive hubs, but provide additional functionality.Active hubs implement store-and-forward technology to watch the data before transmitting it.They have theability to repair certain “damaged” frames and retime the distribution of the other
Figure 1.22 Hub Operation
HUB
A C
EG
DH
F
B
219_sniffer_01.qxd 6/28/02 12:43 PM Page 37
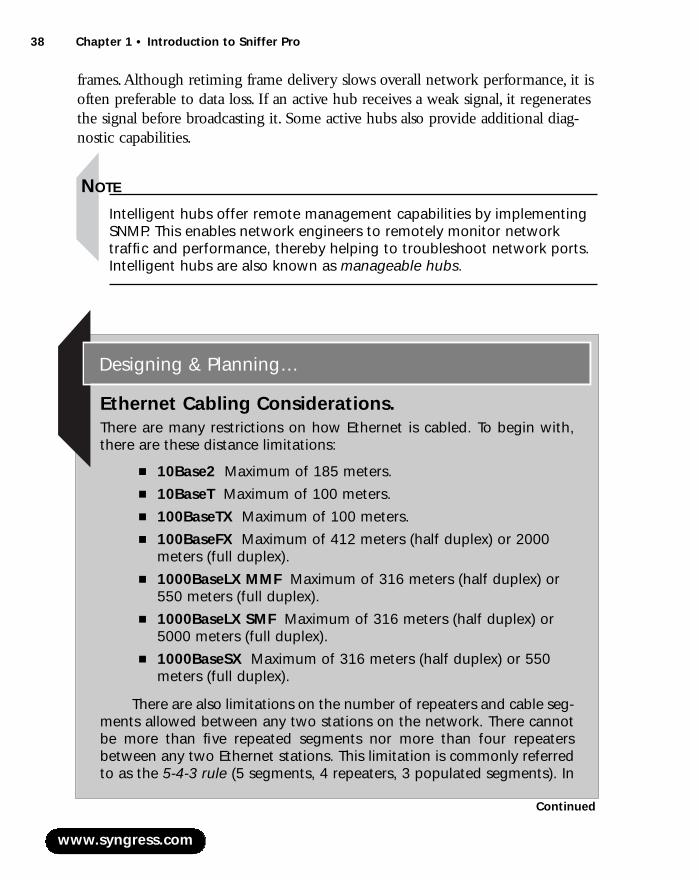
38 Chapter 1 • Introduction to Sniffer Pro
frames.Although retiming frame delivery slows overall network performance, it isoften preferable to data loss. If an active hub receives a weak signal, it regeneratesthe signal before broadcasting it. Some active hubs also provide additional diag-nostic capabilities.
NOTE
Intelligent hubs offer remote management capabilities by implementingSNMP. This enables network engineers to remotely monitor networktraffic and performance, thereby helping to troubleshoot network ports.Intelligent hubs are also known as manageable hubs.
www.syngress.com
Ethernet Cabling Considerations.There are many restrictions on how Ethernet is cabled. To begin with,there are these distance limitations:
■ 10Base2 Maximum of 185 meters.■ 10BaseT Maximum of 100 meters.■ 100BaseTX Maximum of 100 meters.■ 100BaseFX Maximum of 412 meters (half duplex) or 2000
meters (full duplex).■ 1000BaseLX MMF Maximum of 316 meters (half duplex) or
550 meters (full duplex).■ 1000BaseLX SMF Maximum of 316 meters (half duplex) or
5000 meters (full duplex).■ 1000BaseSX Maximum of 316 meters (half duplex) or 550
meters (full duplex).
There are also limitations on the number of repeaters and cable seg-ments allowed between any two stations on the network. There cannotbe more than five repeated segments nor more than four repeatersbetween any two Ethernet stations. This limitation is commonly referredto as the 5-4-3 rule (5 segments, 4 repeaters, 3 populated segments). In
Designing & Planning…
Continued
219_sniffer_01.qxd 6/28/02 12:43 PM Page 38

Introduction to Sniffer Pro • Chapter 1 39
What Is a MAU?A multistation access unit (MAU) is a special type of hub designed for Token Ringnetworks.A MAU connects Token Ring stations physically in a star topology whilestill maintaining a ring structure logically. One of the issues with Token Ring net-works is that a single nonoperating node can take down the entire network bybreaking the ring.A MAU works around this problem by shorting out the nonop-erating node, thereby maintaining the integrity of the ring (see Figure 1.23).
MAUs can be daisy-chained together to extend the distance and expand thenumber of ports available on the network. Generally, MAUs have ring-in andring-out ports to attach to other MAUs.
www.syngress.com
other words, any possible path between two stations cannot passthrough more than four repeaters or hubs nor more than three popu-lated cable segments.
It is important to note that there is also a maximum number of net-work devices that can be placed on an unrepeated cable segment. In10Base2, there can only be 30 devices per unrepeated segment, with aminimum distance of half a meter between T-connectors. In 10BaseT,100BaseTX, 100BaseFX, 1000BaseLX, and 1000BaseSX, you can have amaximum of 1024 devices.
Figure 1.23 MAU Operation with a Disconnected Station
DisconnectedStation
219_sniffer_01.qxd 6/28/02 12:43 PM Page 39
40 Chapter 1 • Introduction to Sniffer Pro
Common Layer 1 Device ProblemsA variety of problems can occur at Layer 1, including the following:
■ Attenuation Attenuation is the decrease in signal strength that occurs asa signal travels over a wire. In the networking world, repeaters areresponsible for cleaning up and regenerating a signal before passing it on.
■ Crosstalk Crosstalk is interference in the form of a signal from a neigh-boring cable or circuit. For example, signals on different pairs of wires ina twisted pair could interfere with each other. Crosstalk is generallyavoided by using additional shielding on the cable.
■ Impedance Impedance is a type of resistance that opposes the flow ofalternating current. Proper network operation depends on a constantcharacteristic impedance.Abrupt changes in this constant impedance cancause problems in signal transmission. Impedance problems can beavoided by using cables and connectors that all have the same character-istic impedance values.
■ Interference Interference can be radio frequency interference (RFI) orelectromagnetic interference (EMI). Interference can be caused by elec-tronic components near the cables such as from power lines, trans-formers, and even simple electronic components.
■ Bad cable A single broken cable can cause serious problems on thenetwork.
■ Power Obviously, lack of power to network devices can cause issues.
Switches, Bridging, and NICsTo improve performance, LANs are usually broken down and separated bybridges or switches. Bridges and switches are both intelligent devices that divide anetwork into collision domains.
Switches, Bridges and BridgingBridges operate at the data link layer of the OSI model and forward frames basedon the source and destination addresses in the frame. Bridges are only concernedwith the Layer 2 addresses of the network devices, not the actual paths betweenthem. Since the presence and operation of bridges are transparent to networkhosts, they are often called transparent bridges.
www.syngress.com
219_sniffer_01.qxd 6/28/02 12:43 PM Page 40

Introduction to Sniffer Pro • Chapter 1 41
Bridges learn about the presence of end stations by listening to all traffic. Bylistening to all the traffic on a network, a bridge is able to build a database of theend stations that are attached to it.The bridge creates a mapping of each station’sMAC address and the port of the bridge to which it connects.When the bridgereceives a frame, it checks the frame’s destination address against its database. Ifthe destination address is on the same port that the frame came from, the bridgedoes not forward the frame. If the destination address is on another port, it for-wards the frame only to the port to which it is destined. If the destination addressis not present in the bridge’s database, it floods the frame out all ports except thesource port.
Bridge operation can be broken down into three tasks:
1. Learning A bridge passively learns the MAC addresses of all the sta-tions on each segment (port) and builds a database.
2. Forwarding A bridge sends a frame to the appropriate port, or if nooutgoing port is known for a particular MAC address, the bridge floodsit out all ports (except the incoming port).
3. Filtering If there are multiple MAC addresses on a single segment (port),the bridge drops all frames seen between the devices on that segment.
Differences Between a Switch and a BridgeAlthough bridges and switches are similar in many respects, there are some minordifferences between them. Switches are generally much faster than bridgesbecause switching is generally done in hardware, and bridges are normally soft-ware based. Switches also offer higher port densities than bridges. Furthermore,although bridges always use store-and-forward technology, some switches supportcut-through switching, which allows them to reduce latency in the network.
When using store-and-forward, a switch must receive the entire frame beforebeginning the switching process.After it receives the entire frame, the switchexamines the frame to check for errors. If it sees errors, the frame is discarded.Since the switch discards frames with errors, store-and-forward prevents theseerrored frames from using up bandwidth on the destination segment. If Layer 2frame errors are common on your network, store-and-forward technology is agood fit. However, since the switch must receive the entire frame before it canbegin to forward, latency is added to the switching process.This latency is basedon the frame size. For example, in a 10Mbps Ethernet network, the smallest pos-sible frame (64 bytes) takes 51.2 microseconds to receive.The largest frame size
www.syngress.com
219_sniffer_01.qxd 6/28/02 12:43 PM Page 41

42 Chapter 1 • Introduction to Sniffer Pro
(1518 bytes) takes 1.2 milliseconds. Latency for 100Mbps networks is one-tenthof these numbers, and latency on Gigabit networks is one-hundredth of thesevalues.
Cut-through switching allows a switch to start forwarding a frame as soon as thedestination address is received.This reduces the latency value to the time requiredto receive the 6 bytes of the destination address. In the case of 10Mbps Ethernet,there is a 4.8-microsecond latency. However, cut-through switching does nothave the ability to check for errors on a frame before it is forwarded.As a result,errored frames pass through the switch, wasting bandwidth on the destinationsegment.
Collision DomainsA collision domain is defined as a single CSMA/CD network in which there willbe a collision if two stations attached to the system transmit at the same time.Each port on a bridge or a switch defines a collision domain.
Spanning Tree Protocol and the Spanning Tree AlgorithmSpanning Tree Protocol (STP) is documented in the IEEE 802.1D standard. It isdesigned to maintain a loop-free topology in a bridged network. In a redundanttopology, where more than one bridge might be connected between two LANs,frames can bounce back and forth between the two parallel bridges connectingthe LANs.This can create a situation in which broadcast packets keep goingaround and around in a loop. STP works around this issue by blocking bridge portswhen a physical loop exists in the network.This solution allows a new bridge tobe placed anywhere in the LAN without the danger of creating a loop.
STP goes through three steps to achieve a loop-free topology:
1. Election of a root bridge
2. Election of a root port
3. Election of a designated port
BPDUs and a Root BridgeBridges and switches build spanning trees by exchanging Bridge Protocol DataUnit (BPDU) frames. Figure 1.24 shows the frame format of a configurationBPDU. It consists of the following fields:
■ Protocol Identifier A 2-byte field that identifies the type of protocol.This field always contains the value 0.
www.syngress.com
219_sniffer_01.qxd 6/28/02 12:43 PM Page 42

Introduction to Sniffer Pro • Chapter 1 43
■ Version A 1-byte field that specifies the version of protocol.This fieldalways contains the value 0.
■ Message Type A 1-byte field that indicates the type of message.Thisfield always contains the value 0.
■ Flags A 1-byte field, but only the first 2 bits are used.The topologychange (TC) bit indicates a topology change.The topology changeacknowledgment bit (TCA) indicates acknowledgment of a messagewith the TC bit set.
■ Root ID An 8 -byte field that specifies the bridge ID of the root ofthe spanning tree.
■ Root Path Cost A 4-byte field that specifies the cost of the path fromthe bridge sending the BPDU to the root bridge.
■ Bridge ID An 8-byte field that specifies the bridge ID of the bridgesending the BPDU.
■ Port ID A 2-byte field that identifies the port from which the BPDUwas sent.
■ Message Age A 2-byte field that specifies the amount of time elapsedsince the root initiated the BPDU on which this BPDU is based.
■ Maximum Age A 2-byte field that specifies when this BPDU shouldbe deleted.
■ Hello Time A 2-byte field that specifies the time period between con-figuration BPDUs.
■ Forward Delay A 2-byte field that specifies the amount of time bridgesshould wait before transitioning to a new state after a topology change.
When the network starts, all bridges start sending out configuration BPDUs.These BPDUs include a field known as the bridge ID.The bridge ID consists oftwo parts: a 2-byte priority value and the 6-byte MAC address of the bridge.Thedefault priority value is 32,768.The bridge ID is used to determine the root ofthe bridged network, and the bridge with the lowest bridge ID becomes the root
www.syngress.com
Figure 1.24 BPDU Frame Format
ProtID Ver Root ID
FwdDelay
HelloTime
MsgType
Root PathCostFlags Bridge ID
PortID
MsgAge
MaxAge
219_sniffer_01.qxd 6/28/02 12:43 PM Page 43
44 Chapter 1 • Introduction to Sniffer Pro
of the network. Once the root bridge has been determined, BPDUs originateonly from the root.
Bridges use BPDUs to calculate and advertise the path cost to the root bridge.Each bridge performs a calculation to determine its cost to the root bridge.Theport with the lowest root-path cost is designated as the root port. If the root-pathcost is the same on multiple ports, the bridge uses the port ID as a tiebreaker toselect a designated port.
If there is a change in spanning tree topology, topology change notification(TCN) BPDUs are sent by a nonroot bridge.TCN messages are 4 bytes long andconsist of the following fields:
■ Protocol Identifier A 2-byte field that identifies the type of protocol.This field always contains the value 0.
■ Version A 1-byte field that specifies the version of the protocol.Thisfield always contains the value 0.
■ Message Type A 1-byte field that indicates the type of message.Thisfield always contains the value 128.
VLANsA virtual LAN (VLAN) is a group of network stations that behave as though theywere connected to a single network segment, even though they might not be.Legacy networks used router interfaces to separate broadcast domains.Today’sswitches have the ability to create broadcast domains based on the switches’ con-figuration.VLANs provide a logical, rather than a physical, grouping of devicesattached to a switch or a group of switches.A VLAN defines a broadcast domainand limits unicast, multicast, and broadcast flooding. Flooded traffic originatingfrom a particular VLAN is flooded out only the other ports belonging to thatVLAN.
VLANs are often associated with Layer 3 networks.All stations that belong tothe same VLAN generally belong to the same Layer 3 network. Since VLANsdefine broadcast domains, traffic between VLANs must be routed.
Ports can be assigned to a VLAN statically or dynamically. If using staticmembership, you must manually specify which ports belong to a given VLAN. Indynamic mode, a station is automatically assigned to a particular VLAN based onits MAC address.A server on the network must keep a track of MAC address toVLAN mappings.
www.syngress.com
219_sniffer_01.qxd 6/28/02 12:43 PM Page 44
Introduction to Sniffer Pro • Chapter 1 45
If two network devices share the same VLANs, frames for multiple VLANsmight need to be exchanged. Rather than a separate physical link to connecteach VLAN,VLAN-tagging technology provides the ability to send traffic formultiple VLANs over a single physical link.A common VLAN-tagging mecha-nism is IEEE 802.1q, which inserts a “tag” right after the Source Address field inEthernet.The tag contains, among other things, the number of the VLAN towhich the frame belongs.
Sniffer Pro has the ability to understand VLANs and is able to decode IEEE802.1q packets as well as Cisco’s Inter-Switch Link (ISL) VLAN-tagging pro-tocol. Sniffer Pro can also decode Cisco’s VLAN Trunk Protocol (VTP), whichallows VLANs to propagate across multiple switches without having to create theVLAN manually on each switch.Additionally, the Switch Expert feature ofSniffer Pro can poll network switches to retrieve VLAN properties and statistics.
Network Interface CardsA NIC is used to connect a computer to a network. NICs handle all the detailsof packet transmission and reception without using the computer’s CPU tohandle each bit. Most NICs are designed for a particular type of network media.NICs often come as an expansion board that you insert your computer. Newercomputers, however, often come with what is known as LAN on Motherboard(LOM). LOM frees an expansion slot on the host and decreases cost.
Common Layer 2 Device ProblemsAs frames travel over the wire, bad cabling, transceivers, and other physical layerissues can cause corruption.Although many errors occur at Layer 2, the followingare some of the more common ones:
■ Runts In Ethernet networks, the minimum frame length is 64 bytes. Ifa frame is shorter than 64 bytes, it is called a runt. Runts are sometimescaused by collisions, and that is normal behavior. However, they can alsobe caused by bad hardware, transmission problems, or a poor networkdesign.
■ Giants The maximum frame length in Ethernet is 1518 bytes. If aframe is larger than 1518 bytes, it is considered a giant. Giants are gener-ally caused by bad transmitters on a NIC.They can also be caused bytransmission problems, either by addition of garbage signals or by cor-ruption of the bits that indicate the frame size.
www.syngress.com
219_sniffer_01.qxd 6/28/02 12:43 PM Page 45
46 Chapter 1 • Introduction to Sniffer Pro
■ CRC CRC errors occur when the FCS value on the Ethernet framedoes not match the calculated FCS value.These errors are caused whenframes are damaged in transit.
■ Alignment errors All frames should end on an 8-bit boundary. If aproblem on the network causes the frame to deviate from this boundary,an alignment error occurs. Misaligned frames are caused by either thetransmitting NIC or bad cabling.Alignment errors can also be caused bya poorly designed network that does not meet the Ethernet specifica-tions.
Routers and GatewaysA router is a device that routes packets between different networks based on thenetwork address located in the packet header (IP, IPX,AppleTalk, and so on).Routers operate at Layer 3 (the network layer) of the OSI model and are there-fore protocol dependent. Routers have the ability to connect two or more similaror dissimilar networks.
Routing Fundamentals and ProtocolsRouters are a great way to segment your network because they do not passbroadcast traffic. Routers make their routing decisions based on network layeraddresses. Routing involves two basic activities: determining the optimal path andswitching the packet. Routers use metrics to determine the best path for apacket.The metric is a standard value based on bandwidth, hop count, delay, orother parameters.The switching process is straightforward. Routers are not trans-parent devices.As a packet is routed from one interface to the other, portions ofthe packet are rewritten.
There are two ways to create the routing table, which is used to make for-warding decisions.The routing table can either be configured statically or it canbe learned dynamically based on information received from other routers.Dynamic routing is performed using routing protocols. Routing protocols createoverhead on both the network and the router because data needs to beexchanged between routers, and each router much process this data to create therouting table.
There are two main types of routing protocols: distance vector and link state.Distance vector protocols exchange routing information packets containing the dis-tance to all known destinations. Each router counts the number of devicespackets must flow through to reach the final destination. Each device that a
www.syngress.com
219_sniffer_01.qxd 6/28/02 12:43 PM Page 46
Introduction to Sniffer Pro • Chapter 1 47
packet must flow through is known as a hop; the total number of hops between asource and a destination is known as the hop count.After determining the hopcounts for the various destinations, the router broadcasts its entire routing table toall other routers. Examples of distance vector routing protocols include IP RIP,IPX RIP, and AppleTalk RTMP. Link state routing protocols keep track of the statusof each interface, also known as link state.This information is maintained in adatabase called the link state database. Each router builds its own link state databaseand uses the shortest path algorithm to calculate the best route to each destina-tion network. Examples of link state routing protocols include Open ShortestPath First (OSPF), Intermediate System-to-Intermediate System (IS-IS), andNetwork Link Services Protocol (NLSP).
Problems with RIP, IPX RIP and RTMPIP RIP, IPX RIP and AppleTalk RTMP are all distance vector routing protocols.One of the main problems with distance vector routing protocols is their use ofhop count as a metric to make routing decisions. Unfortunately, the lowestnumber of hops to a destination is not always the best path to follow. Forexample, a path that crosses three 100Mbps Ethernet links has a higher hop countthan a path that crosses two 10Mbps Ethernet links.A distance vector routingprotocol would take the 10Mbps path, resulting in slower network performance.The other problem with these protocols is their limitation on the size of the net-work. Most distance vector routing protocols have a very low maximum hopcount value. Once a packet has traveled that many hops, it is discarded.
Broadcast DomainsA broadcast domain is defined as a portion of the network from which you canretrieve information using a broadcast packet. Since repeaters, hubs, bridges, andswitches forward broadcasts, they do not separate broadcast domains. However,routers generally do not forward broadcasts and therefore separate broadcastdomains.
Gateways Gateways operate up to the application layer of the OSI model and convert fromone protocol to another.
Common Upper-Layer Device ProblemsHere are some common upper-layer device problems you might run across:
www.syngress.com
219_sniffer_01.qxd 6/28/02 12:43 PM Page 47
48 Chapter 1 • Introduction to Sniffer Pro
■ Duplicate network layer addresses Because network layer addressesare assigned through software and are not burned in hardware, two sta-tions might accidentally be assigned the same network layer address.Thiscan cause problems—for example, a packet destined to the network layeraddress could end up at the wrong station.
■ Local routing This happens when two networked stations on the samesegment are communicating with each other through a router instead oftalking to each other directly.This is usually caused by a misconfigura-tion of the network settings on one or both hosts.
Sniffer Pro Fundamentals Sniffer Pro is a network analyzer from the Sniffer Technologies business unit ofNetwork Associates, Inc. Sniffer Pro, the industry’s most widely used tool for net-work fault and performance management, holds a 76-percent market share fornetwork analyzers. Sniffer Pro enjoys the largest installed base in the industry—more than 80,000 portable and in excess of 40,000 distributed units. Sniffer Procan prevent, isolate, and resolve problems quickly and efficiently.This sectionintroduces some of the fundamentals of the Sniffer Pro software.
Features of Sniffer ProSniffer Pro focuses on both ease of use and functionality. It has earned more than60 awards for product excellence. Some of its important features are:
■ It decodes for more than 450 protocols. In addition to IP, IPX, and other“standard” protocols, Sniffer Pro can decode a large number of vendor-proprietary protocols such as Cisco VLAN-specific protocols.
■ It provides support for major LAN,WAN, and networking technologies(including Fast and Gigabit Ethernet,Token Ring, 802.11b Wireless,Packet over SONET,T-1, frame relay, and ATM).
■ It provides the ability to filter packets at both the bit and byte levels.
■ It provides expert analysis and diagnosis of network problems and rec-ommends corrective actions.
■ Switch Expert provides the ability to poll statistics from various networkswitches.
■ Network traffic generator can operate at Gigabit speeds.
www.syngress.com
219_sniffer_01.qxd 6/28/02 12:43 PM Page 48

Introduction to Sniffer Pro • Chapter 1 49
Sniffer Pro captures data off the wire as frames. Since frames are alwaysaligned at an 8-bit boundary, Sniffer Pro captures data only in bytes. However,filters can be defined either at the bit or byte level.
Other Sniffer Versions and ProductsSniffer Technologies offers a number of other products in addition to the SnifferPro LAN portable, including the following:
■ Sniffer Wireless Comprehensive network analyzer for IEEE 802.11bwireless LANs. It provides all the same features as Sniffer Pro LAN, plussupport for channel surfing across 12 channels as well as WEP.
■ Sniffer Distributed Sniffer Pro and remote monitoring(RMON/RMON2) on a network probe. It supports real-time trou-bleshooting as well as collecting statistical data for monitoring and trendanalysis.
■ Sniffer Optical Network analyzer for Packet over SONET andDWDM Packet over SONET networks.
Sniffer Pro 4.x offers a number of new features over the previous versions,including several cosmetic changes and a more browser-like user interface. Someof the new features are:
■ Dashboard with segment view, showing short-term and long-term history
■ Application Response Time (ART), which provides reports on the healthof applications; these reports include top 10 applications and worstresponse time by application.ART can be used to show whether anapplication server is running slowly or if the problem lies in the network
■ Expert application service layer
■ Enhanced switch expert
■ Gigabit traffic generator
■ Ability to save and retrieve expert objects
■ Additional protocol decodes
www.syngress.com
219_sniffer_01.qxd 6/28/02 12:43 PM Page 49

50 Chapter 1 • Introduction to Sniffer Pro
Other Solutions and ProductsSniffer Pro is not the only network analyzer available.A number of other prod-ucts are on the market. Some are hardware based; others are software only. Somerun on Microsoft Windows; others are cross-platform.There are even open-source network analyzers as well as commercial ones. Most of these protocol ana-lyzers have full capture capability. However, a number of them have a limitednumber of protocol decodes and lack real-time expert analysis.This section takesa brief look at some of these tools.
EtherPeekEtherPeek is a protocol analyzer designed by WildPackets that runs on MicrosoftWindows as well as Apple Macintosh computers. EtherPeek provides both protocoldecode and monitoring capabilities and has a user interface very similar to that ofSniffer Pro. However, EtherPeek does not offer as many protocol decodes as SnifferPro, and its expert abilities are also limited in comparison. For more informationabout EtherPeek, visit the WildPackets Web site at www.wildpackets.com.
EtherealEthereal is an open-source freeware network analyzer available for both UNIXand Windows platforms. However, Ethereal simply provides protocol decode andlacks a number of features that Sniffer Pro provides, such as monitor applications,expert analysis, and the ability to capture mangled frames. For more informationon Ethereal, visit www.ethereal.com.
Agilent AdvisorAgilent Technologies provides a protocol analyzer called Agilent Advisor thatcompetes with Sniffer Pro.Agilent Advisor provides expert capabilities similar tothat of Sniffer Pro. However,Advisor’s user interface is nonintuitive and hard tonavigate.Advisor’s protocol support is also limited compared with Sniffer Pro’s.Tolearn more about the Agilent Advisor product suite, visitwww.onenetworks.com/agilentadvisor.
Management and Return on InvestmentThe Sniffer Pro product is designed for not only for network professionals but alsofor managers. It provides detailed protocol decodes and expert analysis capabilitiesto aid a network professional in solving problems. It also provides monitoring and
www.syngress.com
219_sniffer_01.qxd 6/28/02 12:43 PM Page 50
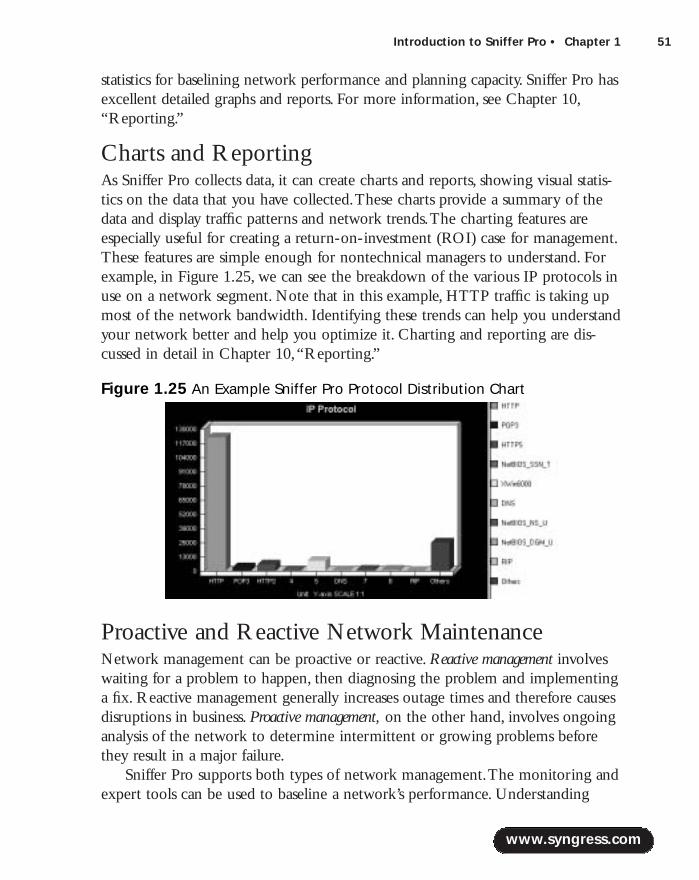
Introduction to Sniffer Pro • Chapter 1 51
statistics for baselining network performance and planning capacity. Sniffer Pro hasexcellent detailed graphs and reports. For more information, see Chapter 10,“Reporting.”
Charts and ReportingAs Sniffer Pro collects data, it can create charts and reports, showing visual statis-tics on the data that you have collected.These charts provide a summary of thedata and display traffic patterns and network trends.The charting features areespecially useful for creating a return-on-investment (ROI) case for management.These features are simple enough for nontechnical managers to understand. Forexample, in Figure 1.25, we can see the breakdown of the various IP protocols inuse on a network segment. Note that in this example, HTTP traffic is taking upmost of the network bandwidth. Identifying these trends can help you understandyour network better and help you optimize it. Charting and reporting are dis-cussed in detail in Chapter 10,“Reporting.”
Proactive and Reactive Network MaintenanceNetwork management can be proactive or reactive. Reactive management involveswaiting for a problem to happen, then diagnosing the problem and implementinga fix. Reactive management generally increases outage times and therefore causesdisruptions in business. Proactive management, on the other hand, involves ongoinganalysis of the network to determine intermittent or growing problems beforethey result in a major failure.
Sniffer Pro supports both types of network management.The monitoring andexpert tools can be used to baseline a network’s performance. Understanding
www.syngress.com
Figure 1.25 An Example Sniffer Pro Protocol Distribution Chart
219_sniffer_01.qxd 6/28/02 12:43 PM Page 51
52 Chapter 1 • Introduction to Sniffer Pro
how the network operates under normal conditions helps solve a problem whenthe network is not behaving normally. Monitoring statistics and protocol decodescan be compared against “normal” behavior when the network is experiencingconnectivity or performance issues.
Sniffer Pro: The Exam As in other areas of IT, certifications are available in the area of network analysis.Certifications can address a number of goals: industry recognition, careeradvancement, and personal satisfaction. In the following sections, we discuss someof these network analysis certifications as they relate to Sniffer Pro.
Certification Testing and the Sniffer UniversitySniffer University is a division of Network Associates that was created in 1991 totrain customers how to use Sniffer products. Sniffer University offers trainingcourses to network professionals so that they can learn about network analysis,troubleshooting methodologies, and new networking technologies such as wire-less LANs. Sniffer University also prepares customers for the Sniffer CertifiedProfessional Program.
Sniffer Certified ProfessionalThe Sniffer Certified Professional Program validates an individual’s achievementand certifies skills in the area of network analysis and understanding of the SnifferPro software.
Sniffer Certified Professional (SCP) candidates are required to pass one coreexam,Troubleshooting with the Sniffer Pro Network Analyzer.As of this writing,this exam consists of 50 multiple-choice questions and must be completed in 60minutes. Check the Sniffer Certified Professional Program Web site(www.sniffer.com/education/scpp.asp) for the most current information.
NOTE
The SCP exam is not a test of general networking knowledge. Althoughyou will need to know the fundamentals of network analysis, that is allyou need to know—the fundamentals. The exam measures your ability touse the Sniffer Pro network analyzer. It has a strong focus on the SnifferPro application and its user interface. To study for this exam, you shouldfocus on the topics covered in Chapters 1, 2, 3, 4, 8, and 9 of this book.
www.syngress.com
219_sniffer_01.qxd 6/28/02 12:43 PM Page 52
Introduction to Sniffer Pro • Chapter 1 53
Although the exam has no prerequisites, it is technically challenging.Candidates can prepare for the exam in a number of ways, including instructor-led training, self-study, and real-world experience.Although the TNV-101-GUIcourse from Sniffer University maps directly to the exam objectives, it is not aprerequisite for the exam.This book covers all the necessary objectives to pass theexam.The exam objectives are as follows:
1. Introduction and Installation
■ Describe the system requirements and supported interfaces of Sniffer Pro
■ Network Analyzer suite
■ Relate the OSI reference model to a frame on the wire
■ Configure a Sniffer Pro agent
■ Identify icons on the Sniffer Pro toolbar
■ Generate traffic with Packet Generator
2. Monitoring Network Health and Performance
■ Use Sniffer Pro Monitor Applications to provide an accurate pictureof network activity in real time
■ Use Sniffer Pro Monitor Applications to save historical records ofnetwork activity that can be used later for traffic and fault analysis
3. Troubleshooting the Network
■ Configure and enable alarms to immediately identify problems in the network
■ Start, stop, and save a Sniffer Pro capture
■ Use Sniffer Pro Expert analysis to troubleshoot the network
■ Customize a Sniffer Pro capture session by using filters
■ Apply triggers to capture data at selected times or based on errorconditions
4. Analyzing Network Issues
■ Examine frames for potential errors or activity of interest using theDecode Panel’s Summary, Detail, and Hex views
■ Set Display and Capture filters
www.syngress.com
219_sniffer_01.qxd 6/28/02 12:43 PM Page 53
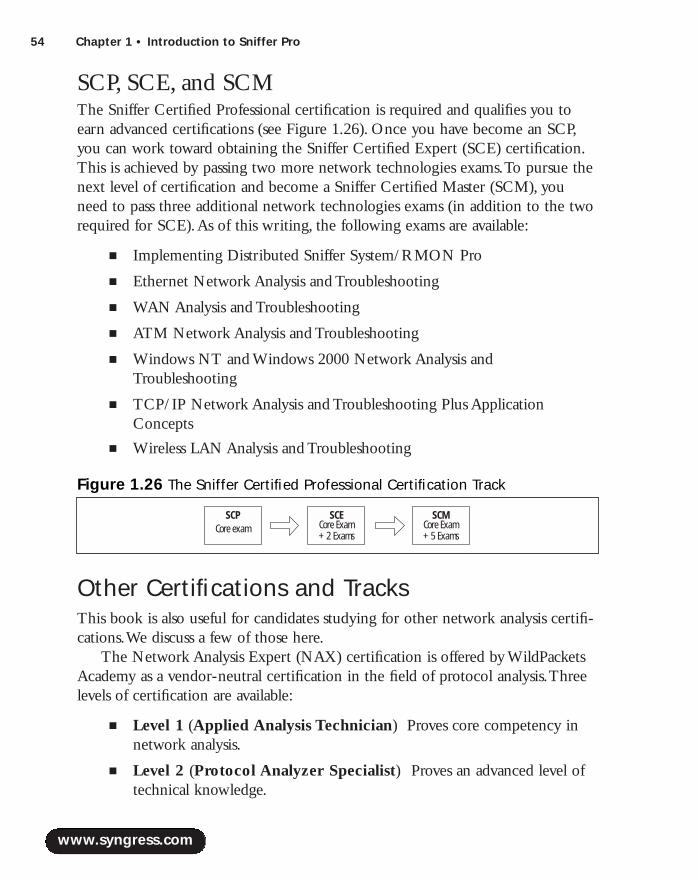
54 Chapter 1 • Introduction to Sniffer Pro
SCP, SCE, and SCMThe Sniffer Certified Professional certification is required and qualifies you toearn advanced certifications (see Figure 1.26). Once you have become an SCP,you can work toward obtaining the Sniffer Certified Expert (SCE) certification.This is achieved by passing two more network technologies exams.To pursue thenext level of certification and become a Sniffer Certified Master (SCM), youneed to pass three additional network technologies exams (in addition to the tworequired for SCE).As of this writing, the following exams are available:
■ Implementing Distributed Sniffer System/RMON Pro
■ Ethernet Network Analysis and Troubleshooting
■ WAN Analysis and Troubleshooting
■ ATM Network Analysis and Troubleshooting
■ Windows NT and Windows 2000 Network Analysis andTroubleshooting
■ TCP/IP Network Analysis and Troubleshooting Plus ApplicationConcepts
■ Wireless LAN Analysis and Troubleshooting
Other Certifications and TracksThis book is also useful for candidates studying for other network analysis certifi-cations.We discuss a few of those here.
The Network Analysis Expert (NAX) certification is offered by WildPacketsAcademy as a vendor-neutral certification in the field of protocol analysis.Threelevels of certification are available:
■ Level 1 (Applied Analysis Technician) Proves core competency innetwork analysis.
■ Level 2 (Protocol Analyzer Specialist) Proves an advanced level oftechnical knowledge.
www.syngress.com
Figure 1.26 The Sniffer Certified Professional Certification Track
SCPCore exam
SCECore Exam+ 2 Exams
SCMCore Exam+ 5 Exams
219_sniffer_01.qxd 6/28/02 12:43 PM Page 54

Introduction to Sniffer Pro • Chapter 1 55
■ Level 3 (Network Analysis Expert) Proves specialized technicalknowledge and practical skills in an area of specialty.
More information can be obtained from the NAX Web site at www.nax2000.com.The Certified Network Expert (CNX) program was developed in 1992 by
Network General (Sniffer University), Hewlett-Packard, and Wandel &Goltermann.The program went through various revisions over the years as com-panies joined and left the CNX consortium.As of April 2001, the program wasretired, but CNX certifications are still valid.The Sniffer Certified ProfessionalProgram and the Network Analysis Expert certification program both offer fasttracks for individuals holding CNX certification.
www.syngress.com
219_sniffer_01.qxd 6/28/02 12:43 PM Page 55
56 Chapter 1 • Introduction to Sniffer Pro
SummaryNetwork analysis is the key to maintaining an optimized network. Proactivemanagement can help find issues before they turn into serious problems andcause network downtime.A network analyzer allows you to capture data fromthe network, packet by packet; decode this information; and view it in an easy-to-understand format.
The OSI reference model provides a framework for dividing network pro-tocol functions into seven layers.The model is very generic and can be used toexplain virtually any network protocol. Commonly used upper-layer protocolsinclude TCP/IP, IPX/SPX, and AppleTalk. Commonly used lower-layer protocolsare Ethernet and Token Ring.
A variety of hardware devices—hubs, MAUs, switches, bridges, routers, andgateways—are available to interconnect networks. Each of these devices works ata particular layer of the OSI model to connect networks together and provide atransmission medium from source to destination.
Sniffer Pro is a network analyzer that allows you to capture network data,decode it, generate statistics and reports, and perform expert-level analysis of thedata to isolate problems and determine their causes. Sniffer Pro can be used forproactive or reactive network management.You will learn more details aboutSniffer Pro in the upcoming chapters in this book.
Solutions Fast Track
Understanding Network Analysis
! Network analysis is a range of techniques employed by networkengineers and designers to study the properties of networks, includingconnectivity, capacity, and performance.
! Successful network analysis involves developing a strong understandingof how your network operates under normal conditions, so problemscan easily be identified. Network troubleshooting should be performedusing a structured network methodology.
www.syngress.com
219_sniffer_01.qxd 6/28/02 12:43 PM Page 56

Introduction to Sniffer Pro • Chapter 1 57
The OSI Model, Protocols, and Devices
! A protocol is a set of rules (a common language) developed forcomputers running on a network to communicate with each other.
! The Open Systems Interconnect (OSI) reference model divides networkprotocol functions into seven layers. Each layer of the OSI modelrepresents a group of related specifications, functions, and activities.Alayer in the OSI model provides services to the layer above it and, inturn, relies on the services provided by the layer below it.
! The seven layers of the OSI model are application, presentation, session,transport, network, data link, and physical.
! The Transmission Control Protocol/Internet Protocol (TCP/IP) suite isthe most commonly used routed protocol in use today. IP, which sits atthe network layer of the OSI model, provides services to TCP and UserDatagram Protocol (UDP), which sit at the transport layer of the OSImodel.
Sniffer Pro Fundamentals
! Sniffer Pro is an expert-level network analyzer that provides protocoldecodes, network monitoring, and expert-level analysis.
! Sniffer Pro is the most widely used network analyzer because of itsintuitive user interface, more than 450 protocol decodes, and a real-timeexpert analysis engine that is far superior to other products in themarket.
! Sniffer Pro can be used as a tool to provide both proactive and reactivemanagement of the network. It can be used to take a baseline of thenetwork to determine how the network performs under normalconditions. If a problem occurs on the network, Sniffer Pro can be usedto gather new data from the network to compare against the baseline.
Sniffer Pro:The Exam
! To become a Sniffer Certified Professional (SCP), candidates must passone core exam,Troubleshooting with the Sniffer Pro Network Analyzer.
www.syngress.com
219_sniffer_01.qxd 6/28/02 12:43 PM Page 57
58 Chapter 1 • Introduction to Sniffer Pro
! The Sniffer Certified Master (SCM) and Sniffer Certified Expert (SCE)certifications can be achieved by taking additional network technologyexams.
! This book covers all the necessary objectives to pass the SCP exam. Itwill also help in passing the Network Analysis Expert (NAX) and othernetwork analysis certifications.
Q: Where is TCP/IP defined?
A: The protocols in the TCP/IP suite are defined in documents known asrequests for comment (RFCs). RFCs are freely available and can be down-loaded on the Internet at www.ietf.org. Not all RFCs specify TCP/IP stan-dards. Some of them address other protocols, some document hints andtechniques, and others are written just for humor.
Q: What is the TCP three-way handshake?
A: Handshaking is defined as the exchange of control information during thesetup of a session.TCP is a connection-oriented protocol that exchangescontrol information with the remote host to verify that the remote host isready to receive data before sending it. Every TCP connection begins withthe three-way handshake. First the source device initiates a TCP segment tothe destination with its sequence number and the maximum segment size.Then the destination device sends a TCP segment to the source device withits sequence number and the maximum segment size. Finally, the sourcedevice acknowledges receipt of the sequence number and segment size infor-mation.Thus the connection is established.
Q: How many collisions in Ethernet are considered bad?
www.syngress.com
Frequently Asked Questions
The following Frequently Asked Questions, answered by the authors of this book,are designed to both measure your understanding of the concepts presented in this chapter and to assist you with real-life implementation of these concepts. Tohave your questions about this chapter answered by the author, browse towww.syngress.com/solutions and click on the “Ask the Author” form.
219_sniffer_01.qxd 6/28/02 12:43 PM Page 58
Introduction to Sniffer Pro • Chapter 1 59
A: Collisions are used in Ethernet as a contention access method. If carrier is notin use, any station can transmit. If two stations sense carrier, find it inactive,and transmit at the same time, the result is that the two signals overlap eachother, causing a collision. However, collisions are not errors! They are anormal part of half-duplex Ethernet operation.Therefore, it is not appropriateto define “good” or “bad” levels of collisions. If you think there are too manycollisions on your network, you can create collision domains using a bridgeor a switch.
Q: What is flow control?
A: Flow control regulates the volume and timing of data transmissions. It is usedto ensure that the receiving device can handle all the incoming data. If thereceiving device is busy, the network protocol can tell the sender to slow orstop sending more packets.When the receiving device is once more ready toreceive data, the protocol can signal the sender to begin transmitting again.Flow control can be implemented in hardware, software, or a combination ofboth.
Q: Where can I learn more about protocols and packet and frame formats?
A: A great way to learn about protocol operation and packet/frame formats is tocapture and look at data on Sniffer Pro. In addition, many books and Websites are available with detailed information on protocol decodes.A great freeWeb site dedicated to protocol decodes is www.protocols.com.
www.syngress.com
219_sniffer_01.qxd 6/28/02 12:43 PM Page 59

219_sniffer_01.qxd 6/28/02 12:43 PM Page 60
Installing Sniffer Pro
Solutions in this chapter:
■ Installing Sniffer Pro Step by Step
■ Customizing the Installation
■ Configuring Network Interfaces andDrivers
■ Troubleshooting the Installation
Chapter 2
61
! Summary
! Solutions Fast Track
! Frequently Asked Questions
219_sniffer_02.qxd 6/28/02 11:48 AM Page 61

62 Chapter 2 • Installing Sniffer Pro
IntroductionNow that we have seen an overview of what Sniffer Pro will do for you andwhere you are going to apply this technology, we need to get the product onto amachine so we can use it. In this chapter, you will learn how to install Sniffer Pro4.5. In our discussion, we will mention older versions as well as other types ofSniffer products.The chapter covers the issues you could face while installing andother problems you might run into while upgrading.The in-depth informationfocuses on the minimum requirements for every platform.When using SnifferPro, you need to know which operating systems it can function on. If the oper-ating system is not compatible, Sniffer Pro might not function properly.
Another topic that we cover in even greater detail is how to configure thedrivers and why you need special drivers for Ethernet,Token Ring, or any otherplatform you use with Sniffer Pro.To put it simply, if you do not set up the soft-ware correctly, you might not get accurate data. If you use the wrong drivers, youmight not see collisions; if these collisions are not picked up with a promiscu-ously set network interface card (NIC), you will not receive accurate reportingdata. Other topics covered in this chapter are how to build a technician’s tool kitand why you might need to use those specific tools.
Installing Sniffer Pro Step by StepThe following sections describe the Sniffer Pro installation process in detail.Youwill find that installing Sniffer Pro is as simple as installing any other applicationon Microsoft Windows. Before you install the software, you should ensure thatyour system meets the minimum requirements.You should also check to makesure that you are licensed for installation. Once the prerequisites are complete,you can begin the installation process. Sniffer Pro uses the standard InstallShieldWizard to guide you through the setup process.
NOTE
A stable operating system for the Sniffer Pro machine is highly recom-mended. Microsoft Windows NT Workstation 4.0 and Windows 2000Professional are known to be more stable than other flavors of MicrosoftWindows and serve as good platforms for the Sniffer Pro software.
www.syngress.com
219_sniffer_02.qxd 6/28/02 11:48 AM Page 62
www.syngress.com
System Requirements for Sniffer Pro InstallationThere are a number of minimum hardware and software requirements to installSniffer Pro on a PC.The following sections describe these requirements in detail.
NOTE
To ensure that Sniffer Pro operates without any problems, it is importantthat your system meet all the installation requirements. You might findthat although the software will install on a system that doesn’t meet allthe requirements, you could run into problems when you operate SnifferPro. For example, the dashboard might not work, or the Sniffer Proapplication might crash when capturing large files.
Minimum System Requirements for Version 4.xThe Sniffer Pro 4.5 software has the following minimum requirements:
■ A Pentium 200MHz CPU; 400MHz or higher is recommended.
■ A minimum of 64MB of RAM; 128MB or higher is recommended.
■ A minimum of 84MB of free disk space is necessary to install the software.
■ A VGA adapter and color monitor with 640 x 480 (or higher) resolutionare required.
■ An operational mouse, trackball, or similar pointing device are needed.
■ The machine should be running Microsoft Windows 98,Windows NT4.0 (with Service Pack 3, 4, 5, or 6a), or Windows 2000.At this time,Sniffer 4.5 does not support Windows 95,Windows Me, or Windows XP.
■ A working NIC should be installed.
■ A CD-ROM drive or the Sniffer Pro installation executable file.
NOTE
As of this writing, the SCP exam is based on Sniffer Pro 4.0. The systemrequirements for Sniffer Pro 4.0 are exactly the same as Sniffer Pro 4.5except that it supports Microsoft Windows 95 and does not supportMicrosoft Windows 2000.
Installing Sniffer Pro • Chapter 2 63
219_sniffer_02.qxd 6/28/02 11:48 AM Page 63
64 Chapter 2 • Installing Sniffer Pro
Internet Explorer 5 with the Virtual MachineA number of user interface enhancements in Sniffer Pro 4.x require the installa-tion of Microsoft Internet Explorer 5.01 (or later) with the Microsoft VirtualMachine.The Microsoft Virtual Machine isn’t normally installed as a part ofInternet Explorer 5.01 and must be selected during the download.You candownload Internet Explorer at www.microsoft.com/ie.
NOTE
As of this writing, the latest and most stable version of Internet Explorer5.01 is Service Pack 2.
Netscape Communicator or Netscape Navigator cannot be used instead ofInternet Explorer to provide the functionality that Sniffer Pro requires. SnifferPro uses Hypertext Markup Language (HTML) and Dynamic HTML (DHTML)features that are only found in Internet Explorer and not in Netscape’s browsers.In addition, the Sniffer Pro Dashboard and Capture Panel depend on theMicrosoft Virtual Machine to run.
www.syngress.com
The Standard Sniffer Pro ImageIf you have discovered a hardware and software combination that alwaysworks for you and is very stable, you might want to create an “image” ofyour Sniffer Pro system. Once you have Sniffer Pro up and running on aPC with the latest service packs, the Microsoft virtual machine, and theenhanced NAI drivers, you can take a snapshot of the system using animaging program such as Norton Ghost or ImageCast IC3. This will allowyou to create “clones” of the Sniffer Pro system with minimum effort.Clones can be very useful if you are looking to roll out many Sniffer Prosystems. Of course, you should ensure that you have the number oflicenses necessary to deploy these systems. You can also use these imagesto rebuild a Sniffer Pro system if it ever becomes corrupted.
Designing & Planning…
219_sniffer_02.qxd 6/28/02 11:48 AM Page 64
Installing Sniffer Pro • Chapter 2 65
NOTE
Don’t worry if you use a Netscape browser. Just because Sniffer Prorequires libraries only found in Internet Explorer doesn’t mean you haveto change browsers. Although Internet Explorer must be installed on yourSniffer Pro system, you can still use Netscape as your default browser.
Minimum System Requirements for Version 3.0To install Sniffer Pro 3.0, your system should meet the following requirements:
■ At least a Pentium 200MHz (or higher) CPU.
■ You should have at least 64MB of RAM.
■ You will require at least 35MB of free disk space.
■ A VGA adapter and color monitor with 640 x 480 (or higher) resolutionare recommended.
■ You should be running Microsoft Windows 95,Windows 98, orWindows NT 4.0. Sniffer Pro 3.0 is not compatible with Windows2000,Windows Me, or Windows XP.
■ Your computer should have an operational mouse, trackball, or similarpointing device.
■ Sniffer Pro requires an up-to-date NIC.
■ Your system must have a CD-ROM drive, or you should have access tothe Sniffer Pro 3.0 installation executable file.
These requirements are very similar to those of Sniffer Pro 4.5, but SnifferPro 3.0 requires less hard drive space.The key difference in operating systemrequirements is that Sniffer 3.0 provides no support for Windows 2000 but willrun fine on Windows 95.
Installing Sniffer Pro 4.5The following instructions guide you through installing Sniffer Pro 4.5 on yourmachine.The Sniffer Pro software is provided to you either on CD-ROM or as afile downloaded from the Sniffer Technologies Web site. If you have downloaded
www.syngress.com
219_sniffer_02.qxd 6/28/02 11:48 AM Page 65
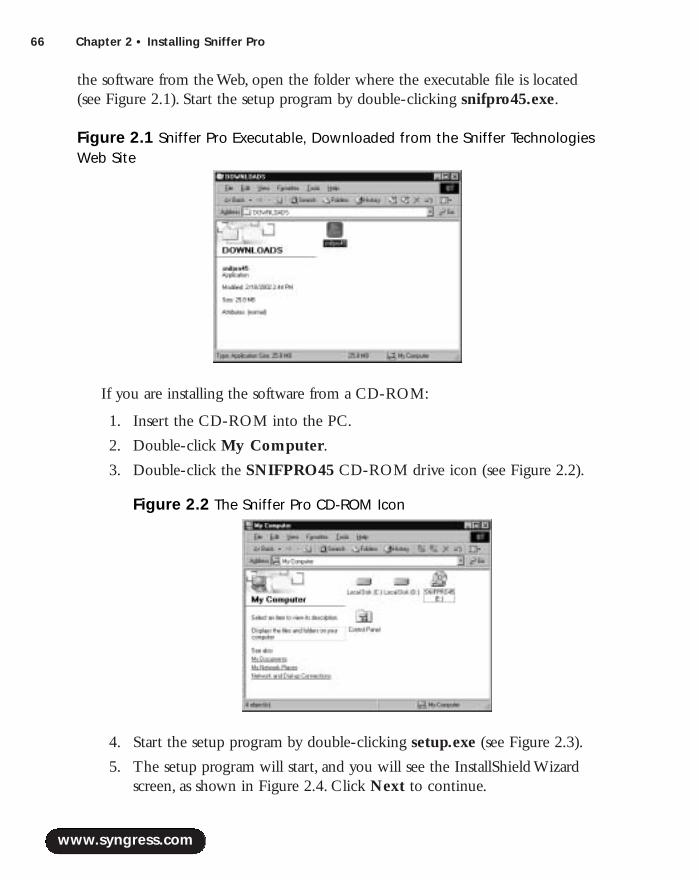
66 Chapter 2 • Installing Sniffer Pro
the software from the Web, open the folder where the executable file is located(see Figure 2.1). Start the setup program by double-clicking snifpro45.exe.
If you are installing the software from a CD-ROM:
1. Insert the CD-ROM into the PC.
2. Double-click My Computer.
3. Double-click the SNIFPRO45 CD-ROM drive icon (see Figure 2.2).
4. Start the setup program by double-clicking setup.exe (see Figure 2.3).
5. The setup program will start, and you will see the InstallShield Wizardscreen, as shown in Figure 2.4. Click Next to continue.
www.syngress.com
Figure 2.1 Sniffer Pro Executable, Downloaded from the Sniffer TechnologiesWeb Site
Figure 2.2 The Sniffer Pro CD-ROM Icon
219_sniffer_02.qxd 6/28/02 11:48 AM Page 66
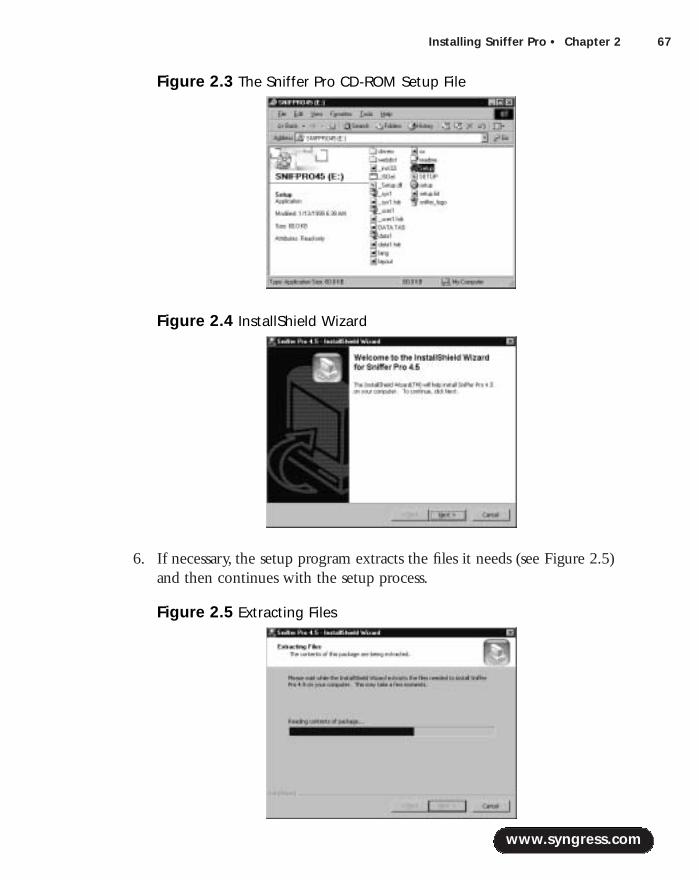
Installing Sniffer Pro • Chapter 2 67
6. If necessary, the setup program extracts the files it needs (see Figure 2.5)and then continues with the setup process.
www.syngress.com
Figure 2.3 The Sniffer Pro CD-ROM Setup File
Figure 2.4 InstallShield Wizard
Figure 2.5 Extracting Files
219_sniffer_02.qxd 6/28/02 11:48 AM Page 67
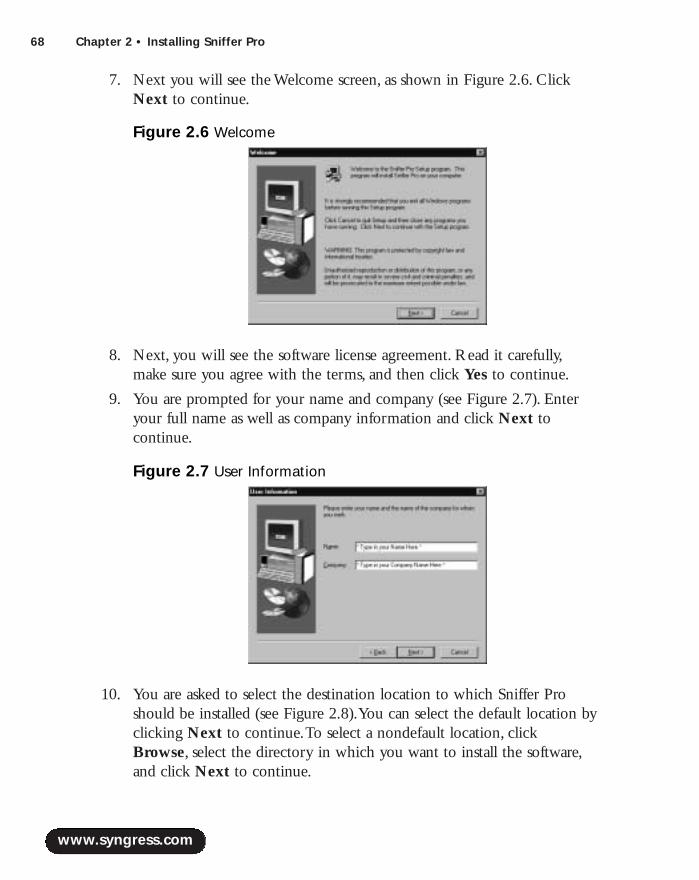
68 Chapter 2 • Installing Sniffer Pro
7. Next you will see the Welcome screen, as shown in Figure 2.6. ClickNext to continue.
8. Next, you will see the software license agreement. Read it carefully,make sure you agree with the terms, and then click Yes to continue.
9. You are prompted for your name and company (see Figure 2.7). Enteryour full name as well as company information and click Next to continue.
10. You are asked to select the destination location to which Sniffer Proshould be installed (see Figure 2.8).You can select the default location byclicking Next to continue.To select a nondefault location, clickBrowse, select the directory in which you want to install the software,and click Next to continue.
www.syngress.com
Figure 2.6 Welcome
Figure 2.7 User Information
219_sniffer_02.qxd 6/28/02 11:48 AM Page 68
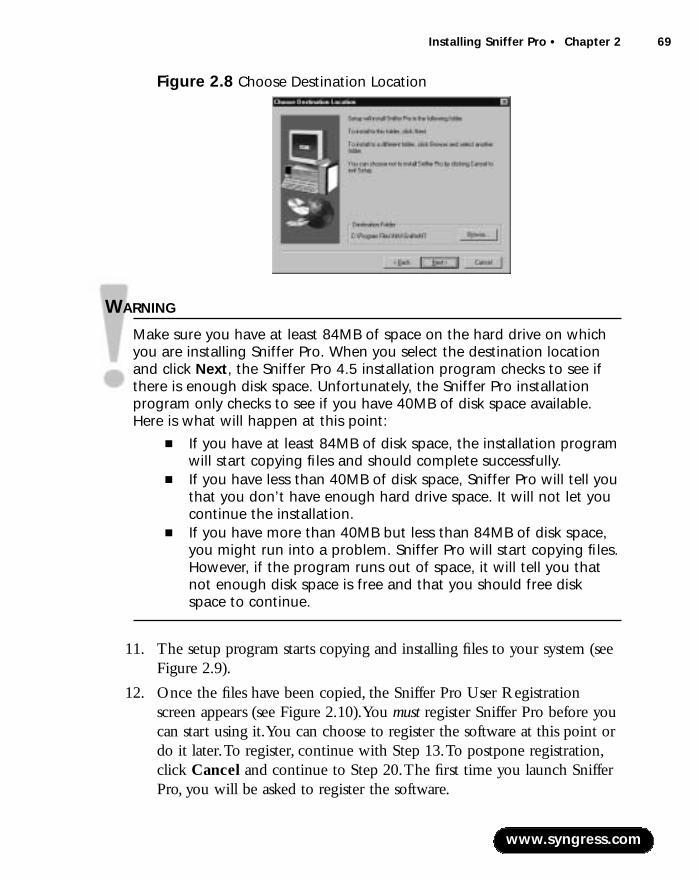
Installing Sniffer Pro • Chapter 2 69
WARNING
Make sure you have at least 84MB of space on the hard drive on whichyou are installing Sniffer Pro. When you select the destination locationand click Next, the Sniffer Pro 4.5 installation program checks to see ifthere is enough disk space. Unfortunately, the Sniffer Pro installationprogram only checks to see if you have 40MB of disk space available.Here is what will happen at this point:
■ If you have at least 84MB of disk space, the installation programwill start copying files and should complete successfully.
■ If you have less than 40MB of disk space, Sniffer Pro will tell youthat you don’t have enough hard drive space. It will not let youcontinue the installation.
■ If you have more than 40MB but less than 84MB of disk space,you might run into a problem. Sniffer Pro will start copying files.However, if the program runs out of space, it will tell you thatnot enough disk space is free and that you should free diskspace to continue.
11. The setup program starts copying and installing files to your system (seeFigure 2.9).
12. Once the files have been copied, the Sniffer Pro User Registrationscreen appears (see Figure 2.10).You must register Sniffer Pro before youcan start using it.You can choose to register the software at this point ordo it later.To register, continue with Step 13.To postpone registration,click Cancel and continue to Step 20.The first time you launch SnifferPro, you will be asked to register the software.
www.syngress.com
Figure 2.8 Choose Destination Location
219_sniffer_02.qxd 6/28/02 11:48 AM Page 69
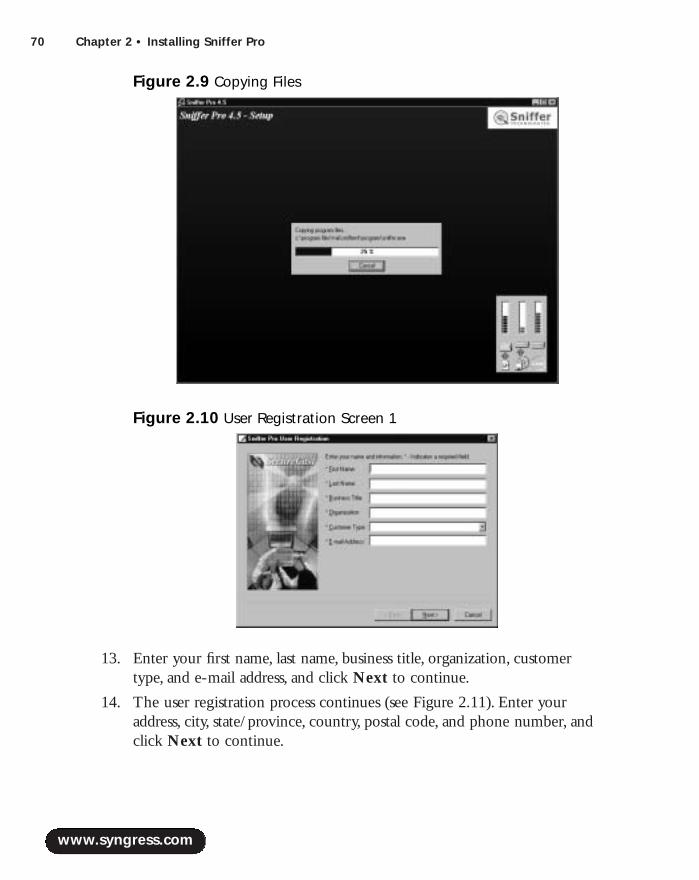
70 Chapter 2 • Installing Sniffer Pro
13. Enter your first name, last name, business title, organization, customertype, and e-mail address, and click Next to continue.
14. The user registration process continues (see Figure 2.11). Enter youraddress, city, state/province, country, postal code, and phone number, andclick Next to continue.
www.syngress.com
Figure 2.9 Copying Files
Figure 2.10 User Registration Screen 1
219_sniffer_02.qxd 6/28/02 11:48 AM Page 70

Installing Sniffer Pro • Chapter 2 71
15. This brings you to the third user registration screen (see Figure 2.12).Answer the questions, enter your serial number from the Sniffer Proproduct package, and click Next to continue.
16. At this point of the installation, you need to contact NAI through theInternet to register the software. Please select the type of connection youhave to the Internet (see Figure 2.13). If you do not have Internetaccess, you’ll have to complete this step manually using a fax machine(select Not connected to network or dial-up). If you need to con-figure proxy settings, click Connection to the Internet through aProxy, and then click the Configure button.You need to enter theproxy settings, as shown in Figure 2.14.
www.syngress.com
Figure 2.11 User Registration Screen 2
Figure 2.12 User Registration Screen 3
219_sniffer_02.qxd 6/28/02 11:48 AM Page 71
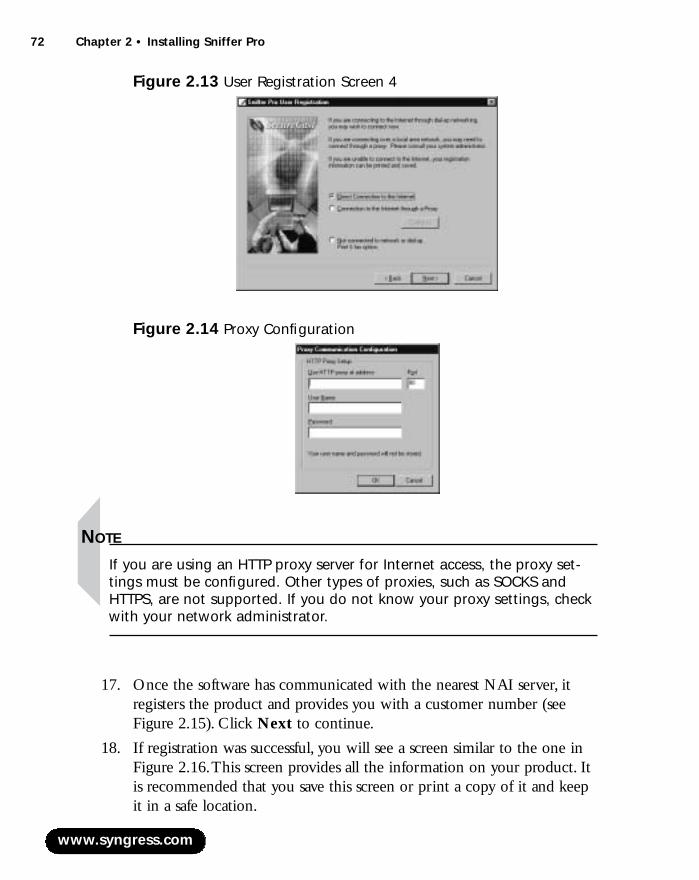
72 Chapter 2 • Installing Sniffer Pro
NOTE
If you are using an HTTP proxy server for Internet access, the proxy set-tings must be configured. Other types of proxies, such as SOCKS andHTTPS, are not supported. If you do not know your proxy settings, checkwith your network administrator.
17. Once the software has communicated with the nearest NAI server, itregisters the product and provides you with a customer number (seeFigure 2.15). Click Next to continue.
18. If registration was successful, you will see a screen similar to the one inFigure 2.16.This screen provides all the information on your product. Itis recommended that you save this screen or print a copy of it and keepit in a safe location.
www.syngress.com
Figure 2.13 User Registration Screen 4
Figure 2.14 Proxy Configuration
219_sniffer_02.qxd 6/28/02 11:48 AM Page 72
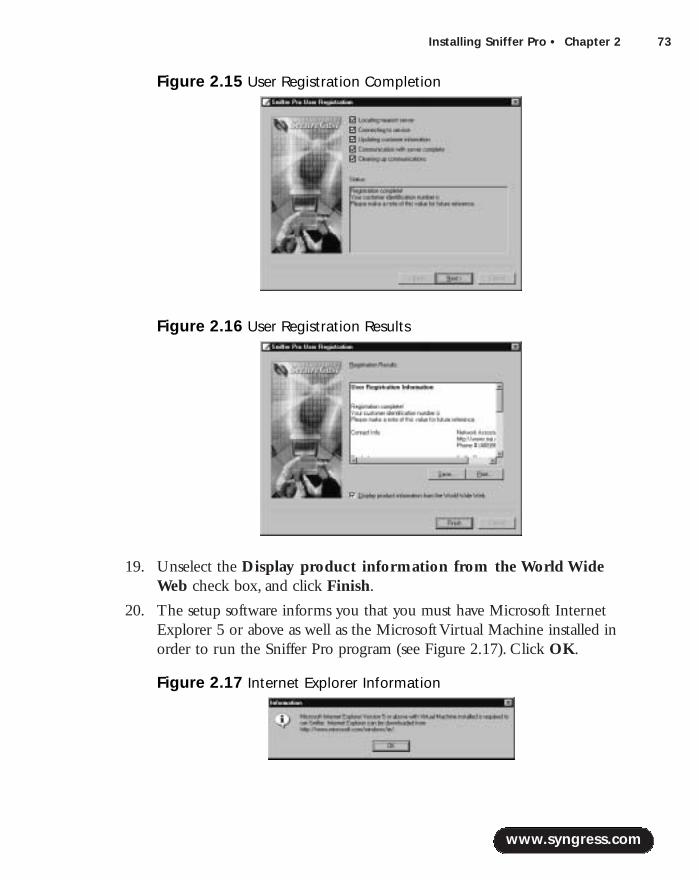
Installing Sniffer Pro • Chapter 2 73
19. Unselect the Display product information from the World WideWeb check box, and click Finish.
20. The setup software informs you that you must have Microsoft InternetExplorer 5 or above as well as the Microsoft Virtual Machine installed inorder to run the Sniffer Pro program (see Figure 2.17). Click OK.
www.syngress.com
Figure 2.15 User Registration Completion
Figure 2.16 User Registration Results
Figure 2.17 Internet Explorer Information
219_sniffer_02.qxd 6/28/02 11:48 AM Page 73

74 Chapter 2 • Installing Sniffer Pro
21. The software displays a screen indicating that Sniffer Pro setup is com-plete. Make sure that the View the Sniffer Pro README file checkbox is selected, and click Finish.
22. If you selected the check box in the previous step, the Release Note filefor the Sniffer Pro software will appear on screen (see Figure 2.18).Please make sure you review this file in detail because it contains impor-tant information about the current release of the Sniffer Pro software.You can also print a copy of this file for future reference. Close thewindow when you are finished reading the Release Note.
23. You are asked if you want to restart your computer. Select Yes, I wantto restart my computer now. Ensure that all other applications onyour computer have been closed. Click Finish.This choice causes yourcomputer to reboot.
www.syngress.com
Figure 2.18 Release Note
219_sniffer_02.qxd 6/28/02 11:48 AM Page 74
Installing Sniffer Pro • Chapter 2 75
NOTE
You should always reboot your system after installing and uninstallingsoftware. Sniffer Pro is no exception. Failing to reboot after installationcould result in an unstable Sniffer Pro machine. This is because the software installation makes modifications to the registry, updates somesystem files, and adds a service to the NIC drivers. Some of thesechanges do not take full effect until the system is rebooted.
LicensingRegardless of the software version you installed, NAI provides two licensingoptions for the Sniffer Pro software:
■ Subscription Enables the customer to use the software for a limitedtime (two years).After this period, the customer must obtain a newlicense or stop using the software.The list price for a Subscriptionlicense including one year of NAI’s Prime Support Connect isU.S.$14,701.75.A second year of Prime Support Connect comes atU.S.$2,699.25.
■ Perpetual Enables the customer to own and use the software forever.The list price for a Perpetual license is U.S.$17,995 and includes no sup-port. Prime Support Connect costs an additional U.S.$2,699.25 per year.
NOTE
This licensing and pricing information is accurate as of writing of thispublication. For up-to-date information, you should contact a NetworkAssociates representative or reseller in your area.
The licensing scheme you choose depends on your business needs, your com-pany’s financial situation, and your analysis of the cost of ownership.The cost ofownership for Perpetual licensing is lower than for subscription over the longterm. If you buy for two years or less, however, the Subscription licensing optionworks out to be less expensive. Figure 2.19 shows a comparison of the twolicensing methods and their total costs over one to six years.
www.syngress.com
219_sniffer_02.qxd 6/28/02 11:48 AM Page 75

76 Chapter 2 • Installing Sniffer Pro
NOTE
Although a Subscription license is generally for two years, you can workwith your Network Associates representative or reseller to negotiate alicense for other time periods. You might be able to work out a one-yearSubscription license. This can be useful if you are not willing to enterinto a long-term commitment for the software.
During installation, you will be prompted for the product serial number.Thisserial number should have been provided to you when you purchased the soft-ware. It is 20 digits long, with a dash separating every five digits.
NOTE
Do not lose the serial number provided to you by Network Associates. Ifyou ever want to move your installation of Sniffer Pro to another systemor rebuild the existing system, you will need this serial number again.
Read the Readme.txt FileAfter you install the Sniffer Pro software, it is very important to read the ReleaseNote.This note is usually included in hardcopy format with the Sniffer Pro soft-ware. It is also provided in a file named readme.wri.After you install Sniffer Pro,
www.syngress.com
Figure 2.19 Sniffer Pro Cost-of-Ownership Analysis (Perpetual vs. Subscription)
219_sniffer_02.qxd 6/28/02 11:48 AM Page 76
Installing Sniffer Pro • Chapter 2 77
you can access this file by going to Start | Programs | Sniffer Pro |Readme.The file is written in rich text format, making it very easy to read.
The Release Note always starts with the Sniffer Pro version number and date.Make sure you are reading the Release Note for the correct version of SnifferPro. Newer versions of the Release Note also include a table of contents.The restof the file is divided into sections and contains information on a variety of topics,including a list of new features and, most important, driver information, knownissues, driver and performance issues, and contact information for NAI.
Most of the topics in the Release Note are covered in this chapter. Specifically,the following sections contain discussions of a number of these topics:
■ Configuring Network Interfaces and Drivers
■ Troubleshooting the Installation
Installation of Version 3.xThe following instructions will guide you through installing Sniffer Pro 3.0 onyour machine.The Sniffer Pro software is provided to you either on CD-ROMor as a file downloaded from the Sniffer Technologies Web site. If you havedownloaded the software from the Web, you will follow a process very similar tothe one described earlier in the section on installing Version 4.5:
1. Open the folder where the executable file is located.
2. Double-click the executable file to launch the setup program.
If you are installing the software from a CD-ROM:
1. Insert the CD-ROM into the drive.
2. Double-click My Computer.
3. Double-click the CD-ROM drive icon.
4. Start the setup program by double-clicking setup.exe.
5. When the setup program starts (see Figure 2.20), click Continue.
6. The setup program unpacks necessary files and then continues with thesetup process.
7. Next, you will see the Welcome screen, as shown in Figure 2.21. ClickNext to continue.
www.syngress.com
219_sniffer_02.qxd 6/28/02 11:48 AM Page 77
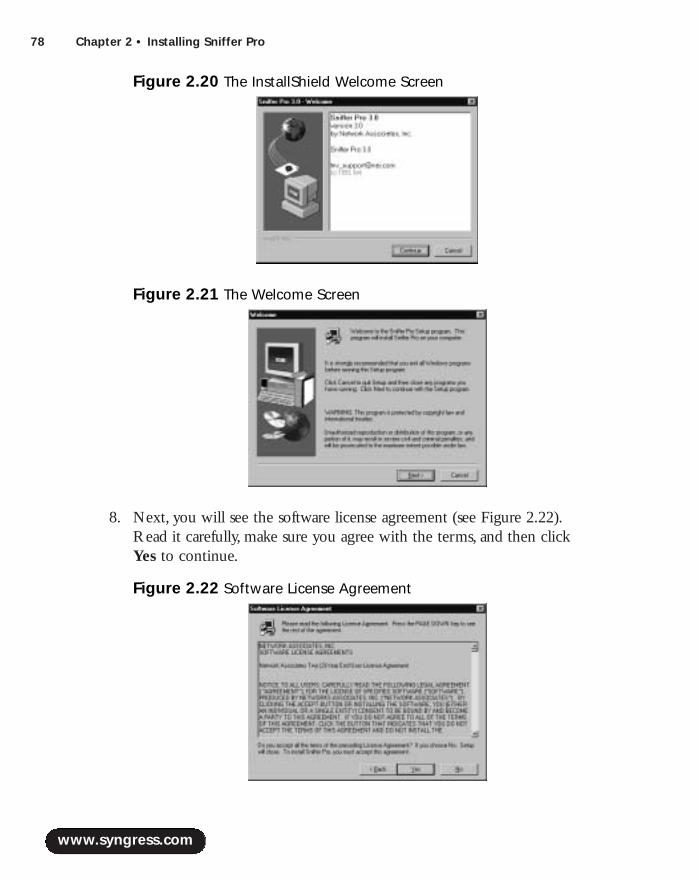
78 Chapter 2 • Installing Sniffer Pro
8. Next, you will see the software license agreement (see Figure 2.22).Read it carefully, make sure you agree with the terms, and then clickYes to continue.
www.syngress.com
Figure 2.20 The InstallShield Welcome Screen
Figure 2.21 The Welcome Screen
Figure 2.22 Software License Agreement
219_sniffer_02.qxd 6/28/02 11:48 AM Page 78
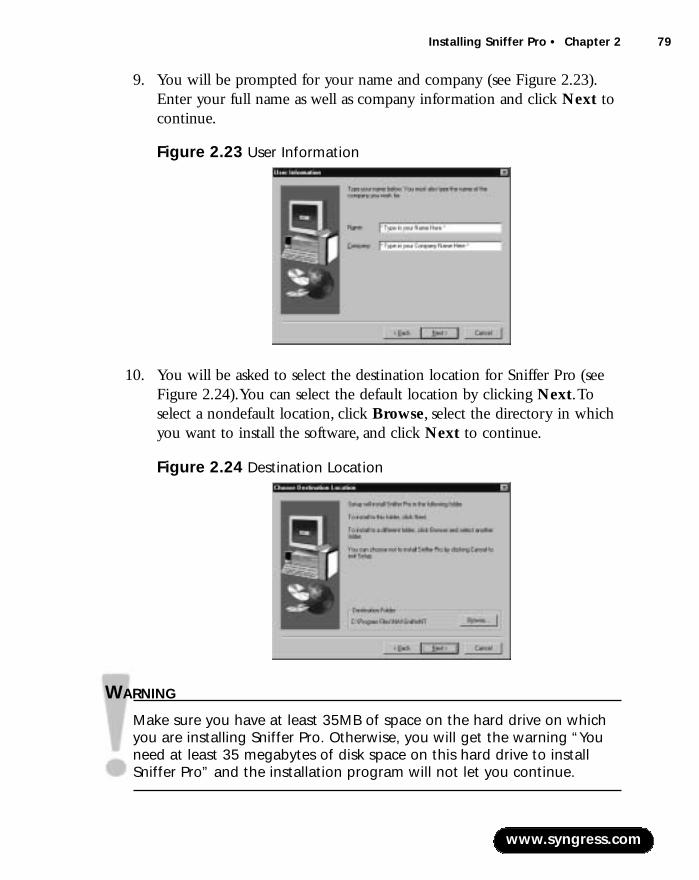
Installing Sniffer Pro • Chapter 2 79
9. You will be prompted for your name and company (see Figure 2.23).Enter your full name as well as company information and click Next tocontinue.
10. You will be asked to select the destination location for Sniffer Pro (seeFigure 2.24).You can select the default location by clicking Next.Toselect a nondefault location, click Browse, select the directory in whichyou want to install the software, and click Next to continue.
WARNING
Make sure you have at least 35MB of space on the hard drive on whichyou are installing Sniffer Pro. Otherwise, you will get the warning “Youneed at least 35 megabytes of disk space on this hard drive to installSniffer Pro” and the installation program will not let you continue.
www.syngress.com
Figure 2.23 User Information
Figure 2.24 Destination Location
219_sniffer_02.qxd 6/28/02 11:48 AM Page 79

80 Chapter 2 • Installing Sniffer Pro
11. The setup program starts copying and installing files on your system.
12. The software displays a screen indicating that Sniffer Pro setup is com-plete (see Figure 2.25). Make sure that the View the Sniffer ProREADME file check box is selected, and click Finish.
13. If you selected the check box in the previous step, the Release Note filefor the Sniffer Pro software will appear on screen (see Figure 2.26).Make sure you review the contents of this file in detail because it con-tains important information about the current release of the Sniffer Prosoftware.You can also print a copy of the Release Note.
www.syngress.com
Figure 2.25 Setup Complete
Figure 2.26 Release Note
219_sniffer_02.qxd 6/28/02 11:48 AM Page 80

Installing Sniffer Pro • Chapter 2 81
14. Close the window when you are finished reading the Release Note.
15. You will be asked if you want to restart your computer (see Figure 2.27).Select Yes, I want to restart my computer now. Ensure that allother applications on your computer have been closed. Click Finish.This step causes your computer to reboot.
NOTE
Version 3.x of Sniffer Pro does not require a serial number to operate.
Installing Sniffer Pro on Other Platforms and HardwareAs stated earlier, Sniffer Pro runs only on Microsoft Windows. Sniffer Pro 3.0 iscompatible with Microsoft Windows 95,Windows 98, and Windows NT 4.0.Version 4.5 is compatible only with Microsoft Windows 98,Windows NT 4.0(with Service Pack 3, 4, 5, or 6a), and Windows 2000. Neither version is compat-ible with Microsoft Windows 3.1,Windows Me, or Windows XP. However,Windows XP support is expected to be available within the next few releases ofthe software.
No support is currently planned for other operating environments such asSolaris or Linux.
www.syngress.com
Figure 2.27 The Computer Restart Screen
219_sniffer_02.qxd 6/28/02 11:48 AM Page 81

82 Chapter 2 • Installing Sniffer Pro
Laptop ConsiderationsAs long as your machine meets the requirements, Sniffer Pro can be installed onmost Intel or compatible laptop and desktop hardware platforms.
NOTE
You may choose to install Sniffer Pro on your personal system. If you doso, you will also see traffic to and from your machine when monitoringthe network and performing captures. This might not be desirable,because you will see your personal network traffic while troubleshootingproblems (e-mail, Web browsing, and so on). If you must use your per-sonal system as the Sniffer Pro machine, you can create a filter to forgocapturing or displaying the network traffic to and from the Sniffer Prosystem itself. Filters are discussed in Chapter 8, “Using Filters.”
The other problem with using Sniffer Pro on your personal system isthat some software applications on your system, such as a VPN client,could interfere with the operation of Sniffer Pro. It is recommended thatyou build a dedicated system for Sniffer Pro, one that has no unneces-sary applications.
A lightweight laptop usually works well for Sniffer Pro because it can easilybe carried around wiring closets and data centers. However, you want to ensurethat the machine is powerful enough to meet Sniffer Pro system requirements.
In some cases, especially on older laptops, you might need to upgrade theBIOS on the laptop to get Microsoft Windows 2000 to function correctly.Workwith laptop’s vendor to ensure that you are using a stable release of the BIOS thatsupports the operating system you are using.
It is also highly recommended that the NICs used on laptops be purchasedfrom NAI.The cards available from NAI are:
■ Network Associates CardBus Ethernet 10/100
■ Network Associates CardBus Ethernet II 10/100
■ Network Associates Token Ring 16/4 CardBus Adapter Mk2
www.syngress.com
219_sniffer_02.qxd 6/28/02 11:48 AM Page 82
Installing Sniffer Pro • Chapter 2 83
NOTE
Sniffer Pro is sometimes used to capture network data that could be con-sidered confidential. This data can include passwords that appear inplain text format on the network. To ensure that the data is safe, keepthe Sniffer Pro laptop in a secure location.
Apple ConsiderationsSniffer Pro is supported in only Microsoft Windows environments. No version ofSniffer Pro works on Apple Macintosh computers.There are no planned releasesfor an Apple platform as of this writing.
Customizing the InstallationCustomized installations of Sniffer Pro can be developed for various applications.Depending on the requirements, you might decide to install Sniffer Pro on a spe-cial type of PC.You can also develop methods of remotely accessing a portableSniffer Pro system.
Configuring Sniffer Pro for Remote AccessAlthough Sniffer Pro was not designed to be accessed remotely, you can easilyconfigure a system for this purpose.To accomplish this goal, you need to installtwo NICs on the Sniffer Pro system. One of the NICs will be used for capturingand monitoring traffic, and the second one will be used purely for management(remote access). Label the NICs accordingly.
On the management NIC, either assign a static IP address or enable it forDHCP.This interface should be accessible from the rest of the network. Installand configure a remote control software application, such as PC Anywhere,VNC,or Carbon Copy, and enable it to listen for connections on the managementinterface.
The NIC you will use for capturing and monitoring does not need a net-work layer address. Configure it with the minimum possible bindings.
Now you can plug the Sniffer Pro system anywhere on the network and usethe remote control software to monitor the network traffic or take captures.Thisconfiguration can be very useful if you need to ship the Sniffer Pro system to a
www.syngress.com
219_sniffer_02.qxd 6/28/02 11:48 AM Page 83
84 Chapter 2 • Installing Sniffer Pro
remote location where you will not be present to start and stop captures. Forexample, you can send this Sniffer Pro system to your Singapore office and havean on-site support person plug the system into the network for you.You can thenuse PC Anywhere from your local office to access the system remotely to captureand monitor traffic on the remote network.
Using a Tablet PC for PortabilityAlthough not a new concept, tablet PCs are becoming increasingly popular.TabletPCs are essentially full-fledged personal computers with touch screens, networkconnections, and speech and handwriting input.Tablet PCs have been gettingsmaller and smaller over time and are highly portable.You might find a tablet PCmuch easier to use in a data center or wiring closet. Generally outfitted withtouch screens, tablet PCs can be much easier to use while you’re standing up in awiring closet than a traditional laptop computer with a keyboard and mouse.
Configuring Network Interfaces and Drivers Sniffer Pro operates by capturing all data from the NIC.To ensure proper andoptimal operation, NIC drivers must be installed and configured correctly.
The Promiscuous NICEach Ethernet card has a Media Access Control (MAC) address associated with it.In its normal mode of operation, a NIC listens for frames addressed to its ownMAC address, any multicast address groups that it belongs to, and the broadcastMAC address.All other frames on the network are ignored.
In promiscuous mode operation, a NIC picks up all frames on a segment,even those that are not addressed to it. Promiscuous mode must be supported bynetwork adapter hardware as well as the software driver installed on the operatingsystem.
Not all NICs support promiscuous mode operation.When you buy a NIC,check its specifications to make sure it supports promiscuous mode. If you are notsure, test it using Sniffer Pro. If all you see is unicast traffic destined to the SnifferPro machine as well as broadcasts and multicasts, the NIC is not running inpromiscuous mode.A list of Sniffer Pro-supported NICs that provide promis-cuous mode functionality is available at www.sniffer.com/services/support/technical-support/faqid.asp?id=327&pCode=SNP. Other NICs that support
www.syngress.com
219_sniffer_02.qxd 6/28/02 11:48 AM Page 84
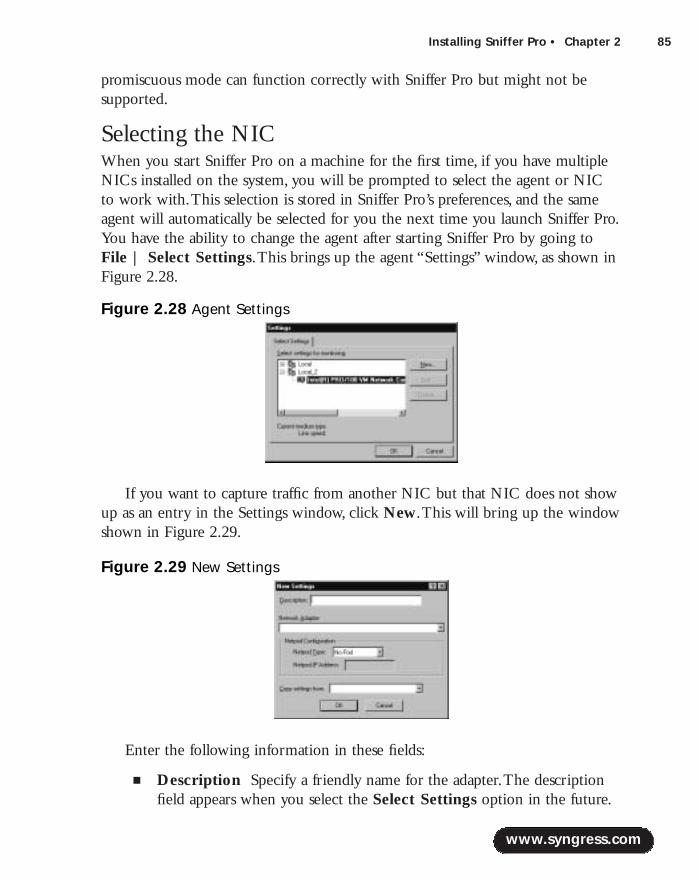
Installing Sniffer Pro • Chapter 2 85
promiscuous mode can function correctly with Sniffer Pro but might not be supported.
Selecting the NICWhen you start Sniffer Pro on a machine for the first time, if you have multipleNICs installed on the system, you will be prompted to select the agent or NICto work with.This selection is stored in Sniffer Pro’s preferences, and the sameagent will automatically be selected for you the next time you launch Sniffer Pro.You have the ability to change the agent after starting Sniffer Pro by going toFile | Select Settings.This brings up the agent “Settings” window, as shown inFigure 2.28.
If you want to capture traffic from another NIC but that NIC does not showup as an entry in the Settings window, click New.This will bring up the windowshown in Figure 2.29.
Enter the following information in these fields:
■ Description Specify a friendly name for the adapter.The descriptionfield appears when you select the Select Settings option in the future.
www.syngress.com
Figure 2.28 Agent Settings
Figure 2.29 New Settings
219_sniffer_02.qxd 6/28/02 11:48 AM Page 85
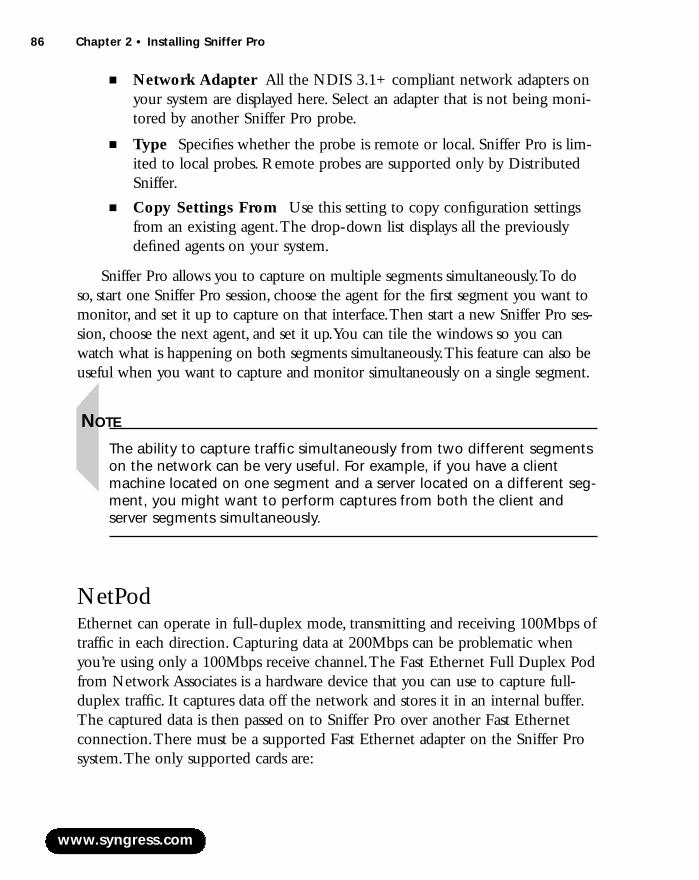
86 Chapter 2 • Installing Sniffer Pro
■ Network Adapter All the NDIS 3.1+ compliant network adapters onyour system are displayed here. Select an adapter that is not being moni-tored by another Sniffer Pro probe.
■ Type Specifies whether the probe is remote or local. Sniffer Pro is lim-ited to local probes. Remote probes are supported only by DistributedSniffer.
■ Copy Settings From Use this setting to copy configuration settingsfrom an existing agent.The drop-down list displays all the previouslydefined agents on your system.
Sniffer Pro allows you to capture on multiple segments simultaneously.To doso, start one Sniffer Pro session, choose the agent for the first segment you want tomonitor, and set it up to capture on that interface.Then start a new Sniffer Pro ses-sion, choose the next agent, and set it up.You can tile the windows so you canwatch what is happening on both segments simultaneously.This feature can also beuseful when you want to capture and monitor simultaneously on a single segment.
NOTE
The ability to capture traffic simultaneously from two different segmentson the network can be very useful. For example, if you have a clientmachine located on one segment and a server located on a different seg-ment, you might want to perform captures from both the client andserver segments simultaneously.
NetPodEthernet can operate in full-duplex mode, transmitting and receiving 100Mbps oftraffic in each direction. Capturing data at 200Mbps can be problematic whenyou’re using only a 100Mbps receive channel.The Fast Ethernet Full Duplex Podfrom Network Associates is a hardware device that you can use to capture full-duplex traffic. It captures data off the network and stores it in an internal buffer.The captured data is then passed on to Sniffer Pro over another Fast Ethernetconnection.There must be a supported Fast Ethernet adapter on the Sniffer Prosystem.The only supported cards are:
www.syngress.com
219_sniffer_02.qxd 6/28/02 11:48 AM Page 86
Installing Sniffer Pro • Chapter 2 87
■ Adaptec Cogent 10/100 Fast Ethernet 21140UC PCI Adapter with theNAI Enhanced Driver
■ Network Associates NAI21140/UC PCI Fast Ethernet Adapter with theNAI Enhanced Driver
■ Xircom CBE2-100BTX CardBus Adapter with the NAI EnhancedDriver
■ Network Associates CardBus Ethernet II 10/100 Adapter with the NAIEnhanced Driver
NOTE
For more information on the Fast Ethernet Full Duplex Pod or to pur-chase one, contact your local NAI representative or reseller.
To configure the Fast Ethernet Pod in Sniffer Pro, select File | SelectSettings. Click the New button to define a new local agent that works with theFast Ethernet Full Duplex Pod. In the Network Adapter field, select the NICthat is attached to the Fast Ethernet Full Duplex Pod. From the NetPod Type,select Full Duplex Pod. Under NetPod IP Address, enter an IP address that isincremented by one from the IP address configured on the Sniffer Pro system’snetwork adapter. For example, if you configured 192.168.1.1 on the Sniffer Pronetwork adapter, you must configure 192.168.1.2 for the NetPod IP address. Forthe NetPod to work properly,TCP/IP must be installed on the Sniffer Prosystem.The Full Duplex Pod requires a static IP address, so DHCP should be dis-abled. Click OK to complete agent installation. Once you have configured theFull Duplex Pod and selected the agent, you are ready to capture data.
NOTE
The current release of Sniffer Pro supports only a local connection to theFull Duplex Pod. You cannot connect to pods over the network.
www.syngress.com
219_sniffer_02.qxd 6/28/02 11:48 AM Page 87

88 Chapter 2 • Installing Sniffer Pro
Replacing DriversAlthough Sniffer Pro can be used with any NDIS 3.1+ compliant NIC, it ishighly recommended that you use network cards from Network Associates. NAIprovides enhanced drivers for these network cards, allowing for optimum opera-tion of Sniffer Pro.The following sections describe the process of replacing stan-dard NIC drivers with NAI’s enhanced drivers.
Standard NDIS Drivers and IssuesThe use of standard NDIS drivers with Sniffer Pro is not recommended. If youare using a supported NIC, you should use the enhanced drivers that come withthe Sniffer Pro software.These drivers are optimized for Sniffer Pro and havelarge buffer sizes. Sniffer Pro could experience unstable behavior if you use non-NAI NDIS drivers on a highly utilized network.
NOTE
If you’re using incompatible drivers, you might experience a problemwhen you try to select an agent. You could find that the system will notdisplay the network adapter at all under the agent settings. You mightalso find that the system operates with the agent but is unstable.
Furthermore, Sniffer Pro will be unable to view physical layer errors (such asCRC and alignment errors) unless you are using a supported NIC and theenhanced NAI driver. Most NICs and NIC drivers are designed to discard frameswith physical layer errors, so these errored frames are never passed on to thehigher layers.The NAI driver is written specifically to pass errors up beyond theNDIS layer, allowing Sniffer Pro to capture and display these frames.
Sniffer Pro Network DriversNAI’s enhanced drivers come with Sniffer Pro.These drivers were created specif-ically with Sniffer Pro in mind and therefore provide advanced performance andfeatures.The drivers pass all network frames to Sniffer Pro without discardingthem.
www.syngress.com
219_sniffer_02.qxd 6/28/02 11:48 AM Page 88

Installing Sniffer Pro • Chapter 2 89
NAI Enhanced Drivers for Windows 2000The first release of Sniffer Pro to support Windows 2000 is version 4.5.With thisrelease of software, NAI provides enhanced drivers for Windows 2000 for theXircom (CBE, CBE2) and Madge (20-03) CardBus network adapters only.Enhanced drivers for other network adapters are not available for Windows 2000.To install the NAI enhanced drivers, perform the following steps:
1. Turn off the laptop.
2. Insert the Xircom or Madge adapter into an available slot.
3. Power on the PC and let Windows 2000 boot up.Windows 2000 willdetect the new hardware.
4. Follow the steps in the Windows 2000 Upgrade Device Wizard to loadthe driver.
5. Restart the computer if you are prompted to do so.
6. Install the Sniffer Pro software and restart the PC.
7. Right-click the My Computer icon and select Properties.
8. Select the Hardware tab.
9. Click Device Manager.
10. Expand Network Adapters.
11. Right-click Xircom CardBus Ethernet 10/100 (for the Xircom card)or Madge 16/4 CardBus Adapter Mk2 (for the Madge card) andselect Properties.
12. Select the Driver tab.
13. Click Update Driver.
14. In the Upgrade Device Driver Wizard, click Next.
15. Select Display a list of known drivers for this device so that Ican choose a specific driver and click Next.
16. Select Have Disk.
17. Browse to C:\Program Files\NAI\SnifferNT\Driver\Xircom\Win2K (for the Xircom card) or C:\Program Files\NAI\SnifferNT\Driver\TRMadge\Win2K (for the Madge card) and click OK.
www.syngress.com
219_sniffer_02.qxd 6/28/02 11:48 AM Page 89
90 Chapter 2 • Installing Sniffer Pro
18. Select Network Associates CardBus Ethernet II 10/100 (for theXircom Card) or Network Associates 16/4 CardBus Adapter Mk2(for the Madge card) and click Next.
19. Click Next again to continue.
20. You will see the message “Digital Signature Not Found.” Click Yes.
21. Click Finish, and restart the PC.
NOTE
The enhanced drivers are available in the directory where you haveinstalled Sniffer Pro as well as on the Sniffer Pro CD-ROM. If you werenot provided with a CD-ROM, please contact your local NetworkAssociates representative or reseller.
Removing Previously Installed PnP Network Drivers on Windows 98Previously installed drivers should be removed before installing the NAIenhanced drivers in Windows 98.To remove drivers, follow these steps:
1. Uninstall all previous versions of Sniffer Pro and restart the PC.
2. Go to Start | Settings | Control Panel.
3. Double-click the Network icon.
4. Select the Configuration tab.
5. In the list box at the top, select the network adapter and click Remove.
6. Click OK. Do not restart the PC at this time.
7. Install Sniffer Pro.
8. When prompted to do so, select Yes to make NAI enhanced driversavailable to the operating system.
9. Restart the PC.
10. Windows Plug and Play will automatically detect and install the newdrivers. Configure the TCP/IP settings of the network interface card.
www.syngress.com
219_sniffer_02.qxd 6/28/02 11:48 AM Page 90

Installing Sniffer Pro • Chapter 2 91
Disabling Unnecessary Services on Ethernet Adapters Attached to PodsIf default bindings are left in place,Windows NT and Windows 2000 can gen-erate large amounts of unnecessary broadcast traffic.This broadcast traffic cancause significant performance degradation if the Ethernet adapter is being used tocommunicate with a pod.To prevent this issue from occurring, it is important todisable all unnecessary services on the Ethernet adapters attached to pods.
To disable these services in Windows NT:
1. Go to Start | Settings | Control Panel.
2. Double-click the Network icon.
3. Select the Bindings tab.
4. Select show bindings for all adapters.
5. Select the appropriate network adapter.
6. Disable all bindings except TCP/IP and Sniffer Driver.
7. Reboot the PC for the changes to take effect.
To disable these services in Windows 2000:
1. Go to Start | Settings | Control Panel.
2. Double-click the Network and Dial-Up Connections icon.
3. Right-click the appropriate connection and select Properties.
4. Unselect all the check boxes except TCP/IP and Sniffer Driver.
5. Reboot the PC for the changes to take effect.
The Ethernet adapter attached to a pod should be configured with a static IPaddress and no default gateway. If a default gateway is configured,Windows willperiodically send ARP messages directed toward the gateway IP.
Changing Network Speeds After Starting Sniffer ProWhen using network adapters that support multiple speeds (such as 10Mbps and100Mbps for Ethernet or 4Mbps and 16Mbps for Token Ring), Sniffer Pro mightnot always function correctly when you change network speeds. It is best torestart the Sniffer Pro system each time you change the network speed.TheMadge Token Ring adapter defaults to 16Mbps. If you are using 4Mbps, you
www.syngress.com
219_sniffer_02.qxd 6/28/02 11:48 AM Page 91

92 Chapter 2 • Installing Sniffer Pro
need to change the Ring Speed setting in the driver.You can modify the speedby selecting the properties for the NIC.
Enhancing Capture PerformanceCapture performance can be improved a number of ways. It is highly recom-mended that you use NAI enhanced drivers for capturing.The drivers are opti-mized for performance. Setting the capture rate to High—No CPU Throttling isanother method to enhance capture performance.The driver’s receive buffer sizeshould be set to the maximum possible value.The capture buffer size should alsobe set to the maximum possible value, based on the amount of RAM installed onthe Sniffer Pro PC.You should never set the buffer size to more than half theRAM installed on your system.
NOTE
Make sure you have enough RAM and processing power so that you donot crash the Sniffer Pro machine. Low memory will cause the system tostart swapping to disk, which will slow performance significantly. In theworst case, the Sniffer Pro system will hang or crash if it does not havethe physical memory necessary to perform a capture. This is not some-thing you want happening to you when you are in the middle of trou-bleshooting an important issue on the network.
If live expert analysis is not a requirement, the real-time expert can be turnedoff. Go to Tools | Expert Options. Select the Objects tab, and deselect theExpert During Capture option. If live expert analysis is required, you canimprove performance by turning off analysis of protocols that are not needed ornot present on your network.To do this, go to Tools | Expert Options. Selectthe Protocols tab, and change the value in the Analyze column to No for eachprotocol for which Expert Analysis is not required.
The router expert analyzes only RIPv1 traffic. If you are running RIPv2 orother routing protocol on the network, you can also turn this feature off to saveprocessor cycles.To do this, go to Tools | Expert Options. Select the RIPOptions tab. Click the first drop-down menu box, and change it from Fulltraffic analysis to No traffic analysis.
www.syngress.com
219_sniffer_02.qxd 6/28/02 11:48 AM Page 92

Installing Sniffer Pro • Chapter 2 93
Enhancing General System PerformanceSniffer Pro performance can be improved by upgrading RAM on the system.This allows the machine to process large amounts of data in memory withouthaving to swap to disk. Capture files can often be large and require large amountsof memory to be opened and analyzed. Upgrading the CPU on a system can alsohelp improve performance. Processing of large traces and expert analysis requiresmore CPU power.
Notebook Resource ProblemsSome notebook computers can experience resource problems when loading theNAI enhanced drivers (Xircom or Madge). In order to allow the card to workacross many notebooks, the receive buffer size is reduced by default. Capture per-formance can be improved by setting the receive buffer size to the maximumpossible setting that still allows the NIC to function.
www.syngress.com
Sniffer Pro PerformanceThe more traffic you capture, the faster and beefier your Sniffer Prosystem should be. An ideal Sniffer Pro system has a processor with thehighest possible speed and at least 512MB of RAM. If the memory isn’tlarge enough, the system will start swapping to disk and become useless.
The NIC used should be one recommended by NAI and must sup-port the NAI enhanced drivers. This will achieve the largest possiblebuffer size. A few gigabytes of hard drive space should be available forcapture files. If capturing to disk, hard drive performance is an impor-tant factor, so use a drive with low average seek time.
The system OS should be further optimized. The swap file for thesystem should be at least one-and-a-half times the physical memory. Ifpossible, to improve performance, the swap file should be placed on adifferent hard drive than the capture file.
For maximum stability, Sniffer Pro should be installed on a dedicatedsystem so that other applications do not cause the machine to crash.
Configuring & Implementing…
219_sniffer_02.qxd 6/28/02 11:48 AM Page 93
94 Chapter 2 • Installing Sniffer Pro
If you experience trouble loading the Xircom or Madge drivers, you can tryto reduce the Receive Buffer Size setting. Changing this setting to the minimumvalue resolves the issue in most cases.
The key is to set the Receive Buffer size to the maximum possible value thatstill allows the NIC drivers to load. Experiment with it to determine the optimalvalue on your system.
To set the receive buffer size in Windows 98:
1. Go to Start | Settings | Control Panel.
2. Double-click the Network icon.
3. Select the Configuration tab.
4. In the list box at the top, select the network adapter and clickProperties.
5. Select the Advanced tab.
6. In the Property list box, select Receive Buffer Size and change thevalue.
To set the receive buffer size in Windows NT:
1. Go to Start | Settings | Control Panel.
2. Double-click the Network icon.
3. Select the Adapter tab.
4. Select the network adapter and click Properties.
5. Set the Receive Buffer Size value.
To set the receive buffer size in Windows 2000:
1. Go to Start | Settings | Control Panel.
2. Double-click the Network and Dial-Up Connections icon.
3. Right-click the appropriate connection and select Properties.
4. Click Configure.
5. Select the Advanced tab.
6. Set the Receive Buffer Size value.
www.syngress.com
219_sniffer_02.qxd 6/28/02 11:48 AM Page 94
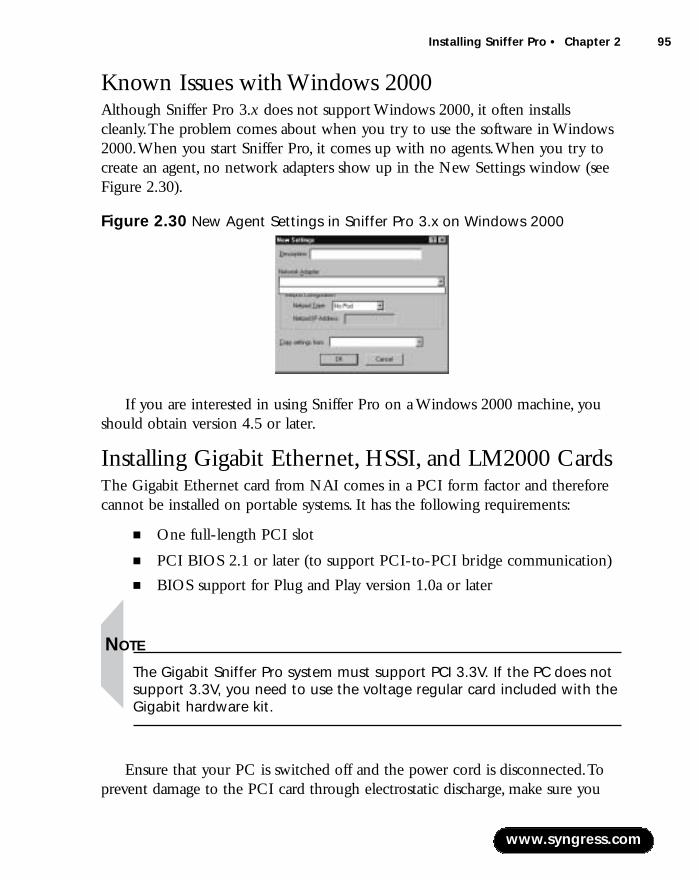
Installing Sniffer Pro • Chapter 2 95
Known Issues with Windows 2000Although Sniffer Pro 3.x does not support Windows 2000, it often installs cleanly.The problem comes about when you try to use the software in Windows2000.When you start Sniffer Pro, it comes up with no agents.When you try tocreate an agent, no network adapters show up in the New Settings window (seeFigure 2.30).
If you are interested in using Sniffer Pro on a Windows 2000 machine, youshould obtain version 4.5 or later.
Installing Gigabit Ethernet, HSSI, and LM2000 CardsThe Gigabit Ethernet card from NAI comes in a PCI form factor and thereforecannot be installed on portable systems. It has the following requirements:
■ One full-length PCI slot
■ PCI BIOS 2.1 or later (to support PCI-to-PCI bridge communication)
■ BIOS support for Plug and Play version 1.0a or later
NOTE
The Gigabit Sniffer Pro system must support PCI 3.3V. If the PC does notsupport 3.3V, you need to use the voltage regular card included with theGigabit hardware kit.
Ensure that your PC is switched off and the power cord is disconnected.Toprevent damage to the PCI card through electrostatic discharge, make sure you
www.syngress.com
Figure 2.30 New Agent Settings in Sniffer Pro 3.x on Windows 2000
219_sniffer_02.qxd 6/28/02 11:48 AM Page 95
96 Chapter 2 • Installing Sniffer Pro
are reliably grounded. Install the PCI card in an available slot on the system.Youcan now install the software driver for this card.
The HSSI adapter and the LM2000 adapter, purchased from NAI, are used tocapture wide area network (WAN) traffic.The HSSI adapter is used to capturetraffic from high-speed serial interfaces and can support full-duplex data rates upto 52Mbps.The LM2000 adapter is used for low-speed WAN interfaces. Bothcards support the following encapsulations:
■ SDLC
■ X.25
■ Frame Relay
■ PPP
■ Cisco HDLC
■ Other router/bridge (used for proprietary versions of HDLC)
■ SMDS/XDI
The HSSI adapter requires an available PCI slot in the Sniffer Pro system.It is a Plug and Play card, so no configuration is required on the card itself.Afteryou install the hardware, you can install the software driver and use Sniffer Pro tocapture data.
The LM2000 adapter requires an available ISA slot in the Sniffer Pro system.It is not a Plug and Play card. DIP switches must be used to manually configurethe interrupt number and I/O base address values that should be assigned to thecard.The LM2000 NIC has two connectors:
■ A 25-pin, D-type receptacle connector (DB-25), used for RS-232 net-work interfaces
■ A 15-pin, D-type receptacle connector (DB-15), used for RS-422 andRS-423,V.10,V.11, and V.35 network interfaces
After installing the LM2000 adapter in the system using a free interruptnumber and I/O base address, you can install the software driver for the card anduse Sniffer Pro to capture data.
www.syngress.com
219_sniffer_02.qxd 6/28/02 11:48 AM Page 96
Installing Sniffer Pro • Chapter 2 97
Troubleshooting the InstallationProblems with a Sniffer Pro installation can occur with installation of the soft-ware itself or the enhanced NAI drivers.The next few sections discuss how totroubleshoot failed installations. If you have purchased maintenance on yourSniffer Pro product, you can contact the NAI customer service center and gethelp installing your software.
Failed Installation Sniffer Pro installs cleanly on most systems. If the installation fails, the problemcould be one of the following:
■ Minimum hardware or software requirements not met Makesure you go through the list of hardware and software requirementsagain. Ensure that you are using supported hardware and software andthat your operating system and service pack level are also supported. Inaddition, check to see if the correct version of Internet Explorer and allnecessary components are loaded on the system.
■ Unstable or incompatible hardware Try another system to see if theproblem goes away. If possible, try a PC from a different vendor to see ifthat works. Furthermore, try different NICs from different vendors.
■ Unstable or incompatible operating system build Make sure thatthe base operating system on the system is stable and without problems.Confirm that the appropriate service packs and patches are installed.Tryinstalling a different operating system.
If you are upgrading from an older version of the software, make sure thatyou uninstall and purge all data from the previous release. If the upgrade is stillunsuccessful, you might want to reinstall the operating system and start fresh.
Drivers Not InstallingIf you have problems installing the drivers, ensure that the NIC is installed andseated correctly in the system. Make sure you have the latest version of thedrivers and that they are for the correct model of the network adapter.Tryinstalling the NIC on another system to make sure it is fully operational. If youhave two network cards on a system and the primary one is failing, try using thesecondary NIC that is already installed and functional on the system.
www.syngress.com
219_sniffer_02.qxd 6/28/02 11:48 AM Page 97

98 Chapter 2 • Installing Sniffer Pro
In some cases, you might even find that although the driver seemed to installcorrectly, it is not picking up any traffic.Try modifying the settings on the driversthemselves. If you’re using Windows 95,Windows 98, or Windows 2000, use thesystem’s Device Manager tool to ensure that there are no resource conflicts. Usethe Microsoft troubleshooting wizards to help you, if necessary.You might needto disable other devices on the system to get the interrupt requests (IRQs) andmemory interrupts needed to install the network card drivers.
If you’re using an NAI enhanced driver, make sure that you have the correctmodel NIC as specified by Network Associates.
Installing on the Wrong PlatformSniffer Pro will not function correctly if installed on an unsupported platform.Check the “System Requirements” section of this chapter to ensure that you areusing a supported OS.As mentioned previously in the chapter, Sniffer Pro 4.5operates only on:
■ Microsoft Windows 98
■ Microsoft Windows NT 4.0 (with Service Pack 3, 4, 5, or 6a)
■ Microsoft Windows 2000
Error MessagesYou might receive the following error message after installing the NAI Xircomdriver and rebooting your machine:
Service Control Manager: "At least one service or driver failed during
system startup. Use Event Viewer to examine the event log for
details."
NT Event Viewer, System log: "CBE1 : Has encountered a conflict in
resources and could not load. CBE1 : There is a memory conflict
at address 0x0000000005B80000."
To resolve this issue, you should change the memory address setting using thefollowing steps:
1. Access the network adapter properties.
2. Change the Memory Address setting for the Xircom driver (cbe.sys)from 0x5B80000 to 0xD4000.
www.syngress.com
219_sniffer_02.qxd 6/28/02 11:48 AM Page 98

Installing Sniffer Pro • Chapter 2 99
Failing to Delete Sniffer.ini on an UpgradeEach release of Sniffer Pro is a complete version of the software. If you are per-forming an upgrade, in order for the new software to run correctly, you must com-pletely remove the previous version before installing the new version.The first step isto remove the older version using Control Panel | Add/Remove Programs.After uninstalling the old version, make sure you delete the SNIFFER.INI file.Deleting this file purges local settings and prevents compatibility problems that canoccur.The file is located under C:\WINDOWS in Windows 95 and Windows 98and under C:\WINNT in Windows NT and Windows 2000.
Deletion of the registry keys from the previous version of Sniffer Pro is alsorecommended before installing the new version:
1. Go to Start | Run and type REGEDIT.The registry editor starts.
2. Browse to HKEY_LOCAL_MACHINE | SOFTWARE.
3. If you have no other Network Associates software installed, it is safe todelete the Network Associates and Network Associates, Inc. reg-istry keys.
4. Reboot your PC and install the new version of Sniffer Pro.
Building a Technician Tool KitA network analyst should create a tool kit with all the parts necessary to trou-bleshoot problems.This tool kit might include a laptop with Sniffer Pro, somestraight-through and cross-over cables, and a mini-hub. It is also a good idea tocarry some standard networking tools such as an RJ-45 crimper, a punch-downtool, some screwdrivers, and a toner/probe.
NOTE
Toners and probes are used together to troubleshoot cabling problems.The toner generates a special signal on the cable to which it is attached.The probe listens for the signal, and when its tip is in close proximity tothe cable, makes a sound. The closer the tip is to the cable, the louderthe sound. This feature can be extremely useful when you have a cablehidden behind a wall or when you need to isolate a single cable in agroup of cables clustered together. You can attach the toner to theknown end and set it to generate the signal. Then you can sweep theprobe across all the potential far ends and listen for the tone.
www.syngress.com
219_sniffer_02.qxd 6/28/02 11:48 AM Page 99
100 Chapter 2 • Installing Sniffer Pro
You should also carry spare parts in your tool kit if you can.These parts couldinclude some extra NICs and RJ-45 connectors.
The Sniffer Pro software comes with a Sniffer Pro Quick Reference Guide, afoldout card with information that you might need quick access to. Keep thiscard with your toolkit. Network diagrams, IP addressing documentation, andother such notes should also be easily accessible to help you troubleshoot prob-lems quickly.
NOTE
Very often, a network analyst will show up at the wiring closet to mon-itor and capture traffic from a machine that is attached to a switch, onlyto find that there aren’t any available ports to plug the Sniffer Prosystem into! Even worse, the switch might be unmanaged, with no wayto mirror a port. This is where the toolkit comes in handy. You can “hubout” using your mini-hub and cables.
Simply attach a mini-hub using a cross-over cable into the switchport where the machine you want to analyze was plugged in. Now plugboth Sniffer Pro and the machine to be analyzed into the mini-hub.
This solution works well on half-duplex Ethernet networks. However,if you are using full-duplex connections, you must use the Full DuplexPod.
www.syngress.com
219_sniffer_02.qxd 6/28/02 11:48 AM Page 100
Installing Sniffer Pro • Chapter 2 101
SummaryInstalling Sniffer Pro is not a challenging task. If your system meets the hardwareand software requirements, generally you will not face any installation issues.Sniffer Pro uses the standard InstallShield Wizard software for installation. SnifferPro 4.x requires a serial number and registration. Sniffer Pro 3.x does not. Eachversion of Sniffer Pro comes with a Release Note, which discusses the issues par-ticular to that version of the software.
Promiscuous mode network cards and drivers should be used to capturetraffic. Otherwise, the Sniffer Pro system sees only frames that are destined for it.To gain the most out of your Sniffer Pro system, an NAI-supported NIC withNAI enhanced drivers should be installed.These drivers are optimized for usewith Sniffer Pro and provide the best capture performance as well as the abilityto monitor physical layer errors.
Once Sniffer Pro is installed, you are ready to move on to the next step:learning how to use the user interface.
Solutions Fast Track
Installing Sniffer Step by Step
! The Sniffer Pro software can be obtained on a CD-ROM ordownloaded from the NAI Web site.
! Ensure that your system meets the minimum requirements beforeinstalling the Sniffer Pro software. Depending on the version of Sniffer Proyou are using, it will run on only certain Microsoft Windows platforms.
! Sniffer Pro 4.x installation requires a serial number.This serial numbershould have been provided to you when you purchased the product.
! It is important to read the latest Release Note that came with yourSniffer Pro software.Among other things, it contains driver information,known issues, and contact information for NAI.
Customizing the Installation
! You can design a remotely accessible Sniffer Pro system by installing twoNICs on it. Using one of the NICs for monitoring and capturing and
www.syngress.com
219_sniffer_02.qxd 6/28/02 11:48 AM Page 101
102 Chapter 2 • Installing Sniffer Pro
the other one for remote management, you can use remote controlsoftware to access the Sniffer Pro system remotely.
! Tablet PCs are becoming increasingly popular and are generally moreportable than traditional laptop systems with keyboards and mice. Forhigher levels of portability, you can install Sniffer Pro on a tablet PCwith an Ethernet interface.
Configuring Network Interfaces and Drivers
! Sniffer Pro requires a NIC that can operate in promiscuous mode.
! Default NDIS drivers do not provide the performance and stability thatenhanced NAI drivers do. Enhanced NAI drivers are available only forcertain NICs as recommended by NAI.
! NAI’s enhanced drivers are designed to pass physical layers to the SnifferPro software.
! The Fast Ethernet Full Duplex Pod can be used to capture full-duplextraffic off the network.
! For highest levels of capture performance, maximize the amount ofphysical memory and processor speed on the Sniffer Pro system.You canalso turn off the real-time expert as well as router expert capabilities ifyou do not need these features.
Troubleshooting the Installation
! Sniffer Pro should be installed on only one of the supported operatingsystems.You should check to make sure that the system meets all theminimum requirements.
! Before installing a new version of Sniffer Pro, any older version must becompletely uninstalled.All .INI files and registry settings associated withthe older version of the software must be removed manually beforeinstalling the new version.
! A technician’s tool kit can be very useful for troubleshooting problems.This toolkit can consist of straight-through and cross-over cables, a mini-hub, an RJ-45 crimper, a punch-down tool, some screwdrivers,and a toner.
www.syngress.com
219_sniffer_02.qxd 6/28/02 11:48 AM Page 102
Installing Sniffer Pro • Chapter 2 103
! Hubs can come in handy when you want to use Sniffer Pro to capturetraffic between a host and other parts of the network.
! Along with your technician’s tool kit, network diagrams, anddocumentation, the Sniffer Pro quick reference guide can also be useful.Always keep these items handy.
Q: What Sniffer Pro support options are available from Network Associates?
A: Network Associates provides a number of support offerings through itsPrimeSupport program. PrimeSupport KnowledgeCenter provides access tothe Network Associates knowledge base on the Web and e-mail responseswithin two business days. It also includes software upgrades. PrimeSupportConnect offers these features as well as unlimited toll-free telephone accessduring business hours. Calls are answered within three minutes, and responseis within one business day. PrimeSupport Priority extends this level of sup-port to unlimited toll-free telephone access 24 hours a day, seven days aweek.This option extends support beyond business hours for critical needs. Ifyou would like a personalized support program, Network Associates alsooffers PrimeSupport Enterprise.As a part of this program, you will beassigned a technical support engineer from the Enterprise support team.Thisoption has a number of other advantages, such as beta participation, volumeawards, and theft protection for Sniffer Pro systems.
Q: Does NAI recommend a particular brand or model of laptop on which torun Sniffer Pro?
A: No. Unlike the older DOS versions of Sniffer, NAI recommends no particularbrand or model of system for Sniffer Pro. Use your best judgment to buy astable and high-performance machine.
www.syngress.com
Frequently Asked Questions
The following Frequently Asked Questions, answered by the authors of this book,are designed to both measure your understanding of the concepts presented in this chapter and to assist you with real-life implementation of these concepts. Tohave your questions about this chapter answered by the author, browse towww.syngress.com/solutions and click on the “Ask the Author” form.
219_sniffer_02.qxd 6/28/02 11:48 AM Page 103
104 Chapter 2 • Installing Sniffer Pro
Q: Can I connect to Sniffer Pro from a remote PC, using the Distributed SnifferPro console?
A: No. Sniffer Pro is standalone software and cannot be accessed using theDistributed Sniffer Pro console.To control a Sniffer Pro system remotely, youcan install remote control software such as PC Anywhere,VNC, or CarbonCopy.
Q: Does Sniffer Pro provide RMON capabilities?
A: Although Sniffer Distributed provides RMON capabilities, Sniffer Pro LANhas no RMON features. Even if you build your own remotely accessibleSniffer Pro system using two network interface cards on a PC, you will notbe able to use RMON to poll network statistics off the system.
Q: I am considering purchasing a laptop to use in my protocol analysis techni-cian toolkit for easy travel.Are there specific things to look for, or moreimportant, look out for?
A: Yes.You might want to investigate your version of Sniffer Pro thoroughly,understand its minimum requirements, and think deeply about what you willbe doing with this laptop. If you are running Windows 2000, you need tomake sure that you have a compatible version of Sniffer Pro.You also need togo to the vendor’s Web site, check the NIC (PCMCIA card), and verify thatit is compatible with Sniffer Pro.You should also make sure that the hardwarecomponents are well above the bare minimum requirements, paying closeattention to CPU speed, memory, and hard disk storage.You will not want toinvest in an expensive laptop without thoroughly checking to make sure thatit is exactly what you need.
www.syngress.com
219_sniffer_02.qxd 6/28/02 11:48 AM Page 104
Exploring theSniffer Pro Interface
Solutions in this chapter:
■ Exploring the Dashboard
■ Understanding Menus
■ Understanding the Toolbars
■ Miscellaneous Sniffer Pro Tools
■ The Expert
■ Graphs, Charts, and Maps
■ Using the Address Book
Chapter 3
105
! Summary
! Solutions Fast Track
! Frequently Asked Questions
219_sniffer_03.qxd 6/28/02 11:49 AM Page 105
106 Chapter 3 • Exploring the Sniffer Pro Interface
IntroductionThe Sniffer Pro interface can be perceived as either a joy or a nightmare to use.The interface seems simplistic at first glance, but as we drill down into it, you willsee that it is much more complex than you might think.There is a great deal ofmaterial to look at; the various options contain incredibly helpful and importanttools.Within this chapter, we look at all the troubleshooting tools, options,menus, dialog boxes, and toolbars Sniffer Pro offers.
As we explore the Sniffer Pro interface, keep in mind that there could beslight redundancy in what you see. For instance, the File menu might have someof the same options as the toolbar. One is viewable with graphics and the other isa simple menu, but both will get you the result you need.
In learning how to use this interface, the focus is not only for you to masterthe navigation of the product, but to achieve two other goals as well. Knowingthe interface is a large part of becoming a Sniffer Certified Professional (SCP),and knowing the interface and learning it well only make the following chapterseasier to work through as we delve more deeply into Sniffer Pro and begin to usefilters and capture data.
Exploring the DashboardNot too long ago, network analyzers operated using text-based interfaces. In con-trast, Sniffer Pro is a graphical user interface (GUI) network analyzer thatincludes a DHTML-based Dashboard.When you start Sniffer Pro LAN for thefirst time, the Dashboard should appear on the screen. If you close the Dashboardwindow, you can start it again by selecting Monitor | Dashboard or byclicking the Dashboard icon in the Sniffer Pro toolbar.
Real-Time StatisticsThe Sniffer Pro Dashboard consists of the following elements, all of which can beused to provide real-time information:
■ Gauges that display utilization and error statistics
■ A Detail tab that displays a tabular view with detailed statistics on net-work utilization, size distribution, and errors
■ Topology-specific tabs that display tabular views with detailed statistics
■ Customizable graphs that show network utilization, errors, and size distribution
www.syngress.com
219_sniffer_03.qxd 6/28/02 11:49 AM Page 106
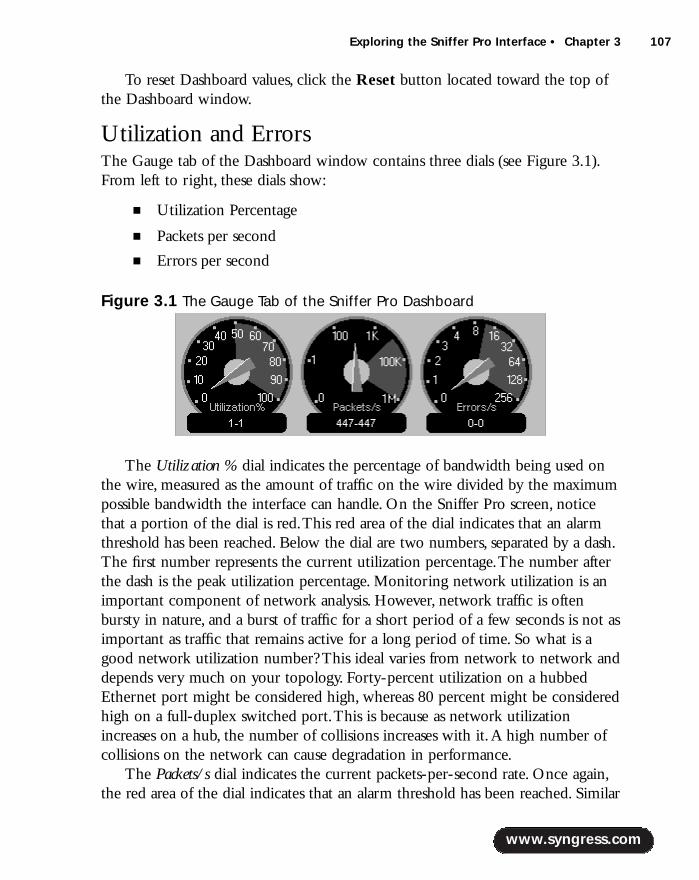
www.syngress.com
To reset Dashboard values, click the Reset button located toward the top ofthe Dashboard window.
Utilization and ErrorsThe Gauge tab of the Dashboard window contains three dials (see Figure 3.1).From left to right, these dials show:
■ Utilization Percentage
■ Packets per second
■ Errors per second
The Utilization % dial indicates the percentage of bandwidth being used onthe wire, measured as the amount of traffic on the wire divided by the maximumpossible bandwidth the interface can handle. On the Sniffer Pro screen, noticethat a portion of the dial is red.This red area of the dial indicates that an alarmthreshold has been reached. Below the dial are two numbers, separated by a dash.The first number represents the current utilization percentage.The number afterthe dash is the peak utilization percentage. Monitoring network utilization is animportant component of network analysis. However, network traffic is oftenbursty in nature, and a burst of traffic for a short period of a few seconds is not asimportant as traffic that remains active for a long period of time. So what is agood network utilization number? This ideal varies from network to network anddepends very much on your topology. Forty-percent utilization on a hubbedEthernet port might be considered high, whereas 80 percent might be consideredhigh on a full-duplex switched port.This is because as network utilizationincreases on a hub, the number of collisions increases with it.A high number ofcollisions on the network can cause degradation in performance.
The Packets/s dial indicates the current packets-per-second rate. Once again,the red area of the dial indicates that an alarm threshold has been reached. Similar
Exploring the Sniffer Pro Interface • Chapter 3 107
Figure 3.1 The Gauge Tab of the Sniffer Pro Dashboard
219_sniffer_03.qxd 6/28/02 11:49 AM Page 107

108 Chapter 3 • Exploring the Sniffer Pro Interface
to the utilization dial, the current packet-per-second rate and the peak packet-per-second rate are displayed below the dial. Packets per second can help derivevaluable information about the type of traffic on your network. For example, ifthe network utilization is high and the packets-per-second value is relatively low,this is an indication of larger frame sizes on the network. If network utilization ishigh and the packets-per-second value is also high, this indicates the presence ofsmaller frame sizes.You can obtain detailed information on frame sizes by lookingat size distribution statistics.
NOTE
Packets per second is an important statistic. Take the case of a clientmachine and a server machine, each sitting in a different VLAN. All trafficbetween them flows through a router. If the server is generating morepackets per second than the router can handle, packets will be dropped.You should check for high CPU utilization and buffer misses on therouter to see if packets are being dropped.
The Errors/s dial is similar to the other two dials.The red zone indicates analarm threshold has been reached.The values below the dial show the currentand peak error rates. Not all errors indicate a problem on the network. Collisions,for example, are a normal part of Ethernet operation. However, too many ofthem can indicate a problem.
When monitoring an Ethernet network, you can get detailed statistics aboututilization, packets per second, and errors by clicking the Detail tab. Doing sowill display a tabular view with detailed statistics (see Figure 3.2).
The Network section of the Detail tab includes the following:
■ Packets The total number of packets on the wire.
www.syngress.com
Figure 3.2 The Detail Tab of the Sniffer Pro Dashboard
219_sniffer_03.qxd 6/28/02 11:49 AM Page 108

Exploring the Sniffer Pro Interface • Chapter 3 109
■ Drops The number of packets Sniffer Pro dropped (possibly becausethe system could not keep up with the packet rate).
■ Broadcasts The number of broadcast frames seen by Sniffer Pro.Remember that all computers in a subnet or VLAN must process allbroadcast packets. Excessive broadcasts can degrade the performance ofall systems on the network.
■ Multicasts The number of multicast frames seen by Sniffer Pro.Although multicast frames affect a smaller group of devices on the net-work than do broadcasts, large quantities of multicast traffic can alsocause throughput issues.
■ Bytes The total number of bytes seen by Sniffer Pro. Multiply thisnumber by 8 to get the number of bits.
■ Utilization The current percentage utilization rate.
■ Errors The total number of errors.
The Size Distribution section provides a breakdown of the various packet sizes(including the 4-byte CRC) seen on the network:
■ Total number of packets 64 bytes in size
■ Total number of packets from 65 to 127 bytes in size
■ Total number of packets from 128 to 255 bytes in size
■ Total number of packets from 256 to 511 bytes in size
■ Total number of packets from 512 to 1023 bytes in size
■ Total number of packets from 1024 to 1518 bytes in size
Smaller packets require more processing than larger packets for the sameamount of data.They also use extra bandwidth because they contain additionaloverhead (headers and trailers). For example, assume that a host needs to transfer8192 bytes of data. Using 1518-byte Ethernet II packets (18 bytes are used forthe header and trailer, leaving 1500 bytes for the data portion), it would take sixframes to transfer this data. Using 64-byte packets (46 bytes of data in each), thesame data would take 179 frames! This adds 3114 bytes of overhead, compared tousing full-sized Ethernet packets (18 bytes x [179 – 6] = 3114 bytes). In addition,the routers, switches, and other devices on the network must process each packet,increasing their CPU utilization.
www.syngress.com
219_sniffer_03.qxd 6/28/02 11:49 AM Page 109

110 Chapter 3 • Exploring the Sniffer Pro Interface
NOTE
Size distribution statistics can be used to solve many problems. Forexample, consider the Novell Large Internet Packets (LIPs) problem, whichis very common. Before LIPs, if there was a router between a NetWareserver and a client, the packet size was automatically set to 576 bytes.Now with LIPs support, newer NetWare clients and servers negotiatepacket size when a client attaches to a server. This way, the packet sizedepends on the maximum physical packet size common to both theclient and the server.
Novell defaults to 802.2 on the network, but many network adminis-trators have 802.3 configured on the NetWare servers. If that is the case,LIPs does not work. In addition, the client needs to be configured to useLIPs. In older clients, this is accomplished using the net.cfg file or right inthe Novell client settings within the network properties. If the clients andservers do not use LIPs, you end up doubling your the network trafficfrom client to server. This is a common misconception when configuringLIPs against the wrong frame type.
The Detailed Errors section provides a breakdown of the errors that are shownon the errors-per-second dial.These errors include CRCs, runts, oversizes, frag-ments, jabbers, alignment errors, and collisions. (For definitions of these errors,refer to Chapter 1,“Introduction to Sniffer Pro.”) A runt packet is an undersizedpacket (less than 64K) with a valid CRC.A fragment is an undersized packet (lessthan 64K) with an invalid CRC.
NOTE
Remember that Sniffer Pro might not pick up a number of these errorsunless you are using NAI enhanced drivers.
If you are monitoring the network using a Token Ring interface, instead ofseeing the Detail tab, you will have the option of selecting the LLC and MACtabs (see Figures 3.3 and 3.4).We cover these tools in detail in Chapter 5,“UsingSniffer Pro to Monitor the Performance of a Network.”
www.syngress.com
219_sniffer_03.qxd 6/28/02 11:49 AM Page 110
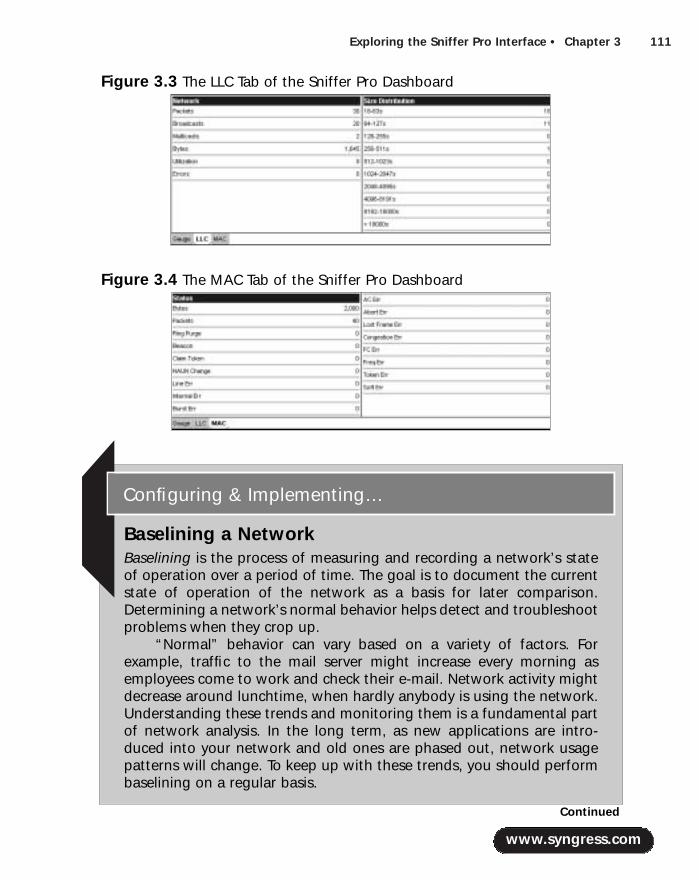
Exploring the Sniffer Pro Interface • Chapter 3 111
www.syngress.com
Figure 3.3 The LLC Tab of the Sniffer Pro Dashboard
Figure 3.4 The MAC Tab of the Sniffer Pro Dashboard
Baselining a NetworkBaselining is the process of measuring and recording a network’s stateof operation over a period of time. The goal is to document the currentstate of operation of the network as a basis for later comparison.Determining a network’s normal behavior helps detect and troubleshootproblems when they crop up.
“Normal” behavior can vary based on a variety of factors. Forexample, traffic to the mail server might increase every morning asemployees come to work and check their e-mail. Network activity mightdecrease around lunchtime, when hardly anybody is using the network.Understanding these trends and monitoring them is a fundamental partof network analysis. In the long term, as new applications are intro-duced into your network and old ones are phased out, network usagepatterns will change. To keep up with these trends, you should performbaselining on a regular basis.
Configuring & Implementing…
Continued
219_sniffer_03.qxd 6/28/02 11:49 AM Page 111

112 Chapter 3 • Exploring the Sniffer Pro Interface
Setting ThresholdsThresholds can be set for many of the network statistics reported by Sniffer Pro. If athreshold is exceeded, an entry is created in the Alarm Log. On the Dashboard, theranges of values exceeding the configured thresholds are marked on the dials in red.
Sniffer Pro comes preconfigured with default threshold values that arecommon to the average network size.To display or modify these values, click theSet Thresholds button located at the top of the Dashboard.You can also selectthe MAC Threshold tab under Tools | Options. Figure 3.5 shows Ethernetthresholds; Figure 3.6 shows Token Ring thresholds.
NOTE
Most functions within Sniffer Pro can be accessed in multiple ways (forexample, via drop-down menus and toolbar icons). All the Monitor appli-cations are accessible under the Monitor menu as well as the toolbar.
www.syngress.com
The Sniffer Pro Dashboard is an excellent utility to perform an ini-tial baseline of a network. The dials can immediately give you a quickoverview of network characteristics and behaviors. The configurablegraphs can be used to view long-term and short-term trends.
You might also find that the “normal” activity on your network isactually above certain default threshold settings in the Dashboard. Youcan modify these thresholds and customize them for your network.
Figure 3.5 Ethernet Thresholds
219_sniffer_03.qxd 6/28/02 11:49 AM Page 112

Exploring the Sniffer Pro Interface • Chapter 3 113
The Thresholds window displays a list of parameters that can create an entryin the Alarm Log.The exact list of parameters depends on the media adapter(Ethernet,Token Ring, and so on). If you have modified a parameter but wouldlike to set it back to the default value, first select the parameter, then click theReset button.To reset all the parameters to their default values, click the ResetAll button.
Setting a temporary threshold value while troubleshooting a problem can behelpful. If you are monitoring traffic from a router, and you know that it shouldnot multicast more than two frames per second, you can set the threshold valuefor Multicasts/s to 2.While Sniffer Pro is monitoring the traffic, if this value isexceeded, an entry will be logged in the Alarm Log.When you’re done, do notforget to set the Threshold back to its regular value!
Configurable Dashboard GraphsThe Dashboard provides configurable graphs based on the type of networkadapter (Ethernet,Token Ring, or the like) selected. In the case of Ethernet, threegroups of statistics are available:
■ Network Shows Packets/s, Utilization/s, Errors/s, Drops/s, Bytes/s,Broadcasts/s, and Multicasts/s.
■ Detail Errors Shows Runts/s, Oversizes/s, Fragments/s, Jabbers/s,CRCs/s,Alignments/s, and Collisions/s.
■ Size Distribution Shows 64-byte packets/s, 65–127-byte packets/s,128–255-byte packets/s, 256–511-byte packets/s, 512–1023-bytepackets/s, and 1024–1518-byte packets/s.
www.syngress.com
Figure 3.6 Token Ring Thresholds
219_sniffer_03.qxd 6/28/02 11:49 AM Page 113

114 Chapter 3 • Exploring the Sniffer Pro Interface
These graphs show statistics over a period of time.To view one of thesegraphs, click the check box corresponding to the group of statistics you want tosee.The graph will appear at the bottom of the Dashboard.
The graph includes a vertical “current” line. Clicking the scroll buttons (leftand right arrows) moves the graph’s current line.The statistics shown at the rightof the graph reflect the values at the position of the current line.As you movethe current line, you can see the exact date and time to the right of the scrollbuttons.You can modify the graph’s time scale by clicking the Long Term orShort Term buttons located at the top.The Long Term button sets the timerange of the graph to 24 hours, and the Short Term button sets it to 25 minutes.
Each possible statistic that can be graphed is listed on the right.You cancheck the boxes next to the statistics you would like to see in the graph, anduncheck the ones you do not want to see.
Understanding MenusAn excellent method of learning all the different functions that Sniffer Pro has tooffer is to go through all the menu options. Eight drop-down menus are availablein Sniffer Pro:
■ File
■ Monitor
■ Capture
■ Display
■ Tools
■ Database
■ Window
■ Help
Each of these menus and the options available under them are discussed indetail below.
The File MenuThe File menu provides various options for opening, closing, and saving capturefiles:
■ Open Opens a previously saved capture file from disk.
www.syngress.com
219_sniffer_03.qxd 6/28/02 11:49 AM Page 114
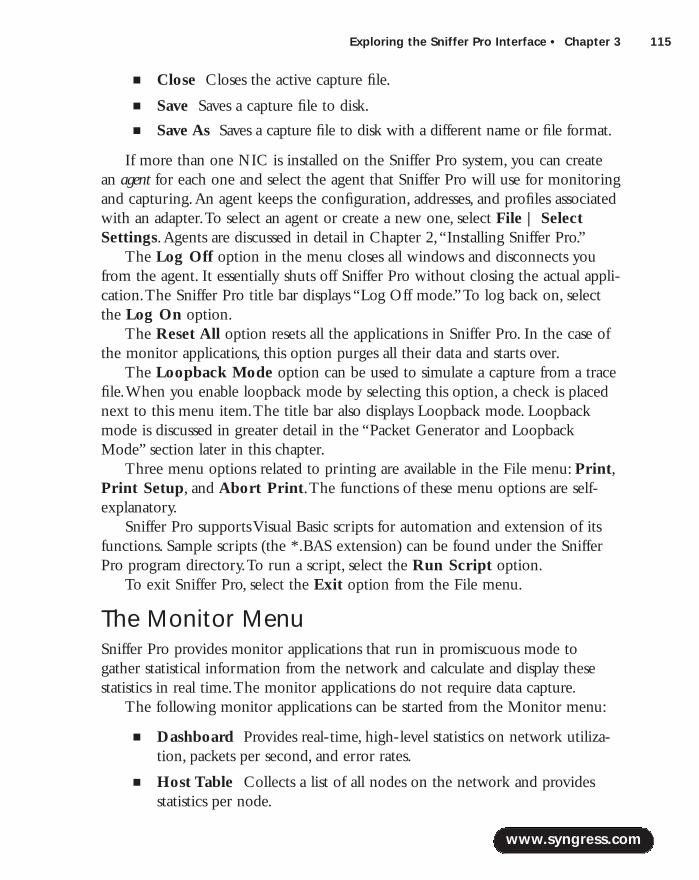
Exploring the Sniffer Pro Interface • Chapter 3 115
■ Close Closes the active capture file.
■ Save Saves a capture file to disk.
■ Save As Saves a capture file to disk with a different name or file format.
If more than one NIC is installed on the Sniffer Pro system, you can createan agent for each one and select the agent that Sniffer Pro will use for monitoringand capturing.An agent keeps the configuration, addresses, and profiles associatedwith an adapter.To select an agent or create a new one, select File | SelectSettings.Agents are discussed in detail in Chapter 2,“Installing Sniffer Pro.”
The Log Off option in the menu closes all windows and disconnects youfrom the agent. It essentially shuts off Sniffer Pro without closing the actual appli-cation.The Sniffer Pro title bar displays “Log Off mode.”To log back on, selectthe Log On option.
The Reset All option resets all the applications in Sniffer Pro. In the case ofthe monitor applications, this option purges all their data and starts over.
The Loopback Mode option can be used to simulate a capture from a tracefile.When you enable loopback mode by selecting this option, a check is placednext to this menu item.The title bar also displays Loopback mode. Loopbackmode is discussed in greater detail in the “Packet Generator and LoopbackMode” section later in this chapter.
Three menu options related to printing are available in the File menu: Print,Print Setup, and Abort Print.The functions of these menu options are self-explanatory.
Sniffer Pro supports Visual Basic scripts for automation and extension of itsfunctions. Sample scripts (the *.BAS extension) can be found under the SnifferPro program directory.To run a script, select the Run Script option.
To exit Sniffer Pro, select the Exit option from the File menu.
The Monitor MenuSniffer Pro provides monitor applications that run in promiscuous mode togather statistical information from the network and calculate and display thesestatistics in real time.The monitor applications do not require data capture.
The following monitor applications can be started from the Monitor menu:
■ Dashboard Provides real-time, high-level statistics on network utiliza-tion, packets per second, and error rates.
■ Host Table Collects a list of all nodes on the network and providesstatistics per node.
www.syngress.com
219_sniffer_03.qxd 6/28/02 11:49 AM Page 115
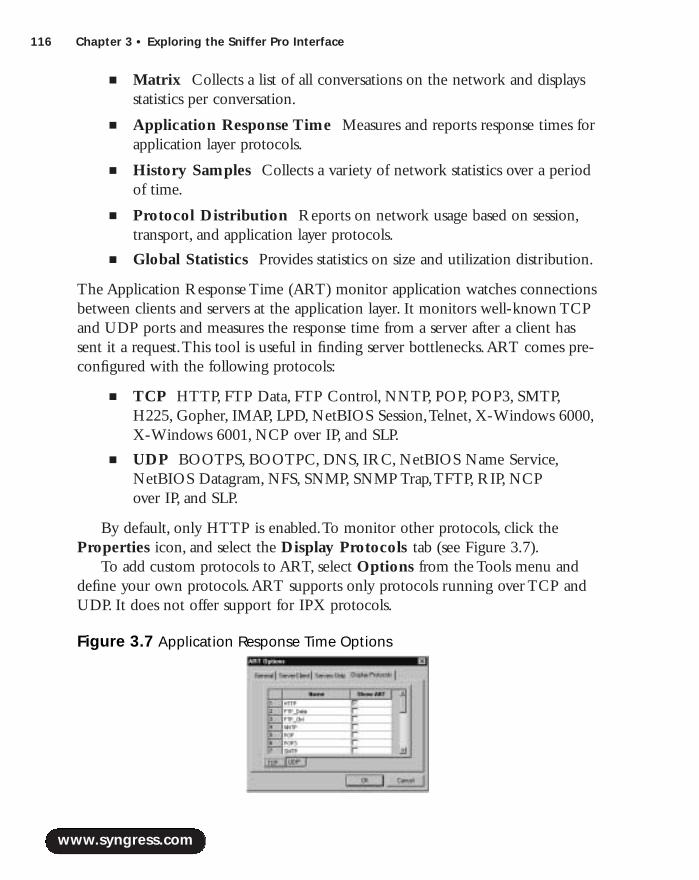
116 Chapter 3 • Exploring the Sniffer Pro Interface
■ Matrix Collects a list of all conversations on the network and displaysstatistics per conversation.
■ Application Response Time Measures and reports response times forapplication layer protocols.
■ History Samples Collects a variety of network statistics over a periodof time.
■ Protocol Distribution Reports on network usage based on session,transport, and application layer protocols.
■ Global Statistics Provides statistics on size and utilization distribution.
The Application Response Time (ART) monitor application watches connectionsbetween clients and servers at the application layer. It monitors well-known TCPand UDP ports and measures the response time from a server after a client hassent it a request.This tool is useful in finding server bottlenecks.ART comes pre-configured with the following protocols:
■ TCP HTTP, FTP Data, FTP Control, NNTP, POP, POP3, SMTP,H225, Gopher, IMAP, LPD, NetBIOS Session,Telnet, X-Windows 6000,X-Windows 6001, NCP over IP, and SLP.
■ UDP BOOTPS, BOOTPC, DNS, IRC, NetBIOS Name Service,NetBIOS Datagram, NFS, SNMP, SNMP Trap,TFTP, RIP, NCP over IP, and SLP.
By default, only HTTP is enabled.To monitor other protocols, click theProperties icon, and select the Display Protocols tab (see Figure 3.7).
To add custom protocols to ART, select Options from the Tools menu anddefine your own protocols.ART supports only protocols running over TCP andUDP. It does not offer support for IPX protocols.
www.syngress.com
Figure 3.7 Application Response Time Options
219_sniffer_03.qxd 6/28/02 11:49 AM Page 116

Exploring the Sniffer Pro Interface • Chapter 3 117
History samples are one of the most valuable tools that Sniffer Pro has tooffer.They collect a variety of network statistics that you can use to establish anetwork baseline. History samples are also useful for determining long-termtrends on the network and therefore help you plan for future network capacity.
Each history sample can be displayed as a bar chart, a line chart, or an areachart.You can launch as many as 10 history samples concurrently.These could be10 different sample types or multiple instances of the same sample (with differentsample intervals to view long-term and short-term trends).
The list of available history samples depends on the type of network beingmonitored. For example, you will not see the history samples for Token Ringframe types (such as beacon frames) when you’re monitoring an Ethernet net-work. Figure 3.8 shows an example of the History Samples screen.
The icons on the History Samples toolbar are (in order, from top to bottom):
■ Start Sample Starts a history sample.This icon is grayed out until asample is selected.
■ Large Icons View the list of history samples as large icons.
■ Small Icons View the list of history samples as small icons.
■ List View the list of history samples as a text list.
■ Details View a detailed list of all the history samples, including theconfigured threshold, interval, sample period, and buffer action for each sample.
■ Multiple History Allows you to create a combination history sampleshowing multiple key statistics on one screen.
■ Properties Used to set the type of chart (bar, area, or line), low andhigh threshold values, and the sampling interval.This icon is grayed outuntil a sample is selected.
www.syngress.com
Figure 3.8 History Samples
219_sniffer_03.qxd 6/28/02 11:49 AM Page 117
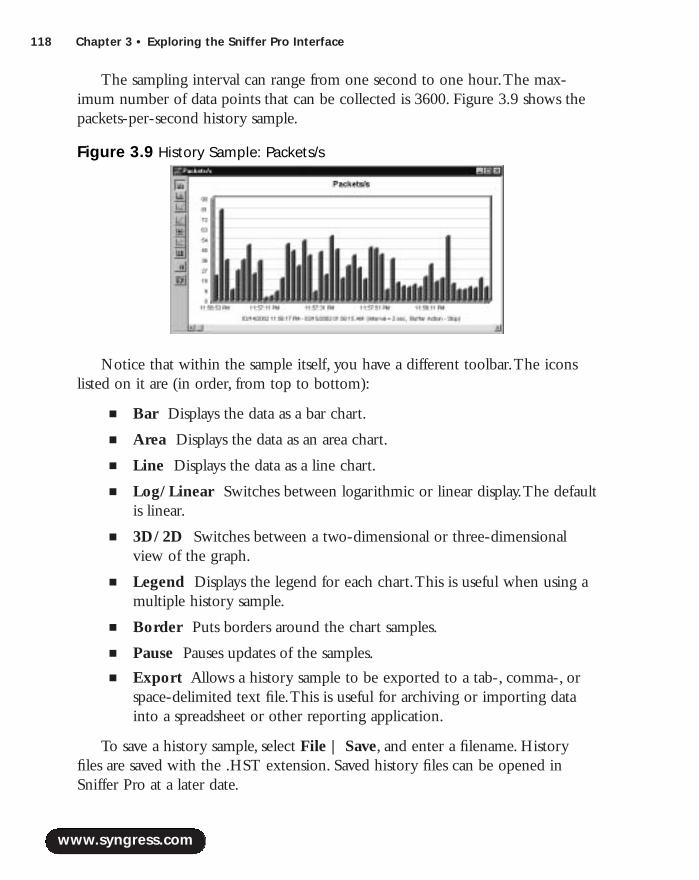
118 Chapter 3 • Exploring the Sniffer Pro Interface
The sampling interval can range from one second to one hour.The max-imum number of data points that can be collected is 3600. Figure 3.9 shows thepackets-per-second history sample.
Notice that within the sample itself, you have a different toolbar.The iconslisted on it are (in order, from top to bottom):
■ Bar Displays the data as a bar chart.
■ Area Displays the data as an area chart.
■ Line Displays the data as a line chart.
■ Log/Linear Switches between logarithmic or linear display.The defaultis linear.
■ 3D/2D Switches between a two-dimensional or three-dimensionalview of the graph.
■ Legend Displays the legend for each chart.This is useful when using amultiple history sample.
■ Border Puts borders around the chart samples.
■ Pause Pauses updates of the samples.
■ Export Allows a history sample to be exported to a tab-, comma-, orspace-delimited text file.This is useful for archiving or importing datainto a spreadsheet or other reporting application.
To save a history sample, select File | Save, and enter a filename. Historyfiles are saved with the .HST extension. Saved history files can be opened inSniffer Pro at a later date.
www.syngress.com
Figure 3.9 History Sample: Packets/s
219_sniffer_03.qxd 6/28/02 11:49 AM Page 118

Exploring the Sniffer Pro Interface • Chapter 3 119
Global statistics summarize the overall activity on the network. Clicking theSize Distribution tab at the bottom of the window displays a graph of the fre-quency of each packet size as a percentage of all monitored traffic. Clicking theUtilization tab at the bottom of the window displays a graph of the networkbandwidth consumption distributed among each 10-percent group (0–10%,11–20%, and so on). Figure 3.10 shows the Global Statistics toolbar.
You can view both the size distribution data and the utilization data in eitherbar graph or pie chart format by clicking the Bar or the Pie icons.The Reseticon clears all the data in Global Statistics and starts collecting data from scratch.
NOTE
Size distribution of the packets on your network should match the appli-cations that you are using. Applications and protocols that transfer largeamounts of data (such as FTP, CIFS, and NFS) should use the largest pos-sible packet size for maximum efficiency. Interactive applications that donot transfer large amounts of data (such as Telnet and X Windows) usesmaller packet sizes. Using Sniffer Pro, you can monitor the various appli-cations that run on your network. If you find an application that trans-fers large files across the network but uses small packet sizes, work withthe application’s author or vendor to improve its efficiency.
The Smart Screens, Physical Layer Stats, and SONET Statistics optionsare also available under the Monitor menu but are not applicable to LANs.
The Switch menu item in the Monitor menu starts the Switch Expert appli-cation.This tool uses Simple Network Management Protocol (SNMP) to retrieveand display statistics from the Management Information Bases (MIBs) on networkswitches.When you start the Switch Expert, the Switch Configuration Listwindow appears on screen.This is where you maintain a list of switches to bemonitored. Four icons are available in the Switch Configuration List toolbar:
www.syngress.com
Figure 3.10 The Global Statistics Toolbar
Bar
Pie
Reset
219_sniffer_03.qxd 6/28/02 11:49 AM Page 119
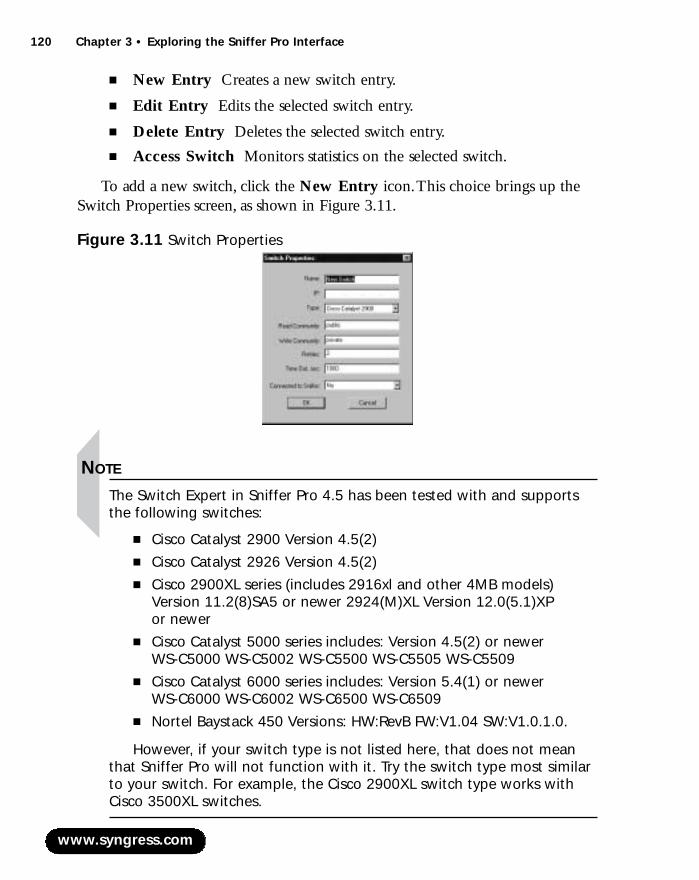
120 Chapter 3 • Exploring the Sniffer Pro Interface
■ New Entry Creates a new switch entry.
■ Edit Entry Edits the selected switch entry.
■ Delete Entry Deletes the selected switch entry.
■ Access Switch Monitors statistics on the selected switch.
To add a new switch, click the New Entry icon.This choice brings up theSwitch Properties screen, as shown in Figure 3.11.
NOTE
The Switch Expert in Sniffer Pro 4.5 has been tested with and supportsthe following switches:
■ Cisco Catalyst 2900 Version 4.5(2)■ Cisco Catalyst 2926 Version 4.5(2)■ Cisco 2900XL series (includes 2916xl and other 4MB models)
Version 11.2(8)SA5 or newer 2924(M)XL Version 12.0(5.1)XP or newer
■ Cisco Catalyst 5000 series includes: Version 4.5(2) or newerWS-C5000 WS-C5002 WS-C5500 WS-C5505 WS-C5509
■ Cisco Catalyst 6000 series includes: Version 5.4(1) or newerWS-C6000 WS-C6002 WS-C6500 WS-C6509
■ Nortel Baystack 450 Versions: HW:RevB FW:V1.04 SW:V1.0.1.0.
However, if your switch type is not listed here, that does not meanthat Sniffer Pro will not function with it. Try the switch type most similarto your switch. For example, the Cisco 2900XL switch type works withCisco 3500XL switches.
www.syngress.com
Figure 3.11 Switch Properties
219_sniffer_03.qxd 6/28/02 11:49 AM Page 120
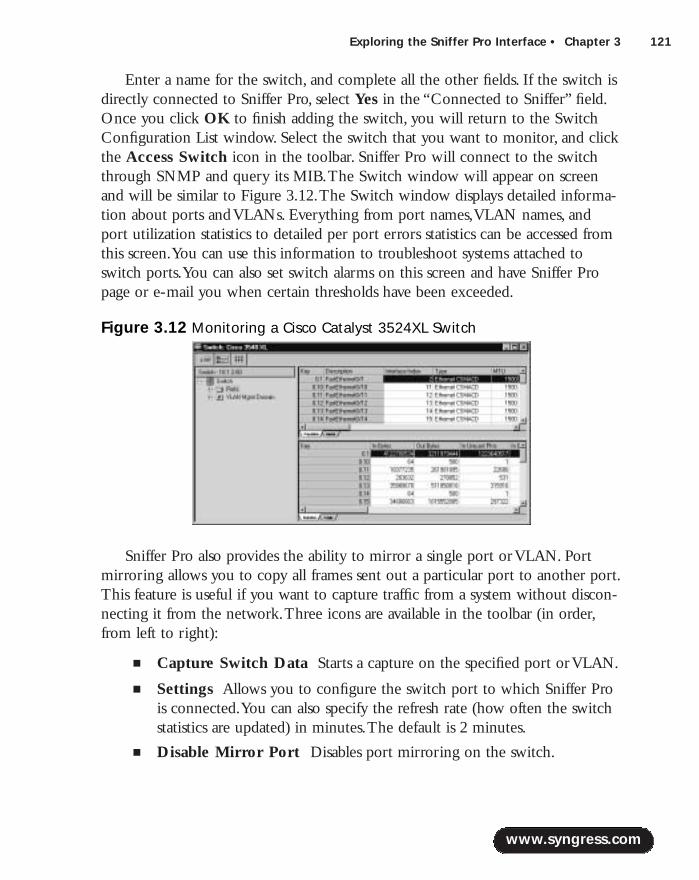
Exploring the Sniffer Pro Interface • Chapter 3 121
Enter a name for the switch, and complete all the other fields. If the switch isdirectly connected to Sniffer Pro, select Yes in the “Connected to Sniffer” field.Once you click OK to finish adding the switch, you will return to the SwitchConfiguration List window. Select the switch that you want to monitor, and clickthe Access Switch icon in the toolbar. Sniffer Pro will connect to the switchthrough SNMP and query its MIB.The Switch window will appear on screenand will be similar to Figure 3.12.The Switch window displays detailed informa-tion about ports and VLANs. Everything from port names,VLAN names, andport utilization statistics to detailed per port errors statistics can be accessed fromthis screen.You can use this information to troubleshoot systems attached toswitch ports.You can also set switch alarms on this screen and have Sniffer Propage or e-mail you when certain thresholds have been exceeded.
Sniffer Pro also provides the ability to mirror a single port or VLAN. Portmirroring allows you to copy all frames sent out a particular port to another port.This feature is useful if you want to capture traffic from a system without discon-necting it from the network.Three icons are available in the toolbar (in order,from left to right):
■ Capture Switch Data Starts a capture on the specified port or VLAN.
■ Settings Allows you to configure the switch port to which Sniffer Prois connected.You can also specify the refresh rate (how often the switchstatistics are updated) in minutes.The default is 2 minutes.
■ Disable Mirror Port Disables port mirroring on the switch.
www.syngress.com
Figure 3.12 Monitoring a Cisco Catalyst 3524XL Switch
219_sniffer_03.qxd 6/28/02 11:49 AM Page 121

122 Chapter 3 • Exploring the Sniffer Pro Interface
NOTE
Cisco uses the word span to describe the concept of port mirroring. Tospan a port in Cisco terms is the same as mirroring a port. Port mirroringis covered in Chapter 6, “Capturing Network Data for Analysis.”
The Define Filter, and Select Filter menu options are available to create,modify, or delete filters and apply them to the monitor applications.These arediscussed in Chapter 8,“Using Filters.”
The Alarm Log option in the Monitor menu is used to view the list ofalarms that have been generated.Alarms are generated from two sources.TheSniffer Pro Expert generates alarms while capturing data.When it detects asymptom or diagnosis, it logs this to the Alarm Log.The monitor alarm manageralso starts automatically when you open Sniffer Pro. Each time a threshold isexceeded, an event is logged in the Alarm Log.
The Alarm Log displays the status of the alarm, the type of event, the time itoccurred, its severity, and a description of the error. Figure 3.13 shows anexample Alarm Log. In this case, we can see that four alarms were generated bythe Expert, all for WINS No Response.
The maximum number of stored alarm entries is 1000, but this value can bechanged. Select Tools | Expert Options, and click the Objects tab. UnderAlarm Maximums, specify the maximum number of alarms to store.When thenumber of events reaches this maximum, the oldest and lowest-priority eventswill be recycled, assuming that the “Recycle Alarms” check box is selected in theoptions. If the check box is not selected, no new alarms will be created.
Individual alarms can be acknowledged in the Alarm Log.To do this, right-click an alarm, and select Acknowledge.This setting changes the status of thealarm to Informational.To acknowledge all alarms, right-click in the alarmwindow and select Acknowledge All.Alarms can also be removed from theAlarm Log altogether.To remove an individual alarm, right-click it, and selectRemove.To remove all alarms, select Remove All.
www.syngress.com
Figure 3.13 Alarm Log
219_sniffer_03.qxd 6/28/02 11:49 AM Page 122
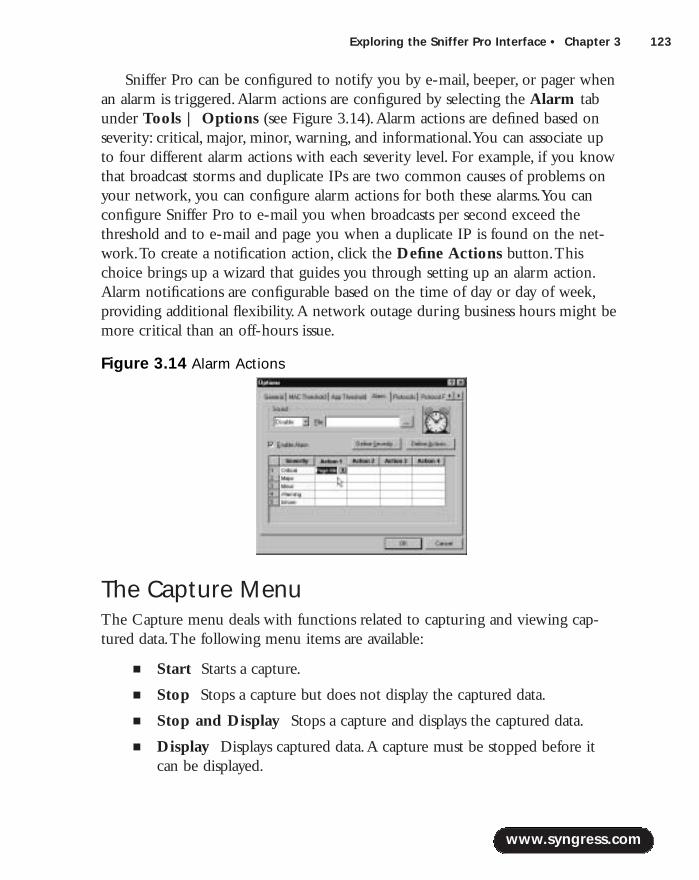
Exploring the Sniffer Pro Interface • Chapter 3 123
Sniffer Pro can be configured to notify you by e-mail, beeper, or pager whenan alarm is triggered.Alarm actions are configured by selecting the Alarm tabunder Tools | Options (see Figure 3.14).Alarm actions are defined based onseverity: critical, major, minor, warning, and informational.You can associate upto four different alarm actions with each severity level. For example, if you knowthat broadcast storms and duplicate IPs are two common causes of problems onyour network, you can configure alarm actions for both these alarms.You canconfigure Sniffer Pro to e-mail you when broadcasts per second exceed thethreshold and to e-mail and page you when a duplicate IP is found on the net-work.To create a notification action, click the Define Actions button.Thischoice brings up a wizard that guides you through setting up an alarm action.Alarm notifications are configurable based on the time of day or day of week,providing additional flexibility.A network outage during business hours might bemore critical than an off-hours issue.
The Capture MenuThe Capture menu deals with functions related to capturing and viewing cap-tured data.The following menu items are available:
■ Start Starts a capture.
■ Stop Stops a capture but does not display the captured data.
■ Stop and Display Stops a capture and displays the captured data.
■ Display Displays captured data.A capture must be stopped before itcan be displayed.
www.syngress.com
Figure 3.14 Alarm Actions
219_sniffer_03.qxd 6/28/02 11:49 AM Page 123

124 Chapter 3 • Exploring the Sniffer Pro Interface
■ Capture Panel Opens the Capture Panel, which displays statisticsduring a capture.
■ Define Filter Used to create, modify, or delete a capture filter.Thisoption is discussed in detail in Chapter 8,“Using Filters.”
■ Select Filter Used to select a capture filter.This option is discussed indetail in Chapter 8,“Using Filters.”
■ Trigger Setup Causes a capture to start and stop based on specificevents.Triggers are discussed in detail in Chapter 9,“Understanding andUsing Triggers and Alarms.”
The Display MenuMost of the functions in the Display menu are useful only while viewing a cap-ture.Without an open capture, nearly everything in this menu is grayed out andunavailable.While viewing a capture, you can select the following options in theDisplay menu:
■ Previous Takes you to the previous frame in the display.
■ Next Takes you to the next frame in the display.
■ Find Frame Find a frame based on search criteria.
■ Find Next Frame Find the next frame based on search criteria.
■ Go to Frame Lets you specify a frame number to jump to.
■ Mark Current Frame Marks the selected frame and puts an “M” inits “Status” field.
■ Select Range Selects a contiguous range of frames.The check boxeson the left of the frames are selected.
■ Select Toggle Toggles the “select” status of a frame. If the frame isselected, it deselects it. If the frame is not selected, it selects it.
■ Previous Selected Jumps to the previous selected frame.
■ Next Selected Jumps to the next selected frame.
■ Discovered Addresses Lists all the addresses discovered by the capture.These addresses can be added to the Address Book.
■ Define Filter Used to create, modify, or delete a display filter.This isdiscussed in detail in Chapter 8,“Using Filters.”
www.syngress.com
219_sniffer_03.qxd 6/28/02 11:49 AM Page 124
Exploring the Sniffer Pro Interface • Chapter 3 125
■ Select Filter Used to select a display filter.This is discussed in detail inChapter 8,“Using Filters.”
■ Display Setup Sets display options.
The Tools MenuThe Tools menu provides access to a number of troubleshooting tools as well asconfiguration settings for Sniffer Pro. Many items listed in the Tools menu arecovered in detail in the “Miscellaneous Sniffer Pro Tools” section later in thischapter.The Tools menu items are:
■ Address Book Used to assign recognizable names to network and datalink layer addresses.
■ Packet Generator Used to transmit test packets on the network.
■ Bit Error Rate Test (BERT) Used to measure BERT values onWAN links.
■ Reporter Launches the Sniffer Reporter Agent software, which is apart of the Sniffer Reporter software from Network Associates.
■ Ping Used to verify IP connectivity to a host.
■ Trace Route Used to verify the Layer 3 path to an IP host.
■ DNS Lookup Used to perform domain name lookups.
■ Finger Used to query hosts using the finger protocol.
■ Who Is Used to perform “whois?” queries.
■ Customize User Tools Used to add, modify, or delete custom tools inSniffer Pro.
■ Options Used to set Sniffer Pro configurable parameters.
■ Expert Options Used to set configurable parameters for the SnifferPro Expert.
The Database MenuSniffer Pro automatically saves all the real-time statistics created by the monitorapplications into comma-separated value files.These database files are updatedevery 60 minutes by default and are saved in a subdirectory under the Sniffer Pro
www.syngress.com
219_sniffer_03.qxd 6/28/02 11:49 AM Page 125

126 Chapter 3 • Exploring the Sniffer Pro Interface
program directory by the same name as the current local agent.The Databasemenu provides configuration options related to these database files.
The Options menu item provides configuration settings for the database files(see Figure 3.15).You can turn database collection on or off for specific statisticsby toggling the check box located to the left of each statistic type.You can alsomodify the default update interval of 60 minutes for each statistic type.To con-figure Sniffer Pro to export the contents of the Expert database automaticallyevery time a capture is stopped, select the Log Expert Data option.You alsohave the option to configure Sniffer Pro to automatically delete database dataafter a certain number of days. By default, Sniffer Pro purges database data that isolder than seven days.This prevents your hard drive from filling up with data thatyou might not need.
The Maintenance menu option allows you to delete all database data beforea certain date.This option is useful if you have not configured Sniffer Pro tohandle this task automatically.When you select this option, you will be promptedfor a date.All database data before the specified date will be purged.
The Save Address Book menu option saves Sniffer Pro’s Address Book tothe database file.The Retrieve Database option copies the database file from anagent to the console.
The Window MenuSniffer Pro is a Multiple Document Interface (MDI) program.This means thatthe application has child windows inside its main window.The Window menuprovides functions related to these child windows.
www.syngress.com
Figure 3.15 Database Options
219_sniffer_03.qxd 6/28/02 11:49 AM Page 126
Exploring the Sniffer Pro Interface • Chapter 3 127
■ New Window This menu option is always grayed out and does nothave a function in Sniffer Pro.To open a new window, you need toselect an option from one of the other menus. For example, each mon-itor application opens a new window.
■ Cascade This menu option places all the windows on top of eachother, slightly indented, with the title bars cascading downward. Eventhough most of the windows are hidden, all the title bars are visible,making it very easy to bring a particular window forward.To bring awindow forward, click its title bar.
■ Tile This menu option divides the screen horizontally and evenlyamong the open windows.All windows are displayed horizontally suchthat no window overlaps any other.
■ Arrange Icons This option is used to arrange the icons of all the min-imized child windows.
The Window menu also shows a list of all the open windows. Selecting oneof these windows brings it to the foreground.
HelpSniffer Pro provides a very complete and robust online help system.To learnmore about any of the features that Sniffer Pro has to offer, you can go to HelpTopics under the Help menu and use the search capabilities to find what youare looking for.To determine the version of Sniffer Pro you are running, selectHelp | About Sniffer.
NOTE
Sniffer Pro provides context-sensitive help. Most windows and functionshave a question-mark icon that you can click to get further information.
Understanding the ToolbarsSniffer Pro’s user interface is based heavily on toolbars. Many of the functions inthe software can be accessed only using toolbar icons.
www.syngress.com
219_sniffer_03.qxd 6/28/02 11:49 AM Page 127
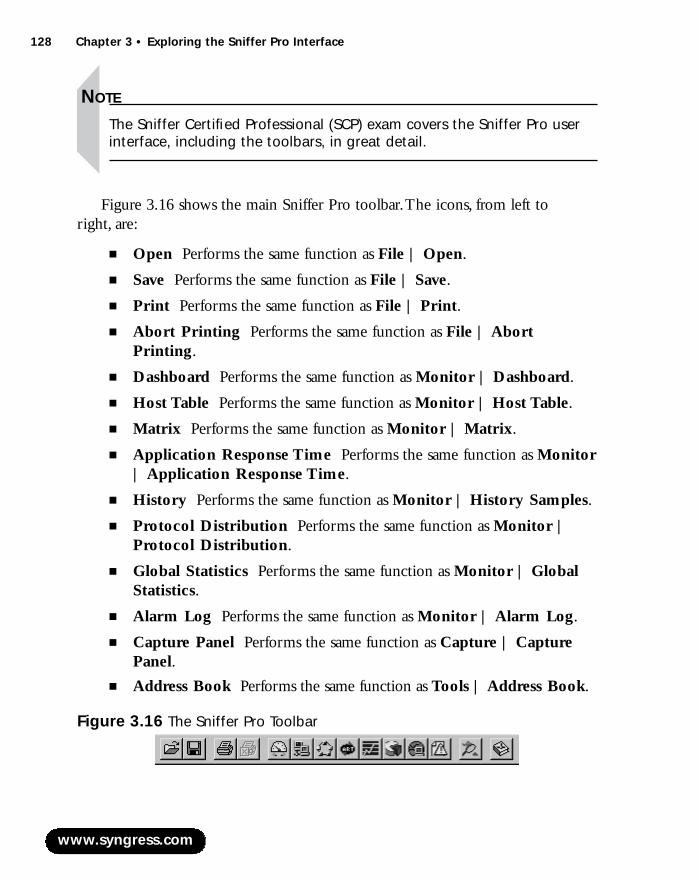
128 Chapter 3 • Exploring the Sniffer Pro Interface
NOTE
The Sniffer Certified Professional (SCP) exam covers the Sniffer Pro userinterface, including the toolbars, in great detail.
Figure 3.16 shows the main Sniffer Pro toolbar.The icons, from left to right, are:
■ Open Performs the same function as File | Open.
■ Save Performs the same function as File | Save.
■ Print Performs the same function as File | Print.
■ Abort Printing Performs the same function as File | AbortPrinting.
■ Dashboard Performs the same function as Monitor | Dashboard.
■ Host Table Performs the same function as Monitor | Host Table.
■ Matrix Performs the same function as Monitor | Matrix.
■ Application Response Time Performs the same function as Monitor| Application Response Time.
■ History Performs the same function as Monitor | History Samples.
■ Protocol Distribution Performs the same function as Monitor |Protocol Distribution.
■ Global Statistics Performs the same function as Monitor | GlobalStatistics.
■ Alarm Log Performs the same function as Monitor | Alarm Log.
■ Capture Panel Performs the same function as Capture | CapturePanel.
■ Address Book Performs the same function as Tools | Address Book.
www.syngress.com
Figure 3.16 The Sniffer Pro Toolbar
219_sniffer_03.qxd 6/28/02 11:49 AM Page 128
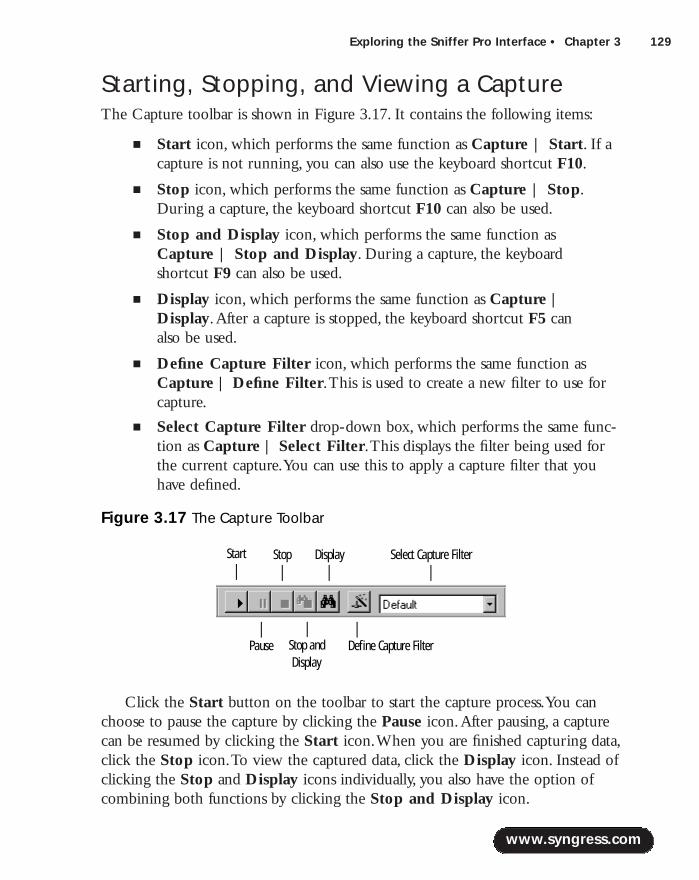
Exploring the Sniffer Pro Interface • Chapter 3 129
Starting, Stopping, and Viewing a CaptureThe Capture toolbar is shown in Figure 3.17. It contains the following items:
■ Start icon, which performs the same function as Capture | Start. If acapture is not running, you can also use the keyboard shortcut F10.
■ Stop icon, which performs the same function as Capture | Stop.During a capture, the keyboard shortcut F10 can also be used.
■ Stop and Display icon, which performs the same function as Capture | Stop and Display. During a capture, the keyboard shortcut F9 can also be used.
■ Display icon, which performs the same function as Capture |Display.After a capture is stopped, the keyboard shortcut F5 can also be used.
■ Define Capture Filter icon, which performs the same function asCapture | Define Filter.This is used to create a new filter to use forcapture.
■ Select Capture Filter drop-down box, which performs the same func-tion as Capture | Select Filter.This displays the filter being used forthe current capture.You can use this to apply a capture filter that youhave defined.
Click the Start button on the toolbar to start the capture process.You canchoose to pause the capture by clicking the Pause icon.After pausing, a capturecan be resumed by clicking the Start icon.When you are finished capturing data,click the Stop icon.To view the captured data, click the Display icon. Instead ofclicking the Stop and Display icons individually, you also have the option ofcombining both functions by clicking the Stop and Display icon.
www.syngress.com
Figure 3.17 The Capture Toolbar
Start
Pause Stop andDisplay
Define Capture Filter
Select Capture FilterDisplayStop
219_sniffer_03.qxd 6/28/02 11:49 AM Page 129
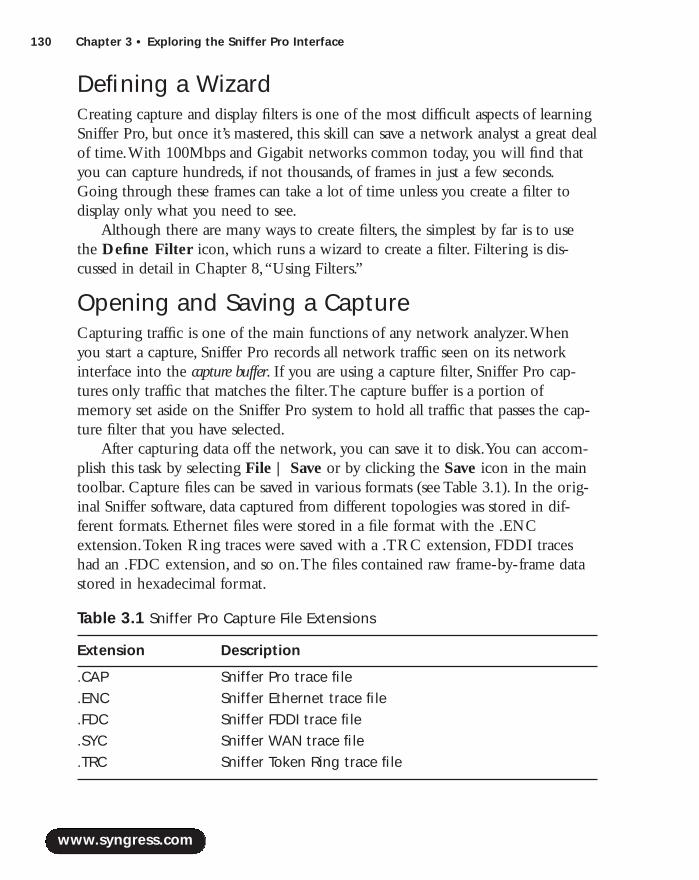
130 Chapter 3 • Exploring the Sniffer Pro Interface
Defining a WizardCreating capture and display filters is one of the most difficult aspects of learningSniffer Pro, but once it’s mastered, this skill can save a network analyst a great dealof time.With 100Mbps and Gigabit networks common today, you will find thatyou can capture hundreds, if not thousands, of frames in just a few seconds.Going through these frames can take a lot of time unless you create a filter todisplay only what you need to see.
Although there are many ways to create filters, the simplest by far is to usethe Define Filter icon, which runs a wizard to create a filter. Filtering is dis-cussed in detail in Chapter 8,“Using Filters.”
Opening and Saving a CaptureCapturing traffic is one of the main functions of any network analyzer.Whenyou start a capture, Sniffer Pro records all network traffic seen on its networkinterface into the capture buffer. If you are using a capture filter, Sniffer Pro cap-tures only traffic that matches the filter.The capture buffer is a portion ofmemory set aside on the Sniffer Pro system to hold all traffic that passes the cap-ture filter that you have selected.
After capturing data off the network, you can save it to disk.You can accom-plish this task by selecting File | Save or by clicking the Save icon in the maintoolbar. Capture files can be saved in various formats (see Table 3.1). In the orig-inal Sniffer software, data captured from different topologies was stored in dif-ferent formats. Ethernet files were stored in a file format with the .ENCextension.Token Ring traces were saved with a .TRC extension, FDDI traceshad an .FDC extension, and so on.The files contained raw frame-by-frame datastored in hexadecimal format.
Table 3.1 Sniffer Pro Capture File Extensions
Extension Description
.CAP Sniffer Pro trace file
.ENC Sniffer Ethernet trace file
.FDC Sniffer FDDI trace file
.SYC Sniffer WAN trace file
.TRC Sniffer Token Ring trace file
www.syngress.com
219_sniffer_03.qxd 6/28/02 11:49 AM Page 130

Exploring the Sniffer Pro Interface • Chapter 3 131
Sniffer Pro for Windows introduced a new file format with the .CAP exten-sion.This file format can store data from all topologies.All the file formats listedin Table 3.1, including the .CAP file format, are saved as uncompressed data.Tosave disk space, you can save a Sniffer Pro trace file in a compressed format. Ifyou save a trace file with the .CAZ extension, Sniffer Pro automatically com-presses the trace file while saving it.
NOTE
Create a naming scheme for your capture files. Elements that could bepart of the filename include the date and time of capture, the networkaddress from which the capture was performed, and the name of thecapture filter used. You will find that keeping your capture files orga-nized will help you in the long run.
To open a previously saved trace file, select File | Open or click the Openicon in the main toolbar.
Data capture and analysis are discussed in detail in Chapter 4,“ConfiguringSniffer Pro to Monitor Network Applications,” and Chapter 6,“CapturingNetwork Data for Analysis.”
PrintingSniffer Pro allows printing from almost all windows.To print the contents of awindow:
1. Select the window and bring it to the foreground.
2. Select File | Print or click the Print icon in the toolbar.
To cancel a print job, select File | Abort Printing or click the AbortPrinting icon in the toolbar.
If you are in a Decode display, you also have the ability to print individualpackets.You can print the line-by-line list of packets in the Summary pane, thedetailed protocol fields in the Detail pane, or the hex data in the Hex pane.While in the Decode view, select File | Print. In the “Print Range” field,specify the range of packets that you want to print (for example, 102–109). In the“Format” field, select the panes (Summary, Detail, or Hex) you want to print.
www.syngress.com
219_sniffer_03.qxd 6/28/02 11:49 AM Page 131
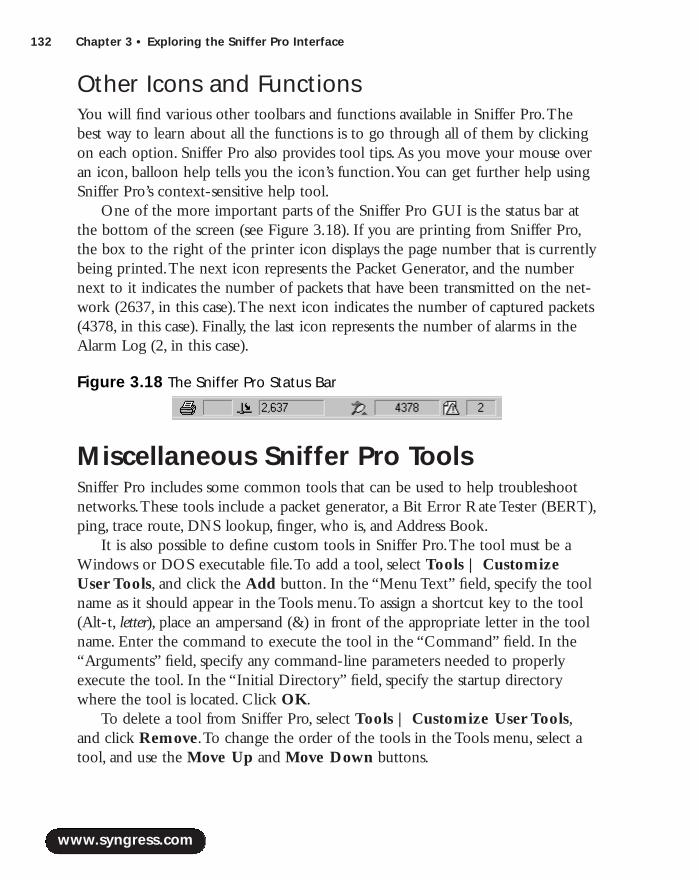
132 Chapter 3 • Exploring the Sniffer Pro Interface
Other Icons and FunctionsYou will find various other toolbars and functions available in Sniffer Pro.Thebest way to learn about all the functions is to go through all of them by clickingon each option. Sniffer Pro also provides tool tips.As you move your mouse overan icon, balloon help tells you the icon’s function.You can get further help usingSniffer Pro’s context-sensitive help tool.
One of the more important parts of the Sniffer Pro GUI is the status bar atthe bottom of the screen (see Figure 3.18). If you are printing from Sniffer Pro,the box to the right of the printer icon displays the page number that is currentlybeing printed.The next icon represents the Packet Generator, and the numbernext to it indicates the number of packets that have been transmitted on the net-work (2637, in this case).The next icon indicates the number of captured packets(4378, in this case). Finally, the last icon represents the number of alarms in theAlarm Log (2, in this case).
Miscellaneous Sniffer Pro ToolsSniffer Pro includes some common tools that can be used to help troubleshootnetworks.These tools include a packet generator, a Bit Error Rate Tester (BERT),ping, trace route, DNS lookup, finger, who is, and Address Book.
It is also possible to define custom tools in Sniffer Pro.The tool must be aWindows or DOS executable file.To add a tool, select Tools | CustomizeUser Tools, and click the Add button. In the “Menu Text” field, specify the toolname as it should appear in the Tools menu.To assign a shortcut key to the tool(Alt-t, letter), place an ampersand (&) in front of the appropriate letter in the toolname. Enter the command to execute the tool in the “Command” field. In the“Arguments” field, specify any command-line parameters needed to properlyexecute the tool. In the “Initial Directory” field, specify the startup directorywhere the tool is located. Click OK.
To delete a tool from Sniffer Pro, select Tools | Customize User Tools,and click Remove.To change the order of the tools in the Tools menu, select atool, and use the Move Up and Move Down buttons.
www.syngress.com
Figure 3.18 The Sniffer Pro Status Bar
219_sniffer_03.qxd 6/28/02 11:49 AM Page 132
Exploring the Sniffer Pro Interface • Chapter 3 133
NOTE
A number of freeware and shareware applications are available on theInternet that would make excellent additions as custom Sniffer Pro tools.These include NetBIOS name-resolution troubleshooting utilities, visualtrace-route tools, and port scanners.
Packet Generator and Loopback ModeSniffer Pro provides a Packet Generator function that can be used to transmit testpackets on the network.This tool can be useful if you want to:
■ Test performance of network equipment—for example, to measure thepackets or frames per second forwarded by a particular model of routeror switch
■ Create a known amount of null traffic to see how a network reacts toincreased bandwidth usage
■ Reproduce a network problem to troubleshoot it or verify a fix
■ Play back a trace file and observe it in monitor mode
NOTE
Transmitting packets into a production network can produce unexpectedresults. Either perform packet generation on a test or isolated network,or make sure that the packets you are generating on the production net-work will not cause any harm. For example, if you continuously transmita TCP SYN packet to a particular IP address, the host will end up withmany half-open connections, making it equivalent to a DoS attack.
If you put Sniffer Pro into loopback mode (File | Loopback Mode) beforestarting Packet Generator, the traffic will be transmitted only locally on theSniffer Pro system and will not be placed on the network.
www.syngress.com
219_sniffer_03.qxd 6/28/02 11:49 AM Page 133
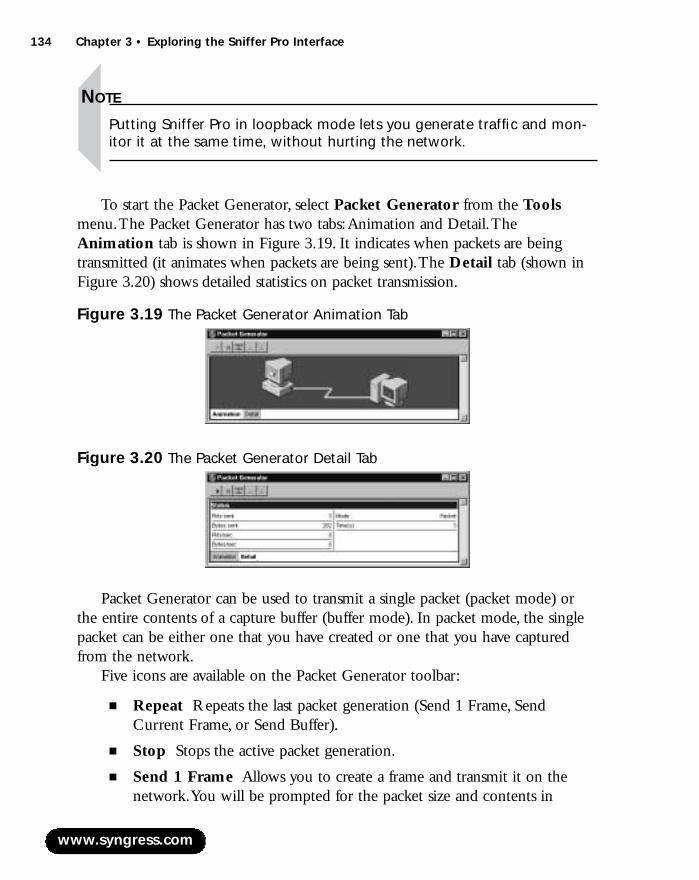
134 Chapter 3 • Exploring the Sniffer Pro Interface
NOTE
Putting Sniffer Pro in loopback mode lets you generate traffic and mon-itor it at the same time, without hurting the network.
To start the Packet Generator, select Packet Generator from the Toolsmenu.The Packet Generator has two tabs:Animation and Detail.TheAnimation tab is shown in Figure 3.19. It indicates when packets are beingtransmitted (it animates when packets are being sent).The Detail tab (shown inFigure 3.20) shows detailed statistics on packet transmission.
Packet Generator can be used to transmit a single packet (packet mode) orthe entire contents of a capture buffer (buffer mode). In packet mode, the singlepacket can be either one that you have created or one that you have capturedfrom the network.
Five icons are available on the Packet Generator toolbar:
■ Repeat Repeats the last packet generation (Send 1 Frame, SendCurrent Frame, or Send Buffer).
■ Stop Stops the active packet generation.
■ Send 1 Frame Allows you to create a frame and transmit it on thenetwork.You will be prompted for the packet size and contents in
www.syngress.com
Figure 3.19 The Packet Generator Animation Tab
Figure 3.20 The Packet Generator Detail Tab
219_sniffer_03.qxd 6/28/02 11:49 AM Page 134

Exploring the Sniffer Pro Interface • Chapter 3 135
hexadecimal format.You can also select how many times you want the frame to be transmitted (select Continuously if you want it to con-tinue until stopped manually) and the delay between each transmissionin milliseconds.
■ Send Current Frame Transmits the frame that is currently selected inthe capture buffer.
■ Send Buffer Transmits the entire capture buffer.
The Bit Error-Rate TestBit error rate (BER) is defined as the percentage of bits that have errors relativeto the total number of bits received in a transmission. BER is usually expressed as10 to a negative power. For example, if a transmission has a BER of 10 to theminus 4, this means that of 10,000 bits transmitted, 1 had an error.A high BERvalue indicates a noisy line, which can cause poor network performance.
BERT is a procedure used to measure the BER for a given transmission.Sniffer Pro provides the ability to act as a BERT device and can measure theBER value on an RS/V,T1, or E1 line.
www.syngress.com
Packet GeneratorThe Packet Generator tool in Sniffer Pro can be very useful to stress-testnetwork or security designs. For example, Packet Generator can be usedto create “spoofed” packets (packets that have fake source addresses) totest firewall rules and access control lists. You can also try networkattacks and see if your firewall or intrusion detection sensor can detectthem. Packet Generator can also be used to artificially introduce highlevels of load into the network while you use actual applications. Thistest will tell you if your network devices (switches, routers, and the like)are capable of sustaining normal network activity during peak trafficperiods.
Designing & Planning…
219_sniffer_03.qxd 6/28/02 11:49 AM Page 135
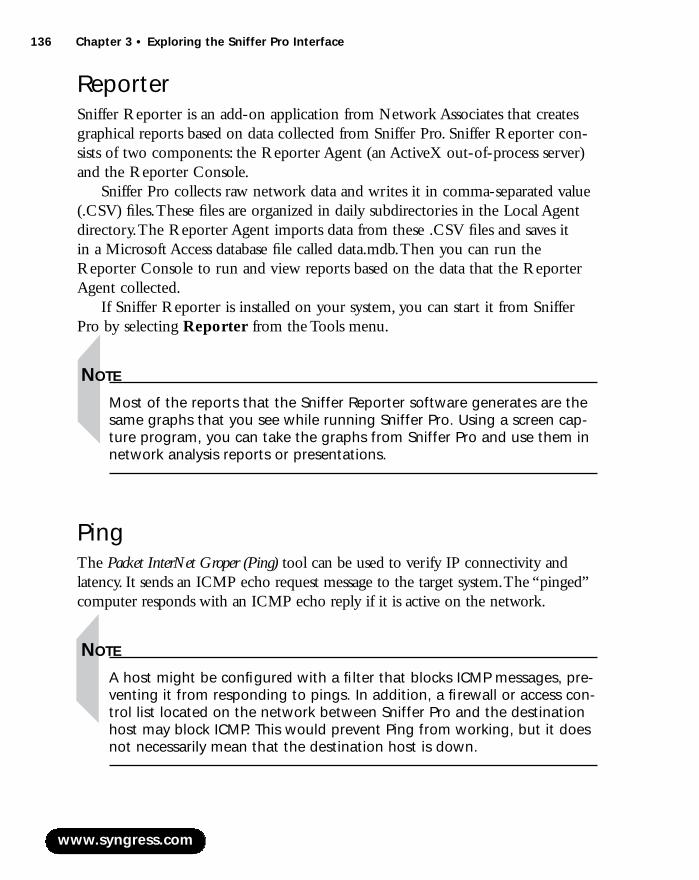
136 Chapter 3 • Exploring the Sniffer Pro Interface
ReporterSniffer Reporter is an add-on application from Network Associates that createsgraphical reports based on data collected from Sniffer Pro. Sniffer Reporter con-sists of two components: the Reporter Agent (an ActiveX out-of-process server)and the Reporter Console.
Sniffer Pro collects raw network data and writes it in comma-separated value(.CSV) files.These files are organized in daily subdirectories in the Local Agentdirectory.The Reporter Agent imports data from these .CSV files and saves it in a Microsoft Access database file called data.mdb.Then you can run theReporter Console to run and view reports based on the data that the ReporterAgent collected.
If Sniffer Reporter is installed on your system, you can start it from SnifferPro by selecting Reporter from the Tools menu.
NOTE
Most of the reports that the Sniffer Reporter software generates are thesame graphs that you see while running Sniffer Pro. Using a screen cap-ture program, you can take the graphs from Sniffer Pro and use them innetwork analysis reports or presentations.
PingThe Packet InterNet Groper (Ping) tool can be used to verify IP connectivity andlatency. It sends an ICMP echo request message to the target system.The “pinged”computer responds with an ICMP echo reply if it is active on the network.
NOTE
A host might be configured with a filter that blocks ICMP messages, pre-venting it from responding to pings. In addition, a firewall or access con-trol list located on the network between Sniffer Pro and the destinationhost may block ICMP. This would prevent Ping from working, but it doesnot necessarily mean that the destination host is down.
www.syngress.com
219_sniffer_03.qxd 6/28/02 11:49 AM Page 136

Exploring the Sniffer Pro Interface • Chapter 3 137
To use the Ping tool provided by Sniffer Pro, either select Ping from theTools menu or use the keyboard shortcut, Alt+1.When the Ping windowappears, enter the hostname or IP address of the host that you want to ping. If ahostname is used, the Ping tool will resolve it to an IP address automatically.Atimeout value can also be entered (the default is 300 milliseconds). If an ICMPecho reply message is not received within the timeout value specified, the host isdeclared inactive.
If a host is active on the network, the Ping program returns a “ping time” or“latency.”The latency value is usually measured in milliseconds (1/1000th of asecond) and specifies the round-trip delay in communicating with the destinationhost. Generally, the lower the latency, the better your network.
Trace RouteThe Trace Route tool is used to discover the Layer 3 path packets take when theytravel to their destination.Trace Route works by sending out an ICMP echopacket with a time-to-live (TTL) value of 1.When this packet reaches the firsthop, it sends back an ICMP error message indicating that the TTL has expired.The packet is then sent again with a TTL value of 2, and the second hopresponds with a TTL expired message.The process is repeated until the final des-tination is reached.This system allows the Trace Route tool to collect a list of allthe intermediate router IP addresses and associated delays.
NOTE
Trace Route displays the outbound path from a source host to the desti-nation. It does not trace the return path, which can differ from the out-bound path.
To use the Trace Route tool, select Trace Route from the Tools menu oruse the keyboard shortcut, Alt+2.When the Trace Route window appears, enterthe hostname or IP address of the host that you want to trace the path to. If ahostname is entered, the Trace Route tool resolves it to an IP address automati-cally.A timeout value can also be specified (the default is 300 milliseconds).
When you click OK, the Trace Route process starts and displays the Layer 3path and delays between the Sniffer Pro system and the destination host.After theprocess completes,Trace Route performs a DNS lookup and displays the results
www.syngress.com
219_sniffer_03.qxd 6/28/02 11:49 AM Page 137

138 Chapter 3 • Exploring the Sniffer Pro Interface
in the Trace Route window. If you prefer to see the results in a table or a chart,click the Table or Chart tabs located at the bottom of the Trace Route window.
The delay displayed in the last line of Trace Route is the same as the totaldelay between Sniffer Pro and the destination host.You would obtain this samevalue if you performed a ping. Essentially,Trace Route is two tools,Trace Routeand Ping, combined into one.
DNS LookupThe Domain Name System (DNS) Lookup tool is used to resolve a domain nameto an IP address, or vice versa. It sends a query to the DNS server (as configuredin the TCP/IP properties of the Network Adapter on the Sniffer Pro system) anddisplays the results of the query in the window.
To use the DNS Lookup tool, either select DNS Lookup from the Toolsmenu or use the keyboard shortcut, Alt+3. Enter an IP address or a domainname, and click OK.
NOTE
In some cases, a domain name might resolve to multiple IP addresses.This might be normal behavior. Sometimes administrators assign multipleIPs to a domain name for load-balancing purposes.
Finger The Finger tool is used to provide information about users who have accounts ona particular system.The Finger protocol runs on TCP port 79 and is generallysupported on UNIX and Linux systems. Details on the finger protocol can befound in RFC 1288.
To use the Finger tool, either select Finger from the Tools menu or use thekeyboard shortcut, Alt+4. Enter the IP address or hostname of the machine thatyou want to query in the “Host” field. In the “Query” field, enter the usernameyou want to query for, or leave the field blank to query all users. Click OK torun the finger.The results will be displayed in the Finger window.
WhoIsThe WhoIs tool is used to search a “whois?” directory for a registered domainname, IP address, or user’s name.This tool provides information on networks and
www.syngress.com
219_sniffer_03.qxd 6/28/02 11:49 AM Page 138
Exploring the Sniffer Pro Interface • Chapter 3 139
domains, the registrant, contact information, and domain servers. Detailed infor-mation on the “whois?” protocol can be found in RFC 954.The “wh is?” pro-tocol contacts a “whois?” server over TCP port 43 to retrieve information.
To use the WhoIs tool, either select WhoIs from the Tools menu or use thekeyboard shortcut, Alt+5. In the “Query” field, enter the domain name, IPaddress, username, or user ID that you want to search for.You can also specify aserver in the “Server” field (the default is rs.internic.net).When you click OK,the results will be displayed in the WhoIs window.
Address BookTo make Sniffer Pro screens easier for the network technician to read, Sniffer Prohas the ability to display names associated with captured addresses instead of theactual network or data link layer addresses.This information can be stored perma-nently in the Address Book.The Address Book can be accessed by selecting theAddress Book option under the Tools menu or by clicking the Address Bookicon on the Sniffer Pro toolbar.The Address Book is discussed in detail later inthis chapter in the “Using the Address Book” section.
The ExpertAlthough the monitor applications in Sniffer Pro can be used to gather statisticaldata on the network, to perform detailed network analysis you must perform acapture of the network data and use the Expert analysis features provided inSniffer Pro.The Expert gathers information about your network as frames arecaptured and performs real-time analysis on them. It compares the capturedframes against an experience-based knowledge database to find problems on yournetwork.The Expert can then provide a description of the problems on yournetwork, along with possible causes and recommended actions.
The CaptureTo start the Sniffer Pro Expert, you must start a capture. By default, expert anal-ysis is performed in real time as data is captured. If the Sniffer Pro system is notvery powerful, you might choose to turn off real-time Expert.To disable it, selectTools | Expert Options. Click the Objects tab. Deselect the “Expert DuringCapture” check box.This will cause the expert analysis to take place after thecapture has stopped and the display function is selected.
www.syngress.com
219_sniffer_03.qxd 6/28/02 11:49 AM Page 139
140 Chapter 3 • Exploring the Sniffer Pro Interface
When you start a capture, Sniffer Pro opens its Expert window.This windowcan be used to monitor Expert objects, symptoms, and diagnoses in real time.When you stop and display the capture, the Expert window has six tabs: Expert,Decode, Matrix, Host Table, Protocol Distribution, and Statistics.
False PositivesA false positive occurs when there isn’t a problem on the network, yet Sniffer Prothinks there is one.A false positive can waste your time if it is not identified imme-diately. Keep an eye out for false positives when you view Sniffer Pro data.The net-work analyzer provides you with plenty of data, but it is your job to interpret it andseparate the true problems on the network from the false positives.
NOTE
A common false positive on many networks is “Loops on Same Request,”indicating that a station is repeating a request it has already sent outand for which it received a valid response. This result can also be causedby inefficient applications. For example, some X Windows applicationscontinuously check the location of the mouse cursor, which causes thisfalse positive.
Another common false positive is “WINS No Response,” indicatingthat a WINS server did not respond to a client query within a reasonableamount of time. This response can occur if a client machine is trying toaccess a NetBIOS system that does not exist.
The Decode TabThe Decode tab shows the decoded packets that were captured from the wire. Itis divided into three viewing panes (see Figure 3.21):
■ Summary The Summary pane shows a high-level overview of thepackets, with one packet per line.
■ Detail The Detail pane shows the detailed contents of the packet that iscurrently selected in the summary pane. It shows the breakdown of thepacket contents with individual headers and fields and their meanings.Sniffer Pro shows all the protocol layers in the detail pane.You can clicknext to the minus (-) or plus (+) signs in front of a protocol sublayerline to expand or contract it.
www.syngress.com
219_sniffer_03.qxd 6/28/02 11:49 AM Page 140

Exploring the Sniffer Pro Interface • Chapter 3 141
■ Hex The Hex pane shows the selected packet in hexadecimal andASCII (or EBCDIC) format.This is a representation of what the rawdata looks like on the wire when it is converted into bits.When youselect a protocol field in the detail pane, its hexadecimal equivalent isselected in this pane.This can help you quickly map the protocol decodeto its hexadecimal value in the packet.
Sniffer Pro timestamps each frame as it is captured.Three basic timestamps areavailable in the Summary pane (see Figure 3.22). Each timestamp is very useful:
■ Relative This timestamp indicates the amount of time elapsed betweenthe marked frame in the capture and the current frame. By default, thefirst frame in a capture is marked.This timestamp can come in handywhen you are timing an entire process. For example, if you wanted toknow how long a Web page took to download, you can easily determinethis information by looking at the timestamps of the first and last HTTPpackets.
■ Delta This timestamp indicates the amount of time elapsed betweenthe previous frame in the capture and the current frame.This timestampis useful if you are looking at the latency between network requests andresponses. If users are complaining that a database is running slowly, youcan take a capture of the database queries and responses at the server.The delta timestamp can show you the delay between when a clientrequest was received and when the database server responded (bylooking at the delta between the command and response packets).You
www.syngress.com
Figure 3.21 The Decode Tab
Summary
Detail
Hex
219_sniffer_03.qxd 6/28/02 11:49 AM Page 141
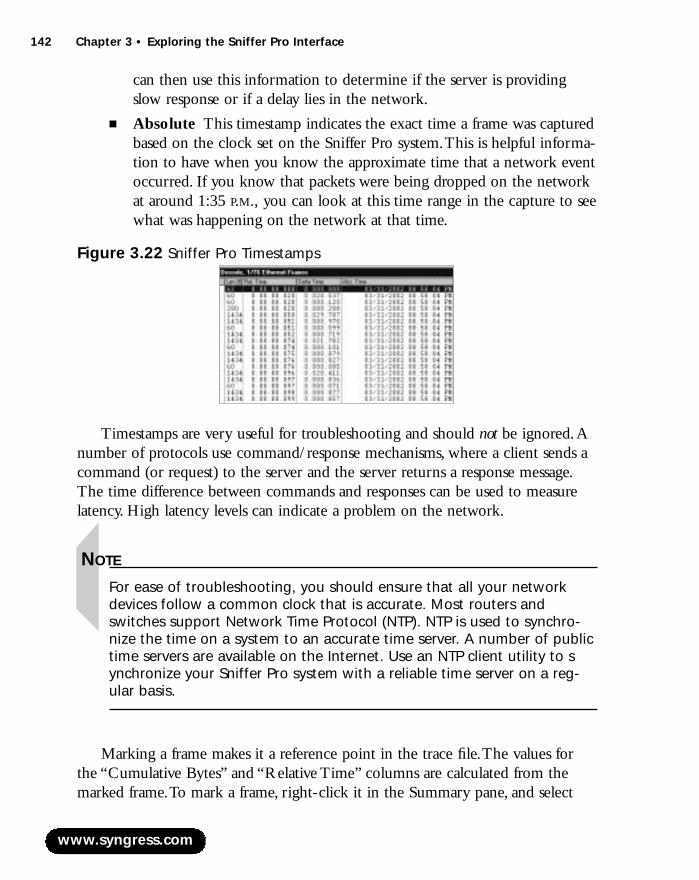
142 Chapter 3 • Exploring the Sniffer Pro Interface
can then use this information to determine if the server is providingslow response or if a delay lies in the network.
■ Absolute This timestamp indicates the exact time a frame was capturedbased on the clock set on the Sniffer Pro system.This is helpful informa-tion to have when you know the approximate time that a network eventoccurred. If you know that packets were being dropped on the networkat around 1:35 P.M., you can look at this time range in the capture to seewhat was happening on the network at that time.
Timestamps are very useful for troubleshooting and should not be ignored.Anumber of protocols use command/response mechanisms, where a client sends acommand (or request) to the server and the server returns a response message.The time difference between commands and responses can be used to measurelatency. High latency levels can indicate a problem on the network.
NOTE
For ease of troubleshooting, you should ensure that all your networkdevices follow a common clock that is accurate. Most routers andswitches support Network Time Protocol (NTP). NTP is used to synchro-nize the time on a system to an accurate time server. A number of publictime servers are available on the Internet. Use an NTP client utility to synchronize your Sniffer Pro system with a reliable time server on a reg-ular basis.
Marking a frame makes it a reference point in the trace file.The values forthe “Cumulative Bytes” and “Relative Time” columns are calculated from themarked frame.To mark a frame, right-click it in the Summary pane, and select
www.syngress.com
Figure 3.22 Sniffer Pro Timestamps
219_sniffer_03.qxd 6/28/02 11:49 AM Page 142
Exploring the Sniffer Pro Interface • Chapter 3 143
Mark Current Frame (you can also select Mark Current Frame from theDisplay menu).This choice places an “M” in the “Status” column of the frame,indicating that the frame is marked.You can have one and only one markedframe in any capture.To find the marked frame, right-click in the Summary pane,and select Go to Marked Frame.
To select individual frames, click the check box in the leftmost column of theSummary pane.To select a range of frames, you can right-click in the Summarypane, and select Select Range (this option is also available in the Display menu).You can navigate through the selected frames by selecting Previous Selectedand Next Selected in the Display menu, or right-click in the Summary paneand select the same options.You can open the selected frames in a new windowand save them as a separate file. Select the Save Selected option from theDisplay menu, or right-click in the Summary pane.
You can use the Packet Generator to transmit an individual frame or theentire capture buffer back on the wire.To do this, select the Send CurrentFrame or Send Current Buffer options accordingly.
MatrixThe Matrix collects a list of all conversations between network hosts and thetraffic statistics for those conversations.This section discusses the Matrix monitorapplication, but the Matrix tab in the Expert window offers similar functionality.The Matrix can be viewed using MAC addresses, IP addresses, or IPX addresses.You can select this option by selecting the appropriate tab at the bottom of theMatrix window. Figure 3.23 shows the Matrix toolbar.
The Matrix can be viewed five different ways.To view an outline table,which shows a list of conversations between hosts and the bytes transmittedbetween them, click the Outline icon.To view a detailed table, which providesmore detailed information including upper-layer protocols, click the Detail icon.You can sort both these tables by any column.To sort by a particular field, simplyclick the column heading. For example, if you wanted to find the conversationthat is generating the most amount of traffic on the network, click the columnlabeled Bytes.To view the top N conversations on the network in a bar chart,click the Bar icon. By default, this choice displays the top 10 conversations.Youcan view the same data in pie chart format by clicking the Pie icon. One of theunique views that the Matrix offers is the Map view, which is accessible byclicking the Map icon.This option shows a map of traffic patterns between hosts(see Figure 3.24 for an example).
www.syngress.com
219_sniffer_03.qxd 6/28/02 11:49 AM Page 143

144 Chapter 3 • Exploring the Sniffer Pro Interface
In the Map view, if you hold the mouse over a line, you will see thethroughput of that particular conversation. Hold your mouse cursor over anaddress to enlarge the address. Selecting several station addresses and clicking theDefine Filter icon in the toolbar creates a filter with just the selected hosts.
While in the Outline view, you have the option to capture between twogiven stations. Select a pair of stations by clicking them, and then click theCapture icon in the Matrix toolbar.You can also define a capture filter for twohosts. Select the two stations (click the first one, then hold the Control key downand click the second one), and then click the Define Filter icon in the Matrixtoolbar.
www.syngress.com
Figure 3.23 Matrix Toolbar
Figure 3.24 Matrix Map View Example
Map
Outline
Detail
Bar
Pie
Capture
Define Filter
Pause
Refresh
Reset
Export
Properties
219_sniffer_03.qxd 6/28/02 11:49 AM Page 144

Exploring the Sniffer Pro Interface • Chapter 3 145
To pause the data in the Matrix and prevent it from updating, you can clickthe Pause icon.The Refresh icon updates the Matrix immediately.The Reseticon clears all the data in the Matrix, and data collection starts from scratch.
Data from the Matrix can be exported to a text file. Click the Export iconto save the data in comma-, tab-, or space-delimited format.
Matrix options can be configured by clicking the Properties icon. In theGeneral tab, there are three configurable options.You can select the Show RawAddress option if you prefer to see MAC addresses as they are rather than lettingSniffer Pro translate the vendor part.You also have the ability to configure howoften the Matrix updates (the default is every 1 second) and how often the datashould be sorted (the default is every 60 updates). In the Traffic Map tab, youcan select the colors that are used in the traffic map view.There are two config-urable options in the TopN Chart tab.The charts can be sorted by total bytes, inbytes, out bytes, in packets, out packets, or total packets (the default is total bytes).The number of conversations that should be displayed in the top N can also beselected (the default is 10).
NOTE
The Matrix offers a number of practical uses. It can be used to take aquick look at who is talking to whom. The Map view is excellent to see ifthere are any misconfigured routers that are routing traffic that theyshould not be routing. It is also useful for looking at throughput statis-tics between stations. Another useful feature of the Matrix is the abilityto select hosts and quickly define a filter on them.
Host TableThe Host Table collects a list of all the nodes from which traffic was seen and dis-plays traffic statistics for all those nodes. For LAN adapters, this informationincludes data link and network layer addresses.This section discusses the HostTable monitor application, but the Host Table tab in the Expert window offerssimilar functionality.The Host Table can be viewed by MAC addresses, IPaddresses, or IPX addresses by selecting the appropriate tab at the bottom of theHost Table window. Figure 3.25 shows the Host Table toolbar.
www.syngress.com
219_sniffer_03.qxd 6/28/02 11:49 AM Page 145

146 Chapter 3 • Exploring the Sniffer Pro Interface
The Host Table supports four different views: Outline, Detail, Bar, and Pie.The outline table can be selected by clicking the Outline icon. It shows a list ofhosts and the bytes transmitted in and out of them.The detail table, which pro-vides more detailed information including upper-layer protocols, can be viewedby clicking the Detail icon.To sort either table by a particular column, simplyclick the column heading. For example, if you wanted to find the host that istransmitting the most amount of traffic on the network, you would click thecolumn labeled Out Bytes.To view the top N hosts on the network in a barchart, click the Bar icon. By default, this choice displays the top 10 hosts.Thesame data can be viewed in pie chart format by clicking the Pie icon.
While in the Outline view, you have the option to capture data to and from aparticular station. Select a station by clicking it, and then click the Capture iconin the Host Table toolbar.You can also define a capture filter based on a particularhost. Select the station by clicking it, and then click the Define Filter icon inthe Host Table toolbar.
To pause the data in the host table and prevent it from updating, you canclick the Pause icon.The Refresh icon updates the host table immediately.TheReset icon clears all the data in the host table, and data collection starts fromscratch.
Host Table data can be exported to a text file. Click the Export icon to savethe data in comma-, tab-, or space-delimited format.
www.syngress.com
Figure 3.25 Host Table Toolbar
Outline
Detail
Bar
Pie
Capture
Define Filter
Pause
Refresh
Reset
Export
Properties
Single Station
219_sniffer_03.qxd 6/28/02 11:49 AM Page 146

Exploring the Sniffer Pro Interface • Chapter 3 147
Host Table options can be configured by clicking the Properties icon. In theGeneral tab, there are three configurable options.You can select the Show RawAddress option if you prefer to see MAC addresses as they are rather than lettingSniffer Pro translate the vendor part.You also have the ability to configure howoften the data in the Host Table updates (the default is every 1 second) and howoften the table should be sorted (the default is every 60 updates). In the TopNChart tab are two configurable options.The charts can be sorted by total bytes,in bytes, out bytes, in packets, out packets, or total packets (the default is totalbytes).You can also select how many hosts should be displayed in the top talkers(the default is 10).
The Single Station icon is available only in the Outline view of the HostTable. It allows you to select a station and view a Matrix that shows conversationsthat are only to and from that station.
Protocol DistributionProtocol Distribution collects a list of all the protocols seen on the network.Thissection discusses the Protocol Distribution monitor application, but the ProtocolDistribution tab in the Expert window offers similar functionality. ProtocolDistribution can be viewed by MAC, IP, or IPX by selecting the appropriate tab atthe bottom of the window. Figure 3.26 shows the Protocol Distribution toolbar.
Three views are available for Protocol Distribution.To view the data as a bargraph, click the Bar icon.To see the same data in pie chart format, click the Pieicon. If you would like to see the data in a tabular format, click the Table icon.
www.syngress.com
Figure 3.26 Protocol Distribution Toolbar
Bar
Pie
Table
Packets
Bytes
Pause
Refresh
Reset
Export
219_sniffer_03.qxd 6/28/02 11:49 AM Page 147

148 Chapter 3 • Exploring the Sniffer Pro Interface
Protocol Distribution can be viewed by number of packets or number of bytes.Click the appropriate icon in the toolbar.You might be surprised to see which pro-tocols are active on the network and how much bandwidth they are consuming.
NOTE
If you have recently migrated your network from one protocol toanother, you should use Protocol Distribution to see if the legacy pro-tocol is still enabled on any hosts on the network. You might havemigrated from NetBEUI to TCP/IP to reduce broadcasts on the networkand to enable cross-network connectivity. However, if NetBEUI is stillenabled on certain hosts, those hosts will continue to generate unneces-sary traffic on the network.
To pause the Protocol Distribution data and prevent it from updating, youcan click the Pause icon.The Refresh button updates the Protocol Distributionimmediately.The Reset icon clears all the data in Protocol Distribution, and thedata collection starts from scratch.
The Protocol Distribution data can be exported to a text file.To perform thisfunction, click the Export icon.You will have the option of saving the data incomma-, tab-, or space-delimited format.
StatisticsThe Statistics tab in the Expert shows a table with overall statistics for the cap-ture, including the start capture time, the duration of the capture, total bytes andpackets captured, bytes per second, average utilization, and line speed. It also pro-vides a breakdown of the number of packets captured by protocol (IP,TCP, UDP,ICMP, IPX, and so on).
To save the statistics to a text file, click the Export icon in the toolbar.Youcan save the file in comma-, tab-, or space-delimited format.
Graphs, Charts, and Maps“Graphs are worth a thousand packets,” as a variation on the old saying goes.Thevarious graphs provided by Sniffer Pro provide visual representations of your net-work’s traffic.These graphs can be used to provide a high-level overview of whatis happening on the network.Anomalies can easily be identified, and captures can
www.syngress.com
219_sniffer_03.qxd 6/28/02 11:49 AM Page 148
Exploring the Sniffer Pro Interface • Chapter 3 149
be performed based on addresses or protocols as necessary to track down thecause of the anomalies. Graphs are most helpful when presenting data to manage-ment.You can easily show if a machine is being overloaded from a network per-spective.You can demonstrate that a particular application is taking up too muchbandwidth and that a network upgrade or an application modification is neces-sary.You might also find protocols active on the network that should be disabled.
Graphs are helpful for use in network analysis reports to make the data easyto read and understand.You can export data from Sniffer Pro and use it to gen-erate custom graphs in other applications such as Microsoft Excel.
Top TalkersThe Top Talkers on the network can be identified using the Sniffer Pro Host Tablefeature.The Host Table provides a list of the chattiest machines, either by packetsize or by the number of packets.You can further drill down into this data andget the list of protocols and the amount of traffic being generated by each pro-tocol on a per-host basis (the Detail view).You might find that a single user isclogging your connection to the Internet by streaming audio or video.You canuse the Host Table to find the system and educate the user about audio/videostreaming and its effects on network performance.The Host Table could displayother anomalies, such as a machine on the network that is transmitting continu-ously.This phenomenon, known as jabbering, can be caused by a malfunctioningnetwork card.
Heavy Protocol DistributionThe Protocol Distribution graph can be a very important tool for a network ana-lyst.Whether used in a production or development environment, it can be usedfor baselining network usage based on application. If a network link is sufferingfrom heavy utilization, Protocol Distribution can help determine the cause of thecongestion by displaying the list of applications that are running on the link.Youmight find unwanted traffic on the network (for example, MP3 downloadsthrough Napster or Morpheus) that is taking up bandwidth that should be allo-cated to more important applications (business applications such as Oracle, SAP,or Peoplesoft).This data can be used to create access lists on a router to blockundesired traffic or to prioritize desired traffic and implement quality of serviceon the network.
If many network protocols are being classified as “Others,” you should cus-tomize Sniffer Pro based on the applications used on your network by selectingthe Protocols tab under Tools | Options. Here, you can add custom TCP,
www.syngress.com
219_sniffer_03.qxd 6/28/02 11:49 AM Page 149
150 Chapter 3 • Exploring the Sniffer Pro Interface
UDP, and IPX protocols. For example, if your enterprise messaging and collabo-ration system runs on Lotus Notes/Domino, you can add TCP port 1352 withthe protocol name Lotus_Notes.This is the port used by Lotus Notes for RPCand replication functions.The next time you start Sniffer Pro, Lotus Notes willno longer be classified under “Others” and will show up as its own protocolentry in the Protocol Distribution chart.
NOTE
Always maintain a complete list of the port numbers that the applica-tions on your network use. For a list of well-known and registered portnumbers, refer to the Internet Assigned Numbers Authority (IANA) Website at www.iana.org.
Creating a List of Hosts on Your NetworkMaintaining a list of hosts on your network is a very important task. Generally,various network services are dedicated to assigning names to machines (NIS,DNS,WINS, and so on). However, these services do not keep complete track ofall information.The Sniffer Pro Address Book can track machine names and theirnetwork layer and data link layer addresses.
This information is very useful for troubleshooting.What if you see excessiveNetBEUI broadcasts from the MAC address 00-00-86-41-D8-47? Would youknow where to find the machine so you can check its NetBEUI configurationsettings? Network troubleshooting is an end-to-end task that generally requiresyou to trace a path between two communicating hosts at the physical, data link,and network layers.This task becomes a lot easier if you maintain a list of hostson the network.You can query ARP tables on routers to find the MAC addressassociated with an IP address.You can further query address tables in switches tofind the port with which a MAC address is associated. If you maintain a list ofhostnames, network layer, and data link addresses, you can always refer to yourdatabase to troubleshoot problems.
Using the Address BookSniffer Pro provides an Address Book feature so that you can assign recognizablenames to network nodes.These friendly names are displayed instead of networkand data link layer addresses on the following screens in Sniffer Pro:
www.syngress.com
219_sniffer_03.qxd 6/28/02 11:49 AM Page 150

Exploring the Sniffer Pro Interface • Chapter 3 151
■ Capture decode display
■ Expert display
■ Host table displays (monitor and capture)
■ Matrix displays (monitor and capture)
■ Filter definitions
Figure 3.27 shows the Address Book toolbar. Most of the icons in the toolbarhave obvious functions.The Sort by Medium icon groups entries alphabeticallyby their network type (Ethernet,Token Ring,ATM, and so on).
Adding New AddressesThere are multiple ways to populate entries in the Address Book. Each of thesemethods is described in detail below:
■ Entering the names manually
■ Importing an external address table from a CSV file
■ Using the Address Book autodiscovery feature
■ Adding names discovered by the Expert
To create an entry in the Address Book manually, open and click the NewAddress icon in the Address Book toolbar.This choice brings up the New/EditAddress screen (see Figure 3.28).You can enter the name of a host, specify the
www.syngress.com
Figure 3.27 Sniffer Pro Address Book Toolbar
New Address
Edit Address
Delete Address
Delete All Addresses
Undo
Redo
Sort By Medium
Autodiscovery
Export
219_sniffer_03.qxd 6/28/02 11:49 AM Page 151
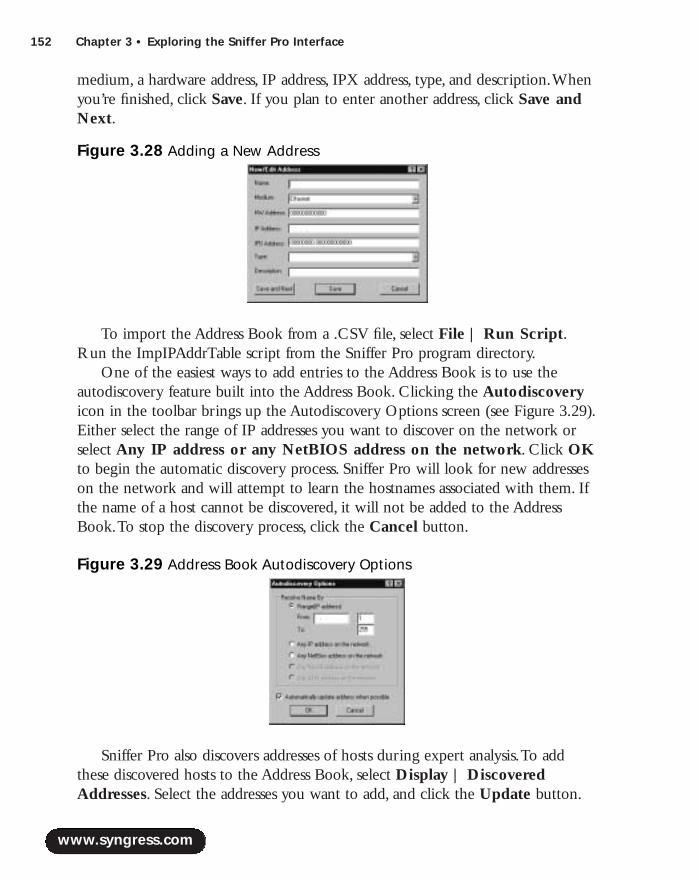
152 Chapter 3 • Exploring the Sniffer Pro Interface
medium, a hardware address, IP address, IPX address, type, and description.Whenyou’re finished, click Save. If you plan to enter another address, click Save andNext.
To import the Address Book from a .CSV file, select File | Run Script.Run the ImpIPAddrTable script from the Sniffer Pro program directory.
One of the easiest ways to add entries to the Address Book is to use theautodiscovery feature built into the Address Book. Clicking the Autodiscoveryicon in the toolbar brings up the Autodiscovery Options screen (see Figure 3.29).Either select the range of IP addresses you want to discover on the network orselect Any IP address or any NetBIOS address on the network. Click OKto begin the automatic discovery process. Sniffer Pro will look for new addresseson the network and will attempt to learn the hostnames associated with them. Ifthe name of a host cannot be discovered, it will not be added to the AddressBook.To stop the discovery process, click the Cancel button.
Sniffer Pro also discovers addresses of hosts during expert analysis.To addthese discovered hosts to the Address Book, select Display | DiscoveredAddresses. Select the addresses you want to add, and click the Update button.
www.syngress.com
Figure 3.28 Adding a New Address
Figure 3.29 Address Book Autodiscovery Options
219_sniffer_03.qxd 6/28/02 11:49 AM Page 152

Exploring the Sniffer Pro Interface • Chapter 3 153
NOTE
For autodiscovery of DNS names to work, you must have DNS serversconfigured in the TCP/IP settings of the Sniffer Pro system.
Exporting the Address BookThe Address Book can be exported to a text file. Open the Address Book, andclick the Export icon.You will be prompted for a filename and location towhich to export the Address Book entries.You will have the option to select thefile type: comma delimited (*.CSV), tab delimited (*.TXT), or space delimited(*.PRN). Enter the filename and location, select the file type, and click the Savebutton.The Address Book database can be very useful as a baseline for the list ofall hosts on your network.You can import it into a spreadsheet and use it fortroubleshooting purposes when there are problems.
www.syngress.com
219_sniffer_03.qxd 6/28/02 11:49 AM Page 153
154 Chapter 3 • Exploring the Sniffer Pro Interface
SummarySniffer Pro is a very complex program with many different features and func-tions. However, its graphical user interface, tool tips, and context-sensitive helpmake it easy to learn.
In this chapter, we explored the various menu options and toolbars thatSniffer Pro has to offer.We also discussed some of the monitor applications(Dashboard, Host Table, Matrix,Application Response Time, history samples,Protocol Distribution, and Global Statistics) that are a part of Sniffer Pro.Welearned how to use the Switch Expert to gather data from switches using SNMP.The Alarm Log is another useful feature. It tracks network events that haveexceeded a configurable threshold value.
We learned how to start, stop, display, save, and open captures.The Sniffer ProExpert can analyze capture files in real time.The Expert analyzes network trafficas it is captured to find problems that might exist on the network.
Sniffer Pro provides a number of additional tools that aid in troubleshooting.We learned how to use the Packet Generator, the Address Book, and the ping,Trace Route, DNS lookup, finger, and Who Is utilities.
We explored some of the Sniffer Pro graphs and charts.These graphs are veryuseful for presenting data to management or creating reports. (Reporting is dis-cussed in detail in Chapter 10,“Reporting.”) Now that we have learned theSniffer Pro interface, we can start using the software to perform captures, createfilters, and analyze the network.
Solutions Fast Track
Exploring the Dashboard
! The Sniffer Pro Dashboard provides dials that show percent utilization,packets per second, and errors per second.
! The Dashboard can provide a detailed tabular view as well as short-termand long-term graphs for network, size distribution, and detailed errorstatistics.
! A network technician can modify and customize the thresholds used bythe Dashboard.
www.syngress.com
219_sniffer_03.qxd 6/28/02 11:49 AM Page 154
Exploring the Sniffer Pro Interface • Chapter 3 155
Understanding Menus
! The File menu mainly provides options related to opening and savingcapture files.The Select Settings option can be used to select, create, ormodify agents. Printing capability is also available from virtually allscreens in Sniffer Pro.
! The Monitor menu focuses on the various monitor applications thatSniffer Pro provides: Dashboard, Host Table, Matrix,Application ResponseTime, history samples, Protocol Distribution, and Global Statistics. It alsoprovides access to the Switch expert, monitor filters, and the Alarm Log.
! The Capture menu provides capture-related functions such as starting,stopping, and displaying captures. It also provides access to capture filtersand triggers.
! The Display menu is used primarily when viewing captures. It allows foreasy navigation between frames. It also provides access to Display filtersand the Display setup.
! The Tools menu provides troubleshooting tools as well as the AddressBook and the Packet Generator.
! History samples can be used to collect a variety of network statistics overa period of time and are useful in establishing a network baseline.Thelist of available history samples depends on the type of network beingmonitored (Token Ring, Ethernet, and the like).
! The Switch Expert uses Simple Network Management Protocol(SNMP) to retrieve and display statistics from the ManagementInformation Bases (MIBs) on network switches. It can also enable portmirroring for a single port or VLAN.
! Sniffer Pro maintains an Alarm Log in which it logs all events thatexceed thresholds.The two sources of alarm events are the Monitor andthe Expert.Alarm actions are used to notify a network administratorwhen a threshold is reached.
Understanding the Toolbars
! The main toolbar in Sniffer Pro provides many of the same functionsavailable in the menu options.The toolbar includes capture file options(Open, Save, Print,Abort Print), monitor applications (Dashboard, Host
www.syngress.com
219_sniffer_03.qxd 6/28/02 11:49 AM Page 155

156 Chapter 3 • Exploring the Sniffer Pro Interface
Table, Matrix,Application Response Time, History Samples, ProtocolDistribution, Global Statistics,Alarm Log), and other miscellaneous items(Capture Panel,Address Book, Stop).
! Sniffer Pro provides a wizard for easy creation of filters.The Definefilter icon can be used to start the wizard, which guides you throughfilter setup.
! By default, Sniffer Pro saves capture files in uncompressed format.Tosave them in compressed format, use the .CAZ extension.
Miscellaneous Sniffer Pro Tools
! The Packet Generator can be used to stress-test the network by puttingload on it. Captured frames can be transmitted back on the network, ornew frames can be created in hexadecimal.
! The Ping and Trace Route tools can be used to verify IP connectivityand map the Layer 3 path between Sniffer Pro and a destination host.
! The Who Is, DNS, and Finger utilities can be used to get moreinformation about machines, including domain name information,WhoIs information, and the list of logged-in users.
The Expert
! The Sniffer Pro Expert analyzes data in real time to find objects,symptoms, and diagnoses on the network.
! The Expert requires that data be captured on the network before it isanalyzed.
! The Decode tab of the Sniffer Pro Expert window shows the decodedpackets as they were captured.The decode display is divided into threepanes: Summary, Detail, and Hex.The Summary pane shows a high-leveloverview of packets, with one packet per line.The Detail pane shows abreakdown of all the packet contents, with individual headers and fields.The Hex pane provides a raw hexadecimal representation of the packet,with an ASCII or EBCDIC translation.
www.syngress.com
219_sniffer_03.qxd 6/28/02 11:49 AM Page 156
Exploring the Sniffer Pro Interface • Chapter 3 157
Graphs, Charts, and Maps
! The Host Table can be used to find the top talkers on the network.
! Protocol Distribution is another important graph that Sniffer Proprovides. It can be used to find misbehaving applications on thenetwork. It is also useful for characterizing existing applications andplanning for future growth and upgrades.
Using the Address Book
! The Address Book assigns familiar and recognizable names to hosts.These names are displayed instead of the data link and network layeraddresses in various screens.
! Entries in the Address Book can be created manually, autodiscovered, orimported from a .CSV file.
! The Address Book can be exported to a text file.
Q: When performing a capture, which parts of an Ethernet frame will SnifferPro capture?
A: Sniffer Pro captures the complete frame header, but it does not capture thepreamble. It also picks up the entire payload but does not capture the 4-byteCRC.Therefore, if an Ethernet frame has a length of 110 bytes, Sniffer Prowill represent it as 100 bytes.
Q: Is it possible to overload Sniffer Pro? How will I know if it is overloaded?
A: Sniffer Pro can be overloaded if too much traffic is sent to it. If you start cap-turing traffic from multiple hosts onto Sniffer Pro, the system might not beable to monitor and/or capture all the packets.To determine if Sniffer Pro is
www.syngress.com
Frequently Asked Questions
The following Frequently Asked Questions, answered by the authors of this book,are designed to both measure your understanding of the concepts presented in this chapter and to assist you with real-life implementation of these concepts. Tohave your questions about this chapter answered by the author, browse towww.syngress.com/solutions and click on the “Ask the Author” form.
219_sniffer_03.qxd 6/28/02 11:49 AM Page 157
158 Chapter 3 • Exploring the Sniffer Pro Interface
overloaded, look at the “dropped packets” statistic. If this number is high, con-sider upgrading your system.Alternatively, you can try to reduce the amountof traffic Sniffer Pro is monitoring.
Q: What is the Sniffer Pro Capture Panel?
A: When you start a capture in Sniffer Pro, the Capture Panel does not openautomatically.To see how many packets are captured, you can look at thestatus bar on the bottom right of the Sniffer Pro application.To get detailedinformation on the packets captured, capture buffer, and so on, you can startthe Capture Panel by selecting Capture | Capture Panel or clicking theCapture Panel icon in the toolbar.The Capture Panel shows you thenumber of packets seen, accepted, dropped, and rejected. It also shows thebuffer size, buffer action, and the elapsed time of the capture.
Q: Can the graphs from Sniffer Pro be exported?
A: No. Sniffer Pro only provides you the ability to save data from the graphs intext format.You can then import this data into a spreadsheet application suchas Microsoft Excel and create custom graphs.You can also use a screen cap-ture program to take snapshots of the graphs in Sniffer Pro and use these inreports. Finally, you also have the option of purchasing the NAI SnifferReporter application, which creates graphs based on data collected fromSniffer Pro.
Q: Can other protocol analyzers read data from Sniffer Pro capture files?
A: Sniffer Pro is the number-one commercial network analyzer in the industry.Most other network analyzers support reading trace files that are in theSniffer Pro file format.You can also use utilities that convert capture filesfrom one format to another. For example, the ProConvert utility fromWildPackets can convert over 20 different protocol analyzer file formats.
www.syngress.com
219_sniffer_03.qxd 6/28/02 11:49 AM Page 158
Configuring SnifferPro to MonitorNetworkApplications
Solutions in this chapter:
■ Basic Sniffer Pro Data Capture Operations
■ Viewing and Using the Expert
■ Application Response Time
■ Configuring Sniffer Pro to Capture andAnalyze NetWare Traffic
■ Configuring Sniffer Pro to Capture andAnalyze Microsoft Traffic
Chapter 4
159
! Summary
! Solutions Fast Track
! Frequently Asked Questions
219_sniffer_04.qxd 6/28/02 11:51 AM Page 159
160 Chapter 4 • Configuring Sniffer Pro to Monitor Network Applications
IntroductionSniffer Pro is a network analysis tool that can aid in application monitoring. Inthis chapter, we look at how to monitor your network applications. So far youhave learned a thing or two about networking, installed Sniffer Pro, and gonethrough the Sniffer Pro interface. Now let’s start looking at how to master theSniffer Pro tool to perform protocol analysis.
In this chapter we look not only at how to configure the Sniffer Pro to cap-ture traffic but also the real-life applications of using Sniffer Pro proactively andreactively with regard to your network applications.The network is meaningless ifyou are not doing anything with it, so it’s safe to say that you have an applicationor two running over it. Databases, DNS services, Microsoft browsers, NetWareSAP broadcasts, client/server problems, and printing services are just a small per-centage of what you could see flying across the wire.All these applications andissues are easily monitored using Sniffer Pro.This chapter shows you how to setup the monitoring function.
Basic Sniffer Pro Data Capture OperationsIn the earlier chapters of this book, you learned the fundamentals of the SnifferPro application. It’s a good start to know your application, how to get aroundwith it, and how to install it properly.To know your way around the Sniffer Proprotocol and network analyzer is only the beginning. It will take the remainderof this book to help you truly understand the application while you use it to per-form analysis.This chapter opens that first door to the experience of network andprotocol analysis with Sniffer Pro by explaining how to monitor your network’sapplications with this tool. On any (and almost every) network, some form oftraffic travels across it. It is safe to assume that you wouldn’t set up an expensiveinfrastructure without wanting to put applications and data on it.That being said,once you do in fact begin to inundate your network with such traffic, you mightbegin to experience subtle problems such as slow response time or a hung appli-cation. Before too long, you might have outgrown your network capabilities andbe asked to do more with less. (Sound familiar?) Your hubs that are running at10Mbps are just not cutting it anymore. So how do you argue for that networkupgrade? With Sniffer Pro, of course.What if you simply need to resolve aproblem or two? What could you depend on to help you isolate your problems?
www.syngress.com
219_sniffer_04.qxd 6/28/02 11:51 AM Page 160
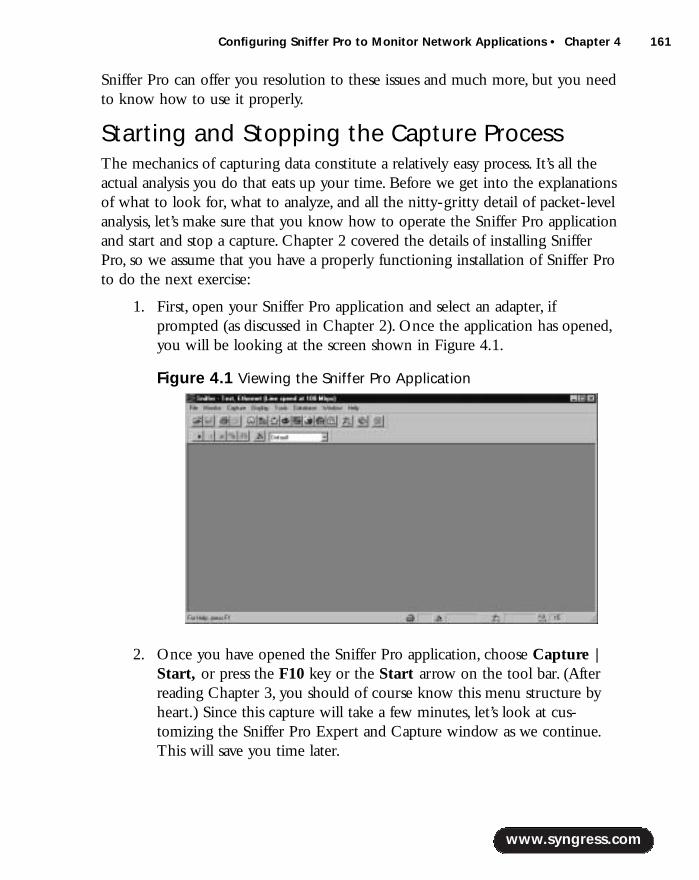
www.syngress.com
Sniffer Pro can offer you resolution to these issues and much more, but you needto know how to use it properly.
Starting and Stopping the Capture ProcessThe mechanics of capturing data constitute a relatively easy process. It’s all theactual analysis you do that eats up your time. Before we get into the explanationsof what to look for, what to analyze, and all the nitty-gritty detail of packet-levelanalysis, let’s make sure that you know how to operate the Sniffer Pro applicationand start and stop a capture. Chapter 2 covered the details of installing SnifferPro, so we assume that you have a properly functioning installation of Sniffer Proto do the next exercise:
1. First, open your Sniffer Pro application and select an adapter, ifprompted (as discussed in Chapter 2). Once the application has opened,you will be looking at the screen shown in Figure 4.1.
2. Once you have opened the Sniffer Pro application, choose Capture |Start, or press the F10 key or the Start arrow on the tool bar. (Afterreading Chapter 3, you should of course know this menu structure byheart.) Since this capture will take a few minutes, let’s look at cus-tomizing the Sniffer Pro Expert and Capture window as we continue.This will save you time later.
Configuring Sniffer Pro to Monitor Network Applications • Chapter 4 161
Figure 4.1 Viewing the Sniffer Pro Application
219_sniffer_04.qxd 6/28/02 11:51 AM Page 161

162 Chapter 4 • Configuring Sniffer Pro to Monitor Network Applications
3. Next, you will see that the expert system is invoked automatically withinthe Sniffer Pro application, as shown in Figure 4.2. Once it is opened,you will not see anything until you stop the capture to view it. Let thecapture run for a while, and let’s customize the expert system so you cansee incrementing problems in real time while it is doing so.We take amore detailed look at doing this later in the chapter as well.
4. Look at Figure 4.2.The Expert is rolled up to the left and you see onlya toolbar without much detail.To open the detail, find the little arrow inthe top-left corner of the Expert dialog box, just to the right of theword Layer.When you click the arrow, it reveals another portion of theExpert, as shown in Figure 4.3.
NOTE
There is much to see here, so don’t get overwhelmed. We explain all theportions of the Sniffer Pro Expert later in the chapter. For now, you justneed to know how to do a basic capture. All SCPs must understand themechanics and fundamentals of using their tools before performing anyheavy analysis with Sniffer Pro. After you master the “how,” you canthen master the “what” and the “why.”
www.syngress.com
Figure 4.2 Invoking the Expert System When Starting a Capture
219_sniffer_04.qxd 6/28/02 11:51 AM Page 162
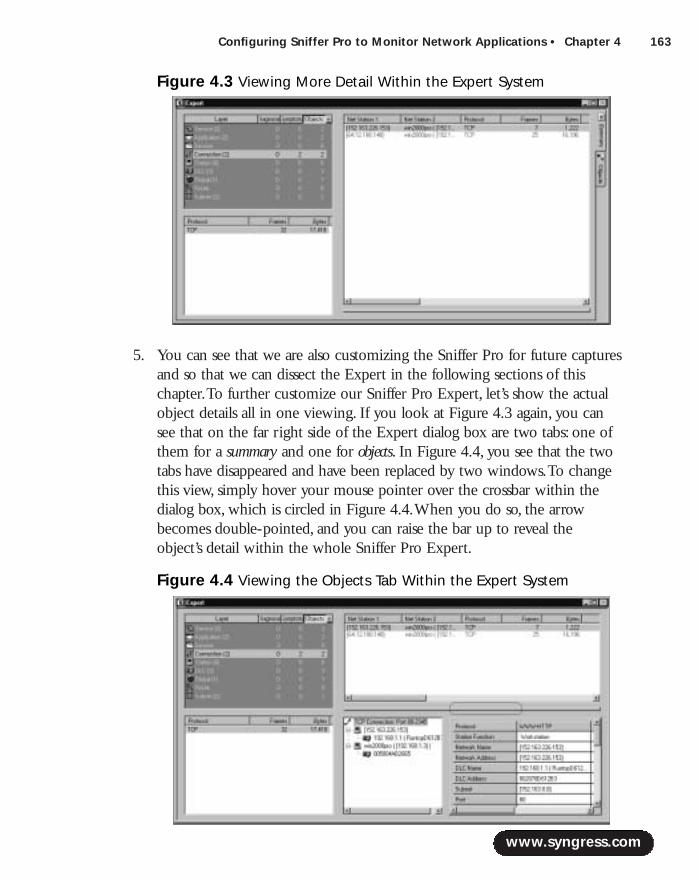
Configuring Sniffer Pro to Monitor Network Applications • Chapter 4 163
5. You can see that we are also customizing the Sniffer Pro for future capturesand so that we can dissect the Expert in the following sections of thischapter.To further customize our Sniffer Pro Expert, let’s show the actualobject details all in one viewing. If you look at Figure 4.3 again, you cansee that on the far right side of the Expert dialog box are two tabs: one ofthem for a summary and one for objects. In Figure 4.4, you see that the twotabs have disappeared and have been replaced by two windows.To changethis view, simply hover your mouse pointer over the crossbar within thedialog box, which is circled in Figure 4.4.When you do so, the arrowbecomes double-pointed, and you can raise the bar up to reveal theobject’s detail within the whole Sniffer Pro Expert.
www.syngress.com
Figure 4.3 Viewing More Detail Within the Expert System
Figure 4.4 Viewing the Objects Tab Within the Expert System
219_sniffer_04.qxd 6/28/02 11:51 AM Page 163

164 Chapter 4 • Configuring Sniffer Pro to Monitor Network Applications
6. You have now fully customized the Sniffer Pro Expert for easy viewing.Now, let’s end the capture. Go to the Capture menu once again andselect Stop or press F10.You can also use the toolbar and select theblack square box icon to do the same thing.
7. Once you stop the capture, nothing happens.This is because you havenot yet asked Sniffer Pro to display the contents of the capture.Youcould have also pressed the F9 key to Stop and Display, or you could goto the Capture menu and select Stop and Display.You can use thetoolbar icon that looks like a black square box with a set of binoculars toperform a Stop and Display as well. Since we stopped it first, you canselect Display from the Capture menu, press the F5 key, or use the setof binoculars in the toolbar only. For this exercise, select Display fromthe Capture menu.When you do so, the Sniffer Pro Expert seems tominimize and maximize quickly, and you are then shown the Expertdialog box once again, as illustrated in Figure 4.5.
8. When you look at the dialog box now (after stopping the capture), yousee a few very important changes.The first change you see is thatnothing is incrementing within the Sniffer Pro Expert anymore. It is safeto say that since you stopped the capture, you no longer have objectsincrementing.The second change you see is within the title bar of thedialog box.At first it simply read Expert. Now it also shows the name of
www.syngress.com
Figure 4.5 Viewing the Expert Dialog Box After You Select Display
219_sniffer_04.qxd 6/28/02 11:51 AM Page 164
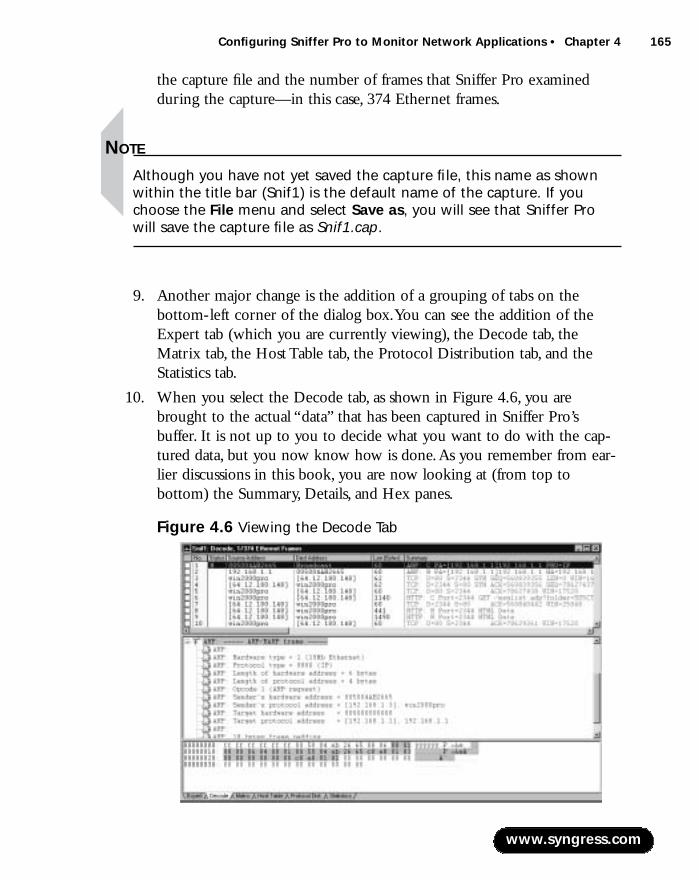
Configuring Sniffer Pro to Monitor Network Applications • Chapter 4 165
the capture file and the number of frames that Sniffer Pro examinedduring the capture—in this case, 374 Ethernet frames.
NOTE
Although you have not yet saved the capture file, this name as shownwithin the title bar (Snif1) is the default name of the capture. If youchoose the File menu and select Save as, you will see that Sniffer Prowill save the capture file as Snif1.cap.
9. Another major change is the addition of a grouping of tabs on thebottom-left corner of the dialog box.You can see the addition of theExpert tab (which you are currently viewing), the Decode tab, theMatrix tab, the Host Table tab, the Protocol Distribution tab, and theStatistics tab.
10. When you select the Decode tab, as shown in Figure 4.6, you arebrought to the actual “data” that has been captured in Sniffer Pro’sbuffer. It is not up to you to decide what you want to do with the cap-tured data, but you now know how is done.As you remember from ear-lier discussions in this book, you are now looking at (from top tobottom) the Summary, Details, and Hex panes.
www.syngress.com
Figure 4.6 Viewing the Decode Tab
219_sniffer_04.qxd 6/28/02 11:51 AM Page 165

166 Chapter 4 • Configuring Sniffer Pro to Monitor Network Applications
NOTE
The Summary, Details, and Hex panes are tested heavily on the SCP exam.You need to know what the panes are and what is viewed within each.
Viewing and Dissecting the CaptureNow that you have accumulated traffic in the buffer, you want to stop and viewthe capture.The only problem with that is, if you look in Figure 4.6, you have374 Ethernet frames to sift through.A quick look shows that many protocols areall mixed up. Furthermore, what exactly are you looking for? Remember, youhave not become a protocol analyzer expert merely by running a capture; youhave to know how to analyze the decode.To analyze it properly, you also have toknow how to configure the Sniffer Pro application to show you what it captured(for you), so you can properly study it and make assessments on what is found.That said, let’s continue to look at how to customize, manipulate, and configurethe Sniffer Pro to show you the capture the way you want to see it.When youstop the Sniffer Pro capture, you need to know how to mark, select, and viewspecific frames within the capture.You also need to know how to read among thewindow’s panes (Summary, Details, and Hex) and understand all the details withineach pane.
Monitoring with the Summary, Details, and Hex PanesLet’s look at each pane, one at a time, to see what you can find and how to cus-tomize the data that has been captured. It is important that you learn thesemechanics now; half the battle of using this tool is knowing its functionality,strengths, and limitations and how to manipulate the data that it has captured. Inthis example, we look at a simple ARP capture within the separate panes.
www.syngress.com
219_sniffer_04.qxd 6/28/02 11:51 AM Page 166
Configuring Sniffer Pro to Monitor Network Applications • Chapter 4 167
The Summary PaneWhen using the Sniffer Pro analyzer, you first want to look at the Summarypane, as shown in Figure 4.7.The Summary pane offers you a view of the exactframes that were captured, in the order (and time) they were captured. In thisexample, we caught ARP traffic on the wire.You can see in the Summary pane
www.syngress.com
Display Setup OptionsBefore you learn about all the great things you can see in the Expertsystem, you need to make sure you are able to see what we go over. Toconfigure the Expert system to show you specific details within thepanes listed in this section, you might need to do some configuring ofoptions. Open the Display menu and choose the Display Setup menuitem. A dialog box opens. Check in the five available tabs, and you willsee options to eliminate certain items from your Summary view.
Instead of writing 30 pages on how to change colors and fonts,here we highlight some of the most important features you need toknow so you can get started on your analysis of the Summary paneitself. In the General tab, you will want to see the Expert and PostAnalysis tabs enabled. On the Summary display (displays on theSummary tab), you will want everything selected except Show All Layersand Two-Station Format. Two-Station Format changes the format of theSummary pane for analysis just between two specific stations. Electingto see all layers will inundate your view with too much information todig through, but by all means use this option once you learn how to setup filters and eliminate the amount of traffic you get to your display. Youreally don’t want to exclude any protocols here; it’s better to leave thissetting on and define filters to exclude protocols. You can use this sec-tion if you know your Sniffer Pro will never move and never change whatit analyzes. The Protocol Expand tab allows you to expand the protocolviews in the Details pane, which we discuss shortly. The rest of the set-tings affect colors, view, and font and should not be tampered withunless you have a specific reason to change them.
It’s best to keep a standardized view when you use Sniffer Pro toavoid confusion if someone else has to use the application after youhave modified it.
Configuring & Implementing…
219_sniffer_04.qxd 6/28/02 11:51 AM Page 167

168 Chapter 4 • Configuring Sniffer Pro to Monitor Network Applications
that we have many columns of information we can look at, such as the numberof the packet, status, source and destination addresses, the length, and quite a fewother things. Let’s examine this ARP capture and explain how you will read eachcolumn.
When viewing the Summary pane, you want to notice the fields that arecontained within. From left to right, you first see a column with no name thathas empty check boxes below it.This column represents the way you can selectframes within your capture.You can place a check mark in the empty box toselect any frame you would like.What’s nice about this feature is that you canselect a few frames from your entire capture and save them in a new capture.Todo this, run a capture and select about one-fourth of the frames you captured byclicking the empty boxes to their left on the screen, filling them in with Xs. Let’slook at some of the options you have with these frames. Open the Displaymenu and you’ll see these options:
■ Save Selected This option allows you to save the frames you selectedin a new capture file. Note that when you do select this option, you alsoopen a whole new Expert system dialog box. However, a quick look atthe title bar shows you it is for a brand-new capture with a new capturefilename, such as snif 2.cap.
■ Select Range This option allows you to open a new dialog box calledSelect Range. Using this option, you can select the entire range offrames (it knows the exact number that you captured), deselect the entirerange, or select and deselect from anywhere within a range that youexplicitly create.
■ Select Toggle This option allows you to simply select or deselect theframe you are currently highlighting.
■ Previously Selected This option allows you to advance to the nearestframe you have selected.This feature is handy, for example, if you wantto select the beginning of a client/server communication and continueto scroll down to analyze it, but you also want to get back to theselected frame in a hurry.You can use this option to move directly to it.
www.syngress.com
Figure 4.7 Viewing the Summary Pane
219_sniffer_04.qxd 6/28/02 11:51 AM Page 168
Configuring Sniffer Pro to Monitor Network Applications • Chapter 4 169
■ Next Selected This option allows you to do the same as the PreviouslySelected option, except you move to the next selected frame, which is in alower position from where you are currently positioned within the trace.
NOTE
You can access all these menu-driven commands by right-clicking yourmouse while it is hovered somewhere within the decode of the Summarypane. You will produce a menu similar to the display menus, but with afew differences. Note the differences in what you can or can’t accessfrom each menu. The Display menu (which we used for the chapterexample) is the most complete.
While looking at Figure 4.7 again, you can see that the next column is No.,which is short for Number.The No. column simply numbers the frames sequen-tially in the order in which they were captured. Numbering the frames is helpfulwhen you’re producing reports with graphics in which you want to referencespecific frames or when you’re sending a capture away for analysis and you wantto reference specific frames within the capture.
The next column to the right is the Status column.This column allows for amarked frame.The mark is a single placeholder within the capture. Generally, thefirst frame in the capture is the marked frame, by default.You can mark a newframe by right-clicking the frame and selecting Mark Current Frame from themenu that opens.This choice marks the frame you are selecting as the beginningframe.Anything before this new frame will go into negative time, so if youdepend on your timestamps, be wary of changing the beginning mark for thecapture.A number sign (#) also appears in this column to show you that theexpert system has made a comment for you to read within the Summary columnin the Summary pane.This column makes it easier for you to find information.
The next column to the right is the Source Address, followed by theDestination Address column.These two columns are critical to your analysisbecause they show you where the traffic (data packet) originated from and whereit wound up.This is an easy way to troubleshoot conversations between nodes.When we learn how to define filters in Chapter 8, we will clean this up to makeit specific.The Source and Destination address columns also show either MACaddress, IP or IPX address, hostname, or, if it is a simple broadcast, Sniffer Pronames it a broadcast.This feature is helpful in finding hosts on your network. If
www.syngress.com
219_sniffer_04.qxd 6/28/02 11:51 AM Page 169
170 Chapter 4 • Configuring Sniffer Pro to Monitor Network Applications
you received only a MAC address, you can use your address book (when youlearn how to populate it) to find nodes.
NOTE
If you find a MAC address and have a lot of trouble finding where on thenetwork this host is located, start looking though your switch and routerARP caches to see if you can resolve an IP to it. You can then look in theDNS and WINS databases to help narrow your search, if necessary.
The next column, the Summary column, is focused on showing you a briefsummary of the frame captured. More information can be found within theDetails pane, but this column in the Summary pane shows you basic informationsuch as the protocol used (color coded) and Expert comments if available.We’llskip the last few columns skip for now; we’ll look at them in much deeper detailwhen we discuss time and the stamping of frames.
The Details PaneThe Details pane is good for seeing inside a packet to do some serious decodeanalysis.This pane shows you all the finer details of the protocol that you cap-tured. In Figure 4.8, you can see that we are still looking at ARP but now withinthe Details pane.The Details pane is a good way to take a closer look into each
www.syngress.com
Customizing the Expert Screen ColumnsIf you like to see certain columns ahead of other columns in theSummary pane, you can move them around. For example, you can seeyour absolute timestamp ahead of the Summary column. To move thecolumn, hover your mouse pointer over the column you want to move,and hold you left mouse button down. While holding the button down,drag your mouse pointer and hover over the location where you want toplace the column you are holding and then release the mouse button.This way you can move the columns around as you want to see them.
Configuring & Implementing…
219_sniffer_04.qxd 6/28/02 11:51 AM Page 170
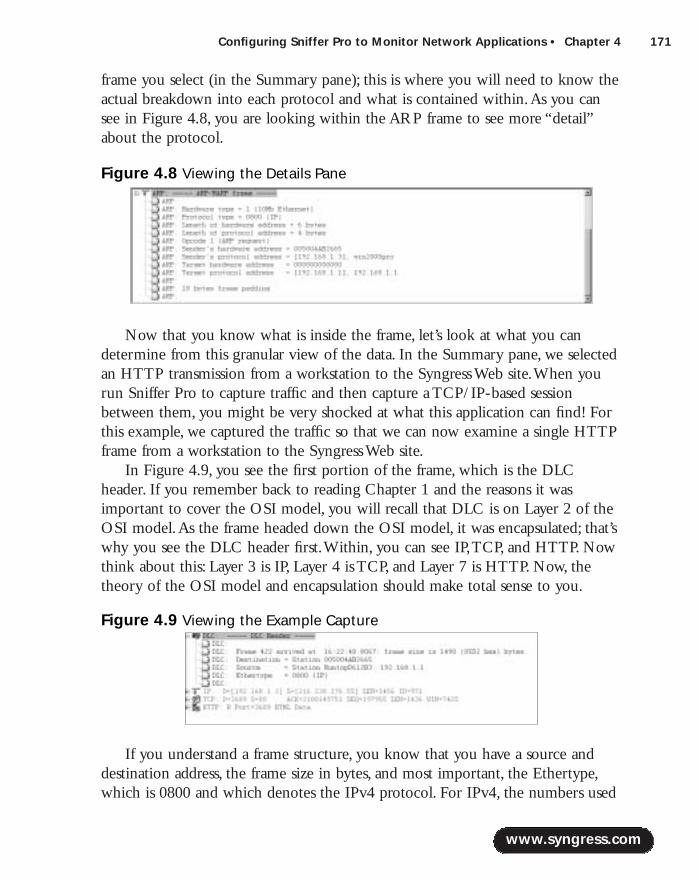
Configuring Sniffer Pro to Monitor Network Applications • Chapter 4 171
frame you select (in the Summary pane); this is where you will need to know theactual breakdown into each protocol and what is contained within.As you cansee in Figure 4.8, you are looking within the ARP frame to see more “detail”about the protocol.
Now that you know what is inside the frame, let’s look at what you candetermine from this granular view of the data. In the Summary pane, we selectedan HTTP transmission from a workstation to the Syngress Web site.When yourun Sniffer Pro to capture traffic and then capture a TCP/IP-based sessionbetween them, you might be very shocked at what this application can find! Forthis example, we captured the traffic so that we can now examine a single HTTPframe from a workstation to the Syngress Web site.
In Figure 4.9, you see the first portion of the frame, which is the DLCheader. If you remember back to reading Chapter 1 and the reasons it wasimportant to cover the OSI model, you will recall that DLC is on Layer 2 of theOSI model.As the frame headed down the OSI model, it was encapsulated; that’swhy you see the DLC header first.Within, you can see IP,TCP, and HTTP. Nowthink about this: Layer 3 is IP, Layer 4 is TCP, and Layer 7 is HTTP. Now, thetheory of the OSI model and encapsulation should make total sense to you.
If you understand a frame structure, you know that you have a source anddestination address, the frame size in bytes, and most important, the Ethertype,which is 0800 and which denotes the IPv4 protocol. For IPv4, the numbers used
www.syngress.com
Figure 4.8 Viewing the Details Pane
Figure 4.9 Viewing the Example Capture
219_sniffer_04.qxd 6/28/02 11:51 AM Page 171
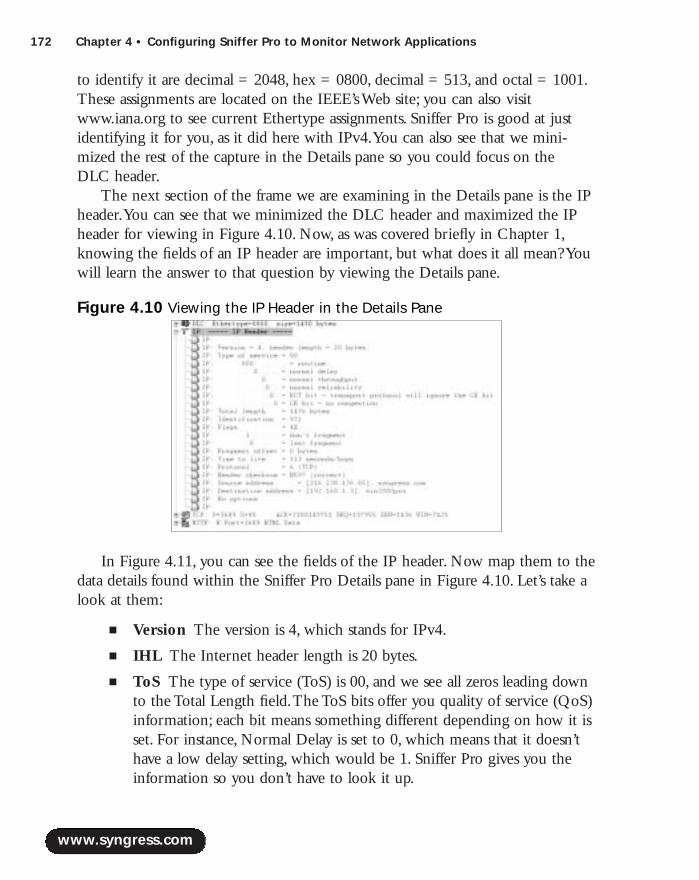
172 Chapter 4 • Configuring Sniffer Pro to Monitor Network Applications
to identify it are decimal = 2048, hex = 0800, decimal = 513, and octal = 1001.These assignments are located on the IEEE’s Web site; you can also visitwww.iana.org to see current Ethertype assignments. Sniffer Pro is good at justidentifying it for you, as it did here with IPv4.You can also see that we mini-mized the rest of the capture in the Details pane so you could focus on the DLC header.
The next section of the frame we are examining in the Details pane is the IPheader.You can see that we minimized the DLC header and maximized the IPheader for viewing in Figure 4.10. Now, as was covered briefly in Chapter 1,knowing the fields of an IP header are important, but what does it all mean? Youwill learn the answer to that question by viewing the Details pane.
In Figure 4.11, you can see the fields of the IP header. Now map them to thedata details found within the Sniffer Pro Details pane in Figure 4.10. Let’s take alook at them:
■ Version The version is 4, which stands for IPv4.
■ IHL The Internet header length is 20 bytes.
■ ToS The type of service (ToS) is 00, and we see all zeros leading downto the Total Length field.The ToS bits offer you quality of service (QoS)information; each bit means something different depending on how it isset. For instance, Normal Delay is set to 0, which means that it doesn’thave a low delay setting, which would be 1. Sniffer Pro gives you theinformation so you don’t have to look it up.
www.syngress.com
Figure 4.10 Viewing the IP Header in the Details Pane
219_sniffer_04.qxd 6/28/02 11:51 AM Page 172
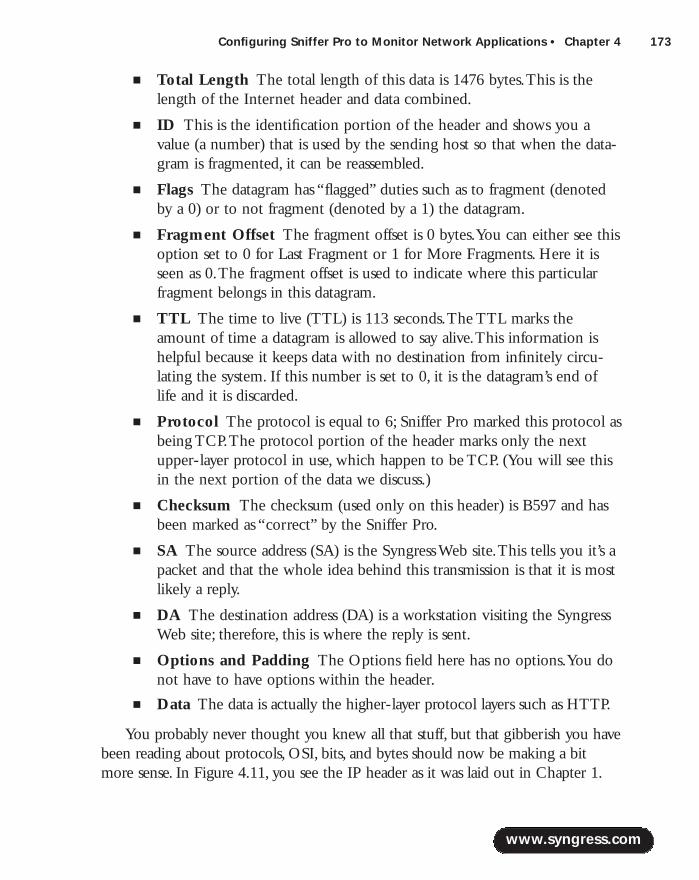
Configuring Sniffer Pro to Monitor Network Applications • Chapter 4 173
■ Total Length The total length of this data is 1476 bytes.This is thelength of the Internet header and data combined.
■ ID This is the identification portion of the header and shows you avalue (a number) that is used by the sending host so that when the data-gram is fragmented, it can be reassembled.
■ Flags The datagram has “flagged” duties such as to fragment (denotedby a 0) or to not fragment (denoted by a 1) the datagram.
■ Fragment Offset The fragment offset is 0 bytes.You can either see thisoption set to 0 for Last Fragment or 1 for More Fragments. Here it isseen as 0.The fragment offset is used to indicate where this particularfragment belongs in this datagram.
■ TTL The time to live (TTL) is 113 seconds.The TTL marks theamount of time a datagram is allowed to say alive.This information ishelpful because it keeps data with no destination from infinitely circu-lating the system. If this number is set to 0, it is the datagram’s end oflife and it is discarded.
■ Protocol The protocol is equal to 6; Sniffer Pro marked this protocol asbeing TCP.The protocol portion of the header marks only the nextupper-layer protocol in use, which happen to be TCP. (You will see thisin the next portion of the data we discuss.)
■ Checksum The checksum (used only on this header) is B597 and hasbeen marked as “correct” by the Sniffer Pro.
■ SA The source address (SA) is the Syngress Web site.This tells you it’s apacket and that the whole idea behind this transmission is that it is mostlikely a reply.
■ DA The destination address (DA) is a workstation visiting the SyngressWeb site; therefore, this is where the reply is sent.
■ Options and Padding The Options field here has no options.You donot have to have options within the header.
■ Data The data is actually the higher-layer protocol layers such as HTTP.
You probably never thought you knew all that stuff, but that gibberish you havebeen reading about protocols, OSI, bits, and bytes should now be making a bitmore sense. In Figure 4.11, you see the IP header as it was laid out in Chapter 1.
www.syngress.com
219_sniffer_04.qxd 6/28/02 11:51 AM Page 173
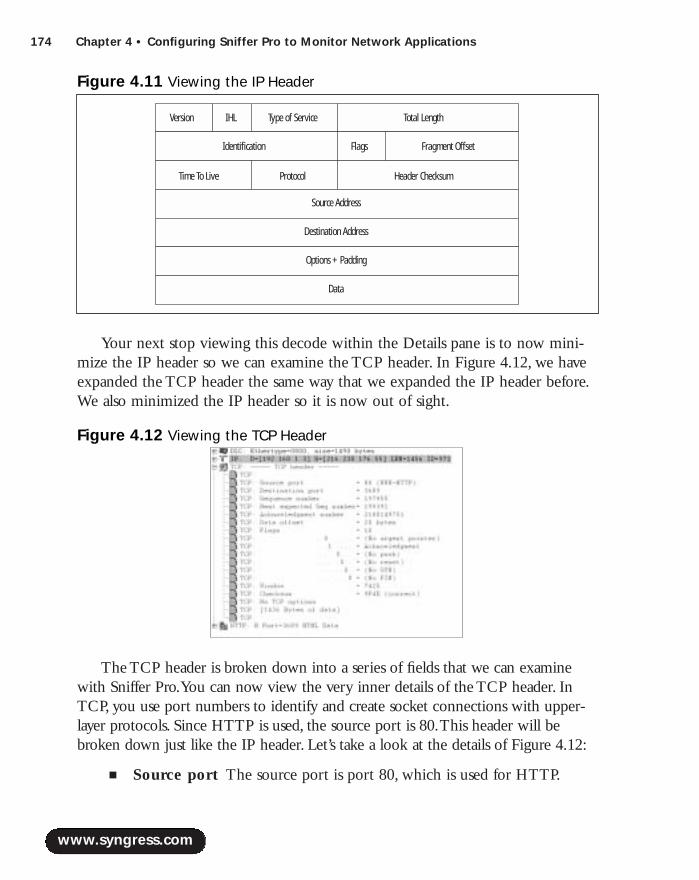
174 Chapter 4 • Configuring Sniffer Pro to Monitor Network Applications
Your next stop viewing this decode within the Details pane is to now mini-mize the IP header so we can examine the TCP header. In Figure 4.12, we haveexpanded the TCP header the same way that we expanded the IP header before.We also minimized the IP header so it is now out of sight.
The TCP header is broken down into a series of fields that we can examinewith Sniffer Pro.You can now view the very inner details of the TCP header. InTCP, you use port numbers to identify and create socket connections with upper-layer protocols. Since HTTP is used, the source port is 80.This header will bebroken down just like the IP header. Let’s take a look at the details of Figure 4.12:
■ Source port The source port is port 80, which is used for HTTP.
www.syngress.com
Figure 4.11 Viewing the IP Header
IHLVersion Type of Service Total Length
Identification Flags Fragment Offset
Time To Live Protocol Header Checksum
Source Address
Destination Address
Options + Padding
Data
Figure 4.12 Viewing the TCP Header
219_sniffer_04.qxd 6/28/02 11:51 AM Page 174
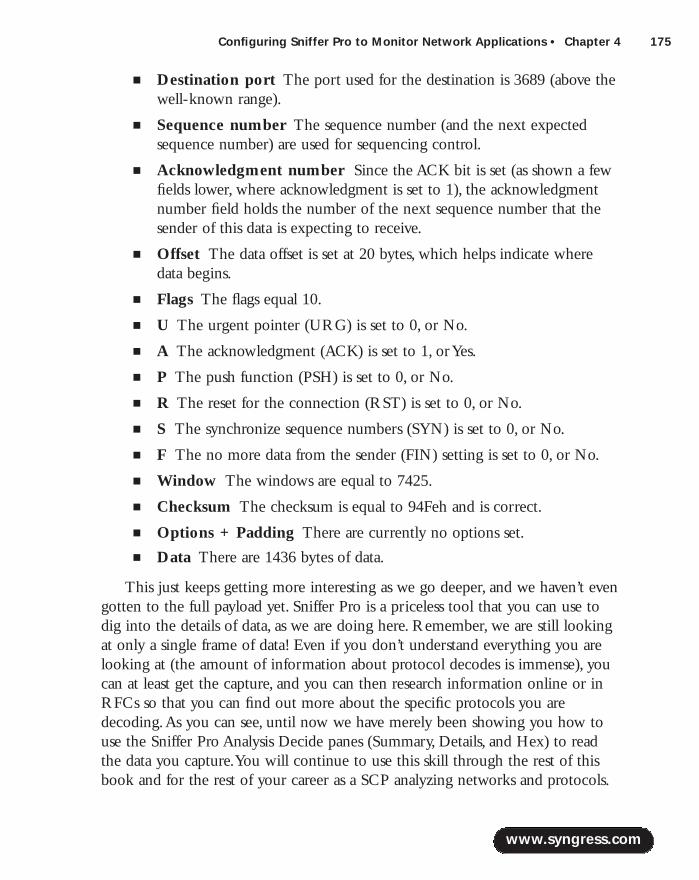
Configuring Sniffer Pro to Monitor Network Applications • Chapter 4 175
■ Destination port The port used for the destination is 3689 (above thewell-known range).
■ Sequence number The sequence number (and the next expectedsequence number) are used for sequencing control.
■ Acknowledgment number Since the ACK bit is set (as shown a fewfields lower, where acknowledgment is set to 1), the acknowledgmentnumber field holds the number of the next sequence number that thesender of this data is expecting to receive.
■ Offset The data offset is set at 20 bytes, which helps indicate wheredata begins.
■ Flags The flags equal 10.
■ U The urgent pointer (URG) is set to 0, or No.
■ A The acknowledgment (ACK) is set to 1, or Yes.
■ P The push function (PSH) is set to 0, or No.
■ R The reset for the connection (RST) is set to 0, or No.
■ S The synchronize sequence numbers (SYN) is set to 0, or No.
■ F The no more data from the sender (FIN) setting is set to 0, or No.
■ Window The windows are equal to 7425.
■ Checksum The checksum is equal to 94Feh and is correct.
■ Options + Padding There are currently no options set.
■ Data There are 1436 bytes of data.
This just keeps getting more interesting as we go deeper, and we haven’t evengotten to the full payload yet. Sniffer Pro is a priceless tool that you can use todig into the details of data, as we are doing here. Remember, we are still lookingat only a single frame of data! Even if you don’t understand everything you arelooking at (the amount of information about protocol decodes is immense), youcan at least get the capture, and you can then research information online or inRFCs so that you can find out more about the specific protocols you aredecoding.As you can see, until now we have merely been showing you how touse the Sniffer Pro Analysis Decide panes (Summary, Details, and Hex) to readthe data you capture.You will continue to use this skill through the rest of thisbook and for the rest of your career as a SCP analyzing networks and protocols.
www.syngress.com
219_sniffer_04.qxd 6/28/02 11:51 AM Page 175

176 Chapter 4 • Configuring Sniffer Pro to Monitor Network Applications
Let’s continue with the Details pane and finish analyzing the HTTP frame we’vecaptured and analyzed. In Figure 4.13, you can see that I have minimized theDLC, IP, and TCP headers, so we can look at the HTTP portion of the capture.
You can see that the HTTP portion of the capture is showing the Web pagewe accessed and what the Web server returned to our workstation.Within thecapture, you can see that HTML tags and URLs have been returned to therequester.As we mentioned from the beginning when we looked in the IPheader, the source was the Web server and the destination was the workstationrequesting the Web page to view within a browser. Now the reason that you seeHTML in the capture should make sense.
The Hex PaneThe Hex pane is by far the most revealing, but at the same time, it is a hard-to-read pane.The Hex pane looks like an information dump of pure hexadecimalcode. It is that, but here we examine a better way for you to understand whatyou are looking at so you can make sense of what you see for analysis purposes.
We know data in transmission is based on the Base 2 system of binary.Wealso know that we can translate binary into hexadecimal as well as decimal andoctal formats.When you see data in the Hex pane, you are seeing the raw data
www.syngress.com
Figure 4.13 Viewing the HTTP Protocol in the Details Pane
219_sniffer_04.qxd 6/28/02 11:51 AM Page 176
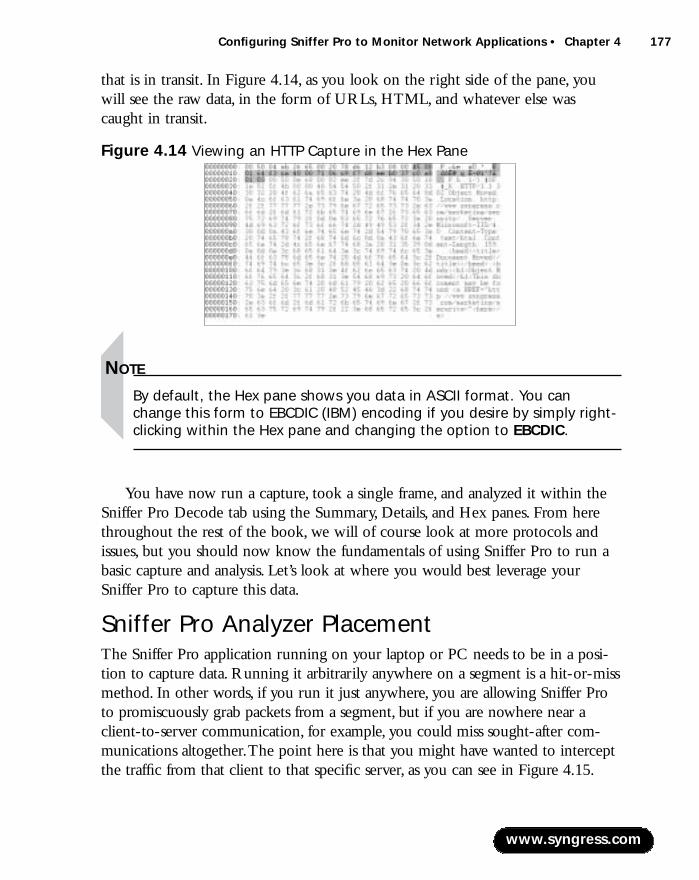
Configuring Sniffer Pro to Monitor Network Applications • Chapter 4 177
that is in transit. In Figure 4.14, as you look on the right side of the pane, youwill see the raw data, in the form of URLs, HTML, and whatever else wascaught in transit.
NOTE
By default, the Hex pane shows you data in ASCII format. You canchange this form to EBCDIC (IBM) encoding if you desire by simply right-clicking within the Hex pane and changing the option to EBCDIC.
You have now run a capture, took a single frame, and analyzed it within theSniffer Pro Decode tab using the Summary, Details, and Hex panes. From herethroughout the rest of the book, we will of course look at more protocols andissues, but you should now know the fundamentals of using Sniffer Pro to run abasic capture and analysis. Let’s look at where you would best leverage yourSniffer Pro to capture this data.
Sniffer Pro Analyzer Placement The Sniffer Pro application running on your laptop or PC needs to be in a posi-tion to capture data. Running it arbitrarily anywhere on a segment is a hit-or-missmethod. In other words, if you run it just anywhere, you are allowing Sniffer Proto promiscuously grab packets from a segment, but if you are nowhere near aclient-to-server communication, for example, you could miss sought-after com-munications altogether.The point here is that you might have wanted to interceptthe traffic from that client to that specific server, as you can see in Figure 4.15.
www.syngress.com
Figure 4.14 Viewing an HTTP Capture in the Hex Pane
219_sniffer_04.qxd 6/28/02 11:51 AM Page 177
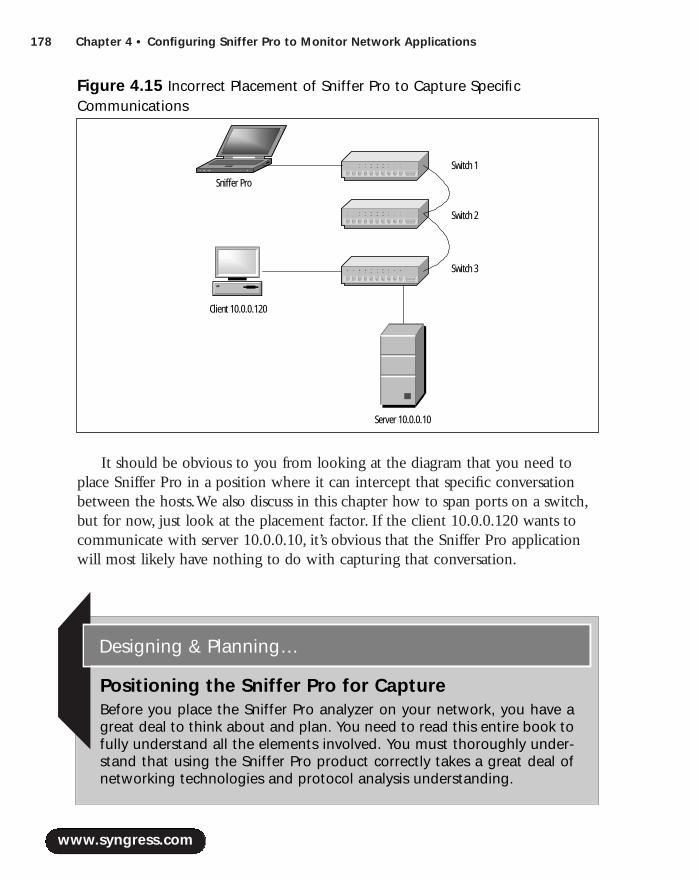
178 Chapter 4 • Configuring Sniffer Pro to Monitor Network Applications
It should be obvious to you from looking at the diagram that you need toplace Sniffer Pro in a position where it can intercept that specific conversationbetween the hosts.We also discuss in this chapter how to span ports on a switch,but for now, just look at the placement factor. If the client 10.0.0.120 wants tocommunicate with server 10.0.0.10, it’s obvious that the Sniffer Pro applicationwill most likely have nothing to do with capturing that conversation.
www.syngress.com
Figure 4.15 Incorrect Placement of Sniffer Pro to Capture SpecificCommunications
Sniffer Pro
Switch 1
Switch 2
Switch 3
Client 10.0.0.120
Server 10.0.0.10
Positioning the Sniffer Pro for CaptureBefore you place the Sniffer Pro analyzer on your network, you have agreat deal to think about and plan. You need to read this entire book tofully understand all the elements involved. You must thoroughly under-stand that using the Sniffer Pro product correctly takes a great deal ofnetworking technologies and protocol analysis understanding.
Designing & Planning…
219_sniffer_04.qxd 6/28/02 11:51 AM Page 178

Configuring Sniffer Pro to Monitor Network Applications • Chapter 4 179
In Figure 4.16, note that we have “hubbed out” on the switch to capture thecommunications from the client to the server.We have yet to learn how to builda filter (the topic of Chapter 8), but you can run a general capture (as you did inthe first section of this chapter) to at least get the data.
There are also ways to span or mirror a port on a switch to capture traffic,which we discuss later in this chapter. Spanning is the simplest way to capturedata in a hurry. In Chapter 2, we discussed creating a technicians toolkit, whichcontained a small hub for just this purpose.
Sniffer Pro Advanced Configuration Now that you have learned about positioning, let’s look at a scenario in whichyou might be in a position to span a group of ports over to a single port for anal-ysis.You previously learned how to perform a capture, and now you know whereto put Sniffer Pro, but what about if your analysis requires plugging into aswitch? A switch is not like a hub; an active hub regenerates and broadcasts alldata received out all available ports.A switch, however, functions on Layer 2 ofthe OSI (the hub on Layer 1), and the switch uses memory to build a table to
www.syngress.com
Figure 4.16 Correct Placement of Sniffer Pro to Capture SpecificCommunications
Sniffer Pro
Switch 1
Switch 2
Switch 3
Client 10.0.0.120
Server 10.0.0.10
HUB
219_sniffer_04.qxd 6/28/02 11:51 AM Page 179
180 Chapter 4 • Configuring Sniffer Pro to Monitor Network Applications
memorize the MAC addresses associated with the ports on the switch.This eliminates the need to broadcast every port as the hub did to find its intendedrecipient.
When you want to use port spanning (or mirroring, as it’s called in Nortel orBay equipment), all you need to do is follow the guidelines in this section.Thewhole reason for port spanning is that with a switch, the destination is mostlikely a single port. How are you going to capture traffic on a switch with trafficnot duplicated to another port to which you attach Sniffer Pro? You can hub out,as shown in Figure 4.16, but if you use the spanning method, you need to knowhow to configure the switch.Why not just hub out all the time? If you have yourdevices (servers, ports) hardcoded at 100Mbps and full duplex, plugging theminto a 10BaseT hub is simply not going to work.To span ports, you need to con-figure the switch to duplicate the traffic from a port you want to monitor to aport you are connected to with Sniffer Pro.
Switched Port Analyzer A switched port analyzer (span) session is a configuration of a destination portwith a grouping of source ports, configured with parameters that specify themonitored network traffic. In this section, we show you the fundamentals of con-figuring a span session with a SET-based IOS on a Catalyst 4000 series switch.You can use Cisco’s Web site to learn how to configure for spanning any otherswitch in Cisco’s huge inventory.We discuss this topic here so that you get anidea and an understanding of how to apply this methodology to just about anyswitch, with the correct documentation. In addition, note that you can span aVLAN.
NOTE
Spanning sessions do not interfere with the normal operation ofswitches, but you always want to check the documentation of the exactswitch you are configuring as well as periodically check the device’s logs.You won’t affect the switch, but you will increase the amount of trafficon a specific destination port, so make sure your properly configuredSniffer Pro workstation is the destination port. You learned how to prop-erly configure Sniffer Pro for basic operation in Chapter 2.
www.syngress.com
219_sniffer_04.qxd 6/28/02 11:51 AM Page 180

Configuring Sniffer Pro to Monitor Network Applications • Chapter 4 181
How to Set Port Spanning To configure spanning, you need to first properly place your Sniffer Pro worksta-tion or laptop. Plug into a free switch port and make sure you write down thenumber of the port you are plugged into. For Cisco, you need to know the blademodule and the port number, so if you are plugged into the second modules ofFast Ethernet ports and you are in the tenth port, you are in the 2/10 port.Furthermore, note the traffic you want to span. Let’s say it’s a server located onthe third blade module and it’s plugged into the second port.The server islocated in the 3/2 port. Now do the following:
1. Connect to and log into the switch you want to configure.
2. Type enable (you must be in enable mode to configure spanning) andlog in.You will now be at the Switch1 (enable) prompt.
3. You can now type Switch1 (enable) set span 3/2 2/10.This enablesspanning so that traffic from the server goes to the port where SnifferPro is located.The switch, in turn, confirms the span with a message:“Overwrote Port 2/10 to monitor transmit/receive traffic of Port 3/2—Incoming Packets disabled. Learning enabled.”
4. To obtain statistics, you can now type the following at the switchprompt: Switch1 (enable) show span.
You are now port spanning. It’s that easy. Remember, though, this is theDetails pane for a single switch and there are slight differences as you move up incode levels as well as differences among operating systems (IOS) on the Ciscoline of switches. Now let’s look at the VLAN configuration.
How to Set Port Spanning for a VLANTo span a VLAN, you can do the following. If you do not know which VLANsyou have and what ports are associated with them, you need to find out theVLANs on the switch before you do anything. Find this information using com-mands such as show VLAN. Once you have the VLAN information you need(we use VLAN 100 for this exercise with the same switch port for Sniffer Pro)and you have read the documentation specific to your version of switch IOScode, you can do the following:
1. Connect to and log into the switch you want to configure.
2. Type enable (you must be in enable mode to configure spanning) andlog in.You will now be at the Switch1 (enable) prompt.
www.syngress.com
219_sniffer_04.qxd 6/28/02 11:51 AM Page 181

182 Chapter 4 • Configuring Sniffer Pro to Monitor Network Applications
3. You can now type Switch1 (enable) set span 100 2/10.This enablesspanning so that traffic from the VLAN goes to the port where SnifferPro is located.The switch, in turn, confirms the span with a message:“Overwrote Port 2/10 to monitor transmit/receive traffic of VLAN100—Incoming Packets disabled. Learning enabled.”
4. To get statistics, you can now type the following at the switch prompt:Switch1 (enable) show span.
WARNING
Be extremely careful not to create STP loops on the network when con-figuring the span destination port on a VLAN. The span destination portmight not participate in that VLAN, so make sure that you carefully readthe documentation on the switch you are configuring when you workwith and span VLANs.
In sum, port spanning is fairly simple if you have some Cisco skill.We recom-mend that you never work on a switch if you’re not authorized to do so, and bevery careful, because most of these switch changes write to memory immediatelywithout the need to save the changes to the configuration.This warning shouldbe enough to give you an idea that although you now understand the theory andthe commands are simple, a mistake made on a core switch will have very uglyresults. Exercise great caution if you don’t know what to do.
www.syngress.com
Port Mirroring on a Nortel/Bay SwitchCisco spanning is the same theory for Nortel/Bay mirroring. It’s the sameidea, just with two different names. At times, you might find yourself ina position where you need to mirror ports on a Nortel/Bay switch. Ifthat’s the case, it’s as easy as configuring it on the Cisco switch. If youneed to mirror a set of ports on a Nortel or Bay switch, you need toknow the version of code and the model of switch you are working with.
Configuring & Implementing…
Continued
219_sniffer_04.qxd 6/28/02 11:51 AM Page 182
Configuring Sniffer Pro to Monitor Network Applications • Chapter 4 183
Timestamping ProceduresThe Sniffer Pro Analyzer “timestamps” each packet that it captures in its buffer.Three basic timestamps are used in analysis:
■ Relative
■ Delta (also known as interpacket)
■ Absolute
All three timestamps are useful to help find problems on your network. Insome instances, using timestamps is critical to resolving network issues such asslow response times from a host to another host.
Timestamp Columns and TimestampingWe covered timestamps in Chapter 3, giving you a brief overview of what theSniffer Pro can do. In this chapter, we look at why you really need to look atthose timestamps for troubleshooting.The material in Chapter 3 might have been
www.syngress.com
Here we show you the configuration for the most common series ofBaystack switch-based operating systems and hardware: the Baystack450-24T.
Log into the switch, if prompted, and you should be at the mainmenu. From the main menu, select the Switch Configuration menuoption. Halfway down on the next menu, you will see a menu optioncalled Port Mirroring Configuration. When you select that menuoption, a new configuration page opens. Look at the bottom of thepage; you will see that Monitoring Mode is disabled. Once you configureit, this mode will be enabled.
Your first section to configure is the pattern. In the first field, youcan set (using the Spacebar) any variation of mirroring with the optionsprovided. Select an option that suits your needs, such as any address toa specific port. Then you can continue down to configure the ports andaddresses you specifically want to be source and destination. The pro-cess is completely menu driven, so it’s pretty simple to implement. PressEnter, and you will be asked if you are done. You can reply Yes to finishyour configuration. Be aware that if you are not going to Telnet into theswitch, you need to console into the switch. Nortel/Bay switches useconsole cables that are proprietary to the switch and model; a Cisco con-sole cable will not work.
219_sniffer_04.qxd 6/28/02 11:51 AM Page 183
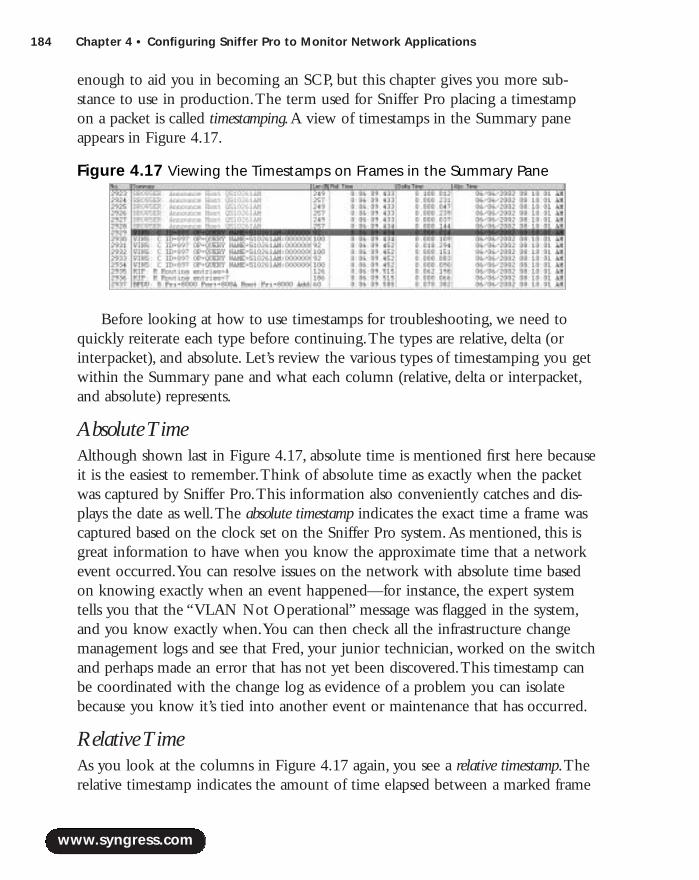
184 Chapter 4 • Configuring Sniffer Pro to Monitor Network Applications
enough to aid you in becoming an SCP, but this chapter gives you more sub-stance to use in production.The term used for Sniffer Pro placing a timestampon a packet is called timestamping.A view of timestamps in the Summary paneappears in Figure 4.17.
Before looking at how to use timestamps for troubleshooting, we need toquickly reiterate each type before continuing.The types are relative, delta (orinterpacket), and absolute. Let’s review the various types of timestamping you getwithin the Summary pane and what each column (relative, delta or interpacket,and absolute) represents.
Absolute TimeAlthough shown last in Figure 4.17, absolute time is mentioned first here becauseit is the easiest to remember.Think of absolute time as exactly when the packetwas captured by Sniffer Pro.This information also conveniently catches and dis-plays the date as well.The absolute timestamp indicates the exact time a frame wascaptured based on the clock set on the Sniffer Pro system.As mentioned, this isgreat information to have when you know the approximate time that a networkevent occurred.You can resolve issues on the network with absolute time basedon knowing exactly when an event happened—for instance, the expert systemtells you that the “VLAN Not Operational” message was flagged in the system,and you know exactly when.You can then check all the infrastructure changemanagement logs and see that Fred, your junior technician, worked on the switchand perhaps made an error that has not yet been discovered.This timestamp canbe coordinated with the change log as evidence of a problem you can isolatebecause you know it’s tied into another event or maintenance that has occurred.
Relative TimeAs you look at the columns in Figure 4.17 again, you see a relative timestamp.Therelative timestamp indicates the amount of time elapsed between a marked frame
www.syngress.com
Figure 4.17 Viewing the Timestamps on Frames in the Summary Pane
219_sniffer_04.qxd 6/28/02 11:51 AM Page 184
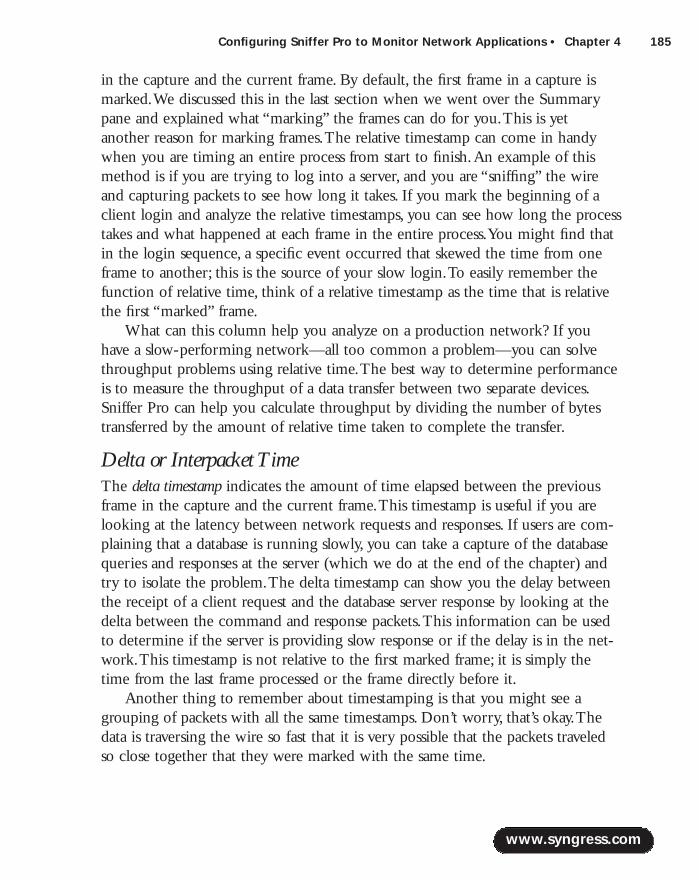
Configuring Sniffer Pro to Monitor Network Applications • Chapter 4 185
in the capture and the current frame. By default, the first frame in a capture ismarked.We discussed this in the last section when we went over the Summarypane and explained what “marking” the frames can do for you.This is yetanother reason for marking frames.The relative timestamp can come in handywhen you are timing an entire process from start to finish.An example of thismethod is if you are trying to log into a server, and you are “sniffing” the wireand capturing packets to see how long it takes. If you mark the beginning of aclient login and analyze the relative timestamps, you can see how long the processtakes and what happened at each frame in the entire process.You might find thatin the login sequence, a specific event occurred that skewed the time from oneframe to another; this is the source of your slow login.To easily remember thefunction of relative time, think of a relative timestamp as the time that is relativethe first “marked” frame.
What can this column help you analyze on a production network? If youhave a slow-performing network—all too common a problem—you can solvethroughput problems using relative time.The best way to determine performanceis to measure the throughput of a data transfer between two separate devices.Sniffer Pro can help you calculate throughput by dividing the number of bytestransferred by the amount of relative time taken to complete the transfer.
Delta or Interpacket TimeThe delta timestamp indicates the amount of time elapsed between the previousframe in the capture and the current frame.This timestamp is useful if you arelooking at the latency between network requests and responses. If users are com-plaining that a database is running slowly, you can take a capture of the databasequeries and responses at the server (which we do at the end of the chapter) andtry to isolate the problem.The delta timestamp can show you the delay betweenthe receipt of a client request and the database server response by looking at thedelta between the command and response packets.This information can be usedto determine if the server is providing slow response or if the delay is in the net-work.This timestamp is not relative to the first marked frame; it is simply thetime from the last frame processed or the frame directly before it.
Another thing to remember about timestamping is that you might see agrouping of packets with all the same timestamps. Don’t worry, that’s okay.Thedata is traversing the wire so fast that it is very possible that the packets traveledso close together that they were marked with the same time.
www.syngress.com
219_sniffer_04.qxd 6/28/02 11:51 AM Page 185
186 Chapter 4 • Configuring Sniffer Pro to Monitor Network Applications
WARNING
Make sure you master the art of working with timestamps so that youcan troubleshoot how long a login occurs or how long it takes totransfer a file. Once you learn how to build a filter, use timestamps toisolate a client/server login to see how long it takes. You must alsomaster this information for the SCP exam.
Viewing and Using the ExpertThe expert system is a part of the Sniffer Pro application that serves as a helpinghand when you’re trying to troubleshoot network and protocol problems.We dis-cuss this system here in great detail so that you know what to expect, what tolook for, what to believe (and not believe), and what components actually makeup the Expert.
When monitoring your network, you of course want to know what’s goingon under the hood.This is not as simple as it sounds.When you come acrosslarge quantities of data, you might think how handy it would be if something just“stuck out at you” to give you an idea of where to look or where to begin.Theexpert system does a great job of doing that for you.
In Figure 4.18, you can see that Sniffer Pro does a great job breaking downall the information you capture into separate categories so it is easier for you toanalyze the issues that are occurring.
Sniffer Pro allows you to view possible problems in an OSI model type offormat.This model actually maps to the OSI.You must know how it maps tobecome a Sniffer Certified Professional. Memorize the mapping for testing pur-poses, but we go over it here so you are at least familiar with it. In Table 4.1, youcan see the mappings to memorize.
Table 4.1 OSI to Sniffer Pro Expert System Mappings
Expert System Layers OSI Model Layers
Service Application and presentationApplication Application and presentationSession SessionConnection Transport
www.syngress.com
Continued
219_sniffer_04.qxd 6/28/02 11:51 AM Page 186
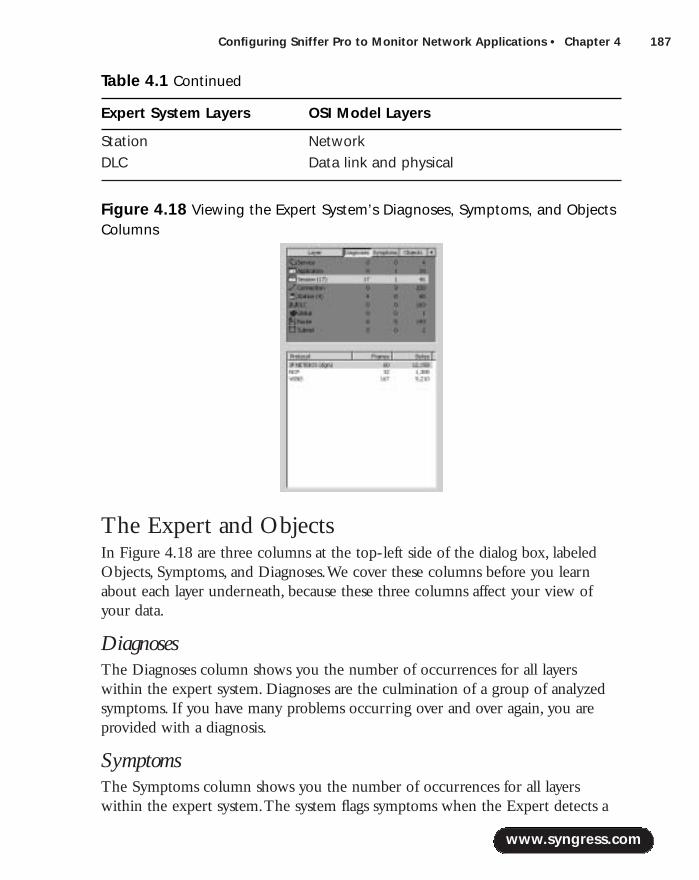
Configuring Sniffer Pro to Monitor Network Applications • Chapter 4 187
Station NetworkDLC Data link and physical
The Expert and ObjectsIn Figure 4.18 are three columns at the top-left side of the dialog box, labeledObjects, Symptoms, and Diagnoses.We cover these columns before you learnabout each layer underneath, because these three columns affect your view ofyour data.
DiagnosesThe Diagnoses column shows you the number of occurrences for all layerswithin the expert system. Diagnoses are the culmination of a group of analyzedsymptoms. If you have many problems occurring over and over again, you areprovided with a diagnosis.
Symptoms The Symptoms column shows you the number of occurrences for all layerswithin the expert system.The system flags symptoms when the Expert detects a
www.syngress.com
Figure 4.18 Viewing the Expert System’s Diagnoses, Symptoms, and ObjectsColumns
Table 4.1 Continued
Expert System Layers OSI Model Layers
219_sniffer_04.qxd 6/28/02 11:51 AM Page 187

188 Chapter 4 • Configuring Sniffer Pro to Monitor Network Applications
network event that is either unusual or deemed abnormal.The symptom is usu-ally indicative of a network problem or an exceeded threshold.
Objects The Objects column shows you the number of occurrences for all layers withinthe expert system. Expert objects are data that has been taken from the datas-tream; they represent entities. Objects can be routers, networks, network stations,IP addresses, or MAC addresses.
Troubleshooting with the Expert SystemAs you will soon see, the expert system is a boon, but it’s not something to betrusted with all decisions. It’s not always correct in its assessments, and it some-times gives you only a small piece of a problem.We recommend you use theExpert as a “hinting” tool. It allows you to start to find possible problems youmight be having.
The Expert LayersAs mentioned, the expert layers help you categorize and begin to isolate yourproblems. It is not the “answer” to your problems, but instead is more of a guide.In this section, we look at each layer shown in Table 4.1 and demystify themeaning of each layer.
The Service LayerThe service layer is mapped to the application and presentation layers of the OSImodel.The Expert uses the service layer to summarize objects using protocolssuch as HTTP and SMB.You can view the Objects tab to drill down into thespecifics of each connection, as shown in Figure 4.19. Connections are madeeven more granular in the HTTP statistics summary, and you can see if you haveproblems such as slow GET or POST.
The Application LayerThe Expert merges the upper two OSI layers into one because relatively fewprotocols exist at the presentation layer; also, the boundaries between these layersare unclear.Very often the applications can access the transport layer (like TCP)without using the service at the presentation layer.
The error, as shown in Figure 4.20, displays an “HTTP Slow Server GETResponse Time” message.When the GET function was used, it was slow, and the
www.syngress.com
219_sniffer_04.qxd 6/28/02 11:51 AM Page 188
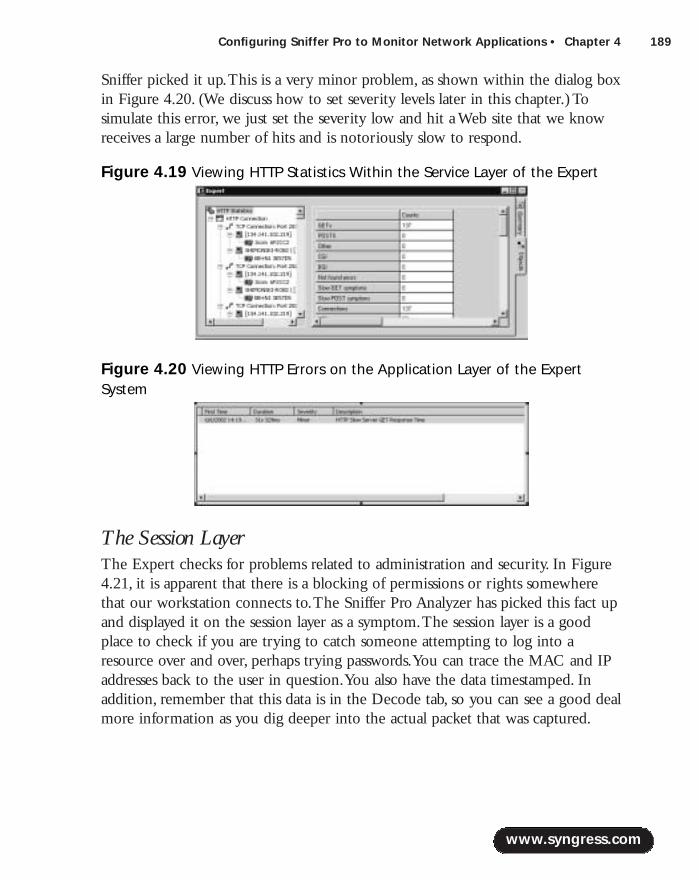
Configuring Sniffer Pro to Monitor Network Applications • Chapter 4 189
Sniffer picked it up.This is a very minor problem, as shown within the dialog boxin Figure 4.20. (We discuss how to set severity levels later in this chapter.) Tosimulate this error, we just set the severity low and hit a Web site that we knowreceives a large number of hits and is notoriously slow to respond.
The Session LayerThe Expert checks for problems related to administration and security. In Figure4.21, it is apparent that there is a blocking of permissions or rights somewherethat our workstation connects to.The Sniffer Pro Analyzer has picked this fact upand displayed it on the session layer as a symptom.The session layer is a goodplace to check if you are trying to catch someone attempting to log into aresource over and over, perhaps trying passwords.You can trace the MAC and IPaddresses back to the user in question.You also have the data timestamped. Inaddition, remember that this data is in the Decode tab, so you can see a good dealmore information as you dig deeper into the actual packet that was captured.
www.syngress.com
Figure 4.19 Viewing HTTP Statistics Within the Service Layer of the Expert
Figure 4.20 Viewing HTTP Errors on the Application Layer of the ExpertSystem
219_sniffer_04.qxd 6/28/02 11:51 AM Page 189
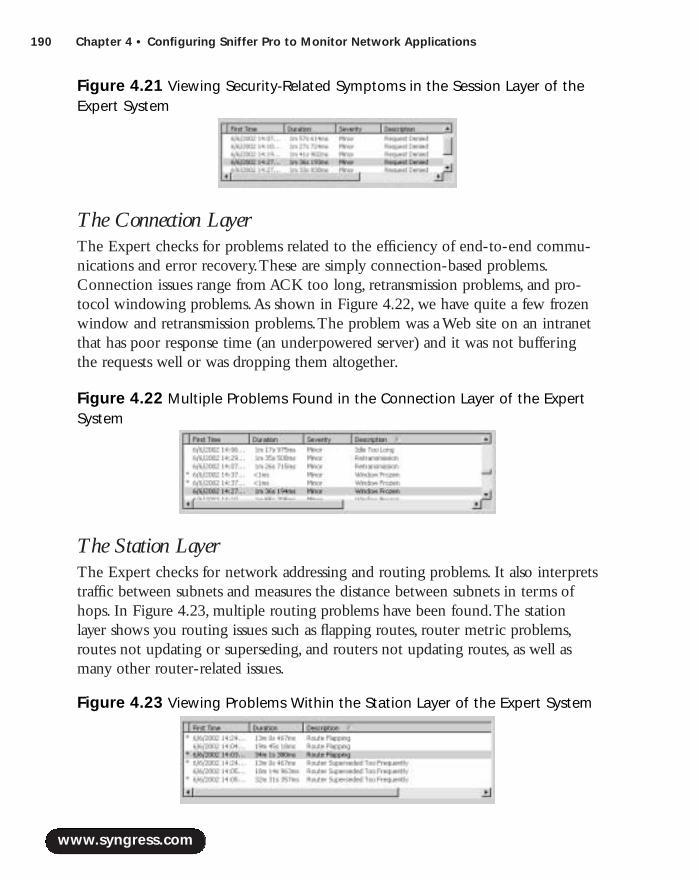
190 Chapter 4 • Configuring Sniffer Pro to Monitor Network Applications
The Connection LayerThe Expert checks for problems related to the efficiency of end-to-end commu-nications and error recovery.These are simply connection-based problems.Connection issues range from ACK too long, retransmission problems, and pro-tocol windowing problems.As shown in Figure 4.22, we have quite a few frozenwindow and retransmission problems.The problem was a Web site on an intranetthat has poor response time (an underpowered server) and it was not bufferingthe requests well or was dropping them altogether.
The Station LayerThe Expert checks for network addressing and routing problems. It also interpretstraffic between subnets and measures the distance between subnets in terms ofhops. In Figure 4.23, multiple routing problems have been found.The stationlayer shows you routing issues such as flapping routes, router metric problems,routes not updating or superseding, and routers not updating routes, as well asmany other router-related issues.
www.syngress.com
Figure 4.21 Viewing Security-Related Symptoms in the Session Layer of theExpert System
Figure 4.22 Multiple Problems Found in the Connection Layer of the ExpertSystem
Figure 4.23 Viewing Problems Within the Station Layer of the Expert System
219_sniffer_04.qxd 6/28/02 11:51 AM Page 190

Configuring Sniffer Pro to Monitor Network Applications • Chapter 4 191
The DLC LayerThe Expert merges the lowest two layers of the OSI model (the physical and datalink layers), mostly because it does not perform a wide range of diagnoses on thephysical characteristics of the network, such as electrical voltage and current.TheExpert is concerned with the actual transfer of data across the network. If you areconcerned about voltage issues, cabling, and other physical problems, this is wherea tone generator, time domain reflectometer (TDR), or “fluke” comes in handy.If LAN analysis is your job or work-related responsibility; you want to pair aSniffer Pro Analyzer with a fluke to get the most “bang for your buck.”
The DLC layer of the Expert analyzes physical errors such as CRC errors aswell as frames that are too short and other Layer 1 and 2 issues that might be pre-sent on the network segment. In Figure 4.24, you see that the Expert has foundMAC addresses and listed the current amount of transmitted and received bytes.
The Global LayerThe Expert’s global layer shows you globally (to the system and the segment)related issues.The Objects column also shows you the total number of framescaptured as well as general global statistics on that block of captured frames, suchas average frame length, which tells you your averages. Global problems might bea broadcast or multicast storm such as the one captured in Figure 4.25.This hap-pened to be a broadcast storm that we caught periodically throughout a day.TheExpert didn’t tell why, but it did alert us to a possible problem with a set of oldhubs in a closet that needed to be replaced.
The Route LayerThe route layer of the expert system shows you route problems on your network.The station layer section you just read told you that router and addressing problemsare covered there as well, but the trick to knowing the route layer is to see that onthe station layer, you have diagnoses such as “route superseded too frequently,”whereas on the route layer, the symptoms point to a route that superseded.The
www.syngress.com
Figure 4.24 Viewing DLC Layer Statistics with the Sniffer Pro Expert
219_sniffer_04.qxd 6/28/02 11:51 AM Page 191
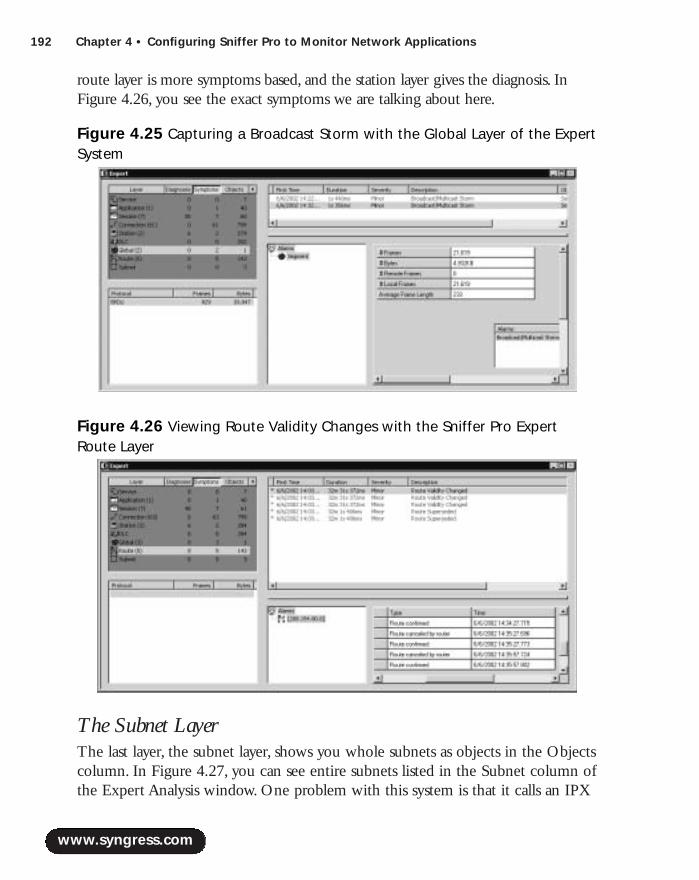
192 Chapter 4 • Configuring Sniffer Pro to Monitor Network Applications
route layer is more symptoms based, and the station layer gives the diagnosis. InFigure 4.26, you see the exact symptoms we are talking about here.
The Subnet LayerThe last layer, the subnet layer, shows you whole subnets as objects in the Objectscolumn. In Figure 4.27, you can see entire subnets listed in the Subnet column ofthe Expert Analysis window. One problem with this system is that it calls an IPX
www.syngress.com
Figure 4.25 Capturing a Broadcast Storm with the Global Layer of the ExpertSystem
Figure 4.26 Viewing Route Validity Changes with the Sniffer Pro ExpertRoute Layer
219_sniffer_04.qxd 6/28/02 11:51 AM Page 192
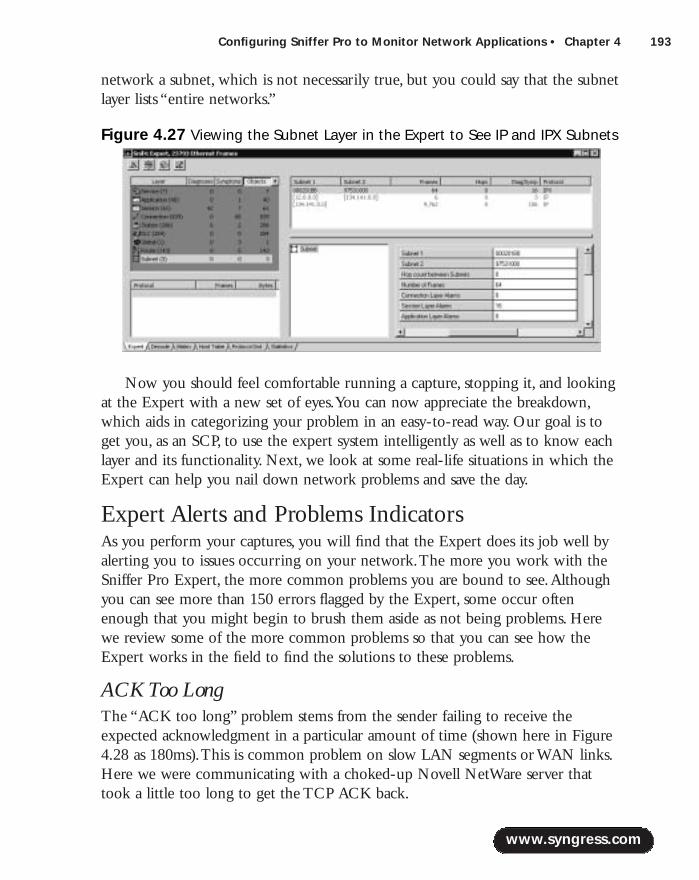
Configuring Sniffer Pro to Monitor Network Applications • Chapter 4 193
network a subnet, which is not necessarily true, but you could say that the subnetlayer lists “entire networks.”
Now you should feel comfortable running a capture, stopping it, and lookingat the Expert with a new set of eyes.You can now appreciate the breakdown,which aids in categorizing your problem in an easy-to-read way. Our goal is toget you, as an SCP, to use the expert system intelligently as well as to know eachlayer and its functionality. Next, we look at some real-life situations in which theExpert can help you nail down network problems and save the day.
Expert Alerts and Problems IndicatorsAs you perform your captures, you will find that the Expert does its job well byalerting you to issues occurring on your network.The more you work with theSniffer Pro Expert, the more common problems you are bound to see.Althoughyou can see more than 150 errors flagged by the Expert, some occur oftenenough that you might begin to brush them aside as not being problems. Herewe review some of the more common problems so that you can see how theExpert works in the field to find the solutions to these problems.
ACK Too LongThe “ACK too long” problem stems from the sender failing to receive theexpected acknowledgment in a particular amount of time (shown here in Figure4.28 as 180ms).This is common problem on slow LAN segments or WAN links.Here we were communicating with a choked-up Novell NetWare server thattook a little too long to get the TCP ACK back.
www.syngress.com
Figure 4.27 Viewing the Subnet Layer in the Expert to See IP and IPX Subnets
219_sniffer_04.qxd 6/28/02 11:51 AM Page 193

194 Chapter 4 • Configuring Sniffer Pro to Monitor Network Applications
Window FrozenA “Window Frozen” message is another common problem that is often ignored.This common Expert message indicates that there could be an application perfor-mance problem, as shown in Figure 4.29, where we simulated a file transfer on aninundated server.You need to understand TCP communications to analyze thisproblem.When a TCP connection is established, available buffer space is adver-tised at both ends of the connection.This buffer space is the window size.Astransmission continues, the available buffer space decreases until the applicationremoves the data from the buffer.This is a problem because performance can bedegraded if this space gets too small.A very common reason you get “WindowFrozen” messages is that a receiving host might not be able to keep up with thefast rate at which the sending host is transmitting.There are other reasons this sit-uation occurs, but this is a common reason.
Request DeniedThe “Request Denied” error message was simple to recreate as a common mes-sage seen within the Sniffer Pro Expert.You simply need to deny yourself accessto something and capture your attempts at login. (Be careful not to lock yourselfout of whatever you’re testing with!) Figure 4.30 shows you the Expert flagging a“Request Denied” problem between a client and a server.
www.syngress.com
Figure 4.28 Shows an ACK Too Long Message
Figure 4.29 A “Window Frozen” Message
Figure 4.30 Shows a Request Denied Message
219_sniffer_04.qxd 6/28/02 11:51 AM Page 194
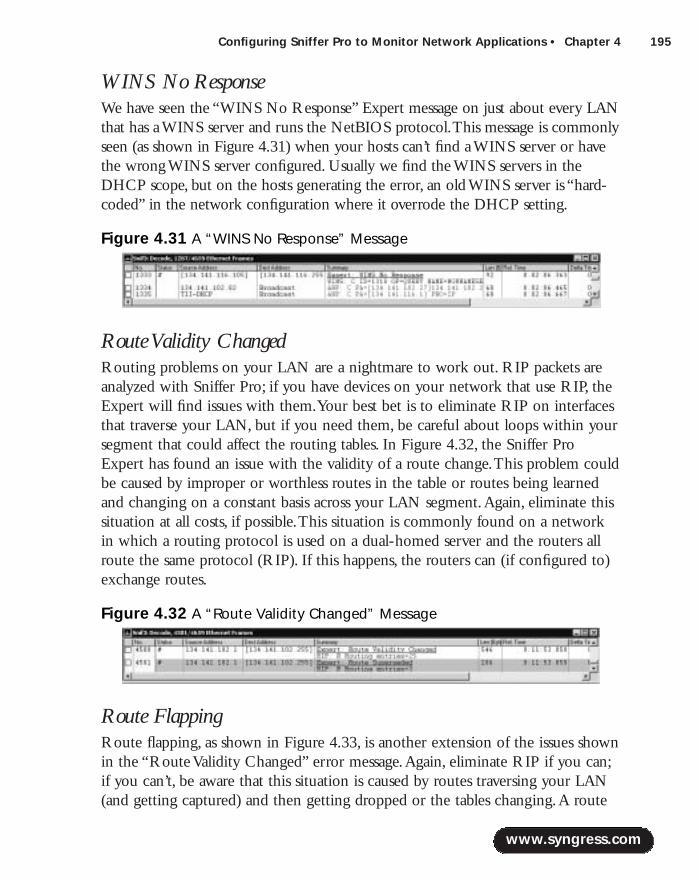
Configuring Sniffer Pro to Monitor Network Applications • Chapter 4 195
WINS No ResponseWe have seen the “WINS No Response” Expert message on just about every LANthat has a WINS server and runs the NetBIOS protocol.This message is commonlyseen (as shown in Figure 4.31) when your hosts can’t find a WINS server or havethe wrong WINS server configured. Usually we find the WINS servers in theDHCP scope, but on the hosts generating the error, an old WINS server is “hard-coded” in the network configuration where it overrode the DHCP setting.
Route Validity ChangedRouting problems on your LAN are a nightmare to work out. RIP packets areanalyzed with Sniffer Pro; if you have devices on your network that use RIP, theExpert will find issues with them.Your best bet is to eliminate RIP on interfacesthat traverse your LAN, but if you need them, be careful about loops within yoursegment that could affect the routing tables. In Figure 4.32, the Sniffer ProExpert has found an issue with the validity of a route change.This problem couldbe caused by improper or worthless routes in the table or routes being learnedand changing on a constant basis across your LAN segment.Again, eliminate thissituation at all costs, if possible.This situation is commonly found on a networkin which a routing protocol is used on a dual-homed server and the routers allroute the same protocol (RIP). If this happens, the routers can (if configured to)exchange routes.
Route FlappingRoute flapping, as shown in Figure 4.33, is another extension of the issues shownin the “Route Validity Changed” error message.Again, eliminate RIP if you can;if you can’t, be aware that this situation is caused by routes traversing your LAN(and getting captured) and then getting dropped or the tables changing.A route
www.syngress.com
Figure 4.31 A “WINS No Response” Message
Figure 4.32 A “Route Validity Changed” Message
219_sniffer_04.qxd 6/28/02 11:51 AM Page 195
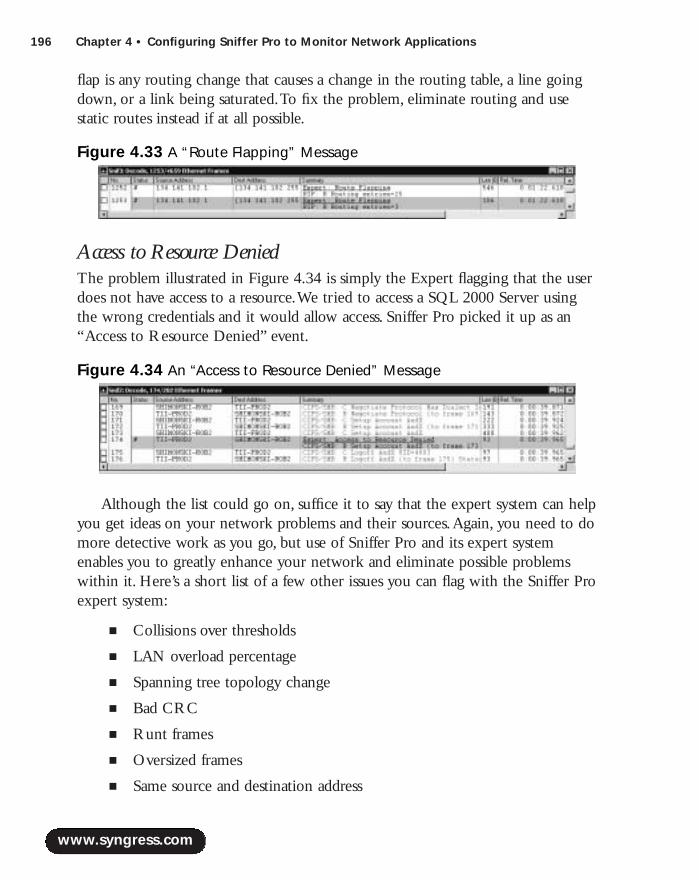
196 Chapter 4 • Configuring Sniffer Pro to Monitor Network Applications
flap is any routing change that causes a change in the routing table, a line goingdown, or a link being saturated.To fix the problem, eliminate routing and usestatic routes instead if at all possible.
Access to Resource DeniedThe problem illustrated in Figure 4.34 is simply the Expert flagging that the userdoes not have access to a resource.We tried to access a SQL 2000 Server usingthe wrong credentials and it would allow access. Sniffer Pro picked it up as an“Access to Resource Denied” event.
Although the list could go on, suffice it to say that the expert system can helpyou get ideas on your network problems and their sources.Again, you need to domore detective work as you go, but use of Sniffer Pro and its expert systemenables you to greatly enhance your network and eliminate possible problemswithin it. Here’s a short list of a few other issues you can flag with the Sniffer Proexpert system:
■ Collisions over thresholds
■ LAN overload percentage
■ Spanning tree topology change
■ Bad CRC
■ Runt frames
■ Oversized frames
■ Same source and destination address
www.syngress.com
Figure 4.33 A “Route Flapping” Message
Figure 4.34 An “Access to Resource Denied” Message
219_sniffer_04.qxd 6/28/02 11:51 AM Page 196
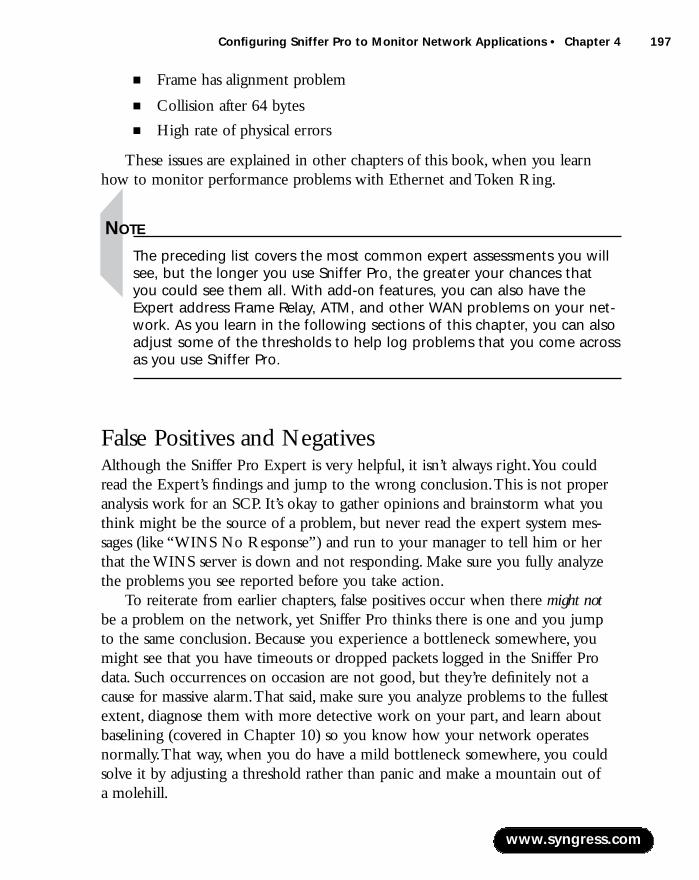
Configuring Sniffer Pro to Monitor Network Applications • Chapter 4 197
■ Frame has alignment problem
■ Collision after 64 bytes
■ High rate of physical errors
These issues are explained in other chapters of this book, when you learnhow to monitor performance problems with Ethernet and Token Ring.
NOTE
The preceding list covers the most common expert assessments you willsee, but the longer you use Sniffer Pro, the greater your chances thatyou could see them all. With add-on features, you can also have theExpert address Frame Relay, ATM, and other WAN problems on your net-work. As you learn in the following sections of this chapter, you can alsoadjust some of the thresholds to help log problems that you come acrossas you use Sniffer Pro.
False Positives and NegativesAlthough the Sniffer Pro Expert is very helpful, it isn’t always right.You couldread the Expert’s findings and jump to the wrong conclusion.This is not properanalysis work for an SCP. It’s okay to gather opinions and brainstorm what youthink might be the source of a problem, but never read the expert system mes-sages (like “WINS No Response”) and run to your manager to tell him or herthat the WINS server is down and not responding. Make sure you fully analyzethe problems you see reported before you take action.
To reiterate from earlier chapters, false positives occur when there might notbe a problem on the network, yet Sniffer Pro thinks there is one and you jumpto the same conclusion. Because you experience a bottleneck somewhere, youmight see that you have timeouts or dropped packets logged in the Sniffer Prodata. Such occurrences on occasion are not good, but they’re definitely not acause for massive alarm.That said, make sure you analyze problems to the fullestextent, diagnose them with more detective work on your part, and learn aboutbaselining (covered in Chapter 10) so you know how your network operates normally.That way, when you do have a mild bottleneck somewhere, you couldsolve it by adjusting a threshold rather than panic and make a mountain out of a molehill.
www.syngress.com
219_sniffer_04.qxd 6/28/02 11:51 AM Page 197
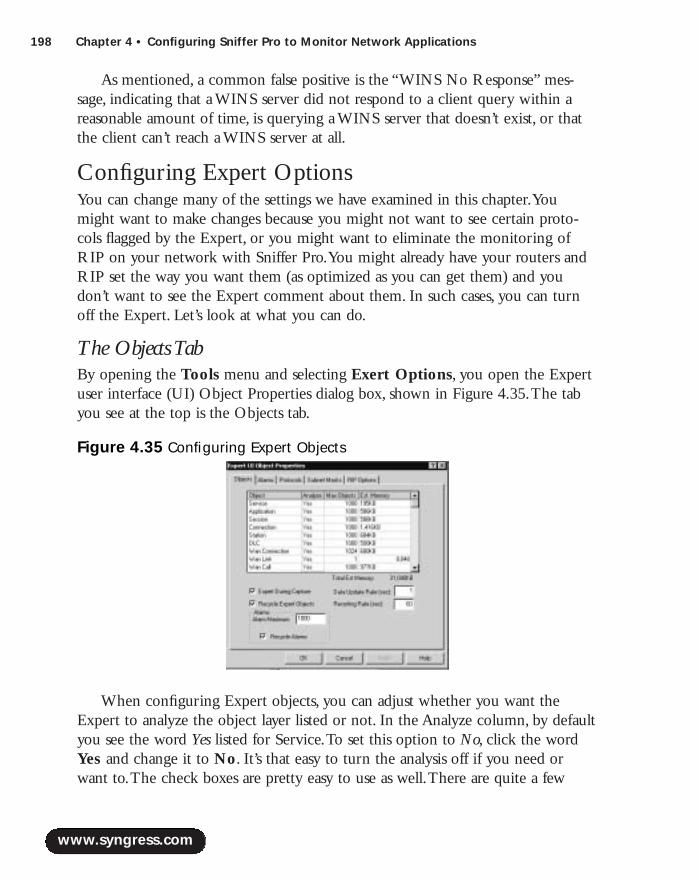
198 Chapter 4 • Configuring Sniffer Pro to Monitor Network Applications
As mentioned, a common false positive is the “WINS No Response” mes-sage, indicating that a WINS server did not respond to a client query within areasonable amount of time, is querying a WINS server that doesn’t exist, or thatthe client can’t reach a WINS server at all.
Configuring Expert OptionsYou can change many of the settings we have examined in this chapter.Youmight want to make changes because you might not want to see certain proto-cols flagged by the Expert, or you might want to eliminate the monitoring ofRIP on your network with Sniffer Pro.You might already have your routers andRIP set the way you want them (as optimized as you can get them) and youdon’t want to see the Expert comment about them. In such cases, you can turnoff the Expert. Let’s look at what you can do.
The Objects TabBy opening the Tools menu and selecting Exert Options, you open the Expertuser interface (UI) Object Properties dialog box, shown in Figure 4.35.The tabyou see at the top is the Objects tab.
When configuring Expert objects, you can adjust whether you want theExpert to analyze the object layer listed or not. In the Analyze column, by defaultyou see the word Yes listed for Service.To set this option to No, click the wordYes and change it to No. It’s that easy to turn the analysis off if you need orwant to.The check boxes are pretty easy to use as well.There are quite a few
www.syngress.com
Figure 4.35 Configuring Expert Objects
219_sniffer_04.qxd 6/28/02 11:51 AM Page 198

Configuring Sniffer Pro to Monitor Network Applications • Chapter 4 199
configurations you can make; most revolve around the data recorded in theobject database.
In Figure 4.35, you see that you have Max Objects set at 1000 for the Servicelayer.This setting indicates that you are specifying the maximum number ofobjects that can be created in the database for the Service layer.At the end of thissection, you learn how to view the database options.With the “recycle” options,once again you can specify whether the Expert either stops creating new objectsbased on the captured data or “recycles” the ones that are currently recorded tomake room for new ones. Other configurations within the Objects tab are to setthe Expert to hide during the capture process as well as rates of data update andresorting in seconds-based intervals. On the very bottom of the Objects tab, yousee alarm settings that can also be configured.You can either set the maximumnumber of alarms that are to be created in the database, or you can specify as youdid for recycling objects and the alarms will be recycled as well.
The Alarms TabThe Alarms tab is used to enable alarms and set their severity levels.You can setthresholds for your Expert Symptoms and Diagnoses so they trip and flag prob-lems at the set threshold.You can also set severities for each alarm, which we dis-cuss shortly.You can also tell Sniffer Pro to record the alarm in the Alarm log.Toview the Alarm log, open to the Monitor menu and select Alarm Log from thedrop-down menu. Following chapters cover the Alarm log in more detail.
The Alarms tab, as shown in Figure 4.36, contains columns that show you adescription (which is the Expert layer) and a value that allows you to changeoptions based on the selected item in the Description column.
www.syngress.com
Figure 4.36 Using the Alarms Tab
219_sniffer_04.qxd 6/28/02 11:51 AM Page 199

200 Chapter 4 • Configuring Sniffer Pro to Monitor Network Applications
Description, the first column you work with, contains the actual alarms, butyou need to expand each layer to see the alarms listed within.You can expand analarm by clicking the plus sign (+) sign in the 0 column.When you expand analarm, it then shows up in the 1 column, as shown in Figure 4.37.Value, thesecond column you work with, contains the grouping of values you can set foreach listed alarm. In Figure 4.37, you can see that the Connection layer isexpanded to show the first value, which is Ack Too Long.
Severity is the level at which the problem is rated. In Figure 4.37, weexpanded the Connection layer to expose the Ack Too Long issue we saw earlierso we can view the severity level.The severity is flagged as minor, which meansthat’s how the Expert system marks it.You can change this setting to one of theseverities listed in Table 4.2.
Table 4.2 Expert Option Severity Levels
Severity Level Severity Rating
Critical Most severeMajor Not as severe as Critical, but problematicMinor Where most options are setWarning To be warned of problemsInformational Least severeDisabled Disables the option
www.syngress.com
Figure 4.37 Altering Object Severity Values
219_sniffer_04.qxd 6/28/02 11:51 AM Page 200
Configuring Sniffer Pro to Monitor Network Applications • Chapter 4 201
NOTE
To become a Sniffer Certified Professional, you must fully understandseverity levels for the first SCP exam.
We recommend that you go through each severity level and look at what youcan and can’t configure for the Sniffer Pro Expert system.
The Protocols TabThe Protocols tab, shown in Figure 4.38, is where you can specify whether theExpert enables protocols for analysis.You either turn them on (by layer), or youturn them off.The second column,Analyze, allows you to select either Yes or No.Two buttons, Enable All and Disable All, allow you to enable or disable them all.This setup also works as a reset to make sure you have everything turned onwithout having to expand each layer to look at the contents within.
www.syngress.com
Registry Hacking the Sniffer Pro Expert AlarmsIn online forums, you can find hints and tips on how to get rid ofcommon or annoying Expert messages. All to often we see readers ofthese forums post tips on how to hack the registry to stop an alarm fromlogging. Look at Figure 4.37; you can see the option to have the alarmlogged, which you can set to No, or you can set the time so the systemdoesn’t log as often. We do not recommend hacking the system registryto alter this information, because—although it’s annoying to see thesealarms at times—it’s much less annoying than having to go backthrough Chapter 2 again to reinstall the Sniffer Pro application, or worseyet, restore your system from a corrupted registry. If you must, here isthe key for you to view the options: HKEY_LOCAL_MACHINE\Software\Network Associates, Inc.\Sniffer Pro\4.5\Expert\Local\Alarms.
Make sure you have a full backup of your system registry if youmake any changes to it.
Configuring & Implementing…
219_sniffer_04.qxd 6/28/02 11:51 AM Page 201
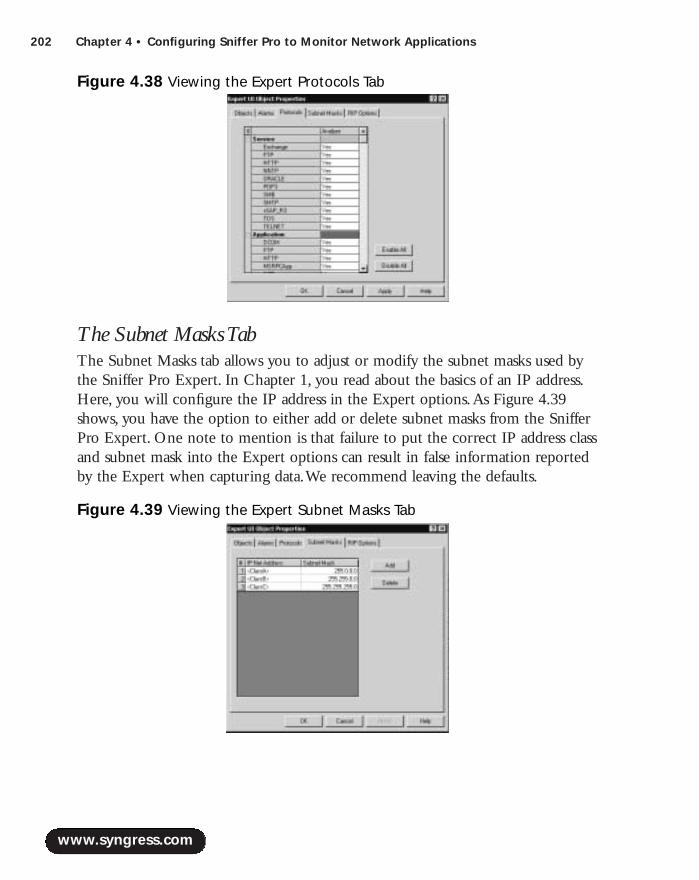
202 Chapter 4 • Configuring Sniffer Pro to Monitor Network Applications
The Subnet Masks TabThe Subnet Masks tab allows you to adjust or modify the subnet masks used bythe Sniffer Pro Expert. In Chapter 1, you read about the basics of an IP address.Here, you will configure the IP address in the Expert options.As Figure 4.39shows, you have the option to either add or delete subnet masks from the SnifferPro Expert. One note to mention is that failure to put the correct IP address classand subnet mask into the Expert options can result in false information reportedby the Expert when capturing data.We recommend leaving the defaults.
www.syngress.com
Figure 4.38 Viewing the Expert Protocols Tab
Figure 4.39 Viewing the Expert Subnet Masks Tab
219_sniffer_04.qxd 6/28/02 11:51 AM Page 202
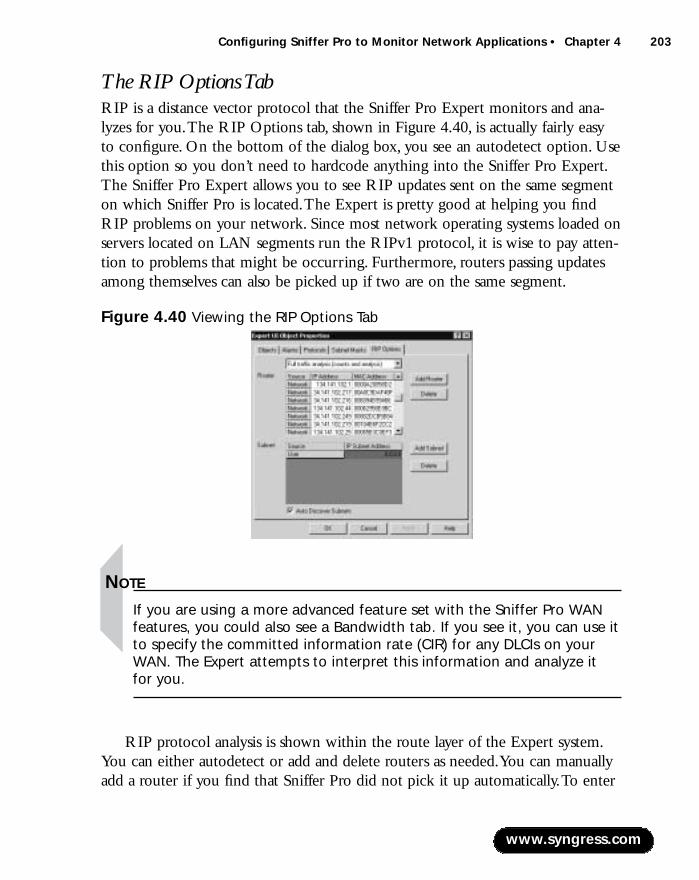
Configuring Sniffer Pro to Monitor Network Applications • Chapter 4 203
The RIP Options TabRIP is a distance vector protocol that the Sniffer Pro Expert monitors and ana-lyzes for you.The RIP Options tab, shown in Figure 4.40, is actually fairly easyto configure. On the bottom of the dialog box, you see an autodetect option. Usethis option so you don’t need to hardcode anything into the Sniffer Pro Expert.The Sniffer Pro Expert allows you to see RIP updates sent on the same segmenton which Sniffer Pro is located.The Expert is pretty good at helping you findRIP problems on your network. Since most network operating systems loaded onservers located on LAN segments run the RIPv1 protocol, it is wise to pay atten-tion to problems that might be occurring. Furthermore, routers passing updatesamong themselves can also be picked up if two are on the same segment.
NOTE
If you are using a more advanced feature set with the Sniffer Pro WANfeatures, you could also see a Bandwidth tab. If you see it, you can use itto specify the committed information rate (CIR) for any DLCIs on yourWAN. The Expert attempts to interpret this information and analyze it for you.
RIP protocol analysis is shown within the route layer of the Expert system.You can either autodetect or add and delete routers as needed.You can manuallyadd a router if you find that Sniffer Pro did not pick it up automatically.To enter
www.syngress.com
Figure 4.40 Viewing the RIP Options Tab
219_sniffer_04.qxd 6/28/02 11:51 AM Page 203
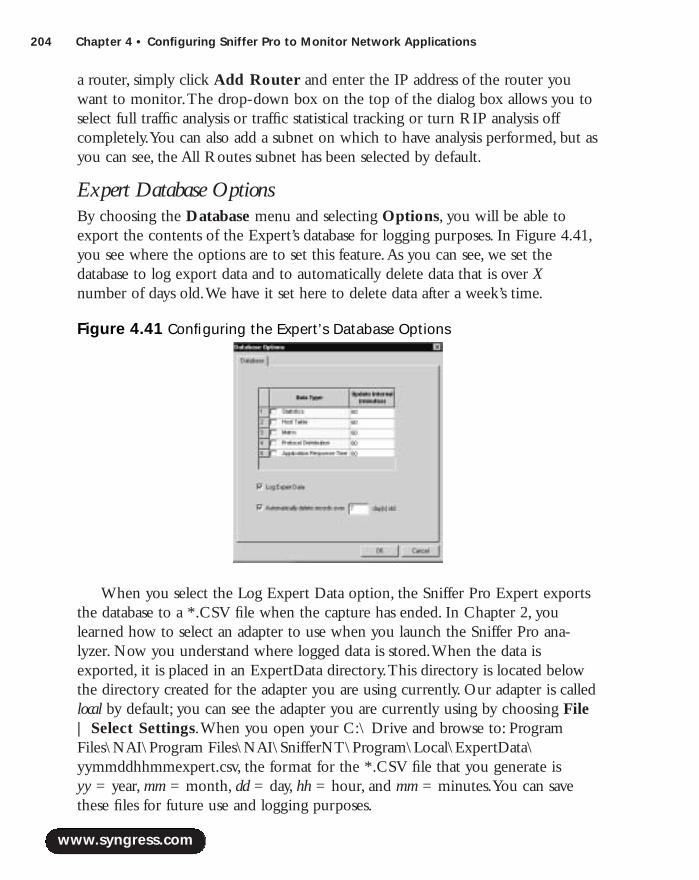
204 Chapter 4 • Configuring Sniffer Pro to Monitor Network Applications
a router, simply click Add Router and enter the IP address of the router youwant to monitor.The drop-down box on the top of the dialog box allows you toselect full traffic analysis or traffic statistical tracking or turn RIP analysis offcompletely.You can also add a subnet on which to have analysis performed, but asyou can see, the All Routes subnet has been selected by default.
Expert Database OptionsBy choosing the Database menu and selecting Options, you will be able toexport the contents of the Expert’s database for logging purposes. In Figure 4.41,you see where the options are to set this feature.As you can see, we set thedatabase to log export data and to automatically delete data that is over Xnumber of days old.We have it set here to delete data after a week’s time.
When you select the Log Expert Data option, the Sniffer Pro Expert exportsthe database to a *.CSV file when the capture has ended. In Chapter 2, youlearned how to select an adapter to use when you launch the Sniffer Pro ana-lyzer. Now you understand where logged data is stored.When the data isexported, it is placed in an ExpertData directory.This directory is located belowthe directory created for the adapter you are using currently. Our adapter is calledlocal by default; you can see the adapter you are currently using by choosing File| Select Settings.When you open your C:\ Drive and browse to: ProgramFiles\NAI\Program Files\NAI\SnifferNT\Program\Local\ExpertData\yymmddhhmmexpert.csv, the format for the *.CSV file that you generate is yy = year, mm = month, dd = day, hh = hour, and mm = minutes.You can savethese files for future use and logging purposes.
www.syngress.com
Figure 4.41 Configuring the Expert’s Database Options
219_sniffer_04.qxd 6/28/02 11:51 AM Page 204
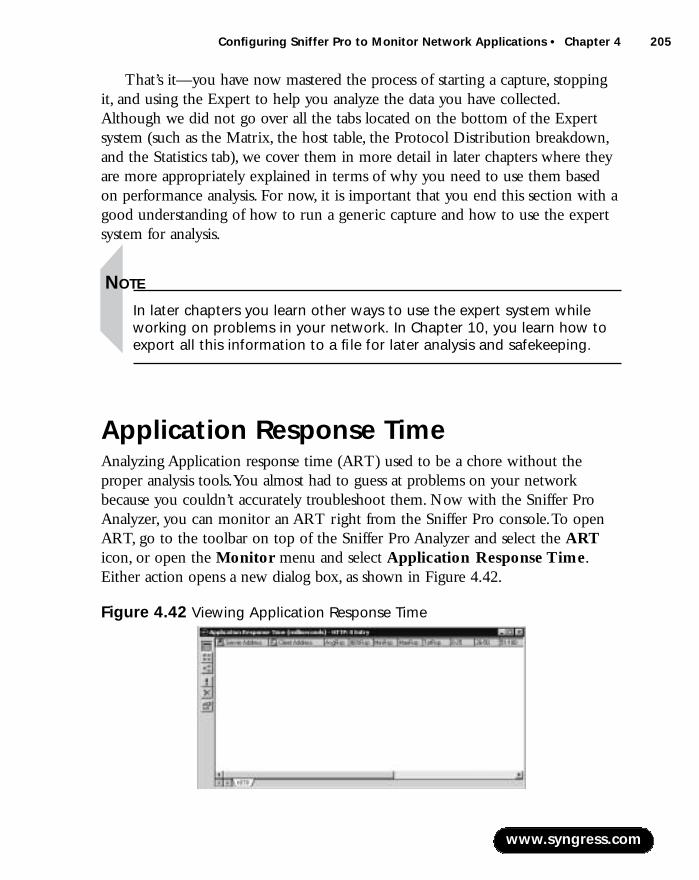
Configuring Sniffer Pro to Monitor Network Applications • Chapter 4 205
That’s it—you have now mastered the process of starting a capture, stoppingit, and using the Expert to help you analyze the data you have collected.Although we did not go over all the tabs located on the bottom of the Expertsystem (such as the Matrix, the host table, the Protocol Distribution breakdown,and the Statistics tab), we cover them in more detail in later chapters where theyare more appropriately explained in terms of why you need to use them basedon performance analysis. For now, it is important that you end this section with agood understanding of how to run a generic capture and how to use the expertsystem for analysis.
NOTE
In later chapters you learn other ways to use the expert system whileworking on problems in your network. In Chapter 10, you learn how toexport all this information to a file for later analysis and safekeeping.
Application Response TimeAnalyzing Application response time (ART) used to be a chore without theproper analysis tools.You almost had to guess at problems on your networkbecause you couldn’t accurately troubleshoot them. Now with the Sniffer ProAnalyzer, you can monitor an ART right from the Sniffer Pro console.To openART, go to the toolbar on top of the Sniffer Pro Analyzer and select the ARTicon, or open the Monitor menu and select Application Response Time.Either action opens a new dialog box, as shown in Figure 4.42.
www.syngress.com
Figure 4.42 Viewing Application Response Time
219_sniffer_04.qxd 6/28/02 11:51 AM Page 205
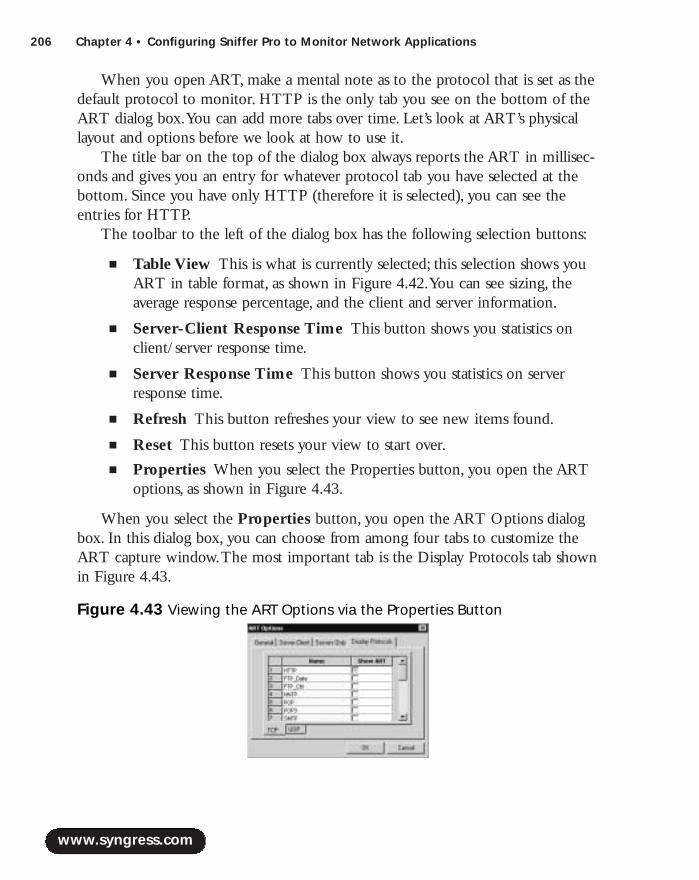
206 Chapter 4 • Configuring Sniffer Pro to Monitor Network Applications
When you open ART, make a mental note as to the protocol that is set as thedefault protocol to monitor. HTTP is the only tab you see on the bottom of theART dialog box.You can add more tabs over time. Let’s look at ART’s physicallayout and options before we look at how to use it.
The title bar on the top of the dialog box always reports the ART in millisec-onds and gives you an entry for whatever protocol tab you have selected at thebottom. Since you have only HTTP (therefore it is selected), you can see theentries for HTTP.
The toolbar to the left of the dialog box has the following selection buttons:
■ Table View This is what is currently selected; this selection shows youART in table format, as shown in Figure 4.42.You can see sizing, theaverage response percentage, and the client and server information.
■ Server-Client Response Time This button shows you statistics onclient/server response time.
■ Server Response Time This button shows you statistics on serverresponse time.
■ Refresh This button refreshes your view to see new items found.
■ Reset This button resets your view to start over.
■ Properties When you select the Properties button, you open the ARToptions, as shown in Figure 4.43.
When you select the Properties button, you open the ART Options dialogbox. In this dialog box, you can choose from among four tabs to customize theART capture window.The most important tab is the Display Protocols tab shownin Figure 4.43.
www.syngress.com
Figure 4.43 Viewing the ART Options via the Properties Button
219_sniffer_04.qxd 6/28/02 11:51 AM Page 206

Configuring Sniffer Pro to Monitor Network Applications • Chapter 4 207
If you select protocols to view other than HTTP, you can select them onboth the TCP and UDP ranges, as shown in Figure 4.43, within the DisplayProtocols tab. If you select new protocols to monitor, Sniffer Pro forces you toclose ART and the program reopens it automatically.You will see a new ARTdialog box open, as shown in Figure 4.44.
Figure 4.44 shows that we have used the Telnet protocol to attach to a device.Since attaching to the device involved using an application protocol set such asTelnet,ART picked it up and gave me a general reading on how well it per-formed.You can use this same method for any of the protocols listed in the ARToptions you have configured.
The ART monitor measures and reports to you the response times for theapplication layer (Layer 7 on the OSI) client/server connections that are based onTCP and UDP ports that you configure.
You can switch your view to the client/server or just server response timesbased on a time bar chart, as shown in Figure 4.45. By clicking the corre-sponding toolbar icon, you can set your view in bar chart-based mode.
www.syngress.com
Figure 4.44 Viewing ART with More Protocols Selected for Monitoring
Figure 4.45 Viewing the Server Response Time Bar Chart
219_sniffer_04.qxd 6/28/02 11:51 AM Page 207
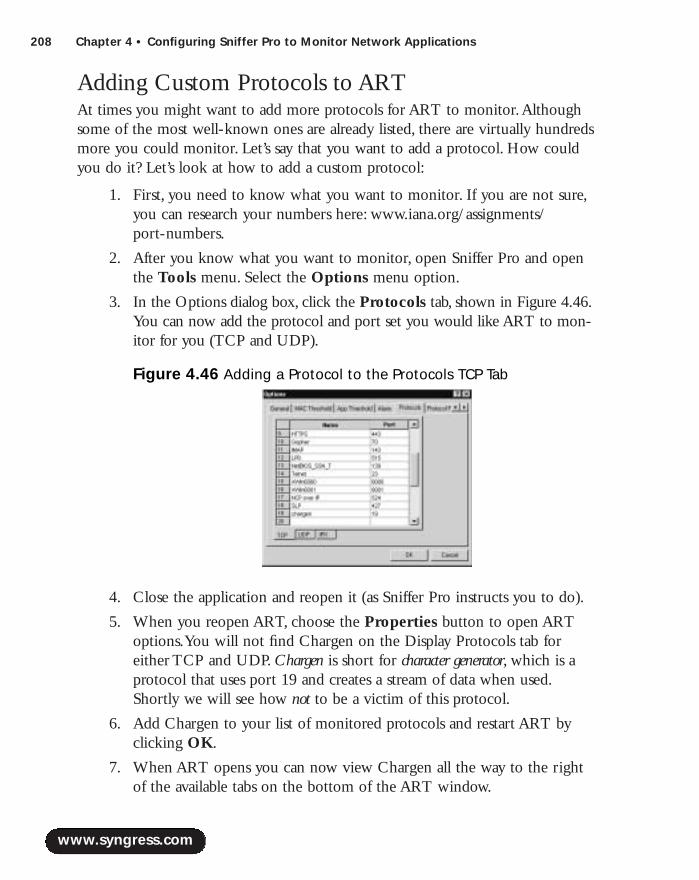
208 Chapter 4 • Configuring Sniffer Pro to Monitor Network Applications
Adding Custom Protocols to ARTAt times you might want to add more protocols for ART to monitor.Althoughsome of the most well-known ones are already listed, there are virtually hundredsmore you could monitor. Let’s say that you want to add a protocol. How couldyou do it? Let’s look at how to add a custom protocol:
1. First, you need to know what you want to monitor. If you are not sure,you can research your numbers here: www.iana.org/assignments/port-numbers.
2. After you know what you want to monitor, open Sniffer Pro and openthe Tools menu. Select the Options menu option.
3. In the Options dialog box, click the Protocols tab, shown in Figure 4.46.You can now add the protocol and port set you would like ART to mon-itor for you (TCP and UDP).
4. Close the application and reopen it (as Sniffer Pro instructs you to do).
5. When you reopen ART, choose the Properties button to open ARToptions.You will not find Chargen on the Display Protocols tab foreither TCP and UDP. Chargen is short for character generator, which is aprotocol that uses port 19 and creates a stream of data when used.Shortly we will see how not to be a victim of this protocol.
6. Add Chargen to your list of monitored protocols and restart ART byclicking OK.
7. When ART opens you can now view Chargen all the way to the rightof the available tabs on the bottom of the ART window.
www.syngress.com
Figure 4.46 Adding a Protocol to the Protocols TCP Tab
219_sniffer_04.qxd 6/28/02 11:51 AM Page 208
Configuring Sniffer Pro to Monitor Network Applications • Chapter 4 209
8. To test Chargen,Telnet to a device via port 19: Telnet Ip_AddressPort (or telnet 10.0.0.1 19).
To make this example more interesting, we just showed you how to do acharacter generator attack on a device running a Telnet daemon.This is a test youcan run on devices to see if they are prone to attack via TCP and UDP smallports such as port 19.A character generator attack can inundate a device by pro-cessing characters and either slow it or crash it. Practice this tip on a lab networkbefore trying it on your production network where you can potentially get your-self in hot water, especially if the IT staff logs your IP address as you Telnet to thedevice to practice on.
NOTE
To eliminate the possibility of a hacker running a Chargen attack on yourCisco routers, you can remove the service udp-small-servers and the ser-vice tcp-small-servers from your configuration.
Although you might not want to select this as a port to monitor responsetimes on, we used it to show you how you can add and test any protocol andport set from the www.iana.org Web site to be monitored by ART. Use ART tomake sure your client/server-based applications are running the way you wantthem to, monitoring the statistics provided by ART.Another note on ART pro-tocol customization is that although in Figure 4.46 you could add IPX-basedprotocols; you cannot monitor them with ART.ART does not support moni-toring over protocols running over IPX in this release of the Sniffer Pro software.
Now that you have mastered the art (no pun intended) of applicationresponse timing and configuration, let’s take what we have learned up to nowand put it to the test on a network in need of some analysis.
Configuring Sniffer Pro to Capture and Analyze NetWare TrafficThis section of the chapter looks at all the steps you’ve learned and puts them tothe test against a Novell NetWare network.Again, this is the foundation oflearning how to use the Sniffer Pro application.As you read each chapter afterthis one, the theory and skills you use will grow. Let’s look at how the Sniffer Pro
www.syngress.com
219_sniffer_04.qxd 6/28/02 11:51 AM Page 209
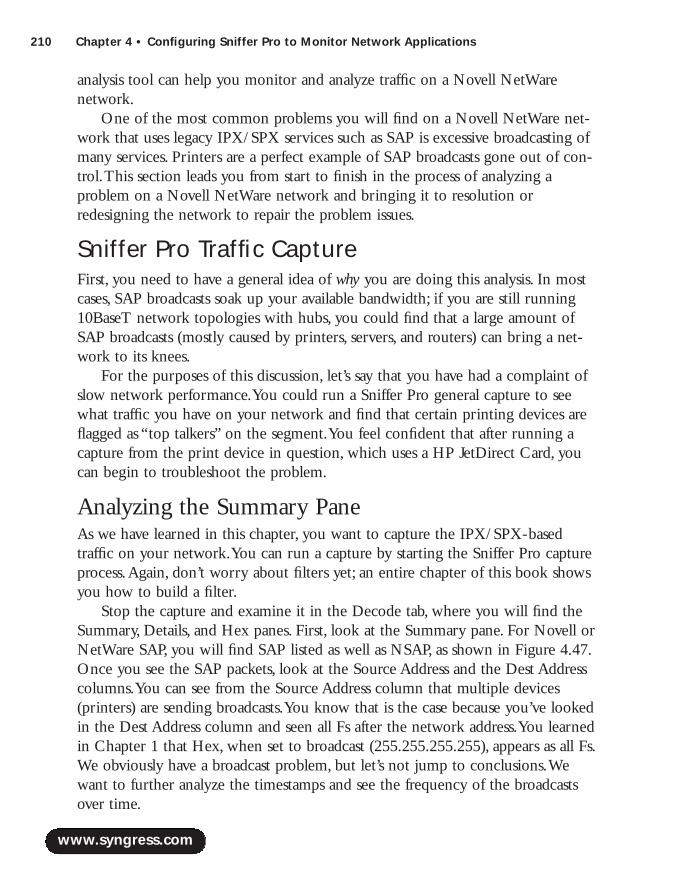
210 Chapter 4 • Configuring Sniffer Pro to Monitor Network Applications
analysis tool can help you monitor and analyze traffic on a Novell NetWare network.
One of the most common problems you will find on a Novell NetWare net-work that uses legacy IPX/SPX services such as SAP is excessive broadcasting ofmany services. Printers are a perfect example of SAP broadcasts gone out of con-trol.This section leads you from start to finish in the process of analyzing aproblem on a Novell NetWare network and bringing it to resolution orredesigning the network to repair the problem issues.
Sniffer Pro Traffic CaptureFirst, you need to have a general idea of why you are doing this analysis. In mostcases, SAP broadcasts soak up your available bandwidth; if you are still running10BaseT network topologies with hubs, you could find that a large amount ofSAP broadcasts (mostly caused by printers, servers, and routers) can bring a net-work to its knees.
For the purposes of this discussion, let’s say that you have had a complaint ofslow network performance.You could run a Sniffer Pro general capture to seewhat traffic you have on your network and find that certain printing devices areflagged as “top talkers” on the segment.You feel confident that after running acapture from the print device in question, which uses a HP JetDirect Card, youcan begin to troubleshoot the problem.
Analyzing the Summary PaneAs we have learned in this chapter, you want to capture the IPX/SPX-basedtraffic on your network.You can run a capture by starting the Sniffer Pro captureprocess.Again, don’t worry about filters yet; an entire chapter of this book showsyou how to build a filter.
Stop the capture and examine it in the Decode tab, where you will find theSummary, Details, and Hex panes. First, look at the Summary pane. For Novell orNetWare SAP, you will find SAP listed as well as NSAP, as shown in Figure 4.47.Once you see the SAP packets, look at the Source Address and the Dest Addresscolumns.You can see from the Source Address column that multiple devices(printers) are sending broadcasts.You know that is the case because you’ve lookedin the Dest Address column and seen all Fs after the network address.You learnedin Chapter 1 that Hex, when set to broadcast (255.255.255.255), appears as all Fs.We obviously have a broadcast problem, but let’s not jump to conclusions.Wewant to further analyze the timestamps and see the frequency of the broadcastsover time.
www.syngress.com
219_sniffer_04.qxd 6/28/02 11:51 AM Page 210
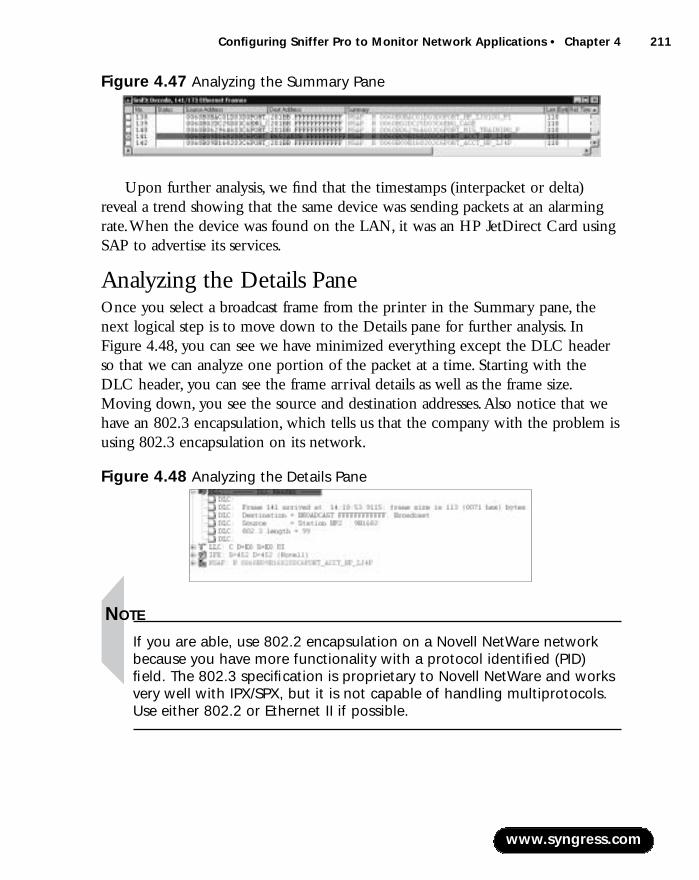
Configuring Sniffer Pro to Monitor Network Applications • Chapter 4 211
Upon further analysis, we find that the timestamps (interpacket or delta)reveal a trend showing that the same device was sending packets at an alarmingrate.When the device was found on the LAN, it was an HP JetDirect Card usingSAP to advertise its services.
Analyzing the Details PaneOnce you select a broadcast frame from the printer in the Summary pane, thenext logical step is to move down to the Details pane for further analysis. InFigure 4.48, you can see we have minimized everything except the DLC headerso that we can analyze one portion of the packet at a time. Starting with theDLC header, you can see the frame arrival details as well as the frame size.Moving down, you see the source and destination addresses.Also notice that wehave an 802.3 encapsulation, which tells us that the company with the problem isusing 802.3 encapsulation on its network.
NOTE
If you are able, use 802.2 encapsulation on a Novell NetWare networkbecause you have more functionality with a protocol identified (PID)field. The 802.3 specification is proprietary to Novell NetWare and worksvery well with IPX/SPX, but it is not capable of handling multiprotocols.Use either 802.2 or Ethernet II if possible.
www.syngress.com
Figure 4.47 Analyzing the Summary Pane
Figure 4.48 Analyzing the Details Pane
219_sniffer_04.qxd 6/28/02 11:51 AM Page 211

212 Chapter 4 • Configuring Sniffer Pro to Monitor Network Applications
Now minimize the DLC header and maximize the LLC header, as shown inFigure 4.49. LLC, or Logical Link Control, shows you SSAPs and DSAPs as yourindividual address and command.
Minimize your LLC header and maximize your IPX header, as shown inFigure 4.50, to view the IPX header.
In IPX you will find some interesting information.Working our way downfrom the top of the header, let’s analyze the packet header details. IPX is a con-nectionless datagram protocol that delivers packets across the Internet and pro-vides NetWare workstations and file servers with addressing and internetworkingrouting services. Let’s look at what we can determine the excessive broadcastproblem:
■ Checksum The checksum is set to FFFFh.
■ Length Shows the length of the IPX datagram in octets. Here, is it 96.
■ Transport Control Used by NetWare routers. Set to 0 by IPX beforepacket transmission.
■ Packet Type Specifies the packet information.You can see that thepacket type here is 0, so it stands for SAP; 1 = RIP, 2 = Echo, and so on.
■ Node Number A 48-bit number that identifies the LAN hardwareaddress.The node number is FFFFFFFFFFFF, which means it’s a broadcast.
www.syngress.com
Figure 4.49 The Maximized LLC Header
Figure 4.50 The Maximized IPX Header
219_sniffer_04.qxd 6/28/02 11:51 AM Page 212

Configuring Sniffer Pro to Monitor Network Applications • Chapter 4 213
■ Socket number A 16-bit number that identifies the higher-layerpacket that can equal quite a few hex addresses. Here the socket is 452,but it is really 0452h, and 452 = SAP (451 = NCP, 453 = RIP, 455 =NetBIOS, and so on).
From our examination of this IPX header, we have determined that this is infact a SAP broadcast from a source address (which, as you can see in the tracedecode, is a HP Laser Jet 4!).We are getting closer to the end of the packet, sominimize the IPX header and let’s move to the SAP decode.
The next and last portion of the Details pane is where we look at the SAPinformation. In Figure 4.51, the NetWare General Service Response (NSAP) iswhere we will see the actual codes to verify this problem.
In the SAP operation listing, you can see what type of SAP it is.The listingsyou have for operation are as follows: 1 = general service request, 2 = generalservice response, 3 = nearest service request, and 4 = nearest service response.This SAP is a general service response. Let’s continue down and analyze:
■ Service Type This is the number that denotes the service being used.Here it is 030C, which points directly to the HP printer. How do youknow? We know by the number assignment: decimal = 780, hex = 030c(Intel Netport 2 or HP JetDirect or HP Quicksilver).
■ Server Name The 48-byte field containing the server’s name in quota-tion marks, but this is not actually a server, so don’t read into it asthough it is a server—it’s a printer device.
■ Network The 32-bit network number of the server.
■ Node The 48-bit node number of the server.
■ Socket The 16-bit socket number of the server.
www.syngress.com
Figure 4.51 The Maximized NetWare General Service Response Header
219_sniffer_04.qxd 6/28/02 11:51 AM Page 213
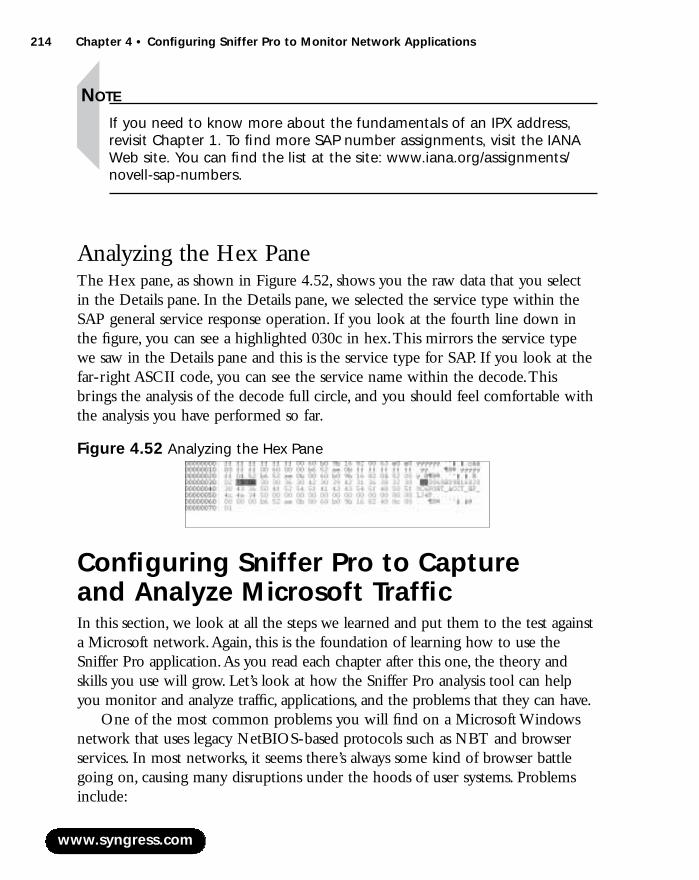
214 Chapter 4 • Configuring Sniffer Pro to Monitor Network Applications
NOTE
If you need to know more about the fundamentals of an IPX address,revisit Chapter 1. To find more SAP number assignments, visit the IANAWeb site. You can find the list at the site: www.iana.org/assignments/novell-sap-numbers.
Analyzing the Hex PaneThe Hex pane, as shown in Figure 4.52, shows you the raw data that you selectin the Details pane. In the Details pane, we selected the service type within theSAP general service response operation. If you look at the fourth line down inthe figure, you can see a highlighted 030c in hex.This mirrors the service typewe saw in the Details pane and this is the service type for SAP. If you look at thefar-right ASCII code, you can see the service name within the decode.Thisbrings the analysis of the decode full circle, and you should feel comfortable withthe analysis you have performed so far.
Configuring Sniffer Pro to Capture and Analyze Microsoft TrafficIn this section, we look at all the steps we learned and put them to the test againsta Microsoft network.Again, this is the foundation of learning how to use theSniffer Pro application.As you read each chapter after this one, the theory andskills you use will grow. Let’s look at how the Sniffer Pro analysis tool can helpyou monitor and analyze traffic, applications, and the problems that they can have.
One of the most common problems you will find on a Microsoft Windowsnetwork that uses legacy NetBIOS-based protocols such as NBT and browserservices. In most networks, it seems there’s always some kind of browser battlegoing on, causing many disruptions under the hoods of user systems. Problemsinclude:
www.syngress.com
Figure 4.52 Analyzing the Hex Pane
219_sniffer_04.qxd 6/28/02 11:51 AM Page 214
Configuring Sniffer Pro to Monitor Network Applications • Chapter 4 215
■ Wasted CPU processing cycles
■ Added bandwidth usage (more problematic on WAN links)
■ Unwanted log events (can fill logs if the situation is bad enough)
■ A workstation unnecessarily becoming a master browser
■ A UNIX-based workstation with SAMBA participating in browser elections
These are some of the problems that can be encountered with NetBIOS-based services; the last two problems can almost devastate a network. In oneinstance, a Sun Solaris server with SAMBA took over the role of master browserbecause it wasn’t configured properly and wiped out the list because it didn’thave the services enabled to maintain the list.Although Microsoft wanted you tothink that DNS would take over the dreaded NetBIOS systems with the incep-tion of Windows 2000, you had to have a pure Windows 2000 network to getand see that benefit. Since most of the world’s networks still run some legacyoperating systems (some people are still running Windows 3.11) and legacy appli-cations, it is almost impossible to eliminate the dependency on NetBIOS just yet.However, there is a way for you to clean up your network so you can helpremove the problems that NetBIOS misconfiguration can cause. Let’s put yourhard-learned skills to the test to solve a browser problem.
NOTE
Microsoft browser problem elimination is covered later in the book, afteryou have learned a few more important skills to help you troubleshootthe problem even further and with more granularity. The Browser serviceis also covered in greater detail as you progress through the book.
Sniffer Pro Traffic CaptureAgain, you need a general idea of why you are doing this analysis. In thisinstance, a workstation that is participating in the browser election process iscausing disruption to the network.You initially found the problem within theEvent View logs in your workstation and your main file servers.The errors pointto the fact that your workstation is a backup browser and is constantly generating
www.syngress.com
219_sniffer_04.qxd 6/28/02 11:51 AM Page 215
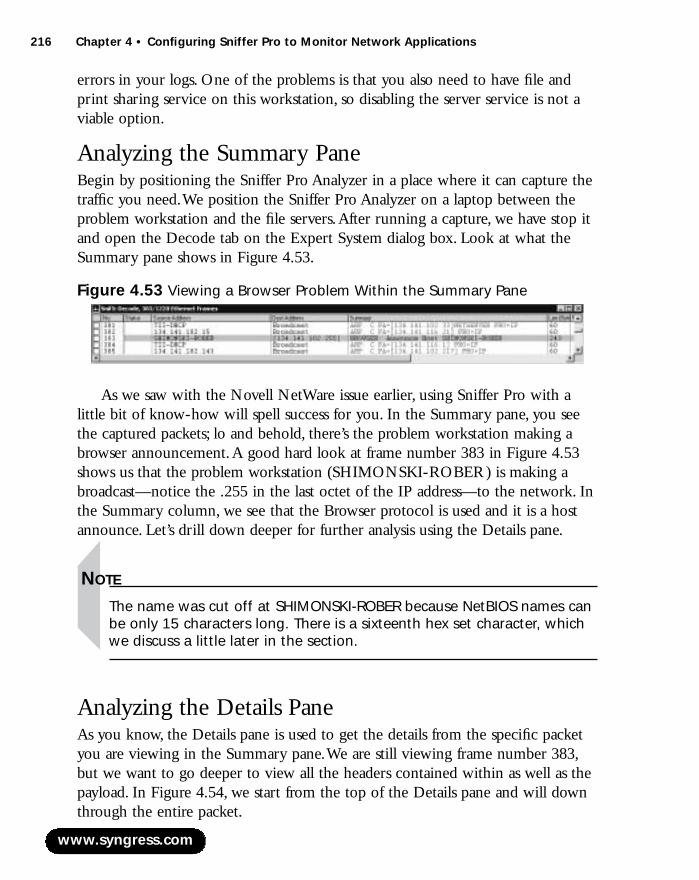
216 Chapter 4 • Configuring Sniffer Pro to Monitor Network Applications
errors in your logs. One of the problems is that you also need to have file andprint sharing service on this workstation, so disabling the server service is not aviable option.
Analyzing the Summary PaneBegin by positioning the Sniffer Pro Analyzer in a place where it can capture thetraffic you need.We position the Sniffer Pro Analyzer on a laptop between theproblem workstation and the file servers.After running a capture, we have stop itand open the Decode tab on the Expert System dialog box. Look at what theSummary pane shows in Figure 4.53.
As we saw with the Novell NetWare issue earlier, using Sniffer Pro with alittle bit of know-how will spell success for you. In the Summary pane, you seethe captured packets; lo and behold, there’s the problem workstation making abrowser announcement.A good hard look at frame number 383 in Figure 4.53shows us that the problem workstation (SHIMONSKI-ROBER) is making abroadcast—notice the .255 in the last octet of the IP address—to the network. Inthe Summary column, we see that the Browser protocol is used and it is a hostannounce. Let’s drill down deeper for further analysis using the Details pane.
NOTE
The name was cut off at SHIMONSKI-ROBER because NetBIOS names canbe only 15 characters long. There is a sixteenth hex set character, whichwe discuss a little later in the section.
Analyzing the Details PaneAs you know, the Details pane is used to get the details from the specific packetyou are viewing in the Summary pane.We are still viewing frame number 383,but we want to go deeper to view all the headers contained within as well as thepayload. In Figure 4.54, we start from the top of the Details pane and will downthrough the entire packet.
www.syngress.com
Figure 4.53 Viewing a Browser Problem Within the Summary Pane
219_sniffer_04.qxd 6/28/02 11:51 AM Page 216
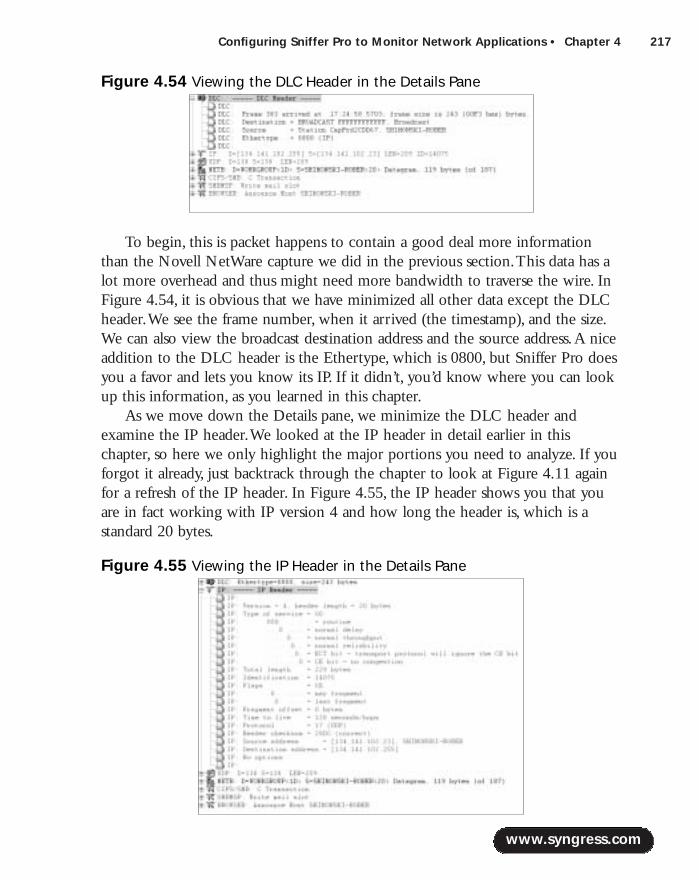
Configuring Sniffer Pro to Monitor Network Applications • Chapter 4 217
To begin, this is packet happens to contain a good deal more informationthan the Novell NetWare capture we did in the previous section.This data has alot more overhead and thus might need more bandwidth to traverse the wire. InFigure 4.54, it is obvious that we have minimized all other data except the DLCheader.We see the frame number, when it arrived (the timestamp), and the size.We can also view the broadcast destination address and the source address.A niceaddition to the DLC header is the Ethertype, which is 0800, but Sniffer Pro doesyou a favor and lets you know its IP. If it didn’t, you’d know where you can lookup this information, as you learned in this chapter.
As we move down the Details pane, we minimize the DLC header andexamine the IP header.We looked at the IP header in detail earlier in thischapter, so here we only highlight the major portions you need to analyze. If youforgot it already, just backtrack through the chapter to look at Figure 4.11 againfor a refresh of the IP header. In Figure 4.55, the IP header shows you that youare in fact working with IP version 4 and how long the header is, which is astandard 20 bytes.
www.syngress.com
Figure 4.54 Viewing the DLC Header in the Details Pane
Figure 4.55 Viewing the IP Header in the Details Pane
219_sniffer_04.qxd 6/28/02 11:51 AM Page 217
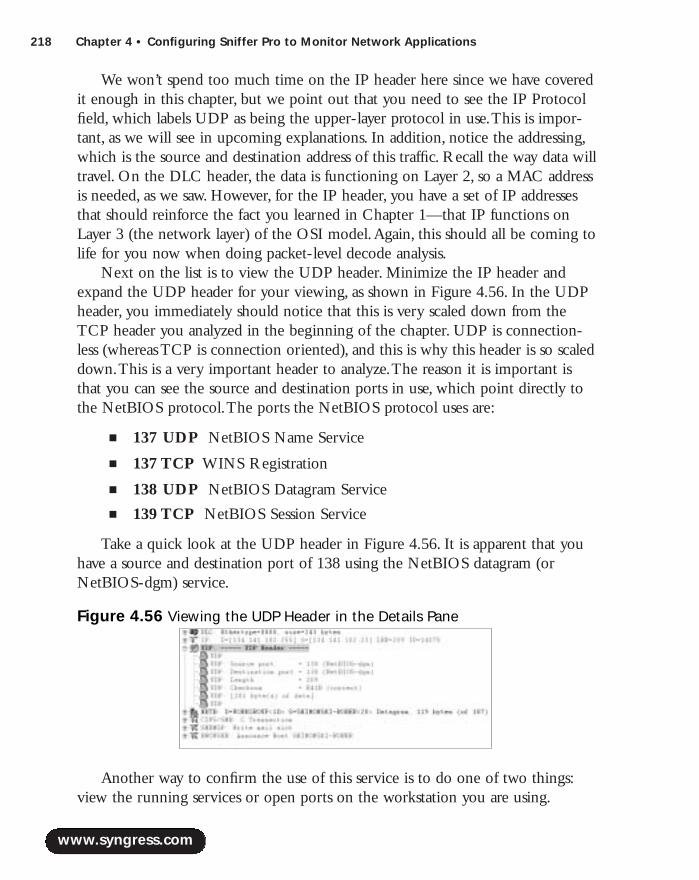
218 Chapter 4 • Configuring Sniffer Pro to Monitor Network Applications
We won’t spend too much time on the IP header here since we have coveredit enough in this chapter, but we point out that you need to see the IP Protocolfield, which labels UDP as being the upper-layer protocol in use.This is impor-tant, as we will see in upcoming explanations. In addition, notice the addressing,which is the source and destination address of this traffic. Recall the way data willtravel. On the DLC header, the data is functioning on Layer 2, so a MAC addressis needed, as we saw. However, for the IP header, you have a set of IP addressesthat should reinforce the fact you learned in Chapter 1—that IP functions onLayer 3 (the network layer) of the OSI model.Again, this should all be coming tolife for you now when doing packet-level decode analysis.
Next on the list is to view the UDP header. Minimize the IP header andexpand the UDP header for your viewing, as shown in Figure 4.56. In the UDPheader, you immediately should notice that this is very scaled down from theTCP header you analyzed in the beginning of the chapter. UDP is connection-less (whereas TCP is connection oriented), and this is why this header is so scaleddown.This is a very important header to analyze.The reason it is important isthat you can see the source and destination ports in use, which point directly tothe NetBIOS protocol.The ports the NetBIOS protocol uses are:
■ 137 UDP NetBIOS Name Service
■ 137 TCP WINS Registration
■ 138 UDP NetBIOS Datagram Service
■ 139 TCP NetBIOS Session Service
Take a quick look at the UDP header in Figure 4.56. It is apparent that youhave a source and destination port of 138 using the NetBIOS datagram (orNetBIOS-dgm) service.
Another way to confirm the use of this service is to do one of two things:view the running services or open ports on the workstation you are using.
www.syngress.com
Figure 4.56 Viewing the UDP Header in the Details Pane
219_sniffer_04.qxd 6/28/02 11:51 AM Page 218
Configuring Sniffer Pro to Monitor Network Applications • Chapter 4 219
As we continue our analysis, we want to minimize the UDP header and expandthe NetBIOS datagram protocol in the Details pane, as shown in Figure 4.57. Inthis figure, you start to dig even deeper into this single packet for more clues anddetails for your analysis.
In Figure 4.57, we see the breakdown of the NETB protocol.You knew itwas the Datagram protocol from the header before it, which called on port 138,and NetBIOS-dgm. On further investigation, it should be clear that this is apacket sent by the problem workstation using the server service.You can also seethat the SHIMONSKI-ROBER workstation is also using that 16th character setwe mentioned earlier.You see it here as a <20>, which stands for 20h. It is ahexadecimal character that shows a unique name or group for the workstationname, as shown here.Again, Sniffer Pro diligently provides you with the transla-tion of <20>, which is, of course, the server service.You already knew you were
www.syngress.com
Using Server and Workstation Tools to Confirm ServicesWhen checking you workstation or server for running services and openports, you can verify needed information in two quick ways:
■ Open a command (or DOS) prompt on your workstation andrun the Netstat –na command. You will see “Open connec-tions via ports” in use: UDP 134.141.102.104:138 *:*
■ Open a command (or DOS) prompt on your workstation andrun the Net Start command. Finding the server service in thelist verifies that you are in fact running the server service.
In both these instances, you are confirming that your workstationis acting as a server with the server service running or File and PrintSharing enabled, depending on the version of Windows you are run-ning. With the Netstat command, you can see that you are running UDP(also confirmed in the capture) and that there is a socket connection (IPaddress plus port number 138) to the server from your workstation. Youcan also see that the *:* symbol proves UDP is connectionless because itdoesn’t connect via a foreign address and it doesn’t have any state suchas Listening or Established.
Configuring & Implementing…
219_sniffer_04.qxd 6/28/02 11:51 AM Page 219

220 Chapter 4 • Configuring Sniffer Pro to Monitor Network Applications
running the server service just by checking your own workstation, so thisshouldn’t come as a shock to you.You know why the workstation you are ana-lyzing is participating in the browser elections. Now we just need to understandhow to analyze it and then fix it.
The Destination NetBIOS name is a clear broadcast sent to any node on thenetwork that can receive it.This is where this service also becomes a nuisance.For one, it is broadcast based, which causes traffic on your network; second, youknow the issues with broadcasts not passing routers could cause problems withyour systems correctly identifying other systems on the network.The destinationname is WORKGROUP<1D>, and this is the workgroup name with the identi-fier (the 16th bit), which Sniffer Pro tells you is the master browser service.Weare gifted with Sniffer Pro telling us what it is we need to know in terms of the16th character set, but you can run a search on Microsoft’s TechNet Web site fora full list of numbers.
NOTE
Every workstation with the server service or File and Print Sharing enabledis a potential browser by default and responds to the hex <1E> electmaster browser request, which can generate literally thousands of returnpackets due to NetBIOS broadcasting. With Microsoft’s implementation ofNetBIOS, even if replies are received, each and every workstation sendsout three “Find Name” requests, no matter what. What a mess.
www.syngress.com
Figure 4.57 Viewing the NetBIOS Datagram Protocol in the Details Pane
219_sniffer_04.qxd 6/28/02 11:51 AM Page 220
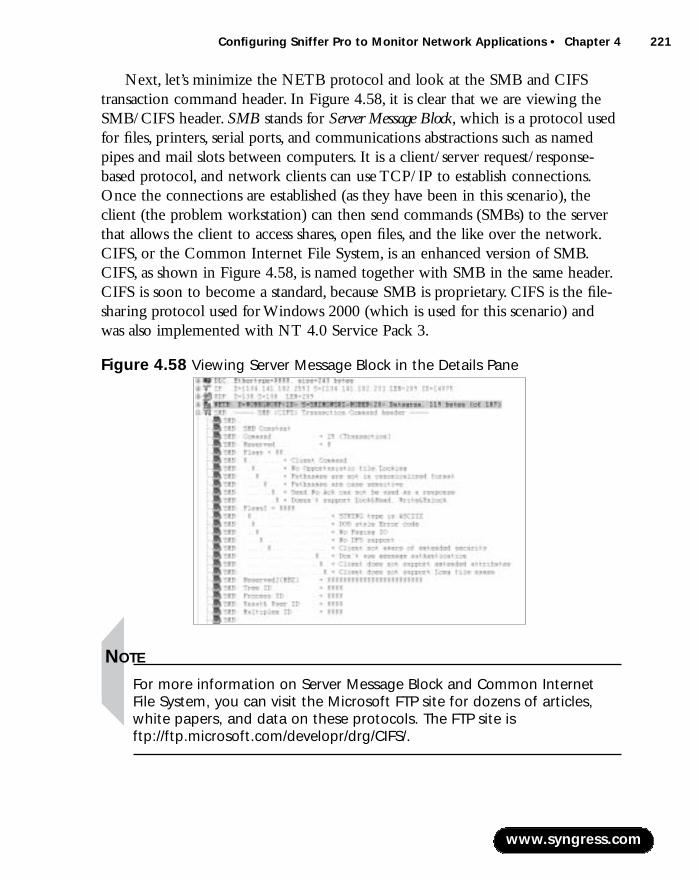
Configuring Sniffer Pro to Monitor Network Applications • Chapter 4 221
Next, let’s minimize the NETB protocol and look at the SMB and CIFStransaction command header. In Figure 4.58, it is clear that we are viewing theSMB/CIFS header. SMB stands for Server Message Block, which is a protocol usedfor files, printers, serial ports, and communications abstractions such as namedpipes and mail slots between computers. It is a client/server request/response-based protocol, and network clients can use TCP/IP to establish connections.Once the connections are established (as they have been in this scenario), theclient (the problem workstation) can then send commands (SMBs) to the serverthat allows the client to access shares, open files, and the like over the network.CIFS, or the Common Internet File System, is an enhanced version of SMB.CIFS, as shown in Figure 4.58, is named together with SMB in the same header.CIFS is soon to become a standard, because SMB is proprietary. CIFS is the file-sharing protocol used for Windows 2000 (which is used for this scenario) andwas also implemented with NT 4.0 Service Pack 3.
NOTE
For more information on Server Message Block and Common Internet File System, you can visit the Microsoft FTP site for dozens of articles,white papers, and data on these protocols. The FTP site isftp://ftp.microsoft.com/developr/drg/CIFS/.
www.syngress.com
Figure 4.58 Viewing Server Message Block in the Details Pane
219_sniffer_04.qxd 6/28/02 11:51 AM Page 221
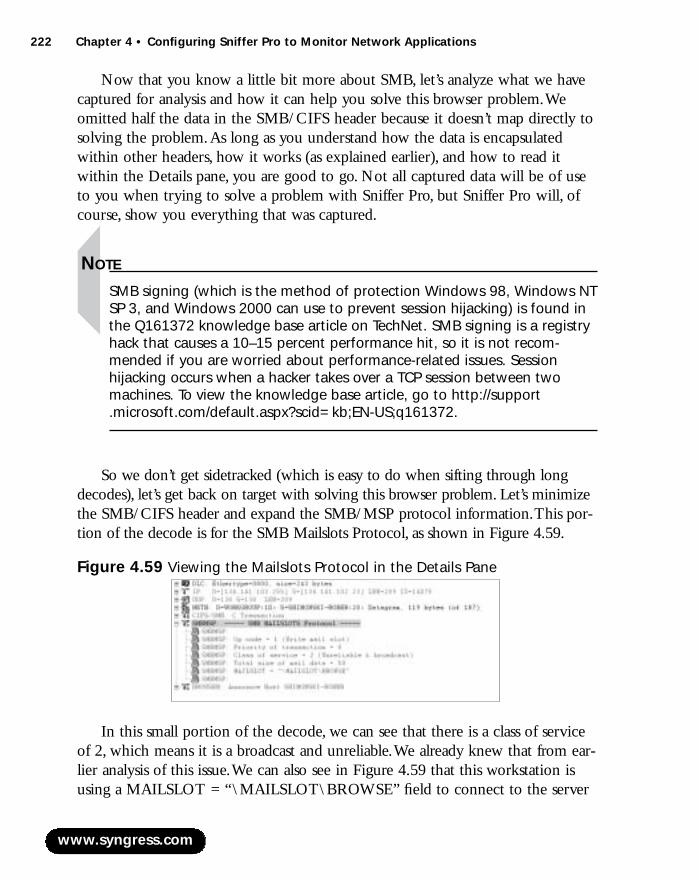
222 Chapter 4 • Configuring Sniffer Pro to Monitor Network Applications
Now that you know a little bit more about SMB, let’s analyze what we havecaptured for analysis and how it can help you solve this browser problem.Weomitted half the data in the SMB/CIFS header because it doesn’t map directly tosolving the problem.As long as you understand how the data is encapsulatedwithin other headers, how it works (as explained earlier), and how to read itwithin the Details pane, you are good to go. Not all captured data will be of useto you when trying to solve a problem with Sniffer Pro, but Sniffer Pro will, ofcourse, show you everything that was captured.
NOTE
SMB signing (which is the method of protection Windows 98, Windows NTSP 3, and Windows 2000 can use to prevent session hijacking) is found inthe Q161372 knowledge base article on TechNet. SMB signing is a registryhack that causes a 10–15 percent performance hit, so it is not recom-mended if you are worried about performance-related issues. Sessionhijacking occurs when a hacker takes over a TCP session between twomachines. To view the knowledge base article, go to http://support.microsoft.com/default.aspx?scid=kb;EN-US;q161372.
So we don’t get sidetracked (which is easy to do when sifting through longdecodes), let’s get back on target with solving this browser problem. Let’s minimizethe SMB/CIFS header and expand the SMB/MSP protocol information.This por-tion of the decode is for the SMB Mailslots Protocol, as shown in Figure 4.59.
In this small portion of the decode, we can see that there is a class of serviceof 2, which means it is a broadcast and unreliable.We already knew that from ear-lier analysis of this issue.We can also see in Figure 4.59 that this workstation isusing a MAILSLOT = “\MAILSLOT\BROWSE” field to connect to the server
www.syngress.com
Figure 4.59 Viewing the Mailslots Protocol in the Details Pane
219_sniffer_04.qxd 6/28/02 11:51 AM Page 222
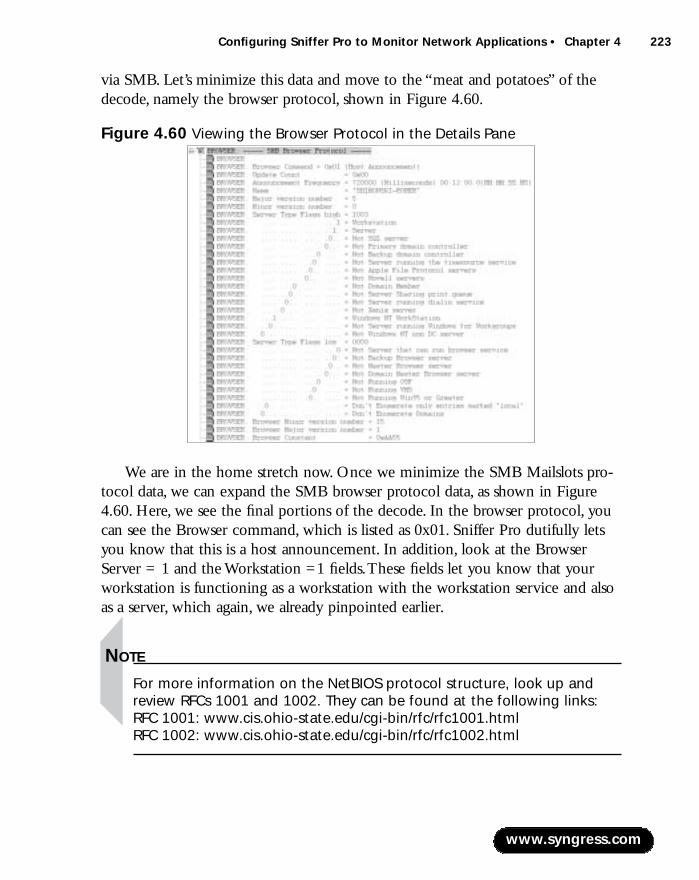
Configuring Sniffer Pro to Monitor Network Applications • Chapter 4 223
via SMB. Let’s minimize this data and move to the “meat and potatoes” of thedecode, namely the browser protocol, shown in Figure 4.60.
We are in the home stretch now. Once we minimize the SMB Mailslots pro-tocol data, we can expand the SMB browser protocol data, as shown in Figure4.60. Here, we see the final portions of the decode. In the browser protocol, youcan see the Browser command, which is listed as 0x01. Sniffer Pro dutifully letsyou know that this is a host announcement. In addition, look at the BrowserServer = 1 and the Workstation =1 fields.These fields let you know that yourworkstation is functioning as a workstation with the workstation service and alsoas a server, which again, we already pinpointed earlier.
NOTE
For more information on the NetBIOS protocol structure, look up andreview RFCs 1001 and 1002. They can be found at the following links:RFC 1001: www.cis.ohio-state.edu/cgi-bin/rfc/rfc1001.htmlRFC 1002: www.cis.ohio-state.edu/cgi-bin/rfc/rfc1002.html
www.syngress.com
Figure 4.60 Viewing the Browser Protocol in the Details Pane
219_sniffer_04.qxd 6/28/02 11:51 AM Page 223
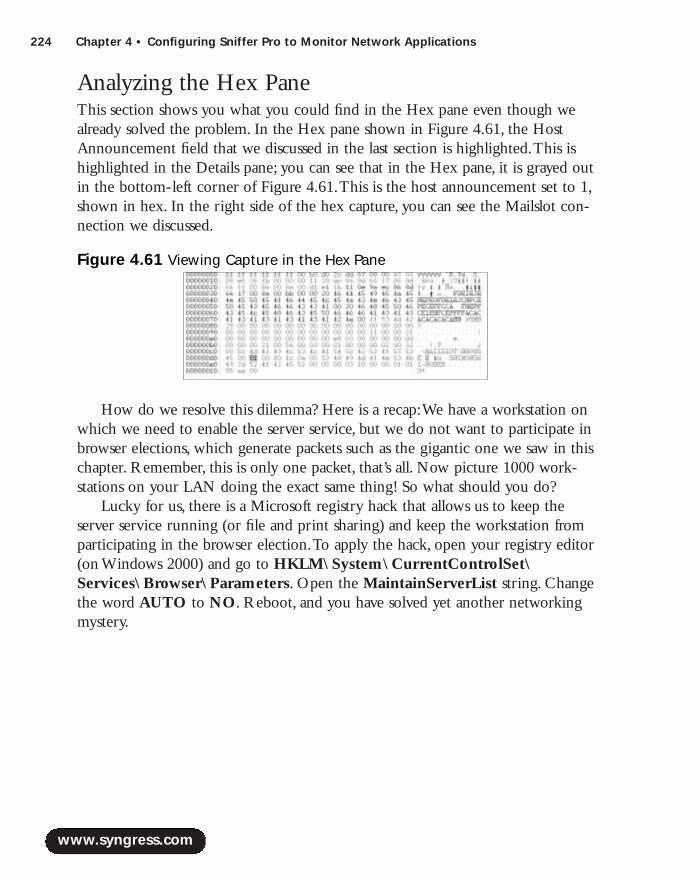
224 Chapter 4 • Configuring Sniffer Pro to Monitor Network Applications
Analyzing the Hex PaneThis section shows you what you could find in the Hex pane even though wealready solved the problem. In the Hex pane shown in Figure 4.61, the HostAnnouncement field that we discussed in the last section is highlighted.This ishighlighted in the Details pane; you can see that in the Hex pane, it is grayed outin the bottom-left corner of Figure 4.61.This is the host announcement set to 1,shown in hex. In the right side of the hex capture, you can see the Mailslot con-nection we discussed.
How do we resolve this dilemma? Here is a recap:We have a workstation onwhich we need to enable the server service, but we do not want to participate inbrowser elections, which generate packets such as the gigantic one we saw in thischapter. Remember, this is only one packet, that’s all. Now picture 1000 work-stations on your LAN doing the exact same thing! So what should you do?
Lucky for us, there is a Microsoft registry hack that allows us to keep theserver service running (or file and print sharing) and keep the workstation fromparticipating in the browser election.To apply the hack, open your registry editor(on Windows 2000) and go to HKLM\System\CurrentControlSet\Services\Browser\Parameters. Open the MaintainServerList string. Changethe word AUTO to NO. Reboot, and you have solved yet another networkingmystery.
www.syngress.com
Figure 4.61 Viewing Capture in the Hex Pane
219_sniffer_04.qxd 6/28/02 11:51 AM Page 224

Configuring Sniffer Pro to Monitor Network Applications • Chapter 4 225
SummaryIn this chapter we learned the fundamental basics that will get you movingtoward higher-level analysis work with the Sniffer Pro Analyzer.The chapter cov-ered the steps to take to start and stop a capture with Sniffer Pro.We also dis-cussed proper positioning of the workstation with Sniffer Pro installed so thatyou know that what you want to capture will be captured. Furthermore, we dis-cussed how to hub out and span ports to get your initial captures.You learnedhow to view timestamps on packets and why they can help you troubleshootproblems.
You learned the concepts of monitoring applications and application responsetime (ART), how Sniffer Pro monitors ART, and how you can further customizeART to your individual environmental needs.
We covered the Sniffer Pro Expert in great detail.We broke down the Expertto see how to customize it, what each layer represents, and how to use it fortroubleshooting and analysis.We took a good look at using the Expert to help usfind problems on a network and the possible reasons for those problems, payingclose attention to false positives and more detailed analysis work performed byyou, the SCP.
We covered the Sniffer Pro Decode tab in great detail to show you what eachpane does, how to read it, how to customize it, and what to look for while doinganalysis work.We also broke down the Summary, Details, and Hex panes so youknow what you will find in each pane and how they work together to provideyou the most granular information possible.We also looked at a simple decode toget you started down the path of doing packet-level decoding.
Lastly, you learned how to apply all this knowledge to two fairly complexproblems that made you capture, decode, and analyze possible problems withSniffer Pro. Both problems resulted in a solution that you applied after doing theinitial analysis work. Each scenario showed you that using the Sniffer Pro analysistool, which allowed you to view the transmitted data that you could never haveseen and dissected without the use of a tool such as Sniffer Pro.
By working through this chapter, you have mastered the fundamentals ofbasic protocol capture and decode.You will continue building on this knowledgeas you progress through each chapter that follows.
www.syngress.com
219_sniffer_04.qxd 6/28/02 11:51 AM Page 225

226 Chapter 4 • Configuring Sniffer Pro to Monitor Network Applications
Solutions Fast Track
Basic Sniffer Pro Data Capture Operations
! Starting and stopping captures is the lifeblood of using Sniffer Pro.Youmust know how to start the capture (using either the File menu or thetoolbar) and how to stop them. More important, you need to knowwhere to put your Sniffer Pro so you know that what you are capturingis what you intended to get.
! Spanning or mirroring ports is an essential skill for any SCP to master.Make sure that you have a hub ready to “hub out” so you can do youranalysis work.Also make sure you remember that you can causeproblems by putting a hardcoded host (100Mbps or higher) into a hub,which can run only at 10Mbps.
! Timestamps are essential to read on the Sniffer Pro Summary pane.Youcan find the relative, absolute, or delta (interpacket) times to helptroubleshoot your problems.
Viewing and Using the Expert
! The Expert is a system that aids you (not tells you) in finding the sourceof problems on your network segment. Remember that the Expert is atool that doesn’t replace your brain—it helps augment it. Make sure thatyou know how to read each layer and column in the Expert system tohelp you troubleshoot possible problems on your network.
! The Expert records many problems (symptoms and diagnoses).You needto know how to read each one in detail.You can set all these thresholdseverity levels in the Expert options.
! False positives are common when troubleshooting a network, especiallyusing the Expert.The Expert flags problems that might not be problemsat all and overlooks issues that really are problems. Use the Expert as atool to help initially trace a problem, and then use your skills to detectand fix any issues that arise.
www.syngress.com
219_sniffer_04.qxd 6/28/02 11:51 AM Page 226

Configuring Sniffer Pro to Monitor Network Applications • Chapter 4 227
Application Response Time
! ART stands for application response time, a tool that comes with SnifferPro. Once launched,ART allows you to find the actual response timebetween a client and a server, based on either a TCP- or UDP-basedprotocol application.
! By default,ART monitors only HTTP. However, you can addpredefined protocols from the TCP and UDP range within the ARToptions.
! You can customize ART by adding customized protocols.The must beTCP/IP based, because Sniffer Pro does not currently supportIPX/SPX-based ART options.
Configuring Sniffer Pro to Capture and Analyze NetWare Traffic
! In the Summary, Details, and Hex panes, you can find many headers anddata that can help you resolve complex problems on a network. In thescenario covered in this chapter, we were able to use the Summary,Details, and Hex windows to find and resolve a SAP-based printingproblem on a Novell NetWare network segment.
! Common problems with SAP traffic are high utilization of client andserver resources, excessive broadcasts, and unwanted WAN-based traffic.
! A way you can resolve this problem is by using SAP access control listsor eliminating IPX/SPX and using pure IP-based printing.
Configuring Sniffer Pro to Capture and Analyze Microsoft Traffic
! In the Summary, Details, and Hex panes, you can find headers and datathat can help you resolve complex problems on a network. In thescenario covered in this chapter, we were able to use the Summary,Details, and Hex windows to find and resolve a browser-basedworkstation problem on a Microsoft Windows network segment.
www.syngress.com
219_sniffer_04.qxd 6/28/02 11:51 AM Page 227
228 Chapter 4 • Configuring Sniffer Pro to Monitor Network Applications
! Common problems with browser traffic include high utilization of clientand server resources, excessive broadcasts, and unwanted WAN-basedtraffic.
! One way you can resolve this problem is by eliminating the need foryour workstation to participate in browser elections by using a registryhack to remove the workstation from browse elections but still be ableto share resources on the network with the server service of File andPrint Sharing enabled.
Q: I want to start a capture but would like to see only IPX traffic.After readingthis chapter, it seems that I would have to run a general capture and thenhand-pick through each packet to find IPX traffic. Is this right?
A: Of course not, but we haven’t learned how to build custom filters yet.Thisbook contains an entire chapter dedicated to building filters because there is somuch to know. In this chapter, you learned how to run general captures andperform basic analysis.You will build on this information in later chapters.
Q: While performing network analysis with Sniffer Pro, I want to plug mylaptop into a switch.Will I pick up traffic on all ports, like a hub?
A: No.You need to configure the switch to either mirror or span ports you wantto monitor to a port you will analyze from. Be careful when setting up span-ning and mirroring. Read each hardware vendor’s documentation on how toconfigure and monitor them properly, because each vendor has a differentway of setting them up.
Q: I occasionally come across an issue while using the Sniffer Pro Expert systemwhere I need to find, isolate, and troubleshoot TCP- and UDP-based prob-lems.Where in the Expert system can I look to find such issues?
www.syngress.com
Frequently Asked Questions
The following Frequently Asked Questions, answered by the authors of this book,are designed to both measure your understanding of the concepts presented in this chapter and to assist you with real-life implementation of these concepts. Tohave your questions about this chapter answered by the author, browse towww.syngress.com/solutions and click on the “Ask the Author” form.
219_sniffer_04.qxd 6/28/02 11:51 AM Page 228
Configuring Sniffer Pro to Monitor Network Applications • Chapter 4 229
A: Each layer of the Expert is used to identify and troubleshoot specific layer-based protocols and their problems. In the Expert system, you can use theconnection layer to analyze TCP- and UDP-based problems on your networksegment.
Q: I would like to change the fonts in my Protocol Decode window. I havesearched for this option and cannot find the options to change the font. Isthis in general a Windows property, or are the font settings specific to theSniffer Pro application?
A: Although it would seem that a Windows setting could change the font, it is infact changed within the Sniffer Pro application. Open the Display menu andselect the Display Setup menu option. Choose the Decode Font tab andset your fonts accordingly.
www.syngress.com
219_sniffer_04.qxd 6/28/02 11:51 AM Page 229

219_sniffer_04.qxd 6/28/02 11:51 AM Page 230

Using Sniffer Pro to Monitor thePerformance of a Network
Solutions in this chapter:
■ Network Performance Issues
■ Real-Time Performance Monitoring withSniffer Pro
■ Baselining, Trending, and ChangeManagement
■ Analyzing Ethernet Performance withSniffer Pro
■ Analyzing Token Ring Performance withSniffer Pro
■ Analyzing LAN Routing PerformanceIssues
■ Realigning Your Network for BetterPerformance
Chapter 5
231
! Summary
! Solutions Fast Track
! Frequently Asked Questions
219_sniffer_05.qxd 6/28/02 11:53 AM Page 231

232 Chapter 5 • Using Sniffer Pro to Monitor the Performance of a Network
IntroductionWhen you work with a network or are directly responsible for it, you will oftenhear that there are problems with it. Some are common help desk requests fromusers who have problems remembering their system passwords, and others arecalls from users who cannot login because their network cable got unpluggedagain.Although these are common problems, and annoying at times, they areeasily fixed through a quick series of troubleshooting steps and usually require asimple solution.
Next on the complaint list are the calls from users who say that the networkis too slow.That’s a common complaint, but what happens when almost all theusers on your network call en masse to complain about the speed of their logins,hanging applications, or timed-out sessions? Obviously, there could be a problemwith network performance if the majority of your users call to complain.Wheredo you begin to look for the source of this problem? With enterprise networksgrowing and connecting to other companies’ networks increasingly rapidly, moni-toring network performance can become a cumbersome task.
In this chapter, we look at how to initially isolate a problem, monitor the net-work’s performance using Sniffer Pro, and then offer tips on how to correct theissues.This chapter covers monitoring your network in real time with theDashboard; you’ll learn how to monitor the performance of Ethernet,TokenRing, and LAN routing technologies as well as how to baseline these technolo-gies and perform trending.At the beginning of this chapter, we look at a samplenetwork that is not performing well.At the end of the chapter, you will see thatall the skills learned within the chapter and the book can be used to help fix thenetwork and realign it to perform better.A network that is performing wellmakes for a happier management team, a more productive user community, andhopefully, a highly regarded and requested Sniffer Certified Professional—you.
Network Performance IssuesIn Chapter 1,“Introduction to Sniffer Pro,” we looked at basic network-trouble-shooting methodology.What you learned from that chapter’s discussion also holdstrue for this chapter and every network problem you diagnose.With time andexperience, you will develop good troubleshooting methodologies. It is notsomething a person naturally knows how to do unless he or she truly gifted.Some of the best network experts in the world still overlook simple things that can solve problems simply because of the sheer volume of ever-changing
www.syngress.com
219_sniffer_05.qxd 6/28/02 11:53 AM Page 232
www.syngress.com
information they need to digest. Learning how to monitor network performanceis even trickier.
Let’s look at Figure 5.1 for a moment. If someone on your network com-plained of slow database retrievals from a host with the IP address of 172.16.3.7,how in the world would you be able to diagnose the cause of the problem?Figure 5.1 shows a high-level topology map that clearly depicts the path that theclient would travel to get to this database application.As a network analyst, whatwould you do? Where would you start to look for problems? If performance isthe issue, what are the many things we can look at in the map to troubleshootwhere the problems are occurring and how to diagnose them correctly? Questionsyou need to ask immediately upon starting performance analysis are:
■ Is poor network performance affecting one user, several users, or theentire network?
■ Is the poor performance centered at a particular location or the entirenetwork?
■ When exactly did you start noticing poor performance or has it alwaysbeen bad?
■ Have any recent changes taken place—no matter how large or small?
■ Do you have any network documentation or topology maps?
After asking these questions, you can start to formulate an idea of what prob-lems might be occurring on the network.As common sense and logic would dic-tate, you can logically piece together the origins of a problem from some of theseanswers alone.After you have gathered the most basic information from whoeveris in the know, you need to start network performance troubleshooting.The mostimportant tools you can have for this task are your troubleshooting skills and agood topology map. Nothing can replace these.Add to these tools the knowledgeof proper network design and a tool like Sniffer Pro, and you will be unstoppable.
When you look at Figure 5.1, what do you think could cause poor perfor-mance? We see many things that could be causing problems on this network.When you initially look at this topology map, it should be obvious to you thatthere are some issues here. If it’s not obvious now, by the time you reach the endof the chapter it will become more apparent where these performance problemsmanifest themselves and how you could go about correcting them.
Let’s look at the steps in analyzing the performance of this problem. By theend of the chapter, you will have learned enough to monitor the performance ofa network with Sniffer Pro, and you’ll know how you can successfully apply this
Using Sniffer Pro to Monitor the Performance of a Network • Chapter 5 233
219_sniffer_05.qxd 6/28/02 11:53 AM Page 233

234 Chapter 5 • Using Sniffer Pro to Monitor the Performance of a Network
knowledge to the scenario.You will also redesign this less-than-optimal configu-ration into an efficient and well-performing network.
NOTE
As you will find in your work as a network analyst and troubleshooter,you will come across networks that lack proper documentation. InChapter 10, “Reporting,” we discuss how to better document a networkfor the purpose of analysis. Without proper documentation, it is nearlyimpossible to analyze a network efficiently.
www.syngress.com
Figure 5.1 Topology Map of a Basic Network Layout
150 Users
WAN
Frame Relay64K
32K CIR
UserWorkstations
LightPave Domain
172.16.3.2 172.16.3.3172.16.3.5 172.16.3.6
172.16.3.7172.16.3.1
172.16.1.2
172.16.2.3
172.16.1.1
172.16.2.1
172.16.2.5
172.16.2.4
172.16.2.2Frame Relay
64K32K CIR
172.16.2.6
172.16.3.4
SQLDB
AS/400 ERP Software
Sniffer ProApplication
Plugged in via Hub
10BaseT
100BaseTX
Replication
Domain Controller
ApplicationServer
50 Users
Domain Controller
219_sniffer_05.qxd 6/28/02 11:53 AM Page 234
Using Sniffer Pro to Monitor the Performance of a Network • Chapter 5 235
Slow logins, segment saturation, and bottlenecking choke points are commonproblems on today’s networks. Regardless of how fast manufacturers create newmedia, their speed only increases the demand for applications that require evenhigher bandwidth. Look at Figure 5.1 again, and think about where performanceissues would come into play if a node on the 172.16.3.x network were trying toaccess the mainframe on the 172.16.2.x network. Can you see from this mapalone where a bottleneck is going to occur? You should see that traffic from thefirst node is on a Fast Ethernet segment, going across a Frame Relay link (whichis probably running at about 32K) to an Ethernet segment running at 10Mbps.You should see that the bottleneck might occur at the router across the WAN intoa slower segment.The company domain controller might be plugged into aswitch, and the mainframe might be plugged into a shared access hub. If the seg-ment with the hub is saturated (above 40 percent is a general guideline), the net-work might experience problems.
Another item to analyze is that all the hosts on the 172.16.2.x network segment must cross the WAN to log into the network.Would this fact cause aslow login?
As you will see by the end of this chapter, performance issues are somethingyou need to solve using the Sniffer Pro network protocol analyzer and your senseof good network troubleshooting and design.You must analyze all of these factorsand more when you’re looking at a network’s performance.To start the perfor-mance analysis evolution, you first need to know what your network looks likeand how it performs on a normal daily basis.
www.syngress.com
The Importance of Proper Network DesignIt is always important to make sure that you have a sound networkdesign. This is not a book on how to design a network; it is a book onhow to use the Sniffer Pro network and protocol analyzer to find prob-lems on an existing network. Many problems you will run into as youwork with a network will have a common denominator: poor networkdesign. Many networks have been pieced together over time with con-flicting and incorrectly integrated systems. Often, these networks arerunning outdated applications, multiple protocol types, legacy printing,and so on. Keep this knowledge in mind when you analyze any net-work’s performance and are asked for an opinion on how to fix it.
Designing & Planning…
219_sniffer_05.qxd 6/28/02 11:53 AM Page 235

236 Chapter 5 • Using Sniffer Pro to Monitor the Performance of a Network
NOTE
Good network documentation is key to solving major performance prob-lems. Without knowing the physical layout and application flows of thenetwork you are assessing, you will not even know where to start youranalysis. You can learn more about using Sniffer Pro (as well as othertools) for mapping, documentation, and using reporting features inChapter 10, “Reporting.”
Real-Time Performance Monitoring with Sniffer ProReal-time performance monitoring is rarely done. More often than not, however,real-time monitoring can help you sort out the problems on your network.Almost every software application is accompanied by monitoring software. Behonest, though—how many times have you fired up System Monitor on aWindows 2000 server?
The Windows 2000 Performance tool, shown in Figure 5.2, is great forfinding performance issues on your server. For instance, what if you had aproblem after installing a database application such as SQL Server 2000 on theserver, and the CPU was being tasked beyond belief. In order to verify that anupgrade to a dual processor is necessary, wouldn’t you use a tool that comes withthe system? The sad truth is that although some network analysts use these tools,most do not.This is apparent from information we’ve gathered while consultingfor companies that hire a protocol and network analyst to troubleshoot the com-pany’s very slow network, only to find that the network is fine and the server isactually the bottleneck.This situation is all too common.
Monitor.nlm is another great tool to use if you are working on a NovellNetWare network.To load it, simply type load monitor on a Novell NetWareserver console.You can use this tool to monitor the performance of the NetWareserver.We once had a situation in which the users of a medium-sized networkconstantly complained of slow response time.After loading monitor on theNetWare server console, we noticed that it flagged a problem right away.Afterfurther analysis, it was clear that the CPU was peaking at 100 percent for morethan five minutes at a time, and the memory in the server was extremely low.
www.syngress.com
219_sniffer_05.qxd 6/28/02 11:53 AM Page 236
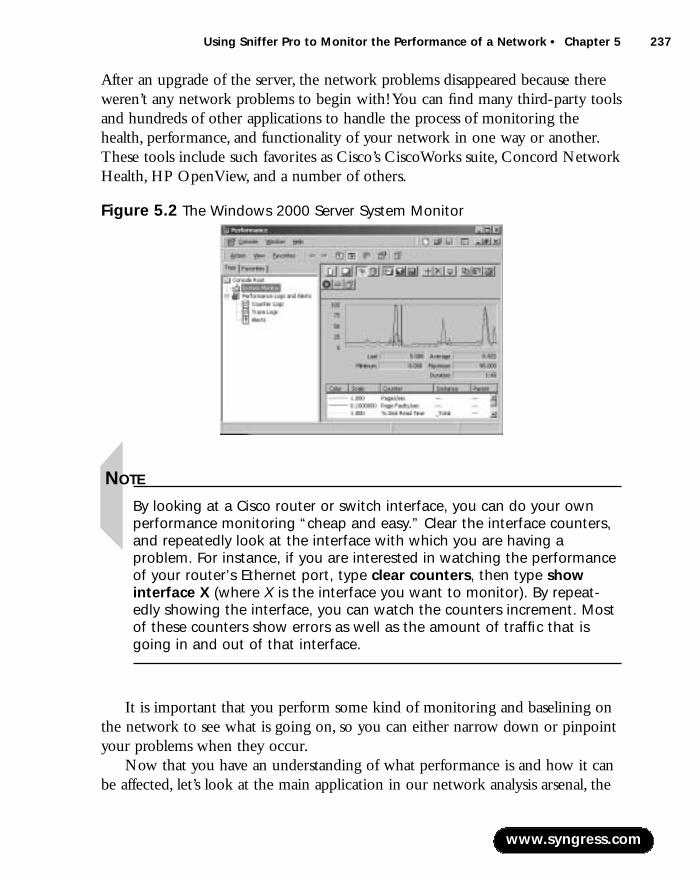
Using Sniffer Pro to Monitor the Performance of a Network • Chapter 5 237
After an upgrade of the server, the network problems disappeared because thereweren’t any network problems to begin with! You can find many third-party toolsand hundreds of other applications to handle the process of monitoring thehealth, performance, and functionality of your network in one way or another.These tools include such favorites as Cisco’s CiscoWorks suite, Concord NetworkHealth, HP OpenView, and a number of others.
NOTE
By looking at a Cisco router or switch interface, you can do your ownperformance monitoring “cheap and easy.” Clear the interface counters,and repeatedly look at the interface with which you are having aproblem. For instance, if you are interested in watching the performanceof your router’s Ethernet port, type clear counters, then type showinterface X (where X is the interface you want to monitor). By repeat-edly showing the interface, you can watch the counters increment. Mostof these counters show errors as well as the amount of traffic that isgoing in and out of that interface.
It is important that you perform some kind of monitoring and baselining onthe network to see what is going on, so you can either narrow down or pinpointyour problems when they occur.
Now that you have an understanding of what performance is and how it canbe affected, let’s look at the main application in our network analysis arsenal, the
www.syngress.com
Figure 5.2 The Windows 2000 Server System Monitor
219_sniffer_05.qxd 6/28/02 11:53 AM Page 237
238 Chapter 5 • Using Sniffer Pro to Monitor the Performance of a Network
Sniffer Pro network and protocol analysis tool.You can use the Sniffer ProDashboard to help pinpoint and narrow down problems on your network. In thenext section, we look at how to use this Dashboard and discuss baselining andhow to perform it.
Using the Dashboard in Real TimeWhen you first open the Sniffer Pro application, you will most likely be greetedwith the Dashboard, which is the name of Sniffer Pro’s viewable network perfor-mance monitor. If it does not immediately appear, getting to it is rather easy.Tofollow this discussion on the Dashboard, it is easier if you are looking at it. If youdo not see it open, go Monitor | Dashboard.Alternatively, you can select theDashboard toolbar icon. Chapter 3,“Exploring the Sniffer Pro Interface,” coveredthe Sniffer Pro interface, so you should be very familiar with the placement andretrieval of this tool.
Now that you have the Dashboard open, you should see a large dialog boxopen to reveal some dials, and if the box is already extended, perhaps a fewgraphs.You will learn how to customize these settings in the next few sections, soif you do not see exactly what is mentioned here, keep reading—soon enoughyou will be a master at monitoring performance and manipulating the graphswith this tool.
The Sniffer Pro Dashboard is a tool that monitors exactly what we have beendiscussing:The performance of the segment or network to which it is attached.This single portion of the Sniffer Pro network and protocol analyzer tool hasmuch to offer to the Sniffer Certified Professional and/or the network analyst.Aswe discussed earlier, many companies complain about network performance.Thisis just a fact of life of working in the networked world.At times of high networkactivity or when something unforeseen happens on the network, performancecan degrade.The network analyst needs a tool (much like Microsoft’s SystemMonitor for monitoring the performance of a server) to provide insight into thereasons that these problems are occurring. In this section, you learn how to usethe Sniffer Pro application to find such issues and monitor the performance ofany network segment to which it is attached.
Let’s look at using the Dashboard in real time.You are not necessarilyrecording a capture (although you could be performing a capture simultane-ously).You are watching the actual data flow on the network and how Sniffer Proanalyzes it. Let’s now look at the specifics of each component of the Sniffer ProDashboard.
www.syngress.com
219_sniffer_05.qxd 6/28/02 11:53 AM Page 238
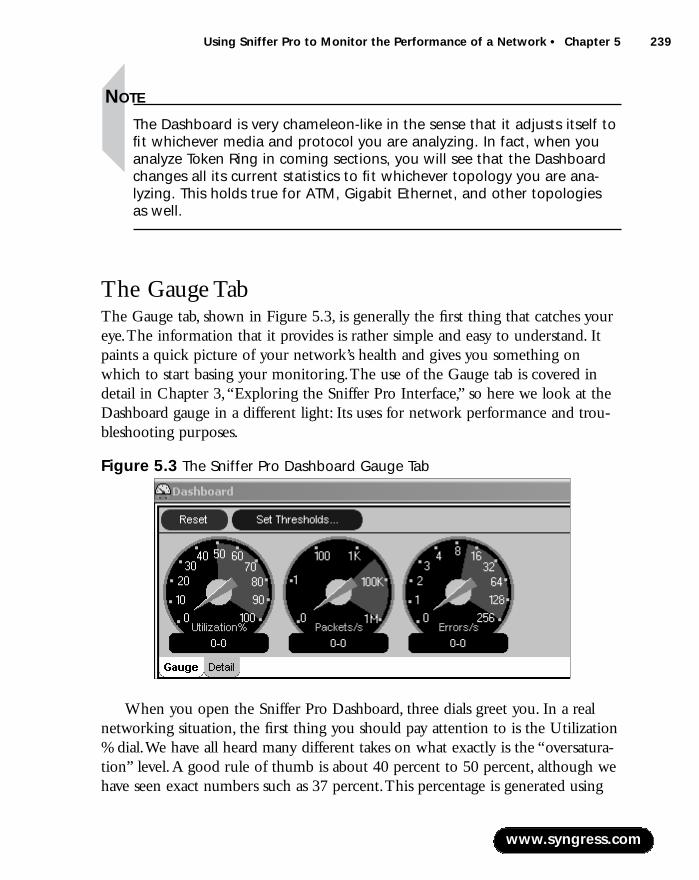
Using Sniffer Pro to Monitor the Performance of a Network • Chapter 5 239
NOTE
The Dashboard is very chameleon-like in the sense that it adjusts itself tofit whichever media and protocol you are analyzing. In fact, when youanalyze Token Ring in coming sections, you will see that the Dashboardchanges all its current statistics to fit whichever topology you are ana-lyzing. This holds true for ATM, Gigabit Ethernet, and other topologies as well.
The Gauge TabThe Gauge tab, shown in Figure 5.3, is generally the first thing that catches youreye.The information that it provides is rather simple and easy to understand. Itpaints a quick picture of your network’s health and gives you something onwhich to start basing your monitoring.The use of the Gauge tab is covered indetail in Chapter 3,“Exploring the Sniffer Pro Interface,” so here we look at theDashboard gauge in a different light: Its uses for network performance and trou-bleshooting purposes.
When you open the Sniffer Pro Dashboard, three dials greet you. In a realnetworking situation, the first thing you should pay attention to is the Utilization% dial.We have all heard many different takes on what exactly is the “oversatura-tion” level.A good rule of thumb is about 40 percent to 50 percent, although wehave seen exact numbers such as 37 percent.This percentage is generated using
www.syngress.com
Figure 5.3 The Sniffer Pro Dashboard Gauge Tab
219_sniffer_05.qxd 6/28/02 11:53 AM Page 239
240 Chapter 5 • Using Sniffer Pro to Monitor the Performance of a Network
half-duplex Ethernet. If you were using full-duplex, the utilization percentage canbe as high as 70 percent.You can adjust the threshold setting to meet either onewith Sniffer Pro. In general, you don’t want to open the Dashboard, see theneedle on the gauge flicker up to 40 percent, and immediately conclude that thenetwork is saturated. However, if you see the needle consistently hitting a highpercentage like that, you definitely have a major problem.
NOTE
Network utilization is much like a hardware device’s CPU. When moni-tored, utilization can consistently spike at 100 percent. Just because thereading peaks at 100 percent does not mean that there is necessarily aproblem. Be aware that network traffic is bursty in nature. You need tomonitor the performance over some time to see if these peaks occur as a trend and how long and how often they occur. Of course, anythingpeaking at 100 percent for a long time can point to the obvious conclu-sion that overutilization is occurring.
You might be asking yourself what causes utilization-based performanceissues.While you are monitoring performance with Sniffer Pro, you are lookingat only half the problem.You need to analyze the current topology and see ifdesign factors are causing your problem or if there are other issues such as appli-cation flows that use up extremely high amounts of bandwidth at certain times ofthe day. If the utilization rides consistently high, you should look at the actualtopology and network media you are using. Depending on the type of networktopology, its speed might increase saturation immediately. If you are using a10BaseT network with hubs, you have higher saturation compared with100BaseTX Fast Ethernet in a switched environment. Do the math. If you arerunning 10 times as fast as your older networking speed, you will have betterperformance on the segments.When you move to faster speeds and reduced col-lision domains, the saturation level decreases dramatically, and performanceincreases.
You can also look at the packets-per-second dial within the Gauge tab.Thisdial shows the rate of packets per second picked up by the Sniffer Pro applica-tion. In Chapter 3,“Exploring the Sniffer Pro Interface,” we looked at this dial indetail. For example, in Fast Ethernet, if the packet rate is higher than about50,000, this could be a reason to be concerned. Remember, anything nearing
www.syngress.com
219_sniffer_05.qxd 6/28/02 11:53 AM Page 240
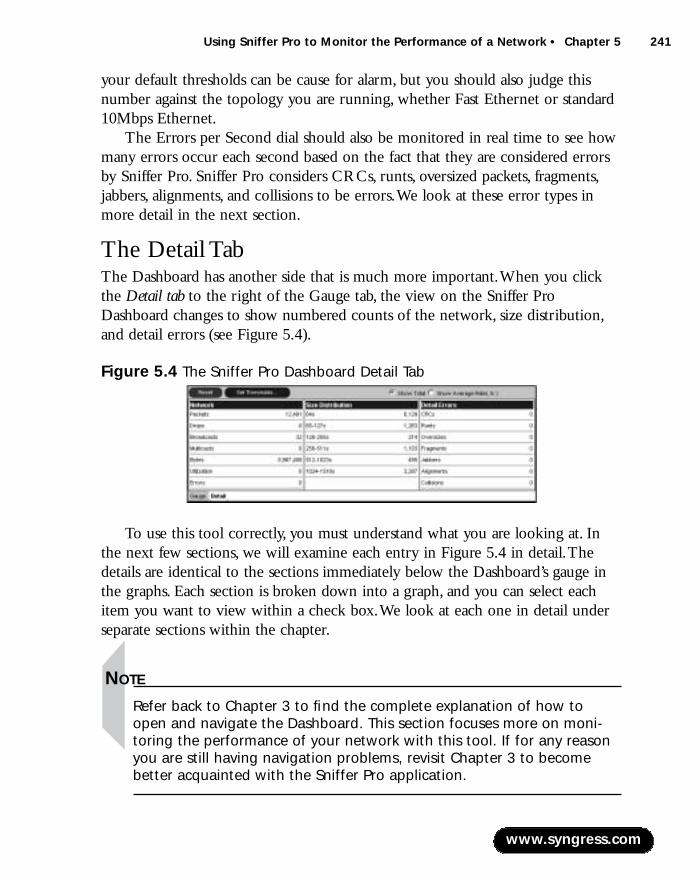
Using Sniffer Pro to Monitor the Performance of a Network • Chapter 5 241
your default thresholds can be cause for alarm, but you should also judge thisnumber against the topology you are running, whether Fast Ethernet or standard10Mbps Ethernet.
The Errors per Second dial should also be monitored in real time to see howmany errors occur each second based on the fact that they are considered errorsby Sniffer Pro. Sniffer Pro considers CRCs, runts, oversized packets, fragments,jabbers, alignments, and collisions to be errors.We look at these error types inmore detail in the next section.
The Detail TabThe Dashboard has another side that is much more important.When you clickthe Detail tab to the right of the Gauge tab, the view on the Sniffer ProDashboard changes to show numbered counts of the network, size distribution,and detail errors (see Figure 5.4).
To use this tool correctly, you must understand what you are looking at. Inthe next few sections, we will examine each entry in Figure 5.4 in detail.Thedetails are identical to the sections immediately below the Dashboard’s gauge inthe graphs. Each section is broken down into a graph, and you can select eachitem you want to view within a check box.We look at each one in detail underseparate sections within the chapter.
NOTE
Refer back to Chapter 3 to find the complete explanation of how toopen and navigate the Dashboard. This section focuses more on moni-toring the performance of your network with this tool. If for any reasonyou are still having navigation problems, revisit Chapter 3 to becomebetter acquainted with the Sniffer Pro application.
www.syngress.com
Figure 5.4 The Sniffer Pro Dashboard Detail Tab
219_sniffer_05.qxd 6/28/02 11:53 AM Page 241
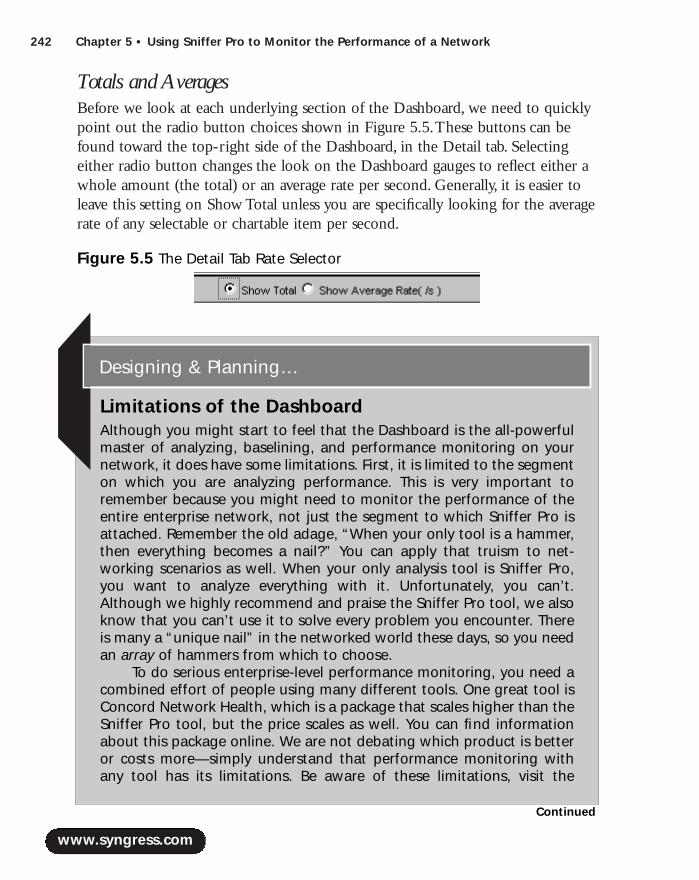
242 Chapter 5 • Using Sniffer Pro to Monitor the Performance of a Network
Totals and AveragesBefore we look at each underlying section of the Dashboard, we need to quicklypoint out the radio button choices shown in Figure 5.5.These buttons can befound toward the top-right side of the Dashboard, in the Detail tab. Selectingeither radio button changes the look on the Dashboard gauges to reflect either awhole amount (the total) or an average rate per second. Generally, it is easier toleave this setting on Show Total unless you are specifically looking for the averagerate of any selectable or chartable item per second.
www.syngress.com
Figure 5.5 The Detail Tab Rate Selector
Limitations of the DashboardAlthough you might start to feel that the Dashboard is the all-powerfulmaster of analyzing, baselining, and performance monitoring on yournetwork, it does have some limitations. First, it is limited to the segmenton which you are analyzing performance. This is very important toremember because you might need to monitor the performance of theentire enterprise network, not just the segment to which Sniffer Pro isattached. Remember the old adage, “When your only tool is a hammer,then everything becomes a nail?” You can apply that truism to net-working scenarios as well. When your only analysis tool is Sniffer Pro,you want to analyze everything with it. Unfortunately, you can’t.Although we highly recommend and praise the Sniffer Pro tool, we alsoknow that you can’t use it to solve every problem you encounter. Thereis many a “unique nail” in the networked world these days, so you needan array of hammers from which to choose.
To do serious enterprise-level performance monitoring, you need acombined effort of people using many different tools. One great tool isConcord Network Health, which is a package that scales higher than theSniffer Pro tool, but the price scales as well. You can find informationabout this package online. We are not debating which product is betteror costs more—simply understand that performance monitoring withany tool has its limitations. Be aware of these limitations, visit the
Designing & Planning…
Continued
219_sniffer_05.qxd 6/28/02 11:53 AM Page 242
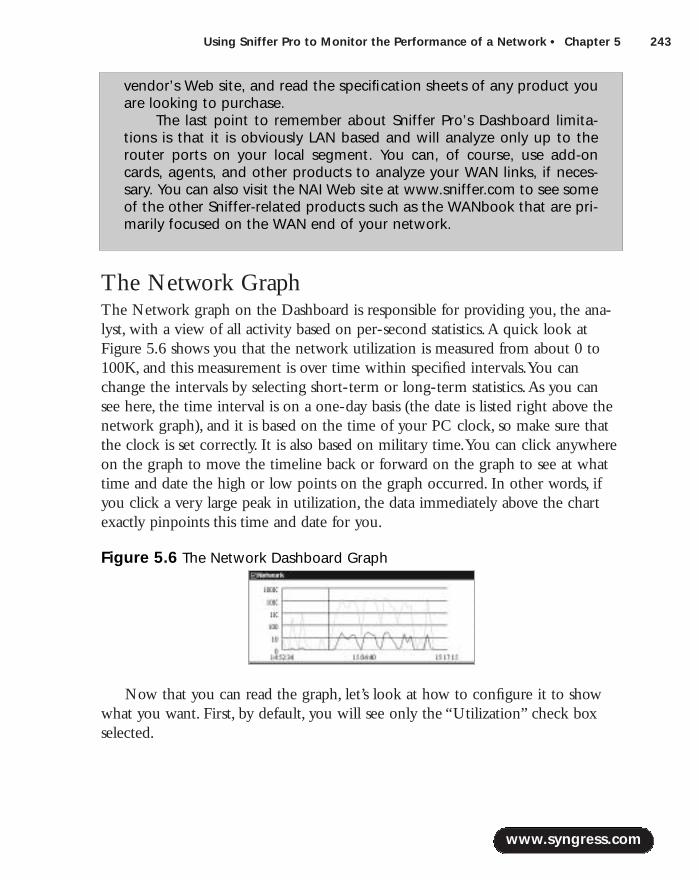
Using Sniffer Pro to Monitor the Performance of a Network • Chapter 5 243
The Network GraphThe Network graph on the Dashboard is responsible for providing you, the ana-lyst, with a view of all activity based on per-second statistics.A quick look atFigure 5.6 shows you that the network utilization is measured from about 0 to100K, and this measurement is over time within specified intervals.You canchange the intervals by selecting short-term or long-term statistics.As you cansee here, the time interval is on a one-day basis (the date is listed right above thenetwork graph), and it is based on the time of your PC clock, so make sure thatthe clock is set correctly. It is also based on military time.You can click anywhereon the graph to move the timeline back or forward on the graph to see at whattime and date the high or low points on the graph occurred. In other words, ifyou click a very large peak in utilization, the data immediately above the chartexactly pinpoints this time and date for you.
Now that you can read the graph, let’s look at how to configure it to showwhat you want. First, by default, you will see only the “Utilization” check boxselected.
www.syngress.com
vendor’s Web site, and read the specification sheets of any product youare looking to purchase.
The last point to remember about Sniffer Pro’s Dashboard limita-tions is that it is obviously LAN based and will analyze only up to therouter ports on your local segment. You can, of course, use add-oncards, agents, and other products to analyze your WAN links, if neces-sary. You can also visit the NAI Web site at www.sniffer.com to see someof the other Sniffer-related products such as the WANbook that are pri-marily focused on the WAN end of your network.
Figure 5.6 The Network Dashboard Graph
219_sniffer_05.qxd 6/28/02 11:53 AM Page 243

244 Chapter 5 • Using Sniffer Pro to Monitor the Performance of a Network
NOTE
Military time works on a 24-hour clock, so after 12:00 in the afternoon,1:00 P.M. becomes 13:00 (read 13 hundred hours), and 2 P.M. becomes14:00, all the way to midnight, which is 00:00, not 24:00. Military time isused because it can be read more accurately and does not need an A.M.or P.M. column attached to it. Each timestamp is unique.
When you’re using the Network graph, it is important to note that you aremonitoring in real time, seeing how many packets, errors, drops, bytes, broadcasts,and multicasts or overall utilization occurring per second throughout the speci-fied time interval, as shown in Figure 5.7. It is that easy.This information can beused for baselining purposes and historical trending, which are topics that warranttheir own section within this chapter.You could see that, for example, every dayat about 15:00, the packets on the segment increase by about 10K.
Now that you have a basic idea of how to view the graph and what youshould expect to see, look at what each selectable counter actually monitors.Using the view shown in Figure 5.7, it is important to note that you are readinga book that is in grayscale and that the graph uses different colors. Be aware thatthe colors are important when you select multiple monitorable selections at thesame time and need to differentiate between them in the graph.The only way todo so is by color-coding them.You can review what each counter does in theNetwork Event Selection box by reviewing Table 5.1.
Table 5.1 Network Event Selection Details
Detail Description
Packets/s The total number of packets per second seen, as recorded bySniffer Pro.
www.syngress.com
Figure 5.7 The Network Event Selection Box
Continued
219_sniffer_05.qxd 6/28/02 11:53 AM Page 244
Using Sniffer Pro to Monitor the Performance of a Network • Chapter 5 245
Utilization The network utilization that is currently recorded by SnifferPro. This setting is on by default and is one of the most com-monly used counters. You can look at the visual graph andmap the time of day during which utilization is the highest. If you do this every day, you can start a baseline for your network.
Errors/s The number of overall errors per second, as recorded bySniffer Pro. In the next graph, you can start fleshing out whicherrors are occurring and at what time and frequency.
Drops/s The number of drops that occur per second, as recorded bySniffer Pro. By baselining, you can see the time of day atwhich drops are most common.
Bytes/s The number of overall bytes of data seen and recorded bySniffer Pro. Bytes are different than packets; bytes have a pre-defined length, whereas packets come in different sizes.
Broadcasts/s The number of broadcast packets per second, as recorded bySniffer Pro. Broadcasts are packets sent from a host to allother hosts on the segment.
Multicasts/s The number of multicast packets per second, as recorded bySniffer Pro. Multicasts are packets sent from a host to a spe-cific and intentional group of hosts.
A nice feature of these graphs is that you can use them in tandem with eachother.You don’t need to look at only how many drops you have at 13:00; youcould see your utilization, packets, and broadcasts all start to climb at that timetogether.Another point to mention is that when monitoring performance, youneed to start looking at acceptable limitations. If you notice that your network isinundated with multicasts at 9:00 every day, you might have an issue you need totend to by analyzing which applications are being used that send out multicastpackets.
Broadcasts are one of the most common problems on networks today.A unicast (which is one machine communicating with another) would interfere with only that one machine.An interrupt would occur on the destination PC andwould process the packet, and that would be the end of it. In a broadcast storm, allhosts on the network must interrupt and process the packet and, in most cases,discard a packet that was not intentionally meant for them.This situation causeslatency issues and can be easily solved by either installing a router to separate the
www.syngress.com
Table 5.1 Continued
Detail Description
219_sniffer_05.qxd 6/28/02 11:53 AM Page 245
246 Chapter 5 • Using Sniffer Pro to Monitor the Performance of a Network
network into broadcast domains or by removing the source of the broadcasts.Again, you would only do this if it were causing a problem on the network,because broadcasting can also be a necessary evil. One example is capturing the0.FFFFFFFFFFFF destination address for Novell’s SAPs or the Microsoft Browserservice.You might find that your Novell clients are set to autodetect for a frametype and they will broadcast to the servers to negotiate the frame type.This is abig deal if you have too many misconfigured services on the network, becausethe broadcast traffic could actually become overwhelming.
Multicast problems are also common because they are unknown to the net-work administrators and engineers until picked up on a protocol analyzer.This isbecause many applications are configured to multicast and you might not even beaware of it. For example, on a Novell NetWare network, if you’re using theTCP/IP-based Service Location Protocol (SLP), you will find that all yourNetWare clients multicast to address 224.0.1.22, which could make for a lot ofunnecessary multicasting.
www.syngress.com
Quick Tips for Optimizing Your Network for Better PerformanceThe following six situations show you how to cut broadcast traffic onany network:
1. On a hub-based network, your network nodes will see muchmore traffic than if you have a switched or bridged network.Consider implementing a single switch between the hubs, orif you can afford it, upgrade to all switches.
2. On a Microsoft network, the Master Browser service andNetBIOS are “hell creators.” Make sure you place WINSservers correctly, cut down all the NetBIOS traffic you don’tneed by removing it from network settings and devices, planand properly position the Master and Backup Browsers, andthen remove the option to have any other workstation onthe network participate in the browser elections. You canfind details on all these steps on Microsoft’s TechNet site.
Configuring & Implementing…
Continued
219_sniffer_05.qxd 6/28/02 11:53 AM Page 246

Using Sniffer Pro to Monitor the Performance of a Network • Chapter 5 247
The Detail Errors GraphThe Detail Errors graph on the Dashboard (see Figure 5.8) provides a real-timeview of all activity based on errors or problems your network might be experi-encing.A quick look at Figure 5.8 shows that all the graphs are identical inappearance and that they all follow the same time frame as indicated by your PCclock. Notice, however, that the Detail Errors graph follows a different scale fromthe other graphs; the scale climbs by twos.
www.syngress.com
3. On a Novell network, three major culprits kill network band-width: if your network clients are configured to autodetectthe frame type with the server, if your client is configuredwith IPX/SPX and SAP instead of TCP/IP, or if your NetWareservers are configured to use RIP instead of a default route.
4. If you have RIP (or IPX RIP) and/or SAP bound to any inter-faces on your network where they are unnecessary, your net-work will suffer unwanted broadcasts.
5. Routers can be used to reduce broadcasts. By default, arouter will not pass a routed broadcast unless you configureit to do so.
6. Unbind protocol stacks from any device that is not usingthem. Doing so will speed up the machine because it will nothave to go through a binding order and unneeded protocolswill not broadcast on the LAN.
These tips will eliminate some of your network traffic. There aremany other ways to decrease traffic, but through these commonmethods, you could conceivably cut 25 percent to 50 percent or more ofyour network traffic. You should also be aware of the fact that anythingabove 20-percent overall traffic made up of broadcasts or multicastsshould be flagged as a problem by you, the Sniffer Certified Professional.
Figure 5.8 The Detail Errors Dashboard Graph
219_sniffer_05.qxd 6/28/02 11:53 AM Page 247

248 Chapter 5 • Using Sniffer Pro to Monitor the Performance of a Network
You can use this graph to view errors on the network segment to whichSniffer Pro is attached: runts, oversizes, fragments, jabbers, CRCs, alignmenterrors, and collisions per second.You can use the selection portion of the graph(see Figure 5.9) to select the errors to view in real time.This is a very helpful fea-ture, for obvious reasons. If you see high utilization and broadcasts when youview the Network graph at 9:30, and in the Detail Errors graph you view a highlevel of collisions per second at the same time every day, there is a good chanceyou have a basic Ethernet problem.We look at this phenomenon in later sectionsof the chapter, where you will analyze the performance of Ethernet and commonproblems. For now, learn how to view these graphs and use them together for acommon cause: network performance analysis.
When you use this view, it is important to note that you are analyzing errors.Errors can cause a serious degradation of performance on your network. If thereare constant collisions, and most nodes need to retransmit data on the network,you are essentially doubling the normal saturation of your network. Most errorsyou encounter on your network segments listed within the Detail Errors sectionconsist of error data that would be discarded by a switch and in some instanceswould cause more traffic through retransmission. Retransmission of data could bevery high, causing your network devices to work twice as hard.This situationwould put twice the amount of traffic on the wire at any time.Table 5.2 shows adescription of the various errors.
Table 5.2 Detail Errors Descriptions
Error Description
Runts/s The number of runts per second. A runt is a frame that is toosmall (less than 64 bytes) but has a valid checksum.Remember that an Ethernet frame must be at least 64 bytes,even if it needs to be padded to bring it to a minimum 64. Ifit is not at least 64 bytes, it will most likely be dropped.
www.syngress.com
Figure 5.9 The Detail Errors Event Selection Box
Continued
219_sniffer_05.qxd 6/28/02 11:53 AM Page 248
Using Sniffer Pro to Monitor the Performance of a Network • Chapter 5 249
Oversizes/s The number of oversized frames per second. An oversizedframe is larger than the maximum transfer unit (MTU) for themedia. MTU is discussed later in the chapter.
Fragments/s The number of fragmented frames per second. Fragments areframes that are too small (less than 64 bytes) and have aninvalid checksum.
Jabbers/s The number of jabbers per second. A jabber is a frame that isoversized and has an invalid CRC.
CRCs/s The number of CRC errors per second. A CRC, or cyclic redun-dancy check, also known as a checksum, is an error thatoccurs if the checksums calculated by the source node andSniffer Pro do not match.
Alignments/s The number of alignment errors per second. An alignmenterror occurs when the length of a frame is not a number divisible by 8, so it cannot be resolved into bytes.
Collisions/s The number of collisions per second. A collision occurs whentwo or more network nodes try to transmit data at the sametime on a shared media network. When a collision occurs,both transmitting stations need to “back off” with an algo-rithm and retransmit their data. Be aware of captures thatwhen viewed in hexadecimal show a pattern of 55s and AAs(D0s and 43s for Fast Ethernet) relate to a collision patternfrom the JAM signal being sent.
NOTE
You will see us repeat Table 5.2’s contents repeated in many differentformats throughout the book in discussion of discussing other topics. Itis important for the Sniffer Certified Professional to be very familiar withthe types of problems he or she might find and how to accurately diag-nose them. By reading the Ethernet performance-monitoring section inthe next few pages, you will become more intimate with these problems.
www.syngress.com
Table 5.2 Continued
Error Description
219_sniffer_05.qxd 6/28/02 11:53 AM Page 249
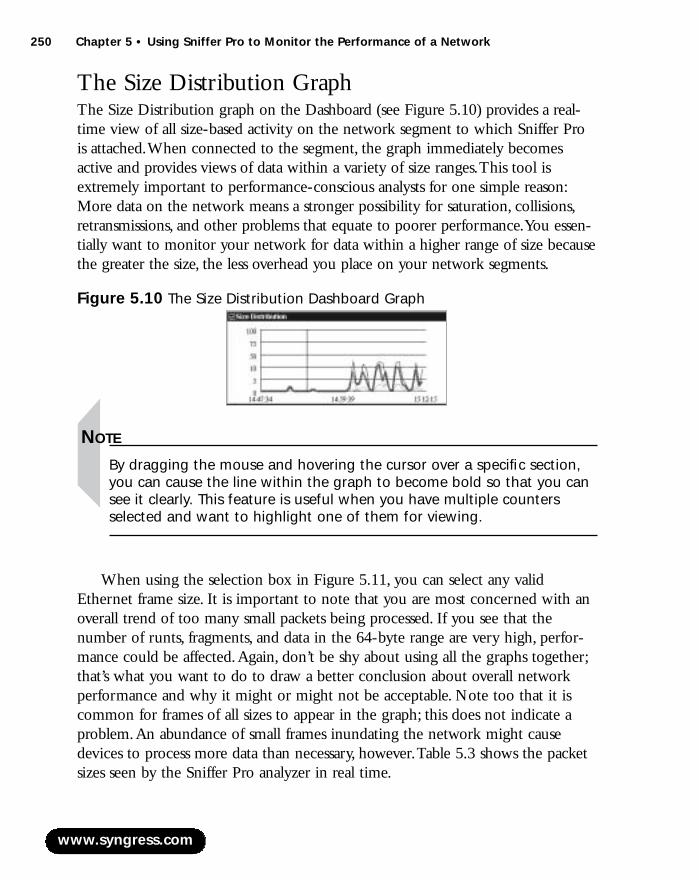
250 Chapter 5 • Using Sniffer Pro to Monitor the Performance of a Network
The Size Distribution GraphThe Size Distribution graph on the Dashboard (see Figure 5.10) provides a real-time view of all size-based activity on the network segment to which Sniffer Prois attached.When connected to the segment, the graph immediately becomesactive and provides views of data within a variety of size ranges.This tool isextremely important to performance-conscious analysts for one simple reason:More data on the network means a stronger possibility for saturation, collisions,retransmissions, and other problems that equate to poorer performance.You essen-tially want to monitor your network for data within a higher range of size becausethe greater the size, the less overhead you place on your network segments.
NOTE
By dragging the mouse and hovering the cursor over a specific section,you can cause the line within the graph to become bold so that you cansee it clearly. This feature is useful when you have multiple countersselected and want to highlight one of them for viewing.
When using the selection box in Figure 5.11, you can select any validEthernet frame size. It is important to note that you are most concerned with anoverall trend of too many small packets being processed. If you see that thenumber of runts, fragments, and data in the 64-byte range are very high, perfor-mance could be affected.Again, don’t be shy about using all the graphs together;that’s what you want to do to draw a better conclusion about overall networkperformance and why it might or might not be acceptable. Note too that it iscommon for frames of all sizes to appear in the graph; this does not indicate aproblem.An abundance of small frames inundating the network might causedevices to process more data than necessary, however.Table 5.3 shows the packetsizes seen by the Sniffer Pro analyzer in real time.
www.syngress.com
Figure 5.10 The Size Distribution Dashboard Graph
219_sniffer_05.qxd 6/28/02 11:53 AM Page 250
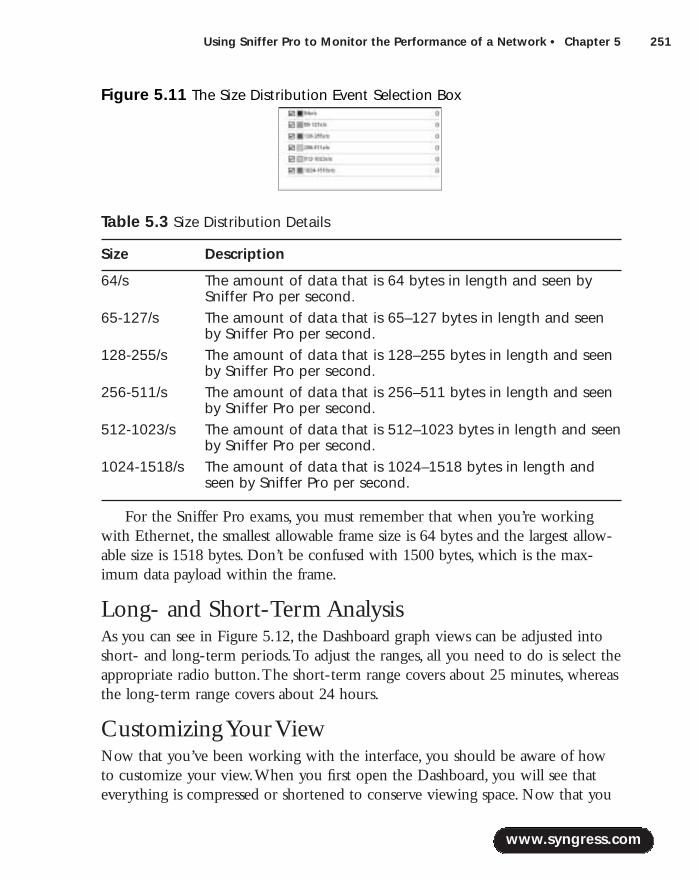
Using Sniffer Pro to Monitor the Performance of a Network • Chapter 5 251
Table 5.3 Size Distribution Details
Size Description
64/s The amount of data that is 64 bytes in length and seen bySniffer Pro per second.
65-127/s The amount of data that is 65–127 bytes in length and seenby Sniffer Pro per second.
128-255/s The amount of data that is 128–255 bytes in length and seenby Sniffer Pro per second.
256-511/s The amount of data that is 256–511 bytes in length and seenby Sniffer Pro per second.
512-1023/s The amount of data that is 512–1023 bytes in length and seenby Sniffer Pro per second.
1024-1518/s The amount of data that is 1024–1518 bytes in length andseen by Sniffer Pro per second.
For the Sniffer Pro exams, you must remember that when you’re workingwith Ethernet, the smallest allowable frame size is 64 bytes and the largest allow-able size is 1518 bytes. Don’t be confused with 1500 bytes, which is the max-imum data payload within the frame.
Long- and Short-Term AnalysisAs you can see in Figure 5.12, the Dashboard graph views can be adjusted intoshort- and long-term periods.To adjust the ranges, all you need to do is select theappropriate radio button.The short-term range covers about 25 minutes, whereasthe long-term range covers about 24 hours.
Customizing Your ViewNow that you’ve been working with the interface, you should be aware of howto customize your view.When you first open the Dashboard, you will see thateverything is compressed or shortened to conserve viewing space. Now that you
www.syngress.com
Figure 5.11 The Size Distribution Event Selection Box
219_sniffer_05.qxd 6/28/02 11:53 AM Page 251
252 Chapter 5 • Using Sniffer Pro to Monitor the Performance of a Network
know which views you can work with (Network, Detail Errors, and SizeDistribution), you might notice that at first you do not see all of them on thescreen.To expand and contract these views, click the little white outlined checkboxes to the direct left of the name of each section. For instance, if you don’twant to view the Detail Errors graph anymore, clear the check box and the graphwill contract. Selecting the check box causes the graph to expand.The Dashboardwindow is also resizable and can be minimized or maximized within the SnifferPro application.
Setting ThresholdsThe process of setting thresholds can be a confusing topic to some people. By thetime you are done reading this section, the process should be demystified for you.To put it simply, a threshold is something you set so that, when it is triggered—inother word, when it goes above a specified number—an alarm of some sortwarns you that the threshold has been reached. In the realm of network analysis,you might want to set thresholds for your network either on agreed-upon set-tings or general guidelines set by the vendors of the products, protocols, andwhatever else you are analyzing. If you feel that more than 5000 packets persecond traversing a 10BaseT segment is too much, set Sniffer Pro with athreshold of 5000 packets per second, and view the alarms created each time thatthreshold is tripped.
The last and most important piece to remember here is that once you haverecorded alarms, you have one more task to take care of.You have to look at theconsistency of how many and how often thresholds were exceeded.This informa-tion will help you determine whether or not you have a problem.To set thresh-olds, look at the top-right side of the Dashboard to find two links, marked Resetand Set Thresholds (see Figure 5.13).
To understand the concept of setting thresholds, you have to remember thatSniffer Pro is truly a “thinking tool.” It rarely ever gives you the answer to your
www.syngress.com
Figure 5.12 The Short- and Long-Term Statistical Settings
Figure 5.13 The Dashboard Reset and Set Thresholds Links
219_sniffer_05.qxd 6/28/02 11:53 AM Page 252

Using Sniffer Pro to Monitor the Performance of a Network • Chapter 5 253
problems in a nutshell.You really have to put your thinking cap on, do someserious crunching of numbers, and consider all factors.We make a point of tellingyou this because you can really goof up when working with thresholds.You neverwant to set a threshold and then, just because it trips, think that you are experi-encing a network issue.You have to analyze why and how many times the alarmtripped. Don’t be afraid to adjust these settings, either.The Sniffer Pro interface isso friendly, it includes a nice Reset button (as shown in Figure 5.13) that will putall your counters to 0. Sniffer Pro also has a specific threshold-setting resetbutton, which we will discuss in a moment.
Now let’s look at tweaking these thresholds to something you might findmore appropriate for your specific network. Direct your attention back to Figure5.13 to see the Reset and Set Thresholds buttons at the top of the Sniffer ProDashboard. Click the Set Thresholds button to produce the Dashboard Propertiesdialog box, as shown in Figure 5.14.
Within this properties dialog box, you will find on the left a Name columnand, on the right, a High Threshold column.At the bottom, you will find themonitor-sampling interval in seconds. On the far right, you will see the Resetand Reset All buttons.
In the Name column, you have 20 items that map directly to the Sniffer ProDashboard. Everything you see in the Network, Detail Errors, and SizeDistribution graphs can be found here, where you can manipulate their settings.Now drift over to the High Threshold column, which is the most important.Here, you can alter each threshold to your own settings. For instance, the multi-cast settings in your network might be set too low. If you are using very intensivemulticasting in your network, such as video conferencing, you might want to setthis generic setting of 2000 higher, to 3000.You need to check the Alarm log to
www.syngress.com
Figure 5.14 The Dashboard Properties Dialog Box
219_sniffer_05.qxd 6/28/02 11:53 AM Page 253
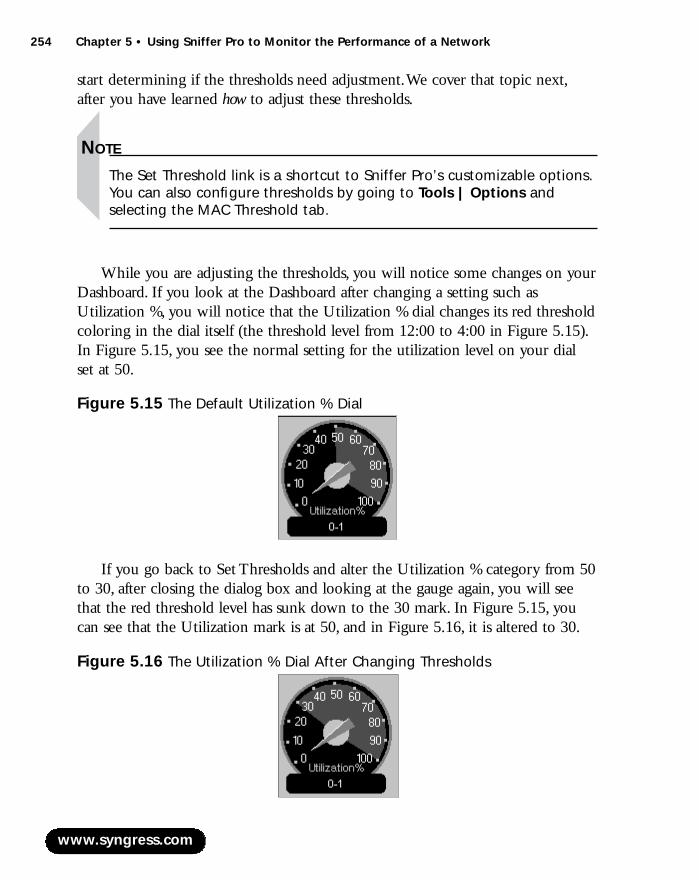
254 Chapter 5 • Using Sniffer Pro to Monitor the Performance of a Network
start determining if the thresholds need adjustment.We cover that topic next,after you have learned how to adjust these thresholds.
NOTE
The Set Threshold link is a shortcut to Sniffer Pro’s customizable options.You can also configure thresholds by going to Tools | Options andselecting the MAC Threshold tab.
While you are adjusting the thresholds, you will notice some changes on yourDashboard. If you look at the Dashboard after changing a setting such asUtilization %, you will notice that the Utilization % dial changes its red thresholdcoloring in the dial itself (the threshold level from 12:00 to 4:00 in Figure 5.15).In Figure 5.15, you see the normal setting for the utilization level on your dial set at 50.
If you go back to Set Thresholds and alter the Utilization % category from 50to 30, after closing the dialog box and looking at the gauge again, you will seethat the red threshold level has sunk down to the 30 mark. In Figure 5.15, youcan see that the Utilization mark is at 50, and in Figure 5.16, it is altered to 30.
www.syngress.com
Figure 5.15 The Default Utilization % Dial
Figure 5.16 The Utilization % Dial After Changing Thresholds
219_sniffer_05.qxd 6/28/02 11:53 AM Page 254
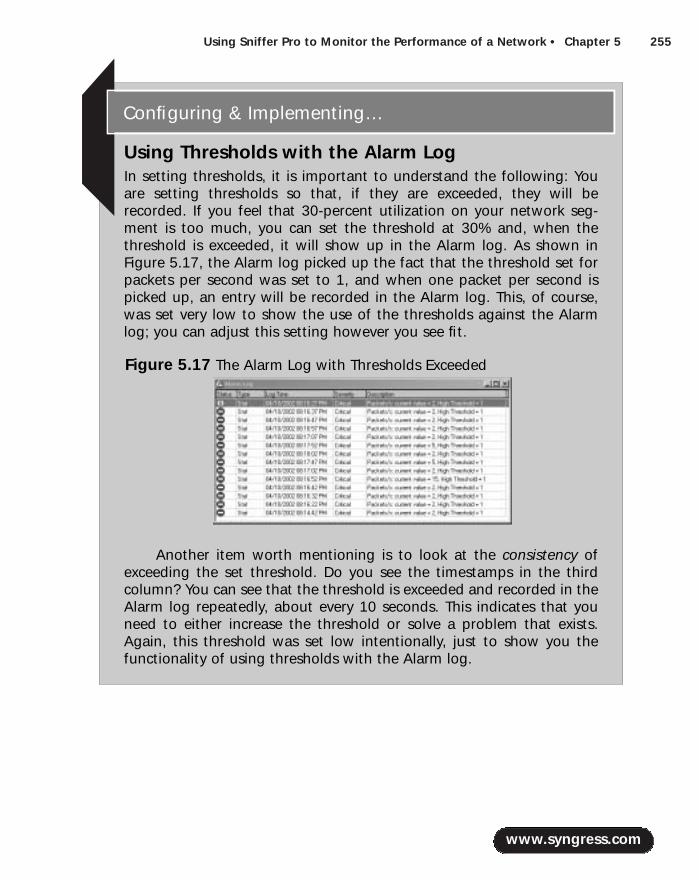
Using Sniffer Pro to Monitor the Performance of a Network • Chapter 5 255
www.syngress.com
Using Thresholds with the Alarm LogIn setting thresholds, it is important to understand the following: Youare setting thresholds so that, if they are exceeded, they will berecorded. If you feel that 30-percent utilization on your network seg-ment is too much, you can set the threshold at 30% and, when thethreshold is exceeded, it will show up in the Alarm log. As shown inFigure 5.17, the Alarm log picked up the fact that the threshold set forpackets per second was set to 1, and when one packet per second ispicked up, an entry will be recorded in the Alarm log. This, of course,was set very low to show the use of the thresholds against the Alarmlog; you can adjust this setting however you see fit.
Another item worth mentioning is to look at the consistency ofexceeding the set threshold. Do you see the timestamps in the thirdcolumn? You can see that the threshold is exceeded and recorded in theAlarm log repeatedly, about every 10 seconds. This indicates that youneed to either increase the threshold or solve a problem that exists.Again, this threshold was set low intentionally, just to show you thefunctionality of using thresholds with the Alarm log.
Configuring & Implementing…
Figure 5.17 The Alarm Log with Thresholds Exceeded
219_sniffer_05.qxd 6/28/02 11:53 AM Page 255

256 Chapter 5 • Using Sniffer Pro to Monitor the Performance of a Network
Baselining, Trending, and Change ManagementBaselining is a word that most technicians learn in school or hear frequently onthe job, but honestly, how many times is it done? Who is actually baselining yournetwork? What exactly is baselining?
A baseline is something you create before you have a problem. Otherwise,what is the point? If you do not know how your network runs under normaloperations, how will you be able to analyze a possible problem? Think of it thisway:You are called to a client site, and they tell you that the network is performingvery badly and is very slow. Generally, the first few questions you ask should be:Has the network always been this way? What is the norm here as far as perfor-mance goes? Were any changes made to the network? Believe it or not, whenyou ask these questions, you will often meet blank stares. Most people do notknow how their networks run normally and don’t know if any changes were made.
NOTE
Always document the changes you make to a network, no matter howlarge or small those changes. That one line of code you changed in theswitch configuration can easily affect network performance. In largecompanies, most changes go through the network management depart-ment, where a change management team monitors and records all thenetwork changes with you.
If you are working toward a solution and choose to implement one, that doesnot mean you have figured out the problem. Many times these issues are only thesurface layer hiding deeper problems.You never know—the solution you imple-ment now could only make things worse. Be careful when you’re formulatingperformance solutions, because problems usually run deep into the networkyou’re analyzing.
You need to take a baseline even if one has never been taken before.This iscritical to making an accurate call on a network’s performance. If a baseline neverexisted, a thorough interview of the network users and administrators is recom-mended. It would be wise to ask performance-related questions of a user whohits the Internet daily or one who always has a problem retrieving files from aspecific file server.You can add their answers into your performance analysis. Be
www.syngress.com
219_sniffer_05.qxd 6/28/02 11:53 AM Page 256
Using Sniffer Pro to Monitor the Performance of a Network • Chapter 5 257
aware that when you ask users if things have always been this way, you could getthe answers you need. Perhaps you will hear something like,“Performance wasn’talways this bad.When I came in on a Monday two weeks ago, I had problemsretrieving files quickly, and ever since then it has been slow.”You would then pro-ceed to ask this user from where she accessed the files. From there, find outwhere the server is located on the network. Perhaps, on a weekend two weeksago, a server was relocated to another segment over a WAN link. If this changewas properly documented, it would point you to a possible solution.This changecould have very well affected overall network performance.
If you had a baseline and proper change management, the network adminis-tration staff could have figured out this problem immediately, but usually, whenyou’re not monitoring the network, you rely on the complaints of your usercommunity to highlight network performance issues for you. Before we look atmore baselining issues and solutions, always remember that you need to monitoryour network’s performance consistently over time to accurately know how thenetwork behaves on a normal basis.Always document your changes with achange control department. For small shops, keeping a simple written log will do.Doing so will save you a great deal of time and effort in the future.
Baselining Over TimeOne handy approach is to watch your network over long periods of time andestablish a monthly and yearly baseline.You will learn things that are common onyour network but do not occur on a daily basis. In other words, let’s say that youwork for an accounting firm.Wouldn’t you think that network utilization wouldtriple during tax time? What about year-end processing at a manufacturingfacility? Network utilization could triple at year’s end. Just be wary of how yournetwork reacts to certain times of the day, month, or year, and you will haveaccurately mapped its performance. If you are a consultant for a network withwhich you are unfamiliar, it is important to ask these questions. For all you know,management could simply be unaware that their network routinely experiencesheavy volume at certain times of the year.Trust us on that—it happens!
Trending TipsA good way to find trends across your network is to constantly monitor andbaseline the network itself.A trend can be something very simple, like themorning rush to log into the network domain controller.At 8:30 to 9:00 everymorning, the entire workforce is trying to log on to the domain controller (you
www.syngress.com
219_sniffer_05.qxd 6/28/02 11:53 AM Page 257
258 Chapter 5 • Using Sniffer Pro to Monitor the Performance of a Network
could only have one) and check their e-mail.This situation, then, would be thenorm, and at that time in the morning, network activity could be very high.Youcould also find that by 10:30 A.M., the network has settled down a bit, and only aspecific LAN segment, where developers are retrieving data from the maindatabase, is experiencing high utilization.Again, this is normal for your network’sstandards. Lastly, say that it is about 4:00 P.M. on a Friday; the proxy server isexperiencing a lot of activity and HTTP traffic is very high.There is a goodchance that the company employees are surfing the Internet and getting ready tostart their weekend.After baselining your network, you’ll know that this is allnormal activity. If it is acceptable and you have allocated the right hardware andbandwidth to support such activity, the situation is fine.
If this is normal, what would be abnormal? Given the baseline informationwe just established, an abnormal trend would be that every day at about 2:00 A.M.,the file server reboots itself.This is obviously an unplanned and unwanted trend.Always consider such events when you’re analyzing a network because it willinevitably affect performance.You will not only want to find the cause of theseproblems, but you’ll also need to figure in the fact that these issues do exist andare actually part of your performance baseline, good or bad.
Trending and baselining go hand in hand and must be thought of as a pair ofactivities.Trends are a part of your baseline. Now you should feel confident thatyou know how to get a baseline and can assess what is normal and abnormalactivity or trends.
Change ManagementYou might have learned about network management from other studies, espe-cially studying Cisco technologies. Network management categories are fault,configuration, accounting, performance, and security management, which youcan remember via the acronym FCAPS. Change management is the term manynetwork management groups use to refer to monitoring and supervising thechanges that occur on the network. Change management is usually found inenterprise environments.This does not mean that you cannot perform changemanagement yourself on your network or a client’s network, regardless of size.Change management is very important.You must manage your network, andbaselining and trending fall under that umbrella.
www.syngress.com
219_sniffer_05.qxd 6/28/02 11:53 AM Page 258
Using Sniffer Pro to Monitor the Performance of a Network • Chapter 5 259
Analyzing Ethernet Performance with Sniffer Pro In this section, we look at capturing data on an Ethernet segment and analyzingit for good or poor performance.There are many factors to consider; whenyou’re done, you will be able to tell if your network is healthy or not. If you needa refresher on Ethernet, revisit Chapter 1,“Introduction to Sniffer Pro.” In thissection, we look at Ethernet performance issues that could be present on a net-work and how you can address them.
Monitoring the Performance of the EthernetAlthough this section does not cover every detail on Ethernet and its history, itdoes discuss how to monitor Ethernet performance and troubleshoot possibleissues using the Sniffer Pro network and protocol analyzer. If you need moreinformation on the details of Ethernet, revisit Chapter 1 for a topical look onEthernet and its functionality.Then if you are still thirsting for information onEthernet and all its versions and types, you can visit quite a few sites for moreinformation. Cisco’s Web site, at www.cisco.com, provides a variety of informa-tion on Ethernet.WildPackets has a great compendium you can use for Ethernetfundamentals, at www.wildpackets.com. Of course, the IEEE site will be helpful:www.ieee.org will turn up more documentation on Ethernet and the 802 stan-dards than you ever wanted to know.This information comes directly from themakers and keepers of the Ethernet standards, so any questions that remain unan-swered in your mind can be answered there. If all else fails, you can also e-mailthe IEEE; they are responsive to requests for standards information.
NOTE
You can monitor the performance of any network node by analyzing itsresponse time. It is important to note that you will have to know how toread timestamps in the decode, which is covered in Chapter 3, but beaware that any response of less that one-tenth of a second is consideredpoor performance.
Here we discuss common Ethernet performance issues and what you mightbe able to do to increase your network’s performance by using the right tools and
www.syngress.com
219_sniffer_05.qxd 6/28/02 11:53 AM Page 259
260 Chapter 5 • Using Sniffer Pro to Monitor the Performance of a Network
know-how.When discussing Ethernet performance with our colleagues, peers,and clients, the same common issues keep coming up. Most clients might nothave the insight that you, as a Sniffer Certified Professional, have. Let’s look atsome very common problems that anyone can understand.
Saturation Levels and CollisionsNetwork saturation is very common and a tough problem to nail down accu-rately, because every network is different and all networks have different types ofactivity and traffic flow, all at different times.That said, the saturation level is whatyou consider acceptable, keeping in mind industry-set thresholds and what yournetwork is capable of handling based on your baselines. On any network, youwant to consider a design that eliminates all bottlenecks, unnecessary broadcasts,and collisions that could possibly affect that network. Some level of poor perfor-mance is acceptable to companies with smaller budgets.You want to stick withthe guidelines set forth by many vendors, which can be confusing because theyall specify different numbers. Once again, the rule of thumb is 40 percent to 50percent.You also have to be realistic when gauging these numbers. Unless youhave an infinite budget (usually not the case), you will be stuck with last year’smodels and be expected to implement the newest technologies over them.This isa give-and-take relationship, so expect performance to decline a bit. Let’s moveon to what you can do with what you have and learn the most common causesof performance issues on an Ethernet network.
Network saturation is common, but when it is pushed too high, you willhave large numbers of collisions.We once worked on a client site that had threehubs as the network core and, plugged into them, a router going to a remote sitefor the company.The collision light on the router’s Ethernet port was flickeringconstantly.Without even plugging in a laptop to start monitoring the network,we already knew there was a collision problem.
Once you see that you have a problem on an Ethernet network, one of yourfocuses should be the collision domain size.To reiterate from Chapter 1, Ethernetis based on the Carrier Sense Multiple Access/Collision Detection (CSMA/CD)protocol. CSMA/CD defines the access method Ethernet uses.The term multipleaccess is refers to the fact that many stations attached to the same cable or hubhave the opportunity to transmit. Each station is given an equal opportunity, andno station has priority over any other. Carrier sense describes how an Ethernet sta-tion listens to the channel before transmitting.The station ensures that there areno other signals on the channel before it transmits.An Ethernet station also lis-tens while transmitting to ensure that no other station transmits data at the same
www.syngress.com
219_sniffer_05.qxd 6/28/02 11:53 AM Page 260
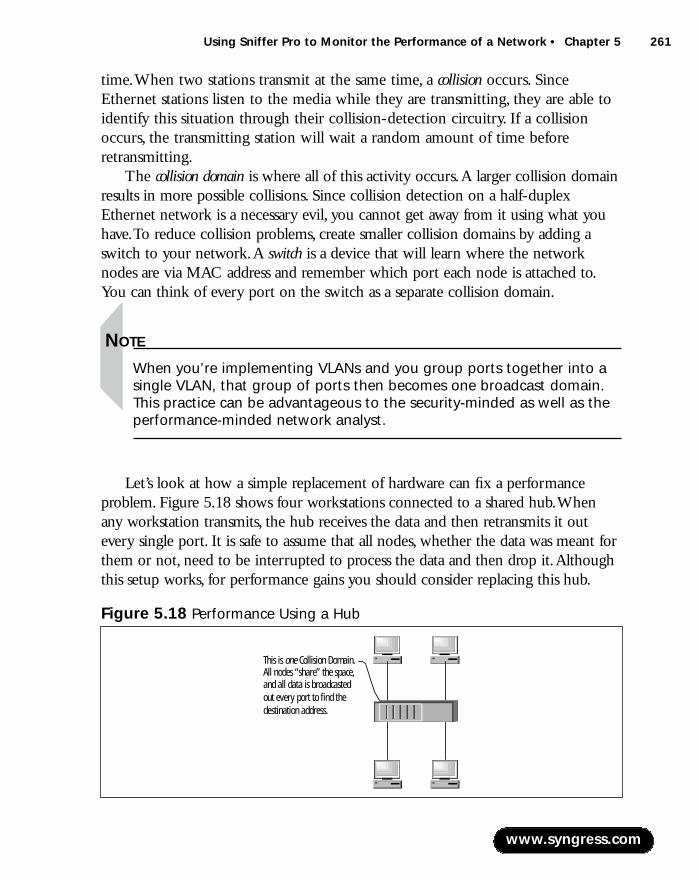
Using Sniffer Pro to Monitor the Performance of a Network • Chapter 5 261
time.When two stations transmit at the same time, a collision occurs. SinceEthernet stations listen to the media while they are transmitting, they are able toidentify this situation through their collision-detection circuitry. If a collisionoccurs, the transmitting station will wait a random amount of time beforeretransmitting.
The collision domain is where all of this activity occurs.A larger collision domainresults in more possible collisions. Since collision detection on a half-duplexEthernet network is a necessary evil, you cannot get away from it using what youhave.To reduce collision problems, create smaller collision domains by adding aswitch to your network.A switch is a device that will learn where the networknodes are via MAC address and remember which port each node is attached to.You can think of every port on the switch as a separate collision domain.
NOTE
When you’re implementing VLANs and you group ports together into asingle VLAN, that group of ports then becomes one broadcast domain.This practice can be advantageous to the security-minded as well as theperformance-minded network analyst.
Let’s look at how a simple replacement of hardware can fix a performanceproblem. Figure 5.18 shows four workstations connected to a shared hub.Whenany workstation transmits, the hub receives the data and then retransmits it outevery single port. It is safe to assume that all nodes, whether the data was meant forthem or not, need to be interrupted to process the data and then drop it.Althoughthis setup works, for performance gains you should consider replacing this hub.
www.syngress.com
Figure 5.18 Performance Using a Hub
This is one Collision Domain.All nodes “share” the space,and all data is broadcastedout every port to find thedestination address.
219_sniffer_05.qxd 6/28/02 11:53 AM Page 261
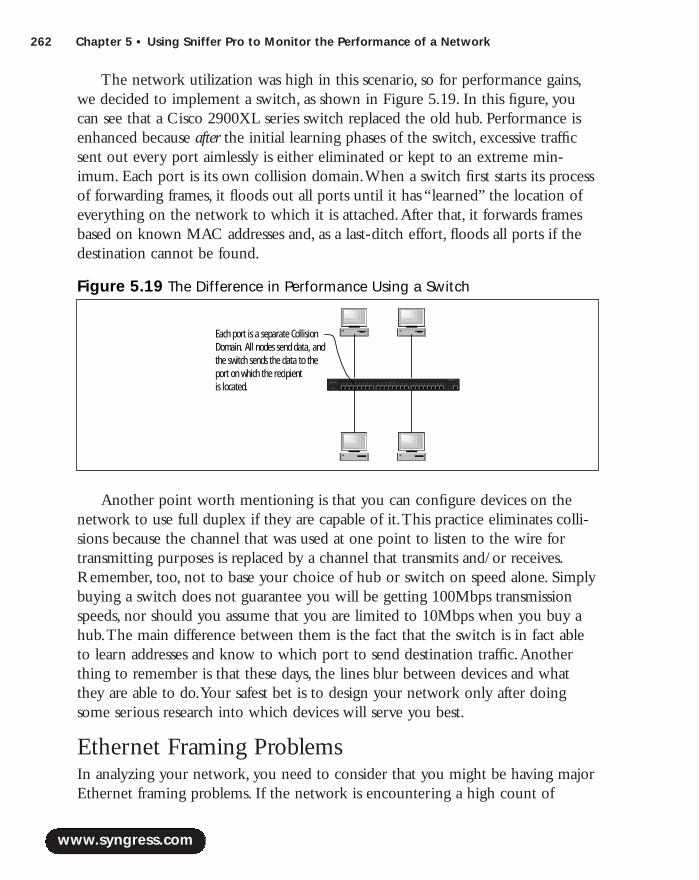
262 Chapter 5 • Using Sniffer Pro to Monitor the Performance of a Network
The network utilization was high in this scenario, so for performance gains,we decided to implement a switch, as shown in Figure 5.19. In this figure, youcan see that a Cisco 2900XL series switch replaced the old hub. Performance isenhanced because after the initial learning phases of the switch, excessive trafficsent out every port aimlessly is either eliminated or kept to an extreme min-imum. Each port is its own collision domain.When a switch first starts its processof forwarding frames, it floods out all ports until it has “learned” the location ofeverything on the network to which it is attached.After that, it forwards framesbased on known MAC addresses and, as a last-ditch effort, floods all ports if thedestination cannot be found.
Another point worth mentioning is that you can configure devices on thenetwork to use full duplex if they are capable of it.This practice eliminates colli-sions because the channel that was used at one point to listen to the wire fortransmitting purposes is replaced by a channel that transmits and/or receives.Remember, too, not to base your choice of hub or switch on speed alone. Simplybuying a switch does not guarantee you will be getting 100Mbps transmissionspeeds, nor should you assume that you are limited to 10Mbps when you buy ahub.The main difference between them is the fact that the switch is in fact ableto learn addresses and know to which port to send destination traffic.Anotherthing to remember is that these days, the lines blur between devices and whatthey are able to do.Your safest bet is to design your network only after doingsome serious research into which devices will serve you best.
Ethernet Framing ProblemsIn analyzing your network, you need to consider that you might be having majorEthernet framing problems. If the network is encountering a high count of
www.syngress.com
Figure 5.19 The Difference in Performance Using a Switch
Each port is a separate CollisionDomain. All nodes send data, andthe switch sends the data to theport on which the recipientis located.
219_sniffer_05.qxd 6/28/02 11:53 AM Page 262

Using Sniffer Pro to Monitor the Performance of a Network • Chapter 5 263
Ethernet frame errors, which you will see in the Detail Errors section of theDashboard, you need to consider taking action. For one, very high usage of net-work bandwidth will cause some of these problems on an improperly designednetwork.You can set your thresholds to pick up and alarm (to see in the Alarmlog) these issues so you can further analyze them. If you see that utilization iswithin acceptable limits and below threshold and you still have a large number offraming issues, you need to consider other possible sources of the problem.
NOTE
Remember that framing errors are not always indicative of a criticalproblem. When analyzing, you need to consider that only specific levelsanalyzed against overall traffic on your network are to be consideredproblems. This is why a baseline is so critical! You must use your headand logically think about the nature of the problem before you try tocorrect it. The perfect example is when you are monitoring a WAN linkand you first bring up a circuit. The interface is flooded with errors, andafter clearing the interface counters and watching for a while, you seethat the errors tend to disappear rapidly. If you only looked at the inter-face for a moment, you would have assumed that there was a majorproblem when there really wasn’t a problem at all.
As if having collisions on the network weren’t bad enough, you can evencount on having different types of collisions! In the Ethernet world, you can havelocal collisions or remote collisions as well as late collisions or early collisions. Be awarethat if your lower-layer protocols are not clean and healthy, you could misdiag-nose upper-layer problems. Generally, we say that water runs downhill, but in thiscase it actually runs uphill. Having lower-layer problems will cause upper-layerproblems to exist or be amplified.
Let’s look at these collision types:
■ Local collisions When excessive local collisions occur, a SnifferCertified Professional must look for high utilization on the LAN towhich Sniffer Pro is attached.A high level of local collisions indicatesthat too many nodes are sharing the media and/or improper cable andtopology design where lengths might have been extended or possiblyexceeded.
www.syngress.com
219_sniffer_05.qxd 6/28/02 11:53 AM Page 263
264 Chapter 5 • Using Sniffer Pro to Monitor the Performance of a Network
■ Remote collisions When excessive remote collisions occur, a SnifferCertified Professional must look for the possibility that a remote seg-ment is totally saturated or that the hardware device between you andthat remote segment is not functioning properly.The device beingcrossed can be a hub or a repeater.
■ Late collisions A late collision occurs within the first 64 bytes of apacket.When excessive late collisions occur, a Sniffer CertifiedProfessional must look for a source NIC to examine the actual NICs onthe segment for interoperability or other problems related to malfunc-tion, such as timing being off.A wise design choice is to keep the NICson your network standardized. Implementing NICs from multiple ven-dors within your network is not a wise choice, because each NIC isbuilt with a different architecture and can cause major problems on thenetwork if mismatching occurs.This is when interoperability becomesvery apparent. Late collisions can also be a case of improperly imple-mented wiring jobs or not following given specifications on length ordistance.
To reiterate the other issues we looked at earlier in Table 5.2, let’s look atsome of these errors with a more critical eye. Most of the errors listed usuallyrelate to a hardware problem.The sending station’s NIC could have a problem,and that would in turn cause CRC errors, long and short frames, and jabbers onthe network.Again, make sure you spend some time trying to standardize thenetwork medium during the design phase of network planning. Now let’s take acloser look at some common errors:
■ Jabbers A jabber is a frame that is oversized and has a CRC error.When a pattern of long packets (oversized) on a network is noted, itcould be an indication that jabbers are occurring. Jabbering is indicativeof a failing NIC or other hardware device.
■ Long and short frames When excessive long or short frames occur, aSniffer Certified Professional must look for a failing NIC or a transceiverfor possible NIC internal circuitry problems.
■ CRCs A CRC, or checksum, is an error that occurs if the checksumscalculated by the source node and Sniffer Pro do not match. Bad NICsor drivers generally cause CRC alignment errors. Generally, you can usethe Sniffer Pro analyzer to find the associated MAC address of the cardin question and either upgrade the drivers or replace them.
www.syngress.com
219_sniffer_05.qxd 6/28/02 11:53 AM Page 264

Using Sniffer Pro to Monitor the Performance of a Network • Chapter 5 265
NOTE
CRC errors should never exceed one per every million bytes of data persegment you are analyzing.
On networks with very old equipment and in dirty environments, networkproblems are amplified.Adapters and contacts covered in dirt and soot createproblems such as CRC errors and jabbering.We once had the opportunity towork for a company that had power-related problems in its area. It was veryapparent that power surges, spikes, and complete blackouts were very common.The machines connected to the network were experiencing issues from receivingall these power surges.These surges even damaged a rack of hubs, all of whichneeded to be replaced. Often, you are told that a NIC is old or damaged; nowyou know a few of the reasons that might be the case.
www.syngress.com
Stress Your NetworkAt last, you can have revenge! If everyone in your life and your job isstressing you out, now you can take it out on your network!
All kidding aside, you do have a tool that you can use to generatetraffic on the network to simulate and proactively plan for high periodsof utilization. By selecting Tools | Packet Generator, you can use a toolthat was meant to perform stress testing. You can see the PacketGenerator in Figure 5.20.
Designing & Planning…
Figure 5.20 The Sniffer Pro Packet Generator
Continued
219_sniffer_05.qxd 6/28/02 11:53 AM Page 265

266 Chapter 5 • Using Sniffer Pro to Monitor the Performance of a Network
www.syngress.com
When you open the Packet Generator, you can select the thirdbutton from the left on the toolbar to open the Send New Frame dialogbox. Be careful with this feature, because if you misconfigure it by set-ting the sizing too high for continuous generation, you will hang yourmachine and have to reboot. In the Send New Frame dialog box, shownin Figure 5.21, you can see options to send continuous packets at 75percent of network utilization and the frame size set to its maximum.
Be aware that you can only set packet sizes between 64 and 1518bytes, as mentioned earlier. These are the absolute limits for Ethernetframe sizes. If you try to set the packet size too high or too low, you willbe given an error message.
Once you start to send the frames, you can see in the Detail tab ofthe Packet Generator’s main window all the data sent, at what size, andhow many times, among other items. Remember that when you experi-ence intermittent problems such as high errors on an Ethernet network,you can use these traffic-generation techniques to add a major load toyour network segments. This additional traffic will be used to flush outcertain types of failures that are intermittently seen on the network inquestion. By generating additional network traffic, you will certainlybring not-so-normally seen network errors to the surface to be analyzed.
Finally, you never want to generate traffic on a production networkwithout scheduling an outage, during off-hours, or without permissionfrom upper management. All you need is to inundate your network withmore traffic than what you already have. This would also raise a securityconcern for your security analysts.
Figure 5.21 Using the Send New Frame Dialog Box
219_sniffer_05.qxd 6/28/02 11:53 AM Page 266

Using Sniffer Pro to Monitor the Performance of a Network • Chapter 5 267
Hardware ProblemsOld, damaged, and malfunctioning NICs are at the top of the hardware problemlist.As NICs get older and take power surges (from the lack of being on a PC orserver not attached to an uninterrupted power source), they tend to create prob-lems like those mentioned in the previous pages. Chattering NICs (cards thatrepeatedly send data over and over again for no reason other than failure) havebeen known to take networks down, bring up expensive ISDN links and keepthem up, and cause many other issues that are network related. NICs, adapters,and transceivers that are dirty have also been known to malfunction.To top thelist, drivers (programs that control a particular type of device that is attached toyour computer) have wreaked havoc on many occasions. Make sure you followsimple guidelines such as these:
■ Minimize ESD Electrostatic discharge, or ESD, is a reality, so handleNICs with care and make sure you are properly grounded. If we had adollar for every technician we encountered blatantly disregarding thissimple step, we could have retired five years ago.
■ NIC standardization Let’s face it, hardware is buggy. Drivers containsoftware bugs, and devices are not always engineered to cohabitate cor-rectly with other devices. Keeping things all the same simply makes yourlife easier.
■ Cleanliness Keep your network equipment clean and at the propertemperature.We once had the experience of being sent to a remotelocation to see why the router and switch ceased to function. Uponwalking into the office, we immediately started to perspire.When weentered the network closet, we noticed that you could fry an egg on thetop of the router cabinet.This temperature level, of course, is somethingyou want to avoid.The same goes for the cabling lying in the corner,saturated not by data, but with water dripping from the ceiling.
■ Power As mentioned in this section, you need to be aware that incor-rect power applied to computer chips and circuits will definitely damagethem. Power surges are chip killers.
Speaking of cabling, it is another very large reason for network performancedisasters. Cabling with inappropriate distances, mismatched standards such as568A and 568B, improperly made and faulty cabling, cabling running past inter-ference-creating devices to foster EMI and/or RFI—all these can all cause major
www.syngress.com
219_sniffer_05.qxd 6/28/02 11:53 AM Page 267
268 Chapter 5 • Using Sniffer Pro to Monitor the Performance of a Network
performance problems on your network.You can use a time-domain reflec-tometer (TDR) to find and correct cabling problems when you encounter them.Again, most of these issues point back to original design and administration.
NOTE
The authors and editors of this book cannot stress enough the impor-tance of a well-documented, managed, environmentally sound and pro-tected network. A well-maintained network will make all the differencewhen a performance problem—or for that matter, any problem—arises.
STP Loops and Broadcast StormsOne of the most horrifying experiences known to the network analyst is thespanning-tree loop.This is a network performance disintegrator. Not only does it justplain stink to have one, but these loops are a pain to diagnose and fix. Usuallythey occur as the result of a mistake placed into a configuration on a network’score switches.We had the opportunity to see this situation first-hand, and it wasnot fun.A technician we were working with entered the wrong command into aCisco Catalyst 5000 series switch. It immediately killed performance on the net-work so badly, we thought all the servers went down.
This situation could also occur if Spanning Tree is turned off and someoneplaces a cable in the network from one device to another to create a loop.This is,of course, the chance you take when you turn off Spanning Tree! Nevertheless,you might encounter this situation only by mistake, but it’s worth a mention.Youcan make performance gains by making sure your root bridge is placed properlyat the center of your network switching core block on a higher-powered switchthan the rest of your network switches. (In other words, you would not want acloset switch to be the root bridge for your network.)
In this section, we have looked at real-time performance monitoring andanalysis of Ethernet with the Sniffer Pro analyzer.A quick point to mention isthat this past section related to Ethernet, but not necessarily Ethernet in full-duplex mode. In analyzing full duplex, you need additional hardware (the full-duplex pod) that is available from NAI.
Let’s now look at another lower-layer technology—Token Ring.
www.syngress.com
219_sniffer_05.qxd 6/28/02 11:53 AM Page 268
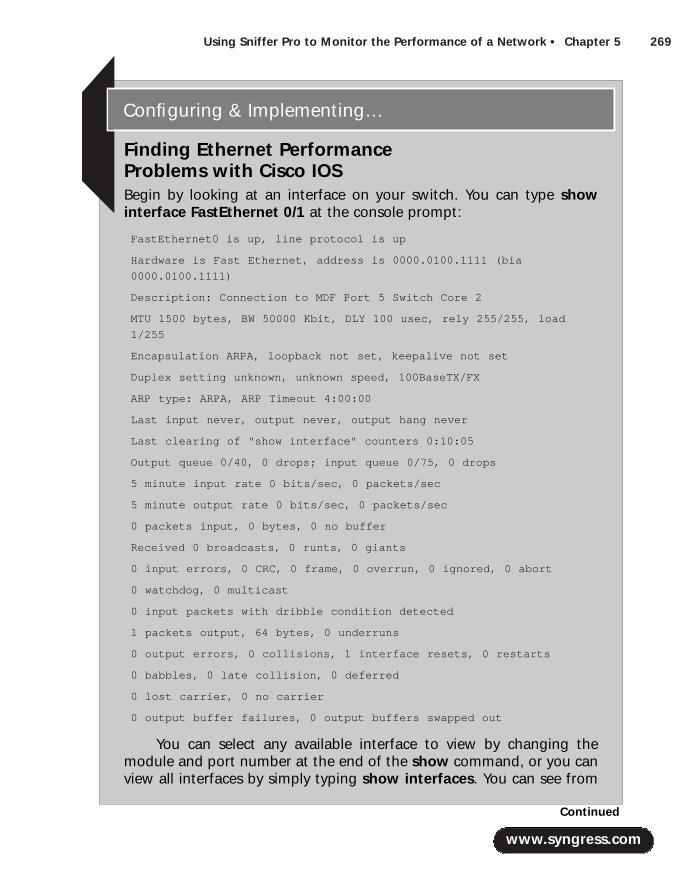
Using Sniffer Pro to Monitor the Performance of a Network • Chapter 5 269
www.syngress.com
Finding Ethernet Performance Problems with Cisco IOSBegin by looking at an interface on your switch. You can type showinterface FastEthernet 0/1 at the console prompt:
FastEthernet0 is up, line protocol is up
Hardware is Fast Ethernet, address is 0000.0100.1111 (bia
0000.0100.1111)
Description: Connection to MDF Port 5 Switch Core 2
MTU 1500 bytes, BW 50000 Kbit, DLY 100 usec, rely 255/255, load
1/255
Encapsulation ARPA, loopback not set, keepalive not set
Duplex setting unknown, unknown speed, 100BaseTX/FX
ARP type: ARPA, ARP Timeout 4:00:00
Last input never, output never, output hang never
Last clearing of "show interface" counters 0:10:05
Output queue 0/40, 0 drops; input queue 0/75, 0 drops
5 minute input rate 0 bits/sec, 0 packets/sec
5 minute output rate 0 bits/sec, 0 packets/sec
0 packets input, 0 bytes, 0 no buffer
Received 0 broadcasts, 0 runts, 0 giants
0 input errors, 0 CRC, 0 frame, 0 overrun, 0 ignored, 0 abort
0 watchdog, 0 multicast
0 input packets with dribble condition detected
1 packets output, 64 bytes, 0 underruns
0 output errors, 0 collisions, 1 interface resets, 0 restarts
0 babbles, 0 late collision, 0 deferred
0 lost carrier, 0 no carrier
0 output buffer failures, 0 output buffers swapped out
You can select any available interface to view by changing themodule and port number at the end of the show command, or you canview all interfaces by simply typing show interfaces. You can see from
Configuring & Implementing…
Continued
219_sniffer_05.qxd 6/28/02 11:53 AM Page 269

270 Chapter 5 • Using Sniffer Pro to Monitor the Performance of a Network
Analyzing Token Ring Performance with Sniffer ProOne thing we have learned very well from being network and protocol analystsourselves is the word budget. Many times we hear,“Why do I need to learn any-thing except Ethernet and TCP/IP?”Too many times, technicians find themselvesin the inevitable situation of walking on site and realizing that they are not inKansas anymore, and Toto has already left the building.What should you do ifyou find yourself in such a situation? Would you suggest that the company youare servicing simply upgrade everything because it is old technology, sidesteppingthe fact that this solution you are proposing stems only from your lack of knowl-edge of the current infrastructure? Of course not! In Chapter 10, when we coverreporting, you will see why this is a grave-digging proposal. In any case, this iswhere the word budget comes up again.Think about this:You are able to set upyour Sniffer Pro analyzer, find a problem with a Token Ring NIC, change it, andsave the network for a cost of about US$200. If they get a second opinion fromsomeone who knows the basics of troubleshooting the technology, you will havea hard time explaining why you needed to upgrade the company’s entire networkfor a price that might be through the roof.
www.syngress.com
the preceding output that you can find errors rather quickly. You canclear the counters on the interface (clear counters) and then startviewing the interface and watching errors increment the counters, iferrors are occurring. Now look at some of the counters at the bottom ofthe output. You should be familiar with some of the names, such as CRCerrors and multicasts. It is common for network analysts to use all thetools they can find to identify and analyze network problems.
If you are running a Cisco Catalyst switch that uses “set”-basedcode, you can use the show port command. This command shows youenough statistics to make your head spin. You will find highly detailederrors on every port on your switch, including all the errors that we havealready highlighted: runts, CRCs, and much more. You can also specifythe exact port you want to view with the same command followed by amodule and port number.
You can also use the IOS-based show tech-support command tobring up a combination of many troubleshooting commands, all at thesame time. You will get performance statistics from this command as well.
219_sniffer_05.qxd 6/28/02 11:53 AM Page 270
Using Sniffer Pro to Monitor the Performance of a Network • Chapter 5 271
NOTE
This is not a discussion of which technology is better. We all know thatsome technologies are at the end of their lives and have reached theirlimitations, but this, of course, is not the point. You are the network andprotocol analyst responsible for identifying and troubleshooting theproblems. It is your responsibility to diagnose them, fix them, or provideopinions on how to provide a solution to the client’s problems.
That said, you can of course make recommendations on the fact thatif the company migrates from Token Ring to Ethernet, it will have newertechnology, better performance and support, and much faster speeds—with more bandwidth available.
You might find this hard to believe, but before Ethernet caught up with suchspeed gains and worked with the use of switches, using Token Ring on a networkactually improved performance.As of 1985, when the IEEE formalized the 802.5standard, it was actually the better technology for the following reasons:
■ Token Ring offered higher bandwidth at 16Mbps, compared withEthernet’s 10Mbps. Of course, this is no longer an issue with FastEthernet, Gigabit Ethernet, and 10 Gigabit Ethernet.
■ Token Ring offered high reliability because the ring can continuenormal operation despite any single fault.
■ Token Ring was a performance and reliability gain from the bus net-works, where a cable break took down the whole network, whereasToken Ring would just bypass inactive stations.
■ Token Ring does not suffer from collisions and is therefore capable ofhigher utilization rates. It can reach up to 70 percent utilization, andEthernet was and still is at 40 to 50 percent utilization at half duplex.
■ Token Ring has a larger frame length of about 4000 or more, whereasEthernet uses 1518 bytes.
Now that Ethernet has caught up and surpassed Token Ring, you will findthat Ethernet is the better technology.This superiority was even mandated by theGartner Group, the think tank for swaying IT decisions worldwide.We won’tfocus on the technology here, but so much of it is available that it would be a
www.syngress.com
219_sniffer_05.qxd 6/28/02 11:53 AM Page 271
272 Chapter 5 • Using Sniffer Pro to Monitor the Performance of a Network
crime to ignore it.The first time we had to travel to another country to resolve aproblem, we were inundated with the older (but fully embedded) Token Ringtechnology, which is neither gone nor forgotten.
Now let’s perform some network analysis and real-time monitoring withToken Ring and increase its performance!
Monitoring the Performance of Token RingThis is not a book on “everything Token Ring.”This is a book on analyzing net-works with Sniffer Pro and learning how to use it to diagnose problems. Refer toChapter 1 for the basics of Token Ring operation, and go online towww.cisco.com to find more information on the history and operation of TokenRing.You will find many real-life experiences that will help you get a grip onbattling Token Ring performance issues.
In monitoring Token Ring performance, you will deal with similar perfor-mance issues as with Ethernet (for instance, slow or problematic network perfor-mance), but you will troubleshoot different hardware and a different topologyaltogether with a whole new slew of error types, which we will look at in detail.
Setting Up Sniffer Pro to Analyze Token RingUpon connecting to a Token Ring network with the Sniffer Pro network andprotocol analyzer, you will immediately notice that you are looking at a wholenew Dashboard! As mentioned earlier in this chapter, the Dashboard changes toaccommodate the network topology it is analyzing. In next few sections, we don’treiterate what you already learned about the Dashboard rather, we cover what isnew and different when you connect to a Token Ring environment.The mostimportant thing (and so many times overlooked) that you need to attach to anduse to analyze a Token Ring environment is—yes, you guessed it, a Token RingNIC. Once you have one configured on your workstation, relaunch Sniffer Proand configure it to use the new card by choosing File | Select Settings.Yourcard should show up as a new NIC to configure with Sniffer Pro. Select the NIC,and when Sniffer Pro starts, it will come up attached via the Token Ring NIC.
NOTE
3Com offers the TokenLink III Family, which includes the TokenLinkPCMCIA card as well as a standard PCI card. If you will be analyzingToken Ring, you need the right equipment. Furthermore, be aware of thedifferent cable types and speeds when you’re purchasing your equipment
www.syngress.com
219_sniffer_05.qxd 6/28/02 11:53 AM Page 272
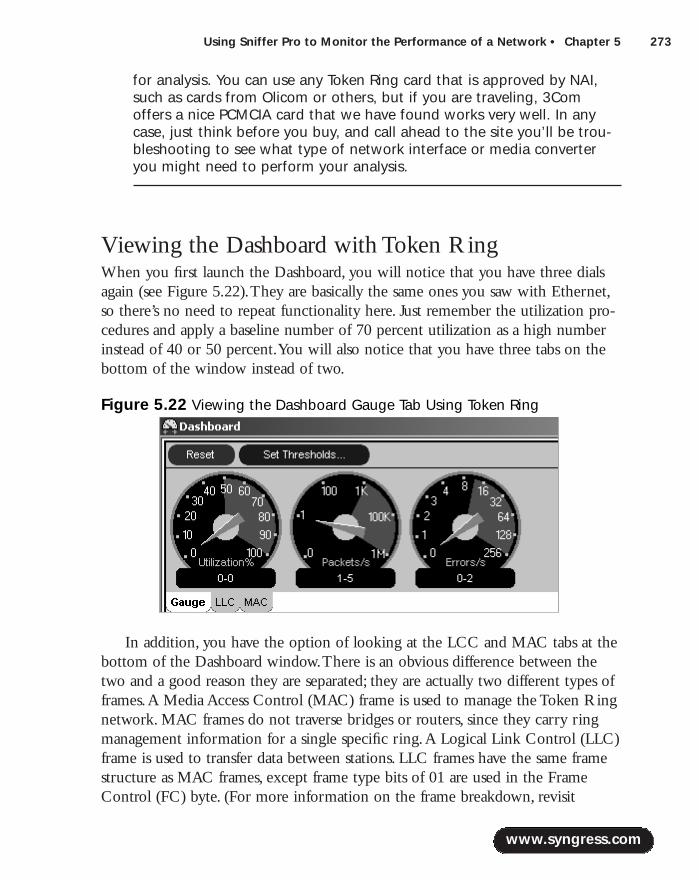
Using Sniffer Pro to Monitor the Performance of a Network • Chapter 5 273
for analysis. You can use any Token Ring card that is approved by NAI,such as cards from Olicom or others, but if you are traveling, 3Comoffers a nice PCMCIA card that we have found works very well. In anycase, just think before you buy, and call ahead to the site you’ll be trou-bleshooting to see what type of network interface or media converteryou might need to perform your analysis.
Viewing the Dashboard with Token RingWhen you first launch the Dashboard, you will notice that you have three dialsagain (see Figure 5.22).They are basically the same ones you saw with Ethernet,so there’s no need to repeat functionality here. Just remember the utilization pro-cedures and apply a baseline number of 70 percent utilization as a high numberinstead of 40 or 50 percent.You will also notice that you have three tabs on thebottom of the window instead of two.
In addition, you have the option of looking at the LCC and MAC tabs at thebottom of the Dashboard window.There is an obvious difference between thetwo and a good reason they are separated; they are actually two different types offrames.A Media Access Control (MAC) frame is used to manage the Token Ringnetwork. MAC frames do not traverse bridges or routers, since they carry ringmanagement information for a single specific ring.A Logical Link Control (LLC)frame is used to transfer data between stations. LLC frames have the same framestructure as MAC frames, except frame type bits of 01 are used in the FrameControl (FC) byte. (For more information on the frame breakdown, revisit
www.syngress.com
Figure 5.22 Viewing the Dashboard Gauge Tab Using Token Ring
219_sniffer_05.qxd 6/28/02 11:53 AM Page 273
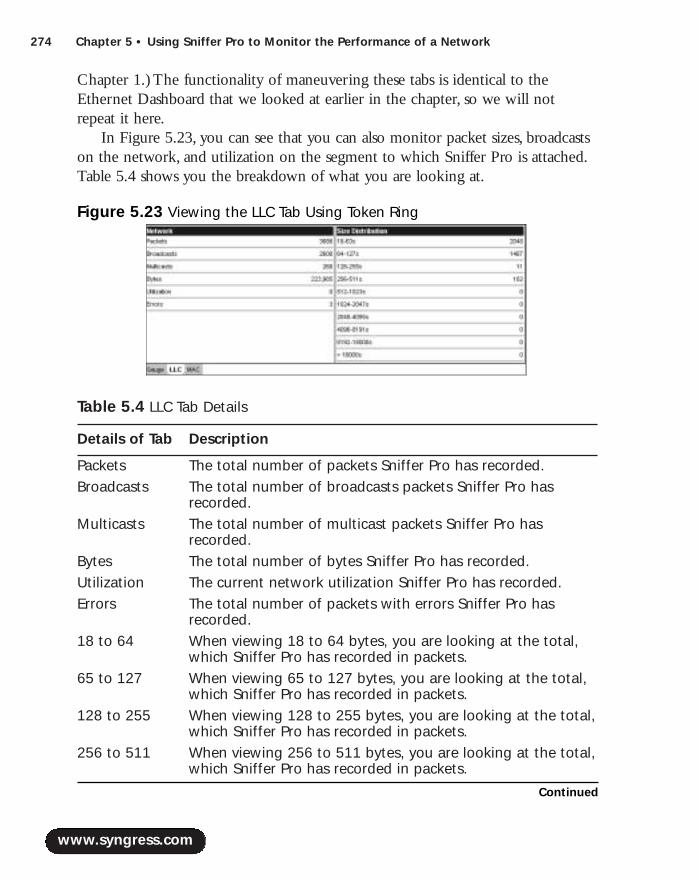
274 Chapter 5 • Using Sniffer Pro to Monitor the Performance of a Network
Chapter 1.) The functionality of maneuvering these tabs is identical to theEthernet Dashboard that we looked at earlier in the chapter, so we will notrepeat it here.
In Figure 5.23, you can see that you can also monitor packet sizes, broadcastson the network, and utilization on the segment to which Sniffer Pro is attached.Table 5.4 shows you the breakdown of what you are looking at.
Table 5.4 LLC Tab Details
Details of Tab Description
Packets The total number of packets Sniffer Pro has recorded. Broadcasts The total number of broadcasts packets Sniffer Pro has
recorded.Multicasts The total number of multicast packets Sniffer Pro has
recorded.Bytes The total number of bytes Sniffer Pro has recorded.Utilization The current network utilization Sniffer Pro has recorded.Errors The total number of packets with errors Sniffer Pro has
recorded.18 to 64 When viewing 18 to 64 bytes, you are looking at the total,
which Sniffer Pro has recorded in packets.65 to 127 When viewing 65 to 127 bytes, you are looking at the total,
which Sniffer Pro has recorded in packets.128 to 255 When viewing 128 to 255 bytes, you are looking at the total,
which Sniffer Pro has recorded in packets.256 to 511 When viewing 256 to 511 bytes, you are looking at the total,
which Sniffer Pro has recorded in packets.
www.syngress.com
Figure 5.23 Viewing the LLC Tab Using Token Ring
Continued
219_sniffer_05.qxd 6/28/02 11:53 AM Page 274
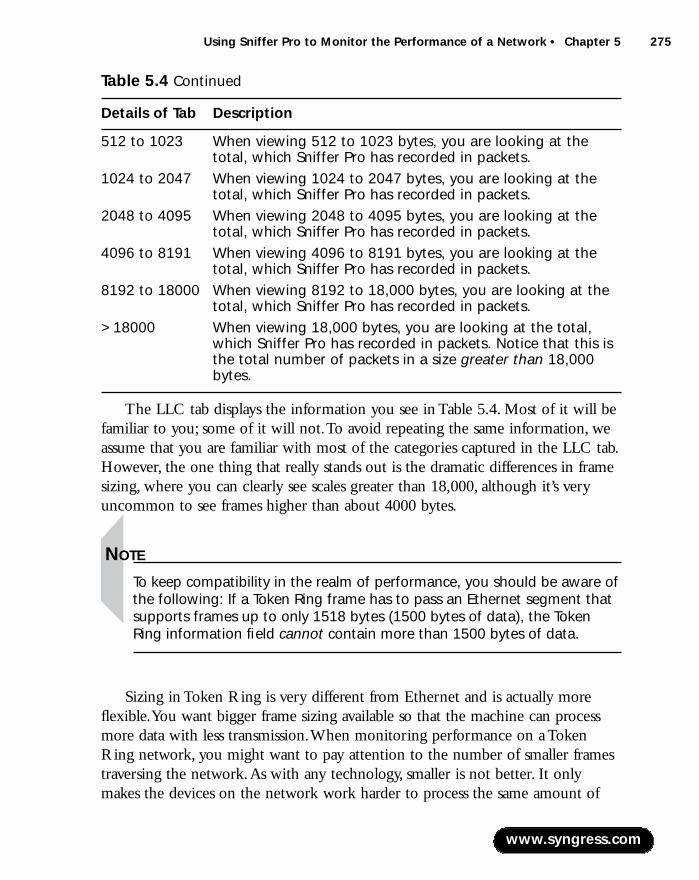
Using Sniffer Pro to Monitor the Performance of a Network • Chapter 5 275
512 to 1023 When viewing 512 to 1023 bytes, you are looking at thetotal, which Sniffer Pro has recorded in packets.
1024 to 2047 When viewing 1024 to 2047 bytes, you are looking at thetotal, which Sniffer Pro has recorded in packets.
2048 to 4095 When viewing 2048 to 4095 bytes, you are looking at thetotal, which Sniffer Pro has recorded in packets.
4096 to 8191 When viewing 4096 to 8191 bytes, you are looking at thetotal, which Sniffer Pro has recorded in packets.
8192 to 18000 When viewing 8192 to 18,000 bytes, you are looking at thetotal, which Sniffer Pro has recorded in packets.
>18000 When viewing 18,000 bytes, you are looking at the total,which Sniffer Pro has recorded in packets. Notice that this isthe total number of packets in a size greater than 18,000bytes.
The LLC tab displays the information you see in Table 5.4. Most of it will befamiliar to you; some of it will not.To avoid repeating the same information, weassume that you are familiar with most of the categories captured in the LLC tab.However, the one thing that really stands out is the dramatic differences in framesizing, where you can clearly see scales greater than 18,000, although it’s veryuncommon to see frames higher than about 4000 bytes.
NOTE
To keep compatibility in the realm of performance, you should be aware ofthe following: If a Token Ring frame has to pass an Ethernet segment thatsupports frames up to only 1518 bytes (1500 bytes of data), the TokenRing information field cannot contain more than 1500 bytes of data.
Sizing in Token Ring is very different from Ethernet and is actually moreflexible.You want bigger frame sizing available so that the machine can processmore data with less transmission.When monitoring performance on a TokenRing network, you might want to pay attention to the number of smaller framestraversing the network.As with any technology, smaller is not better. It onlymakes the devices on the network work harder to process the same amount of
www.syngress.com
Table 5.4 Continued
Details of Tab Description
219_sniffer_05.qxd 6/28/02 11:53 AM Page 275
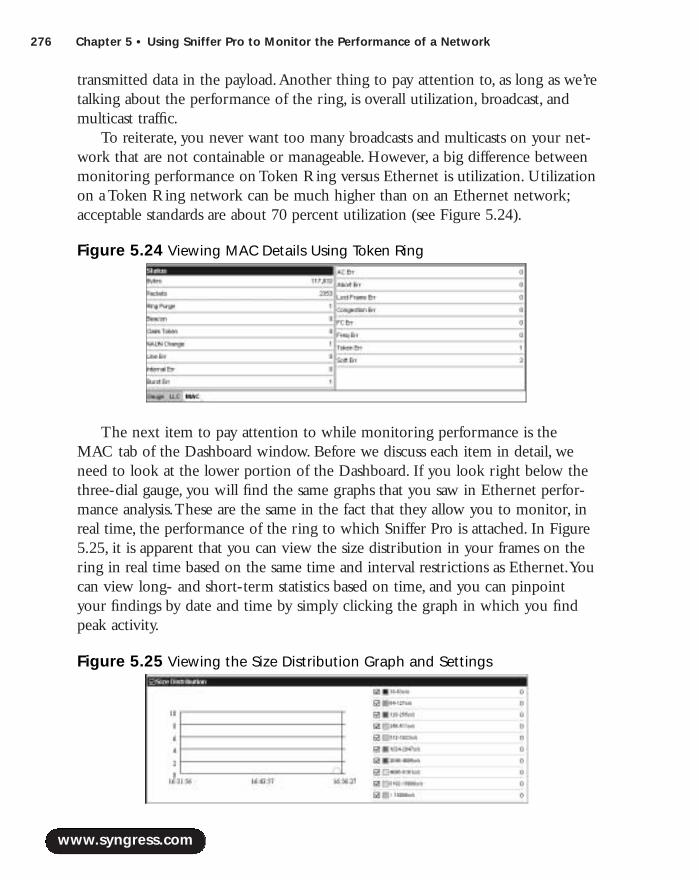
276 Chapter 5 • Using Sniffer Pro to Monitor the Performance of a Network
transmitted data in the payload.Another thing to pay attention to, as long as we’retalking about the performance of the ring, is overall utilization, broadcast, andmulticast traffic.
To reiterate, you never want too many broadcasts and multicasts on your net-work that are not containable or manageable. However, a big difference betweenmonitoring performance on Token Ring versus Ethernet is utilization. Utilizationon a Token Ring network can be much higher than on an Ethernet network;acceptable standards are about 70 percent utilization (see Figure 5.24).
The next item to pay attention to while monitoring performance is theMAC tab of the Dashboard window. Before we discuss each item in detail, weneed to look at the lower portion of the Dashboard. If you look right below thethree-dial gauge, you will find the same graphs that you saw in Ethernet perfor-mance analysis.These are the same in the fact that they allow you to monitor, inreal time, the performance of the ring to which Sniffer Pro is attached. In Figure5.25, it is apparent that you can view the size distribution in your frames on thering in real time based on the same time and interval restrictions as Ethernet.Youcan view long- and short-term statistics based on time, and you can pinpointyour findings by date and time by simply clicking the graph in which you findpeak activity.
www.syngress.com
Figure 5.24 Viewing MAC Details Using Token Ring
Figure 5.25 Viewing the Size Distribution Graph and Settings
219_sniffer_05.qxd 6/28/02 11:53 AM Page 276

Using Sniffer Pro to Monitor the Performance of a Network • Chapter 5 277
Now you should really feel comfortable monitoring your network in realtime with the Sniffer Pro analyzer, regardless of the topology. Never forget thatSniffer Pro is a tool—it is your honed networking skills and troubleshootingability that will find the roots of the problems. Speaking of errors, let’s look atthem in detail.
A big difference with the MAC tab (which looks similar to the Detail Errorstab on Ethernet) is the breadth of errors you can monitor on Token Ring com-pared with Ethernet. Look at Figure 5.26, and it is clear that you are dealing withdouble the number of errors you could have monitored on an Ethernet segment!This does not mean that Token Ring is more susceptible to errors; it means onlythat there are more functions available to report problems.
Figure 5.26 shows the rate of these occurrences per second that Sniffer Prohas recorded. It is not critical for you to memorize every error, especially if youdo not work in a Token Ring environment on a daily basis. Don’t be afraid toaccept that you might not know what the problem is—this is where you hit thebook, the Internet, or perhaps make a phone call to advanced technical support.Analyzing the performance of Token Ring can be difficult if you don’t workwith it on a daily basis.
You should pay special attention to four of these Status details in particular:
■ Ring Purge/s If the number of ring purges per second becomes high,pay special attention, because this is a good indicator that you are havingissues with the Active Monitor (AM) sending a frame to purge the ringtoo frequently.This could indicate an issue with monitor contention, orthe AM could simply be trying to get the ring back into a known state.
www.syngress.com
Figure 5.26 Viewing the MAC Status Graph and Settings
219_sniffer_05.qxd 6/28/02 11:53 AM Page 277

278 Chapter 5 • Using Sniffer Pro to Monitor the Performance of a Network
The AM could purge because it might not have seen a good frame orfree token in a given amount of time (about 10ms). If a frame circles thering twice, it is removed by the AM. Ring purges and beaconing are dis-cussed in more detail later in this chapter.
■ Soft Err/s If the number of soft errors per second becomes high, youcould have multiple types of problems on your network.There are manytypes of soft errors, which are recorded as a whole; you need to dissectand troubleshoot them one at a time. Most (not all) soft errors are cre-ated from some kind of line noise that can be generated from manysources, including background noise, hardware failures causing noise, ormachinery.
■ Burst Err/s Burst errors are incremented if you have noise on theline.A burst error could be the result of problems with noise in thebackground or somehow injected at some point into the network cable.Faulty hardware can also cause burst errors.
■ Congestion Error/s Congestion errors are indications of problemswith receiver congestion frames, which points to the fact that your sta-tions are running low on “buffer” space.This can sometimes cause manyerrors on the ring, including possible purging. Make sure that stations onthe ring have enough buffer space to handle possible congestion sce-narios. Later in this chapter, you’ll learn how to adjust your workstationsto handle better buffering to help alleviate this problem.
If you are unfamiliar with the frame bits mentioned in Table 5.4, revisitChapter 1, where the frame is laid out in detail.This is where you can referencespecific bits and where they sit in the frame.
Now that we have covered the steps to monitoring real-time performance ofToken Ring with the Sniffer Pro analyzer, let’s look at what you might havefound and what you can do about it.
Common Token Ring Performance ProblemsSo far we have outlined some of the common problems that the Sniffer Pro real-time Dashboard analysis can show you. Now we examine some of the more eso-teric problems you might come across that are very common in the Token Ringworld.We then point you in the direction of possible solutions and alert you as towhether they will require further monitoring and analysis.
www.syngress.com
219_sniffer_05.qxd 6/28/02 11:53 AM Page 278
Using Sniffer Pro to Monitor the Performance of a Network • Chapter 5 279
Lobes and Other Large-Scale Hardware ProblemsWhat is a lobe? In the early days of Token Ring, you could (and still might) seethe gigantic, inflexible “Type”-based cable that IBM created. In order to get mul-tiple workstations to attach to a MAU port at a single point, you needed a lobeunit.All workstations attached to a lobe unit need to participate in a token-claiming process on the full ring. If there is a problem with this process, you canconsider that there might be a problem with the lobe or the stations attached toit.You can see lobe errors on the Dashboard. Make sure that stations and lobesare attached properly.You also might want to consider the possibility of an over-loaded ring if you are trying to attach too many stations to a single ring vialobes.You might be stepping outside adjusted ring lengths.
Make sure that you have properly functioning hardware all around.YourMAUs, controlled access units (CAUs), and lobe attachment modules (LAMs) need tobe inspected and analyzed. Some can be passive devices on the network, withoutany intelligence. Make sure you’re clear on the terminology:A MAU providesworkstation connectors as well as ring-in/ring-out ports to connect to otherMAUs; a CAU is a MAU with intelligence; and a LAM is used to support work-stations that will connect to a MAU. So what happens when a station wants toenter the ring? Is there a possibility of a problem right from the start? Yes, youcan have ring insertion problems from an overly congested ring.
Ring Length ProblemsThe adjusted ring length (ARL) of Token Ring is a very important to know andconform to.Although you do not see a pinpointed way to analyze it on SnifferPro, you will get other errors due to ARL violations.The ARL must be com-puted based on the network.ARL is not a number that we can give you; it issomething you must figure out.The best way to remember how to calculate ARLis to take the sum of all cable lengths between wiring closets, minus the shortestcable between wiring closets. Getting the ARL is important for you to accuratelydetermine the full length of the ring. If the ring length is too long, problems willmanifest in the form of attenuation, and you will see many physical-layer errorssuch as those listed in this section. In addition, be aware that lobes have specificlength as well, but you need to go to the vendor’s Web site to get accurate infor-mation, because they are sometimes different based on vendor.
Another common question you could be asked is exactly how many stationsare allowed per ring when acceptable ring lengths are used.Well, since you couldhave both passive and active equipment, the numbers can vary, but a good set of
www.syngress.com
219_sniffer_05.qxd 6/28/02 11:53 AM Page 279

280 Chapter 5 • Using Sniffer Pro to Monitor the Performance of a Network
rough numbers to go with is about 70 or 75 stations on a ring using UTP andabout 250 stations on a ring using IBM Type 1 cable.
Line, Framing, and Adapter ErrorsMost of the following errors are recorded by Sniffer Pro and shown in theDashboard graphs under the MAC tab. Each error is based on line problems,adapter issues, framing problems, or a combination of many things happening atonce. Each one can hinder performance in one way or another. Let’s look atsome of these errors and what they can affect.
If you get line errors on the Dashboard, you have data that might have aninvalid character or a check error in the frame.A frame that does not pass a CRCas the frame is repeated by the hardware can cause line errors. Line errors arecommon and are no reason for alarm unless you get a great number of themabove the default threshold. In that case, you might want to check the faultdomain of the reporting station for problems.
Soft errors are intermittent errors counted by the Token Ring adapter.Thereare different types of soft errors. It is hard to determine exactly what causes a softerror. If you have multiple problems happening at the same time, you could havemany soft errors generated from them all. Soft errors are handy because they senda soft error report, which is nothing more than a MAC frame that includes thetype of error and the upstream address to position itself on the ring. Soft errorsare also common and are considered impermanent. Hard errors are generally fail-ures of the ring and are permanent until fixed.
If a token is lost on the ring, you might see token errors.The AM generates atoken error when it recognizes the need to create a new token because it thinksthat no token currently exists. If the crystal clock and the ring clock are not thesame, you might experience frequency errors. Simply not having them in timesync will cause this kind of error on the ring.
A burst error indicates that there is a signaling error on the cable; this error iscommonly caused by a brief absence of signaling, which in turn might have beencaused by a station inserting or deinserting from the ring.The insertion can befrom a brief signal loss caused by the hardware itself and not necessarily some-thing manually happening.
Other kinds of errors you can receive are congestion errors, which do not meanthat the whole ring is congested but instead that the station’s buffer might nothave enough space to copy a frame. Receiver congestion errors occur when astation in a repeat mode sees a frame for its address but does not have the avail-able space in buffer to copy the incoming frame.When you perform analysis of
www.syngress.com
219_sniffer_05.qxd 6/28/02 11:53 AM Page 280

Using Sniffer Pro to Monitor the Performance of a Network • Chapter 5 281
the ring, the station with the congestion problem will send a report error frameto the Ring Error Monitor with a hex number of 0xC0-00-00-00-00-08.Although we already mentioned it is a buffer problem, the reason this error canoccur is that there might not be enough buffer space in the receiving station’sadapter or traffic might be very heavy at that time.
www.syngress.com
Making Your Workstations Work for You, Not Against YouA little known Token Ring adapter card performance enhancement forWindows workstations is to set the size for the send and receive bufferson the Token Ring adapter card in the PC to the maximum value allowed.This setting also increases performance on your Token Ring network sta-tion and can help eliminate buffer errors.
To change the send and receive buffers on the adapter, do the following:
1. Make sure you are at a Windows Desktop.
2. Click Start | Settings | Control Panel.
3. Double-click the Network applet.
4. Click the Token Ring adapter entry.
5. Click Properties.
6. Click the Advanced tab.
7. Click the Receive Buffer Size entry.
8. Use the Up arrow to select the maximum value allowed.
9. Change the Transmit Buffer Size the same way.
10. Click OK to save your changes.
11. You might need to reboot.
That’s it! Hopefully you get some performance gains from thischange and help rid your network of buffer errors.
Configuring & Implementing…
219_sniffer_05.qxd 6/28/02 11:53 AM Page 281

282 Chapter 5 • Using Sniffer Pro to Monitor the Performance of a Network
Purging and Beaconing ProblemsBeacon packets coming from a device indicate a serious problem such as a brokencable. Beacon errors are not to be taken lightly, and they are very useful.Whenyou see beacon errors in Sniffer Pro, you can almost immediately diagnose theproblem with performance—there probably isn’t any performance, because thenetwork is down! Seriously, beaconing is very important to know about whenyou’re analyzing Token Ring performance.
Beaconing is the result of a “hard” or “permanent” error in the ring.The sta-tion that notices this hard error sends a MAC frame isolating the fault domain.The frame includes the possible reasons for the error and the NAUN—the sta-tion’s nearest active upstream neighbor. Eventually the upstream station will go intobypass state to keep the ring self-healing, and it will have to be reinserted intothe ring when it’s fixed. In Figure 5.27, you can see that when the threshold ispassed for allowable beaconing (which of course is set low because you don’twant it to be allowed), the Alarm log picks it up.When you first start looking atperformance on a Token Ring network, the Alarm log set at the default levelcould be your first step in seeing if you have any showstopping hard errors onthe ring.The Alarm log is still just as useful in the Token Ring world as it was forEthernet. Figure 5.27 shows the threshold for ring beaconing being exceeded andthe Alarm log dutifully flagging and recording it.
When you experience purging problems, you have another interesting itemon your hands.The purging process is actually very normal and is critical toproper ring functionality.A ring purge is a good thing. However, if ring purginghappens frequently and resets the ring, thus affecting all user stations on that ring,you may be alarmed of possible problems. Let’s first look at why ring purging isnormal so you will know when it is malfunctioning and causing performanceproblems.
Ring purging takes place when the Active Monitor purges (removes) all cir-culating data from the ring. It does this because it might not have seen a goodframe or free token in a given amount of time (about 10ms). If a frame circles thering twice, it is removed by the AM. If the ring is carrying illegal data, it is
www.syngress.com
Figure 5.27 The Alarm Log Capturing Ring Beaconing
219_sniffer_05.qxd 6/28/02 11:53 AM Page 282

Using Sniffer Pro to Monitor the Performance of a Network • Chapter 5 283
because your timer valid transmission (TVX) has expired. Be aware of TVXerrors; they mean that the AM does not detect a valid transmission.A ring canalso be purged when a Standby Monitor station takes over the role of ActiveMonitor. Be aware of all these possible problems and monitor them closely in realtime and with captures to find the possible reasons frequent purging is takingplace on the ring. Many times, malfunctioning NICs, an overworked ring, or aring that is not in proper design specifications can cause this problem.
Configuring ThresholdsConfiguring thresholds for Token Ring is identical to the process you learned forEthernet.We went over all the items you can monitor in the Dashboard beforewe explained configuring thresholds because you now know what you want toset low or high and why. In Figure 5.28, you can see the thresholds to set.You getto them the same way you did with Ethernet: Either by clicking the SetThresholds link on the front of the Sniffer Pro Dashboard or through the menusystem by selecting Tools | Options and clicking the MAC Threshold tab.
Other Token Ring Performance SolutionsWhen faced with a Token Ring performance problem, the solution we often hearis,“Why don’t you upgrade?” If you take a moment and do the math to calculatewhat an upgrade might cost, then write it up and hand it in to management (asyou will learn to do in Chapter 10,“Reporting”), this solution suddenly will notseem like such a good idea.Although this book does not go into detail on theother Sniffer-related products offered by NAI, we would like to at least make youaware that the Sniffer Distributed Token Ring Agent does exist as a piece of theSniffer Distributed platform. If you are working in a widespread Token Ring
www.syngress.com
Figure 5.28 Viewing the Dashboard Properties
219_sniffer_05.qxd 6/28/02 11:53 AM Page 283
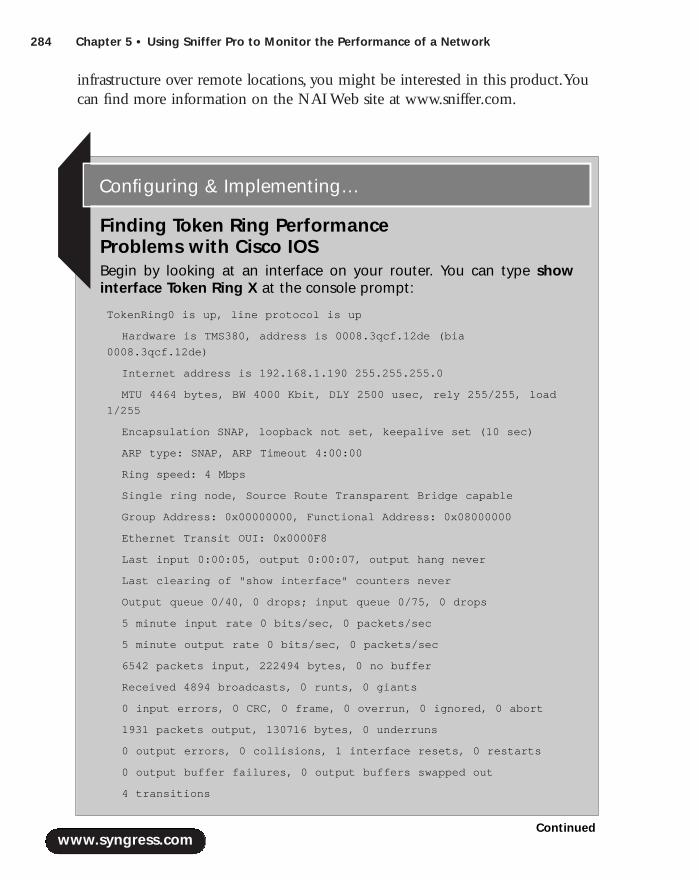
284 Chapter 5 • Using Sniffer Pro to Monitor the Performance of a Network
infrastructure over remote locations, you might be interested in this product.Youcan find more information on the NAI Web site at www.sniffer.com.
www.syngress.com
Finding Token Ring Performance Problems with Cisco IOSBegin by looking at an interface on your router. You can type showinterface Token Ring X at the console prompt:
TokenRing0 is up, line protocol is up
Hardware is TMS380, address is 0008.3qcf.12de (bia
0008.3qcf.12de)
Internet address is 192.168.1.190 255.255.255.0
MTU 4464 bytes, BW 4000 Kbit, DLY 2500 usec, rely 255/255, load
1/255
Encapsulation SNAP, loopback not set, keepalive set (10 sec)
ARP type: SNAP, ARP Timeout 4:00:00
Ring speed: 4 Mbps
Single ring node, Source Route Transparent Bridge capable
Group Address: 0x00000000, Functional Address: 0x08000000
Ethernet Transit OUI: 0x0000F8
Last input 0:00:05, output 0:00:07, output hang never
Last clearing of "show interface" counters never
Output queue 0/40, 0 drops; input queue 0/75, 0 drops
5 minute input rate 0 bits/sec, 0 packets/sec
5 minute output rate 0 bits/sec, 0 packets/sec
6542 packets input, 222494 bytes, 0 no buffer
Received 4894 broadcasts, 0 runts, 0 giants
0 input errors, 0 CRC, 0 frame, 0 overrun, 0 ignored, 0 abort
1931 packets output, 130716 bytes, 0 underruns
0 output errors, 0 collisions, 1 interface resets, 0 restarts
0 output buffer failures, 0 output buffers swapped out
4 transitions
Configuring & Implementing…
Continued
219_sniffer_05.qxd 6/28/02 11:53 AM Page 284
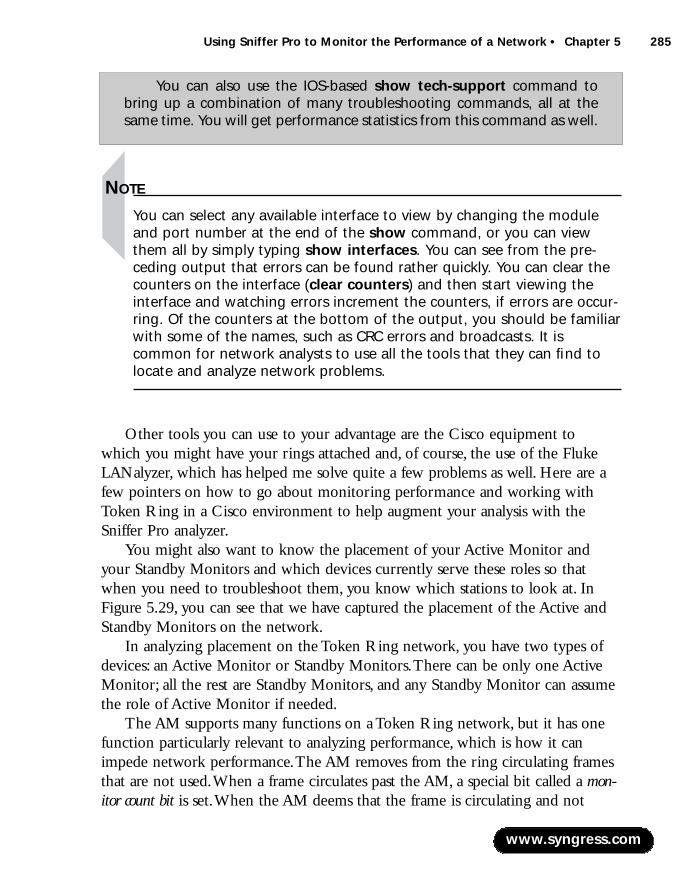
Using Sniffer Pro to Monitor the Performance of a Network • Chapter 5 285
NOTE
You can select any available interface to view by changing the moduleand port number at the end of the show command, or you can viewthem all by simply typing show interfaces. You can see from the pre-ceding output that errors can be found rather quickly. You can clear thecounters on the interface (clear counters) and then start viewing theinterface and watching errors increment the counters, if errors are occur-ring. Of the counters at the bottom of the output, you should be familiarwith some of the names, such as CRC errors and broadcasts. It iscommon for network analysts to use all the tools that they can find tolocate and analyze network problems.
Other tools you can use to your advantage are the Cisco equipment to which you might have your rings attached and, of course, the use of the FlukeLANalyzer, which has helped me solve quite a few problems as well. Here are afew pointers on how to go about monitoring performance and working withToken Ring in a Cisco environment to help augment your analysis with theSniffer Pro analyzer.
You might also want to know the placement of your Active Monitor andyour Standby Monitors and which devices currently serve these roles so thatwhen you need to troubleshoot them, you know which stations to look at. InFigure 5.29, you can see that we have captured the placement of the Active andStandby Monitors on the network.
In analyzing placement on the Token Ring network, you have two types ofdevices: an Active Monitor or Standby Monitors.There can be only one ActiveMonitor; all the rest are Standby Monitors, and any Standby Monitor can assumethe role of Active Monitor if needed.
The AM supports many functions on a Token Ring network, but it has onefunction particularly relevant to analyzing performance, which is how it canimpede network performance.The AM removes from the ring circulating framesthat are not used.When a frame circulates past the AM, a special bit called a mon-itor count bit is set.When the AM deems that the frame is circulating and not
www.syngress.com
You can also use the IOS-based show tech-support command tobring up a combination of many troubleshooting commands, all at thesame time. You will get performance statistics from this command as well.
219_sniffer_05.qxd 6/28/02 11:53 AM Page 285
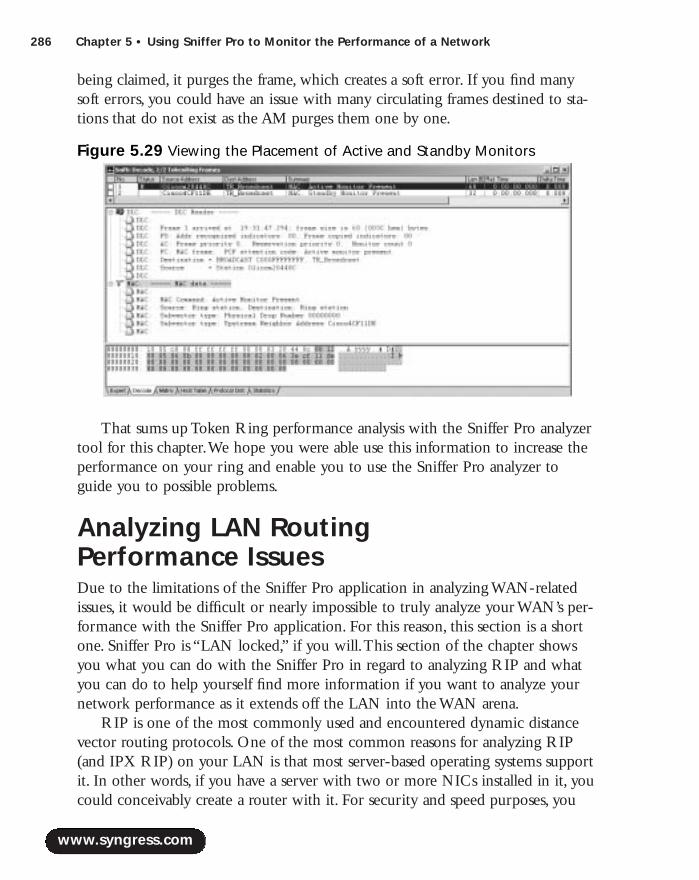
286 Chapter 5 • Using Sniffer Pro to Monitor the Performance of a Network
being claimed, it purges the frame, which creates a soft error. If you find manysoft errors, you could have an issue with many circulating frames destined to sta-tions that do not exist as the AM purges them one by one.
That sums up Token Ring performance analysis with the Sniffer Pro analyzertool for this chapter.We hope you were able use this information to increase theperformance on your ring and enable you to use the Sniffer Pro analyzer toguide you to possible problems.
Analyzing LAN Routing Performance IssuesDue to the limitations of the Sniffer Pro application in analyzing WAN-relatedissues, it would be difficult or nearly impossible to truly analyze your WAN’s per-formance with the Sniffer Pro application. For this reason, this section is a shortone. Sniffer Pro is “LAN locked,” if you will.This section of the chapter showsyou what you can do with the Sniffer Pro in regard to analyzing RIP and whatyou can do to help yourself find more information if you want to analyze yournetwork performance as it extends off the LAN into the WAN arena.
RIP is one of the most commonly used and encountered dynamic distancevector routing protocols. One of the most common reasons for analyzing RIP(and IPX RIP) on your LAN is that most server-based operating systems supportit. In other words, if you have a server with two or more NICs installed in it, youcould conceivably create a router with it. For security and speed purposes, you
www.syngress.com
Figure 5.29 Viewing the Placement of Active and Standby Monitors
219_sniffer_05.qxd 6/28/02 11:53 AM Page 286
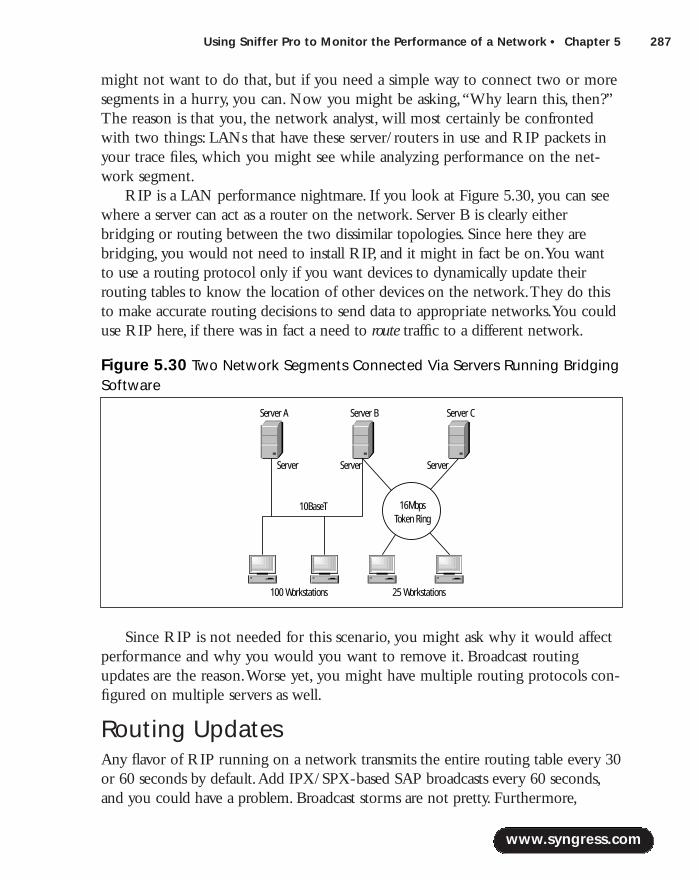
Using Sniffer Pro to Monitor the Performance of a Network • Chapter 5 287
might not want to do that, but if you need a simple way to connect two or moresegments in a hurry, you can. Now you might be asking,“Why learn this, then?”The reason is that you, the network analyst, will most certainly be confrontedwith two things: LANs that have these server/routers in use and RIP packets inyour trace files, which you might see while analyzing performance on the net-work segment.
RIP is a LAN performance nightmare. If you look at Figure 5.30, you can seewhere a server can act as a router on the network. Server B is clearly eitherbridging or routing between the two dissimilar topologies. Since here they arebridging, you would not need to install RIP, and it might in fact be on.You wantto use a routing protocol only if you want devices to dynamically update theirrouting tables to know the location of other devices on the network.They do thisto make accurate routing decisions to send data to appropriate networks.You coulduse RIP here, if there was in fact a need to route traffic to a different network.
Since RIP is not needed for this scenario, you might ask why it would affectperformance and why you would you want to remove it. Broadcast routingupdates are the reason.Worse yet, you might have multiple routing protocols con-figured on multiple servers as well.
Routing UpdatesAny flavor of RIP running on a network transmits the entire routing table every 30or 60 seconds by default.Add IPX/SPX-based SAP broadcasts every 60 seconds,and you could have a problem. Broadcast storms are not pretty. Furthermore,
www.syngress.com
Figure 5.30 Two Network Segments Connected Via Servers Running BridgingSoftware
ServerServer Server
10BaseT
Server A Server B Server C
25 Workstations100 Workstations
Token Ring16Mbps
219_sniffer_05.qxd 6/28/02 11:53 AM Page 287

288 Chapter 5 • Using Sniffer Pro to Monitor the Performance of a Network
routing updates have a 25-entry limit, so if you are pushing 35 routes in yourtables, you will get twice the number of broadcast packets every 30 to 60 seconds,because the rest of the routes still need to be advertised. Now, add the fact that youare running multiple types of RIP at the same time, and things could get hectic onthe wire.
NOTE
Utilization on WAN links should not exceed 70 percent. It is very toughto monitor performance on a WAN without the proper tools and withouthelp from your telco or ISP. Although you can use Sniffer Pro in thisrespect, we feel that this knowledge can only help paint the whole pic-ture of monitoring your network’s performance levels, and WAN links areusually the bottleneck on your network.
To remove RIP from your network to control broadcasts, first verify that youneed RIP.You might need to reconfigure multiple devices so you do not losecommunication with them, but if you do not need RIP, get rid of it.A betteridea is to use static routes; a common static route is the default route. Once youremove the dynamic capabilities of a router to manage its routing table based onwhat it learns, you need to statically add a route to tell the device where to sendits traffic.A common static route is the default (0.0.0.0 0.0.0.0 <next hop>),where next hop is the next device to which you want all outbound traffic to go.
The Sniffer Pro analyzer allows you to analyze RIP in the actual decode cap-tured. In Figure 5.31, you can see that we built a filter to find RIP on our net-work.After the network was analyzed, RIP appeared.
NOTE
You will learn how to create filters in Chapter 6, where you start to lookat how to capture traffic on the network using Sniffer Pro.
You can now see why removing RIP is paramount if it’s not needed, but it isdebatable. Unless you find that RIP updates are pushing your utilization counttoo high, you should not worry so much about it; just be aware that if you needto take away traffic, this is generally a sure bet.
www.syngress.com
219_sniffer_05.qxd 6/28/02 11:53 AM Page 288
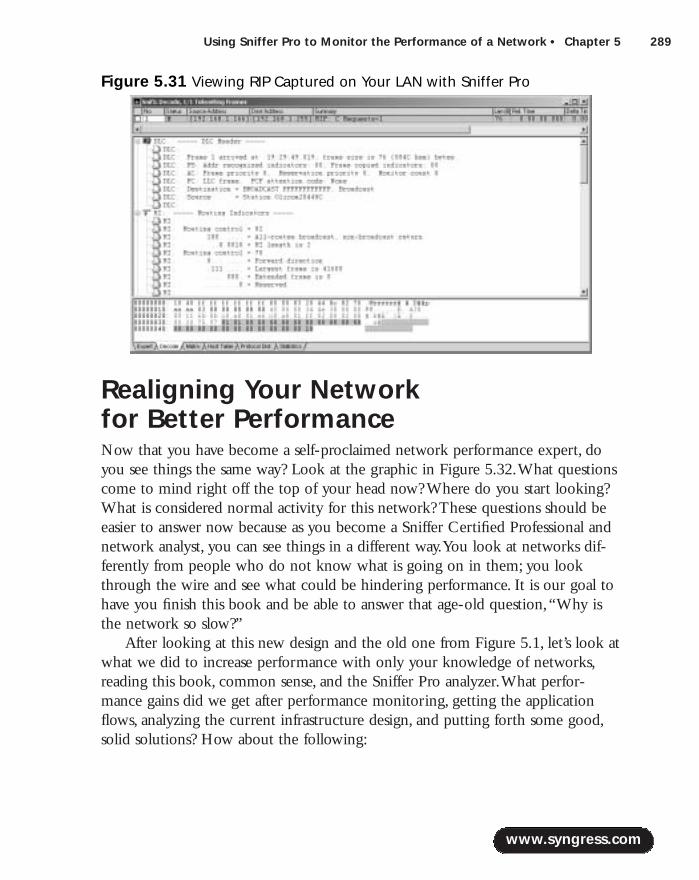
Using Sniffer Pro to Monitor the Performance of a Network • Chapter 5 289
Realigning Your Network for Better PerformanceNow that you have become a self-proclaimed network performance expert, doyou see things the same way? Look at the graphic in Figure 5.32.What questionscome to mind right off the top of your head now? Where do you start looking?What is considered normal activity for this network? These questions should beeasier to answer now because as you become a Sniffer Certified Professional andnetwork analyst, you can see things in a different way.You look at networks dif-ferently from people who do not know what is going on in them; you lookthrough the wire and see what could be hindering performance. It is our goal tohave you finish this book and be able to answer that age-old question,“Why isthe network so slow?”
After looking at this new design and the old one from Figure 5.1, let’s look atwhat we did to increase performance with only your knowledge of networks,reading this book, common sense, and the Sniffer Pro analyzer.What perfor-mance gains did we get after performance monitoring, getting the applicationflows, analyzing the current infrastructure design, and putting forth some good,solid solutions? How about the following:
www.syngress.com
Figure 5.31 Viewing RIP Captured on Your LAN with Sniffer Pro
219_sniffer_05.qxd 6/28/02 11:53 AM Page 289
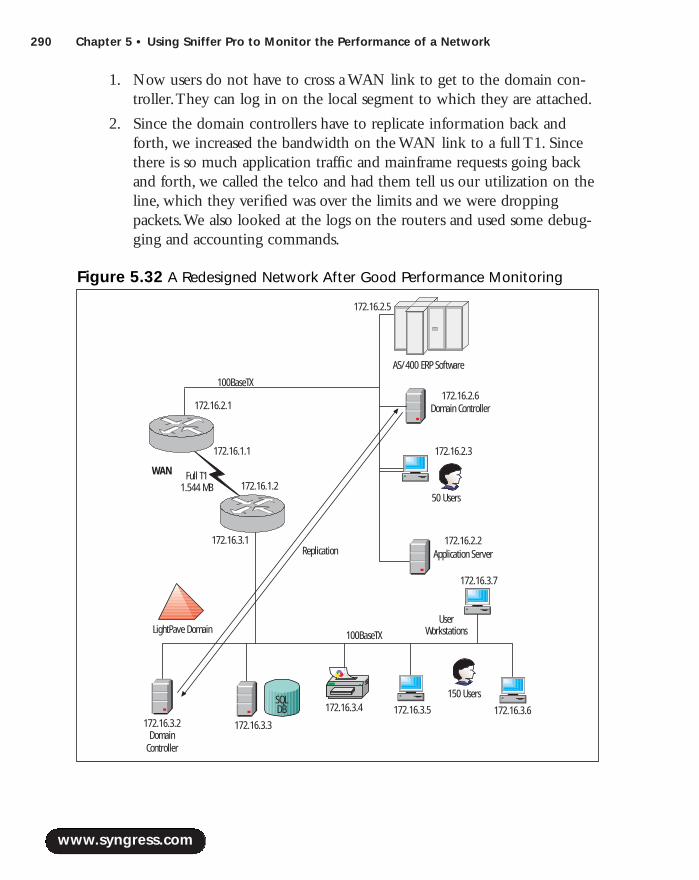
290 Chapter 5 • Using Sniffer Pro to Monitor the Performance of a Network
1. Now users do not have to cross a WAN link to get to the domain con-troller.They can log in on the local segment to which they are attached.
2. Since the domain controllers have to replicate information back andforth, we increased the bandwidth on the WAN link to a full T1. Sincethere is so much application traffic and mainframe requests going backand forth, we called the telco and had them tell us our utilization on theline, which they verified was over the limits and we were droppingpackets.We also looked at the logs on the routers and used some debug-ging and accounting commands.
www.syngress.com
Figure 5.32 A Redesigned Network After Good Performance Monitoring
150 Users
WAN
UserWorkstationsLightPave Domain
172.16.3.2 172.16.3.3172.16.3.5 172.16.3.6
172.16.3.7
172.16.3.1
172.16.1.2
172.16.2.3172.16.1.1
172.16.2.1
172.16.2.5
172.16.2.2
172.16.2.6
172.16.3.4SQLDB
AS/400 ERP Software
100BaseTX
Replication
DomainController
Domain Controller
Application Server
50 Users
100BaseTX
Full T11.544 MB
219_sniffer_05.qxd 6/28/02 11:53 AM Page 290
Using Sniffer Pro to Monitor the Performance of a Network • Chapter 5 291
3. We moved the SQL database application closer to the users who use itmost. Since the users on the 172.16.3.x segment were the biggest usersof the database, we moved it there.We learned that from interviewingthe users on the floor and established application flows and trends.
4. Using System Monitor on the SQL server, we realized that slow perfor-mance was resulting from memory and CPU usage being too high.Theserver was upgraded to 1GB of RAM with dual processors.After a newbaseline, the server is functioning within spec.
5. We also upgraded the 10Mbps LAN segment to which the mainframewas attached up to Fast Ethernet and gave them 10 times faster speed at100Mbps.
6. One of the router Ethernet ports had been damaged from a power surgeand was having intermittent problems, including reboots. Much of theother equipment was experiencing power surge-related problems as well,because it was kept in the closet where the router was located.Afterseeing this and analyzing the router, we replaced it and put all the equip-ment in the closet on a UPS backup system.
7. We removed bindings for unneeded IPX/SPX protocols off the work-stations from the days when they were attaching to a Novell server onthe LAN.We also made sure that the printer was using TCP/IP printingand not IPX/SPX-based SAP, which can cause broadcast problems.
8. We ended the network realignment with a new baseline monitored forone month.We documented the network and labeled peak performancetimes where the network utilization would normally climb or spikeduring business hours.
These improvements show that you need to use a variety of skills to reallyimprove overall performance on a network.We do not want you to believe thatplugging a Sniffer Pro analyzer into a network will solve all your problems. It willhelp you find some of the problems with performance and will give you ideas ofwhat to look for. Inevitably, however, it is the well-rounded analyst who mustpinpoint all the performance problems a network is experiencing and come upwith viable solutions that work and are affordable.This chapter should havehelped you start to think that way so that eventually you will become a master ofsuccessfully monitoring the performance of any network.
www.syngress.com
219_sniffer_05.qxd 6/28/02 11:53 AM Page 291
292 Chapter 5 • Using Sniffer Pro to Monitor the Performance of a Network
SummaryIn this chapter, you will have learned how to be a performance-monitoring guru.You should now feel comfortable looking at networks a different way.You shouldnow feel comfortable facing every situation on the network and performingsome critical analysis on it to find the problems, no matter how deep they run,and use a tool like Sniffer Pro and some good hardcore research to fully isolateand diagnose problems.
This chapter focused on getting you started down that path.This chaptermight also have opened your eyes to what a network looks like and how it per-forms when designed poorly and when designed well. Most performance issuesare the result of poor design. Poor design is encountered far too often to disregard.
Another point this chapter focused on is that you cannot use Sniffer Pro togive you the answers outright; you need to know how to extract those problemswhile using Sniffer Pro as a tool in your arsenal of tools.
This chapter also showed you other ways to monitor performance on yournetwork to augment the use of Sniffer Pro.You learned what a baseline is, how tocreate one, and not to ignore baselining of other devices such as your servers aswell as how to perform basic trending.All these practices are important because,if you do not know how your network performs normally, how do you know itis misbehaving?
In this chapter, you learned how to use the Sniffer Pro analyzer for real-timeanalysis of multiple technologies. Use the Sniffer Pro Dashboard to gather yourbaselines and troubleshooting while referring to the Alarm log based on setthresholds. Lastly, you were shown the advanced problems you can have on yournetwork with Ethernet,Token Ring, and LAN-based routing problems. Using theinformation in this chapter, you should be able to use the Sniffer Pro analyzer todiagnose issues on your LAN.
Solutions Fast Track
Network Performance Issues
! Always try to see if poor network performance is affecting one user,several users, or the entire network. Isolate your problems and nail themdown one at a time, if possible.
www.syngress.com
219_sniffer_05.qxd 6/28/02 11:53 AM Page 292

Using Sniffer Pro to Monitor the Performance of a Network • Chapter 5 293
! Always view network documentation and topology maps, if available, totry to find out whether the initial design itself is causing performanceissues.You need not snap your Sniffer Pro analyzer into the networkimmediately to formulate a clue on where the problems lie; detailedtopology maps speak for themselves.
! When you are initially analyzing performance on a network, it is impor-tant to interview the staff (both users and administrators) to get a solidpicture of network health from a “maintenance performed” point of view.Ask administrators about changes made to the network recently; find outif things had gotten bad at a specific time, and use the information yougather as part of your analysis. Often changes made to a network result inpoor performance, and the staff might be unaware of the cause.
! Always involve your telco or ISP in your overall analysis.Ask for service-level agreements (SLAs) if they’re available and bandwidth utilizationcharts if they keep them.This information will help you get a biggerpicture of possible performance problems.
Real-Time Performance Monitoring with Sniffer Pro
! The Sniffer Pro Dashboard is your tool for real-time network analysis.You can use it to monitor performance of the network segment towhich Sniffer Pro is attached and establish baselining and trending.
! Most performance issues come from recent changes, poor design, orfailing hardware.Although these are common reasons, do not limityourself to them; just make sure you consider them.
! Topology maps and a user community interview help you augment yourperformance assessment.
! When you perform real-time analysis, do not limit yourself to simplylooking at the Sniffer Pro Dashboard; you need to use all your sources ofknowledge and troubleshooting to find, diagnose, and resolve networkperformance issues.
Baselining,Trending, and Change Management
! A baseline is what you call the normal “known” operation of yournetwork, whether it is healthy or not, under daily conditions and
www.syngress.com
219_sniffer_05.qxd 6/28/02 11:53 AM Page 293

294 Chapter 5 • Using Sniffer Pro to Monitor the Performance of a Network
operations.A baseline is critical if you want to be able to diagnoseproblems that come up. If you do not know how your networkfunctions normally, how can you diagnose problems when it does not? Abaseline will help.
! Trends are common events that occur on your network, such as massivetraffic increases during morning logon.Trending is the capturing of thisinformation within the realms of your baseline so you can account forthis decrease in performance as a normal event.
! Change management must be established in your organization so thatchanges to the network are made, monitored, and documented withbackout steps. If you have performance issues that are new, it is commonto look at past logs and changes in your network to diagnose (andhopefully fix) the problems these changes might have created to affectperformance.
Analyzing Ethernet Performance with Sniffer Pro
! You can use the Sniffer Pro Dashboard to monitor your LAN in realtime as well as monitor the bottom-layer protocols that that are presenton the network segment to which Sniffer Pro is attached.Whenconnected to Ethernet, the Dashboard alters itself to monitor Ethernetperformance by giving you only those statistical graphs that pertain tothe Ethernet technology.
! Monitoring Ethernet in real time will help you isolate many errors, suchas high utilization, collisions, and CRC errors or other problems thatyou could experience while monitoring an Ethernet network.
! Using and setting thresholds in conjunction with the Alarm log ishelpful in finding performance issues in real time. Remember that theyare isolated to the segment to which Sniffer Pro is attached.
Analyzing Token Ring Performance with Sniffer Pro
! You can use the Sniffer Pro Dashboard to monitor your LAN in realtime, as well as monitor the bottom-layer protocols that that are presenton the network segment to which Sniffer Pro is attached.Whenconnected to Token Ring, the Dashboard alters itself to monitor the
www.syngress.com
219_sniffer_05.qxd 6/28/02 11:53 AM Page 294

Using Sniffer Pro to Monitor the Performance of a Network • Chapter 5 295
ring’s performance by giving you only those statistical graphs thatpertain to the Token Ring technology.
! Monitoring Token Ring in real time will help you isolate many errorssuch as beaconing, line errors, purging, and other problems you couldexperience on a Token Ring network.
! Using and setting thresholds in conjunction with the Alarm log ishelpful in finding performance issues in real time. Remember that theyare isolated to the ring to which Sniffer Pro is attached.
Analyzing LAN Routing Performance Issues
! The Sniffer Pro Basic analyzer cannot analyze WAN problems, but thereare other ways you can help monitor performance issues on the WANseparating your LAN, using other tools—or better yet, using the routersthemselves.You can also call your telco or ISP to help you monitor yourWAN with the tools in its network operations center (NOC). If youhave add-on products such as the WANbook, you can analyze WAN-based issues as well.
! Routing issues can rear their ugly heads in LAN environments; theseissues include RIP and IPX RIP bound to interfaces and broadcastingon your LAN to create performance issues.You need to be aware ofthem and know how to fix them to increase performance on your LAN.
Realigning Your Network for Better Performance
! Network performance is relative to the design of the network you areanalyzing. Most performance issues come from shoddy network designsimplemented by amateurs or unqualified personnel. Realigning the net-work to proper network design methodologies will, in most cases, increaseperformance, depending on what was affected by the poor design.
! Remove all bottlenecks on your network where you can.You neverwant to have high-speed LANs connecting to a very slow WAN link.
! Look at device placement on your entire network. Look at where usersare logging in, replication of directories, routing protocols, overutilizedand saturated lines, and anything else that will cause poor performanceon the network.Work on redesigning the network to address theseproblems and better the performance on the network.
www.syngress.com
219_sniffer_05.qxd 6/28/02 11:53 AM Page 295

296 Chapter 5 • Using Sniffer Pro to Monitor the Performance of a Network
Q: I am concerned about the accuracy of my analysis. How do I know that I amgoing toward the right solutions to my possible problems?
A: Every network you analyze and perform performance monitoring on willvary in design, configuration, and application flows. Every experience thatyou have had up to the next network you analyze will hopefully be buildingup one important thing: your ability to isolate, diagnose, and resolve any net-work problem on any network.You cannot know it all.That said, you need touse many tools and resources to accurately resolve network performanceissues. Reading this chapter and, more important, this book, will provide youthe tools you need and some expert insight on what steps to take.
Q: While monitoring a network in real time for two weeks and getting randomcaptures, I still can’t find a problem, and the users are still complaining of slownetwork performance. I am starting to feel foolish; is the Sniffer Pro brokenor am I?
A: No, no, no. It is important to view each network performance problem fromthe 100,000-foot level. Have you looked at performance monitoring on theservers? The routers? The switches? Is there anything else you might havemissed? Remember that performance monitoring should never be isolated tolooking at Sniffer Pro and its Dashboard.Think outside the box—get atopology map and start to look elsewhere. Make sure you have the rightdrivers installed on your machine so you can pick up network problems inthe first place. Check your installation configuration against the one inChapter 2 of this book.
Q: While looking at a topology map and seeing a frame relay link with a 16Kcommitted information rate (CIR), I believe my problem might be therouter. It also serves four other remote sites. Before calling the telco, what elsecan I do for performance monitoring? We are using Cisco equipment.
www.syngress.com
Frequently Asked Questions
The following Frequently Asked Questions, answered by the authors of this book,are designed to both measure your understanding of the concepts presented in this chapter and to assist you with real-life implementation of these concepts. Tohave your questions about this chapter answered by the author, browse towww.syngress.com/solutions and click on the “Ask the Author” form.
219_sniffer_05.qxd 6/28/02 11:53 AM Page 296
Using Sniffer Pro to Monitor the Performance of a Network • Chapter 5 297
A: There is much more you can learn from your Cisco hardware (or othervendor hardware you are running). Look at the overall utilization on yourCisco router and memory usage.You could have too many routes in the table.You can use the following commands as a reference, or visit www.cisco.comto gain more information on commands you can use. Show tech-supportalways gives you all the performance information you need. Show processesCPU or show process memory provides you with some insight into theperformance of the device you are using, running standard Cisco IOS.Youcan also view the routing tables, but they depend on the protocol you areusing.You can try show ip route or show ipx route for starters.
Q: I have a massive problem with broadcasts on my network.This chapter says toremove protocols I don’t need or stop dynamic routing. I don’t know whereto start!
A: Good thing you asked—you never want to walk into a client location (oryour own network) and disable them! Always work within your limits as anetwork analyst. Often you might not be well versed in how to solve theproblems; you might be there simply to diagnose them. Never change thingsyou are not sure of.The company might need to be made aware of the pos-sible problems and assign a project team to fix the problems based on yourrecommendations. If you are the network analyst and the engineer in house(most likely you are), you need to do some more research.This chapter wasmeant to point you in the correct direction to help you find and diagnoseperformance problems with Sniffer Pro and make recommendations on howto fix those problems. If you don’t know what you are doing, you might wantto get outside help, do some research on how to fix the problems yourself, ordefer to another person in your IT staff.
Q: I have been a network engineer for about four years. I have gotten more intonetwork analysis and have now sought to become a Sniffer CertifiedProfessional and be able to accurately use the Sniffer Pro analyzer tool todiagnose network problems. My question is, what is the next step after thischapter? What more can I use to augment the information in this chapter?
A: That is a great question. Many technicians today want information spoon-fedto them, not realizing that it is not the information that will save your back, itis the skill of adapting to new environments quickly, learning new informa-tion quickly, and using this information from a 100,000-foot level to accurately
www.syngress.com
219_sniffer_05.qxd 6/28/02 11:53 AM Page 297

298 Chapter 5 • Using Sniffer Pro to Monitor the Performance of a Network
view, pinpoint, and resolve network problems.The most well-rounded indi-viduals will also be able to step in and actually help resolve problems byreconfiguring the devices on the network that might be causing problems. Ifthis chapter wasn’t enough to quench your appetite, you need to start lookinginto outside sources such as server engineering, router and switch design, anddata engineering. Some of the sites you can visit for information arewww.cisco.com (the Network Design sections), www.novell.com (the knowl-edge base and forums), www.microsoft.com (the knowledge base, forums, andTechNet), and www.protocols.com (the protocol dictionary section). Outsidedesign-based research will help you diagnose problems with more accuracyand precision.
www.syngress.com
219_sniffer_05.qxd 6/28/02 11:53 AM Page 298
Capturing NetworkData for Analysis
Solutions in this chapter:
■ Capturing Traffic
■ Saving and Using Captures
■ Capturing and Analyzing AddressResolution Protocol
■ Capturing and Analyzing Internet ControlMessage Protocol
■ Capturing and Analyzing TransmissionControl Protocol
■ Capturing and Analyzing User DatagramProtocol
Chapter 6
299
! Summary
! Solutions Fast Track
! Frequently Asked Questions
219_sniffer_06.qxd 6/28/02 11:55 AM Page 299
300 Chapter 6 • Capturing Network Data for Analysis
IntroductionNow that you have seen how to monitor applications and network performancewith the Sniffer Pro, let’s discuss the actual capturing of data in depth. Until now,you were merely going through the motions of pressing the Start button on theSniffer toolbar and capturing data, stopping the process, and looking at the data.This chapter covers details about capturing data and saving it for later analysis.You need to know how to save and archive capture files for logging and/orfuture baselining.What if you need to download a capture from the Internet tosee what a certain traffic pattern looks like so that you know what you arelooking for on your network? What if an administrator sends you a capture filefor you to analyze from your company’s remote office location? All this is cov-ered in this chapter as we explain how to capture network data for analysis pur-poses.After discussing the specifics of capturing data, we also cover in detail thecapture and analysis of Address Resolution Protocol (ARP), Internet ControlMessage Protocol (ICMP),Transmission Control Protocol (TCP), and UserDatagram Protocol (UDP).
Capturing Traffic As you already know, Sniffer Pro is a great tool to help you capture traffic.Network problems are not a rare thing for a network administrator to experi-ence. Unfortunately, broadcast storms, slow responses, or network attacks happenquite frequently.You have to choose the best way to identify each problem, ana-lyze it, and sort it out. Using Sniffer Pro to capture traffic is one of the fastestways to obtain a complete picture of what is happening on your network, analyzecaptured information, and resolve the issue. It is also possible to capture trafficand to experiment with it, to analyze in a test environment the ways your net-work would react to specific groups of data.
When you use Sniffer Pro, all captured traffic goes straight to the capturebuffer. Captured data can be saved on a hard drive to be used for future referenceand review.
You can also send the captures to your colleagues to share some ideas, or youcan open captures made by somebody else for you. In some cases, you might alsowant to use captured data for baselining purposes.
Besides the ability to capture all the data that is flowing on your network,Sniffer Pro has broad filtering capabilities that greatly facilitate troubleshooting onhighly loaded networks.You can perform filtering by station addresses, data pat-tern, or different protocols.You will learn more about filtering in Chapter 8.
www.syngress.com
219_sniffer_06.qxd 6/28/02 11:55 AM Page 300
www.syngress.com
How to Capture TrafficWhen you capture traffic, it is important for you to make up your mind whetheryou want to capture all the packets Sniffer Pro can see and select interesting onesusing display filters, or whether you want to define a capture filter beforehandand capture only the packets that are related to the problem you are exploring.Both methods have their advantages and disadvantages.
In the first case, when you capture all the traffic, you have more flexibilityafterward because you have a full snapshot of your network’s traffic.There is onedrawback here:Thousands of packets per second can flow through your network,carrying many megabytes of data.
Regardless of how big your hard drive, you probably do not want to storegigabytes of almost useless information on it.This does not mean capturing allthe data is a completely ineffective choice. Capturing all the data on the networkwithout a filter applied allows you to see all the traffic passed over the transmis-sion media, thus giving you a very clear picture of exactly what is there. It allowsyou to “feel” the customer’s network and, in some cases, even resolve the problemthat the customer is complaining about, without using sophisticated filtering andtroubleshooting techniques.
NOTE
You can always apply a filter to a capture buffer after you’ve stopped thecapture process to filter out data that is relevant to the problem you areworking on. You can even apply another filter to the data you to whichhave already applied a filter, to get more granular information. We dis-cuss how to do this later in this chapter.
After you have taken a snapshot of your customer’s network, you might wantto get a more precise picture and start capturing only the data related to theproblem you are troubleshooting. In this case, you can then define a specific cap-ture filter so that you can find particular things you are looking for, making thecapture considerably shorter.This also means that you won’t have to worry aboutyour PC resources. Keep in mind the main disadvantage of this process:Youmight miss something very important if you define an incorrect filter.
Capturing Network Data for Analysis • Chapter 6 301
219_sniffer_06.qxd 6/28/02 11:55 AM Page 301
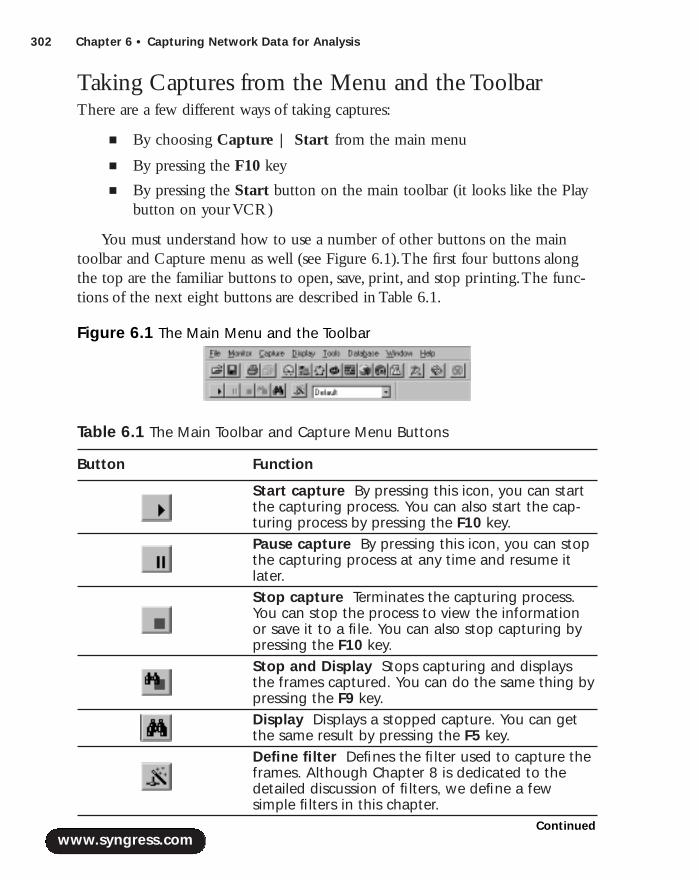
302 Chapter 6 • Capturing Network Data for Analysis
Taking Captures from the Menu and the ToolbarThere are a few different ways of taking captures:
■ By choosing Capture | Start from the main menu
■ By pressing the F10 key
■ By pressing the Start button on the main toolbar (it looks like the Playbutton on your VCR)
You must understand how to use a number of other buttons on the maintoolbar and Capture menu as well (see Figure 6.1).The first four buttons alongthe top are the familiar buttons to open, save, print, and stop printing.The func-tions of the next eight buttons are described in Table 6.1.
Table 6.1 The Main Toolbar and Capture Menu Buttons
Button Function
Start capture By pressing this icon, you can startthe capturing process. You can also start the cap-turing process by pressing the F10 key. Pause capture By pressing this icon, you can stopthe capturing process at any time and resume itlater. Stop capture Terminates the capturing process.You can stop the process to view the informationor save it to a file. You can also stop capturing bypressing the F10 key.Stop and Display Stops capturing and displaysthe frames captured. You can do the same thing bypressing the F9 key.Display Displays a stopped capture. You can getthe same result by pressing the F5 key.Define filter Defines the filter used to capture theframes. Although Chapter 8 is dedicated to thedetailed discussion of filters, we define a fewsimple filters in this chapter.
www.syngress.com
Figure 6.1 The Main Menu and the Toolbar
Continued
219_sniffer_06.qxd 6/28/02 11:55 AM Page 302

Capturing Network Data for Analysis • Chapter 6 303
Select filter Chooses a filter from the list of filtersyou have defined. Capture Panel Brings up the Capture Panel, whichwe discuss in greater detail later in this chapter. Address Book Lets you to assign recognizednames for your network nodes.
Pulling Up the Capture PanelThe Capture Panel is at the center of your capturing process. It gives you all theinformation about the capturing process, such as how many packets have beencaptured, how much space is left in your buffer, and much, much more.
To pull up the Capture Panel, you can either go to the Capture menu andselect Capture Panel or click the Capture Panel button in the main toolbar.
The Capture Panel is very important because it is used to view the status ofthe capture process.At the bottom of the panel are two tabs: Gauge (see Figure6.2) and Detail (see Figure 6.3). On the Gauge tab, you can see two gauges thatshow the following:
■ The number of packets captured
■ How full the buffer is
www.syngress.com
Table 6.1 Continued
Button Function
Figure 6.2 The Capture Panel’s Gauge Tab
219_sniffer_06.qxd 6/28/02 11:55 AM Page 303
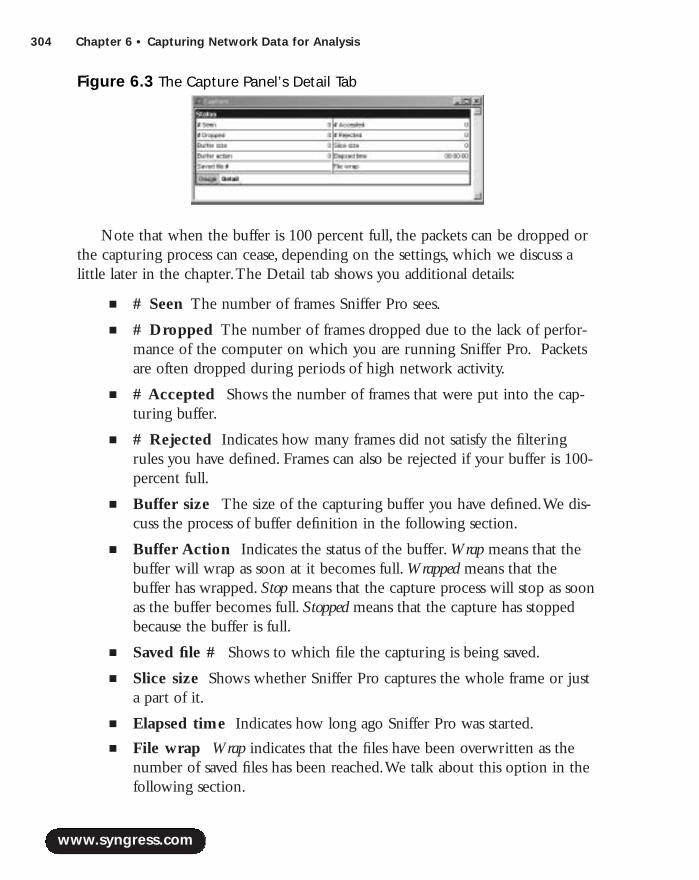
304 Chapter 6 • Capturing Network Data for Analysis
Note that when the buffer is 100 percent full, the packets can be dropped orthe capturing process can cease, depending on the settings, which we discuss alittle later in the chapter.The Detail tab shows you additional details:
■ # Seen The number of frames Sniffer Pro sees.
■ # Dropped The number of frames dropped due to the lack of perfor-mance of the computer on which you are running Sniffer Pro. Packetsare often dropped during periods of high network activity.
■ # Accepted Shows the number of frames that were put into the cap-turing buffer.
■ # Rejected Indicates how many frames did not satisfy the filteringrules you have defined. Frames can also be rejected if your buffer is 100-percent full.
■ Buffer size The size of the capturing buffer you have defined.We dis-cuss the process of buffer definition in the following section.
■ Buffer Action Indicates the status of the buffer. Wrap means that thebuffer will wrap as soon at it becomes full. Wrapped means that thebuffer has wrapped. Stop means that the capture process will stop as soonas the buffer becomes full. Stopped means that the capture has stoppedbecause the buffer is full.
■ Saved file # Shows to which file the capturing is being saved.
■ Slice size Shows whether Sniffer Pro captures the whole frame or justa part of it.
■ Elapsed time Indicates how long ago Sniffer Pro was started.
■ File wrap Wrap indicates that the files have been overwritten as thenumber of saved files has been reached.We talk about this option in thefollowing section.
www.syngress.com
Figure 6.3 The Capture Panel’s Detail Tab
219_sniffer_06.qxd 6/28/02 11:55 AM Page 304

Capturing Network Data for Analysis • Chapter 6 305
NOTE
Please pay attention to the fact that the Capture Panel we have just dis-cussed is not the same as the Sniffer Pro Dashboard, although theirgauge tabs look alike. To access the Capture Panel, select Capture |Capture Panel. To access the Dashboard, select Monitor | Dashboard.
As a Sniffer Pro expert, you should understand that the Capture Panel can bequite useful.You can use it to easily see how many packets have traversed yournetwork since you have started capturing, how many frames were filtered out(rejected), and how many frames Sniffer Pro dropped because your computer didnot have enough resources to capture them.
Saving and Using CapturesIt is very important to know how to save the information you have captured,because you will definitely need to open these captures later for future analysis.As a network analyst, you can spend hours looking into the data that took youonly a few minutes or even seconds to capture! Sometimes you might decide tosend the capture to your colleagues to get a second opinion on a problem youare investigating.
Throughout Sniffer Pro’s evolution, a variety of captured files formats havebeen used. Some of them could support compression; others could not. In addi-tion to the file formats used to save captures, Sniffer Pro uses some other file for-mats for additional information.Table 6.2 lists all these formats.
Table 6.2 Sniffer Pro File Extensions
Extension Description
.CAP Uncompressed capture files
.CAZ Compresses capture files; Sniffer automatically compresses dataif you select this format
.ENC Original format for Ethernet traces
.TRC Original format for Token Ring traces
.FDC Original format for FDDI traces
.ETM Broadcast and functional addresses
www.syngress.com
Continued
219_sniffer_06.qxd 6/28/02 11:55 AM Page 305
306 Chapter 6 • Capturing Network Data for Analysis
.TRM Broadcast and functional addresses
.HST Saved history samples
.CSV Saved history samples
.BTR Token Ring Sniffer Pro table of assigned manufacturer IDs
.BET Ethernet Sniffer Pro table of assigned manufacturer IDs
In addition to understanding various Sniffer Pro formats, you should be ableto distinguish among them and use the formats of other packet analyzers so thatyou can open files captured using other tools.We discuss all these processes indetail in the following sections.
Saving CapturesNow that you know why it is important to save captured data, you need tounderstand how to save this data for future analysis.When using Sniffer Pro, youcould come across a troubleshooting scenario in which you need to remotelycapture data from multiple locations. If this is the case, the versions of Sniffer Procovered in this book (versions 3 and 4) will not allow you to natively perform thistask.You can’t capture traffic on different remote segments with this product, so ifyou need to do that, you might need to purchase an enhanced version of SnifferPro called Sniffer Distributed.This product will allow you to capture traffic on allkey segments of your network using Sniffer Distributed agents. Is there a way youcan circumvent this issue for now and capture the remote traffic? Yes, there is away, but the logistics of doing so could become quite a hassle.You can always asksomeone to capture that data for you (or you can do that with a remotely con-trolled workstation). Once the data is captured, you can upload the capture filesand analyze the captures from the comfort of your own machine.
After you or somebody else has captured the traffic, you need to be able tosave it for future analysis.There are two ways of saving data captures:
■ Manual saving
■ Automatic saving when the capturing buffer is full
Manual saving is very popular because you can view the data you have cap-tured and save it only if you find it necessary to do so.To perform manual saving,you must stop capturing and display the capture buffer (select Capture | Stop
www.syngress.com
Table 6.2 Continued
Extension Description
219_sniffer_06.qxd 6/28/02 11:55 AM Page 306
Capturing Network Data for Analysis • Chapter 6 307
and Display or simply press the F9 button).Then you can actually save the datain your capture buffer.To do so, from the main menu, choose File | Save orSave As.Another alternative is to click the Floppy icon in the main toolbar(refer back to Figure 6.1).A standard Windows Save As dialog window appearson your screen. From here you can select the directory into which you want tosave your capture, the filename, and the extension or type of file. (Refer back toTable 6.2 for the list of known extensions.)
Automatic capture is useful if you want to capture a great deal of data, such asa volume that would not fit into your computer’s memory.Automatic capture isalso helpful if you definitely know that the data you are capturing is required forfuture analysis and you want to save it on your hard drive right away, withoutgoing through the manual-saving process. Before you begin capturing, you mustdefine a special filter profile (although no actual filtering is done here; you saveall the packets you have received).The filter profile allows Sniffer Pro to save thebuffer content to a file.
NOTE
It is usually not a good idea to modify a Default profile because it is usedas a starting point for any new profile you create on your computer. Forthat reason, you should always create a new profile for new filters.
Let’s create a new a new capture profile by following these steps (see Figure 6.4):
1. Select Define Filter from the Capture menu.
2. In the Define Filter window that appears on your screen, press theProfiles button.
3. In the Capture Profiles window, press the New button.
4. Choose an appropriate name for your profile (for example, LightPave),and select OK.
5. Press Done to close the Capture Profiles window.
www.syngress.com
219_sniffer_06.qxd 6/28/02 11:55 AM Page 307
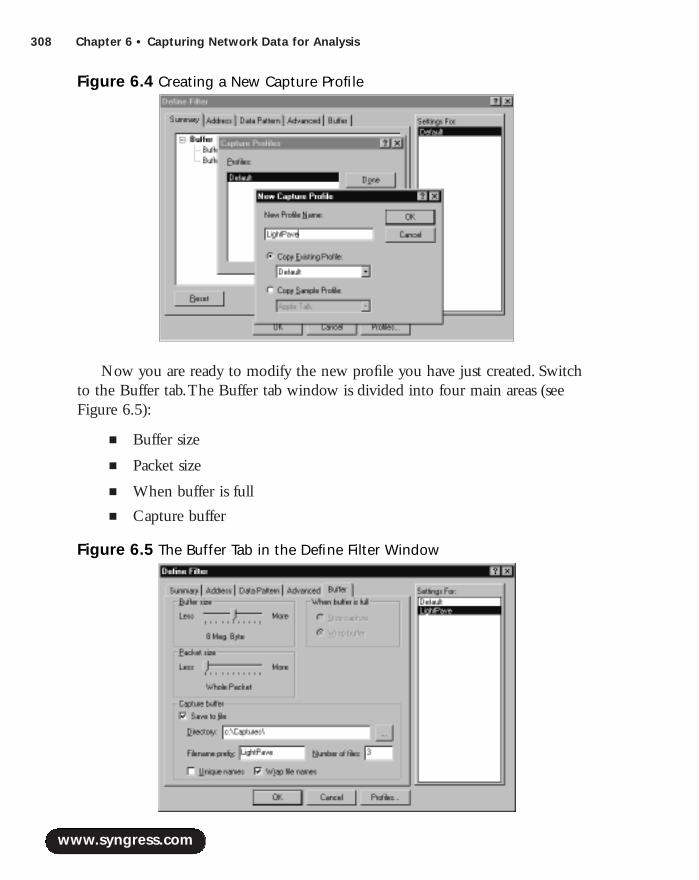
308 Chapter 6 • Capturing Network Data for Analysis
Now you are ready to modify the new profile you have just created. Switchto the Buffer tab.The Buffer tab window is divided into four main areas (seeFigure 6.5):
■ Buffer size
■ Packet size
■ When buffer is full
■ Capture buffer
www.syngress.com
Figure 6.4 Creating a New Capture Profile
Figure 6.5 The Buffer Tab in the Define Filter Window
219_sniffer_06.qxd 6/28/02 11:55 AM Page 308
Capturing Network Data for Analysis • Chapter 6 309
Let’s take a close look at each of these sections.Buffer size allows you to select how much memory on your computer is
actually used for the capture buffer. If your computer has a very limited amountof memory and you overset the buffer size, you can crash your computer orfreeze Sniffer Pro.To avoid this situation, you should decrease the size of thebuffer and use the Save to File option we discuss shortly. Note that the capturebuffer’s default size is 8MB.You can manually modify the buffer size in a rangefrom 256KB to 40MB.The available buffer sizes are:
■ 256KB
■ 512KB
■ 1MB
■ 2MB
■ 4MB
■ 8MB
■ 12MB
■ 16MB
■ 24MB
■ 32MB
■ 40MB
NOTE
You can check how much memory is available for a buffer on your com-puter by executing Task Manager on Windows 2000/NT or SystemMonitor on Windows 98/95. Make sure that the buffer size you haveconfigured does not exceed available memory on your computer. We alsorecommend you close background applications (such as ICQ, OfficePanel, or RealPlayer) to maximize the memory available for Sniffer Pro.Disabling unnecessary Sniffer Pro Expert Objects also allows you to opti-mize memory usage.
For example, if you have a notebook with 96MB of RAM, yourWindows 2000 can use approximately 46MB of the available memoryand Sniffer Pro can use approximately 30MB, so your buffer size can beanywhere between 256KB and 20MB. The standard 8MB buffer size lookslike a good choice in this case.
www.syngress.com
219_sniffer_06.qxd 6/28/02 11:55 AM Page 309
310 Chapter 6 • Capturing Network Data for Analysis
The Packet size option allows you to choose if the whole packet should becaptured (the default option) or only some part of it (between 32 bytes and18,432 bytes).
The When buffer is full option allows you to modify Sniffer Pro’s behaviorin the event that the capture buffer becomes full.The program can either Stopcapture or Wrap buffer and keep capturing data.
To enable automatic saving, choose the Save to File option and specify thefilename prefix as well as the number of files you want to be created on yourhard drive. Indicate the directory to which you want the files to be saved.
Other options you should specify to complete your setup are as follows:
■ Filename prefix Defines a common prefix of saved capture files.
■ Unique names This option specifies whether the analyzer must use aunique filename for each saved file. Sniffer Pro will make sure that thefilenames are unique by assigning three random letters prior to theextension, as shown see in the following example.This option can beuseful if you want to be sure that you don’t overwrite the files you havepreviously captured. Check to make sure that you have enough space onyour hard drive to accommodate all the files.
■ Number of files This option sets the maximum number of files SnifferPro will create on the hard drive.
■ Wrap filenames This option specifies whether the files for this capturecan be overwritten as soon as the number of saved files has beenreached. Disabling of this option tells Sniffer Pro that it should stop cap-turing as soon as it fills its buffer and saves the number of files you havespecified.
To better understand what these options actually do, perform the followingexercise. Modify the new profile you have just created using these options:
1. Type LightPave as the filename prefix.
2. Select 3 as the number of files.
3. Enable the Unique Names option. Do not enable the Wrap file-names option, so Sniffer Pro will stop after the files become full.
4. Specify C:\Capture as the capture buffer directory.
5. Start the capturing process by pressing the F10 key. Sniffer Pro willautomatically stop capturing as soon as three files are filled.
www.syngress.com
219_sniffer_06.qxd 6/28/02 11:55 AM Page 310
Capturing Network Data for Analysis • Chapter 6 311
Now if you look into the C:\Capture directory to which you saved the cap-tures, you will see three files that will look like the following:
■ LightPave001ajr.cap
■ LightPave002ajr.cap
■ LightPave003ajr.cap
LightPave here is the file prefix you chose; 001, 002, and 003 are the file num-bers; and ajr is the randomly generated unique file identifier, so it can be differentif you repeat this exercise.
File TypesTable 6.2 summarized different file types used by Sniffer Pro. Now let’s talk aboutthe file types that are directly related to saving captured data—the ones you canselect while saving your captured data on a hard drive.
When Sniffer Pro was introduced, capture files had extensions that dependedon the type of network adapter used. Ethernet files had an extension *.ENC,Token Ring files had *.TRC, and FDDI files had *.FDC.
With the release of the Windows version of Sniffer Pro, new file formats wereinvented. Now Sniffer Pro uses the same *.CAP format for all types of interfaces.Sniffer Pro saves files in a unified uncompressed format, so the files can grow dra-matically if you capture too much data.To prevent this situation, you can saveyour captures with the *.CAZ extension. In this case, Sniffer Pro automaticallycompresses your data. In the majority of cases, this extension will significantlyreduce the drive space needed to save your captures.
NOTE
For backward compatibility with other versions, Sniffer Pro permits youto save captures in the original Sniffer formats (*.ENC, *.TRC, and *.FDC).
Retrieving and Loading CapturesWhen working with Sniffer Pro, you will find that one of the most difficult andtime-consuming parts of the process is analyzing the captures—whether you tookthem yourself at the client site or someone else sends them to you.To analyze
www.syngress.com
219_sniffer_06.qxd 6/28/02 11:55 AM Page 311

312 Chapter 6 • Capturing Network Data for Analysis
your captures, you must first open the capture files on your workstation.Thereare three different ways to do this:
■ From the main menu, choose File | Open.
■ Use the Open icon located on the main toolbar.
■ Press the Ctrl + O key combination.
Whichever method you choose, the standard MS Windows File Open dialogbox pops up on your screen. From here you can perform all the familiar tasks onthe capture files, such as browsing and changing directories, sorting files by fileextensions, and creating new folders, to name a few.
Capturing and Analyzing Address Resolution ProtocolAddress Resolution Protocol (ARP) is one of the most important protocols inthe LAN environment.ARP allows IP-enabled devices on your network todynamically map physical (MAC) addresses to IP addresses.Without the ARPprocess, the lives of network administrators would be miserable, since they wouldhave to do this task manually!
ARP is described in detail in RFC 826. Let’s briefly examine the way it actually works.
NOTE
As a technician and analyst of networks, you will need a detailed under-standing of ARP and how it functions. Viewing ARP caches on devices isalso critical for the analyst. Because there is no single “magic” commandto check ARP entry on any IP-enabled device, you should remember howto do it on different platforms:
■ Microsoft Windows: arp –a
■ UNIX: arp –a■ Cisco: show arp and show ip arp
Figure 6.6 shows a simple network diagram with two workstations connectedto the same shared Ethernet segment.Workstation A wants to communicate withWorkstation B through the IP protocol on the same LAN segment. It checks thelocal ARP cache for Workstation B’s address, and if no entry is found, it broad-
www.syngress.com
219_sniffer_06.qxd 6/28/02 11:55 AM Page 312

Capturing Network Data for Analysis • Chapter 6 313
casts ARP requests in a special format to see if there is a device associated withthis IP address.
Workstation B replies to Workstation A, indicating that this specific IP addressbelongs to it.Workstation A updates its ARP table and can now communicatewith Workstation B.
Capturing ARP TrafficNow that we’ve talked about the theory involved, let’s turn to actual practice andcapture some ARP traffic. First, we have to find a method to separate ARP trafficfrom other packets on the network.We can use two different methods:
■ Capture all the traffic and afterward filter out the one we are interested in
■ Define a filter beforehand and capture only the traffic we are looking for
As we have already mentioned, both these methods have some pros and consthat we discuss in more detail in Chapter 8. Using capture profiles makes sense ifyou are absolutely sure exactly what information it is that you need for later anal-ysis. If you don’t know what information you need, you might miss somethingvery important because of your filter settings. If you have a capturing buffer thatis big enough to save all the information you capture, it is a good idea to analyze
www.syngress.com
Figure 6.6 The ARP Request/ARP Response Process
Workstation BMAC: 00:01:02:eb:2a:bf
IP: 192.168.2.1
Workstation BMAC: 00:00:86:3e:20:0d
IP: 192.168.2.101 Frame 1: ARP Request
Source MAC: 00:00:86:3e:30:0dDestination MAC: FF:FF:FF:FF:FF:FF
Frame 2: ARP Reply
Source MAC: 00:01:02:eb:2a:bfDestination MAC: 00:00:86:3e:30:0d
219_sniffer_06.qxd 6/28/02 11:55 AM Page 313
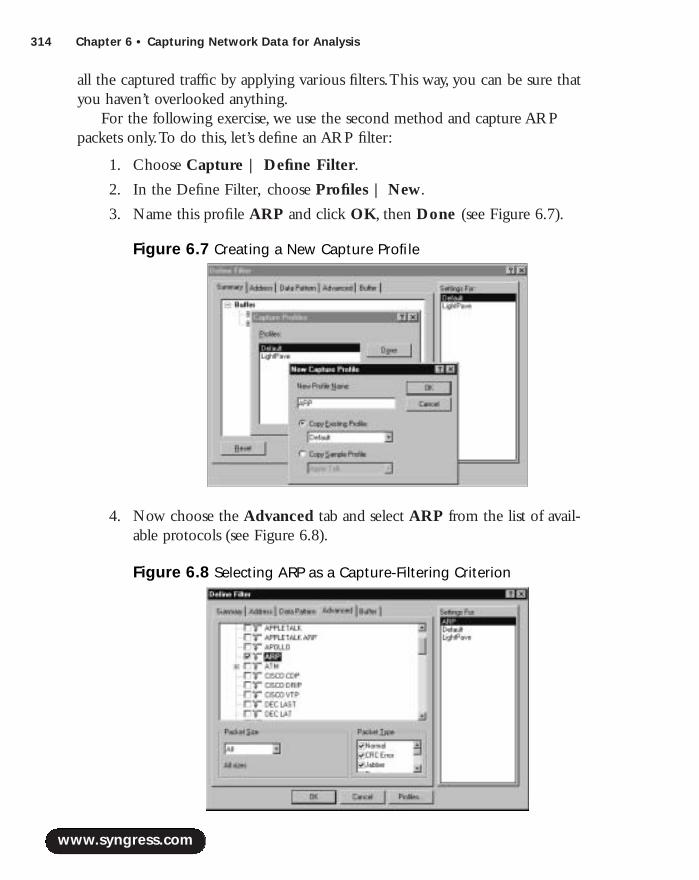
314 Chapter 6 • Capturing Network Data for Analysis
all the captured traffic by applying various filters.This way, you can be sure thatyou haven’t overlooked anything.
For the following exercise, we use the second method and capture ARPpackets only.To do this, let’s define an ARP filter:
1. Choose Capture | Define Filter.
2. In the Define Filter, choose Profiles | New.
3. Name this profile ARP and click OK, then Done (see Figure 6.7).
4. Now choose the Advanced tab and select ARP from the list of avail-able protocols (see Figure 6.8).
www.syngress.com
Figure 6.7 Creating a New Capture Profile
Figure 6.8 Selecting ARP as a Capture-Filtering Criterion
219_sniffer_06.qxd 6/28/02 11:55 AM Page 314

Capturing Network Data for Analysis • Chapter 6 315
5. Click OK to close the Define Filter window.We have defined the filter,so now we can capture some traffic by pressing the F10 key.
6. Clear the ARP entry for your default gateway by typing arp –d IP,where IP is your default gateway’s IP address, and ping your defaultgateway.
7. Stop capturing and open the Decode window.You should see at leasttwo captured frames (assuming that you have connectivity to yourdefault gateway).The results, shown in Figure 6.9, are analyzed in thefollowing section.
NOTE
Clearing an ARP cache is not dangerous to your network; in fact, it couldsolve some of your troubleshooting problems. Clearing an ARP cache canbe useful if, for example, you have replaced network cards on some ofyour network devices, causing MAC addresses to change. Although mostnetwork devices have a special mechanism that ages out ARP entries, youcan manually speed up this process by executing the following commands:
www.syngress.com
Figure 6.9 ARP Request/Reply Frames
219_sniffer_06.qxd 6/28/02 11:55 AM Page 315
316 Chapter 6 • Capturing Network Data for Analysis
■ Microsoft Windows 2000: arp –d
■ UNIX: arp –d –a■ Cisco routers: clear arp
The only negative thing that clearing an ARP cache will do is generatesome broadcast traffic so the device can build up the table again.
Analyzing the CaptureAs shown in Figure 6.9, we can see two frames in the Summary pane:ARPrequest and ARP reply.They are explained in the Detail pane underneath, so let’stake a look at that pane.The DLC header shows the time when the frame capturearrived (it’s not actually a part of the frame; Sniffer Pro simply provides you withthis additional information).The fields that are actually part of the frame are:
■ Size of the frame in bytes
■ Destination of the frame (FFFFFFFFFF—all stations’ broadcast address)
■ Source, the MAC address of the frame
■ EtherType, the upper-layer protocol
NOTE
The EtherType field indicates which upper-layer protocol’s data is encap-sulated into the Ethernet frame. In Ethernet II frames, the EtherType fieldfollows the Source Address field; in 802.2 frames with SNAP headers, theEtherType field follows the OUI field.
You can find a list of EtherType values at www.wildpackets.com/compendium/REF/REF-Etyp.html.
The ARP/RARP frame display presents information related to the ARPrequest itself:
■ Hardware type = 1 Type of media Sniffer Pro is connected to.
■ Protocol Type = 0800 (IP) Upper-layer protocol that originated thisrequested.
www.syngress.com
219_sniffer_06.qxd 6/28/02 11:55 AM Page 316
Capturing Network Data for Analysis • Chapter 6 317
■ Length of hardware address = 6 bytes Length of MAC address forthis media (6 bytes for Ethernet).
■ Length of protocol address = 4 bytes Length of the high-level protocol address (8 bytes for IP).
■ Opcode = 1 (ARP request) Type of ARP frame.
■ Sender’s hardware address = 0000863E200D Sender’s MACaddress.
■ Sender’s protocol address = 192.168.2.101 Sender’s IP address.
■ Target hardware address = 000000000000 Target’s MAC address.Please note that this address is set to all zeroes.The requestor doesn’thave this information; this is actually the information the requestor istrying to find through ARP.
■ Target protocol address = 192.168.2.1 Target’s IP address.
Now that the first frame has been captured and analyzed, let’s look at thesecond frame. Remember that the main difference here is that the first ARPframe captured was a Request (Opcode 1) sent out as a “broadcast” and that thenext ARP frame, which was a Reply (Opcode 2), was sent directly as a Unicastpacket. In other words, the reply was sent directly to the requestor to reduce thebroadcast traffic on the network.
www.syngress.com
ARP Troubleshooting with SnifferAfter having learned all these things about capturing traffic, you areprobably eager to learn ways to detect a real problem. Let’s take a lookat an example of a commonly encountered problem on the network thatyou can easily troubleshoot if you know how to capture and analyze ARPpackets—a situation in which there are duplicate IP address problems.This can be a nightmare for a network administrator who is not familiarwith this issue or does not know how to troubleshoot it; it can causeintermediate loss of connectivity to specific destinations for some or allnetwork devices.
Configuring & Implementing…
Continued
219_sniffer_06.qxd 6/28/02 11:55 AM Page 317

318 Chapter 6 • Capturing Network Data for Analysis
Capturing and Analyzing InternetControl Message ProtocolInternet Control Message Protocol (ICMP), described in RFC 792 and part ofthe TCP/IP protocol stack, is an error reporting and control-based protocol usedbetween network devices. ICMP messages are encapsulated into IP datagrams, sowe also cover the IP header in this section. ICMP is a very powerful tool thatallows us to report over 20 various network conditions. (You can also visitwww.protocols.com to get more information about ICMP.) Let’s look at the combi-nation of echo request and echo reply messages as an example.
Capturing ICMP Traffic To divide ICMP traffic from the rest of the traffic on the network, let’s define anew capture filter:
www.syngress.com
In most cases, duplicated IPs are caused by misconfiguration of anetwork device, when two or more devices on the network are assignedthe same IP address. This can also be caused by misconfiguration or mal-functioning of DHCP servers on a segment. Being able to use Sniffer Procorrectly makes troubleshooting this problem a piece of cake.
Start capturing packets with the ARP filter defined, clear your ARPcache, and run a ping to the destination in question. If you are reallyexperiencing the duplicated IP addresses problem, you will see two ormore responses to a single ARP from different devices, as shown inFigure 6.10.
Now, knowing MAC addresses of the devices that erroneously try toshare the same IP address, you can track their exact locations. (Mostmodern switches allow you to view which particular port has a networkdevice with a specific MAC address connected to it.) Once you know thelocation, you can go there and fix the problem.
You can also choose Discovered Addresses from the Displaymenu. In the Discovered Addresses window, you should be able to finda duplicate address that causes the problem.
Figure 6.10 The Duplicate IP Addresses Problem
219_sniffer_06.qxd 6/28/02 11:55 AM Page 318

Capturing Network Data for Analysis • Chapter 6 319
1. Choose Capture | Define Filter.
2. Select Profiles, and in the Capture Profiles window, select New.
3. Choose ICMP as a new profile name. Here is a trick: Sniffer Pro alreadyhas a predefined profile that filters ICMP only, so instead of creatingyour own filter, you can choose the predefined one. Select CopySample Profile, select IP/ICMP, and press OK.
4. Click Done in the Capture Profiles window and OK in the DefineFilter window.
5. Press the F10 key to start capturing, and send a few pings to your defaultgateway. Stop capturing by pressing F9 and select the Decode tab.
www.syngress.com
Be Prepared for OutagesIf your client is experiencing some technical difficulties, you must resolvethe situation efficiently. To do that, you have to capture and analyze thetraffic on your network. The faster and more thoroughly you captureand analyze the traffic, the earlier you can detect and eliminate theproblem.
As soon as you arrive on site (armed with your laptop that hasSniffer Pro on it, of course) at a location where a client is experiencingnetwork problems, start diagramming locations, closets, traffic flows,and IP schemes. The first and one of the most important steps inproblem resolution is to get accurate documentation so that you canunderstand your customer’s network topology. In addition, make surethat you have familiarized yourself with the equipment your client usesbefore you take immediate action.
We also recommend that you make sure that the computer onwhich you are running Sniffer Pro has enough resources (CPU, memory,hard drive space) to be able to capture all the traffic without packetdrops due to a lack of performance on the part of your computer.
It can be also a good idea to create a few capture filters for the mostimportant applications for your customers well in advance. In today’s net-works, millions of packets can traverse the network equipment everysecond, and most of them are not related to the problem your customeris experiencing. For that reason, defining appropriate capture filtersbeforehand can save precious time during a network outage.
Designing & Planning…
219_sniffer_06.qxd 6/28/02 11:55 AM Page 319

320 Chapter 6 • Capturing Network Data for Analysis
Analyzing the CaptureAs we mentioned earlier, ICMP messages are encapsulated into IP datagrams,which are then encapsulated into an Ethernet frame.Therefore, to completelyanalyze a single ICMP packet, we have to look into all three parts of the packetto understand three different headers: the DLC header, the IP header, and theICMP header.
The DLC header looks exactly like a header of the ARP reply frame wealready discussed.The only difference is the EtherType field—for IP, it is 0800 (in hex format).
The IP header is much more interesting to us. Before you read the followingparagraph that explains the IP header, we encourage you to spend some timereviewing IP frame format at the following link: www.cisco.com/univercd/cc/td/doc/cisintwk/ito_doc/ip.htm.You can also visit www.protocols.com for moreinformation on IP.
Figure 6.11 shows the IP header part of the frame.
The following points explain the IP header fields that are not self-explanatory:
■ Version = 4 The IP protocol version always equals 4 for IPv4 frames.
■ Header length = 20 bytes This field specifies the length of the IPframe’s header.You will typically see it as 20 bytes, which indicates thatno IP options are specified.
■ Type of service = 00 The Type of Service byte shows the ways thecurrent datagram is supposed to be handled.The first 3 bits of the byte
www.syngress.com
Figure 6.11 The IP Header
219_sniffer_06.qxd 6/28/02 11:55 AM Page 320
Capturing Network Data for Analysis • Chapter 6 321
specify datagram importance.This value ranges from 0 (routine) to 7(network control).The next 3 bytes show if the application has specialrequirements to the path this datagram will take through the network.An application can require low delay, high throughput, high reliability, ora combination of these three requirements by setting corresponding bitsto 1.The last 2 bits are defined for congestion control and are rarelyused. Note that most routers are not configured to handle the Type ofService byte and simply ignore it. In the case of the ping, there are nospecial requirements for importance, delay, throughput, or reliability, soall these values are set to 0.
■ Total length = 60 bytes The Total length field indicates the length ofthe IP datagram, measured in bytes. It includes the length of the IPheader and the IP payload, but it does not include the length of theheader of the underlying Layer 2 protocol.The Total length field is 16bits, which gives us a maximum possible size of an IP frame of 65,535bytes. Most applications choose an IP frame size in such a way that eachIP packet fits into a single Layer 2 packet, the size of which is limited toan MTU size for the particular media. MTU for all well-known mediatoday does not exceed 65,535 bytes (typically MTU is much smallerthan that), so the maximum length of the IP packet is not a severe limi-tation for today’s networks.
■ Identification = 3707 The Identification field is one of the threefields that control fragmentation and reassembly of an IP packet. (Twoothers, Flags and Fragment offset, are discussed in later in the chapter).Identification is represented by a 2-byte integer number generated bythe packet’s source to identify the current datagram.
■ Flags = 0X Two low-order bits of the Flags field control fragmenta-tion of the packet. Setting the first of these 2 bits to 0 permits the frag-mentation of the packet. If the bit is set to 1, it cannot be fragmentedalong the path and will be discarded by a router if the packet is too bigto fit into a single frame.A special ICMP message,“Fragmentationneeded and DF set,” will be sent back to the source to report theproblem.This flag is very important for troubleshooting, especially if youwant to find the maxim MTU size between the source and the destina-tion.While doing an extended ping from the enabled mode on a Ciscorouter, you can manually set this bit.The last bit in the Flags field showswhether this is the last fragment of the datagram or more fragments will
www.syngress.com
219_sniffer_06.qxd 6/28/02 11:55 AM Page 321

322 Chapter 6 • Capturing Network Data for Analysis
follow. In our example, the packet can be fragmented along the path ifnecessary; this is the last (and only) fragment of the IP packet.
■ Fragment offset = 0 bytes The last of the three fields controllingfragmentation and reassembly of an IP packet is Fragment offset. It spec-ifies the position of the fragment data relative to the data in the originalpacket that allows the receiver to properly reassemble the IP packet.
NOTE
Remember that fragmented IP packets are always reassembled by a des-tination device, never by the routers along the path.
■ Time to live = 32 The Time to Live (TTL) field indicates how manyhops the datagram can go through before it will be discarded.This valuevaries depending on the application and the operating system on asource device.
■ Protocol =1 This field indicates which upper-layer protocol is encap-sulated into the datagram.The current value (1) shows that this is anICMP packet.
■ Header checksum=B150 The Header Checksum field validates theintegrity of the IP header. Note that the IP packet’s payload is notincluded in this computation, so higher-layer protocols and/or applica-tions must use their own mechanisms to ensure integrity of the data.
■ Source IP Address = 192.168.2.101 The IP address of the sourcedevice.
■ Destination IP Address = 192.168.2.1 The IP address of the desti-nation device.
The last header we need to discuss is the ICMP header, shown in Figure 6.12.Let’s talk about certain ICMP header fields now:
■ Type = 8 There are two possible types of ICMP Echo.Type 8 is desig-nated for echo requests and Type 0 for echo replies.
■ Code = 0 This field is not currently used in ICMP Echo messages andis always set to 0.
www.syngress.com
219_sniffer_06.qxd 6/28/02 11:55 AM Page 322
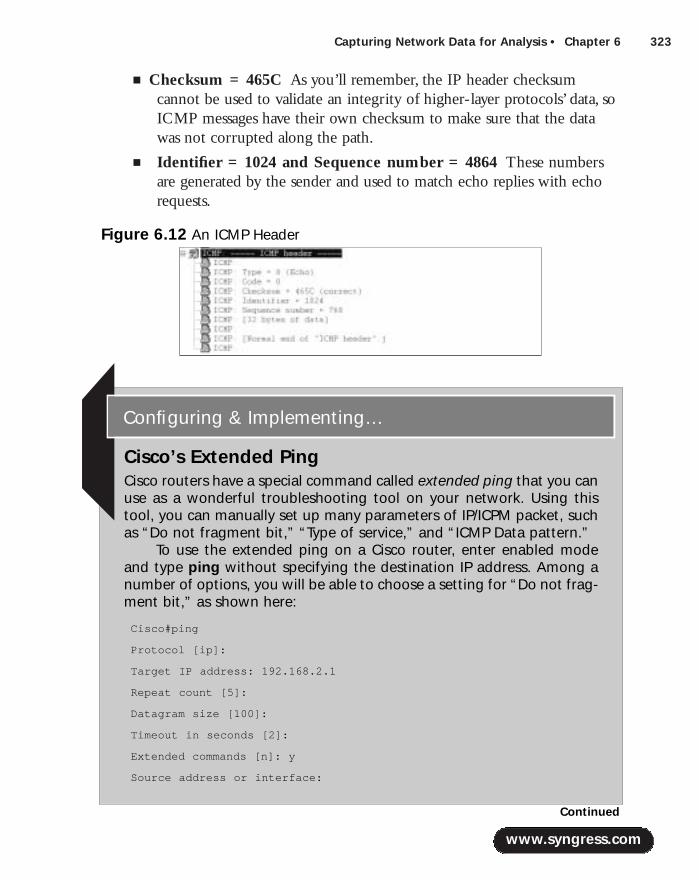
Capturing Network Data for Analysis • Chapter 6 323
■ Checksum = 465C As you’ll remember, the IP header checksumcannot be used to validate an integrity of higher-layer protocols’ data, soICMP messages have their own checksum to make sure that the datawas not corrupted along the path.
■ Identifier = 1024 and Sequence number = 4864 These numbersare generated by the sender and used to match echo replies with echorequests.
www.syngress.com
Cisco’s Extended PingCisco routers have a special command called extended ping that you canuse as a wonderful troubleshooting tool on your network. Using thistool, you can manually set up many parameters of IP/ICPM packet, suchas “Do not fragment bit,” “Type of service,” and “ICMP Data pattern.”
To use the extended ping on a Cisco router, enter enabled modeand type ping without specifying the destination IP address. Among anumber of options, you will be able to choose a setting for “Do not frag-ment bit,” as shown here:
Cisco#ping
Protocol [ip]:
Target IP address: 192.168.2.1
Repeat count [5]:
Datagram size [100]:
Timeout in seconds [2]:
Extended commands [n]: y
Source address or interface:
Configuring & Implementing…
Figure 6.12 An ICMP Header
Continued
219_sniffer_06.qxd 6/28/02 11:55 AM Page 323

324 Chapter 6 • Capturing Network Data for Analysis
We have analyzed only one type out of the large number of different ICMPmessages.Table 6.3 summarizes other types of ICMP frames used today. Use thistable as a reference while troubleshooting ICMP-related problems.
Table 6.3 ICMP Message Types
Type Code Description
0 Echo reply3 Destination unreachable3 0 Network unreachable3 1 Host unreachable3 2 Protocol unreachable3 3 Port unreachable3 4 Fragmentation needed and DF set3 5 Source route failed3 6 Destination network unknown3 7 Destination host unknown3 8 Source host isolated3 9 Communication with destination network administratively
prohibited3 10 Communication with destination host administratively
prohibited3 11 Network unreachable for type of service3 12 Network unreachable for type of service4 Source quench5 IP redirect5 0 Redirect datagram for the network5 1 Redirect datagram for the host
www.syngress.com
Type of service [0]:
Set DF bit in IP header? [no]: yes
Validate reply data? [no]:
Data pattern [0xABCD]:
Loose, Strict, Record, Timestamp, Verbose[none]:
Sweep range of sizes [n]:
Continued
219_sniffer_06.qxd 6/28/02 11:55 AM Page 324
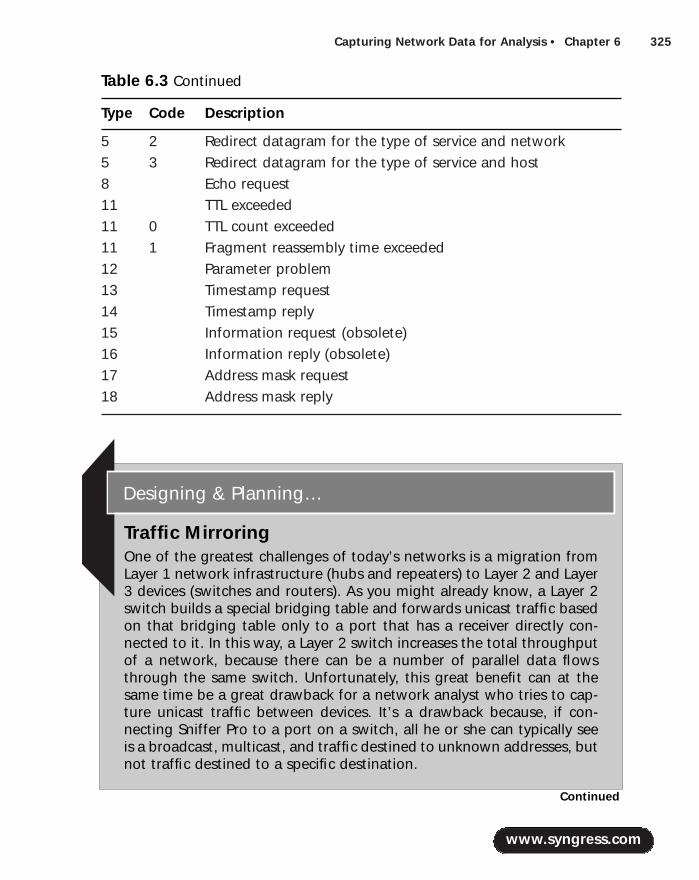
Capturing Network Data for Analysis • Chapter 6 325
5 2 Redirect datagram for the type of service and network5 3 Redirect datagram for the type of service and host8 Echo request11 TTL exceeded11 0 TTL count exceeded11 1 Fragment reassembly time exceeded12 Parameter problem13 Timestamp request14 Timestamp reply15 Information request (obsolete)16 Information reply (obsolete)17 Address mask request18 Address mask reply
www.syngress.com
Table 6.3 Continued
Type Code Description
Traffic MirroringOne of the greatest challenges of today’s networks is a migration fromLayer 1 network infrastructure (hubs and repeaters) to Layer 2 and Layer3 devices (switches and routers). As you might already know, a Layer 2switch builds a special bridging table and forwards unicast traffic basedon that bridging table only to a port that has a receiver directly con-nected to it. In this way, a Layer 2 switch increases the total throughputof a network, because there can be a number of parallel data flowsthrough the same switch. Unfortunately, this great benefit can at thesame time be a great drawback for a network analyst who tries to cap-ture unicast traffic between devices. It’s a drawback because, if con-necting Sniffer Pro to a port on a switch, all he or she can typically seeis a broadcast, multicast, and traffic destined to unknown addresses, butnot traffic destined to a specific destination.
Designing & Planning…
Continued
219_sniffer_06.qxd 6/28/02 11:55 AM Page 325
326 Chapter 6 • Capturing Network Data for Analysis
Capturing and Analyzing Transmission Control ProtocolTransmission Control Protocol (TCP) is the most popular Layer 4 protocol on theInternet.As more and more enterprises migrate from other legacy protocols intheir LANs such as IPX and AppleTalk to TCP/IP, IP traffic starts to dominate andperhaps will eventually be the only protocol to use.The reason for this takeover isIP’s worldwide acceptance on the Internet.We already learned that TCP/IP is a
www.syngress.com
Now you may ask, how can we overcome this limitation? There area few ways of doing so:
■ Port mirroring You can configure your switch in such a waythat it will send all the traffic destined to or received fromone port to another port on the switch. Unfortunately, theway you can turn on mirroring is different for different ven-dors, and not all network switches support this capability.With Cisco switches running Cisco IOS, use the followingcommand on an interface to enable mirroring: port monitor[interface | vlan vlan-id]
On a Cisco switch running Cisco CatOS, use the followingcommand: set span {src_mod/src_ports | src_vlan | sc0}dest_mod/dest_port [rx | tx | both]
For example, if you want to both transmit and receivedata from port 1/10 to be mirrored to port 3/1, use the following command: set span 1/1 2/1
■ Circuit mirroring This method mirrors all traffic exchangedbetween two ports to a specific port.
■ Segment tap This method mirrors all traffic on all ports ofthe switch to a specific port. Note that some of the packetsmight be dropped if the total traffic going through theswitch exceeds the throughput of the port.
■ Ethernet tap splitters These are special devices that allowyou to monitor traffic between two network devices withoutreconfiguring your switch. For example, you can install thesplitter between a server and a switch, connect your SnifferPro to the splitter, and capture all the traffic destined to or originated from the server. Visit www.netoptics.com/net-96135.html to see an example of an Ethernet splitter.
219_sniffer_06.qxd 6/28/02 11:55 AM Page 326
Capturing Network Data for Analysis • Chapter 6 327
protocol suite and that TCP is a Layer 4 protocol within this suite. Employing aspecial mechanism called positive acknowledgment with retransmission, TCP provides areliable transmission of data. Many Internet services, such as HTTP, FTP, SMTP,and Telnet, rely on TCP for their data transmission. Moreover, many traditionalLAN applications such as file transfer and SQL queries also employ TCP/IP.Therefore, troubleshooting TCP-related issues is one of the most common tasks for a network analyst.
NOTE
You should also remember that most well-known applications haveTCP/UDP port numbers reserved for them. You can get a list of theassigned numbers in RFC 1700 at the following link: www.merit.edu/internet/documents/rfc/rfc1700.txt.
Capturing TCP TrafficYou might have already noticed that capturing traffic is a required but not a suffi-cient step in troubleshooting a network issue.This fact is especially noticeable inthe case of TCP traffic.Although defining a proper filter and capturing packetsrelated to the problem you are solving could be difficult tasks, understanding thecapture and drawing a conclusion are usually more challenging if you are dealingwith TCP traffic.
But let’s start from the beginning.We commence with defining a TCP filter,capturing TCP traffic, analyzing it, and pointing to issues you might experienceon your network.As usual, to capture TCP traffic, we create a new capture filtercalled TCP.To do so:
1. Go to Capture | Define Filter. In the Define Filter window, clickProfiles | New.
2. In the New Capture Profile window, specify the new profile name(TCP) and click OK, then Done.
3. Switching to the Advanced tab, you will see a list of the available pro-tocols. Click the plus sign (+) beside the IP protocol title, scroll down toTCP, and select it (see Figure 6.13).
4. Click OK to close the Define Filter window.
5. You can start capturing TCP traffic now by pressing F10.
www.syngress.com
219_sniffer_06.qxd 6/28/02 11:55 AM Page 327

328 Chapter 6 • Capturing Network Data for Analysis
NOTE
If you are connected to a heavy-loaded LAN segment with a large numberof packets traversing it, your Sniffer Pro’s capture buffer can becomeoverrun and fill up past the buffer in a manner of minutes because TCPtraffic consumes the greater part of overall traffic in today’s networks.Make sure that you set your capture buffer accordingly; you don’t want tomake it larger than the available memory on your workstation. To avoidthis situation, you can use more sophisticated capture filters or make surethat you load your Sniffer Pro workstation or laptop with enough memoryto handle the high buffer memory levels. Not adhering to this recommen-dation will possibly crash your machine if available memory is exceeded.Capture filters are discussed in more detail in Chapter 8.
As soon as we have defined a TCP filter, we can move to the next step:Capturing some traffic. In the next example, we connect Sniffer Pro to a corpo-rate LAN and capture some FTP traffic.We selected FTP from a number ofother TCP-based applications to show you how insecure FTP sessions are andhow easily an intruder with some knowledge of Sniffer Pro can capture an FTPpassword and gain access to your servers.
In our example, the user with login name topsecret connects from a worksta-tion that has an IP address 192.168.2.101 to an FTP server with the IP address192.168.2.1.The user obtains a list of files in the directory by executing the lscommand and closes the session using the quit command. Our task is to under-
www.syngress.com
Figure 6.13 Defining a TCP Filter
219_sniffer_06.qxd 6/28/02 11:55 AM Page 328
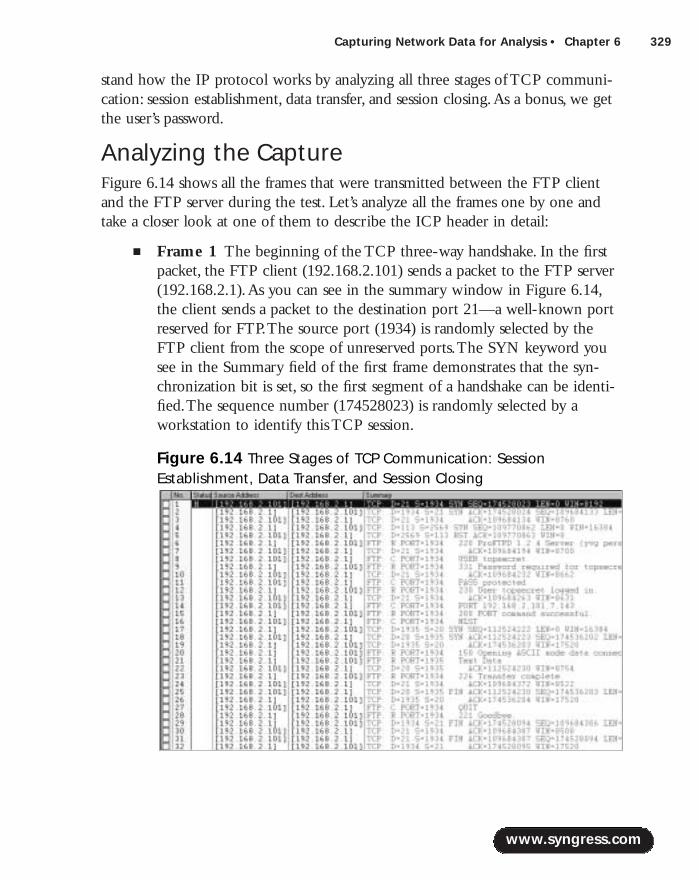
Capturing Network Data for Analysis • Chapter 6 329
stand how the IP protocol works by analyzing all three stages of TCP communi-cation: session establishment, data transfer, and session closing.As a bonus, we getthe user’s password.
Analyzing the CaptureFigure 6.14 shows all the frames that were transmitted between the FTP clientand the FTP server during the test. Let’s analyze all the frames one by one andtake a closer look at one of them to describe the ICP header in detail:
■ Frame 1 The beginning of the TCP three-way handshake. In the firstpacket, the FTP client (192.168.2.101) sends a packet to the FTP server(192.168.2.1).As you can see in the summary window in Figure 6.14,the client sends a packet to the destination port 21—a well-known portreserved for FTP.The source port (1934) is randomly selected by theFTP client from the scope of unreserved ports.The SYN keyword yousee in the Summary field of the first frame demonstrates that the syn-chronization bit is set, so the first segment of a handshake can be identi-fied.The sequence number (174528023) is randomly selected by aworkstation to identify this TCP session.
www.syngress.com
Figure 6.14 Three Stages of TCP Communication: SessionEstablishment, Data Transfer, and Session Closing
219_sniffer_06.qxd 6/28/02 11:55 AM Page 329

330 Chapter 6 • Capturing Network Data for Analysis
■ Frame 2 The second frame of the three-way handshake.The serveracknowledges the session by sending the frame with acknowledgmentnumber (174528024), which is one unit bigger than the sequencenumber (174528023) that was originally sent by the client.The serveralso includes its own unique, randomly chosen sequence number(109684133) to identify the session.
■ Frame 3 The last frame of the three-way handshake.The workstationconfirms the receipt of the synchronization frame from the server bysending an acknowledgment packet (ACK=109684134).That’s it—thesession is established. Now the server and the workstation can exchangedata.
■ Frame 4 This frame is not directly related to the TCP session we areanalyzing right now. It is a part of another TCP conversation originatedby the FTP server. In this frame, the server contacts a well-known port(113), where the authentication server resides.The FTP server is tryingto get some information about the client, although the client hasn’t eventyped a username yet! Here we see an attribute of a new TCP session:the synchronization (SYN) bit is set.
■ Frame 5 The workstation that originated FTP communication is notrunning authentication service, so there is no active service on port 113and no application can answer the authentication request.Therefore, thenew TCP session cannot be established.The workstation’s TCP/IP stackis replying to the server with a reset (RST) packet to terminate thisnever-established TCP communication.
■ Frame 6 As we remember, the three-way handshake between theworkstation and the server is already completed, so some real data can betransferred.This frame is the first actual data packet.The server sends theclient some information about the type of FTP server it is running(ProFTPD), its version (1.2.4), and some additional information.
■ Frame 7 This is merely an acknowledgment frame of Frame 6. It alsospecifies available TCP window size on the client’s side.TCP windowsize is one of the most important parameters of any TCP communica-tion; we discuss it later in this chapter.
■ Frames 8 through 13 The user sends his username and password tothe server, and the server confirms that the password is correct. Lookinto Frame 11; it is the clear-text (“protected”) password of our topsecret
www.syngress.com
219_sniffer_06.qxd 6/28/02 11:55 AM Page 330

Capturing Network Data for Analysis • Chapter 6 331
user sent to the server! Now you realize how insecure FTP communica-tion actually is.
■ Frames 14 and 15 The client specifies which port number should beused for the data transfer, and the server confirms it.
■ Frame 16 The user issues the ls command to get a listing of files anddirectories.
■ Frames 17 through 19 Look at these frames. Do they look familiar?Have we already seen this SYN bit? You are absolutely right—this is athree-way handshake of a new TCP session. FTP does not use port 21for data transfer; it is used to control information only.Another port,port 20, is used for actual data transfer, but as you’ll remember, no datacan be transferred using TCP before the connection is established.Thesethree frames are establishing this new connection!
■ Frames 20 through 24 Transfers the content of the directory. In thisparticular case, the directory contains only one file, just a few bytes ofinformation, but FTP needs five packets to transfer it.
■ Frame 25 This is a new type of frame for us. It contains a FIN bit,which indicates that no more data is available and that the TCP connec-tion should be closed.
■ Frame 26 The server acknowledges closing the connection.
■ Frames 27 and 28 The user terminates the FTP session by enteringthe quit command.The server confirms that the session has been closedsuccessfully by sending the message with the code 221 (“Goodbye”).
■ Frames 29 through 32 The server and the client are closing the con-nection by sending the frames with the FIN bit set.As we know,TCP isa full-duplex communication mode, so each FIN frame is closing its halfof the connection.
Now, since we have reviewed the TCP communication from the 10,000-footview, let’s look into one of the frames in greater detail to understand the meaningof all the fields in it.
Let’s look into Frame 11—the frame by which the user has sent his passwordto the server.We are not going to discuss DLC and IP headers here, becausewe’ve discussed them and we will also spend some time on them in the UDPsection. So, let’s focus on the TCP header and FTP payload only for now:
www.syngress.com
219_sniffer_06.qxd 6/28/02 11:55 AM Page 331
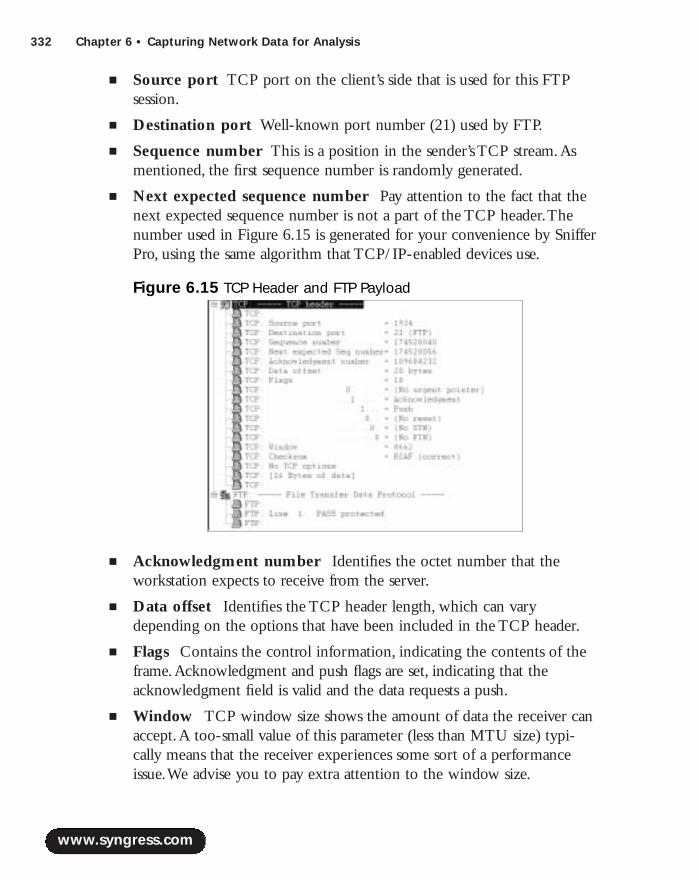
332 Chapter 6 • Capturing Network Data for Analysis
■ Source port TCP port on the client’s side that is used for this FTPsession.
■ Destination port Well-known port number (21) used by FTP.
■ Sequence number This is a position in the sender’s TCP stream.Asmentioned, the first sequence number is randomly generated.
■ Next expected sequence number Pay attention to the fact that thenext expected sequence number is not a part of the TCP header.Thenumber used in Figure 6.15 is generated for your convenience by SnifferPro, using the same algorithm that TCP/IP-enabled devices use.
■ Acknowledgment number Identifies the octet number that theworkstation expects to receive from the server.
■ Data offset Identifies the TCP header length, which can varydepending on the options that have been included in the TCP header.
■ Flags Contains the control information, indicating the contents of theframe.Acknowledgment and push flags are set, indicating that theacknowledgment field is valid and the data requests a push.
■ Window TCP window size shows the amount of data the receiver canaccept.A too-small value of this parameter (less than MTU size) typi-cally means that the receiver experiences some sort of a performanceissue.We advise you to pay extra attention to the window size.
www.syngress.com
Figure 6.15 TCP Header and FTP Payload
219_sniffer_06.qxd 6/28/02 11:55 AM Page 332
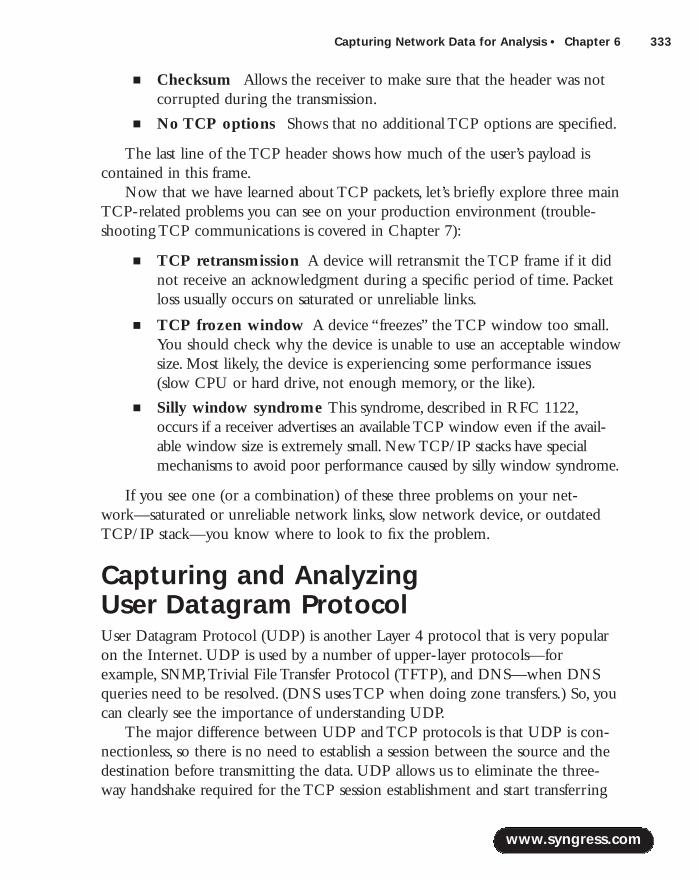
Capturing Network Data for Analysis • Chapter 6 333
■ Checksum Allows the receiver to make sure that the header was notcorrupted during the transmission.
■ No TCP options Shows that no additional TCP options are specified.
The last line of the TCP header shows how much of the user’s payload iscontained in this frame.
Now that we have learned about TCP packets, let’s briefly explore three mainTCP-related problems you can see on your production environment (trouble-shooting TCP communications is covered in Chapter 7):
■ TCP retransmission A device will retransmit the TCP frame if it didnot receive an acknowledgment during a specific period of time. Packetloss usually occurs on saturated or unreliable links.
■ TCP frozen window A device “freezes” the TCP window too small.You should check why the device is unable to use an acceptable windowsize. Most likely, the device is experiencing some performance issues(slow CPU or hard drive, not enough memory, or the like).
■ Silly window syndrome This syndrome, described in RFC 1122,occurs if a receiver advertises an available TCP window even if the avail-able window size is extremely small. New TCP/IP stacks have specialmechanisms to avoid poor performance caused by silly window syndrome.
If you see one (or a combination) of these three problems on your net-work—saturated or unreliable network links, slow network device, or outdatedTCP/IP stack—you know where to look to fix the problem.
Capturing and Analyzing User Datagram ProtocolUser Datagram Protocol (UDP) is another Layer 4 protocol that is very popularon the Internet. UDP is used by a number of upper-layer protocols—forexample, SNMP,Trivial File Transfer Protocol (TFTP), and DNS—when DNSqueries need to be resolved. (DNS uses TCP when doing zone transfers.) So, youcan clearly see the importance of understanding UDP.
The major difference between UDP and TCP protocols is that UDP is con-nectionless, so there is no need to establish a session between the source and thedestination before transmitting the data. UDP allows us to eliminate the three-way handshake required for the TCP session establishment and start transferring
www.syngress.com
219_sniffer_06.qxd 6/28/02 11:55 AM Page 333
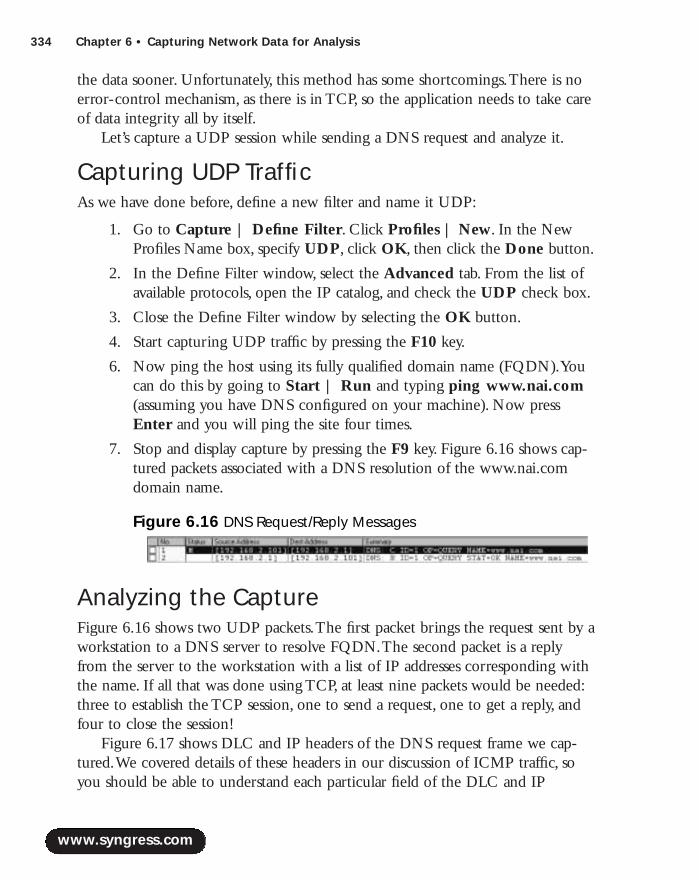
334 Chapter 6 • Capturing Network Data for Analysis
the data sooner. Unfortunately, this method has some shortcomings.There is noerror-control mechanism, as there is in TCP, so the application needs to take careof data integrity all by itself.
Let’s capture a UDP session while sending a DNS request and analyze it.
Capturing UDP TrafficAs we have done before, define a new filter and name it UDP:
1. Go to Capture | Define Filter. Click Profiles | New. In the NewProfiles Name box, specify UDP, click OK, then click the Done button.
2. In the Define Filter window, select the Advanced tab. From the list ofavailable protocols, open the IP catalog, and check the UDP check box.
3. Close the Define Filter window by selecting the OK button.
4. Start capturing UDP traffic by pressing the F10 key.
6. Now ping the host using its fully qualified domain name (FQDN).Youcan do this by going to Start | Run and typing ping www.nai.com(assuming you have DNS configured on your machine). Now pressEnter and you will ping the site four times.
7. Stop and display capture by pressing the F9 key. Figure 6.16 shows cap-tured packets associated with a DNS resolution of the www.nai.comdomain name.
Analyzing the CaptureFigure 6.16 shows two UDP packets.The first packet brings the request sent by aworkstation to a DNS server to resolve FQDN.The second packet is a replyfrom the server to the workstation with a list of IP addresses corresponding withthe name. If all that was done using TCP, at least nine packets would be needed:three to establish the TCP session, one to send a request, one to get a reply, andfour to close the session!
Figure 6.17 shows DLC and IP headers of the DNS request frame we cap-tured.We covered details of these headers in our discussion of ICMP traffic, soyou should be able to understand each particular field of the DLC and IP
www.syngress.com
Figure 6.16 DNS Request/Reply Messages
219_sniffer_06.qxd 6/28/02 11:55 AM Page 334
Capturing Network Data for Analysis • Chapter 6 335
headers. Return to the ICMP section of this chapter if some of the purposes ofsome fields in Figure 6.17 are not clear to you. Furthermore, pay attention to theProtocol field in the IP header; it equals 17 for UDP packets, compared to 1 forICMP and 6 for TCP.
Now let’s look at the UDP part of the domain name resolution query packet.If you compare the UDP header in Figure 6.18 to the TCP header you saw inFigure 6.15, you will realize that the UDP header is not that complicated. In fact,it contains only four fields:
■ Source port The UDP port randomly selected by a workstation fromthe pool of available UDP ports to send the DNS request and get thereply.
■ Destination port A well-known port number (53) used by DNS.
■ Length The length of the UDP message.
■ Checksum The checksum of the UDP message. Note that UDPchecksum is optional, so a UDP frame with the checksum set to 0 is notan erroneous one.
www.syngress.com
Figure 6.17 DLC and IP Parts of a UDP Frame
219_sniffer_06.qxd 6/28/02 11:55 AM Page 335

336 Chapter 6 • Capturing Network Data for Analysis
As you can see, UDP does not have most of the fields we saw in a TCPframe, because it is a connectionless protocol and does not need all the fields nec-essary for a TCP frame, such as sequence numbers, flags, and window size.Thelast part of the frame is the Internet Domain Name Service header.
www.syngress.com
Figure 6.18 A UDP Header
219_sniffer_06.qxd 6/28/02 11:55 AM Page 336
Capturing Network Data for Analysis • Chapter 6 337
SummaryAfter reading this chapter, you should be familiar with the data-capturing process.What is the main reason for data capturing? Capturing data is one of the bestways to gain a full picture of what is happening on the network, trace the packetflow, and make sure everything is working smoothly.
You will be more prepared to deal with a problem on a network if you havetaken some time to familiarize yourself with that particular network.Well inadvance of a problem arising, be sure to take time to create a number of specificfilters for the most important applications your customers use. Defining appro-priate capture filters will save you time when you’re looking for a particularproblem.
As you already know, Sniffer Pro is one of the best tools available to help youcapture traffic. In the majority of cases, you capture traffic in order to analyze oneof the network problems that invariably arise from time to time. Sometimes,however, you might want to capture traffic and save it for future analysis to checkthe ways your network would react to certain situations. Sniffer Pro is not only acapturing tool—it is also a software application with broad filtering resources.
Before you start capturing traffic, make sure that you know whether youwant to capture all the traffic flow and select what interests you with the help ofdisplay filters later, or if you want to narrow your search from the very begin-ning, setting up a particular capture filter. Both of these methods have their prosand cons, which were discussed in this chapter.
When mastering Sniffer Pro, do not neglect the main toolbar. It is veryimportant to know every icon and what it stands for. Using the main toolbar canbe a great timesaver.
It is also very important to be able to correctly interpret the data reflected onthe Capture Panel, which shows the status of the capture process.A full under-standing of the meaning of all its fields will give you a clearer picture of the net-work activity you face.
Once you have captured the data, your main task before starting the analysisis to save captures in the right way. Choose between manual and automatic savingof captures, whichever is more convenient and suitable to you. Make sure thatyou are aware of the existence of various file formats used to save captures as wellas the formats Sniffer Pro uses for auxiliary information.
www.syngress.com
219_sniffer_06.qxd 6/28/02 11:55 AM Page 337

338 Chapter 6 • Capturing Network Data for Analysis
Solutions Fast Track
Capturing Traffic
! If you have a problem on your network, you need to take fast actions tosort it out. Sniffer Pro will help you capture traffic you need to analyzethe issue.
! All captured traffic will go to the capture buffer to be saved andanalyzed later.
! You can capture the traffic in two ways: capture all the traffic and filter itlater in search of what interests you, or apply the predefined capturefilters to capture only the packets that are related to the problem you areabout to explore.
! To pull up the Capture Panel, go to Capture | Capture Panel orselect the Capture Panel icon in the main toolbar.
! Capture Panel is used to view the status of the capture process.
Saving and Using Captures
! It is necessary to save the captures properly in order to use them in thefuture.You have two ways to save captures: manually or automatically.(Automatic saving occurs when the capture buffer is full.)
! As for file types, the *.CAP file format is used for all types of interfaces.Tohave your data compressed automatically, you can save it with a .CAZextension. Compressed files take much less space on your hard drive.
! To open files captured by Sniffer Pro, go to File | Open, or press Ctrl + O.Alternatively, you can click an appropriate icon in the maintoolbar.
! To open files captured by other packet analyzers and saved in a differentformat that is not compatible with Sniffer Pro, you have to use third-party products to export one format into another before actuallyopening a file.
www.syngress.com
219_sniffer_06.qxd 6/28/02 11:55 AM Page 338
Capturing Network Data for Analysis • Chapter 6 339
Capturing and Analyzing Address Resolution Protocol
! ARP’s main function is to allow the IP-enabled devices on the networkto dynamically map IP addresses to physical (MAC) addresses.
! To capture ARP traffic deliberately, you need to define an ARP filter.Choose Capture | Define Filter.
! When analyzing ARP traffic, pay attention to the sender’s and target’shardware and protocol (typically IP) addresses.
! Make sure that you don’t receive multiple ARP responses to a singleARP request. Multiple responses are an indicator of an IP conflict or abridging loop.
Capturing and Analyzing Internet Control Message Protocol
! ICMP’s main function is to allow network devices to report errors andcontrol information. ICMP can help in reporting a huge number ofnetwork conditions.
! Sniffer Pro has a predefined profile that can filter ICMP protocol only,so you do not need to define your own filtering rules for that purpose.
! ICMP messages are encapsulated into IP datagrams, which, in turn, areencapsulated into Ethernet frames.Therefore, to analyze a single ICMPframe completely, it is necessary to look into all three layers.
! ICMP messages can report a large number of network conditions,summarized in Table 6.3.
Capturing and Analyzing Transmission Control Protocol
! TCP is the most popular Layer 4 protocol on the Internet. Employing aspecial positive acknowledgment with retransmission mechanism,TCPprovides reliable data transmission.
! To capture TCP traffic, create a new TCP capture filter. Be careful,however, because on highly utilized networks your capture buffer canoverflow in seconds.
www.syngress.com
219_sniffer_06.qxd 6/28/02 11:55 AM Page 339

340 Chapter 6 • Capturing Network Data for Analysis
! Source and destination ports, sequence number, acknowledgment number,and the window size are the main parameters of a TCP/IP frame.
! Make sure that all TCP frames are acknowledged and TCP window sizeat least exceeds the MTU.
Capturing and Analyzing User Datagram Protocol
! UDP is another popular Layer 4 protocol. DNS,TFTP, and many otherprotocols rely on UDP for their data transmission.
! UDP is a connectionless protocol. No connection needs to beestablished between the source and destination before you transmit data.
! UDP does not have a mechanism to make sure that the payload is notcorrupted.As a result, the application must take care of data integrity allby itself.
! The UDP header is pretty straightforward. It includes only source anddestination port numbers, length of the frame, and a UDP messagechecksum.
www.syngress.com
219_sniffer_06.qxd 6/28/02 11:55 AM Page 340
Capturing Network Data for Analysis • Chapter 6 341
Q: I have received a file captured by Microsoft Network Monitor. Is there anyway to open it with Sniffer Pro?
A: You can’t open these files directly from Sniffer Pro, because the formatsMicrosoft Network Monitor uses to store data are not Sniffer Pro compatible.You have to export one format into another before being able to open thefiles. Some third-party products, such as WildPacket’s ProConvert forWindows (www.wildpackets.com), allow you to do open such files withSniffer Pro.
Q: I have 512MB of RAM on my computer running the Windows NT4 oper-ating system. I have chosen a buffer size of 192MB, but when I try to startcapturing, I get an error message.What is the problem?
A: In Windows NT4, the maximum buffer size available is only 64MB. If youspecify a larger buffer size, capturing will fail to start.The maximum buffersize on Windows 2000 and Windows 98 is 192MB.
Q: I have to capture traffic on many sites that belong to different clients.What isthe best way to organize my captured files?
A: I would recommend that you develop your own naming convention—forexample, client name, year, month, day, and the file number. In this case, atypical file will look like this: LightPave20020129001.cap.This system willallow you to easily sort your files by your client’s name and date.You can alsokeep the log containing the date, client name, problem description, and itscause you discovered using Sniffer Pro.
www.syngress.com
Frequently Asked Questions
The following Frequently Asked Questions, answered by the authors of this book,are designed to both measure your understanding of the concepts presented in this chapter and to assist you with real-life implementation of these concepts. Tohave your questions about this chapter answered by the author, browse towww.syngress.com/solutions and click on the “Ask the Author” form.
219_sniffer_06.qxd 6/28/02 11:55 AM Page 341
342 Chapter 6 • Capturing Network Data for Analysis
Q: In discussing TCP traffic, we could see how simple it is to capture someone’ssecret password. Is there any way to transfer the information securely?
A: Yes.A number of protocols let you to encrypt the data you transfer, so thepasswords and sensitive data cannot be captured that easily.These protocolscan work on the application layer (for example: Secure Shell —SSH, securecopy) and on the network layer (IPSec).
www.syngress.com
219_sniffer_06.qxd 6/28/02 11:55 AM Page 342

Analyzing Network Issues
Solutions in this chapter:
■ Hey! Why Is the Network So Slow?
■ Resetting Token Ring
■ Using Sniffer Pro to Troubleshoot aChattering Network Interface Card
■ Using Sniffer Pro to Troubleshoot SmallPackets (Runts)
■ Using Sniffer Pro to TroubleshootBrowsing Battles
■ Dynamic Host Configuration ProtocolFailure
Chapter 7
343
! Summary
! Solutions Fast Track
! Frequently Asked Questions
219_sniffer_07.qxd 6/28/02 11:56 AM Page 343
344 Chapter 7 • Analyzing Network Issues
IntroductionYou can use Sniffer Pro not only to monitor traffic on your network, but also asan aid in the isolation and resolution of many network issues. Until this point wehave looked at the internals of Sniffer Pro; now we need to put it to work againstsome very common network-related issues.
In reading this chapter, you should realize that many of these problems mightbe masked by other things, but through Sniffer Pro, you can determine thesehidden issues much more easily than you could before. Let’s look at some of themost common problems on networks today: network too slow, slow server access,slow logins, a Token Ring network constantly resetting and knocking everyoneoff the ring, chattering NICs gone bad, and Microsoft-related browsing problems.In addition, we look at the reasons you might not be able to get an IP addressfrom a Dynamic Host Configuration Protocol (DHCP) server.
Hey! Why Is the Network So Slow? These words create myriad emotions in the person responsible for the network,ranging from “Oh no, what will I do?” to “Well, it’s going to be an interestingday—and here’s my first challenge.”
Someone once said the only thing in life you can control is your attitude.Unfortunately, that person didn’t expound on just how you go about doing that.This book isn’t a self-help digest, so we won’t get into the psychology of atti-tudes. However, we do provide you, the SCP, with the knowledge and the toolnecessary to approach a network problem with confidence and a positive attitude.The tool, of course, is Sniffer Pro.
To answer the question “Why is the network so slow?” you are first requiredto ask another question, which is,“What constitutes a slow network?” If the SCPhas done his or her homework and created a network performance baseline, asdiscussed in Chapter 5, the job of defining a slow network will be minimized.The SCP can simply compare the network performance against the baseline anddetermine if the network is, in actuality, slow.With the absence of a baseline, thetask becomes somewhat more challenging.
Network speed is subjective. Network professionals who have been in thebusiness for 10 or so years remember a time when 300-baud modems were con-sidered state of the art.Transmission speeds were measured in kilobytes persecond, and 16 kilobytes of memory were all you would ever need.Things havechanged considerably. Manufacturers are constantly competing to provide faster
www.syngress.com
219_sniffer_07.qxd 6/28/02 11:56 AM Page 344
www.syngress.com
CPUs, which require faster disks and, therefore, faster networks.The days of anacceptable five-second network response are over; today a computer user mightbe unaware that a network even exists. From the users’ viewpoint, everything islocal.This perception is nurtured by operating system software, such as a redi-rector, running behind the scenes, causing network resource requests to appear tobe on one’s local machine. It is only when the network slows that the userbecomes aware of the difference in speed between the network and the localcomputer.This perception varies in individuals, as does tolerance.
Having determined there is actually a problem based on credible input fromthe user, the SCP is now tasked with solving the problem.The first step in thesolution process is defining the problem. Once defined, the necessary correctiveactions can be taken.
Using Sniffer Pro to Troubleshoot a Slow NetworkIn this chapter, we discuss many topics that can result in slow network perfor-mance.A brief history of Ethernet and its origins is presented.The concepts ofcollision detection and collision domains are covered in depth.We include thefunctions of network devices such as repeaters, hubs, bridges, and switchesbecause they pertain to collisions and broadcasts.Token Ring technology,Microsoft browsing, and DHCP are some of the subjects we explore using theSniffer Pro network analyzer.This chapter’s goal is to provide you with the nec-essary knowledge to troubleshoot and repair slow networks.
Excessive Collisions and Collision DomainsWe are all too familiar with what happens when two automobiles run into eachother:There is a collision.Without a doubt, collisions are excessive on our high-ways today, for reasons we can and should prevent by enacting and enforcinglaws. But how can we prevent frames from “colliding” on an Ethernet LAN? Theanswer is, by understanding and obeying the electrical laws of physics.These lawsare the laws of propagation. In order to explain collisions and collision domains, weneed to delve into the principles of Ethernet transmission. But first, a little his-tory is in order.
Ethernet was created in 1970 at Xerox’s Palo Alto Research Center (PARC)by Dr. Robert Metcalfe, affectionately known as Dr. Bob. In 1980, a consortiumof Digital Equipment Corporation, Intel, and Xerox enhanced the protocol, pro-ducing a version known as DIX, derived from the first letter of each company’s
Analyzing Network Issues • Chapter 7 345
219_sniffer_07.qxd 6/28/02 11:56 AM Page 345
346 Chapter 7 • Analyzing Network Issues
name.The Institute of Electrical and Electronic Engineers (IEEE) developed asimilar standard, known as 802.3. For the most part, these two versions are func-tionally equivalent. However, there are differences between them. From this pointon, when we refer to Ethernet, we mean IEEE 802.3.
NOTE
Here’s a bit of network trivia for you: The 802 in the IEEE 802 standardswas derived from the date on which the IEEE proposed the standard:February (the second month of) 1980.
Ethernet uses the Carrier Sense Multiple Access/Collision Detection(CSMA/CD) network access protocol. CSMA/CD is quite a mouthful; however,it describes the functioning of the protocol in one acronym. Let’s break it downto see what is required to implement the Ethernet protocol.
First, CS, or carrier sense, means that the circuit must be able to sense, ordetect, the presence of a carrier.Why? So it can determine whether someone elseis using the LAN segment. In other words, if the LAN is busy (if the circuitsenses the presence of a carrier signal), you are not allowed to transmit. Next,MA, or multiple access, means that Ethernet is a shared-communication channeland as such can have multiple users on a single segment of the LAN. Finally, CD,or collision detection, means that if you are using the LAN segment and anothernode transmits and collides with your communication, you will detect it andreact accordingly.
In Ethernet communication, any node can transmit data if it determines thatthe segment is not busy. If two or more nodes transmit simultaneously, a collisionwill occur. For a bus topology such as 10Base2 or 10Base5 that utilizes a singleconductor wrapped in a shield acting as a ground, the presence of two simulta-neous communications doubles the strength of the signal for some portion of thecollision period. Consequently, the circuit’s voltage detectors senses this condition,and a collision algorithm known as collision backoff is invoked.The stations continueto transmit a jam signal of 4 bytes or 32 bits after detecting the collision.Thisensures that all stations have seen the collision. Basically, the backoff algorithm gen-erates a random number to be used as a timing seed and waits this amount of timebefore retransmitting.The randomness of this algorithm ensures that some nodewill retry before the others and gain access to the LAN.After 16 consecutive colli-sions for a given transmission attempt, the interface discards the Ethernet frame.
www.syngress.com
219_sniffer_07.qxd 6/28/02 11:56 AM Page 346
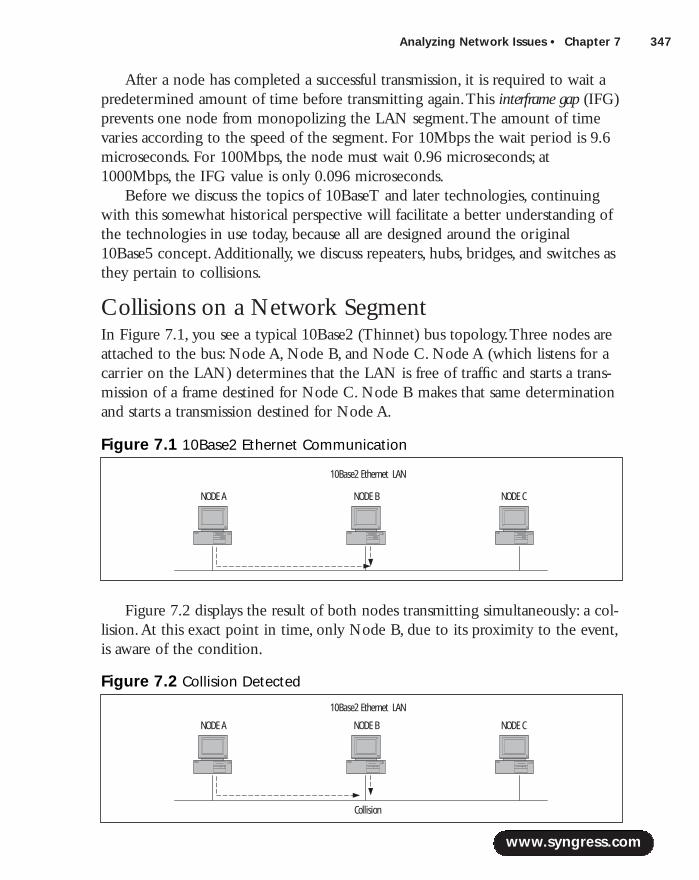
Analyzing Network Issues • Chapter 7 347
After a node has completed a successful transmission, it is required to wait apredetermined amount of time before transmitting again.This interframe gap (IFG)prevents one node from monopolizing the LAN segment.The amount of timevaries according to the speed of the segment. For 10Mbps the wait period is 9.6microseconds. For 100Mbps, the node must wait 0.96 microseconds; at1000Mbps, the IFG value is only 0.096 microseconds.
Before we discuss the topics of 10BaseT and later technologies, continuingwith this somewhat historical perspective will facilitate a better understanding ofthe technologies in use today, because all are designed around the original10Base5 concept.Additionally, we discuss repeaters, hubs, bridges, and switches asthey pertain to collisions.
Collisions on a Network SegmentIn Figure 7.1, you see a typical 10Base2 (Thinnet) bus topology.Three nodes areattached to the bus: Node A, Node B, and Node C. Node A (which listens for acarrier on the LAN) determines that the LAN is free of traffic and starts a trans-mission of a frame destined for Node C. Node B makes that same determinationand starts a transmission destined for Node A.
Figure 7.2 displays the result of both nodes transmitting simultaneously: a col-lision.At this exact point in time, only Node B, due to its proximity to the event,is aware of the condition.
www.syngress.com
Figure 7.1 10Base2 Ethernet Communication
NODE A NODE B NODE C
10Base2 Ethernet LAN
Figure 7.2 Collision Detected
Collision
NODE A NODE B NODE C
10Base2 Ethernet LAN
219_sniffer_07.qxd 6/28/02 11:56 AM Page 347
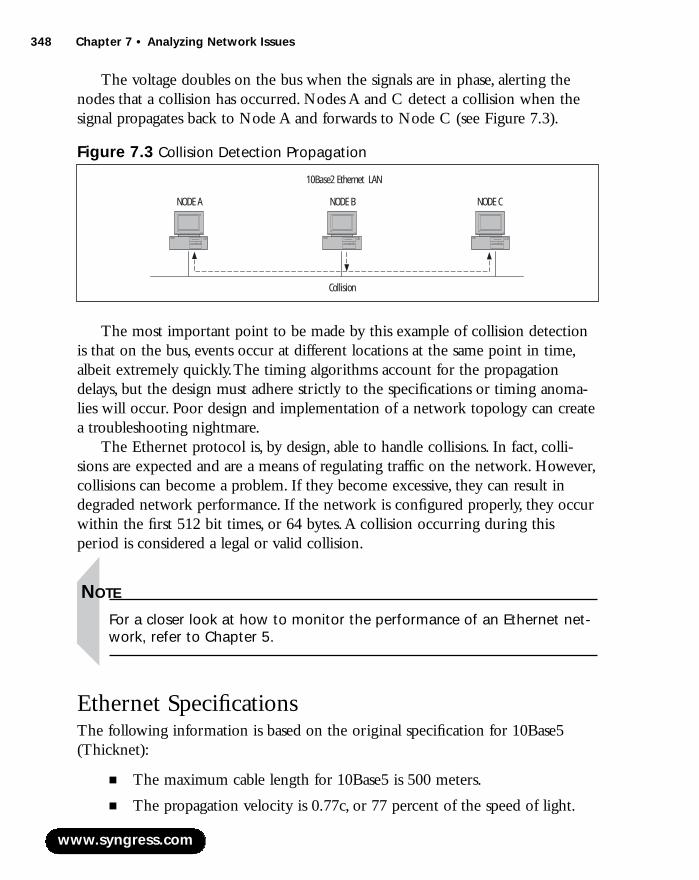
348 Chapter 7 • Analyzing Network Issues
The voltage doubles on the bus when the signals are in phase, alerting thenodes that a collision has occurred. Nodes A and C detect a collision when thesignal propagates back to Node A and forwards to Node C (see Figure 7.3).
The most important point to be made by this example of collision detectionis that on the bus, events occur at different locations at the same point in time,albeit extremely quickly.The timing algorithms account for the propagationdelays, but the design must adhere strictly to the specifications or timing anoma-lies will occur. Poor design and implementation of a network topology can createa troubleshooting nightmare.
The Ethernet protocol is, by design, able to handle collisions. In fact, colli-sions are expected and are a means of regulating traffic on the network. However,collisions can become a problem. If they become excessive, they can result indegraded network performance. If the network is configured properly, they occurwithin the first 512 bit times, or 64 bytes.A collision occurring during thisperiod is considered a legal or valid collision.
NOTE
For a closer look at how to monitor the performance of an Ethernet net-work, refer to Chapter 5.
Ethernet SpecificationsThe following information is based on the original specification for 10Base5(Thicknet):
■ The maximum cable length for 10Base5 is 500 meters.
■ The propagation velocity is 0.77c, or 77 percent of the speed of light.
www.syngress.com
Figure 7.3 Collision Detection Propagation
Collision
NODE A NODE B NODE C
10Base2 Ethernet LAN
219_sniffer_07.qxd 6/28/02 11:56 AM Page 348

Analyzing Network Issues • Chapter 7 349
■ The speed of light is 300,000,000 meters per second (in a vacuum).However, propagation velocity equals 231,000,000 meters per second in a cable.
■ At 10,000,000bps, a single bit occupies 0.1 microseconds.
If a bit occupies 0.1 microseconds, it can travel 23.1 meters during thatperiod at a velocity of 231,000,000 meters per second.We mentioned earlier thatafter a collision is detected, the nodes involved continue to transmit a jam signalof 4 bytes, or 32 bits, to alert all nodes on the segment that a collision occurred.If we apply the results of our previous calculations to the 32-bit transmission, wesee that it results in a 739-meter frame extension. In other words, the effects ofthe jam signal is felt along the entire length of a 739-meter cable.This is suffi-cient to allow a collision at one end of a 500-meter cable to propagate to theother end.With the maximum length of the cable set at 500 meters and thepropagation velocity of 231,000,000 meters per second, it is guaranteed that the32-bit jam signal will reach the other end of the cable before the far-end stationstops transmitting.This results in a doubling of the voltage at that node, and acollision will be detected.
The previous mathematical exercise answers the following question:“What ifthe cable was so long that a jam signal from a collision at one end did not haveenough time to reach the other end before the far-end station stopped transmit-ting?”The answer is:The voltage would not double and the far-end stationwould be unaware that a collision had occurred. From the far-end station’s per-spective, the message was delivered successfully.The condition we have justdescribed should never happen in a properly designed network.
Collision DomainThe previous sections discussed the process of collision detection and the neces-sity for a station to still be transmitting its data in order to detect that it had beeninvolved in a collision.We calculated the bit time of a 10Mbps network at 0.1microseconds. If the minimum frame size is 64 bytes, or 512 bits, multiplying 512bits by 0.1 microseconds results in 51.2 microseconds needed to transmit a 512-bit, or 64-byte, frame. If we divide 51.2 microsecond in half, we get 25.6 micro-seconds.This is the amount of time that should be allotted for the journey to thefar end of the network. If a collision occurs, the signal will have the remaining25.6 microseconds to make the return trip.The value of 25.6 microseconds for aone-way propagation window formally defines the collision domain for a10Mbps network segment.
www.syngress.com
219_sniffer_07.qxd 6/28/02 11:56 AM Page 349
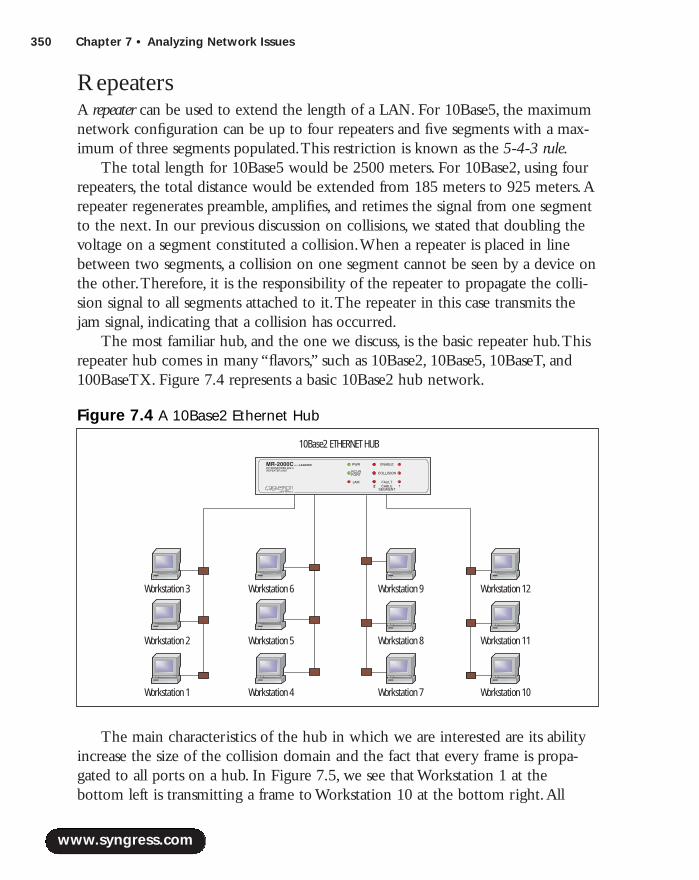
350 Chapter 7 • Analyzing Network Issues
RepeatersA repeater can be used to extend the length of a LAN. For 10Base5, the maximumnetwork configuration can be up to four repeaters and five segments with a max-imum of three segments populated.This restriction is known as the 5-4-3 rule.
The total length for 10Base5 would be 2500 meters. For 10Base2, using fourrepeaters, the total distance would be extended from 185 meters to 925 meters.Arepeater regenerates preamble, amplifies, and retimes the signal from one segmentto the next. In our previous discussion on collisions, we stated that doubling thevoltage on a segment constituted a collision.When a repeater is placed in linebetween two segments, a collision on one segment cannot be seen by a device onthe other.Therefore, it is the responsibility of the repeater to propagate the colli-sion signal to all segments attached to it.The repeater in this case transmits thejam signal, indicating that a collision has occurred.
The most familiar hub, and the one we discuss, is the basic repeater hub.Thisrepeater hub comes in many “flavors,” such as 10Base2, 10Base5, 10BaseT, and100BaseTX. Figure 7.4 represents a basic 10Base2 hub network.
The main characteristics of the hub in which we are interested are its abilityincrease the size of the collision domain and the fact that every frame is propa-gated to all ports on a hub. In Figure 7.5, we see that Workstation 1 at thebottom left is transmitting a frame to Workstation 10 at the bottom right.All
www.syngress.com
Figure 7.4 A 10Base2 Ethernet Hub
10Base2 ETHERNET HUB
Workstation 3
Workstation 2
Workstation 1
Workstation 6
Workstation 5
Workstation 4
Workstation 9
Workstation 8
Workstation 7
Workstation 12
Workstation 11
Workstation 10
219_sniffer_07.qxd 6/28/02 11:56 AM Page 350

Analyzing Network Issues • Chapter 7 351
workstations see the same frame, but only Workstation 10 reads the entire frame.The other stations read the destination address and determine that the frame isnot for them.
Another important point to remember about the configuration of Figure 7.5is that a collision between Workstation 1 and Workstation 3, which are on thesame segment, causes a doubling of the voltage on that segment. However, a col-lision or simultaneous transmission between Workstation 1and Workstation 10does not produce a voltage increase.Therefore, the hub must respond to the colli-sion event by generating and propagating the jam signals.
NOTE
We discuss the placement of Sniffer Pro for proper monitoring later inthis section, but for now you should immediately observe that con-necting Sniffer Pro to any port on the hub shown in Figure 7.5 will mon-itor all traffic on the network.
Before leaving the topic of hubs, let’s take a look at the more familiar10BaseT hub.This type of hub must follow the same Ethernet protocol
www.syngress.com
Figure 7.5 Signal Propagation
10Base2 ETHERNET HUB
Workstation 3
Workstation 2
Workstation 1
Workstation 6
Workstation 5
Workstation 4
Workstation 9
Workstation 8
Workstation 7
Workstation 12
Workstation 11
Workstation 10
219_sniffer_07.qxd 6/28/02 11:56 AM Page 351

352 Chapter 7 • Analyzing Network Issues
specification previously discussed, using a different physical topology. Figure 7.6represents a typical 10BaseT arrangement.
The 10BaseT hub utilizes point-to-point communication over twisted-paircable from workstation to hub port. In Figure 7.6, a frame sent from Workstation1 is seen by all workstations.The transmission speeds and physical medium varyin accordance with the baseband standard.Table 7.1 provides a list of the majorbaseband standards and their specifications.
NOTE
In examining Figure 7.6, a 10BaseT hub, you should recognize a shared-medium device. Sniffer Pro can monitor all traffic from any port on thehub.
Table 7.1 Transmission Methods and Speeds
Transmission Baseband Technology Speed Physical Medium
10Base5 10Mbps Coaxial cable (Thicknet)10Base2 10Mbps Coaxial cable (Thinnet)10BaseT 10Mbps Twisted-pair cable10BaseF 10Mbps Fiber optic cable
www.syngress.com
Figure 7.6 A 10BaseT Hub
Workstation 1
Workstation 2Workstation 3 Workstation 4
Workstation 5
Workstation 6
Continued
219_sniffer_07.qxd 6/28/02 11:56 AM Page 352
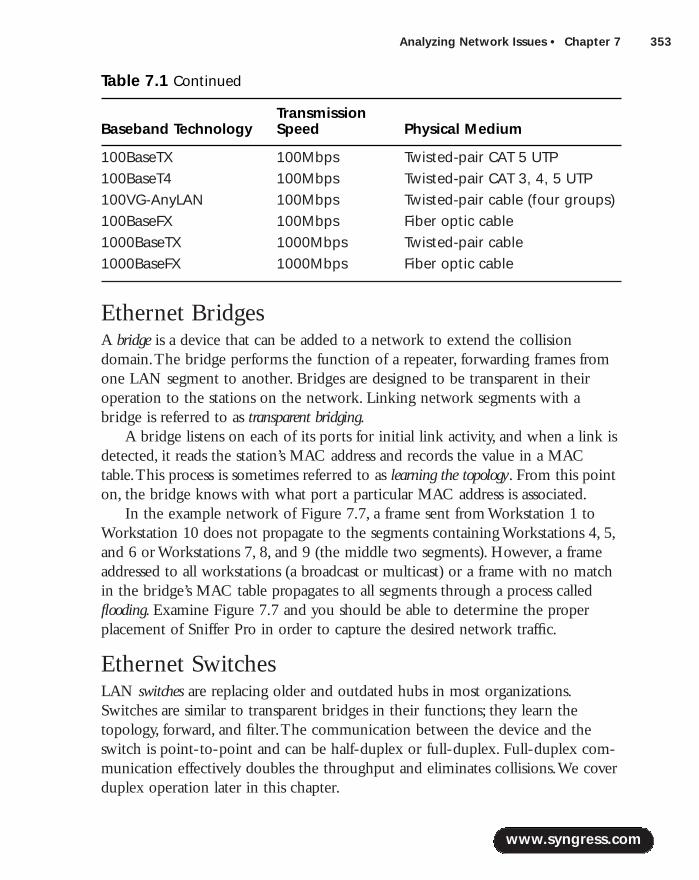
Analyzing Network Issues • Chapter 7 353
100BaseTX 100Mbps Twisted-pair CAT 5 UTP100BaseT4 100Mbps Twisted-pair CAT 3, 4, 5 UTP100VG-AnyLAN 100Mbps Twisted-pair cable (four groups)100BaseFX 100Mbps Fiber optic cable1000BaseTX 1000Mbps Twisted-pair cable1000BaseFX 1000Mbps Fiber optic cable
Ethernet Bridges A bridge is a device that can be added to a network to extend the collisiondomain.The bridge performs the function of a repeater, forwarding frames fromone LAN segment to another. Bridges are designed to be transparent in theiroperation to the stations on the network. Linking network segments with abridge is referred to as transparent bridging.
A bridge listens on each of its ports for initial link activity, and when a link isdetected, it reads the station’s MAC address and records the value in a MACtable.This process is sometimes referred to as learning the topology. From this pointon, the bridge knows with what port a particular MAC address is associated.
In the example network of Figure 7.7, a frame sent from Workstation 1 toWorkstation 10 does not propagate to the segments containing Workstations 4, 5,and 6 or Workstations 7, 8, and 9 (the middle two segments). However, a frameaddressed to all workstations (a broadcast or multicast) or a frame with no matchin the bridge’s MAC table propagates to all segments through a process calledflooding. Examine Figure 7.7 and you should be able to determine the properplacement of Sniffer Pro in order to capture the desired network traffic.
Ethernet SwitchesLAN switches are replacing older and outdated hubs in most organizations.Switches are similar to transparent bridges in their functions; they learn thetopology, forward, and filter.The communication between the device and theswitch is point-to-point and can be half-duplex or full-duplex. Full-duplex com-munication effectively doubles the throughput and eliminates collisions.We coverduplex operation later in this chapter.
www.syngress.com
Table 7.1 Continued
Transmission Baseband Technology Speed Physical Medium
219_sniffer_07.qxd 6/28/02 11:56 AM Page 353

354 Chapter 7 • Analyzing Network Issues
In Figure 7.8,Workstation 4 is in communication with Workstation 7, asdepicted by the dashed line between the two devices.The frames destined forWorkstation 7 are transparent to the other workstations.The return communica-tion to Workstation 4 is also direct and transparent to the other stations.
www.syngress.com
Figure 7.7 An Ethernet Bridge
10Base2
Workstation 3
Workstation 2
Workstation 1
Workstation 6
Workstation 5
Workstation 4
Workstation 9
Workstation 8
Workstation 7
Workstation 12
Workstation 11
Workstation 10
BRIDGE
Figure 7.8 An Ethernet Switch
Workstation 1
Ethernet Switch
Workstation 2 Workstation 3
Workstation 4 Workstation 5 Workstation 6
Workstation 7 Workstation 8 Workstation 9
219_sniffer_07.qxd 6/28/02 11:56 AM Page 354
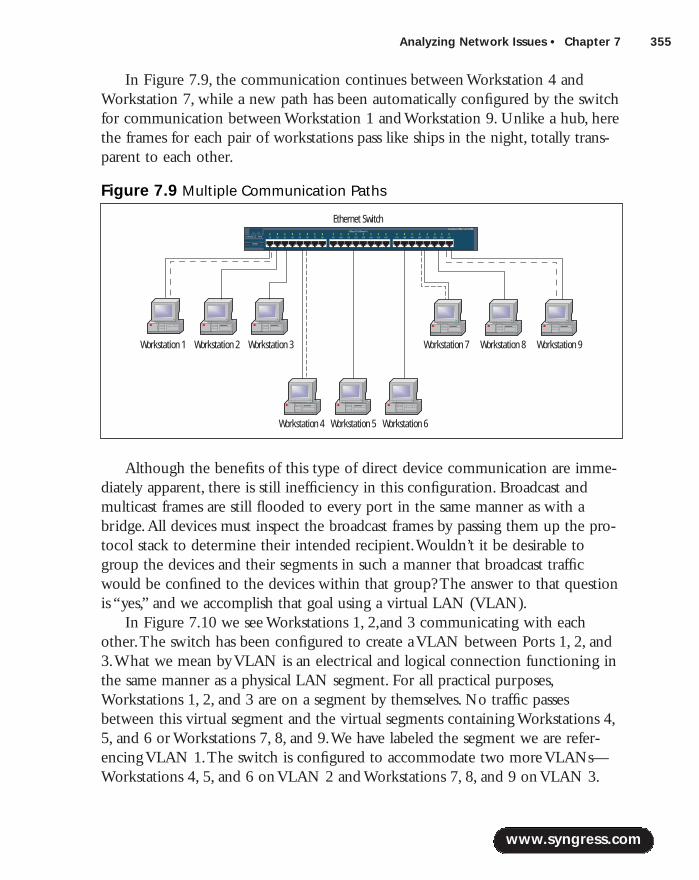
Analyzing Network Issues • Chapter 7 355
In Figure 7.9, the communication continues between Workstation 4 andWorkstation 7, while a new path has been automatically configured by the switchfor communication between Workstation 1 and Workstation 9. Unlike a hub, herethe frames for each pair of workstations pass like ships in the night, totally trans-parent to each other.
Although the benefits of this type of direct device communication are imme-diately apparent, there is still inefficiency in this configuration. Broadcast andmulticast frames are still flooded to every port in the same manner as with abridge.All devices must inspect the broadcast frames by passing them up the pro-tocol stack to determine their intended recipient.Wouldn’t it be desirable togroup the devices and their segments in such a manner that broadcast trafficwould be confined to the devices within that group? The answer to that questionis “yes,” and we accomplish that goal using a virtual LAN (VLAN).
In Figure 7.10 we see Workstations 1, 2,and 3 communicating with eachother.The switch has been configured to create a VLAN between Ports 1, 2, and3.What we mean by VLAN is an electrical and logical connection functioning inthe same manner as a physical LAN segment. For all practical purposes,Workstations 1, 2, and 3 are on a segment by themselves. No traffic passesbetween this virtual segment and the virtual segments containing Workstations 4,5, and 6 or Workstations 7, 8, and 9.We have labeled the segment we are refer-encing VLAN 1.The switch is configured to accommodate two more VLANs—Workstations 4, 5, and 6 on VLAN 2 and Workstations 7, 8, and 9 on VLAN 3.
www.syngress.com
Figure 7.9 Multiple Communication Paths
Workstation 1
Ethernet Switch
Workstation 2 Workstation 3
Workstation 4 Workstation 5 Workstation 6
Workstation 7 Workstation 8 Workstation 9
219_sniffer_07.qxd 6/28/02 11:56 AM Page 355

356 Chapter 7 • Analyzing Network Issues
Normally in a configuration such as this one, each VLAN would have its ownIP address range.This would facilitate cross-VLAN communications using arouter at Layer 3 to connect the segments. Some manufacturers use IEEE 802.10VLAN encapsulation protocols. Cisco uses both 802.10 and Inter-Switch Link(ISL) for interconnecting multiple switches and routers and defining VLANtopologies. Many excellent references on 802.10 and ISL can be found on theCisco Web site at www.cisco.com. Simply browse to the site and enter ISL or802.10 in the search window.
Before we leave our discussion of Figure 7.10, we need to emphasize animportant point concerning traffic flow. Using the VLAN 1 portion of the dia-gram for our example, any communication between the devices (in this case,Workstations 1, 2, and 3) is a direct device-to-device communication.To clarify:If Sniffer Pro were installed and operational on Workstation 3’s interface, it wouldnot be able to capture a communication flow between Workstation 1 andWorkstation 2.You would need to configure the switch to Switch Port Analyzer(SPAN) Port 1 or Port 2 to the Sniffer Pro interface on Port 3. Spanning mirrorsthe traffic on one port to another.
This section has provided an overview of the various network devices andtopologies to begin our discussion on troubleshooting slow networks whose slug-gishness is caused by excessive collisions.As we mentioned earlier, collisions areway of life on Ethernet networks.The acceptable rate of collisions is difficult todefine quantitatively. Obviously, a 100-percent rate of collisions is unacceptable.
www.syngress.com
Figure 7.10 VLANS
Workstation 1
Ethernet Switch
Workstation 2 Workstation 3
Workstation 4 Workstation 5 Workstation 6
Workstation 7 Workstation 8 Workstation 9VLAN 1
VLAN 2
VLAN 3
219_sniffer_07.qxd 6/28/02 11:56 AM Page 356

Analyzing Network Issues • Chapter 7 357
On the other hand, a 0-percent collision rate is almost unattainable.The rule ofthumb is that a very high rate of collisions on a lightly loaded segment mostlikely indicates a problem.The problem could be caused by configuring toomany devices and overloading the segment or by defective hardware or software.Excessive collisions can be the result of a poor design and implementation of anout-of-specification network (e.g., exceeding cable lengths). It is the SCP’s job todetermine the source of the problem.
NOTE
Remember, after 16 consecutive collisions, the frame is discarded and thecollision in some cases might not be reported to the upper-layer proto-cols. Application timers have to expire before a retransmission attemptoccurs. This stipulation can cause serious delays and program timeouts.
Determining the Collision DomainEarlier in this section, we formally defined a collision domain for a 10Mbpstransmission speed.A collision domain can generally be defined as a systemwhose elements are all part of the same signal timing domain.These elements canbe cables, repeaters, hubs, bridges, and, strangely enough, space in the new wire-less protocols.As shown previously in Figure 7.3, the collision domain consists ofthe entire cable segment between Node A and Node C. Recall that n Figure 7.5,the collision domain encompasses all four segments and all 12 workstations.Asimultaneous transmission from Workstation 1 and Workstation 12 produces acollision. In Figure 7.6, we saw that the collision domain comprises all cable seg-ments connecting all workstations. In Figure 7.7, we saw our first example ofsegmenting collision domains.The collisions that normally occur on the segmentcomposed of Workstations 1, 2, and 3 are not propagated to the other segments.Therefore, the collision domain is confined to each segment.This reduces thelikelihood of excessive collisions.The final device we examined was the switch inFigure 7.8.A switch can be thought of as a smart bridge that utilizes many ports.Switch-to-device communication is point-to-point communication, creating thesmallest collision domain possible. In addition, using full-duplex mode eliminatescollisions.
www.syngress.com
219_sniffer_07.qxd 6/28/02 11:56 AM Page 357

358 Chapter 7 • Analyzing Network Issues
Half- and Full-Duplex CommunicationUntil this point we have mentioned duplex configuration in passing. Here wedefine it. 10Base2 and 10Base5 function within constraints of their physicalmedia. Both cabling schemes use one center conductor and a shield as a ground.The signal can move in only one direction at a time.This type of transmission iscalled half-duplex operation. Categories 3, 4, and 5 cable used in 10BaseT,100BaseT, and 1000BaseT utilizes two pairs of twisted wires. One pair can beused for transmitting and the other for receiving.This configuration, capable ofsimultaneous transmission of two signals, is called full-duplex operation. Fiberoptic cable is usually configured for full-duplex transmission by utilizing twofibers. If a cable is capable of full-duplex transmission, this doesn’t mean it mustbe used in that manner. In fact, if the cable is used with a hub, the devices mustbe configured as half-duplex.
One of the most desirable features of full-duplex operation is its doubling ofbandwidth.A 100BaseTX twisted-pair segment can provide a total bandwidth of200Mbps. In full-duplex, point-to-point mode, the signal is limited only by theelectrical attenuation of the medium, not the distance.With fiber optics, the dis-tance of usable transmission can be in kilometers.
Another important characteristic of full-duplex configuration lies in its abilityto eliminate collisions.A collision is produced by a simultaneous transmissionbetween two stations on the same physical cable. Full-duplex operation allowssimultaneous transmission and reception, thereby eliminating collisions.
www.syngress.com
Cisco Switch Interface DisplayIn Figure 7.11, we see the display resulting from a show interfacefastethernet0/11 command on a Cisco 2924 switch. This interface is con-nected to a heavily utilized file-and-print server. The interface ports onthe server and the switch are configured to half-duplex operation (thefourth line from the top). This interface has experienced 93,118,917runts, 93,120,409 input errors , 815 CRC errors, and 25,743,660 colli-sions. The total number of packets both input and output equals424,948,488. A little math determines the collision rate as a percentage:
(25,743,660 collisions / 424,948,488 total packets) x 100 = 6.06 percent
Configuring & Implementing…
Continued
219_sniffer_07.qxd 6/28/02 11:56 AM Page 358

Analyzing Network Issues • Chapter 7 359
www.syngress.com
The value of 6.06 percent is unacceptable. Cisco recommends thatthe total number of collisions with respect to the total number of outputpackets should be no greater than 0.1 percent. The interface cardsshould be configured for full-duplex operation.
Figure 7.11 Interface Display
FastEthernet0/11 is up, line protocol is up
Hardware is Fast Ethernet, address is 0006.d7d4.ff8b (bia
0006.d7d4.ff8b)
Description: Server #1
MTU 1500 bytes, BW 10000 Kbit, DLY 1000 usec,
reliability 255/255, txload 1/255, rxload 1/255
Encapsulation ARPA, loopback not set
Keepalive not set
Half-duplex, 10Mb/s, 100BaseTX/FX
ARP type: ARPA, ARP Timeout 04:00:00
Last input 00:00:05, output 00:00:01, output hang never
Last clearing of "show interface" counters never
Queueing strategy: fifo
Output queue 0/40, 0 drops; input queue 0/75, 0 drops
5 minute input rate 0 bits/sec, 0 packets/sec
5 minute output rate 1000 bits/sec, 2 packets/sec
253347418 packets input, 3115895851 bytes
Received 106923 broadcasts, 93118917 runts, 0 giants, 0
throttles
93120409 input errors, 815 CRC, 677 frame, 2 overrun, 1157
ignored
0 watchdog, 106905 multicast
0 input packets with dribble condition detected
171601070 packets output, 3813255535 bytes, 0 underruns
8830 output errors, 25743660 collisions, 3 interface resets
0 babbles, 0 late collision, 10309453 deferred
0 lost carrier, 0 no carrier
0 output buffer failures, 0 output buffers swapped out
219_sniffer_07.qxd 6/28/02 11:56 AM Page 359

360 Chapter 7 • Analyzing Network Issues
Late CollisionsDuring our discussion of the source of collisions, we mentioned legal or normalcollision.A legal or normal collision occurs within the first 64 bytes, or 512-bittimes. If a collision occurs after the 512-bit times, it is considered an illegal, orlate, collision (see Figure 7.12).This type of collision should never happen.TheSniffer Pro Expert tells us that the collision happened after 64 bytes had beentransmitted. In fact, it occurred shortly after the 86th byte, as displayed in thesize=86 field. In half-duplex mode on a 10Base2 or 10Base5 segment, the latecollision can be caused by a network diameter that is too large.This means thatthe cable is too long, and frame round-trip time exceeds the maximum.Todaywith the newer network infrastructures using CAT 5 and fiber connected toswitches, we seldom see late collisions due to cable length. In addition, the use offull-duplex transmission eliminates collisions as long as it is configured properly.
Causes of Late CollisionsLate collisions can have a number of causes aside from improper network design.In half-duplex mode on a CAT 5 cable, the presence of a signal on both transmitand receive wire pairs generates a collision. One signal can be a legitimate trans-mission and the other signal simply noise or crosstalk.This type of error is some-times referred to as a phantom collision.
One of the most common yet difficult-to-diagnose causes of late collisions isa mismatch in duplex configuration. In this condition, one end of the point-to-point connection is configured for half-duplex and the other for full-duplex.Thecondition can be the result of the duplex autosensing circuit failing or a manualerror in configuration. Strange as it might seem, with many devices this configu-ration still functions, but it functions extremely erratically and very slowly.Theend of the cable configured for half-duplex waits until the other end has finishedtransmitting and the signal on its receive pair is no longer present.As you’ll recall,the device continues to wait for an IFG timer to expire, and if it has a frame tosend, it starts transmitting.The problem occurs when the device at the other endof the cable, which is configured for full-duplex operation, wants to transmit. Infull-duplex operation, collision detection is turned off.Therefore, the device canstart transmitting any time it chooses. By Murphy’s law, this timing will be righton top of the other device’s transmission.
www.syngress.com
Figure 7.12 A Late Collision Summary
219_sniffer_07.qxd 6/28/02 11:56 AM Page 360

Analyzing Network Issues • Chapter 7 361
The half-duplex end of the communication senses a collision and stops trans-mitting after sending a jam signal. It considers the information in its receivebuffer as garbage.The full-duplex device is not aware of the action being takenby the other device and considers the frame successfully transmitted. Dependingon the protocol in use, such as TCP or UDP, and depending on where in thecommunication sequence the error occurred, the recovery from a single error cantake a long time. Consequently, the result of the improper configuration is a veryslow network.
Broadcasts from HubsBroadcasting in Ethernet terminology is very similar to broadcasting in radio.Thetransmission is sent to all stations and is received by those stations if they are lis-tening.The Ethernet frame destination address is set to all ones (i.e., FF FF FF FFFF FF, as shown in Figure 7.13).The area defined for propagation of broadcasttraffic is referred to as the broadcast domain.When a station transmits a broadcastframe, it is seen by all stations in its broadcast domain.
Broadcast traffic is expensive in terms of network utilization. Normally framesare addressed and destined for a particular device on a network.The other devicesare required to read the destination address only; if the address does not belong tothe device, no further action is required.This operation is performed entirely bythe NIC and never requires upper-layer protocol attention. On the other hand,when a broadcast frame is received, the device doesn’t know if the frame is des-tined for it or for another device on the segment.Therefore, it has to read theentire frame and pass it up the protocol stack to be examined for content.
Broadcast Domains The Ethernet LAN devices and topologies we have discussed thus far handlebroadcast traffic in different ways.The isolation of broadcast packets to a certainportion or segment of the network creates broadcast domains. Let’s look at a fewexamples more closely.
Previously, Figure 7.5 showed that we have a 10Base2 hub with 12 worksta-tions.The broadcast domain for this network comprises all segments connecting
www.syngress.com
Figure 7.13 A Broadcast Address
219_sniffer_07.qxd 6/28/02 11:56 AM Page 361
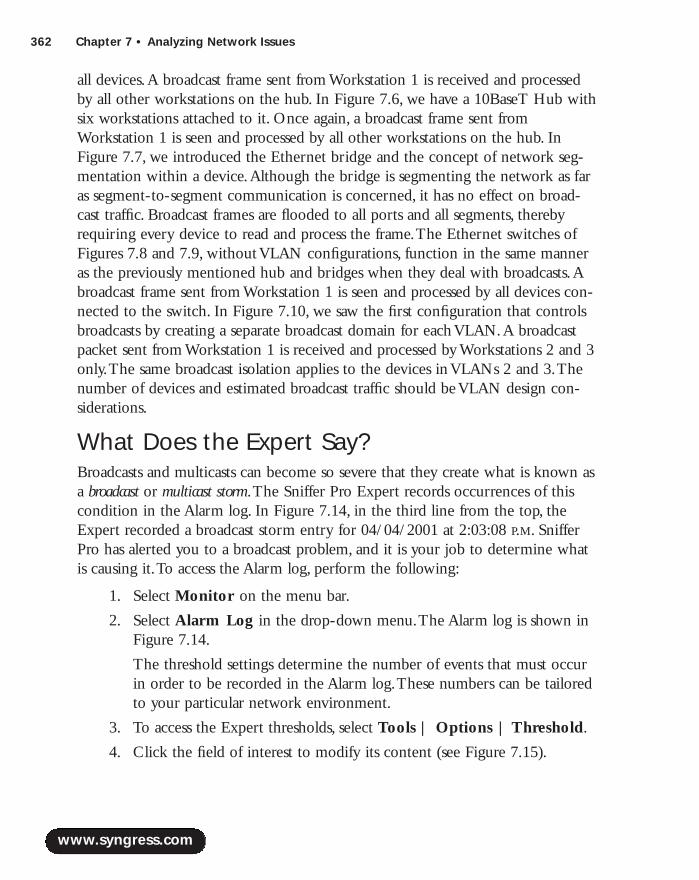
362 Chapter 7 • Analyzing Network Issues
all devices.A broadcast frame sent from Workstation 1 is received and processedby all other workstations on the hub. In Figure 7.6, we have a 10BaseT Hub withsix workstations attached to it. Once again, a broadcast frame sent fromWorkstation 1 is seen and processed by all other workstations on the hub. InFigure 7.7, we introduced the Ethernet bridge and the concept of network seg-mentation within a device.Although the bridge is segmenting the network as faras segment-to-segment communication is concerned, it has no effect on broad-cast traffic. Broadcast frames are flooded to all ports and all segments, therebyrequiring every device to read and process the frame.The Ethernet switches ofFigures 7.8 and 7.9, without VLAN configurations, function in the same manneras the previously mentioned hub and bridges when they deal with broadcasts.Abroadcast frame sent from Workstation 1 is seen and processed by all devices con-nected to the switch. In Figure 7.10, we saw the first configuration that controlsbroadcasts by creating a separate broadcast domain for each VLAN.A broadcastpacket sent from Workstation 1 is received and processed by Workstations 2 and 3only.The same broadcast isolation applies to the devices in VLANs 2 and 3.Thenumber of devices and estimated broadcast traffic should be VLAN design con-siderations.
What Does the Expert Say?Broadcasts and multicasts can become so severe that they create what is known asa broadcast or multicast storm.The Sniffer Pro Expert records occurrences of thiscondition in the Alarm log. In Figure 7.14, in the third line from the top, theExpert recorded a broadcast storm entry for 04/04/2001 at 2:03:08 P.M. SnifferPro has alerted you to a broadcast problem, and it is your job to determine whatis causing it.To access the Alarm log, perform the following:
1. Select Monitor on the menu bar.
2. Select Alarm Log in the drop-down menu.The Alarm log is shown inFigure 7.14.
The threshold settings determine the number of events that must occurin order to be recorded in the Alarm log.These numbers can be tailoredto your particular network environment.
3. To access the Expert thresholds, select Tools | Options | Threshold.
4. Click the field of interest to modify its content (see Figure 7.15).
www.syngress.com
219_sniffer_07.qxd 6/28/02 11:56 AM Page 362
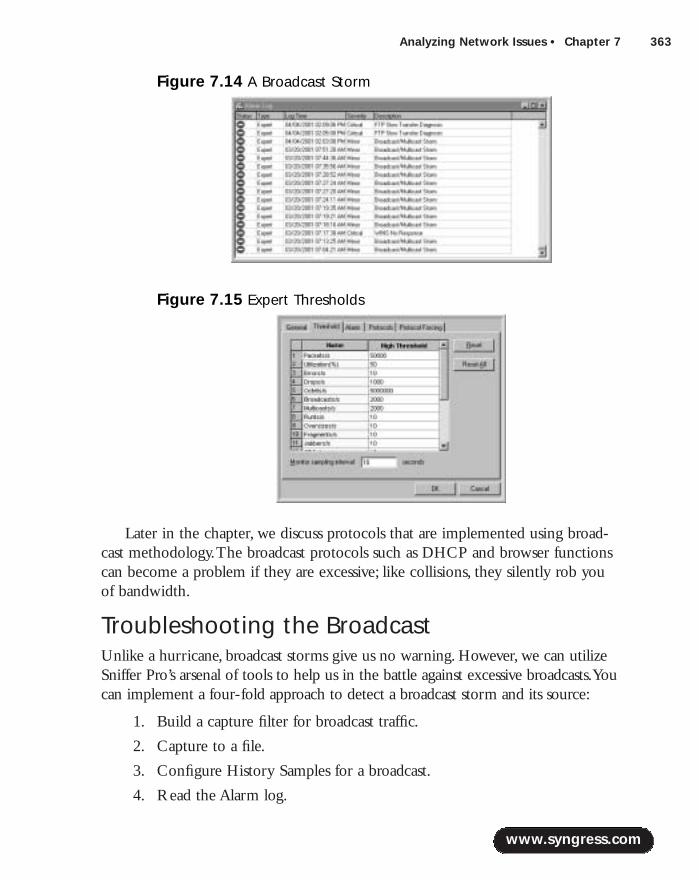
Analyzing Network Issues • Chapter 7 363
Later in the chapter, we discuss protocols that are implemented using broad-cast methodology.The broadcast protocols such as DHCP and browser functionscan become a problem if they are excessive; like collisions, they silently rob youof bandwidth.
Troubleshooting the BroadcastUnlike a hurricane, broadcast storms give us no warning. However, we can utilizeSniffer Pro’s arsenal of tools to help us in the battle against excessive broadcasts.Youcan implement a four-fold approach to detect a broadcast storm and its source:
1. Build a capture filter for broadcast traffic.
2. Capture to a file.
3. Configure History Samples for a broadcast.
4. Read the Alarm log.
www.syngress.com
Figure 7.14 A Broadcast Storm
Figure 7.15 Expert Thresholds
219_sniffer_07.qxd 6/28/02 11:56 AM Page 363
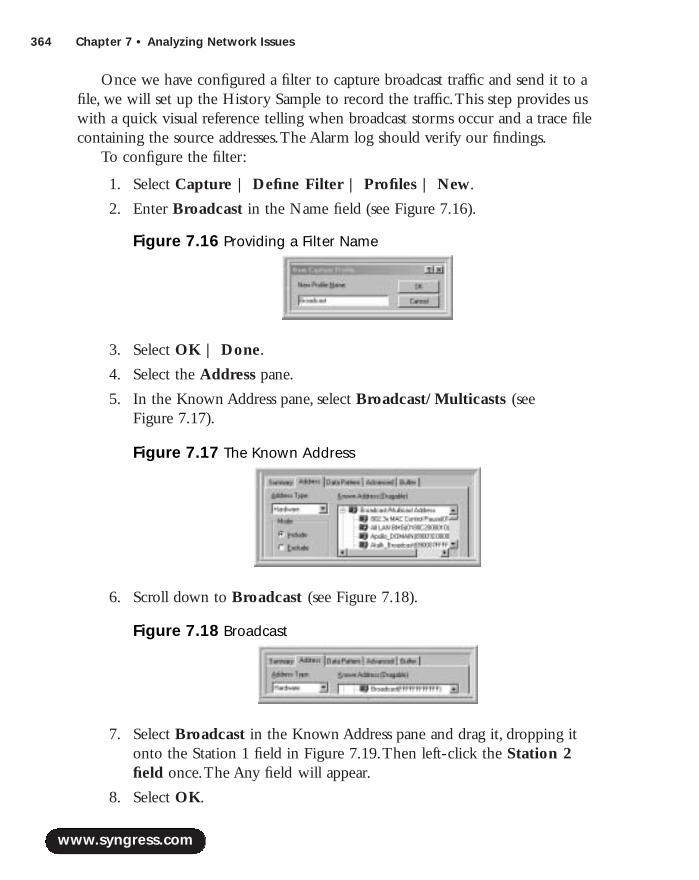
364 Chapter 7 • Analyzing Network Issues
Once we have configured a filter to capture broadcast traffic and send it to afile, we will set up the History Sample to record the traffic.This step provides uswith a quick visual reference telling when broadcast storms occur and a trace filecontaining the source addresses.The Alarm log should verify our findings.
To configure the filter:
1. Select Capture | Define Filter | Profiles | New.
2. Enter Broadcast in the Name field (see Figure 7.16).
3. Select OK | Done.
4. Select the Address pane.
5. In the Known Address pane, select Broadcast/Multicasts (see Figure 7.17).
6. Scroll down to Broadcast (see Figure 7.18).
7. Select Broadcast in the Known Address pane and drag it, dropping itonto the Station 1 field in Figure 7.19.Then left-click the Station 2field once.The Any field will appear.
8. Select OK.
www.syngress.com
Figure 7.16 Providing a Filter Name
Figure 7.17 The Known Address
Figure 7.18 Broadcast
219_sniffer_07.qxd 6/28/02 11:56 AM Page 364
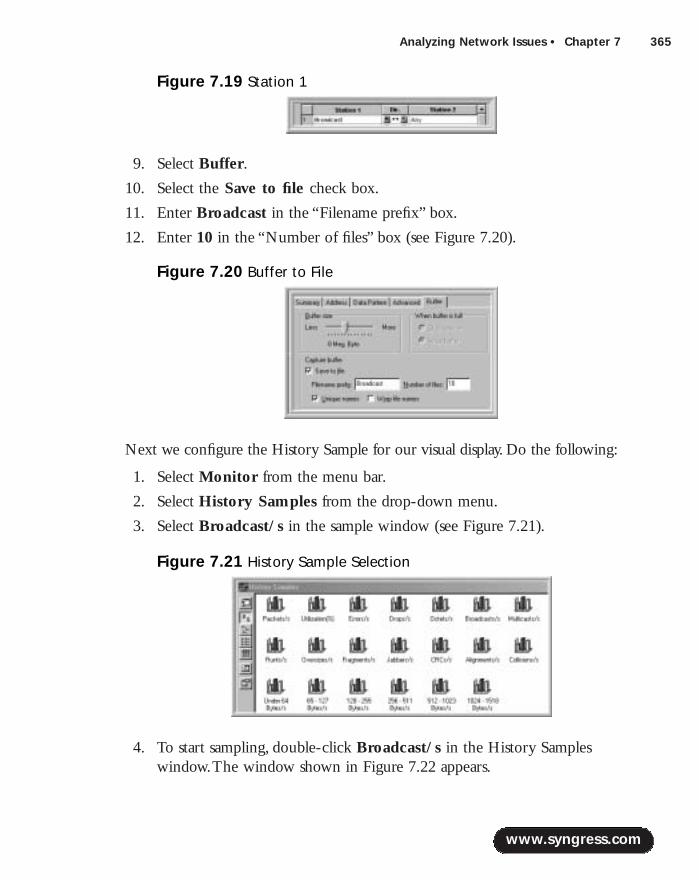
Analyzing Network Issues • Chapter 7 365
9. Select Buffer.
10. Select the Save to file check box.
11. Enter Broadcast in the “Filename prefix” box.
12. Enter 10 in the “Number of files” box (see Figure 7.20).
Next we configure the History Sample for our visual display. Do the following:
1. Select Monitor from the menu bar.
2. Select History Samples from the drop-down menu.
3. Select Broadcast/s in the sample window (see Figure 7.21).
4. To start sampling, double-click Broadcast/s in the History Sampleswindow.The window shown in Figure 7.22 appears.
www.syngress.com
Figure 7.19 Station 1
Figure 7.20 Buffer to File
Figure 7.21 History Sample Selection
219_sniffer_07.qxd 6/28/02 11:56 AM Page 365

366 Chapter 7 • Analyzing Network Issues
You are now sampling for broadcast traffic. Start the broadcast filter captureand you will be ready to capture the next broadcast storm.You can monitor theHistory Sample window so that you know when to stop the capture.An inspec-tion of the appropriate capture file that corresponds with the History Sampletime stamp should produce the source address and reveal the culprit, as indicatedin Figure 7.22.
Resetting Token Ring NetworksToken Ring networks, although decreasing in number, are still in wide use today.Token Ring is the IEEE 802.5 standard for token-passing technology. OriginallyToken Ring was a 4Mbps standard.The systems in use today operate at 16Mbps,and some newer systems operate even faster.
The topology used by Token Ring networks resembles a star configuration.However, it is actually a ring. In Figure 7.23, we see four workstations with theirMAC addresses listed below them. If we start from the left of the diagram atStation 1 and trace the arrows indicating signal flow, it becomes apparent that weare dealing with a physical ring topology.The device labeled MSAU is a multi-station access unit (sometimes abbreviated MAU).This unit is functionally a pas-sive hub for Token Ring. MAUs can be connected in a manner that expands thenetwork diameter. In Figure 7.23, the first port on the MAU is called the ring-inand the last port is called the ring-out. In this configuration, the ring-in is inter-nally looped back to the ring-out.
www.syngress.com
Figure 7.22 A Broadcast Storm
219_sniffer_07.qxd 6/28/02 11:56 AM Page 366

Analyzing Network Issues • Chapter 7 367
Multi-MAU ConfigurationsThe configuration shown in Figure 7.24 consists of three MAUs connected toprovide a ring topology for 24 devices, eight devices per MAU.
Token Ring topology provides a mechanism for ring failover operation. Forexample, consider the topology in Figure 7.24 as having each MAU on a separatefloor in a building.
www.syngress.com
Figure 7.23 A Token Ring Network
IBM2 118D9D NGCTI 010116 IBM2 12F7ECIBM2 118E9A
Station 1 Station 2 Station 3 Station 4
MSAU
Figure 7.24 A Multi-MAU Configuration
MAU -1
MAU -2
MAU -3
219_sniffer_07.qxd 6/28/02 11:56 AM Page 367
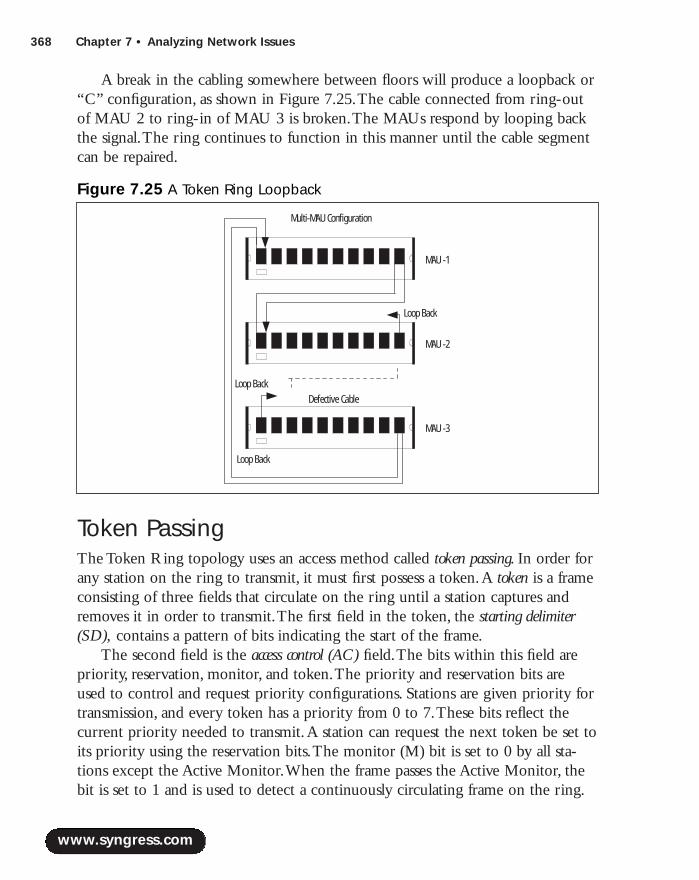
368 Chapter 7 • Analyzing Network Issues
A break in the cabling somewhere between floors will produce a loopback or“C” configuration, as shown in Figure 7.25.The cable connected from ring-outof MAU 2 to ring-in of MAU 3 is broken.The MAUs respond by looping backthe signal.The ring continues to function in this manner until the cable segmentcan be repaired.
Token PassingThe Token Ring topology uses an access method called token passing. In order forany station on the ring to transmit, it must first possess a token.A token is a frameconsisting of three fields that circulate on the ring until a station captures andremoves it in order to transmit.The first field in the token, the starting delimiter(SD), contains a pattern of bits indicating the start of the frame.
The second field is the access control (AC) field.The bits within this field arepriority, reservation, monitor, and token.The priority and reservation bits areused to control and request priority configurations. Stations are given priority fortransmission, and every token has a priority from 0 to 7.These bits reflect thecurrent priority needed to transmit.A station can request the next token be set toits priority using the reservation bits.The monitor (M) bit is set to 0 by all sta-tions except the Active Monitor.When the frame passes the Active Monitor, thebit is set to 1 and is used to detect a continuously circulating frame on the ring.
www.syngress.com
Figure 7.25 A Token Ring Loopback
Multi-MAU Configuration
Defective Cable
Loop Back
Loop Back
Loop Back
MAU -1
MAU -2
MAU -3
219_sniffer_07.qxd 6/28/02 11:56 AM Page 368
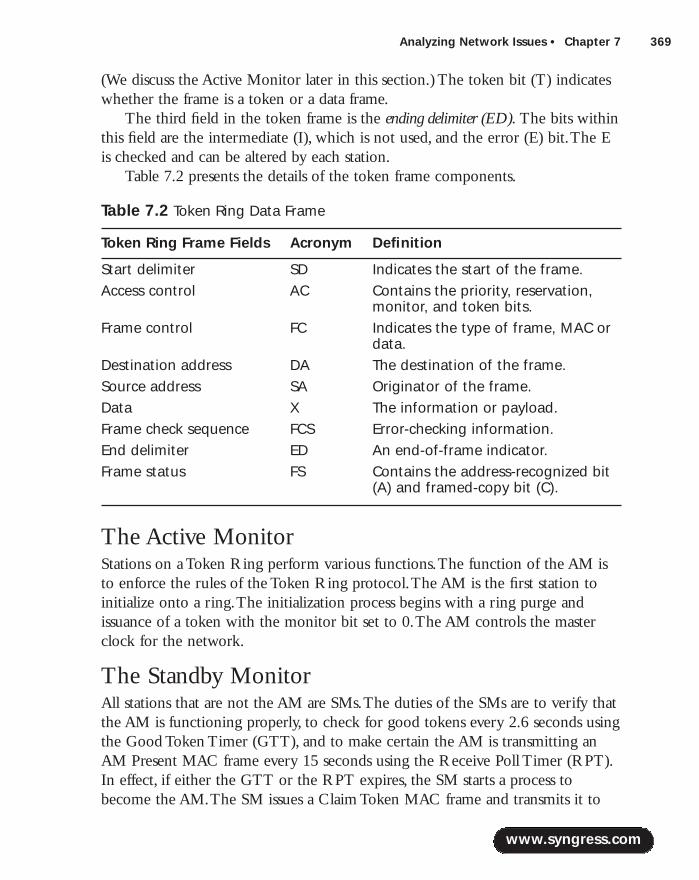
Analyzing Network Issues • Chapter 7 369
(We discuss the Active Monitor later in this section.) The token bit (T) indicateswhether the frame is a token or a data frame.
The third field in the token frame is the ending delimiter (ED). The bits withinthis field are the intermediate (I), which is not used, and the error (E) bit.The Eis checked and can be altered by each station.
Table 7.2 presents the details of the token frame components.
Table 7.2 Token Ring Data Frame
Token Ring Frame Fields Acronym Definition
Start delimiter SD Indicates the start of the frame.Access control AC Contains the priority, reservation,
monitor, and token bits.Frame control FC Indicates the type of frame, MAC or
data.Destination address DA The destination of the frame.Source address SA Originator of the frame.Data X The information or payload.Frame check sequence FCS Error-checking information.End delimiter ED An end-of-frame indicator.Frame status FS Contains the address-recognized bit
(A) and framed-copy bit (C).
The Active MonitorStations on a Token Ring perform various functions.The function of the AM isto enforce the rules of the Token Ring protocol.The AM is the first station toinitialize onto a ring.The initialization process begins with a ring purge andissuance of a token with the monitor bit set to 0.The AM controls the masterclock for the network.
The Standby Monitor All stations that are not the AM are SMs.The duties of the SMs are to verify thatthe AM is functioning properly, to check for good tokens every 2.6 seconds usingthe Good Token Timer (GTT), and to make certain the AM is transmitting anAM Present MAC frame every 15 seconds using the Receive Poll Timer (RPT).In effect, if either the GTT or the RPT expires, the SM starts a process tobecome the AM.The SM issues a Claim Token MAC frame and transmits it to
www.syngress.com
219_sniffer_07.qxd 6/28/02 11:56 AM Page 369
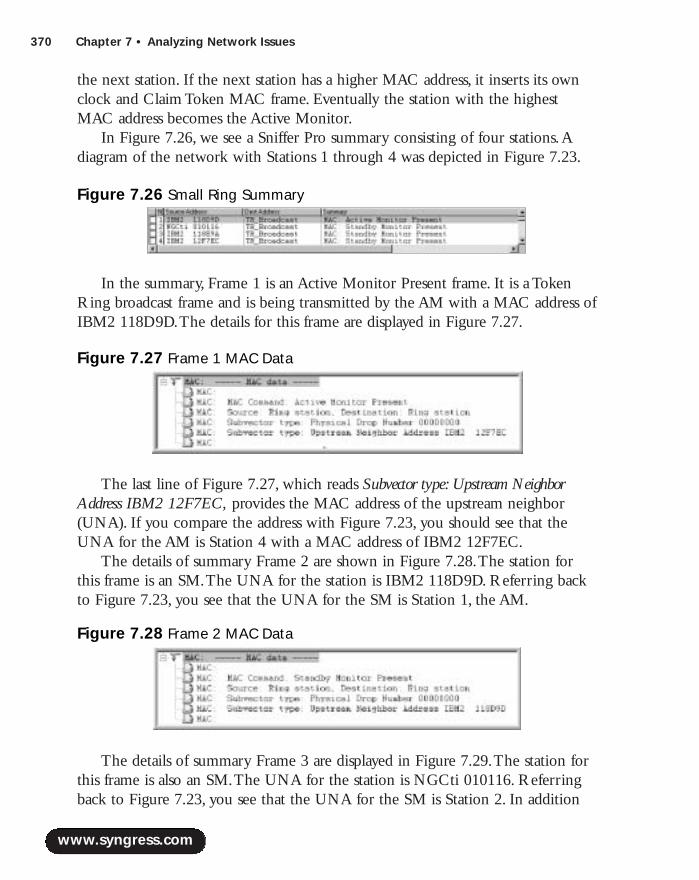
370 Chapter 7 • Analyzing Network Issues
the next station. If the next station has a higher MAC address, it inserts its ownclock and Claim Token MAC frame. Eventually the station with the highestMAC address becomes the Active Monitor.
In Figure 7.26, we see a Sniffer Pro summary consisting of four stations.Adiagram of the network with Stations 1 through 4 was depicted in Figure 7.23.
In the summary, Frame 1 is an Active Monitor Present frame. It is a TokenRing broadcast frame and is being transmitted by the AM with a MAC address ofIBM2 118D9D.The details for this frame are displayed in Figure 7.27.
The last line of Figure 7.27, which reads Subvector type: Upstream NeighborAddress IBM2 12F7EC, provides the MAC address of the upstream neighbor(UNA). If you compare the address with Figure 7.23, you should see that theUNA for the AM is Station 4 with a MAC address of IBM2 12F7EC.
The details of summary Frame 2 are shown in Figure 7.28.The station forthis frame is an SM.The UNA for the station is IBM2 118D9D. Referring backto Figure 7.23, you see that the UNA for the SM is Station 1, the AM.
The details of summary Frame 3 are displayed in Figure 7.29.The station forthis frame is also an SM.The UNA for the station is NGCti 010116. Referringback to Figure 7.23, you see that the UNA for the SM is Station 2. In addition
www.syngress.com
Figure 7.26 Small Ring Summary
Figure 7.27 Frame 1 MAC Data
Figure 7.28 Frame 2 MAC Data
219_sniffer_07.qxd 6/28/02 11:57 AM Page 370
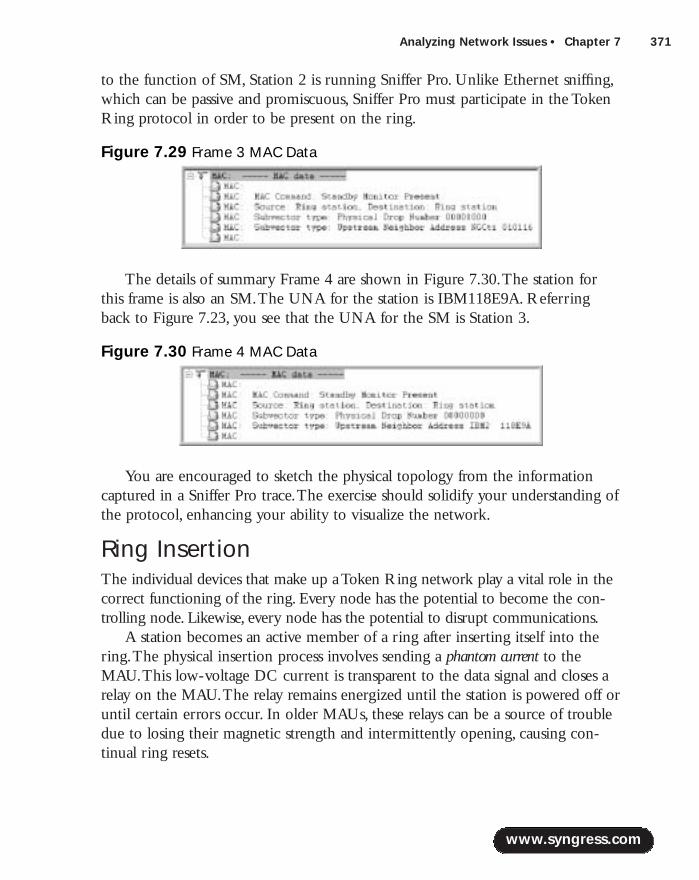
Analyzing Network Issues • Chapter 7 371
to the function of SM, Station 2 is running Sniffer Pro. Unlike Ethernet sniffing,which can be passive and promiscuous, Sniffer Pro must participate in the TokenRing protocol in order to be present on the ring.
The details of summary Frame 4 are shown in Figure 7.30.The station forthis frame is also an SM.The UNA for the station is IBM118E9A. Referringback to Figure 7.23, you see that the UNA for the SM is Station 3.
You are encouraged to sketch the physical topology from the informationcaptured in a Sniffer Pro trace.The exercise should solidify your understanding ofthe protocol, enhancing your ability to visualize the network.
Ring InsertionThe individual devices that make up a Token Ring network play a vital role in thecorrect functioning of the ring. Every node has the potential to become the con-trolling node. Likewise, every node has the potential to disrupt communications.
A station becomes an active member of a ring after inserting itself into thering.The physical insertion process involves sending a phantom current to theMAU.This low-voltage DC current is transparent to the data signal and closes arelay on the MAU.The relay remains energized until the station is powered off oruntil certain errors occur. In older MAUs, these relays can be a source of troubledue to losing their magnetic strength and intermittently opening, causing con-tinual ring resets.
www.syngress.com
Figure 7.29 Frame 3 MAC Data
Figure 7.30 Frame 4 MAC Data
219_sniffer_07.qxd 6/28/02 11:57 AM Page 371
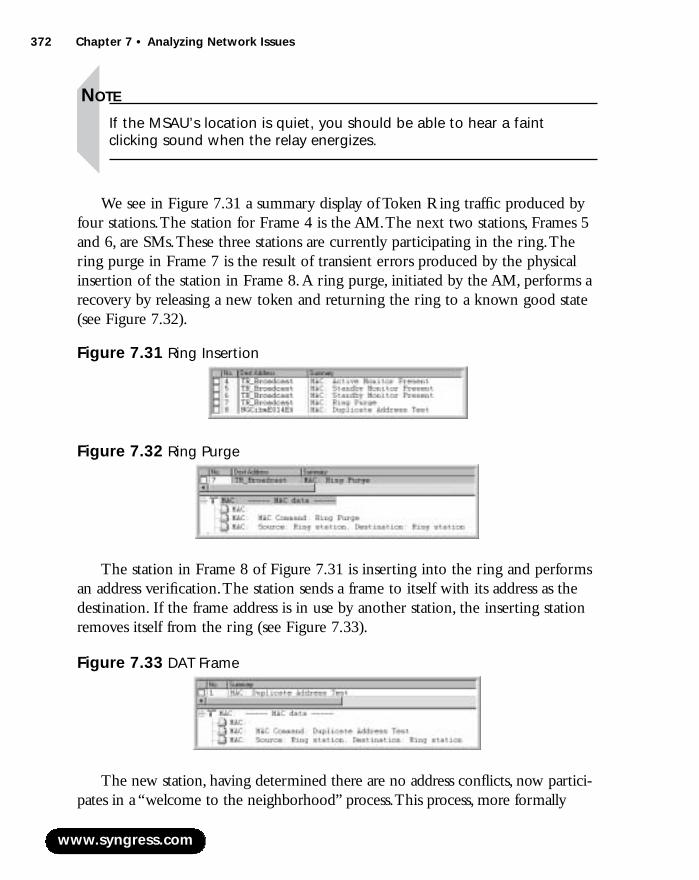
372 Chapter 7 • Analyzing Network Issues
NOTE
If the MSAU’s location is quiet, you should be able to hear a faintclicking sound when the relay energizes.
We see in Figure 7.31 a summary display of Token Ring traffic produced byfour stations.The station for Frame 4 is the AM.The next two stations, Frames 5and 6, are SMs.These three stations are currently participating in the ring.Thering purge in Frame 7 is the result of transient errors produced by the physicalinsertion of the station in Frame 8.A ring purge, initiated by the AM, performs arecovery by releasing a new token and returning the ring to a known good state(see Figure 7.32).
The station in Frame 8 of Figure 7.31 is inserting into the ring and performsan address verification.The station sends a frame to itself with its address as thedestination. If the frame address is in use by another station, the inserting stationremoves itself from the ring (see Figure 7.33).
The new station, having determined there are no address conflicts, now partici-pates in a “welcome to the neighborhood” process.This process, more formally
www.syngress.com
Figure 7.31 Ring Insertion
Figure 7.32 Ring Purge
Figure 7.33 DAT Frame
219_sniffer_07.qxd 6/28/02 11:57 AM Page 372
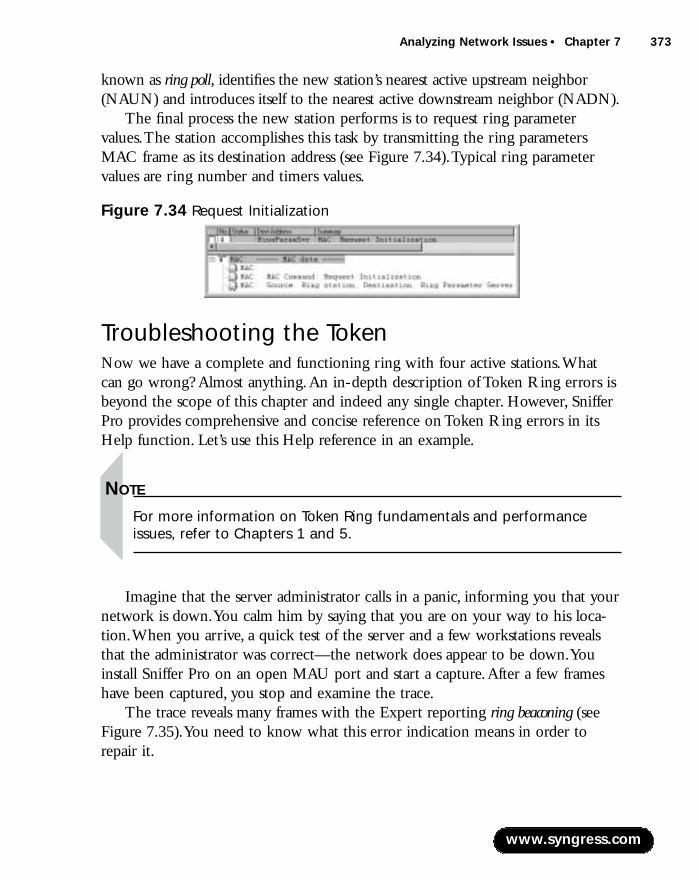
Analyzing Network Issues • Chapter 7 373
known as ring poll, identifies the new station’s nearest active upstream neighbor(NAUN) and introduces itself to the nearest active downstream neighbor (NADN).
The final process the new station performs is to request ring parametervalues.The station accomplishes this task by transmitting the ring parametersMAC frame as its destination address (see Figure 7.34).Typical ring parametervalues are ring number and timers values.
Troubleshooting the TokenNow we have a complete and functioning ring with four active stations.Whatcan go wrong? Almost anything.An in-depth description of Token Ring errors isbeyond the scope of this chapter and indeed any single chapter. However, SnifferPro provides comprehensive and concise reference on Token Ring errors in itsHelp function. Let’s use this Help reference in an example.
NOTE
For more information on Token Ring fundamentals and performanceissues, refer to Chapters 1 and 5.
Imagine that the server administrator calls in a panic, informing you that yournetwork is down.You calm him by saying that you are on your way to his loca-tion.When you arrive, a quick test of the server and a few workstations revealsthat the administrator was correct—the network does appear to be down.Youinstall Sniffer Pro on an open MAU port and start a capture.After a few frameshave been captured, you stop and examine the trace.
The trace reveals many frames with the Expert reporting ring beaconing (seeFigure 7.35).You need to know what this error indication means in order torepair it.
www.syngress.com
Figure 7.34 Request Initialization
219_sniffer_07.qxd 6/28/02 11:57 AM Page 373

374 Chapter 7 • Analyzing Network Issues
You notice signal loss in the packet and decide to use the Help function tofurther clarify your findings. Do the following:
1. Select Help | Index.
2. Enter Token Ring MAC Statistics in the Index field to display thescreen shown in Figure 7.36.
To display the definition of the error, move the mouse over the word beaconin the last line of the Statistics and left-click.The display shown in Figure 7.37appears.The report indicates a serious physical problem with the network, prob-ably a broken cable.
Sniffer Pro has provided you with a definition of the error and a suggestionas to the cause. For the record, a broken cable or open relay on a MAU is a fre-quent occurrence on a Token Ring network, particularly in older installations.
www.syngress.com
Figure 7.35 Beacon Frame
Figure 7.36 Sniffer Pro Help
Figure 7.37 Beacon Packets
219_sniffer_07.qxd 6/28/02 11:57 AM Page 374
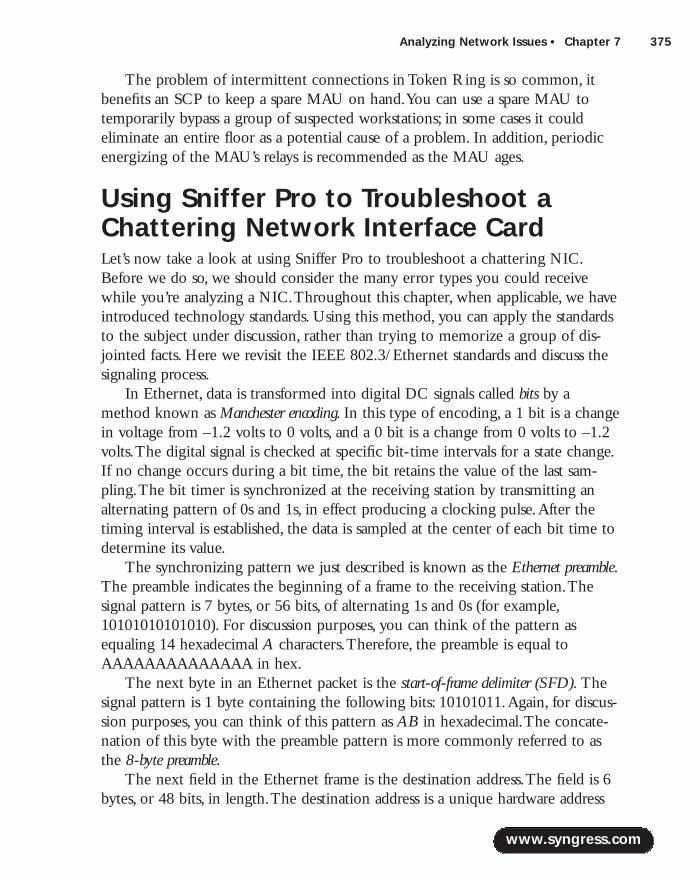
Analyzing Network Issues • Chapter 7 375
The problem of intermittent connections in Token Ring is so common, itbenefits an SCP to keep a spare MAU on hand.You can use a spare MAU totemporarily bypass a group of suspected workstations; in some cases it couldeliminate an entire floor as a potential cause of a problem. In addition, periodicenergizing of the MAU’s relays is recommended as the MAU ages.
Using Sniffer Pro to Troubleshoot aChattering Network Interface Card Let’s now take a look at using Sniffer Pro to troubleshoot a chattering NIC.Before we do so, we should consider the many error types you could receivewhile you’re analyzing a NIC.Throughout this chapter, when applicable, we haveintroduced technology standards. Using this method, you can apply the standardsto the subject under discussion, rather than trying to memorize a group of dis-jointed facts. Here we revisit the IEEE 802.3/Ethernet standards and discuss thesignaling process.
In Ethernet, data is transformed into digital DC signals called bits by amethod known as Manchester encoding. In this type of encoding, a 1 bit is a changein voltage from –1.2 volts to 0 volts, and a 0 bit is a change from 0 volts to –1.2volts.The digital signal is checked at specific bit-time intervals for a state change.If no change occurs during a bit time, the bit retains the value of the last sam-pling.The bit timer is synchronized at the receiving station by transmitting analternating pattern of 0s and 1s, in effect producing a clocking pulse.After thetiming interval is established, the data is sampled at the center of each bit time todetermine its value.
The synchronizing pattern we just described is known as the Ethernet preamble.The preamble indicates the beginning of a frame to the receiving station.Thesignal pattern is 7 bytes, or 56 bits, of alternating 1s and 0s (for example,10101010101010). For discussion purposes, you can think of the pattern asequaling 14 hexadecimal A characters.Therefore, the preamble is equal toAAAAAAAAAAAAAA in hex.
The next byte in an Ethernet packet is the start-of-frame delimiter (SFD). Thesignal pattern is 1 byte containing the following bits: 10101011.Again, for discus-sion purposes, you can think of this pattern as AB in hexadecimal.The concate-nation of this byte with the preamble pattern is more commonly referred to asthe 8-byte preamble.
The next field in the Ethernet frame is the destination address.The field is 6bytes, or 48 bits, in length.The destination address is a unique hardware address
www.syngress.com
219_sniffer_07.qxd 6/28/02 11:57 AM Page 375
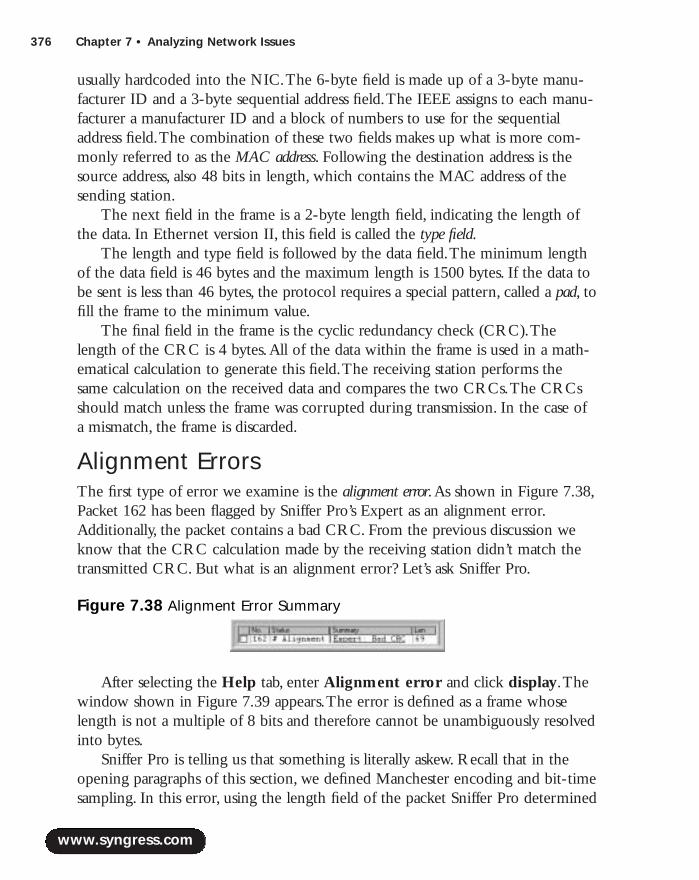
376 Chapter 7 • Analyzing Network Issues
usually hardcoded into the NIC.The 6-byte field is made up of a 3-byte manu-facturer ID and a 3-byte sequential address field.The IEEE assigns to each manu-facturer a manufacturer ID and a block of numbers to use for the sequentialaddress field.The combination of these two fields makes up what is more com-monly referred to as the MAC address. Following the destination address is thesource address, also 48 bits in length, which contains the MAC address of thesending station.
The next field in the frame is a 2-byte length field, indicating the length ofthe data. In Ethernet version II, this field is called the type field.
The length and type field is followed by the data field.The minimum lengthof the data field is 46 bytes and the maximum length is 1500 bytes. If the data tobe sent is less than 46 bytes, the protocol requires a special pattern, called a pad, tofill the frame to the minimum value.
The final field in the frame is the cyclic redundancy check (CRC).Thelength of the CRC is 4 bytes.All of the data within the frame is used in a math-ematical calculation to generate this field.The receiving station performs thesame calculation on the received data and compares the two CRCs.The CRCsshould match unless the frame was corrupted during transmission. In the case ofa mismatch, the frame is discarded.
Alignment ErrorsThe first type of error we examine is the alignment error.As shown in Figure 7.38,Packet 162 has been flagged by Sniffer Pro’s Expert as an alignment error.Additionally, the packet contains a bad CRC. From the previous discussion weknow that the CRC calculation made by the receiving station didn’t match thetransmitted CRC. But what is an alignment error? Let’s ask Sniffer Pro.
After selecting the Help tab, enter Alignment error and click display.Thewindow shown in Figure 7.39 appears.The error is defined as a frame whoselength is not a multiple of 8 bits and therefore cannot be unambiguously resolvedinto bytes.
Sniffer Pro is telling us that something is literally askew. Recall that in theopening paragraphs of this section, we defined Manchester encoding and bit-timesampling. In this error, using the length field of the packet Sniffer Pro determined
www.syngress.com
Figure 7.38 Alignment Error Summary
219_sniffer_07.qxd 6/28/02 11:57 AM Page 376
Analyzing Network Issues • Chapter 7 377
that the transmission of data bits should have stopped, but it didn’t. Furthermore,the additional bits didn’t add up to 8.The other possibility is that Sniffer Pro wassampling a byte and it ended prematurely (because, for example, there were notenough bits).This type of error is usually caused by data skewing on the trans-mission medium as the result of propagation anomalies, thereby creating errors insampling.
In this type of error, you can usually determine the MAC addresses and findthe source of the problem. If the MAC addresses are consistent, the station withthat address is usually at fault. If the MAC addresses are not consistent, map themto the topology and check the cable plant at that location.
www.syngress.com
Figure 7.39 Alignment Error Help
Fluke LANMeterOften a physical problem in a network can manifest itself in the form ofa complex symptom. The guarantee of a properly functioning cableplant can be invaluable to the SCP during troubleshooting. The FlukeLANMeter cable and hardware tester is a device that you can use toassure the functionality of the network cabling.
The LANMeter is much more than a simple cable tester. Itsnumerous functions include network monitoring, switch testing, remoteaccess, protocol analysis, and more. The Fluke LANMeter can verify a Token Ring cable’s ability to operate at16Mbps. The LANMeter can also test the Token Ring MAU for faultyrelays. For Ethernet, the LANMeter can measure the length of a cable todetermine the cause of late collisions and test for proper grounding.Additionally, the LANMeter can measure fiber optic cable loss and detectbad connections, bad splices, broken fibers, and loss of power frombends and fiber type mismatches.
Designing & Planning…
219_sniffer_07.qxd 6/28/02 11:57 AM Page 377
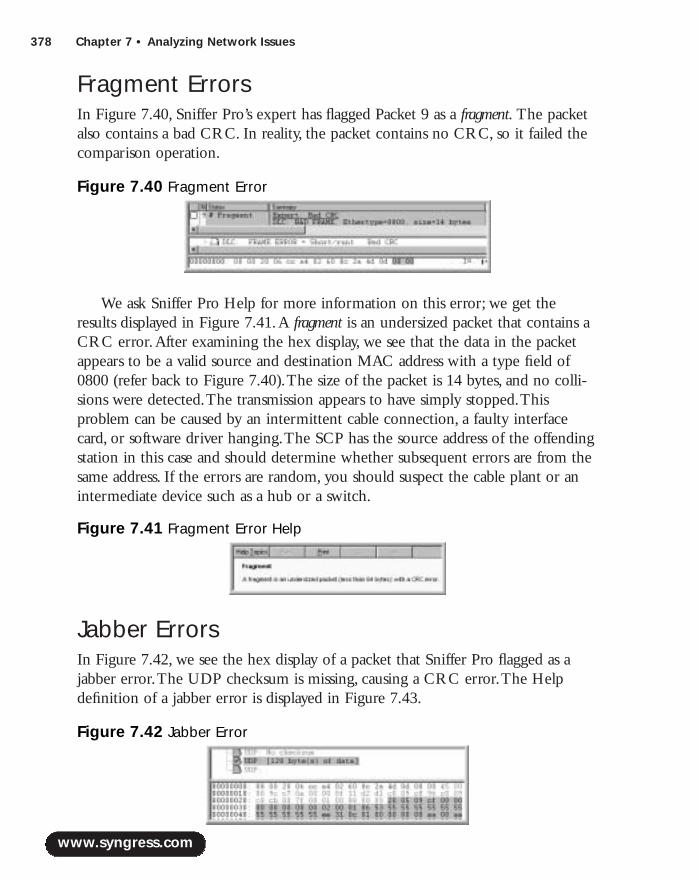
378 Chapter 7 • Analyzing Network Issues
Fragment ErrorsIn Figure 7.40, Sniffer Pro’s expert has flagged Packet 9 as a fragment. The packetalso contains a bad CRC. In reality, the packet contains no CRC, so it failed thecomparison operation.
We ask Sniffer Pro Help for more information on this error; we get theresults displayed in Figure 7.41.A fragment is an undersized packet that contains aCRC error.After examining the hex display, we see that the data in the packetappears to be a valid source and destination MAC address with a type field of0800 (refer back to Figure 7.40).The size of the packet is 14 bytes, and no colli-sions were detected.The transmission appears to have simply stopped.Thisproblem can be caused by an intermittent cable connection, a faulty interfacecard, or software driver hanging.The SCP has the source address of the offendingstation in this case and should determine whether subsequent errors are from thesame address. If the errors are random, you should suspect the cable plant or anintermediate device such as a hub or a switch.
Jabber ErrorsIn Figure 7.42, we see the hex display of a packet that Sniffer Pro flagged as ajabber error.The UDP checksum is missing, causing a CRC error.The Help definition of a jabber error is displayed in Figure 7.43.
www.syngress.com
Figure 7.40 Fragment Error
Figure 7.41 Fragment Error Help
Figure 7.42 Jabber Error
219_sniffer_07.qxd 6/28/02 11:57 AM Page 378

Analyzing Network Issues • Chapter 7 379
Sniffer Pro defines a jabber error as a frame containing random or garbage data,hence the moniker jabber.The packet is oversized, with a CRC error.With that inmind, let’s examine the packet more closely for clues.There appear to be validsource and destination MAC addresses, and the type field of 0800 looks okay.Thedata starting at offset 2B in the packet appears to be valid until we reach offset3B.At this point, the data starts repeating a consistent value of 55 in hex.Although this data might be valid ASCII U characters, it has no valid EBCDICcounterpart.
Let’s look at this suspicious character more closely. Hexadecimal 55 equalsbinary 01010101.You should recognize the alternating pattern of 0s and 1s.Thepattern appears to be a spurious clocking signal without data.
In Figure 7.44, we see a continuation of the jabber error frame. Starting atoffset 460 in the packet, the data consists of normal ASCII escape sequence charac-ters (such as 0, X, esc, *, q, 1,A, esc, *, b, 2, 5, 1,W, us). However, at offset 46F—thelast character in the first line—a repetitious pattern of (ff ) characters begins.
Let’s look at the character more closely.The hexadecimal value (ff ) equalsbinary 11111111.This value is neither a valid ASCII nor an EBCDIC character.Well, then, what is it? You are reminded of the previous discussion of Manchesterencoding. If no change occurs during a bit time, the bit retains the value of thelast sampling. In effect, the receiving stations (both Sniffer Pro and the destinationaddress) are sampling a signal stuck at 1.As Sniffer Pro Help suggested, this situa-tion can be caused by a hardware fault. In addition, a software driver or anydevice (hub or switch) on the segment that can hold the signal level highwithout causing a collision can also cause this error.The first suspect should bethe source station’s interface card.
www.syngress.com
Figure 7.43 Jabber Error Help
Figure 7.44 Jabber Error Continued
219_sniffer_07.qxd 6/28/02 11:57 AM Page 379
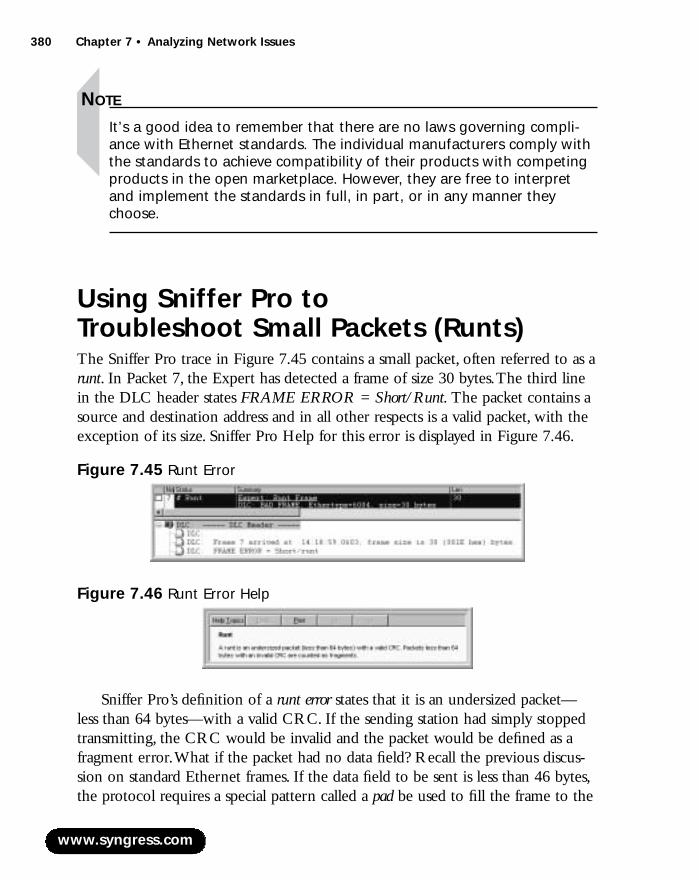
380 Chapter 7 • Analyzing Network Issues
NOTE
It’s a good idea to remember that there are no laws governing compli-ance with Ethernet standards. The individual manufacturers comply withthe standards to achieve compatibility of their products with competingproducts in the open marketplace. However, they are free to interpretand implement the standards in full, in part, or in any manner theychoose.
Using Sniffer Pro to Troubleshoot Small Packets (Runts)The Sniffer Pro trace in Figure 7.45 contains a small packet, often referred to as arunt. In Packet 7, the Expert has detected a frame of size 30 bytes.The third linein the DLC header states FRAME ERROR = Short/Runt. The packet contains asource and destination address and in all other respects is a valid packet, with theexception of its size. Sniffer Pro Help for this error is displayed in Figure 7.46.
Sniffer Pro’s definition of a runt error states that it is an undersized packet—less than 64 bytes—with a valid CRC. If the sending station had simply stoppedtransmitting, the CRC would be invalid and the packet would be defined as afragment error.What if the packet had no data field? Recall the previous discus-sion on standard Ethernet frames. If the data field to be sent is less than 46 bytes,the protocol requires a special pattern called a pad be used to fill the frame to the
www.syngress.com
Figure 7.45 Runt Error
Figure 7.46 Runt Error Help
219_sniffer_07.qxd 6/28/02 11:57 AM Page 380
Analyzing Network Issues • Chapter 7 381
minimum value of 64 bytes. It appears that this error condition cannot happen ifthe standards are followed.
The manufacturer’s compliance with the standards can vary.A runt can becaused by inability of the sending station’s processor to fill the transmit bufferduring a service cycle. If the computer has many interface cards and a slow busprocessor, a parallel operation on multiple interface cards can fail.The question is,how will the station handle the overloaded condition? The Ethernet standardsimply requires the pad to be inserted during normal operation. It does notdefine error-handling procedures.These error algorithms are designed at themanufacturer’s discretion. Some manufacturers choose to discard the packet andlet the upper-layer timers control retry. Other manufacturers continue transmit-ting the packet with a bad CRC, alerting the receiving station to the error (afragment error).
A third method of error handling, employed by some manufacturers, is tocomplete the packet without the pad, requiring the receiving station to processthe error.This method is, in effect, error handling by delegation. Mainframeswere notorious for this type of error handling in the early 1990s.
Whether or not the actual cause of the runt error can be determined, younow have the culprit’s address and know where it lives.
Using Sniffer Pro to Troubleshoot Browsing BattlesThe Computer Browser service is a Windows implementation to help userslocate network resources. It functions, basically, as a distributed series of lists.Thelists are maintained by a group of computers performing various functions insupport of browser clients. In this sense, it is a client/server architecture.
The master browser (MB) maintains the master list (sometimes referred to asthe browse list) of available servers.The list is collected from its domain or work-group and can contain other domains and workgroups.The MB distributes thelist to the backup browser (BB).The BB provides the browser clients with a listof requested resources.The domain master browser (DMBR), which is also theprimary domain controller (PDC), is responsible for synchronizing the browserlist from all BBs within the domain.
The MB is continually collecting server information for the browse list.Periodically, a MB broadcasts an announcement indicating to the BB that theMB is still in service. If the MB browser fails to make this announcement, the BBassumes it is offline and initiates an MB election.The BB periodically contacts
www.syngress.com
219_sniffer_07.qxd 6/28/02 11:57 AM Page 381
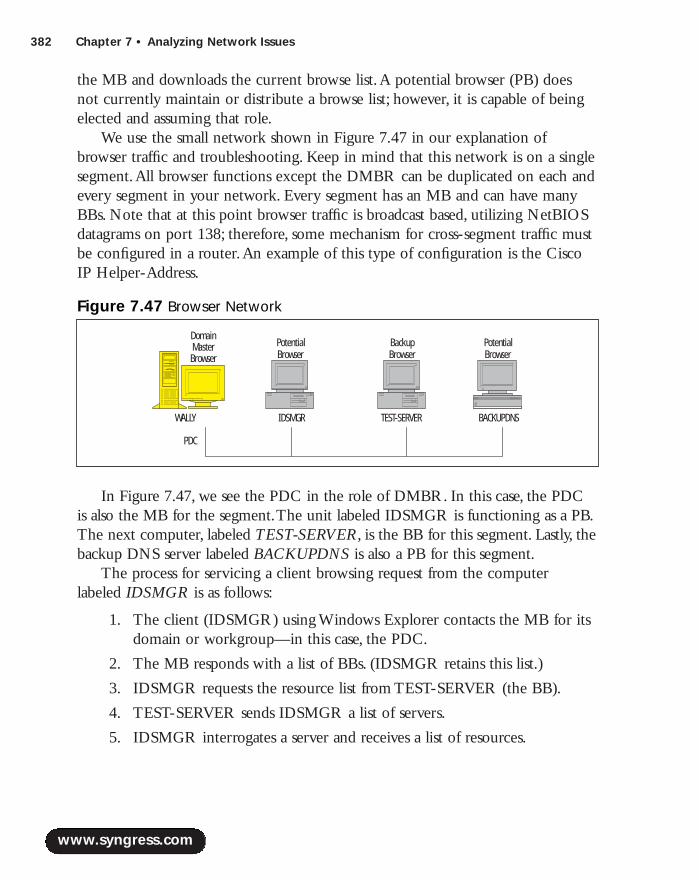
382 Chapter 7 • Analyzing Network Issues
the MB and downloads the current browse list.A potential browser (PB) doesnot currently maintain or distribute a browse list; however, it is capable of beingelected and assuming that role.
We use the small network shown in Figure 7.47 in our explanation ofbrowser traffic and troubleshooting. Keep in mind that this network is on a singlesegment.All browser functions except the DMBR can be duplicated on each andevery segment in your network. Every segment has an MB and can have manyBBs. Note that at this point browser traffic is broadcast based, utilizing NetBIOSdatagrams on port 138; therefore, some mechanism for cross-segment traffic mustbe configured in a router.An example of this type of configuration is the CiscoIP Helper-Address.
In Figure 7.47, we see the PDC in the role of DMBR. In this case, the PDCis also the MB for the segment.The unit labeled IDSMGR is functioning as a PB.The next computer, labeled TEST-SERVER, is the BB for this segment. Lastly, thebackup DNS server labeled BACKUPDNS is also a PB for this segment.
The process for servicing a client browsing request from the computerlabeled IDSMGR is as follows:
1. The client (IDSMGR) using Windows Explorer contacts the MB for itsdomain or workgroup—in this case, the PDC.
2. The MB responds with a list of BBs. (IDSMGR retains this list.)
3. IDSMGR requests the resource list from TEST-SERVER (the BB).
4. TEST-SERVER sends IDSMGR a list of servers.
5. IDSMGR interrogates a server and receives a list of resources.
www.syngress.com
Figure 7.47 Browser Network
BACKUPDNSIDSMGR TEST-SERVERWALLY
PDC
DomainMasterBrowser
PotentialBrowser
BackupBrowser
PotentialBrowser
219_sniffer_07.qxd 6/28/02 11:57 AM Page 382

Analyzing Network Issues • Chapter 7 383
Browser ElectionsBefore we start the discussion on troubleshooting browser traffic, it seems appro-priate to explain how an MB becomes an MB.A browser election determines thecomputer that will function as the MB.The election is held in the event thePDC is booted, a BB is unable to obtain a browse list from the MB, or the clientis unable to obtain a list of BBs from the MB.When a computer experiences oneof these conditions, it broadcasts an election packet.Within the election packet isa list of criteria values such as operating system, version, and browser role (BB orMB) of the computer.
If you examine Figure 7.48, you’ll see a request from the computer TEST-SERVER in Figure 7.47.The Browser Command equals Request Election.TheElection Criteria = 10010F23 and decodes to a computer running the WindowsNT Workstation operating system functioning currently as a BB and SB.Thesevalues are compared to those of the other computers on the segment, and awinner is declared. For example, a Windows NT server is considered a highervalue than a Windows workstation.All computers on the segment receive thebroadcasted election packet and compare the values to their own. Unlike a realelection, however, if the values in the packet are equal or lower, the computerremoves itself from the process by not responding. If, however, the receivingcomputer’s values are higher, it starts a campaign of its own by broadcastinganother election packet.The process continues until no further election packetsare broadcast, and the computer sending the last packet (with the highest values)declares itself the winner, or the MB.
www.syngress.com
Figure 7.48 Browser Election
219_sniffer_07.qxd 6/28/02 11:57 AM Page 383
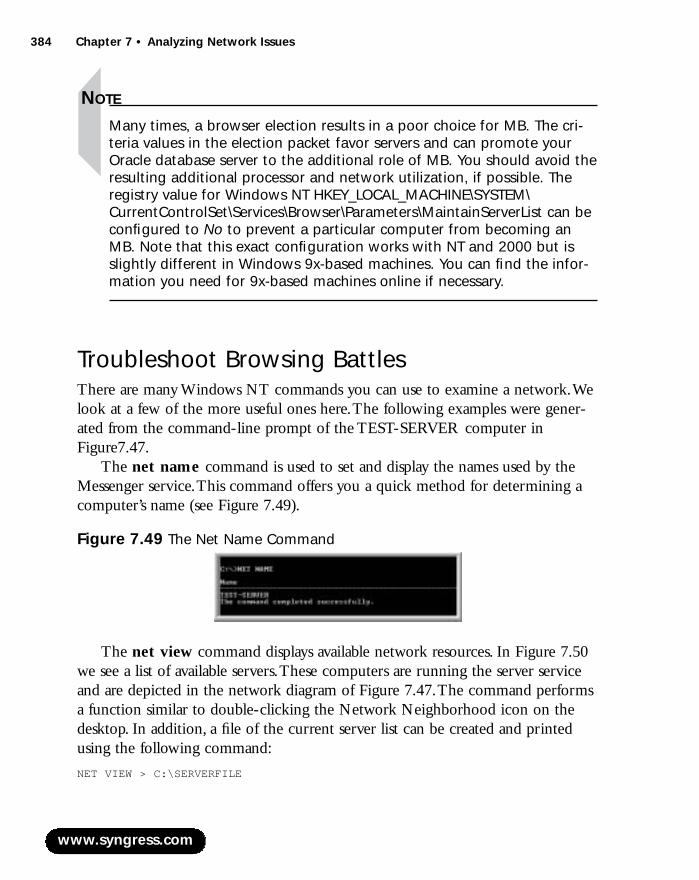
384 Chapter 7 • Analyzing Network Issues
NOTE
Many times, a browser election results in a poor choice for MB. The cri-teria values in the election packet favor servers and can promote yourOracle database server to the additional role of MB. You should avoid theresulting additional processor and network utilization, if possible. Theregistry value for Windows NT HKEY_LOCAL_MACHINE\SYSTEM\CurrentControlSet\Services\Browser\Parameters\MaintainServerList can beconfigured to No to prevent a particular computer from becoming anMB. Note that this exact configuration works with NT and 2000 but isslightly different in Windows 9x-based machines. You can find the infor-mation you need for 9x-based machines online if necessary.
Troubleshoot Browsing BattlesThere are many Windows NT commands you can use to examine a network.Welook at a few of the more useful ones here.The following examples were gener-ated from the command-line prompt of the TEST-SERVER computer inFigure7.47.
The net name command is used to set and display the names used by theMessenger service.This command offers you a quick method for determining acomputer’s name (see Figure 7.49).
The net view command displays available network resources. In Figure 7.50we see a list of available servers.These computers are running the server serviceand are depicted in the network diagram of Figure 7.47.The command performsa function similar to double-clicking the Network Neighborhood icon on thedesktop. In addition, a file of the current server list can be created and printedusing the following command:
NET VIEW > C:\SERVERFILE
www.syngress.com
Figure 7.49 The Net Name Command
219_sniffer_07.qxd 6/28/02 11:57 AM Page 384
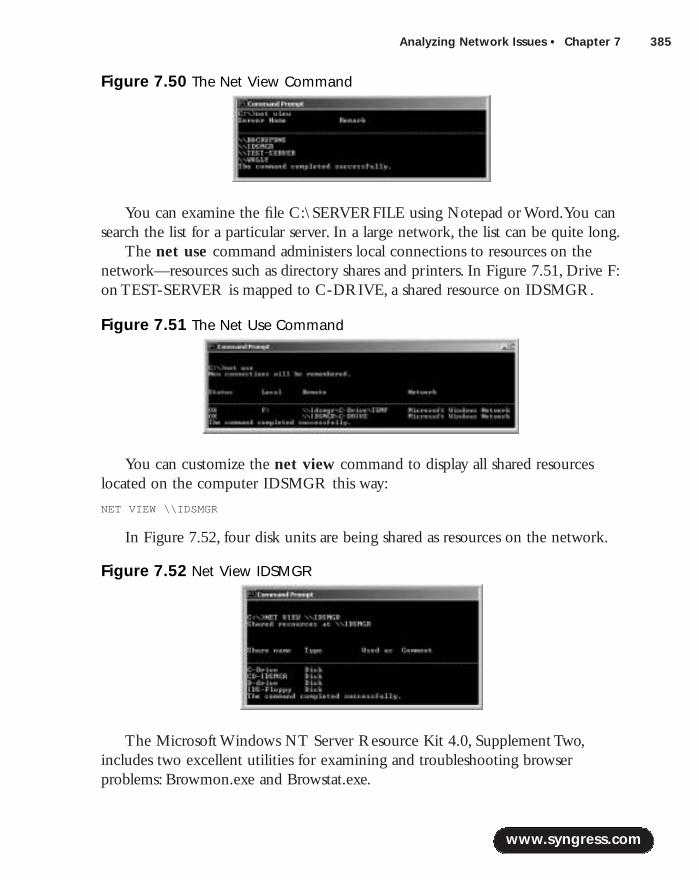
Analyzing Network Issues • Chapter 7 385
You can examine the file C:\SERVERFILE using Notepad or Word.You cansearch the list for a particular server. In a large network, the list can be quite long.
The net use command administers local connections to resources on thenetwork—resources such as directory shares and printers. In Figure 7.51, Drive F:on TEST-SERVER is mapped to C-DRIVE, a shared resource on IDSMGR.
You can customize the net view command to display all shared resourceslocated on the computer IDSMGR this way:
NET VIEW \\IDSMGR
In Figure 7.52, four disk units are being shared as resources on the network.
The Microsoft Windows NT Server Resource Kit 4.0, Supplement Two,includes two excellent utilities for examining and troubleshooting browser problems: Browmon.exe and Browstat.exe.
www.syngress.com
Figure 7.50 The Net View Command
Figure 7.51 The Net Use Command
Figure 7.52 Net View IDSMGR
219_sniffer_07.qxd 6/28/02 11:57 AM Page 385

386 Chapter 7 • Analyzing Network Issues
Browmon.exe is a graphical utility that can be used to view master andbackup browsers. It lists the browser servers for each protocol in use by com-puters in the domain. Browstat.exe is a command-line utility that performs thefunctions of Browmon.exe and more. Browstat.exe can force an election andforce a master browser to stop, therefore invoking an election. Controlling theelection process can be useful in troubleshooting a problem.
Here’s an example of a Browstat.exe command used to find the MB for adomain:
BROWSTAT GETMASTER <transport> <domain_name>
In the command, transport is the equivalent of the protocol, and domain_name isthe Windows domain of interest.
Other useful commands are getblist (get backup list) and stats (statistics).These command-line entries can be redirected to files for creating a dynamicrecord of browser topology changes.You can use this information in conjunctionwith the registry settings to control the browser environment.
Browser CommunicationNow that we have examined the various roles browsers play in a networkingenvironment, let’s focus on browser communication as it pertains to updates.Asyou see in this section, browser traffic can become excessive if it’s not controlledproperly.
The Sniffer Pro trace in Figure7.53 contains packets captured from our dis-cussion network depicted in the diagram of Figure 7.47. Let’s examine thesepackets in turn as they apply to browser communication.
In Packet 1, the computer WALLY is broadcasting a local master announce-ment.The announcement, in effect, declares this computer to be the MB for this
www.syngress.com
Figure 7.53 Browser Announcements
219_sniffer_07.qxd 6/28/02 11:57 AM Page 386
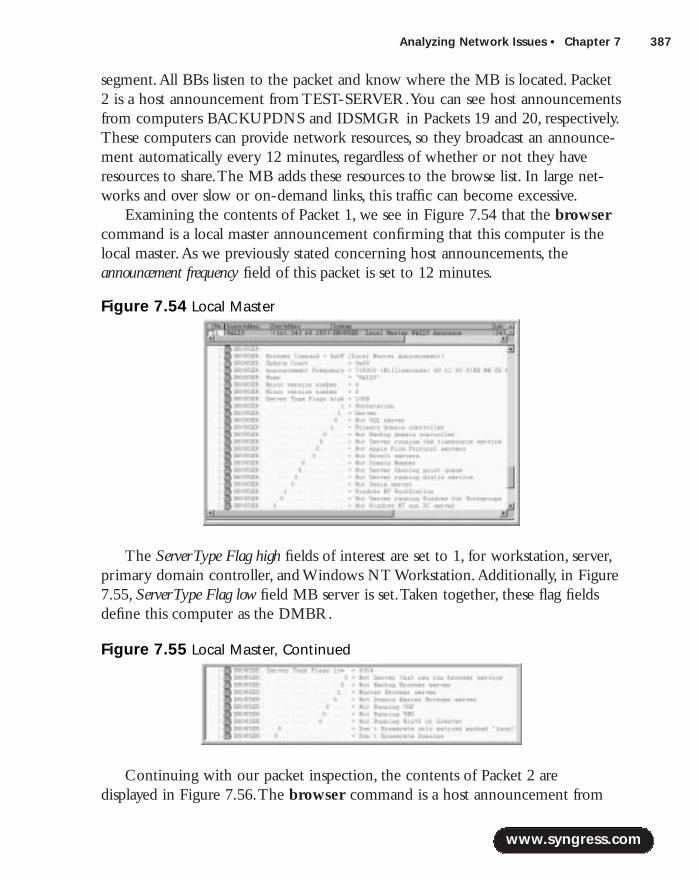
Analyzing Network Issues • Chapter 7 387
segment.All BBs listen to the packet and know where the MB is located. Packet2 is a host announcement from TEST-SERVER.You can see host announcementsfrom computers BACKUPDNS and IDSMGR in Packets 19 and 20, respectively.These computers can provide network resources, so they broadcast an announce-ment automatically every 12 minutes, regardless of whether or not they haveresources to share.The MB adds these resources to the browse list. In large net-works and over slow or on-demand links, this traffic can become excessive.
Examining the contents of Packet 1, we see in Figure 7.54 that the browsercommand is a local master announcement confirming that this computer is thelocal master.As we previously stated concerning host announcements, theannouncement frequency field of this packet is set to 12 minutes.
The Server Type Flag high fields of interest are set to 1, for workstation, server,primary domain controller, and Windows NT Workstation.Additionally, in Figure7.55, Server Type Flag low field MB server is set.Taken together, these flag fieldsdefine this computer as the DMBR.
Continuing with our packet inspection, the contents of Packet 2 are displayed in Figure 7.56.The browser command is a host announcement from
www.syngress.com
Figure 7.54 Local Master
Figure 7.55 Local Master, Continued
219_sniffer_07.qxd 6/28/02 11:57 AM Page 387
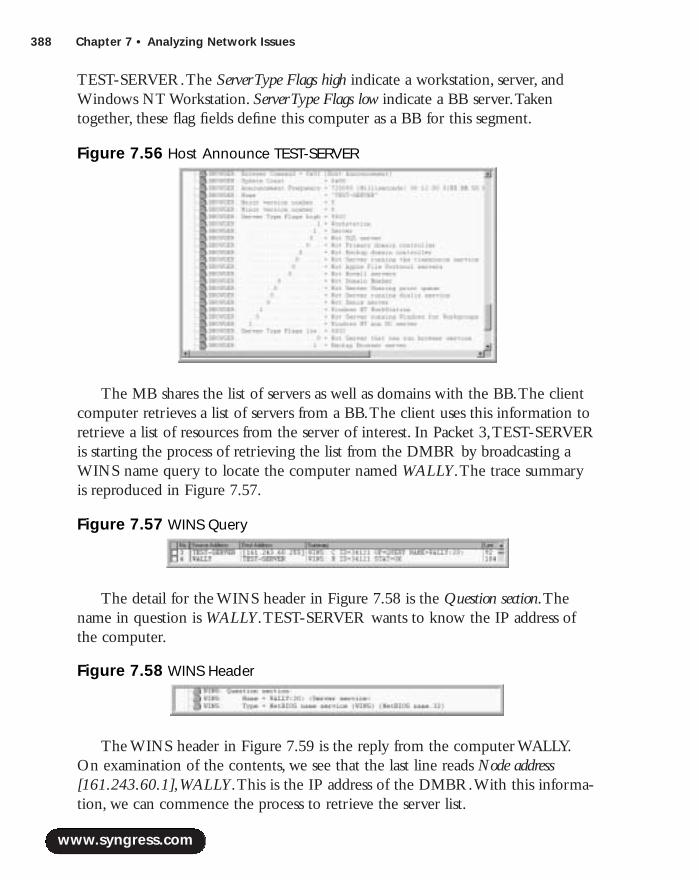
388 Chapter 7 • Analyzing Network Issues
TEST-SERVER.The Server Type Flags high indicate a workstation, server, andWindows NT Workstation. Server Type Flags low indicate a BB server.Takentogether, these flag fields define this computer as a BB for this segment.
The MB shares the list of servers as well as domains with the BB.The clientcomputer retrieves a list of servers from a BB.The client uses this information toretrieve a list of resources from the server of interest. In Packet 3,TEST-SERVERis starting the process of retrieving the list from the DMBR by broadcasting aWINS name query to locate the computer named WALLY.The trace summaryis reproduced in Figure 7.57.
The detail for the WINS header in Figure 7.58 is the Question section.Thename in question is WALLY.TEST-SERVER wants to know the IP address ofthe computer.
The WINS header in Figure 7.59 is the reply from the computer WALLY.On examination of the contents, we see that the last line reads Node address[161.243.60.1],WALLY.This is the IP address of the DMBR.With this informa-tion, we can commence the process to retrieve the server list.
www.syngress.com
Figure 7.56 Host Announce TEST-SERVER
Figure 7.57 WINS Query
Figure 7.58 WINS Header
219_sniffer_07.qxd 6/28/02 11:57 AM Page 388
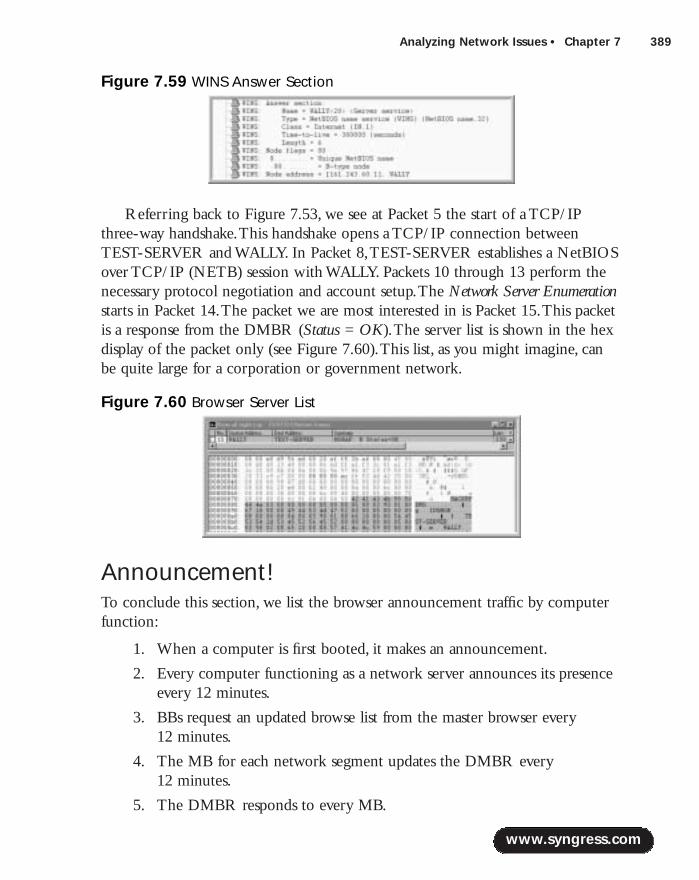
Analyzing Network Issues • Chapter 7 389
Referring back to Figure 7.53, we see at Packet 5 the start of a TCP/IPthree-way handshake.This handshake opens a TCP/IP connection betweenTEST-SERVER and WALLY. In Packet 8,TEST-SERVER establishes a NetBIOSover TCP/IP (NETB) session with WALLY. Packets 10 through 13 perform thenecessary protocol negotiation and account setup.The Network Server Enumerationstarts in Packet 14.The packet we are most interested in is Packet 15.This packetis a response from the DMBR (Status = OK).The server list is shown in the hexdisplay of the packet only (see Figure 7.60).This list, as you might imagine, canbe quite large for a corporation or government network.
Announcement!To conclude this section, we list the browser announcement traffic by computerfunction:
1. When a computer is first booted, it makes an announcement.
2. Every computer functioning as a network server announces its presenceevery 12 minutes.
3. BBs request an updated browse list from the master browser every 12 minutes.
4. The MB for each network segment updates the DMBR every 12 minutes.
5. The DMBR responds to every MB.
www.syngress.com
Figure 7.59 WINS Answer Section
Figure 7.60 Browser Server List
219_sniffer_07.qxd 6/28/02 11:57 AM Page 389

390 Chapter 7 • Analyzing Network Issues
You should be aware that this traffic occurs in normal operation. Be on thealert for problems due to bottlenecks in networks, such as ISDN or other slowlinks.WAN browser traffic can consume a great deal of bandwidth.
Dynamic Host Configuration Protocol FailureDynamic Host Configuration Protocol (DHCP) is based on, or is an extensionof, the BOOTP protocol.A little history is in order before we begin an in-depthdiscussion of this topic.
BOOTPThe BOOTP protocol was designed to provide network configurations to disk-less workstations.When power is applied to a diskless workstation, a processbegins whereby the computer broadcasts a BOOTP message onto the network.ABOOTP server receives the message and responds with the necessary configura-tion information.The information includes an IP address for the host, the IPaddress of the BOOTP server, and where to find the boot image file.The bootimage file contains the information necessary to start the operating system on thehost.The configuration file for the particular host has to be manually configuredon the BOOTP server.The host’s MAC address must be paired with the desiredIP address.The BOOTP system is rarely used today except in special environ-ments.The manual configuration is extremely error prone.
As stated earlier, DHCP is an extension of BOOTP and maintains somebackward compatibility. In addition, as its name implies, DHCP allows fordynamic allocation of network addresses and configuration information.
Here we use Sniffer Pro to examine DHCP’s inner workings.We start theprocess by designing a filter to capture the information needed for a thoroughexamination.We conclude with a discussion of some of the problems you couldencounter using a dynamic allocation mechanism.
The first step in our learning process is to build a filter to capture the information:
1. Select Capture | Define Filter | Profiles | New.
2. Enter DHCP TRAFFIC in the New Profile Name field.
3. Select OK | Done (see Figure 7.61).
4. Select the Advanced tab (see Figure 7.62).
www.syngress.com
219_sniffer_07.qxd 6/28/02 11:57 AM Page 390
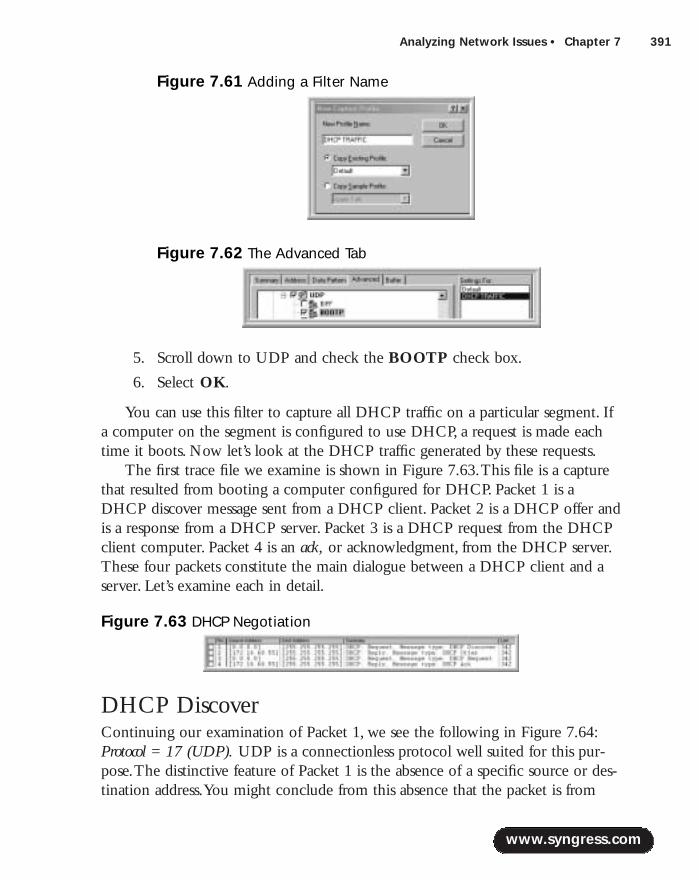
Analyzing Network Issues • Chapter 7 391
5. Scroll down to UDP and check the BOOTP check box.
6. Select OK.
You can use this filter to capture all DHCP traffic on a particular segment. Ifa computer on the segment is configured to use DHCP, a request is made eachtime it boots. Now let’s look at the DHCP traffic generated by these requests.
The first trace file we examine is shown in Figure 7.63.This file is a capturethat resulted from booting a computer configured for DHCP. Packet 1 is aDHCP discover message sent from a DHCP client. Packet 2 is a DHCP offer andis a response from a DHCP server. Packet 3 is a DHCP request from the DHCPclient computer. Packet 4 is an ack, or acknowledgment, from the DHCP server.These four packets constitute the main dialogue between a DHCP client and aserver. Let’s examine each in detail.
DHCP DiscoverContinuing our examination of Packet 1, we see the following in Figure 7.64:Protocol = 17 (UDP). UDP is a connectionless protocol well suited for this pur-pose.The distinctive feature of Packet 1 is the absence of a specific source or des-tination address.You might conclude from this absence that the packet is from
www.syngress.com
Figure 7.61 Adding a Filter Name
Figure 7.62 The Advanced Tab
Figure 7.63 DHCP Negotiation
219_sniffer_07.qxd 6/28/02 11:57 AM Page 391

392 Chapter 7 • Analyzing Network Issues
nobody, destined to everybody.We soon see that the IP header provides only partof the story.
The UDP header from Packet 1 is displayed in Figure 7.65.The entry Sourceport = 68 (Bootpc/DHCP) tells us this packet came from a DHCP client (denotedby the c in Bootpc).The entry Destination port = 67 tells us the packet is destinedfor a DHCP server (denoted by the s in Bootps).We now know the broadcast wasnot for everybody. Indeed, it was specifically for a DHCP server.
Before continuing, let’s do a quick review of what we have learned usingSniffer Pro. DHCP is a client/server connectionless protocol using UDP port 68for the client and 67 for the server.The initial communication addresses are0.0.0.0 for source and broadcast for destination.
In Figure 7.66, the field Boot record type reveals the true intent of the discoverpacket. It is a request for an IP address and configuration information from theserver.The packet provides the server with the client’s current configuration.Thefields of interest to us are:
■ Client self-assigned IP address = none
■ Client IP address = none
■ Client hardware address = AcctonD9C30B (MAC)
It is important to realize that in the absence of an IP address, the method ofcommunication is MAC address to MAC address only.This fact should alert you
www.syngress.com
Figure 7.64 Discover IP Header
Figure 7.65 Discover UDP Header
219_sniffer_07.qxd 6/28/02 11:57 AM Page 392
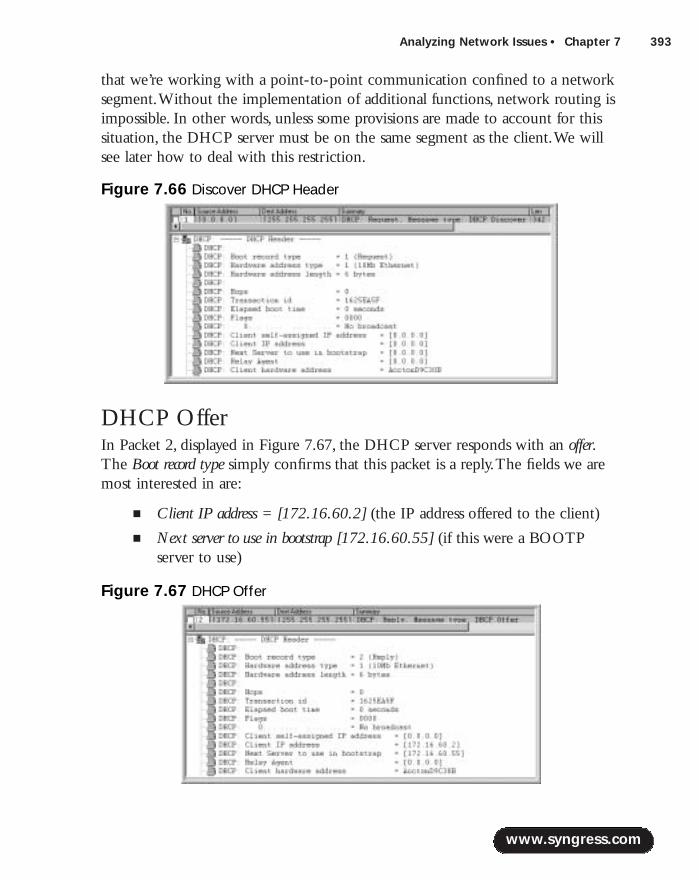
Analyzing Network Issues • Chapter 7 393
that we’re working with a point-to-point communication confined to a networksegment.Without the implementation of additional functions, network routing isimpossible. In other words, unless some provisions are made to account for thissituation, the DHCP server must be on the same segment as the client.We willsee later how to deal with this restriction.
DHCP OfferIn Packet 2, displayed in Figure 7.67, the DHCP server responds with an offer.The Boot record type simply confirms that this packet is a reply.The fields we aremost interested in are:
■ Client IP address = [172.16.60.2] (the IP address offered to the client)
■ Next server to use in bootstrap [172.16.60.55] (if this were a BOOTPserver to use)
www.syngress.com
Figure 7.66 Discover DHCP Header
Figure 7.67 DHCP Offer
219_sniffer_07.qxd 6/28/02 11:57 AM Page 393
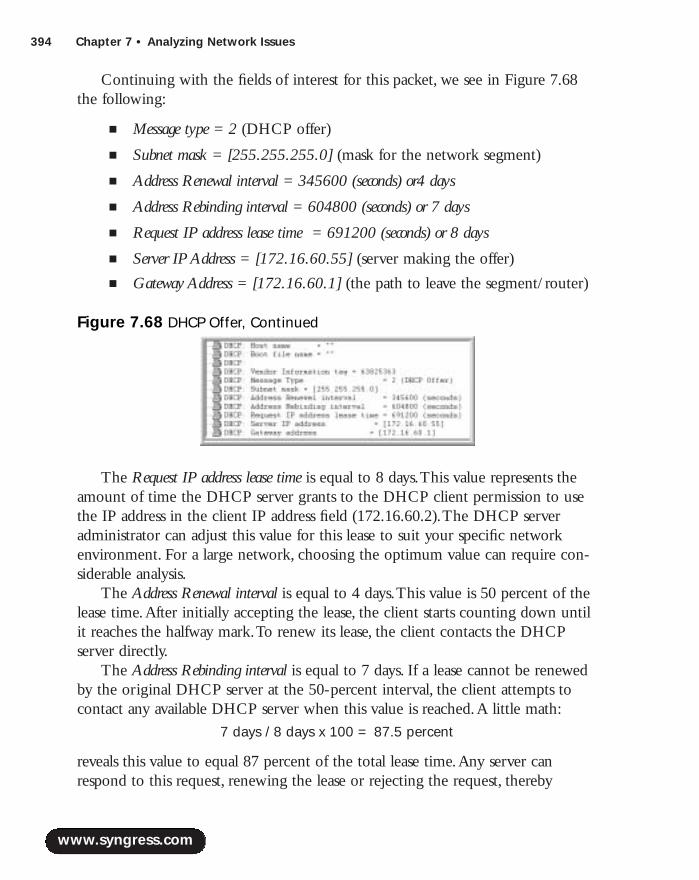
394 Chapter 7 • Analyzing Network Issues
Continuing with the fields of interest for this packet, we see in Figure 7.68the following:
■ Message type = 2 (DHCP offer)
■ Subnet mask = [255.255.255.0] (mask for the network segment)
■ Address Renewal interval = 345600 (seconds) or4 days
■ Address Rebinding interval = 604800 (seconds) or 7 days
■ Request IP address lease time = 691200 (seconds) or 8 days
■ Server IP Address = [172.16.60.55] (server making the offer)
■ Gateway Address = [172.16.60.1] (the path to leave the segment/router)
The Request IP address lease time is equal to 8 days.This value represents theamount of time the DHCP server grants to the DHCP client permission to usethe IP address in the client IP address field (172.16.60.2).The DHCP serveradministrator can adjust this value for this lease to suit your specific networkenvironment. For a large network, choosing the optimum value can require con-siderable analysis.
The Address Renewal interval is equal to 4 days.This value is 50 percent of thelease time.After initially accepting the lease, the client starts counting down untilit reaches the halfway mark.To renew its lease, the client contacts the DHCPserver directly.
The Address Rebinding interval is equal to 7 days. If a lease cannot be renewedby the original DHCP server at the 50-percent interval, the client attempts tocontact any available DHCP server when this value is reached.A little math:
7 days / 8 days x 100 = 87.5 percent
reveals this value to equal 87 percent of the total lease time.Any server canrespond to this request, renewing the lease or rejecting the request, thereby
www.syngress.com
Figure 7.68 DHCP Offer, Continued
219_sniffer_07.qxd 6/28/02 11:57 AM Page 394
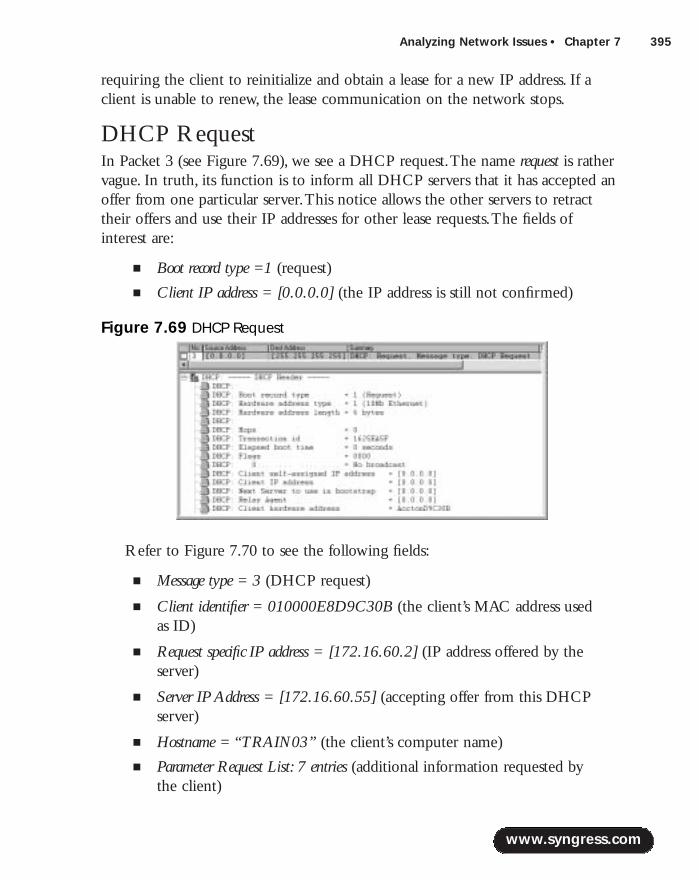
Analyzing Network Issues • Chapter 7 395
requiring the client to reinitialize and obtain a lease for a new IP address. If aclient is unable to renew, the lease communication on the network stops.
DHCP RequestIn Packet 3 (see Figure 7.69), we see a DHCP request.The name request is rathervague. In truth, its function is to inform all DHCP servers that it has accepted anoffer from one particular server.This notice allows the other servers to retracttheir offers and use their IP addresses for other lease requests.The fields ofinterest are:
■ Boot record type =1 (request)
■ Client IP address = [0.0.0.0] (the IP address is still not confirmed)
Refer to Figure 7.70 to see the following fields:
■ Message type = 3 (DHCP request)
■ Client identifier = 010000E8D9C30B (the client’s MAC address used as ID)
■ Request specific IP address = [172.16.60.2] (IP address offered by theserver)
■ Server IP Address = [172.16.60.55] (accepting offer from this DHCPserver)
■ Hostname = “TRAIN03” (the client’s computer name)
■ Parameter Request List: 7 entries (additional information requested by the client)
www.syngress.com
Figure 7.69 DHCP Request
219_sniffer_07.qxd 6/28/02 11:57 AM Page 395

396 Chapter 7 • Analyzing Network Issues
The additional information included in the parameter list can simplify clientconfiguration in a large network.As shown in the list, the domain name, routers,WINS server, and DNS server can be dynamically configured at initializationtime.The list is not complete; new enhancements are being added to the DHCPspecification as needed.
DHCP AckThe information in Packet 4 of Figures 7.71 and 7.72 is sent from the DHCPserver whose offer has been accepted by the client.The message contains thelease agreement, which includes the IP address and possibly other configurationinformation.The client can now participate in network communications usingthe IP address granted in the lease.
The information in this packet is, for the most part, a copy of the DHCPoffer.The client stores this information in its registry under the key:
HKEY_LOCAL_MACHINE\SYSTEM\CurrentControlSet\Services\adapters\Parameters\Tcpip
www.syngress.com
Figure 7.70 DHCP Request, Continued
Figure 7.71 DHCP Ack
219_sniffer_07.qxd 6/28/02 11:57 AM Page 396
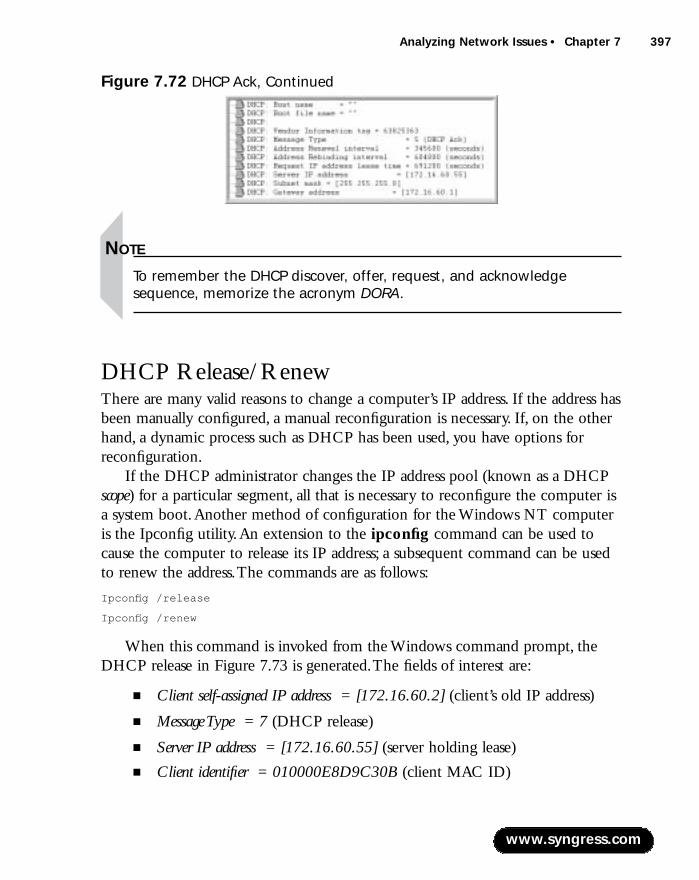
Analyzing Network Issues • Chapter 7 397
NOTE
To remember the DHCP discover, offer, request, and acknowledgesequence, memorize the acronym DORA.
DHCP Release/Renew There are many valid reasons to change a computer’s IP address. If the address hasbeen manually configured, a manual reconfiguration is necessary. If, on the otherhand, a dynamic process such as DHCP has been used, you have options forreconfiguration.
If the DHCP administrator changes the IP address pool (known as a DHCPscope) for a particular segment, all that is necessary to reconfigure the computer isa system boot.Another method of configuration for the Windows NT computeris the Ipconfig utility.An extension to the ipconfig command can be used tocause the computer to release its IP address; a subsequent command can be usedto renew the address.The commands are as follows:
Ipconfig /release
Ipconfig /renew
When this command is invoked from the Windows command prompt, theDHCP release in Figure 7.73 is generated.The fields of interest are:
■ Client self-assigned IP address = [172.16.60.2] (client’s old IP address)
■ Message Type = 7 (DHCP release)
■ Server IP address = [172.16.60.55] (server holding lease)
■ Client identifier = 010000E8D9C30B (client MAC ID)
www.syngress.com
Figure 7.72 DHCP Ack, Continued
219_sniffer_07.qxd 6/28/02 11:57 AM Page 397
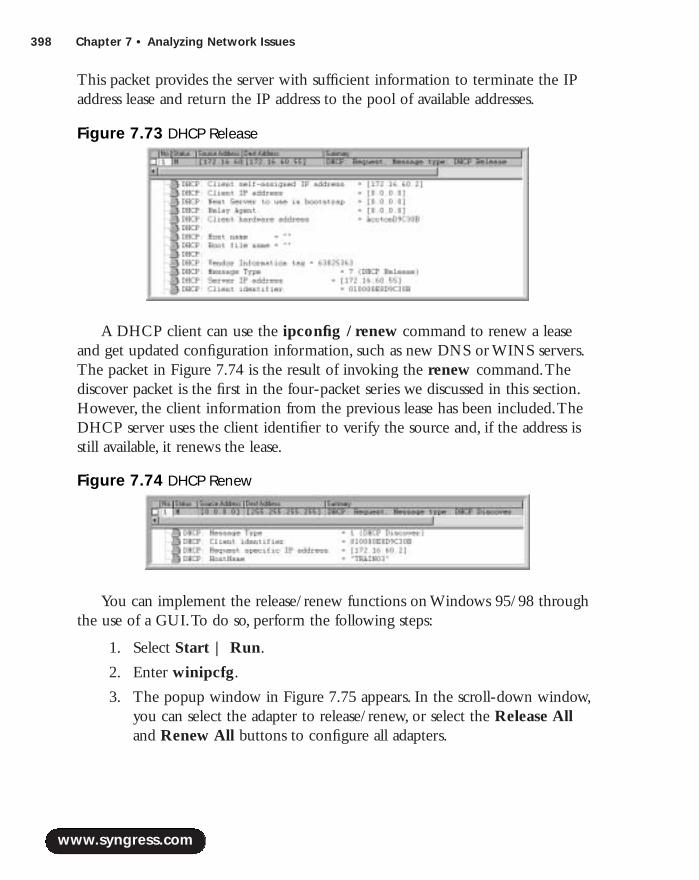
398 Chapter 7 • Analyzing Network Issues
This packet provides the server with sufficient information to terminate the IPaddress lease and return the IP address to the pool of available addresses.
A DHCP client can use the ipconfig /renew command to renew a leaseand get updated configuration information, such as new DNS or WINS servers.The packet in Figure 7.74 is the result of invoking the renew command.Thediscover packet is the first in the four-packet series we discussed in this section.However, the client information from the previous lease has been included.TheDHCP server uses the client identifier to verify the source and, if the address isstill available, it renews the lease.
You can implement the release/renew functions on Windows 95/98 throughthe use of a GUI.To do so, perform the following steps:
1. Select Start | Run.
2. Enter winipcfg.
3. The popup window in Figure 7.75 appears. In the scroll-down window,you can select the adapter to release/renew, or select the Release Alland Renew All buttons to configure all adapters.
www.syngress.com
Figure 7.73 DHCP Release
Figure 7.74 DHCP Renew
219_sniffer_07.qxd 6/28/02 11:57 AM Page 398
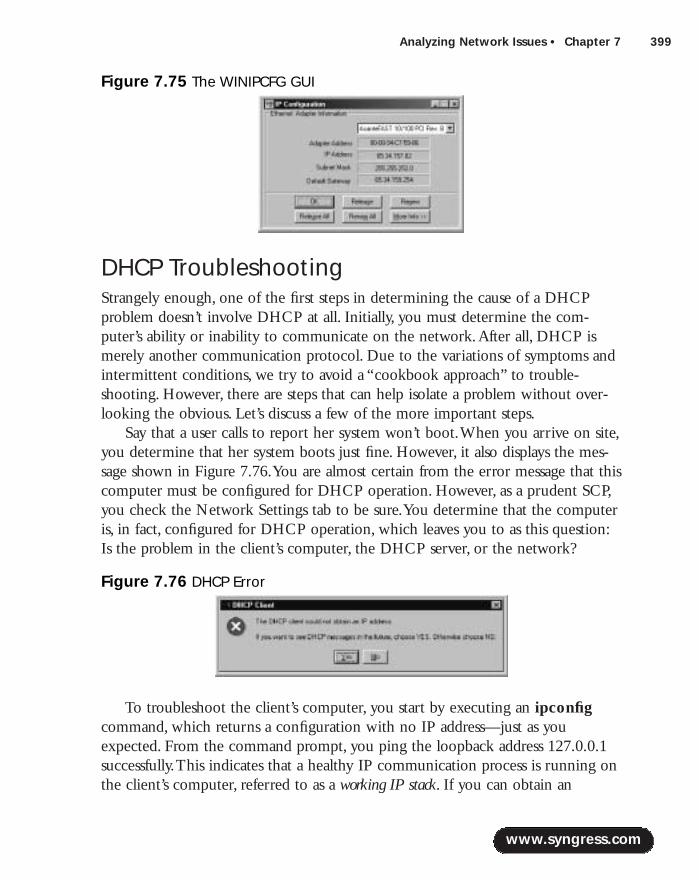
Analyzing Network Issues • Chapter 7 399
DHCP TroubleshootingStrangely enough, one of the first steps in determining the cause of a DHCPproblem doesn’t involve DHCP at all. Initially, you must determine the com-puter’s ability or inability to communicate on the network.After all, DHCP ismerely another communication protocol. Due to the variations of symptoms andintermittent conditions, we try to avoid a “cookbook approach” to trouble-shooting. However, there are steps that can help isolate a problem without over-looking the obvious. Let’s discuss a few of the more important steps.
Say that a user calls to report her system won’t boot.When you arrive on site,you determine that her system boots just fine. However, it also displays the mes-sage shown in Figure 7.76.You are almost certain from the error message that thiscomputer must be configured for DHCP operation. However, as a prudent SCP,you check the Network Settings tab to be sure.You determine that the computeris, in fact, configured for DHCP operation, which leaves you to as this question:Is the problem in the client’s computer, the DHCP server, or the network?
To troubleshoot the client’s computer, you start by executing an ipconfigcommand, which returns a configuration with no IP address—just as youexpected. From the command prompt, you ping the loopback address 127.0.0.1successfully.This indicates that a healthy IP communication process is running onthe client’s computer, referred to as a working IP stack. If you can obtain an
www.syngress.com
Figure 7.75 The WINIPCFG GUI
Figure 7.76 DHCP Error
219_sniffer_07.qxd 6/28/02 11:57 AM Page 399

400 Chapter 7 • Analyzing Network Issues
unused IP address for the segment in question, you should manually configure iton the client’s computer and test the basic network functions.
The client’s computer checks out, so it is time to bring out the big guns.Youinstall Sniffer Pro on the network segment with the client’s computer and, usingthe filter we designed in this section, start a trace.After a reboot of the client’scomputer and a redisplay of the error message, you stop the trace.The summaryframes are displayed in Figure 7.77.You note a repeated and valid attempt by theclient to acquire an IP address, with no response from the DHCP server.
At this point, your attention turns from the client to the DHCP server. If youhad another computer on the same segment that could stand a short interrup-tion, you could duplicate these symptoms. However, from the Sniffer Pro trace itis obvious that the server is not responding to a request.A ping operation fromanother computer on the segment to the DHCP server is successful, indictinggood network connectivity—for ICMP traffic, at least.You inquire as to wherethe DHCP is physically located.The answer is, on another floor and another seg-ment.You’re told that the only maintenance that has been performed lately is thatthe router was swapped the night before.
Bingo! ICMP traffic to the server works, but broadcast traffic doesn’t.A quickcall to the network admin reveals a misconfigured IP helper address on the newrouter. DHCP requests were confined to the segment.
www.syngress.com
Figure 7.77 DHCP Error Summary
219_sniffer_07.qxd 6/28/02 11:57 AM Page 400
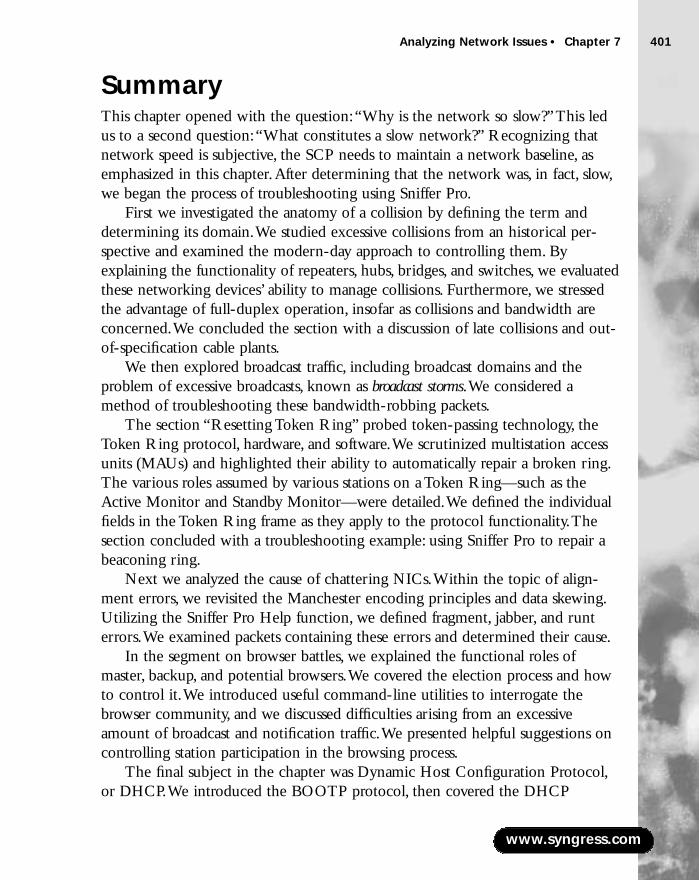
Analyzing Network Issues • Chapter 7 401
SummaryThis chapter opened with the question:“Why is the network so slow?”This ledus to a second question:“What constitutes a slow network?” Recognizing thatnetwork speed is subjective, the SCP needs to maintain a network baseline, asemphasized in this chapter.After determining that the network was, in fact, slow,we began the process of troubleshooting using Sniffer Pro.
First we investigated the anatomy of a collision by defining the term anddetermining its domain.We studied excessive collisions from an historical per-spective and examined the modern-day approach to controlling them. Byexplaining the functionality of repeaters, hubs, bridges, and switches, we evaluatedthese networking devices’ ability to manage collisions. Furthermore, we stressedthe advantage of full-duplex operation, insofar as collisions and bandwidth areconcerned.We concluded the section with a discussion of late collisions and out-of-specification cable plants.
We then explored broadcast traffic, including broadcast domains and theproblem of excessive broadcasts, known as broadcast storms.We considered amethod of troubleshooting these bandwidth-robbing packets.
The section “Resetting Token Ring” probed token-passing technology, theToken Ring protocol, hardware, and software.We scrutinized multistation accessunits (MAUs) and highlighted their ability to automatically repair a broken ring.The various roles assumed by various stations on a Token Ring—such as theActive Monitor and Standby Monitor—were detailed.We defined the individualfields in the Token Ring frame as they apply to the protocol functionality.Thesection concluded with a troubleshooting example: using Sniffer Pro to repair abeaconing ring.
Next we analyzed the cause of chattering NICs.Within the topic of align-ment errors, we revisited the Manchester encoding principles and data skewing.Utilizing the Sniffer Pro Help function, we defined fragment, jabber, and runterrors.We examined packets containing these errors and determined their cause.
In the segment on browser battles, we explained the functional roles ofmaster, backup, and potential browsers.We covered the election process and howto control it.We introduced useful command-line utilities to interrogate thebrowser community, and we discussed difficulties arising from an excessiveamount of broadcast and notification traffic.We presented helpful suggestions oncontrolling station participation in the browsing process.
The final subject in the chapter was Dynamic Host Configuration Protocol,or DHCP.We introduced the BOOTP protocol, then covered the DHCP
www.syngress.com
219_sniffer_07.qxd 6/28/02 11:57 AM Page 401
402 Chapter 7 • Analyzing Network Issues
extensions.We built a filter to capture DHCP traffic and examined the function-ality of the protocol.We analyzed the discovery, offer, request, and ack packets ofa DHCP negotiation, then used Sniffer Pro to troubleshoot a DHCP-related net-work problem.
By demonstrating the powerful ability of Sniffer Pro and its Help function tobe both a tool and a mentor, this chapter sought to provide you with the knowl-edge and confidence necessary to approach a network problem with a positiveattitude and an assurance of success.
Solutions Fast Track
Hey! Why Is the Network So Slow?
! Network speed is subjective.
! The SCP should create a network performance baseline.The baselinecan be compared to current network performance.
! Slow networks can be the result of errors such as collisions, CRC errors,ring resets, excessive broadcasts, and misbehaving application.
Resetting Token Ring
! Token Ring is the IEEE 802.5 standard for a token-passing network.
! Token Ring is configured as a star topology but actually functions as aring topology.
! The hub used in Token Ring is called a multistation access unit (MAU).
! In token-passing technology, a single station can disrupt the network.
Using Sniffer Pro to Troubleshoot a Chattering Network Interface Card
! Chattering on the network can be caused by jabbering or streamingNICs.
! Jabber frames contain random garbage.
! Jabber frames are typically hardware faults.
www.syngress.com
219_sniffer_07.qxd 6/28/02 11:57 AM Page 402
Analyzing Network Issues • Chapter 7 403
! Fragments are undersized packets (of less than 64 bytes) with a CRC error.
Using Sniffer Pro to Troubleshoot Small Packets (Runts)
! Small packets are undersize packets of less than 64 bytes with a valid CRC.
! Small packets are sometimes called runts.
! Runts can be caused by defective NIC driver software.
! Runts can occur on an overloaded interface where the transmit buffercannot be serviced in the allotted time.
Using Sniffer Pro to Troubleshoot Browsing Battles
! Browser traffic can become excessive in large networks.
! Browser announcements occur every 12 minutes for every deviceparticipating in the process.
! Excessive browser traffic can cripple slow links such as ISDN and on-demand connections.
Dynamic Host Configuration Protocol Failure
! DHCP was based on BOOTP and is backward compatible.
! DHCP provides dynamic allocation of IP addresses and otherconfiguration information.
! DHCP uses broadcast destination addressing; gateway routers must beconfigured to relay the requests if the DHCP server is not on the samesegment as the client.
www.syngress.com
219_sniffer_07.qxd 6/28/02 11:57 AM Page 403
404 Chapter 7 • Analyzing Network Issues
Q: Can I have more than one DHCP server on a network?
A: Yes. However, the servers must be configured to distribute unique IPaddresses.This technique is called splitting the scope.
Q: In troubleshooting Token Ring, how can you quickly isolate a group ofdevices?
A: The fastest method is to use a spare MAU. Inserting the ring-in and ring-outcables into the empty unit temporarily bypasses a group of eight suspecteddevices. If the ring functions normally in this configuration, troubleshoot thebypassed units.
Q: Where can I find historical error information on a particular network seg-ment?
A: Most routers and switches include logging functions.They can actually logerrors to a log file or simply update interface error counters. In either case,the information is valuable to the SCP for troubleshooting an intermittentproblem.
Q: How can I determine if the communication between two devices is intermit-tently slowing down?
A: From the command line on one of the devices, enter the following command:
ping –t (other device IP address) > C:\ pingfile.
This command produces a file named C:\ pingtest.After a period of time,stop the operation and list the file, observing the time= field of each packet.Aslowdown will be obvious.
www.syngress.com
Frequently Asked Questions
The following Frequently Asked Questions, answered by the authors of this book,are designed to both measure your understanding of the concepts presented in this chapter and to assist you with real-life implementation of these concepts. Tohave your questions about this chapter answered by the author, browse towww.syngress.com/solutions and click on the “Ask the Author” form.
219_sniffer_07.qxd 6/28/02 11:57 AM Page 404
Using Filters
Solutions in this chapter:
■ What Is Filtering, and Why Filter?
■ Using Predefined Filters
■ Creating Filters
■ Expert-Level Filtering
■ Troubleshooting with Filters
Chapter 8
405
! Summary
! Solutions Fast Track
! Frequently Asked Questions
219_sniffer_08.qxd 6/28/02 11:58 AM Page 405

406 Chapter 8 • Using Filters
IntroductionUntil now, you have used a few filters that have been vaguely explained.At thispoint, you need to walk through the granular details of filtering, which is thepurpose of this chapter.
You might have toiled with a sniffer or some other protocol analysis device inthe past.You simply pushed the Go or Start button, captured everything thatcame into the buffer, and then displayed it all after counting backward from 100.Although this description might seem silly, it’s not bad.Actually, doing it that waymight show you how many different protocols you have crossing the wire or theintensity of some compared with others. Now that you have this information,how would you find out if a specific client is actually connecting to a designatedserver when launched? If you did not filter the data captures, you could be siftingthrough literally hundreds of captured frames looking for a specific IP address andthe synchronization between that client and the server.Why not simply look forthose two IP addresses or MAC addresses? You can, and you will.You can also usefiltering to capture only specific protocols within a suite or entire protocol suitesat a time.
What Is Filtering, and Why Filter?As the Wordsmyth Educational Dictionary states,“filtering is the process of removingimpurities from something by using a filter”—in other words, separating sub-stances with the help of a filter.The simplest filter that you can think of is a pieceof paper or other porous material, such as charcoal, used to remove solids orother impurities from fluids or gases that pass through it. Let’s take a look at whatfiltering means in the context of networking.
When it comes to networks, we separate out unnecessary data—data irrele-vant to the problem or the event that we are exploring.The most important andthe most difficult thing to do is not to capture data but to find out which of thethousands of frames traversing your network are related to a problem you areworking on, diagnose the problem correctly, and eliminate its cause. Sniffer Pro isa very good tool to perform this troubleshooting, as long as you choose the cor-rect filter.
In the data transmission environment, filtering becomes very important whenit comes to the search and use of specific information hidden in the midst ofunimportant data.
www.syngress.com
219_sniffer_08.qxd 6/28/02 11:58 AM Page 406

www.syngress.com
One of the most difficult and significant tasks involved in working withSniffer Pro is to define the right filter. Having defined a correct filter, you will beable to save a great deal of time when it comes to detecting a problem on yournetwork or analyzing data you have captured using a particular filter.
Different types of filtering are available:You can filter traffic based on Layer 2and Layer 3 addresses, protocol types, and/or data patterns.
Using Predefined FiltersSniffer Pro is shipped with a large variety of predefined filters that can be used invarious situations. Filters are generally used to select the traffic that would giveyou an opportunity to analyze the network you are monitoring to troubleshootproblems. Moreover, in case you are not there to start capturing data at that par-ticular moment, triggers can be really helpful.Triggers make Sniffer Pro start cap-turing data at various alarm conditions you specify.Triggers are covered in moredetail in Chapter 9,“Understanding Triggers and Using Alarms.”
Filters Available to You by DefaultWhen you start working on a network problem that includes complicated fil-tering, you should always make a decision: whether you want to create your ownfilter from scratch or try to use one of the predefined Sniffer Pro filters, or try todownload a filter from the Internet.As is often the case, the answer is, it depends.Depending on the kind of problem you are troubleshooting, you might or mightnot find an appropriate predefined filter or download it from the Internet.
Sniffer Pro has a number of predefined filters that can satisfy some essentialfiltering needs, such as filtering based on Layer 3 protocol type (AppleTalk, IPX,NetBEUI) or on a network application (IP/FTP and HTTP, IP/Telnet,IP/whois).To access these predefined filters, you have to create a new profile bycopying one of the Sample profiles. For example, let’s create a new capture filterthat will permit HTTP and FTP traffic only:
1. From the main menu, select Capture | Define Filter.
2. In the Define Filter window, click the Profiles button.
3. In the Capture Profiles, select New.
4. In the New Capture Profile window, assign the profile a new name—forexample, FTP+HTTP.
Using Filters • Chapter 8 407
219_sniffer_08.qxd 6/28/02 11:58 AM Page 407
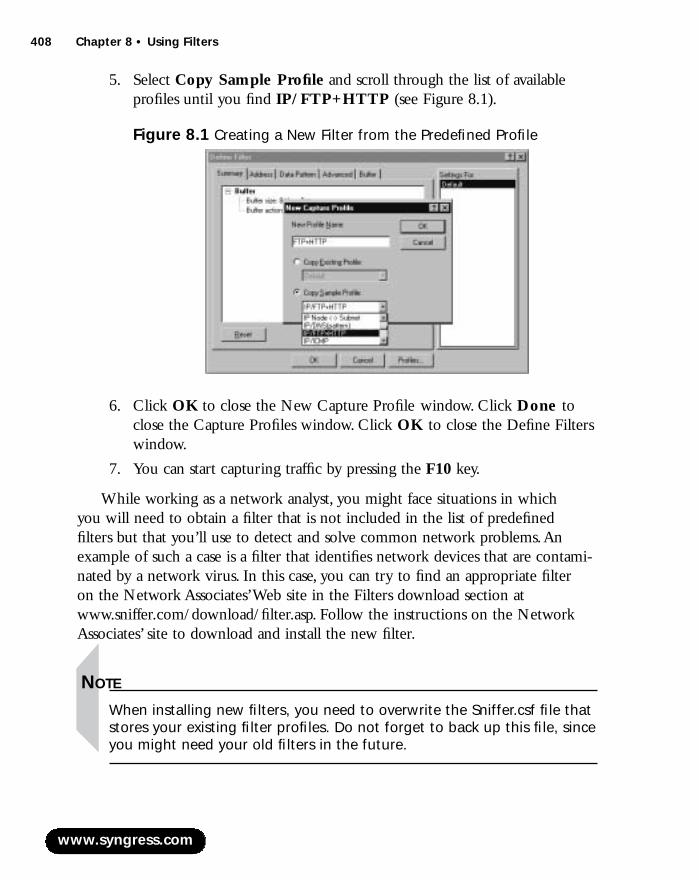
408 Chapter 8 • Using Filters
5. Select Copy Sample Profile and scroll through the list of availableprofiles until you find IP/FTP+HTTP (see Figure 8.1).
6. Click OK to close the New Capture Profile window. Click Done toclose the Capture Profiles window. Click OK to close the Define Filterswindow.
7. You can start capturing traffic by pressing the F10 key.
While working as a network analyst, you might face situations in which you will need to obtain a filter that is not included in the list of predefined filters but that you’ll use to detect and solve common network problems.Anexample of such a case is a filter that identifies network devices that are contami-nated by a network virus. In this case, you can try to find an appropriate filter on the Network Associates’Web site in the Filters download section atwww.sniffer.com/download/filter.asp. Follow the instructions on the NetworkAssociates’ site to download and install the new filter.
NOTE
When installing new filters, you need to overwrite the Sniffer.csf file thatstores your existing filter profiles. Do not forget to back up this file, sinceyou might need your old filters in the future.
www.syngress.com
Figure 8.1 Creating a New Filter from the Predefined Profile
219_sniffer_08.qxd 6/28/02 11:58 AM Page 408
Using Filters • Chapter 8 409
Creating FiltersAs you already know, Sniffer Pro stores filters in special entities called profiles.Each filter is kept in its own profile. Depending on the filter type, profiles can becreated from the Monitor, Capture, and Display menus.You can also define a cap-ture filter by clicking the Define Filter icon on the main panel. It is typicallynot a good idea to do any modifications in the Default profile, so we recommendthat you create a new profile for every new filter you want to set up.
NOTE
If you have accidentally modified your default profile, you can revert allmodifications at once by clicking the Reset button in the Define Filterwindow.
We created a few capture profiles in Chapter 6, so let’s refresh our knowledgeby creating a new display profile:
1. In the main menu, select Display | Define Filter.The Define Filterwindow pops up on your screen.
2. On the right-hand side of the window, you should see the Settings Fortext box, which lists all existing display filters created on your computer.If no display profiles have been created on your computer, you shouldsee only one, Default. Let’s create a new profile.
3. Click the Profile button at the bottom of the Define Filter window.The Capture Profiles window comes up.This is a confusing detail:Weare creating a display profile, although the window is called CaptureProfiles.
4. Click New.The New Capture Profile window comes up.
5. Type an appropriate name and click OK (see Figure 8.2).
6. Click Done to close the Capture Profiles window.That’s it! A new display profile has been created.You can see its name in the right-handtext box.
www.syngress.com
219_sniffer_08.qxd 6/28/02 11:58 AM Page 409
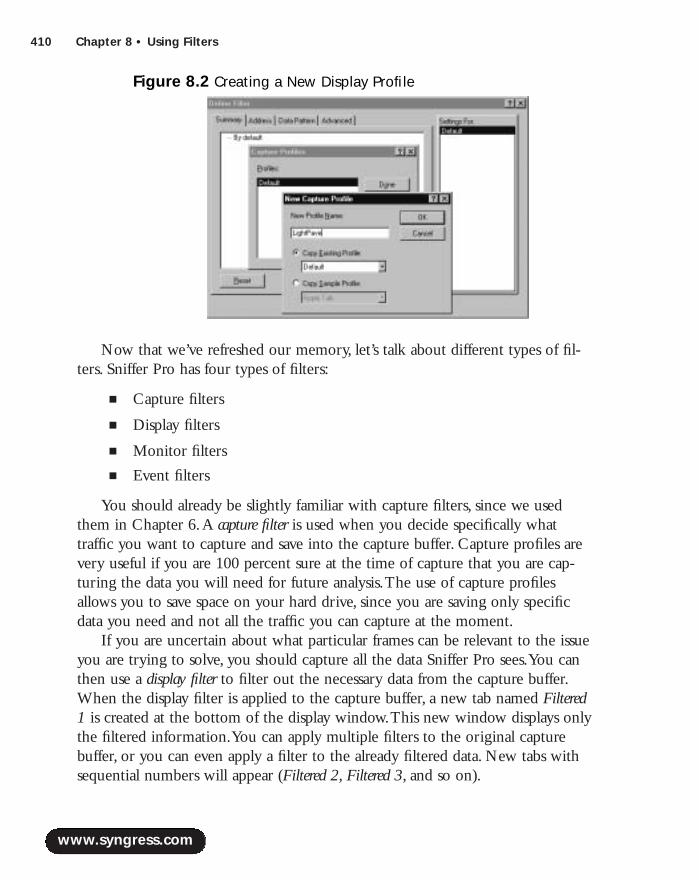
410 Chapter 8 • Using Filters
Now that we’ve refreshed our memory, let’s talk about different types of fil-ters. Sniffer Pro has four types of filters:
■ Capture filters
■ Display filters
■ Monitor filters
■ Event filters
You should already be slightly familiar with capture filters, since we usedthem in Chapter 6.A capture filter is used when you decide specifically whattraffic you want to capture and save into the capture buffer. Capture profiles arevery useful if you are 100 percent sure at the time of capture that you are cap-turing the data you will need for future analysis.The use of capture profilesallows you to save space on your hard drive, since you are saving only specificdata you need and not all the traffic you can capture at the moment.
If you are uncertain about what particular frames can be relevant to the issueyou are trying to solve, you should capture all the data Sniffer Pro sees.You canthen use a display filter to filter out the necessary data from the capture buffer.When the display filter is applied to the capture buffer, a new tab named Filtered1 is created at the bottom of the display window.This new window displays onlythe filtered information.You can apply multiple filters to the original capturebuffer, or you can even apply a filter to the already filtered data. New tabs withsequential numbers will appear (Filtered 2, Filtered 3, and so on).
www.syngress.com
Figure 8.2 Creating a New Display Profile
219_sniffer_08.qxd 6/28/02 11:58 AM Page 410
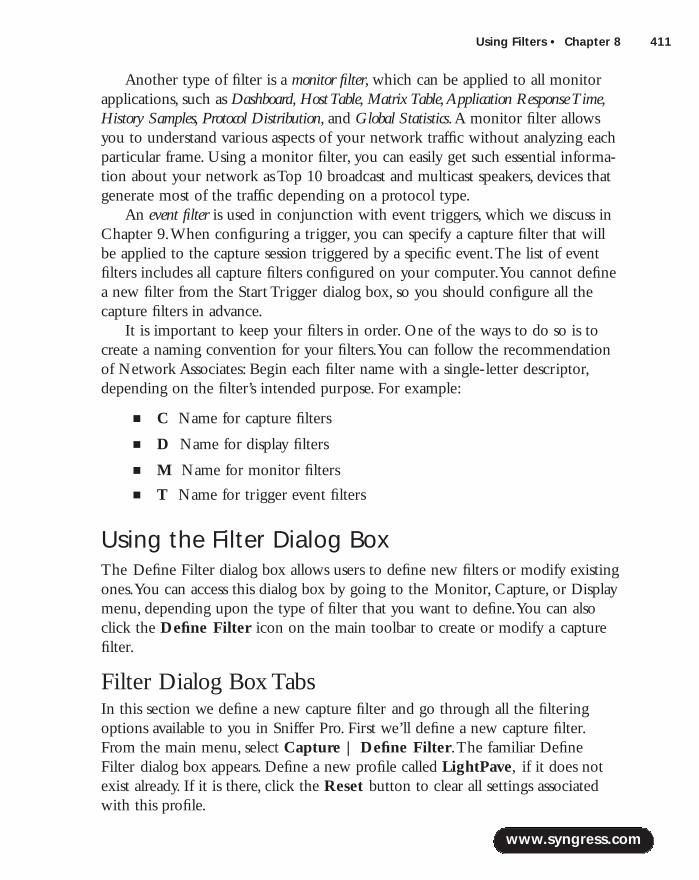
Using Filters • Chapter 8 411
Another type of filter is a monitor filter, which can be applied to all monitorapplications, such as Dashboard, Host Table, Matrix Table,Application Response Time,History Samples, Protocol Distribution, and Global Statistics.A monitor filter allowsyou to understand various aspects of your network traffic without analyzing eachparticular frame. Using a monitor filter, you can easily get such essential informa-tion about your network as Top 10 broadcast and multicast speakers, devices thatgenerate most of the traffic depending on a protocol type.
An event filter is used in conjunction with event triggers, which we discuss inChapter 9.When configuring a trigger, you can specify a capture filter that willbe applied to the capture session triggered by a specific event.The list of eventfilters includes all capture filters configured on your computer.You cannot definea new filter from the Start Trigger dialog box, so you should configure all thecapture filters in advance.
It is important to keep your filters in order. One of the ways to do so is tocreate a naming convention for your filters.You can follow the recommendationof Network Associates: Begin each filter name with a single-letter descriptor,depending on the filter’s intended purpose. For example:
■ C Name for capture filters
■ D Name for display filters
■ M Name for monitor filters
■ T Name for trigger event filters
Using the Filter Dialog BoxThe Define Filter dialog box allows users to define new filters or modify existingones.You can access this dialog box by going to the Monitor, Capture, or Displaymenu, depending upon the type of filter that you want to define.You can alsoclick the Define Filter icon on the main toolbar to create or modify a capturefilter.
Filter Dialog Box TabsIn this section we define a new capture filter and go through all the filteringoptions available to you in Sniffer Pro. First we’ll define a new capture filter.From the main menu, select Capture | Define Filter.The familiar DefineFilter dialog box appears. Define a new profile called LightPave, if it does notexist already. If it is there, click the Reset button to clear all settings associatedwith this profile.
www.syngress.com
219_sniffer_08.qxd 6/28/02 11:58 AM Page 411
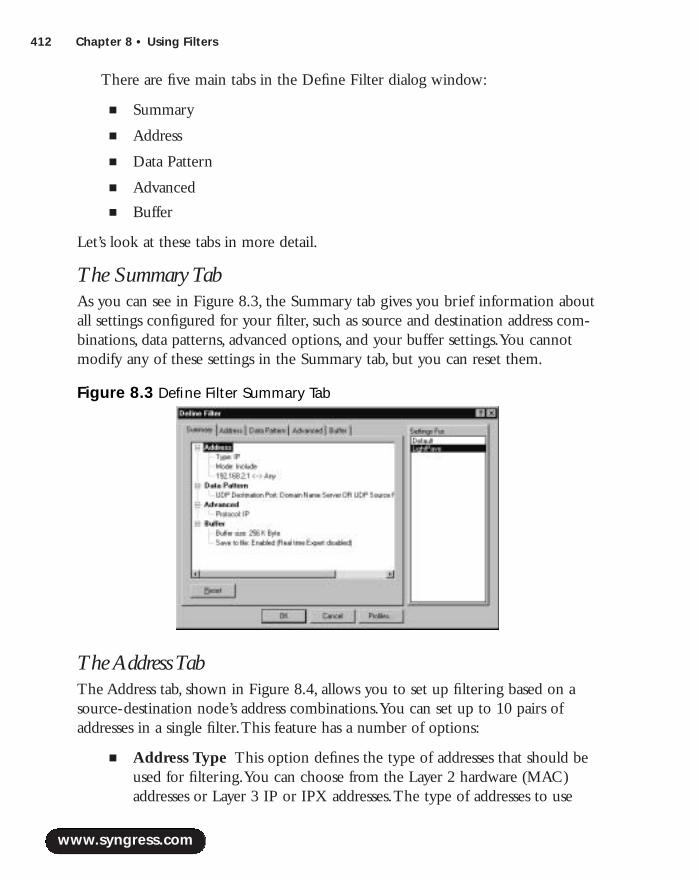
412 Chapter 8 • Using Filters
There are five main tabs in the Define Filter dialog window:
■ Summary
■ Address
■ Data Pattern
■ Advanced
■ Buffer
Let’s look at these tabs in more detail.
The Summary TabAs you can see in Figure 8.3, the Summary tab gives you brief information aboutall settings configured for your filter, such as source and destination address com-binations, data patterns, advanced options, and your buffer settings.You cannotmodify any of these settings in the Summary tab, but you can reset them.
The Address TabThe Address tab, shown in Figure 8.4, allows you to set up filtering based on asource-destination node’s address combinations.You can set up to 10 pairs ofaddresses in a single filter.This feature has a number of options:
■ Address Type This option defines the type of addresses that should beused for filtering.You can choose from the Layer 2 hardware (MAC)addresses or Layer 3 IP or IPX addresses.The type of addresses to use
www.syngress.com
Figure 8.3 Define Filter Summary Tab
219_sniffer_08.qxd 6/28/02 11:58 AM Page 412
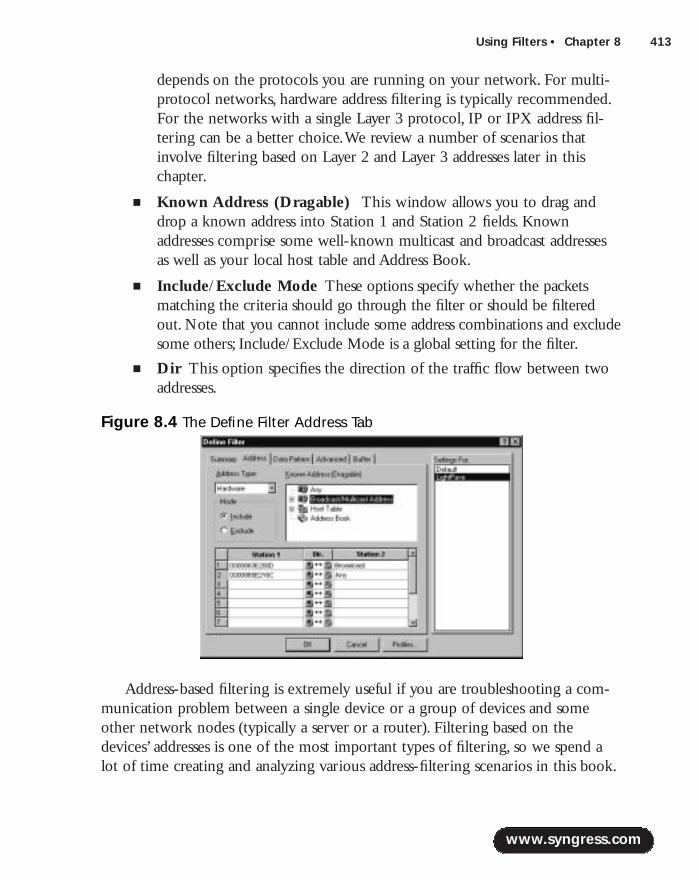
Using Filters • Chapter 8 413
depends on the protocols you are running on your network. For multi-protocol networks, hardware address filtering is typically recommended.For the networks with a single Layer 3 protocol, IP or IPX address fil-tering can be a better choice.We review a number of scenarios thatinvolve filtering based on Layer 2 and Layer 3 addresses later in thischapter.
■ Known Address (Dragable) This window allows you to drag anddrop a known address into Station 1 and Station 2 fields. Knownaddresses comprise some well-known multicast and broadcast addressesas well as your local host table and Address Book.
■ Include/Exclude Mode These options specify whether the packetsmatching the criteria should go through the filter or should be filteredout. Note that you cannot include some address combinations and excludesome others; Include/Exclude Mode is a global setting for the filter.
■ Dir This option specifies the direction of the traffic flow between twoaddresses.
Address-based filtering is extremely useful if you are troubleshooting a com-munication problem between a single device or a group of devices and someother network nodes (typically a server or a router). Filtering based on thedevices’ addresses is one of the most important types of filtering, so we spend alot of time creating and analyzing various address-filtering scenarios in this book.
www.syngress.com
Figure 8.4 The Define Filter Address Tab
219_sniffer_08.qxd 6/28/02 11:58 AM Page 413

414 Chapter 8 • Using Filters
The Data Pattern TabThe Data Pattern tab, shown in Figure 8.5, allows you to create a filtering policybased on a certain data pattern inside a frame.The filter can be created from asingle data pattern or from multiple data patterns linked by AND, OR, and NOTdefinitions.A data packet is defined by a sequence of bits and an offset from thebeginning of the packet or from the Layer 1 protocol boundary.The maximumlength of each data pattern equals 32 bytes, and you can configure up to 20 datapatterns connected together through the Boolean operators (logical operatorsAND, OR, and NOT).
NOTE
When talking about an offset as applied to filtering in Sniffer Pro, we arereferring to a shift in bytes from the beginning of the frame or protocol.
To understand what particular offset is applicable for a data patternin a frame, you must have an in-depth understanding of the protocolyou are analyzing. You should know all the data fields of the protocol aswell as the positions of the fields and their sizes.
Now, let’s discuss the meanings of all the buttons in the Data Pattern tab:
■ Add AND/OR Adds a new AND operator.You can transfer it intoOR operator afterward.
www.syngress.com
Figure 8.5 A Data Pattern That Allows Capture of FTP Passwords for AllHosts Except 192.168.2.1
219_sniffer_08.qxd 6/28/02 11:58 AM Page 414
Using Filters • Chapter 8 415
■ Toggle AND/OR Toggles between AND and OR operators.
■ Toggle NOT Turns on or off the NOT operator.
■ Add NOT Adds a new NOT operator.
■ Add Pattern Adds a new data pattern.We discuss how to create datapatterns in the following section.
■ Edit Pattern Allows you to modify a data pattern you have alreadycreated.
■ Delete allows you to remove a data pattern you have created, aBoolean expression, or a Boolean tree. Be careful with this button,because there is no Undo option and you can accidentally remove acomplex tree you spent a lot of time creating.
■ Evaluate Evaluates the Boolean expression. If the expression is notcompleted, Sniffer Pro displays an error message.
www.syngress.com
Boolean LogicBoolean logic is named for British mathematician George Boole(1815–1864), whose works were dedicated to a system of logic createdto generate better search results by formulating accurate queries.
To be able to create Sniffer Pro filters based on data patterns, youhave to understand four main Boolean operators:
■ Boolean AND permits only queries that contain both specifiedpatterns. For example, (Dest Port 21) AND (Protocol TCP)permit only TCP traffic destined for port 21.
■ Boolean OR permits queries that contain one of the specifiedpatterns. For example, (Dest Port 21) OR (Protocol TCP)permit all the TCP traffic and all other traffic (for example,UDP) destined for port 21.
■ Boolean NOT does not permit specified patterns. Forexample, NOT (Dest Port 21) filters out all the traffic destinedfor port 21.
Configuring & Implementing…
Continued
219_sniffer_08.qxd 6/28/02 11:58 AM Page 415

416 Chapter 8 • Using Filters
Let’s now discuss the way we can use all this new information. For example,we can capture FTP passwords for all the servers in the LightPave networkexcept for the password addressed to the server with the IP address 192.168.2.1,because this is an anonymous FTP server and users don’t send real passwords.
When using FTP, passwords are transmitted in TCP packets, which travelbetween an FTP client and a server on the client’s side.An FTP session can orig-inate from any available TCP port, at a time when a TCP port number typicallyequals 21 on the server’s side. Because we also want to exclude 192.168.2.1 fromour capturing, the Boolean expression will look like this:
(Dest IP NOT 192.168.2.1) AND (Dest Port 21) AND (Data pattern =
PASS with protocol offset 28h)
So, let’s create a data pattern according to our rules.We start with the (DestIP NOT 192.168.2.1) expression. In the Data Pattern tab, click the Add NOTbutton to create the Boolean NOT. Click the Add Pattern button.A newwindow called Edit Pattern pops up. Because we are not yet familiar with thiswindow, let’s go through all the available options:
■ Reset This button clears all the settings in the Edit Pattern window.
■ From This option allows you to choose if you want to specify dataoffset from the beginning of the packet (the Packet option) or from thebeginning of the Layer 3 protocol (the Protocol option).The Protocoloption is very convenient if you are creating a common filter for dif-ferent media types (for example,Token Ring and Ethernet) or for dif-ferent DLC frame formats (for example, 802.2, Ethernet II, or 802.3SNAP). In this case, Layer 3 protocols have different offsets from thebeginning of the packet, but our data will have the same offset from thebeginning of the Layer 3 protocol.
www.syngress.com
■ Boolean AND NOT works the same way as the NOT state-ment. For example, AND NOT (Dest Port 21) filters out all thetraffic destined for port 21.
You can combine a few statements into the same Boolean expres-sion, like this: (Dest IP 192.168.2.1) and (Source IP 192.168.2.100). (DestPort 21) will permit only Telnet (port 21) traffic originated from192.168.2.100 and destined for 192.168.2.1.
219_sniffer_08.qxd 6/28/02 11:58 AM Page 416
Using Filters • Chapter 8 417
■ Format This option permits you to switch between hex, binary,ASCII,and EBDIC formats. In the ASCII and EBDIC formats, standard charac-ters are shown as text symbols; anything else is replaced with dots.
■ Offset (hex) Specifies an offset from the beginning of the packet orLayer 3 protocol.
■ Data Pattern The Data Pattern window allows you to enter the dataon which you want to base your filter. Up to 32 octets can be used in asingle pattern.
■ Name Defines a symbolic name for the data pattern.
■ Packet Decode This window shows the selected packet in the detaileddecode form.You can copy from the field into the Data Pattern windowby selecting the field and pressing the Set Data button. Note that youmust have frames in your capture buffer in order to use this option.
■ Previous and Next These buttons focus the Packet Decode windowon the previous and next frames in your capture buffer.
Now that you’re familiar with all the Edit Pattern window options, let’s con-tinue with our example. Right now we are creating the (Dest IP NOT192.168.2.1) expression:
1. In the From field, choose the Protocol option, keep Format as hex,and specify 10 (hex) as an offset. In an IP header, the destination IPaddress has an offset of 16 bytes from the beginning of IP protocol data.
2. Translate 192.168.2.1 IP address into hex format; you will getC0.A8.02.01. Key this number into the Data Pattern window (seeFigure 8.6).
3. Specify a symbolic name for the pattern—for example, IP: DestinationAddress = [192.168.2.1].
4. Press the OK button.
5. In the Define Pattern window, move the focus to the AND operatorand create two more Data Patterns by clicking the Add Patternbutton—one for (Dest Port 21) and the second one for (Data pattern =PASS with protocol offset 28h).
Compare the result data pattern expression with the one you saw in Figure 8.5.
www.syngress.com
219_sniffer_08.qxd 6/28/02 11:58 AM Page 417
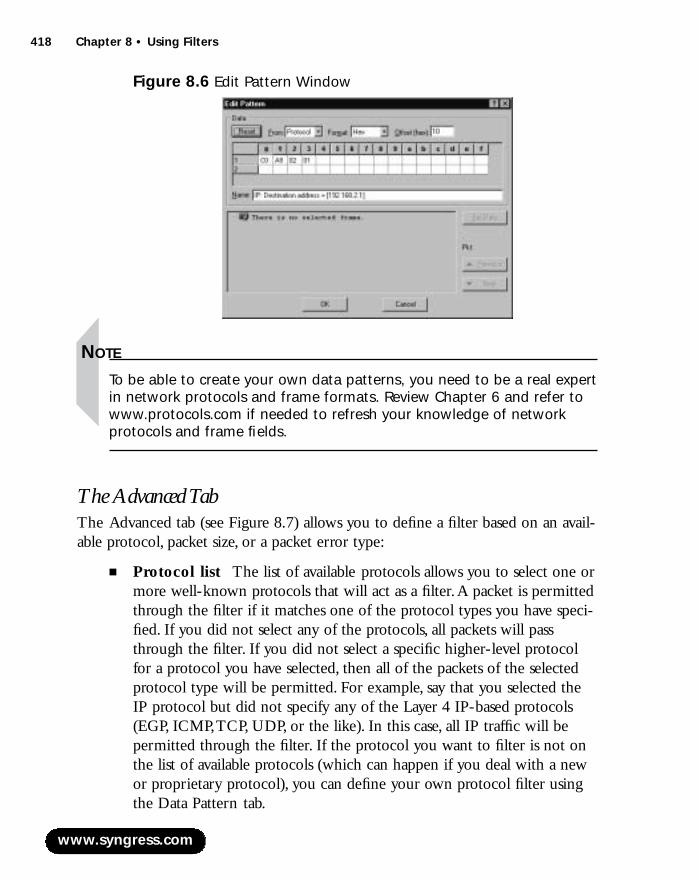
418 Chapter 8 • Using Filters
NOTE
To be able to create your own data patterns, you need to be a real expertin network protocols and frame formats. Review Chapter 6 and refer towww.protocols.com if needed to refresh your knowledge of networkprotocols and frame fields.
The Advanced TabThe Advanced tab (see Figure 8.7) allows you to define a filter based on an avail-able protocol, packet size, or a packet error type:
■ Protocol list The list of available protocols allows you to select one ormore well-known protocols that will act as a filter.A packet is permittedthrough the filter if it matches one of the protocol types you have speci-fied. If you did not select any of the protocols, all packets will passthrough the filter. If you did not select a specific higher-level protocolfor a protocol you have selected, then all of the packets of the selectedprotocol type will be permitted. For example, say that you selected theIP protocol but did not specify any of the Layer 4 IP-based protocols(EGP, ICMP,TCP, UDP, or the like). In this case, all IP traffic will bepermitted through the filter. If the protocol you want to filter is not onthe list of available protocols (which can happen if you deal with a newor proprietary protocol), you can define your own protocol filter usingthe Data Pattern tab.
www.syngress.com
Figure 8.6 Edit Pattern Window
219_sniffer_08.qxd 6/28/02 11:58 AM Page 418

Using Filters • Chapter 8 419
■ Packet Size This option specifies the size of the packets that will bepermitted through the filter.You can select packets that are equal to,greater than, or less than a specific size as well as in between or not inbetween a specified range of packet sizes.
■ Packet Type This window gives you an option to choose one or moreerror types that will be permitted through the filter. Sniffer Pro withNAI enhanced network drivers installed can detect the following typesof Layer 2 errors:
■ CRC Error A cyclic redundancy check (also known as a checksum)error occurs if the checksum calculated by the source node andSniffer Pro don’t match.
■ Jabber Oversized frame with a CRC error. Jabbers are typicallycaused by hardware failure and contain random or garbage data.
■ Runt The frame is too small (less than 64 bytes) but has a validchecksum.
■ Fragment The frame is too small (less than 64 bytes) and has aninvalid checksum.
■ Oversize Frame size is larger than the maximum transfer unit(MTU) for the media.
■ Collision Two or more network nodes are trying to transmit dataat the same time on a shared media network.
■ Alignment The length of the frame is not a number divisible by 8,so it cannot be resolved into bytes.
www.syngress.com
Figure 8.7 The Define Filter Advanced Tab
219_sniffer_08.qxd 6/28/02 11:58 AM Page 419
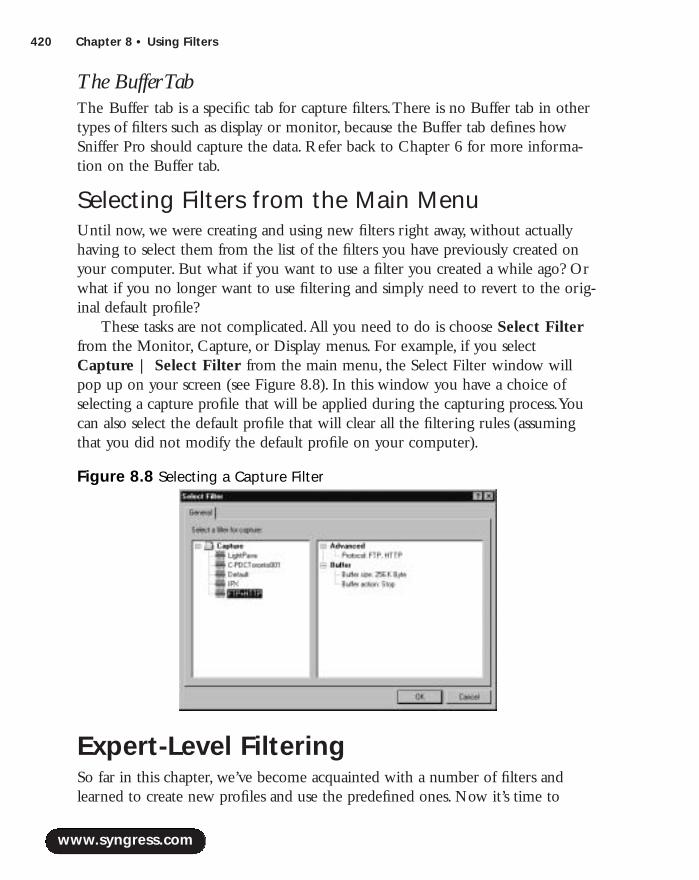
420 Chapter 8 • Using Filters
The Buffer TabThe Buffer tab is a specific tab for capture filters.There is no Buffer tab in othertypes of filters such as display or monitor, because the Buffer tab defines howSniffer Pro should capture the data. Refer back to Chapter 6 for more informa-tion on the Buffer tab.
Selecting Filters from the Main MenuUntil now, we were creating and using new filters right away, without actuallyhaving to select them from the list of the filters you have previously created onyour computer. But what if you want to use a filter you created a while ago? Orwhat if you no longer want to use filtering and simply need to revert to the orig-inal default profile?
These tasks are not complicated.All you need to do is choose Select Filterfrom the Monitor, Capture, or Display menus. For example, if you selectCapture | Select Filter from the main menu, the Select Filter window willpop up on your screen (see Figure 8.8). In this window you have a choice ofselecting a capture profile that will be applied during the capturing process.Youcan also select the default profile that will clear all the filtering rules (assumingthat you did not modify the default profile on your computer).
Expert-Level FilteringSo far in this chapter, we’ve become acquainted with a number of filters andlearned to create new profiles and use the predefined ones. Now it’s time to
www.syngress.com
Figure 8.8 Selecting a Capture Filter
219_sniffer_08.qxd 6/28/02 11:58 AM Page 420

Using Filters • Chapter 8 421
move on to the expert level and learn how to create filters that will help youtroubleshoot real-life problems. One of the most important groups of filters is thegroup of filters that are used to work with data flowing from one node toanother; we discuss this group shortly.We also discuss some advanced filters thatwill involve a combination of filtering parameters.
Filtering from One Node to Another One of the frequent issues a network analyst must deal with is user complaintsabout problems when working with a certain application or server.There is nocommon method of solving all the network issues, but there are some steps youcan start with:
1. Make sure that the user’s workstation does not suffer from network-related issues, such as a slow CPU, a highly fragmented hard drive, or aninsufficient amount of RAM. Make sure that you have the right driversfor the network card installed on the user’s computer and that thesedrivers are up to date. If necessary, download new drivers from thevendor’s Web site and update them.
2. Test patchcords that are used to connect to the network device. If pos-sible, try to move the cord to another port on a switch or hub to whichthe user is connected. Faulty network devices and low-quality networkcabling often create network performance issues that sometimes can bevery difficult to troubleshoot.
3. Make sure you have network diagrams and documentation so that youcan understand how the application should work.
4. Capture all the traffic on the network. On busy networks, your capturebuffer will fill up very quickly, but you will be able to get a goodoverview of what is going on. For example, if you have a very busyEthernet segment with a high level of collisions and packet loss, mostapplications will experience performance degradation due to the highvolume of packet retransmissions. Some other general network issuessuch as broadcast storms and routing loops can also cause performanceissues.These issues typically can be detected at this point of analysiswithout going into troubleshooting of a particular application.
5. If you still have not found the problem, the last step of the trouble-shooting process is to analyze the network topology and general healthof the network.At this stage, you should start looking into traffic
www.syngress.com
219_sniffer_08.qxd 6/28/02 11:58 AM Page 421
422 Chapter 8 • Using Filters
between two network devices that are actually experiencing theproblem.The easiest way to do this is to apply a filter, which is based onthe addresses of the network nodes.
Depending on the particular network protocol the application uses, a corre-sponding filter should be applied.The most popular network protocols these daysare IP and IPX. So, we will set up filters for these protocols. Filtering based onMAC address can also be very useful in some other cases. MAC address filters arealso discussed in the following sections.
www.syngress.com
Network CablingInstallation of a new network cabling looks like a trivial task to manypeople. For that reason, many network administrators make their owncabling although they lack the necessary skills and tools for this work.Bad cabling is one of the top network problems.
Correctly installed network cable should satisfy more than 10 dif-ferent requirements, such as frequency range, attenuation, and propa-gation delay. Cable testers that measure all these parameters can costthousands of dollars and in most cases are not available to a typical net-work administrator. Therefore, it can be a good idea to hire a qualifiedcontractor who is experienced in cabling installation and has appro-priate tools to certify each cable and provide you with a full report. Ifyou still decide to do your own cabling, we encourage you to visitwww.lanshack.com and refer to the articles Cat 5 Cabling Tutorial andHow to Make a Category 5 Patch Cable. These two documents will giveyou an idea of various aspects of Category 5 (and new Categories 5E, 6,and 7) cabling.
If your budget permits, you might also decide to purchase yourown cable tester so that you don’t need to rely on contractors to certifyyour wiring. Fluke is a leader in production of cable testers, so you mightwant to visit its Web site (www.fluke.com) to get more information onthe products this company offers.
Configuring & Implementing…
219_sniffer_08.qxd 6/28/02 11:58 AM Page 422

Using Filters • Chapter 8 423
MAC Address FilteringFiltering based on source and/or destination MAC addresses can be very helpfulif the devices on your network are running multiple Layer 3 protocols and youcannot easily determine which particular network layer protocol the problem isassociated with.
NOTE
Try to avoid the use of multiple Layer 3 protocols on your network.Additional protocols add complexity to your network, so it becomes moredifficult to troubleshoot. They also create additional broadcast traffic thatcan decrease overall performance. Nowadays, the TCP/IP protocol stack isdefinitely the best choice as a single protocol for most networks.
First, we need to discuss both Layers 2 and 3 destination addresses, dependingon where the frame is sent—to a device on the local or on the remote network.In our example (see Figure 8.9), we use IP as a Layer 3 protocol; for other Layer 3protocols, the idea is the same.Workstation A sends packets to three destinations:Servers A, B, and C. In the first case, the server resides on the same IP subnet(192.168.2.0/24). In the second case, packets must pass through the router, becauseServers B and C are connected to another subnet (192.168.3.0/24).Table 8.1summarizes destination IP and MAC addresses of the frames originated fromWorkstation A. Note the destination MAC address of the frame sent to Servers Band C—it is the router’s MAC address, because the workstation must send packetsto all nonlocal destinations through its default gateway.
Table 8.1 Example Destination IP and MAC Addresses
IP Destination MAC Destination
Server A 192.168.2.2 00:01:02:eb:2a:bfServer B 192.168.3.2 00:e0:1e:60:83:18Server C 192.168.3.3 00:e0:1e:60:83:18
Now let’s look into three main scenarios you might face while working onnetwork problems in a network with this or a similar topology.
www.syngress.com
219_sniffer_08.qxd 6/28/02 11:58 AM Page 423
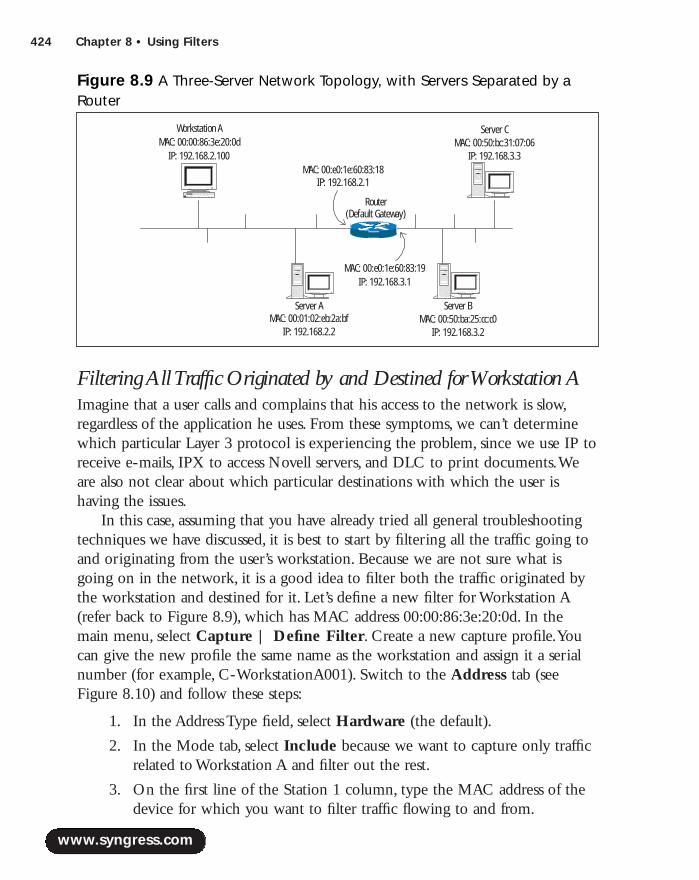
424 Chapter 8 • Using Filters
Filtering All Traffic Originated by and Destined for Workstation AImagine that a user calls and complains that his access to the network is slow,regardless of the application he uses. From these symptoms, we can’t determinewhich particular Layer 3 protocol is experiencing the problem, since we use IP toreceive e-mails, IPX to access Novell servers, and DLC to print documents.Weare also not clear about which particular destinations with which the user ishaving the issues.
In this case, assuming that you have already tried all general troubleshootingtechniques we have discussed, it is best to start by filtering all the traffic going toand originating from the user’s workstation. Because we are not sure what isgoing on in the network, it is a good idea to filter both the traffic originated bythe workstation and destined for it. Let’s define a new filter for Workstation A(refer back to Figure 8.9), which has MAC address 00:00:86:3e:20:0d. In themain menu, select Capture | Define Filter. Create a new capture profile.Youcan give the new profile the same name as the workstation and assign it a serialnumber (for example, C-WorkstationA001). Switch to the Address tab (seeFigure 8.10) and follow these steps:
1. In the Address Type field, select Hardware (the default).
2. In the Mode tab, select Include because we want to capture only trafficrelated to Workstation A and filter out the rest.
3. On the first line of the Station 1 column, type the MAC address of thedevice for which you want to filter traffic flowing to and from.
www.syngress.com
Figure 8.9 A Three-Server Network Topology, with Servers Separated by aRouter
Workstation AMAC: 00:00:86:3e:20:0d
IP: 192.168.2.100
Server AMAC: 00:01:02:eb:2a:bf
IP: 192.168.2.2
Server BMAC: 00:50:ba:25:cc:c0
IP: 192.168.3.2
MAC: 00:e0:1e:60:83:18IP: 192.168.2.1
Router(Default Gateway)
MAC: 00:e0:1e:60:83:19IP: 192.168.3.1
Server CMAC: 00:50:bc:31:07:06
IP: 192.168.3.3
219_sniffer_08.qxd 6/28/02 11:58 AM Page 424

Using Filters • Chapter 8 425
4. Type Any in the first line of the Station 2 column.You can also dragand drop Any from the Known Address list.)
5. Press OK to close the Define Filter window.
We have just defined the filter that will allow us to capture all packets that areflowing to and from the workstation, regardless of upper-layer protocols. Now,when you have a full picture of traffic belonging to the workstation that has net-work issues, you can determine the source of the problem using troubleshootingtechniques we learned in Chapter 7.
Filtering Traffic Between Two Network Devices on the Same SegmentAnother type of problem with which you will often deal is a network issue thatinvolves two network devices. In the majority of cases, the symptoms will showthat the user can work with all the network applications and servers from his orher workstation except for one server to which the user won’t be able to con-nect. Depending on your network topology and protocols you are running, youshould be able to decide which particular type of filtering is more suitable—filtering based on Layer 2 addresses or filtering based on Layer 3 addresses.
Filtering based on Layer 3 (IP or IPX) addresses allows you to separate thetraffic between two devices, regardless of whether the devices are located on thesame segment or on different segments. However, this type of filtering limits yourcapturing activity to a single Layer 3 protocol, so it cannot give you a full pictureif both your server and your workstation are running multiple Layer 3 protocols.
www.syngress.com
Figure 8.10 The Define Filter Address Tab
219_sniffer_08.qxd 6/28/02 11:58 AM Page 425
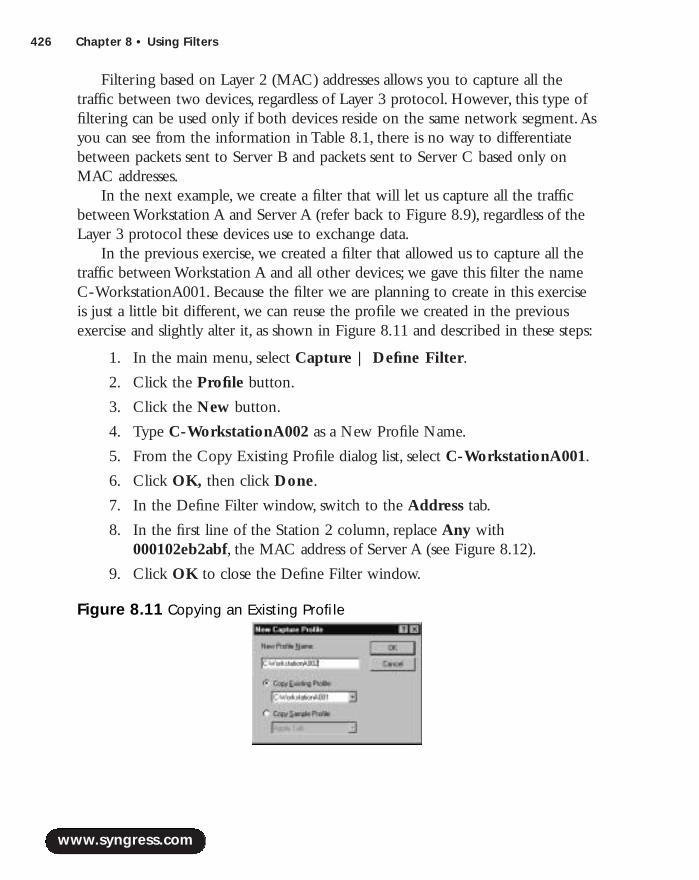
426 Chapter 8 • Using Filters
Filtering based on Layer 2 (MAC) addresses allows you to capture all thetraffic between two devices, regardless of Layer 3 protocol. However, this type offiltering can be used only if both devices reside on the same network segment.Asyou can see from the information in Table 8.1, there is no way to differentiatebetween packets sent to Server B and packets sent to Server C based only onMAC addresses.
In the next example, we create a filter that will let us capture all the trafficbetween Workstation A and Server A (refer back to Figure 8.9), regardless of theLayer 3 protocol these devices use to exchange data.
In the previous exercise, we created a filter that allowed us to capture all thetraffic between Workstation A and all other devices; we gave this filter the nameC-WorkstationA001. Because the filter we are planning to create in this exerciseis just a little bit different, we can reuse the profile we created in the previousexercise and slightly alter it, as shown in Figure 8.11 and described in these steps:
1. In the main menu, select Capture | Define Filter.
2. Click the Profile button.
3. Click the New button.
4. Type C-WorkstationA002 as a New Profile Name.
5. From the Copy Existing Profile dialog list, select C-WorkstationA001.
6. Click OK, then click Done.
7. In the Define Filter window, switch to the Address tab.
8. In the first line of the Station 2 column, replace Any with000102eb2abf, the MAC address of Server A (see Figure 8.12).
9. Click OK to close the Define Filter window.
www.syngress.com
Figure 8.11 Copying an Existing Profile
219_sniffer_08.qxd 6/28/02 11:58 AM Page 426

Using Filters • Chapter 8 427
Capturing Broadcast TrafficAnother type of problem that you can troubleshoot using MAC-address filteringis an explicit number of broadcasts on the network. Sniffer Pro allows us toimplement filtering based on a broadcast address that makes it easy to find adevice or a number of devices that cause a broadcast-related issue. Let’s define amonitor filter and use Monitor Matrix to find the source of a problem:
1. In the main menu, select Monitor | Define Filter.
2. Create a new profile called M-Broadcast. (We are using the namingconvention recommended by Network Associates, an M- combinationused for monitor filter profiles.)
3. In the Define Filter window, switch to the Address tab.
4. Drag the Any keyword from the Known Address window into the firstline of the Station 1 tab.
5. In the Known Address window, expand the Broadcast/MulticastAddress text box, scroll to the Broadcast (FFFFFFFFFFFF) address,and drag it to the first line of the Station 2 tab (see Figure 8.13).
www.syngress.com
Figure 8.12 A MAC Address-Based Filter Between Two Devices
Figure 8.13 Monitoring All the Broadcast Packets
219_sniffer_08.qxd 6/28/02 11:58 AM Page 427

428 Chapter 8 • Using Filters
Now we can apply the filter we’ve just defined to all the Monitor applications:
1. In the main menu, select Monitor | Select Filter.
2. In the Select Filter window, click Apply monitor filter.
3. From the list of the available filters, select M-Broadcast.
4. Click OK to close the Select Filter window.
Start the Matrix Monitor by selecting Monitor | Matrix from the mainmenu. Now, by switching to the Bar or Pie view, you can easily identify networkdevices that generate most of the broadcast traffic on your network.
IP Address FilteringBecause IP protocol dominates networks today, it’s no wonder that a largenumber of problems you must solve relate to this protocol.You already gainedsome information about the IP frame format in Chapter 6, so let’s move on tothe description of filtering based on IP addresses.As you probably know, IPaddresses consist of 32 bits grouped in 8 bits, separated by dots. For user conve-nience, IP addresses are typically represented in decimal format (called dotted dec-imal format). Each IP address consists of two parts: a network part and a host part.
When IP addressing was first developed, network and host parts were differ-entiated based on the first 4 bits of an IP address (see Table 8.2). Depending onthese 4 bits, each network belonged to a class; this method of separating the net-work and host parts was called classful. Class A, Class B, and Class C IP addressesare unicast IP addresses, so they can be assigned to network nodes such as servers,workstations, and routers.The last group of IP addresses, Class D addresses, isreserved for a special purpose:They represent multicast groups, which differentmulticast-enabled devices can join.
Table 8.2 Classful IP Addressing
Number of Hosts
First 3 Number of per Class Bits IP Range Subnet Mask Networks Network
A 0000 1.0.0.0– 255.0.0.0 126 networks 16M 127.255.255.255
B 1000 128.0.0.0– 255.255.0.0 65K networks 65K 191.255.255.255
www.syngress.com
Continued
219_sniffer_08.qxd 6/28/02 11:58 AM Page 428
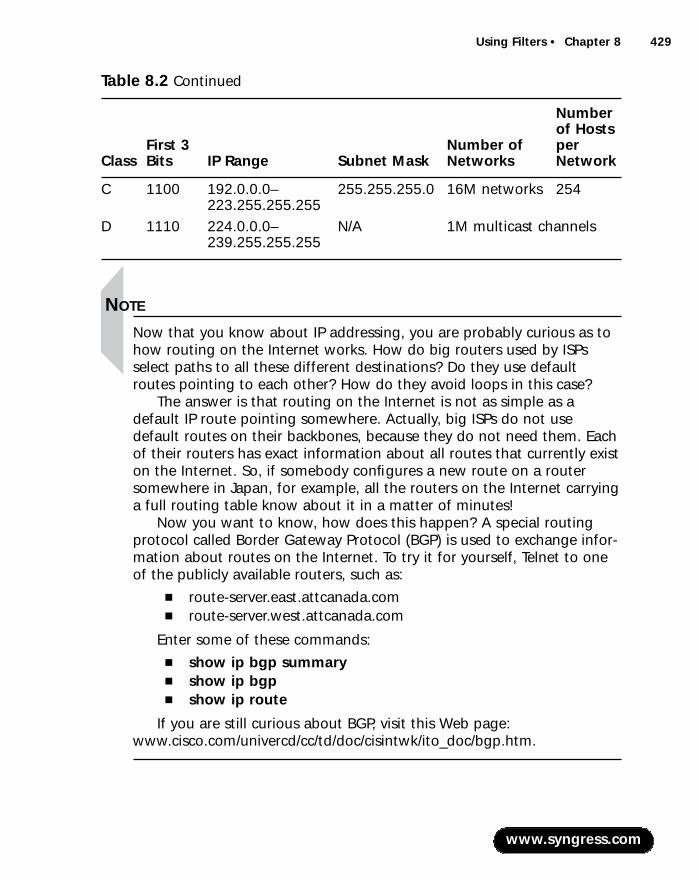
Using Filters • Chapter 8 429
C 1100 192.0.0.0– 255.255.255.0 16M networks 254 223.255.255.255
D 1110 224.0.0.0– N/A 1M multicast channels239.255.255.255
NOTE
Now that you know about IP addressing, you are probably curious as tohow routing on the Internet works. How do big routers used by ISPsselect paths to all these different destinations? Do they use defaultroutes pointing to each other? How do they avoid loops in this case?
The answer is that routing on the Internet is not as simple as adefault IP route pointing somewhere. Actually, big ISPs do not usedefault routes on their backbones, because they do not need them. Eachof their routers has exact information about all routes that currently existon the Internet. So, if somebody configures a new route on a routersomewhere in Japan, for example, all the routers on the Internet carryinga full routing table know about it in a matter of minutes!
Now you want to know, how does this happen? A special routingprotocol called Border Gateway Protocol (BGP) is used to exchange infor-mation about routes on the Internet. To try it for yourself, Telnet to oneof the publicly available routers, such as:
■ route-server.east.attcanada.com■ route-server.west.attcanada.com
Enter some of these commands:■ show ip bgp summary■ show ip bgp■ show ip route
If you are still curious about BGP, visit this Web page:www.cisco.com/univercd/cc/td/doc/cisintwk/ito_doc/bgp.htm.
www.syngress.com
Table 8.2 Continued
Number of Hosts
First 3 Number of per Class Bits IP Range Subnet Mask Networks Network
219_sniffer_08.qxd 6/28/02 11:58 AM Page 429
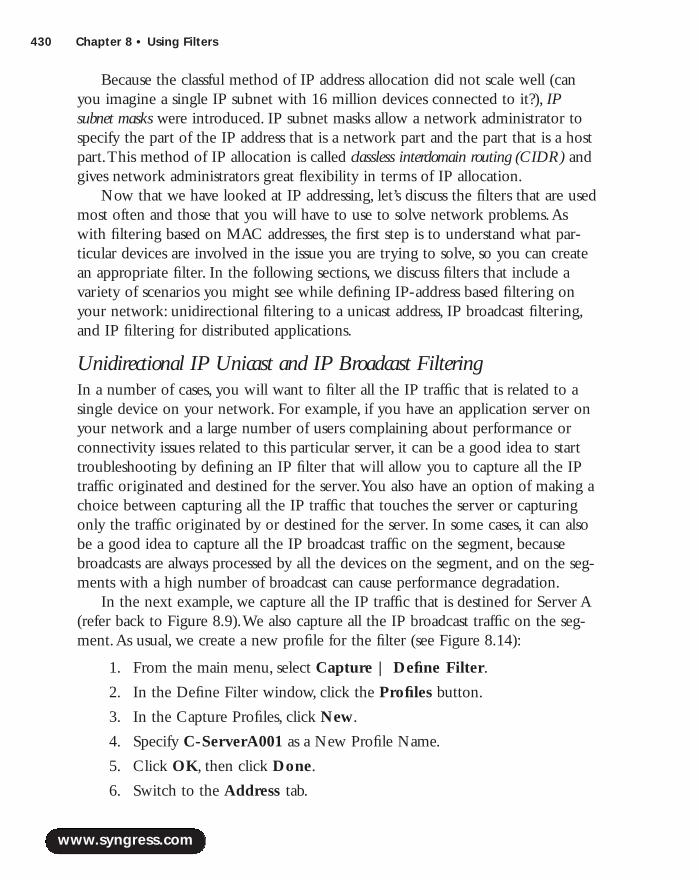
430 Chapter 8 • Using Filters
Because the classful method of IP address allocation did not scale well (canyou imagine a single IP subnet with 16 million devices connected to it?), IPsubnet masks were introduced. IP subnet masks allow a network administrator tospecify the part of the IP address that is a network part and the part that is a hostpart.This method of IP allocation is called classless interdomain routing (CIDR) andgives network administrators great flexibility in terms of IP allocation.
Now that we have looked at IP addressing, let’s discuss the filters that are usedmost often and those that you will have to use to solve network problems.Aswith filtering based on MAC addresses, the first step is to understand what par-ticular devices are involved in the issue you are trying to solve, so you can createan appropriate filter. In the following sections, we discuss filters that include avariety of scenarios you might see while defining IP-address based filtering onyour network: unidirectional filtering to a unicast address, IP broadcast filtering,and IP filtering for distributed applications.
Unidirectional IP Unicast and IP Broadcast FilteringIn a number of cases, you will want to filter all the IP traffic that is related to asingle device on your network. For example, if you have an application server onyour network and a large number of users complaining about performance orconnectivity issues related to this particular server, it can be a good idea to starttroubleshooting by defining an IP filter that will allow you to capture all the IPtraffic originated and destined for the server.You also have an option of making achoice between capturing all the IP traffic that touches the server or capturingonly the traffic originated by or destined for the server. In some cases, it can alsobe a good idea to capture all the IP broadcast traffic on the segment, becausebroadcasts are always processed by all the devices on the segment, and on the seg-ments with a high number of broadcast can cause performance degradation.
In the next example, we capture all the IP traffic that is destined for Server A(refer back to Figure 8.9).We also capture all the IP broadcast traffic on the seg-ment.As usual, we create a new profile for the filter (see Figure 8.14):
1. From the main menu, select Capture | Define Filter.
2. In the Define Filter window, click the Profiles button.
3. In the Capture Profiles, click New.
4. Specify C-ServerA001 as a New Profile Name.
5. Click OK, then click Done.
6. Switch to the Address tab.
www.syngress.com
219_sniffer_08.qxd 6/28/02 11:58 AM Page 430
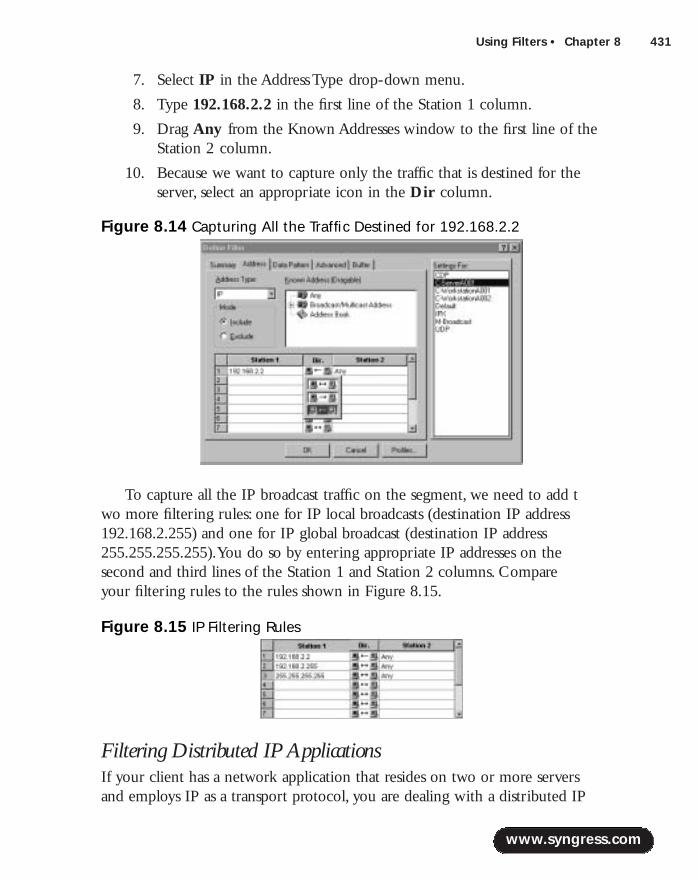
Using Filters • Chapter 8 431
7. Select IP in the Address Type drop-down menu.
8. Type 192.168.2.2 in the first line of the Station 1 column.
9. Drag Any from the Known Addresses window to the first line of theStation 2 column.
10. Because we want to capture only the traffic that is destined for theserver, select an appropriate icon in the Dir column.
To capture all the IP broadcast traffic on the segment, we need to add two more filtering rules: one for IP local broadcasts (destination IP address192.168.2.255) and one for IP global broadcast (destination IP address255.255.255.255).You do so by entering appropriate IP addresses on the second and third lines of the Station 1 and Station 2 columns. Compare your filtering rules to the rules shown in Figure 8.15.
Filtering Distributed IP ApplicationsIf your client has a network application that resides on two or more servers and employs IP as a transport protocol, you are dealing with a distributed IP
www.syngress.com
Figure 8.14 Capturing All the Traffic Destined for 192.168.2.2
Figure 8.15 IP Filtering Rules
219_sniffer_08.qxd 6/28/02 11:58 AM Page 431

432 Chapter 8 • Using Filters
application.The challenge of a distributed IP application in comparison to anapplication that resides on a single server is that you can observe a number ofdata flows between servers—not only between a workstation and a server thatcan be related to the same event, such as a customer’s data query.
Let’s say we have some sort of distributed application that resides on Server Aand Server B (refer back to Figure 8.9).A user at Workstation A is experiencingnetwork problems while working with this application.As a network expert, youdecide to capture all the traffic flowing among Workstation A, Server A, andServer B.
First you have to decide where your Sniffer Pro should be connected to.Youhave a choice of connecting it to the segment to which Workstation A and ServerA are connected, or you can connect it to the segment where Server B and ServerC reside. In this particular case, the choice is clear:Your Sniffer Pro must be con-nected to the same Ethernet segment as Workstation A and Server A. If you con-nect your Sniffer Pro to the Server B and Server C segment, you won’t be able tocapture network traffic between Workstation A and Server A.As you know, routerstypically do not propagate to different interfaces unicast traffic local to an interface.
The second step is to define a proper filter. Because we want to capture IPtraffic between three separate devices, we must define a filter that includes threepairs of capture rules:
■ Traffic between Workstation A and Server A
■ Traffic between Workstation A and Server B
■ Traffic between Server A and Server B
Since you already know how to create filters based on addresses, create yourown filter and compare it to the one shown in Figure 8.16. If you experiencesome difficulties, review the “Unidirectional IP Unicast and IP BroadcastFiltering” section of this chapter.
Therefore, the filter we’ve just created will permit all the IP traffic amongWorkstation A, Server A, and Server B and will deny all other traffic. Note that
www.syngress.com
Figure 8.16 Filtering Rules Between Three Network Devices
219_sniffer_08.qxd 6/28/02 11:58 AM Page 432
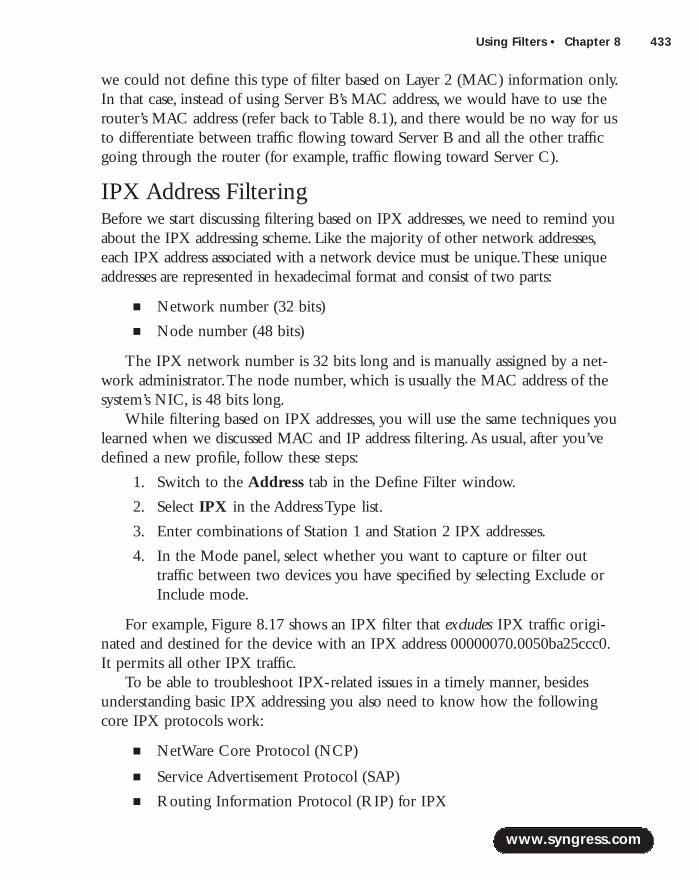
Using Filters • Chapter 8 433
we could not define this type of filter based on Layer 2 (MAC) information only.In that case, instead of using Server B’s MAC address, we would have to use therouter’s MAC address (refer back to Table 8.1), and there would be no way for usto differentiate between traffic flowing toward Server B and all the other trafficgoing through the router (for example, traffic flowing toward Server C).
IPX Address FilteringBefore we start discussing filtering based on IPX addresses, we need to remind youabout the IPX addressing scheme. Like the majority of other network addresses,each IPX address associated with a network device must be unique.These uniqueaddresses are represented in hexadecimal format and consist of two parts:
■ Network number (32 bits)
■ Node number (48 bits)
The IPX network number is 32 bits long and is manually assigned by a net-work administrator.The node number, which is usually the MAC address of thesystem’s NIC, is 48 bits long.
While filtering based on IPX addresses, you will use the same techniques youlearned when we discussed MAC and IP address filtering.As usual, after you’vedefined a new profile, follow these steps:
1. Switch to the Address tab in the Define Filter window.
2. Select IPX in the Address Type list.
3. Enter combinations of Station 1 and Station 2 IPX addresses.
4. In the Mode panel, select whether you want to capture or filter outtraffic between two devices you have specified by selecting Exclude orInclude mode.
For example, Figure 8.17 shows an IPX filter that excludes IPX traffic origi-nated and destined for the device with an IPX address 00000070.0050ba25ccc0.It permits all other IPX traffic.
To be able to troubleshoot IPX-related issues in a timely manner, besidesunderstanding basic IPX addressing you also need to know how the followingcore IPX protocols work:
■ NetWare Core Protocol (NCP)
■ Service Advertisement Protocol (SAP)
■ Routing Information Protocol (RIP) for IPX
www.syngress.com
219_sniffer_08.qxd 6/28/02 11:58 AM Page 433
434 Chapter 8 • Using Filters
You can find a very good document, Troubleshooting Novell IPX, at the followingsite: www.cisco.com/univercd/cc/td/doc/cisintwk/itg_v1/tr1908.htm.The doc-ument discusses most of the issues that you can experience while resolving IPXproblems.
Troubleshooting with FiltersWe have already talked about a large number of network scenarios that can bemuch easier to troubleshoot if you develop a proper filter.You could have realizedby yourself that the main step that will lead you to find the cause of a networkissue is understanding the customer’s network and the network protocols yourcustomer uses.This section discusses two problems that were easily resolved withthe help of proper filters.
Cisco Discovery ProtocolAs a network analyst, imagine that you are called by a customer whose networkhas started to experience security issues associated with Cisco equipment the cus-tomer is using. She suspects that an intruder is able to find out what particularversions of the Cisco IOS software are used on the network and explore securitybugs associated with these versions of code via cdp neighbors.
A new company security policy was developed to eliminate all CDP trafficon the network.The client expects you to make an audit of her network to makesure that CDP is disabled on all the Cisco devices.
www.syngress.com
Figure 8.17 Filtering Out Traffic Flowing to and from a Single IPX Host
219_sniffer_08.qxd 6/28/02 11:58 AM Page 434
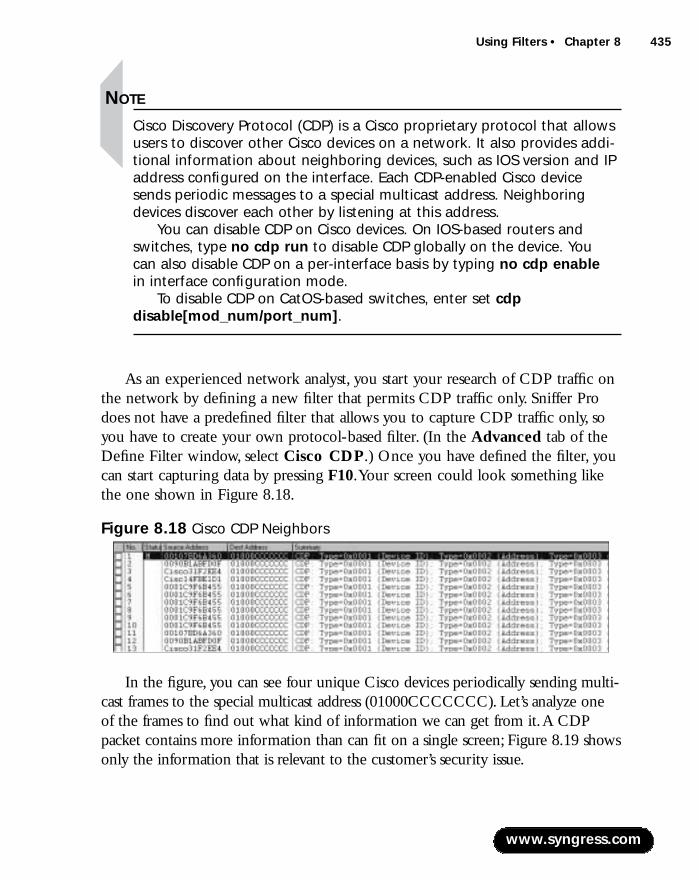
Using Filters • Chapter 8 435
NOTE
Cisco Discovery Protocol (CDP) is a Cisco proprietary protocol that allowsusers to discover other Cisco devices on a network. It also provides addi-tional information about neighboring devices, such as IOS version and IPaddress configured on the interface. Each CDP-enabled Cisco devicesends periodic messages to a special multicast address. Neighboringdevices discover each other by listening at this address.
You can disable CDP on Cisco devices. On IOS-based routers andswitches, type no cdp run to disable CDP globally on the device. You can also disable CDP on a per-interface basis by typing no cdp enablein interface configuration mode.
To disable CDP on CatOS-based switches, enter set cdpdisable[mod_num/port_num].
As an experienced network analyst, you start your research of CDP traffic onthe network by defining a new filter that permits CDP traffic only. Sniffer Prodoes not have a predefined filter that allows you to capture CDP traffic only, soyou have to create your own protocol-based filter. (In the Advanced tab of theDefine Filter window, select Cisco CDP.) Once you have defined the filter, youcan start capturing data by pressing F10.Your screen could look something likethe one shown in Figure 8.18.
In the figure, you can see four unique Cisco devices periodically sending multi-cast frames to the special multicast address (01000CCCCCCC). Let’s analyze oneof the frames to find out what kind of information we can get from it.A CDPpacket contains more information than can fit on a single screen; Figure 8.19 showsonly the information that is relevant to the customer’s security issue.
www.syngress.com
Figure 8.18 Cisco CDP Neighbors
219_sniffer_08.qxd 6/28/02 11:58 AM Page 435
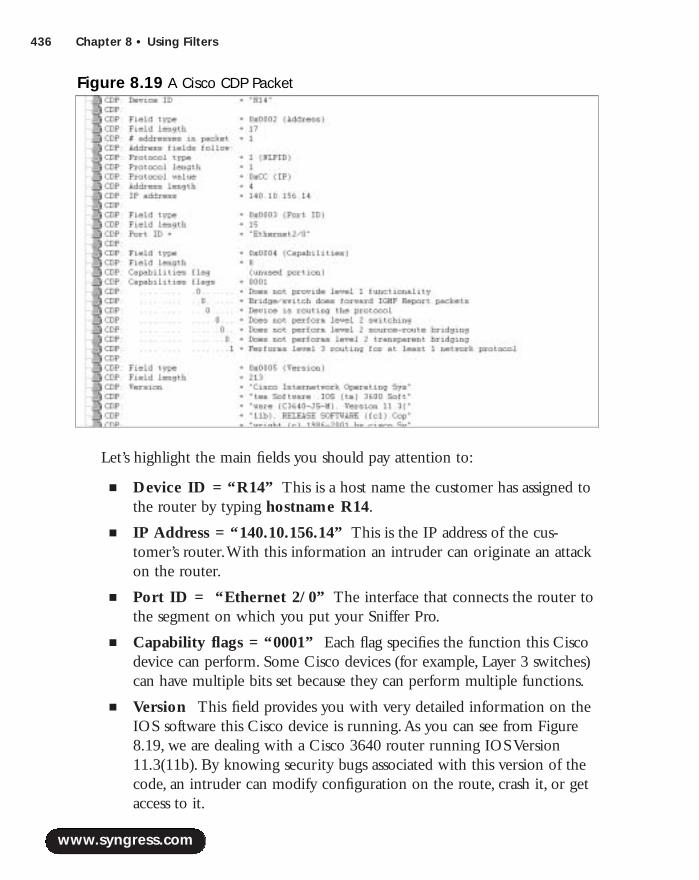
436 Chapter 8 • Using Filters
Let’s highlight the main fields you should pay attention to:
■ Device ID = “R14” This is a host name the customer has assigned tothe router by typing hostname R14.
■ IP Address = “140.10.156.14” This is the IP address of the cus-tomer’s router.With this information an intruder can originate an attackon the router.
■ Port ID = “Ethernet 2/0” The interface that connects the router tothe segment on which you put your Sniffer Pro.
■ Capability flags = “0001” Each flag specifies the function this Ciscodevice can perform. Some Cisco devices (for example, Layer 3 switches)can have multiple bits set because they can perform multiple functions.
■ Version This field provides you with very detailed information on theIOS software this Cisco device is running.As you can see from Figure8.19, we are dealing with a Cisco 3640 router running IOS Version11.3(11b). By knowing security bugs associated with this version of thecode, an intruder can modify configuration on the route, crash it, or getaccess to it.
www.syngress.com
Figure 8.19 A Cisco CDP Packet
219_sniffer_08.qxd 6/28/02 11:58 AM Page 436
Using Filters • Chapter 8 437
■ Platform = “cisco 3640” This one’s not shown in Figure 8.19.ThePlatform field gives you information on the Cisco hardware platform.
Routing Information Protocol Your customer has just installed two new routers with multiple interfaces. He didnot want to spend time on manual configuration of IP static routes and decidedto implement a dynamic routing protocol. Because he does not have much expe-rience with dynamic routing protocols, he wants to use RIP version 1—the sim-plest of available protocols. He used some examples from the documentation CDshe got with the routers, but he ran into problems: Routes are appearing and dis-appearing from the routing tables and his network is very unstable. He has askedyou to look into the issue and resolve its.
NOTE
RIP is one of the most popular and definitely the simplest of the largevariety of IP routing protocols. RIP version 1 is a classful routing protocol(refer to the “IP Address Filtering” section of this chapter for the defini-tion of classful routing) that employs UDP packets to send broadcastperiodic updates. Hop count is used as a metric to choose the best pathbetween destinations. A network that is 16 hops away is consideredunreachable, and that is a limiting factor of the diameter of a RIP-enabled network.
RIP version 2 is very similar to RIP version 1 in the sense that it usesperiodic updates and hop count as a metric, but it has a few major dif-ferences:
■ RIP version 2 messages carry network masks (therefore, RIP ver-sion 2 is a classless protocol).
■ RIP version 2 uses multicast address 224.0.0.9 as a destinationfor routing updates.
For more information on RIP and RIP packet format, refer towww.cisco.com/univercd/cc/td/doc/cisintwk/ito_doc/rip.htm.
As a Sniffer Pro expert, you started your research by taking a snapshot of trafficon the customer’s network.You found nothing unusual; the network was notoverutilized, you discovered no packet loss of loops.The next step is to define afilter that will capture only the traffic related to the problem you are investigating.
www.syngress.com
219_sniffer_08.qxd 6/28/02 11:58 AM Page 437
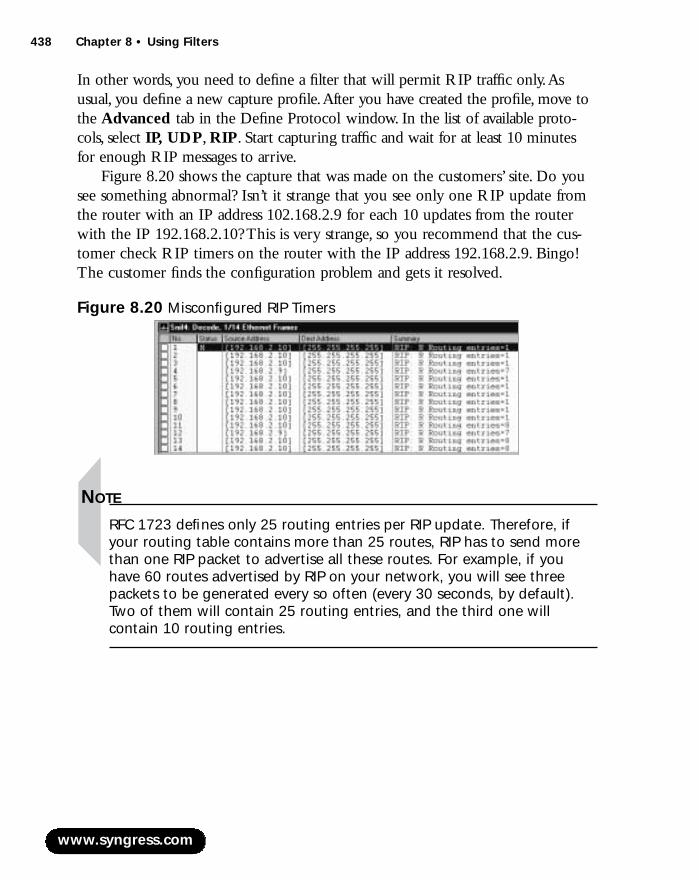
438 Chapter 8 • Using Filters
In other words, you need to define a filter that will permit RIP traffic only.Asusual, you define a new capture profile.After you have created the profile, move tothe Advanced tab in the Define Protocol window. In the list of available proto-cols, select IP, UDP, RIP. Start capturing traffic and wait for at least 10 minutesfor enough RIP messages to arrive.
Figure 8.20 shows the capture that was made on the customers’ site. Do yousee something abnormal? Isn’t it strange that you see only one RIP update fromthe router with an IP address 102.168.2.9 for each 10 updates from the routerwith the IP 192.168.2.10? This is very strange, so you recommend that the cus-tomer check RIP timers on the router with the IP address 192.168.2.9. Bingo!The customer finds the configuration problem and gets it resolved.
NOTE
RFC 1723 defines only 25 routing entries per RIP update. Therefore, ifyour routing table contains more than 25 routes, RIP has to send morethan one RIP packet to advertise all these routes. For example, if youhave 60 routes advertised by RIP on your network, you will see threepackets to be generated every so often (every 30 seconds, by default).Two of them will contain 25 routing entries, and the third one will contain 10 routing entries.
www.syngress.com
Figure 8.20 Misconfigured RIP Timers
219_sniffer_08.qxd 6/28/02 11:58 AM Page 438

Using Filters • Chapter 8 439
SummaryThe principles of filtering were not invented for networks specifically, but they’vebeen adapted for the purposed of working with digital data.When we talk aboutfiltering as it relates to networks, we mean separating unnecessary data—in otherwords, data irrelevant to the problem we are investigating. Sniffer Pro is designedto help you achieve that goal.
Sniffer Pro comes with a number of predefined filters that are very usefulwhen you need to do filtering based on a network protocol type (AppleTalk,IPX, NetBEUI) or a network application (IP/FTP + HTTP, IP/Telnet,IP/whois).To access and use the predefined filters, you need to copy a sampleprofile and save it as a new one. Profiles are special units in which Sniffer Prostores filters, and each filter has its own profile.You can create new profiles fromthe Monitor, Capture, and Display menus, depending on a type of filter youneed.
Generally, you use capture filters when, at the moment you begin capturingdata, you are absolutely sure of the specific data you need to analyze and save itinto the capture buffer. One of the advantages of this type of filtering is that youcapture and save only specific information you are interested in and thus savespace on your hard drive.
If you are not sure what particular information you want to save, you shouldcapture all data Sniffer Pro can see and use a display filter afterward to select thedata you need. It is possible to apply a number of filters to the original capturebuffer or apply a filter to already filtered information.If the devices on your network are running multiple Layer 3 protocols and youdon’t know what particular protocol is causing a problem, it is a good idea to dofiltering based on source and/or destination MAC address to solve a problem. Ifyou are sure that a particular Layer 3 protocol is involved in an issue, or if you aredealing with an application distributed among a number of servers separated byrouters, you should use filtering based on Layer 3 addresses (IP or IPX).
Solutions Fast Track
What Is Filtering, and Why Filter?
! Filtering is the process of removing impurities from a substance with thehelp of a filter.
www.syngress.com
219_sniffer_08.qxd 6/28/02 11:58 AM Page 439

440 Chapter 8 • Using Filters
! In networks, filtering involves separating the irrelevant data from relevantdata—the process of searching for specific information hidden in themidst of the data flow.
! Sniffer Pro allows you to employ different types of traffic filtering: byMAC, by IP address, by data patterns, and by protocol types.
Using Predefined Filters
! Sniffer Pro comes with a number of predefined filters.
! To access predefined filters copy a sample profile.
Creating Filters
! In Sniffer Pro, filters are stored in special units, called profiles. Every typeof filter is stored in a corresponding profile.You can create profiles fromthe Monitor, Capture, and Display menus.
! We recommend that you not make any changes to default profiles.Instead, create a new profile for every new filter you set up.
! Keep your filters in order. Create a naming convention for your filtersbased on each filter’s purpose.
Expert-Level Filtering
! Filtering from one node to another is an important method to masterwhen it comes to solving user’s network problems.
! Depending on the particular network protocol used by the applicationthat is experiencing network-related problems, a corresponding filtershould be used.
! Filtering based on MAC address can be very helpful if the devices onyour network are running multiple Layer 3 protocols and it is hard tofind out which of these protocols is causing a problem.
! Filtering based on Layer 3 protocol addresses (IP or IPX) should be usedif you are troubleshooting a distributed application.
www.syngress.com
219_sniffer_08.qxd 6/28/02 11:58 AM Page 440
Using Filters • Chapter 8 441
Troubleshooting with Filters
! Before going into troubleshooting with sophisticated filters, try the fiveeasy general troubleshooting steps described in this chapter.
! Familiarize yourself with the topology, data flow, and protocols used byyour client.
! Define an appropriate filter and start capturing data.
Q: I defined a monitor filter that permits only IP broadcast packets to find outwho are the top broadcast speakers on my network. For some reason I see alot of IP packets with IP source address 0.0.0.0.Who can probably originatethese packets?
A: Most likely the packets you see are DHCP requests. DHCP clients that arebroadcasting DHCP discovery packets are using a 0.0.0.0 source address.Youcan define a new filter that will capture only DHCP Discover, DHCP Offer,DHCP Request, and DHCP ACK packets to make sure the DHCP process isfunctioning correctly.
Q: My friend has mentioned some “backdoor” programs that allow hackers totake control of my servers. How can I find out if my network is infected?
A: Unfortunately, there is no simple way to make sure that you have a securitybreach in your network.You can develop a filter that will capture incomingconnections from the Internet to the following TCP ports on your network:31337, 31335, 27444, 27665, 20034, 9704, 5999, 6063, 5900–5910, 5432,2049, 1433, 137–139. Many of the “backdoor” programs use these ports tolisten to incoming connections.
www.syngress.com
Frequently Asked Questions
The following Frequently Asked Questions, answered by the authors of this book,are designed to both measure your understanding of the concepts presented in this chapter and to assist you with real-life implementation of these concepts. Tohave your questions about this chapter answered by the author, browse towww.syngress.com/solutions and click on the “Ask the Author” form.
219_sniffer_08.qxd 6/28/02 11:58 AM Page 441
442 Chapter 8 • Using Filters
Q: I see some abnormally high traffic entering my network from the Internet,and I suspect that this is some sort of attack. How can I find out what isgoing on?
A: First, it is always a good idea to start any troubleshooting action by capturingall traffic on your network without any filters applied.This practice will giveyou an overall picture of the traffic flow. If an attack is originated from asingle IP address, you can then block it on your router or firewall.Your nextstep will be to set up a filter that will separate the data based on SYN bit inthe TCP header set to 1.This process will allow you to capture all TCP con-nection attempts to your network.
Q: The security policy of the company I work for does not allow FTP serverson employee desktops.We’ve implemented a firewall rule that does notpermit outside connections to port 21, but it seems that some of theemployees manage to connect to their desktops through FTP from theInternet. How can this happen?
A: Most FTP servers nowadays allow changing the default FTP port (21) theyshould be listening on to some other port number. In this case, your firewallrules won’t help much.What you can do is to create a data pattern filter thatwill capture different FTP-specific commands, such as PASS, RETR, andNLST.
Q: My client is experiencing some problems with the IP OSPF routing protocolon his network. He is complaining that some of the routes are not gettinginstalled into the IP routing table on his Cisco routers, although they can beseen in the OSPF database. I’ve defined an OSPF filter and captured allOSPF packets that traversed the network in a one-hour period. I see a lot ofOSPF hello packets, but I cannot find any routing entries in these packets.When another client was experiencing a similar issue with RIP, I capturedRIP traffic and could see routing entries in the RIP packets.What is differentabout OSPF? How can I help my client resolve the issue?
A: RIP and OSPF are very different protocols. RIP belongs to a group of dis-tance-vector protocols and sends periodic updates that contain informationabout all routes RIP is aware of. OSPF is a link-state protocol, which meansthat OSPF routers build adjacencies with directly connected OSPF-enabledneighbors.These neighbors synchronize link-state databases that contain
www.syngress.com
219_sniffer_08.qxd 6/28/02 11:58 AM Page 442
Using Filters • Chapter 8 443
information about all routes on the network at the time the adjacencies arebuilt.After routers have exchanged information about all the routes, they startto exchange hello packets only.These hello packets serve as keepalives but donot contain information about the actual routes on the network.Therefore,although Sniffer Pro can be a very useful tool for troubleshooting adjacency-related problems, it is not very useful in troubleshooting the problem yourcustomer is experiencing.You can refer your client to the following link,which explains reasons that some of the routes can be visible in the OSPFdatabase but not be installed in the routing table: www.cisco.com/warp/public/104/26.html.
Q: I’ve got a request from my customer to capture all Bridge Protocol Data Unit(BPDU) packets on a specific Ethernet segment. Of course, my first step wasto define a new filter that will permit BPDUs only. In the Define Filterwindow, I switched to the Advanced tab, but could not find BPDU in thelist of available protocols. How do I define the filter?
A. BPDU packets are sent to the specific multicast address 01:80:C2:00:00:00,therefore you can define a BPDU filter using this address as the destinationhardware address. In the Define Filter window, switch to Advanced. In theKnown Addresses list, open Broadcast/Multicast Address, choose BridgeGroup (0180C2000000), and drop it into the Station 2 column. Put Any inthe Station 1 column.
www.syngress.com
219_sniffer_08.qxd 6/28/02 11:58 AM Page 443

219_sniffer_08.qxd 6/28/02 11:58 AM Page 444

Understanding and Using Triggersand Alarms
Solutions in this chapter:
■ Introducing Triggers
■ Configuring and Using Triggers
■ Configuring and Using Alarms
■ Configuring Alarm Notifications
■ Modifying Alarm Threshold Levels
■ Application Response Time
Chapter 9
445
! Summary
! Solutions Fast Track
! Frequently Asked Questions
219_sniffer_09.qxd 6/28/02 12:00 PM Page 445

446 Chapter 9 • Understanding and Using Triggers and Alarms
IntroductionNetwork usage patterns change over time as personnel roles and responsibilitieschange and as new applications are introduced; so too should the network sup-porting them. Networks are constantly being put to the test with the latest appli-cations.As the demands and level of complexity grow, so does the possibility ofan unexpected network failure. Seemingly benign events are often symptoms ofmore ominous problems lurking just below the surface. Only by proactivelymonitoring the network resources can these possible issues be mitigated in timeto make the difference between a minimal service outage used to tweak a net-work segment or component and a full-out crisis during peak network usage.
In the previous chapters you have learned how to:
■ Monitor network utilization
■ Generate real-time logs and reports on specified activities or stations,such as utilization and error statistics
■ Capture network traffic for later analysis
■ Review the analysis generated by the Sniffer Pro Expert
■ Generate traffic to simulate network conditions
www.syngress.com
Preparing for Network IssuesNetwork issues occur on even the best-managed networks. It is criticalthat before you begin to analyze any specific network issue, you have aclear understanding of the environment you will be working in. Here isa short list of the basic information you should have available.
■ An established baseline Before you can troubleshoot a net-work, you should have a good understanding of how it nor-mally operates under usual everyday conditions. How can youknow something is not operating properly if you’ve neverseen it operate any other way? One of the first steps in get-ting acquainted with Sniffer Pro should be using it to base-line the network’s performance and operations at varioustimes of the day. This baseline will provide you a good basisfor reviewing data you collect during your investigations.
Configuring & Implementing…
Continued
219_sniffer_09.qxd 6/28/02 12:00 PM Page 446
www.syngress.com
In this chapter, we examine how to combine these activities with filters todefine triggers. Triggers allow us to automate Sniffer Pro operations to look forand monitor network events, even when the program is not being operated bypersonnel. In addition, we take a close look at how triggers can be used to raisean alert when potential network errors are manifested or when Sniffer Pro iden-tifies a trend that is alarmed. By proactively monitoring the network day in andday out for specific conditions, we can resolve potential issues well before theybecome critical.
Understanding and Using Triggers and Alarms • Chapter 9 447
■ Current physical and network topology Having a roadmap to your network will help you identify where bottleneckscould exist and the location from which you might be able tocollect the best data to help you troubleshoot or monitoryour network.
■ List of network protocols in use Knowing which protocolsare in use will help you identify the components that are rel-evant to the network issue being addressed. The list shouldalso identify whether the protocols are routable or bridge-able. Having this information will help you troubleshoot andcreate filters, triggers, and alarms that are tailored for yourenvironment. Should you be looking at AppleTalk if there areno Apple computers on the network? Are there restrictedprotocols that should not cross over DMZ boundaries?
■ Router, switch, and bridge configurations Configurationfiles can help simplify the resolution of application communi-cation issues. This resolution can help identify that a routethat is supposed to be open isn’t operating properly, that aVLAN is not assigned to a network link, or that a segment isnot bridged.
■ Contact information A list of IT equipment with the con-tact information for its owners and support groups can helpresolve issues more quickly. For example, if you identify that afaulty NIC on a server is causing issues over the network, youwill want to get in contact with the server’s owners so theycan shut it down and replace the faulty unit.
219_sniffer_09.qxd 6/28/02 12:00 PM Page 447

448 Chapter 9 • Understanding and Using Triggers and Alarms
Introducing TriggersTriggers are used to configure special conditions within Sniffer Pro to initializean automated capture sequence.Automated captures are generally used whenSniffer Pro is to be operated in unattended mode, as in the case of network mon-itoring outside work hours.There are two types of triggers: start and stop. Starttriggers are used to initiate an automated capture sequence. Stop triggers are used toend an automated capture sequence.
NOTE
A distinction exists between monitoring and triggered captures. Monitorsessions contain the statistical information and measurements of a cap-ture session. A capture session contains a copy of the actual data packetsthat were collected for further analysis.
It is important to note that only one trigger can be active at any one time.Thatis, a new triggered capture cannot be initiated until the currently active trigger isstopped.To illustrate this point, imagine that Sniffer Pro identifies a triggered eventand begins an automated capture. If additional events are also identified, these willbe stored within the logs until the currently active trigger is stopped by administra-tive intervention or as a result of a stop trigger.As such, it could be useful to defineboth start and stop triggers so that when a trigger is initiated based on an event, itstops logging information after that event has terminated.
NOTE
When setting up automated captures, it is important to consider the net-work traffic loads and Sniffer Pro resource allocations. If a specific eventis what you are after, define a filter that will isolate the specific types ofpackets related to that event. Triggering on this filter will help keep diskstorage of data packets to a minimum. Opting to not use filters mayresult in capturing gigabytes of information that is unrelated and thatmust be parsed before data analysis can take place.
www.syngress.com
219_sniffer_09.qxd 6/28/02 12:00 PM Page 448
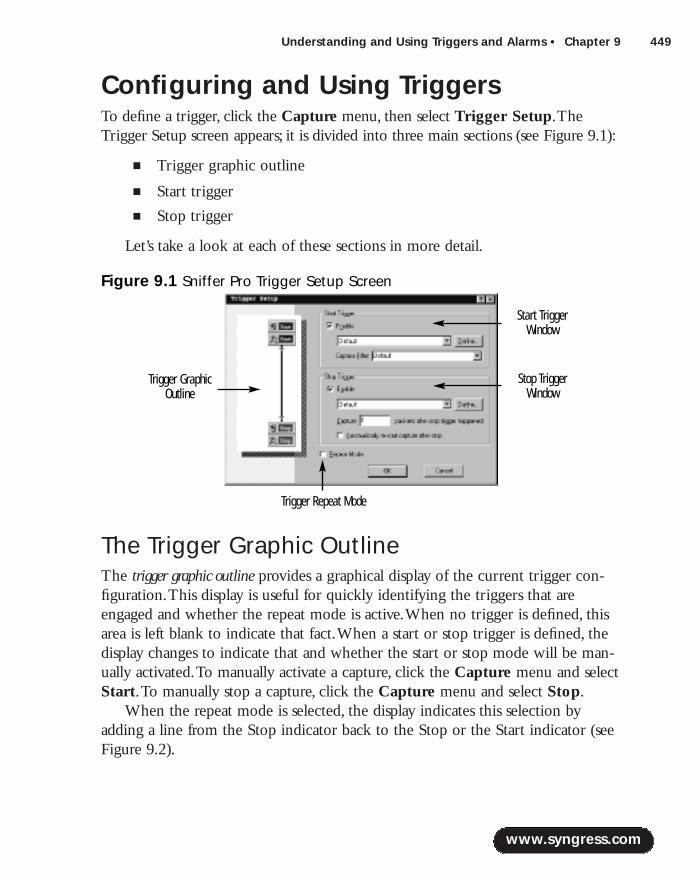
Understanding and Using Triggers and Alarms • Chapter 9 449
Configuring and Using TriggersTo define a trigger, click the Capture menu, then select Trigger Setup.TheTrigger Setup screen appears; it is divided into three main sections (see Figure 9.1):
■ Trigger graphic outline
■ Start trigger
■ Stop trigger
Let’s take a look at each of these sections in more detail.
The Trigger Graphic OutlineThe trigger graphic outline provides a graphical display of the current trigger con-figuration.This display is useful for quickly identifying the triggers that areengaged and whether the repeat mode is active.When no trigger is defined, thisarea is left blank to indicate that fact.When a start or stop trigger is defined, thedisplay changes to indicate that and whether the start or stop mode will be man-ually activated.To manually activate a capture, click the Capture menu and selectStart.To manually stop a capture, click the Capture menu and select Stop.
When the repeat mode is selected, the display indicates this selection byadding a line from the Stop indicator back to the Stop or the Start indicator (seeFigure 9.2).
www.syngress.com
Figure 9.1 Sniffer Pro Trigger Setup Screen
Trigger GraphicOutline
Trigger Repeat Mode
Stop TriggerWindow
Start TriggerWindow
219_sniffer_09.qxd 6/28/02 12:00 PM Page 449
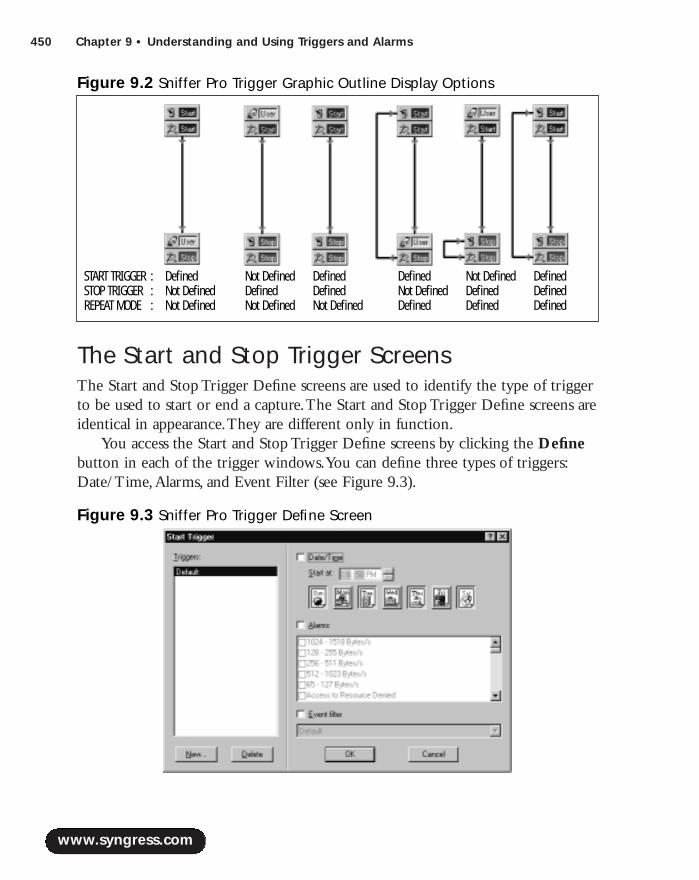
450 Chapter 9 • Understanding and Using Triggers and Alarms
The Start and Stop Trigger ScreensThe Start and Stop Trigger Define screens are used to identify the type of triggerto be used to start or end a capture.The Start and Stop Trigger Define screens areidentical in appearance.They are different only in function.
You access the Start and Stop Trigger Define screens by clicking the Definebutton in each of the trigger windows.You can define three types of triggers:Date/Time,Alarms, and Event Filter (see Figure 9.3).
www.syngress.com
Figure 9.2 Sniffer Pro Trigger Graphic Outline Display Options
START TRIGGER : Defined Not Defined Defined Defined Not Defined DefinedSTOP TRIGGER : Not Defined Defined Defined Not Defined Defined DefinedREPEAT MODE : Not Defined Not Defined Not Defined Defined Defined Defined
Figure 9.3 Sniffer Pro Trigger Define Screen
219_sniffer_09.qxd 6/28/02 12:00 PM Page 450
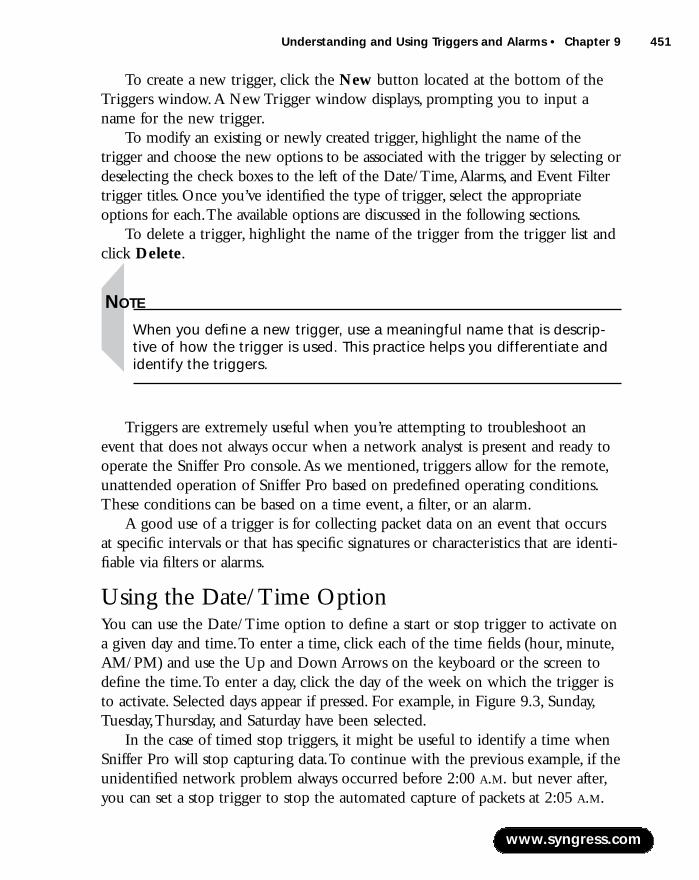
Understanding and Using Triggers and Alarms • Chapter 9 451
To create a new trigger, click the New button located at the bottom of theTriggers window.A New Trigger window displays, prompting you to input aname for the new trigger.
To modify an existing or newly created trigger, highlight the name of thetrigger and choose the new options to be associated with the trigger by selecting ordeselecting the check boxes to the left of the Date/Time,Alarms, and Event Filtertrigger titles. Once you’ve identified the type of trigger, select the appropriateoptions for each.The available options are discussed in the following sections.
To delete a trigger, highlight the name of the trigger from the trigger list andclick Delete.
NOTE
When you define a new trigger, use a meaningful name that is descrip-tive of how the trigger is used. This practice helps you differentiate andidentify the triggers.
Triggers are extremely useful when you’re attempting to troubleshoot anevent that does not always occur when a network analyst is present and ready tooperate the Sniffer Pro console.As we mentioned, triggers allow for the remote,unattended operation of Sniffer Pro based on predefined operating conditions.These conditions can be based on a time event, a filter, or an alarm.
A good use of a trigger is for collecting packet data on an event that occursat specific intervals or that has specific signatures or characteristics that are identi-fiable via filters or alarms.
Using the Date/Time OptionYou can use the Date/Time option to define a start or stop trigger to activate ona given day and time.To enter a time, click each of the time fields (hour, minute,AM/PM) and use the Up and Down Arrows on the keyboard or the screen todefine the time.To enter a day, click the day of the week on which the trigger isto activate. Selected days appear if pressed. For example, in Figure 9.3, Sunday,Tuesday,Thursday, and Saturday have been selected.
In the case of timed stop triggers, it might be useful to identify a time whenSniffer Pro will stop capturing data.To continue with the previous example, if theunidentified network problem always occurred before 2:00 A.M. but never after,you can set a stop trigger to stop the automated capture of packets at 2:05 A.M.
www.syngress.com
219_sniffer_09.qxd 6/28/02 12:00 PM Page 451
452 Chapter 9 • Understanding and Using Triggers and Alarms
This solution helps minimize the amount of captured data that needs to bereviewed to identify the issue.
NOTE
A good use of a start trigger is to collect network data resulting from anunidentified network problem that has been known to occur on certaindays at certain times. In this example, you’d configure a trigger so thatSniffer Pro will begin capturing packets a few minutes before the antici-pated time window during which the network problem typically occurs.In this way, Sniffer Pro can be running and left unattended, freeingresources to work on other issues. On the return of network monitoringstaff, the captured data can be analyzed and used to determine the rootcause of the network problem.
Using the Alarm OptionYou can use the Alarm option to define an alarm-based trigger.These triggers areused to start or stop a capture based on a given alarm. If we again use ourexample of the unidentified network problem, we might, based on the informa-tion we know, be able to glean basic information regarding some of the symp-toms that typically lead to problems. In this case, it would be possible to use oneof the existing alarm filters or an alarm filter devised specifically to pick outsome of the symptoms, to initiate or terminate a triggered capture.We discuss thedetails of how to configure alarms later in this chapter, in the “Configuring andUsing Alarms” section.
A good example of using alarm triggers in troubleshooting activities involvesidentifying the cause behind a network segment being reported as sluggish atrandom times and on random days. In this scenario, Sniffer Pro was used to raisea triggered alarm capture when error statistics increased dramatically.This allowedthe troubleshooting personnel of the large company to identify that the source ofthe error was an Ethernet interface on a laptop docking station used by visitorsattending meetings at the corporate head office.Typical LAN connection sessionsoriginating from this station tended to last less than an hour. Because this wasone of several stations identified for use by visitors, it was not always active.Thedefective docking station was replaced, and the network segment returned tonormal operations.
www.syngress.com
219_sniffer_09.qxd 6/28/02 12:00 PM Page 452
Understanding and Using Triggers and Alarms • Chapter 9 453
Using the Event FilterEvent filters are used to activate a trigger based on a predefined filter. Filters canbe defined to pick out specific network events, including transmissions to andfrom specific hosts, specific data patterns, and selected protocols. Chapter 8,“Using Filters,” discusses in detail how to define and use filters. Refer to thatchapter for additional information on configuring individual filters.
To activate an Event Filter trigger, select the Event filter check box and usethe pull-down menu to list the available filters. Highlight and click the filter thatis to be used.
NOTE
Filter-based triggers are very useful for monitoring a network for specificevents, hosts, or network conditions. That is, Sniffer Pro can monitor thenetwork unattended and trigger a capture sequence when it sees anevent that matches a filter. If we return to our network problemexample, once you homed in on some of the symptoms and possiblecauses for the problem, you could establish a filter specifically to beginand end a capture whenever the symptoms would be manifested. Thiswould again help to minimize the amount of data that needs to be ana-lyzed in order to thoroughly understand the circumstances causing thenetwork issue.
One example of using an event filter is to identify the cause of poorthroughput between hosts located at one location and servers located at anotherend of meshed WAN segments. In this case, we suspected one of the new WANlinks to the remote sites was faulty, but we did not have access to the routers.Thenetwork operations center had performed a quick check but was not reportingany issues.We used Sniffer Pro to trigger a capture based on a filter defined toisolate routing updates. Subsequent analysis identified that one of the links wasflapping—that is, cycling up and down every couple of seconds.This activity wascausing the network routing tables to update and alternate routes between bothWAN links at the remote office. In turn, we also identified that network manage-ment on the new router was not properly configured.This was the reason thenetwork operations center did not report any issues.
www.syngress.com
219_sniffer_09.qxd 6/28/02 12:00 PM Page 453
454 Chapter 9 • Understanding and Using Triggers and Alarms
Trigger Repeat ModeTrigger repeat mode should be selected to automatically reuse a trigger after atriggered capture has been completed.This tool is effective in monitoring anevent based on a specified time, filter, or alarm that occurs more than one timeover the automated-monitoring time period.
This practice is very useful as a means of capturing multiple occurrences ofan event, thereby simplifying the identification of an event pattern and its relatedcause.When activated, repeat mode reinitiates a capture every time the specifiedevent takes place—that is, at the end of the capture period, the trigger is reset andwaits to be activated again.
For example, if an event always occurs at 3 A.M. on Tuesdays and Thursdays,triggering Sniffer Pro to capture this event over the course of a week or severalweeks can help provide the data required to pinpoint the problem and resolve the issue.
www.syngress.com
Distributed Sniffer SystemThe Distributed Sniffer System is a network management utility that canbe used for monitoring, capturing, and analyzing networking informa-tion over an entire network using multiple hardware and softwareSniffer components. Distributed Sniffer provides the same expert anal-ysis as is provided within Sniffer Pro.
A Distributed Sniffer system consists of Distributed Sniffer Servers(DSS) that are controlled by SniffMaster Consoles (clients). A SniffMasterConsole aggregates the real-time data captured by the remotely locatedDSS and analyzes the data for trend, alarm, and filter signatures. DSScapture network information using monitoring and expert analysis.
The Distributed Sniffer utility provides the communicationsbetween SniffMaster Consoles and DSS using in-band (over a LAN con-nection) and out-of-band (over an external serial link such as a modem).TCP transport is provided over Ethernet, ring LANs and SLIP connectionsover asynchronous modem connections. Up to four simultaneous LANconnections, or three LAN connections and one serial modem connec-tion, can be active at any one time.
Designing & Planning…
219_sniffer_09.qxd 6/28/02 12:00 PM Page 454

Understanding and Using Triggers and Alarms • Chapter 9 455
Configuring and Using Alarms Alarms are used to identify that an event threshold or network condition hasoccurred during a capture sequence.The alarm monitor is always active during acapture sequence and does not need special configuration to begin monitoringevents.You can define and tailor alarms to trigger based on the specific require-ments of a network.They can also be defined to initiate an action such as anaudible alert, an e-mail, or a pager call, among others.We cover these functions ingreater detail in the “Configuring Alarm Notifications” section.
www.syngress.com
Sniffer Pro Network Problem-Solving Model with Triggers and AlarmsBefore tackling any network issue, it is best to devise a plan of action.Although at first it might appear that you’re wasting valuable time,arming yourself with the right information can help you resolve prob-lems more quickly and effectively.
There are many good methodologies for addressing network issues.The following steps constitute one example that could help get you getthe most out of Sniffer Pro:
1. Define the problem This step is critical in helping you orga-nize the issues into visible symptoms and likely causes. If youare told that a database is not responding to client requestsin a timely manner, you might begin to suspect a networkissue, a client issue, or NIC. Is this a regular occurrence orsomething that happens at different intervals?
2. Gather information Once you have defined the problem,you want to know how many hosts are affected, their loca-tion, if there are any similarities between them (the same NICcard, for example), whether there have been any updates tothe network (router updates) or to the clients (new desktoprelease, firmware upgrade), and so on.
3. Reassess the problem Based on the information you col-lected in the second step, you want to verify that your initialassumptions regarding the problem still make sense. Does
Designing & Planning…
Continued
219_sniffer_09.qxd 6/28/02 12:00 PM Page 455
456 Chapter 9 • Understanding and Using Triggers and Alarms
Alarm Log DisplayThe Alarm log displays the Monitor and Expert alarms that have been received andthat have been stored within the Alarm Manager.To bring up the Alarm log display,
www.syngress.com
the data you collected support any one or more of the causesyou suspect are the root of the symptoms?
4. Establish a game plan By this time, you should have a goodunderstanding of the symptoms and some of the possibleleading causes. It is time now to devise a game plan. How doyou intend to investigate this issue? Will you leave Sniffer Proto collect data over a given period or can you isolate theobservations? Do you want to create a trigger that initiateswhen a given signature appears over the network? Where willyou begin monitoring the network—at the client end or at thedatabase? If you are investigating a security-related matter, doyou need signoff from management before proceeding? Doyou need to obtain approval from the authorities?
5. Set your plan in motion You are ready to begin your inves-tigation. This is when you configure Sniffer Pro to look forthe symptoms and causes and collect network traffic. Keepdetailed notes regarding what you are doing and where. Asyou save your log files and error reports, use a naming con-vention that will make it simple to recall the source of thedata when you or your peers perform your investigation.
6. Implement solutions and observe results Your investiga-tion is well in progress. You will likely be able to identify thecause(s) of the symptoms and should be able to provide sug-gestions for resolving the issue. As these resolutions arebeing implemented, you should continue to monitor the net-work and verify that the changes being implemented areactually resolving the problem.
If things are getting better, you know you’ve well on your way toresolving the problem. You should still monitor the network for a littlewhile to ensure that no other issues come up as a result of the changes.
If the problem persists, your work is not finished. It is time to returnto the first step and reassess your assumptions regarding the issues. Inaddition, refer to Chapter 1, where we discussed basic troubleshootingsteps and methodologies.
219_sniffer_09.qxd 6/28/02 12:00 PM Page 456
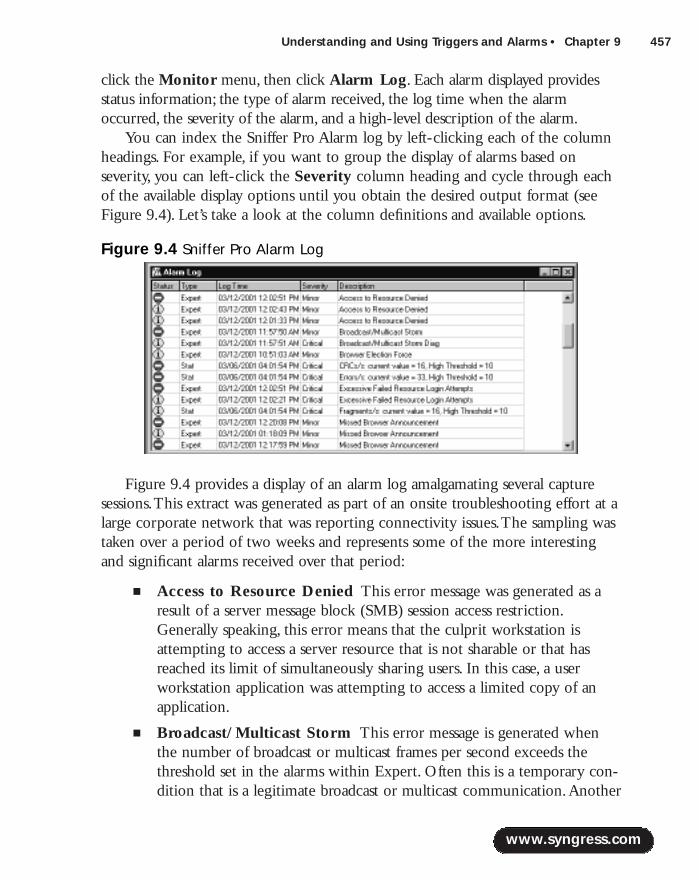
Understanding and Using Triggers and Alarms • Chapter 9 457
click the Monitor menu, then click Alarm Log. Each alarm displayed providesstatus information; the type of alarm received, the log time when the alarmoccurred, the severity of the alarm, and a high-level description of the alarm.
You can index the Sniffer Pro Alarm log by left-clicking each of the columnheadings. For example, if you want to group the display of alarms based onseverity, you can left-click the Severity column heading and cycle through eachof the available display options until you obtain the desired output format (seeFigure 9.4). Let’s take a look at the column definitions and available options.
Figure 9.4 provides a display of an alarm log amalgamating several capturesessions.This extract was generated as part of an onsite troubleshooting effort at alarge corporate network that was reporting connectivity issues.The sampling wastaken over a period of two weeks and represents some of the more interestingand significant alarms received over that period:
■ Access to Resource Denied This error message was generated as aresult of a server message block (SMB) session access restriction.Generally speaking, this error means that the culprit workstation isattempting to access a server resource that is not sharable or that hasreached its limit of simultaneously sharing users. In this case, a userworkstation application was attempting to access a limited copy of anapplication.
■ Broadcast/Multicast Storm This error message is generated whenthe number of broadcast or multicast frames per second exceeds thethreshold set in the alarms within Expert. Often this is a temporary con-dition that is a legitimate broadcast or multicast communication.Another
www.syngress.com
Figure 9.4 Sniffer Pro Alarm Log
219_sniffer_09.qxd 6/28/02 12:00 PM Page 457
458 Chapter 9 • Understanding and Using Triggers and Alarms
cause could be that a workstation is not maintaining an appropriate hosttable and is thereby sending repeated rwho packets. If broadcast andmulticast storms are frequent on the network, they should be investi-gated and their sources should be identified.
■ Broadcast/Multicast Storm Diag Similar to the Broadcast/Multicast Storm, this message indicates that a severe broadcast storm,as indicated by the alarm thresholds, has occurred.
■ Browser Election Force Browser force election requests occur whena node has not identified a local master browser and is attempting tobecome the local master browser.This situation occurs occasionallywithin Microsoft-based networks. If it continues to occur, verify theoffending workstation’s networking configuration to ensure the networkparameters are properly defined.
■ CRCs/s:current value=16, High Threshold=10 This error messageindicates a high rate of CRCs or frame check sequence errors occurringover the segment.There are several possible reasons for this situation,including faulty network card or driver, faulty network cabling, faultyhub or switch port, or noise induced over the cabling.
■ Errors/s:current value=33, High Threshold=10 This error messageindicates a high rate of errors is occurring over the segment and that ithas exceeded the alarm threshold.
■ Excessive Failed Resource Login Attempts This error messageoccurs when consecutive failed login attempts resulting from an incorrectpassword or username exceed the threshold defined for this error. Causesinclude users attempting to log into a resource and not rememberingtheir passwords or a malicious user attempting to guess a password.
■ Missed Browser Announcement Microsoft client workstations areexpected to send a browser announcement frame at regular intervals tothe Master Browser to indicate that they are still active on the networkand the types of resources at the system.When this interval has beenmissed more times than the alarm threshold permits, an alarm conditionis raised.The two main reasons that a missed browser announcement isreceived are that the workstation has been shut down or that the net-work is very active and frames are being lost.
www.syngress.com
219_sniffer_09.qxd 6/28/02 12:00 PM Page 458
Understanding and Using Triggers and Alarms • Chapter 9 459
The Status ColumnThe Status column identifies whether an alarm is new or has been acknowledged.Acknowledged alarms are indicated by the i icon. Unacknowledged alarms areindicated with the red dash (–) icon.You can acknowledge alarms one at a timeby selecting the alarm and then right-clicking the window.A popup window isthen displayed, offering five distinct options:
■ Acknowledge The Acknowledge option is used to acknowledge asingle alarm condition.This is useful in identifying alarms that have beeninvestigated and dealt with.
■ Acknowledge All The Acknowledge All option is used to acknowl-edge all the alarms listed in the Alarm log.This is useful for clearingmany alarms at once. It can also be used to provide an additional refer-ence when a new capture is about to begin and you want a distinctionbetween exiting alarms and new alarms.Take care to verify that all pre-vious alarms have actually been dealt with appropriately before youacknowledge all alarms.
■ Remove The Remove option is used to remove a single alarm fromthe Alarm log.This option is used when an alarm has been investigatedand is no longer active or required to be maintained in the AlarmMonitor logs.
■ Remove All The Remove All option is used to remove all alarms thatare listed in the Alarm log at once.This option is useful when a newcapture is about to begin and a clear alarm log is required for the newalarms.Take care to verify that all previous alarms have actually beendealt with appropriately before you remove all alarms.
■ Export The Export option is used to export the Alarm log to a localdisk or folder.The exported Alarm log can be saved in comma-delimited(CSV), tab-delimited (text), or space-delimited (formatted text) form.You can further analyze the exported log using a spreadsheet programsuch as Microsoft Excel.
The Alarm Type ColumnThe Alarm Type column indicates the type of node or the originator of thealarm as defined within the address book.These types can include servers,
www.syngress.com
219_sniffer_09.qxd 6/28/02 12:00 PM Page 459

460 Chapter 9 • Understanding and Using Triggers and Alarms
bridges, hubs, and other network devices. In Figure 9.4, the types of alarms dis-played are from Sniffer Expert and Statistics.
The Log Time ColumnThe Log Time column provides the details of an alarm. It provides the date andtime for each alarm listed.
The Severity ColumnThe Severity column provides information on the severity associated with eachalarm listed in the Alarm log. Five severity levels are used to identify the criti-cality of an alarm: Critical, Major, Minor,Warning, and Informational.The levelof severity can be defined or tailored to match the conditions of the networkbeing monitored.This option is reviewed in more detail in the sections“Modifying Alarm Threshold Levels” and “Configuring Alarm Notifications.”
The Description ColumnThe Description column provides a high-level description of each of the listedalarms.
Configuring Alarms NotificationsAs we have discussed earlier, Sniffer Pro can be configured to monitor and recordspecific events and raise an alarm condition based on thresholds. Sniffer Pro canalso be configured to trigger external—that is, non-Sniffer Pro-related—actionsbased on the severity of an alarm.You can use these notifications to alert staff andthird-party applications of a detected symptom or condition. Sniffer Pro cannotify of an alarm by sounding an audible alarm, sending an e-mail, calling abeeper, sending an alarm message to a pager, and/or starting a Visual Basic scriptto open a third-party application or send an alarm to a monitoring agent such asan SNMP console.
To define the alarm notifications associated with each severity, click theTools menu, select Options, and then select the Alarms tab (see Figure 9.5).
Notification Using a SoundSniffer Pro can be configured to sound an audible alarm when an alarm isreceived.Audible alarms can be disabled, played once, or set to repeat until thealarm has been acknowledged.To play a sound when an alarm is received, click
www.syngress.com
219_sniffer_09.qxd 6/28/02 12:00 PM Page 460

Understanding and Using Triggers and Alarms • Chapter 9 461
the pull-down menu in the Sound window and select the appropriate playoption (Disable, Once, or Repeat). Next, select the sound file to be played byeither entering the location of the .WAV file or clicking the three dots and navi-gating to the location of the .WAV file.The sound file must be a .WAV file.Sniffer Pro does not play other types of sound files.
Associating an Action with Alarm SeverityFour notification actions can be configured for each of the five alarm severitieslisted.To associate a notification action, click the appropriate action box for eachof the severities.A pull-down menu lists the available actions.You can define newactions by clicking the Define Action button. Use of the Define Action buttonis described further in an upcoming section.
To change an existing notification action to another notification action, clickthe appropriate action box for the sensitivity to be modified and select a newnotification action from the pull-down menu.
Define Severity Alarms that have been defined within Sniffer Pro can be assigned a severity level.To do so, click the Define Severity button.A popup menu is displayed, listingthe various alarms that have been defined (see Figure 9.6).To select a newseverity for a given alarm, click the Severity box associated with the alarm andselect the appropriate severity from the pull-down menu.The levels of severityavailable are Critical, Major, Minor,Warning, and Informational.
www.syngress.com
Figure 9.5 Sniffer Pro Alarm Notification Options Screen
219_sniffer_09.qxd 6/28/02 12:00 PM Page 461
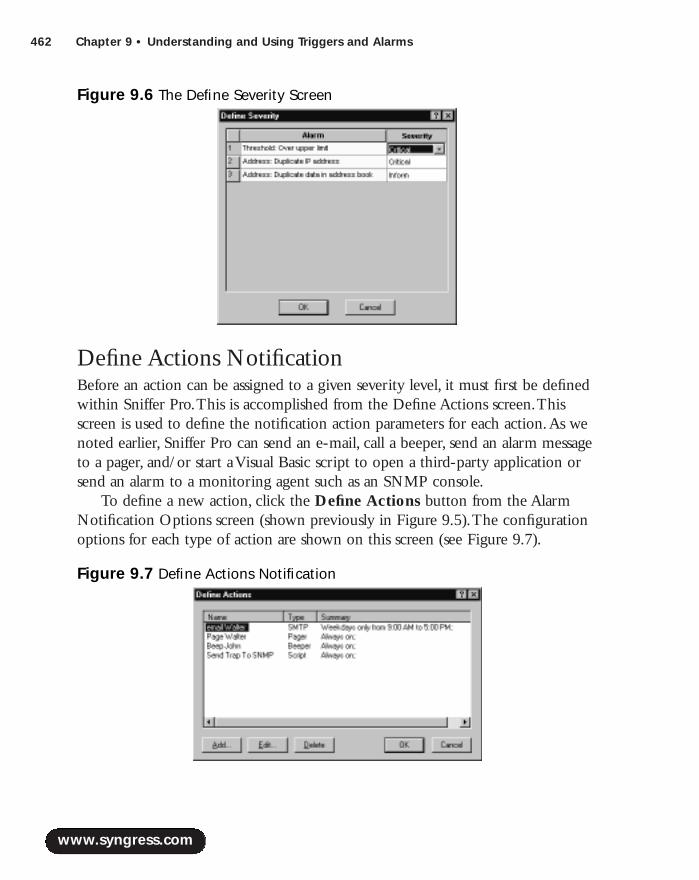
462 Chapter 9 • Understanding and Using Triggers and Alarms
Define Actions Notification Before an action can be assigned to a given severity level, it must first be definedwithin Sniffer Pro.This is accomplished from the Define Actions screen.Thisscreen is used to define the notification action parameters for each action.As wenoted earlier, Sniffer Pro can send an e-mail, call a beeper, send an alarm messageto a pager, and/or start a Visual Basic script to open a third-party application orsend an alarm to a monitoring agent such as an SNMP console.
To define a new action, click the Define Actions button from the AlarmNotification Options screen (shown previously in Figure 9.5).The configurationoptions for each type of action are shown on this screen (see Figure 9.7).
www.syngress.com
Figure 9.6 The Define Severity Screen
Figure 9.7 Define Actions Notification
219_sniffer_09.qxd 6/28/02 12:00 PM Page 462

Understanding and Using Triggers and Alarms • Chapter 9 463
Managing Alarm ActionsYou can use the Define Alarm Actions screen to add, edit, and delete existingactions. Let’s take a closer look at these options.
Adding a New Alarm Notification ActionTo add a new action that will be triggered by an alarm, click the Add button.The New Alarm Action screen is displayed (see Figure 9.8). In the Name field,enter the name to be associated with the new notification. Names should be easyto understand, such as e-mail username or page username.An obvious name sim-plifies the task of deciphering which notifications do what functions. Next, selectthe appropriate type of notification (e-mail, beeper, pager, or script) and clickOK.The configuration of each type of alarm notification action is detailed in thefollowing discussion.
An existing notification can be used as a template for the new notification.Touse an existing notification, click the pull-down menu next to the desired notifi-cation option and select the appropriate notification.The configuration screensfor the new notification are then displayed, with the fields populated with theinformation from the template notification.The fields can be modified to matchthe new notification requirements.
Using a template notification can save time and eliminate configurationerrors when creating multiple notifications with the same base settings such as e-mail server, pager, or beeper number.
www.syngress.com
Figure 9.8 The New Alarm Action Screen
219_sniffer_09.qxd 6/28/02 12:00 PM Page 463

464 Chapter 9 • Understanding and Using Triggers and Alarms
Editing an Existing Alarm Notification ActionTo edit an existing alarm notification option, select the appropriate notificationand then click the Edit button at the bottom of the Define Actions notificationscreen.The configuration screen appropriate for the type of action being modi-fied (e-mail, beeper, pager, or script) is then displayed.The configured informa-tion for that particular action is displayed and can be modified.
This option is useful when notification information has been changed, as inthe case of a new e-mail address or new pager or beeper ID number assignmentfor a given notified resource.
Deleting an Existing Alarm Notification ActionTo delete an existing alarm notification action, select the appropriate notificationand the click the Delete button at the bottom of the Define Actions notificationscreen.A confirmation prompt is displayed, asking if you are sure you want todelete the notification.
Defining an SMTP Mail NotificationTo define an SMTP mail notification, click the SMTP mail radio button andclick OK.The Mail Information screen is then displayed (see Figure 9.9).Thedisplay provides input fields for the SMTP server address and the SMTP port tobe used along with user information details such as the username and user e-mailaddress.To continue configuring the mail options, click Next.
www.syngress.com
Figure 9.9 Mail Information Display
219_sniffer_09.qxd 6/28/02 12:00 PM Page 464
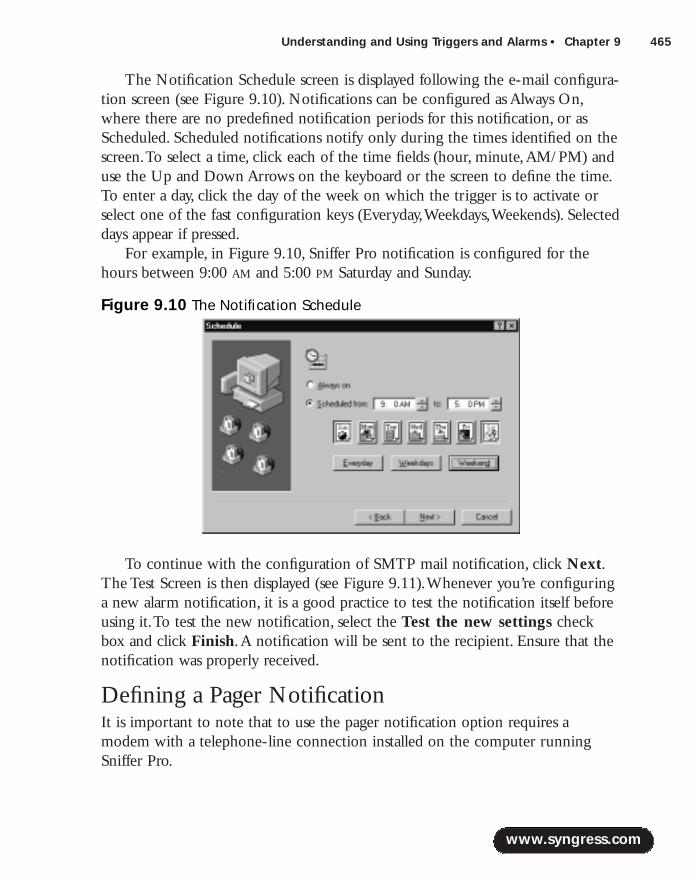
Understanding and Using Triggers and Alarms • Chapter 9 465
The Notification Schedule screen is displayed following the e-mail configura-tion screen (see Figure 9.10). Notifications can be configured as Always On,where there are no predefined notification periods for this notification, or asScheduled. Scheduled notifications notify only during the times identified on thescreen.To select a time, click each of the time fields (hour, minute,AM/PM) anduse the Up and Down Arrows on the keyboard or the screen to define the time.To enter a day, click the day of the week on which the trigger is to activate orselect one of the fast configuration keys (Everyday,Weekdays,Weekends). Selecteddays appear if pressed.
For example, in Figure 9.10, Sniffer Pro notification is configured for thehours between 9:00 AM and 5:00 PM Saturday and Sunday.
To continue with the configuration of SMTP mail notification, click Next.The Test Screen is then displayed (see Figure 9.11).Whenever you’re configuringa new alarm notification, it is a good practice to test the notification itself beforeusing it.To test the new notification, select the Test the new settings checkbox and click Finish.A notification will be sent to the recipient. Ensure that thenotification was properly received.
Defining a Pager NotificationIt is important to note that to use the pager notification option requires amodem with a telephone-line connection installed on the computer runningSniffer Pro.
www.syngress.com
Figure 9.10 The Notification Schedule
219_sniffer_09.qxd 6/28/02 12:00 PM Page 465
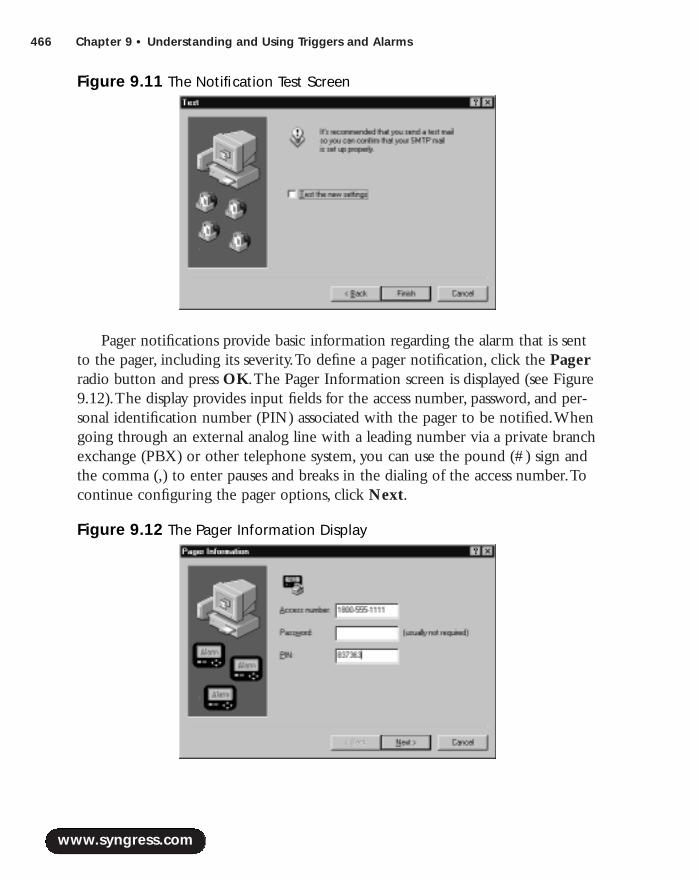
466 Chapter 9 • Understanding and Using Triggers and Alarms
Pager notifications provide basic information regarding the alarm that is sentto the pager, including its severity.To define a pager notification, click the Pagerradio button and press OK.The Pager Information screen is displayed (see Figure9.12).The display provides input fields for the access number, password, and per-sonal identification number (PIN) associated with the pager to be notified.Whengoing through an external analog line with a leading number via a private branchexchange (PBX) or other telephone system, you can use the pound (#) sign andthe comma (,) to enter pauses and breaks in the dialing of the access number.Tocontinue configuring the pager options, click Next.
www.syngress.com
Figure 9.11 The Notification Test Screen
Figure 9.12 The Pager Information Display
219_sniffer_09.qxd 6/28/02 12:00 PM Page 466
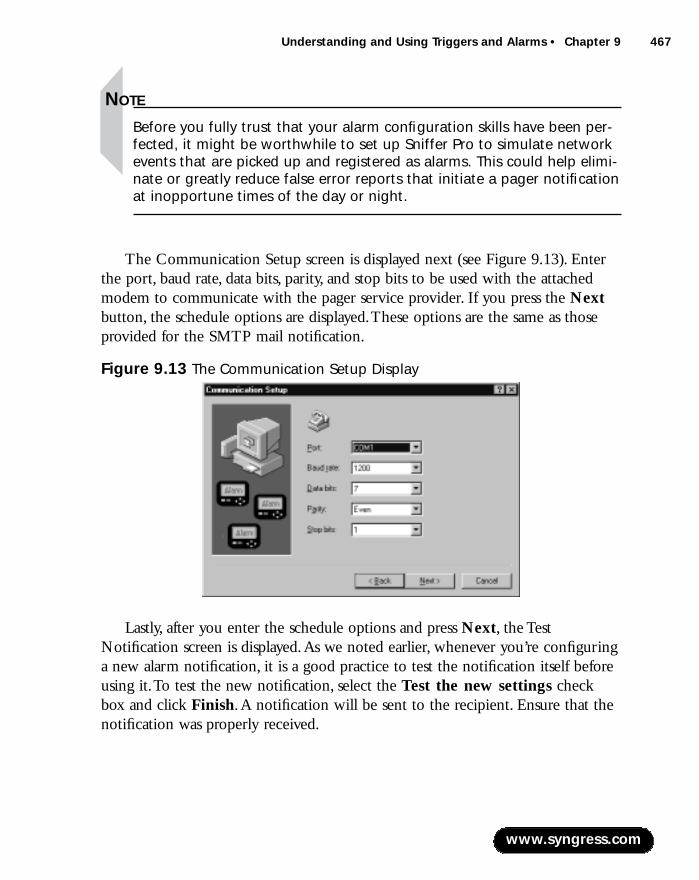
Understanding and Using Triggers and Alarms • Chapter 9 467
NOTE
Before you fully trust that your alarm configuration skills have been per-fected, it might be worthwhile to set up Sniffer Pro to simulate networkevents that are picked up and registered as alarms. This could help elimi-nate or greatly reduce false error reports that initiate a pager notificationat inopportune times of the day or night.
The Communication Setup screen is displayed next (see Figure 9.13). Enterthe port, baud rate, data bits, parity, and stop bits to be used with the attachedmodem to communicate with the pager service provider. If you press the Nextbutton, the schedule options are displayed.These options are the same as thoseprovided for the SMTP mail notification.
Lastly, after you enter the schedule options and press Next, the TestNotification screen is displayed.As we noted earlier, whenever you’re configuringa new alarm notification, it is a good practice to test the notification itself beforeusing it.To test the new notification, select the Test the new settings checkbox and click Finish.A notification will be sent to the recipient. Ensure that thenotification was properly received.
www.syngress.com
Figure 9.13 The Communication Setup Display
219_sniffer_09.qxd 6/28/02 12:00 PM Page 467

468 Chapter 9 • Understanding and Using Triggers and Alarms
NOTE
Only basic information relating to the alarm is communicated in thepager notification. To obtain the alarm details, you are required to viewthe Alarm log display.
Defining a Beeper NotificationIt is important to note that using the beeper notification option requires that amodem with a telephone-line connection is installed on the computer runningSniffer Pro.
Beepers are generally used when simple numeric messages are to be received.Beepers do not provide any details regarding the alarm notification.The onlyinformation communicated to the beeper is the numeric message defined withinthe beeper information screen.
To define a beeper notification, click the Beeper radio button and press OK.The Beeper Information screen is displayed (see Figure 9.14).The display pro-vides input fields for the access number, the delay time before sending the mes-sage, the numeric message, the end string for the message, and the wait timebefore the call is to be terminated.When you’re accessing an external analog linewith a leading number via a PBX or other telephone system, you can use thepound (#) sign and comma (,) to enter pauses and breaks in the dialing of theaccess number.To continue configuring the beeper options, click Next.
www.syngress.com
Figure 9.14 The Beeper Information Display
219_sniffer_09.qxd 6/28/02 12:00 PM Page 468
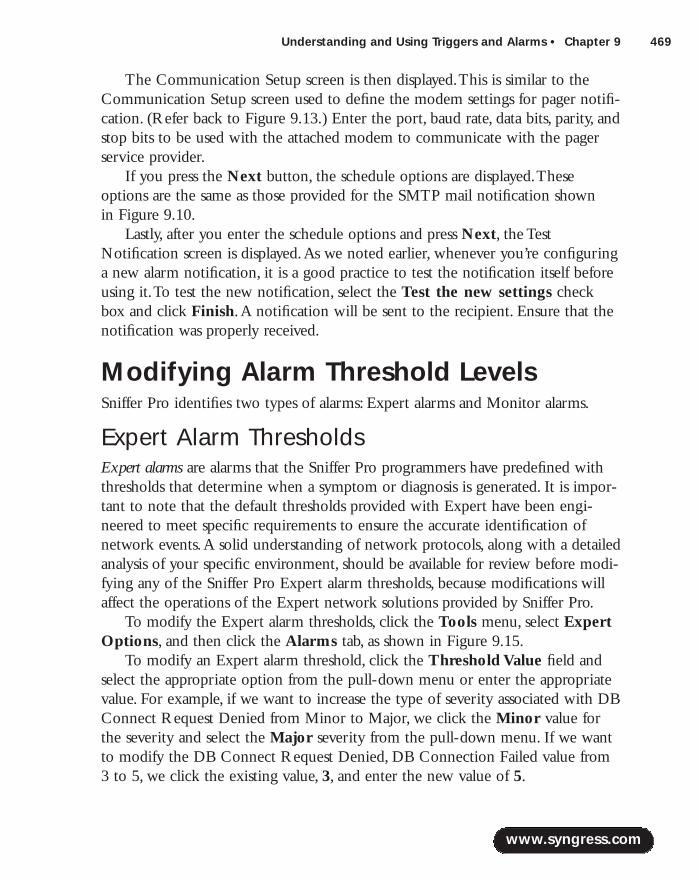
Understanding and Using Triggers and Alarms • Chapter 9 469
The Communication Setup screen is then displayed.This is similar to theCommunication Setup screen used to define the modem settings for pager notifi-cation. (Refer back to Figure 9.13.) Enter the port, baud rate, data bits, parity, andstop bits to be used with the attached modem to communicate with the pagerservice provider.
If you press the Next button, the schedule options are displayed.Theseoptions are the same as those provided for the SMTP mail notification shown in Figure 9.10.
Lastly, after you enter the schedule options and press Next, the TestNotification screen is displayed.As we noted earlier, whenever you’re configuringa new alarm notification, it is a good practice to test the notification itself beforeusing it.To test the new notification, select the Test the new settings checkbox and click Finish.A notification will be sent to the recipient. Ensure that thenotification was properly received.
Modifying Alarm Threshold LevelsSniffer Pro identifies two types of alarms: Expert alarms and Monitor alarms.
Expert Alarm ThresholdsExpert alarms are alarms that the Sniffer Pro programmers have predefined withthresholds that determine when a symptom or diagnosis is generated. It is impor-tant to note that the default thresholds provided with Expert have been engi-neered to meet specific requirements to ensure the accurate identification ofnetwork events.A solid understanding of network protocols, along with a detailedanalysis of your specific environment, should be available for review before modi-fying any of the Sniffer Pro Expert alarm thresholds, because modifications willaffect the operations of the Expert network solutions provided by Sniffer Pro.
To modify the Expert alarm thresholds, click the Tools menu, select ExpertOptions, and then click the Alarms tab, as shown in Figure 9.15.
To modify an Expert alarm threshold, click the Threshold Value field andselect the appropriate option from the pull-down menu or enter the appropriatevalue. For example, if we want to increase the type of severity associated with DBConnect Request Denied from Minor to Major, we click the Minor value forthe severity and select the Major severity from the pull-down menu. If we wantto modify the DB Connect Request Denied, DB Connection Failed value from3 to 5, we click the existing value, 3, and enter the new value of 5.
www.syngress.com
219_sniffer_09.qxd 6/28/02 12:00 PM Page 469
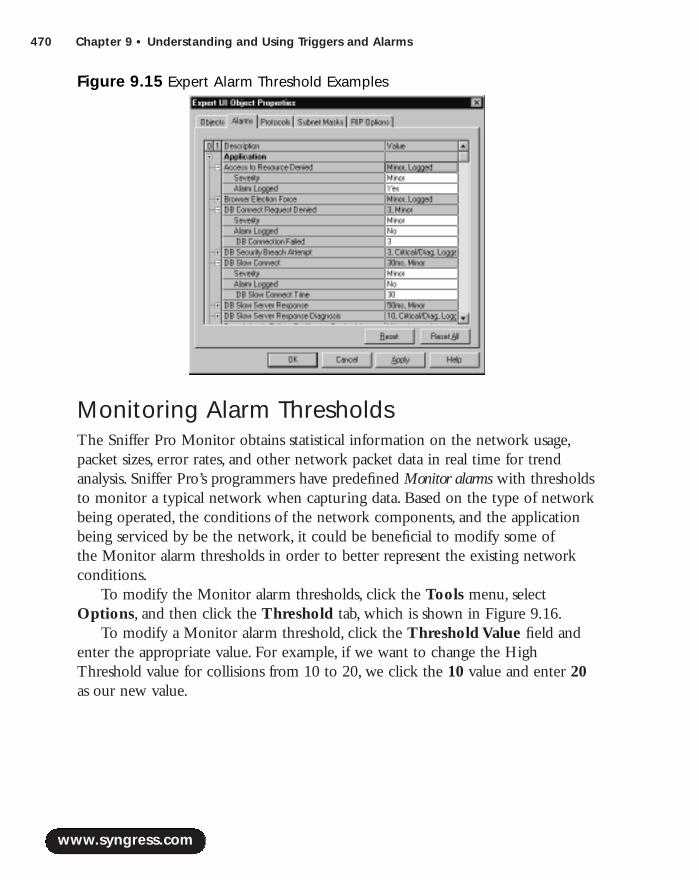
470 Chapter 9 • Understanding and Using Triggers and Alarms
Monitoring Alarm ThresholdsThe Sniffer Pro Monitor obtains statistical information on the network usage,packet sizes, error rates, and other network packet data in real time for trend analysis. Sniffer Pro’s programmers have predefined Monitor alarms with thresholdsto monitor a typical network when capturing data. Based on the type of networkbeing operated, the conditions of the network components, and the applicationbeing serviced by be the network, it could be beneficial to modify some of the Monitor alarm thresholds in order to better represent the existing networkconditions.
To modify the Monitor alarm thresholds, click the Tools menu, selectOptions, and then click the Threshold tab, which is shown in Figure 9.16.
To modify a Monitor alarm threshold, click the Threshold Value field andenter the appropriate value. For example, if we want to change the HighThreshold value for collisions from 10 to 20, we click the 10 value and enter 20as our new value.
www.syngress.com
Figure 9.15 Expert Alarm Threshold Examples
219_sniffer_09.qxd 6/28/02 12:00 PM Page 470
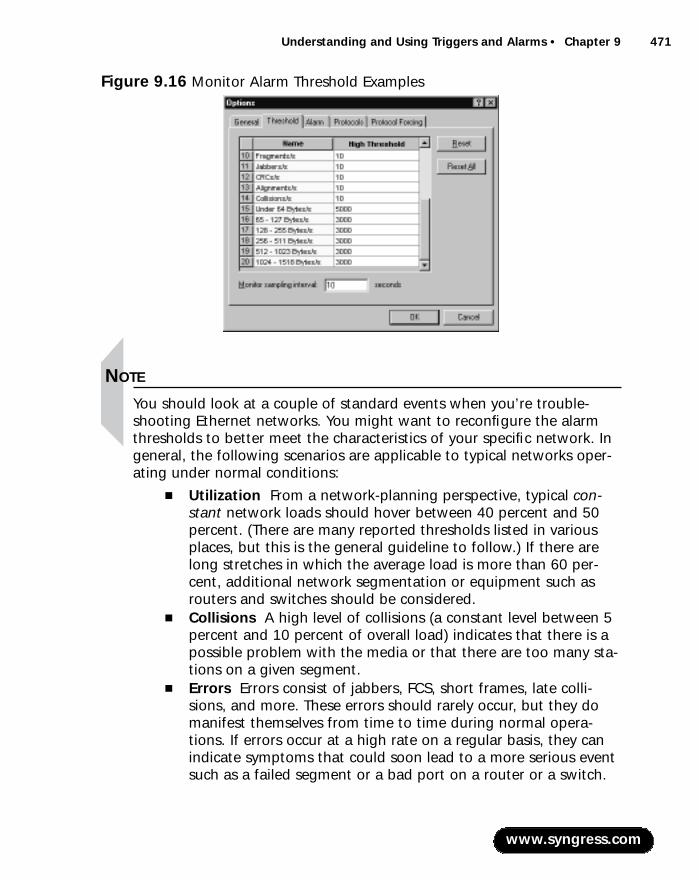
Understanding and Using Triggers and Alarms • Chapter 9 471
NOTE
You should look at a couple of standard events when you’re trouble-shooting Ethernet networks. You might want to reconfigure the alarmthresholds to better meet the characteristics of your specific network. Ingeneral, the following scenarios are applicable to typical networks oper-ating under normal conditions:
■ Utilization From a network-planning perspective, typical con-stant network loads should hover between 40 percent and 50percent. (There are many reported thresholds listed in variousplaces, but this is the general guideline to follow.) If there arelong stretches in which the average load is more than 60 per-cent, additional network segmentation or equipment such asrouters and switches should be considered.
■ Collisions A high level of collisions (a constant level between 5percent and 10 percent of overall load) indicates that there is apossible problem with the media or that there are too many sta-tions on a given segment.
■ Errors Errors consist of jabbers, FCS, short frames, late colli-sions, and more. These errors should rarely occur, but they domanifest themselves from time to time during normal opera-tions. If errors occur at a high rate on a regular basis, they canindicate symptoms that could soon lead to a more serious eventsuch as a failed segment or a bad port on a router or a switch.
www.syngress.com
Figure 9.16 Monitor Alarm Threshold Examples
219_sniffer_09.qxd 6/28/02 12:00 PM Page 471
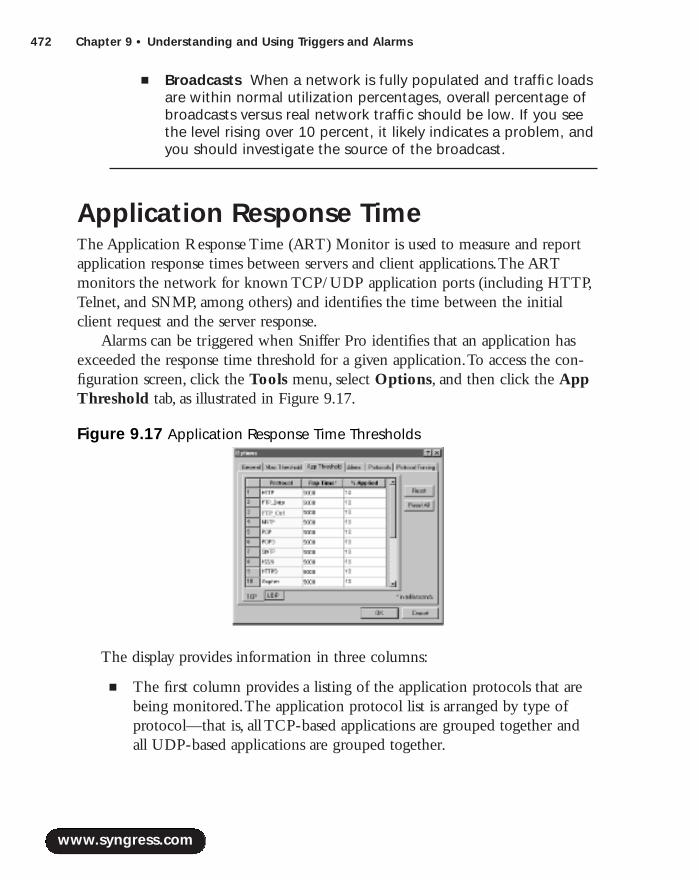
472 Chapter 9 • Understanding and Using Triggers and Alarms
■ Broadcasts When a network is fully populated and traffic loadsare within normal utilization percentages, overall percentage ofbroadcasts versus real network traffic should be low. If you seethe level rising over 10 percent, it likely indicates a problem, andyou should investigate the source of the broadcast.
Application Response TimeThe Application Response Time (ART) Monitor is used to measure and reportapplication response times between servers and client applications.The ARTmonitors the network for known TCP/UDP application ports (including HTTP,Telnet, and SNMP, among others) and identifies the time between the initialclient request and the server response.
Alarms can be triggered when Sniffer Pro identifies that an application hasexceeded the response time threshold for a given application.To access the con-figuration screen, click the Tools menu, select Options, and then click the AppThreshold tab, as illustrated in Figure 9.17.
The display provides information in three columns:
■ The first column provides a listing of the application protocols that arebeing monitored.The application protocol list is arranged by type ofprotocol—that is, all TCP-based applications are grouped together andall UDP-based applications are grouped together.
www.syngress.com
Figure 9.17 Application Response Time Thresholds
219_sniffer_09.qxd 6/28/02 12:00 PM Page 472
Understanding and Using Triggers and Alarms • Chapter 9 473
■ The second column provides the value of the Rsp Time.The Rsp Timevalue identifies the delay in milliseconds that is considered slow for eachgiven application protocol.
■ The third column, % Applied, provides the alarm threshold value thatwill trigger an alarm. For example, if a % Applied threshold is defined at10 percent, an alarm is raised when 10 percent or more of the ART cal-culated between a given client and server is over the Rsp Time.ARTalarms are stored in the Alarms log.
NOTE
For additional information on using the ART Monitor, refer to Chapter 3,“Exploring the Sniffer Pro Interface.”
Before you attempt to modify any ART threshold, it is prudent to obtain agood understanding of how your network operates and to classify application accessfrom the most critical to the least critical. Some networks are categorically sluggish,and server response times tend to be slower than at other sites. Other sites are con-sidered high-performance environments, and these are locations at which applica-tion access times must be maintained at a high level—for instance, trading terminalson a Wall Street trading floor.At these sites, even slight deviations from optimumapplication service times can result in massive financial losses.
www.syngress.com
219_sniffer_09.qxd 6/28/02 12:00 PM Page 473
474 Chapter 9 • Understanding and Using Triggers and Alarms
SummaryThis chapter provided detailed configuration information on Sniffer Pro triggersand alarms.Triggers can be used to automate Sniffer Pro operations to look forand capture network events, even when Sniffer Pro is left unattended.Triggerscan also be used to raise alarms based on symptoms and diagnosis in order toproactively address network issues before they have a significant impact on thenetwork.
Triggers can operate only one at a time.That is, a new triggered capturecannot be initiated until the currently active triggered capture is stopped.Triggerscan be defined to start and/or stop an automated capture.Triggered capturesactually copy the packets that are being transmitted over the network, whereasmonitor sessions only retain the statistical information and measurements of acapture session.
Triggers are defined by clicking the Capture menu, then selecting TriggerSetup.The Trigger Setup screen is divided into three main sections: the triggergraphic outline, the start trigger, and the stop trigger.
The trigger graphic outline provides a graphical display of the current triggerconfiguration.This display is useful for quickly identifying the triggers that areengaged and whether repeat mode is active.When no trigger is defined, thetrigger graphic outline is left blank to indicate that fact.When a start or stoptrigger is defined, the display changes to indicate that and whether the start orstop mode will be manually activated.Triggers can be added, edited, or deleted.
You can define triggers based on a time event, an alarm condition, or as aresult of an event filter.Time-based triggers are initiated at a given time, meaningthat they can start and stop at a specific time of day and day of the week.Alarmtriggers are initiated on the generation of an alarm. Event filter triggers are initi-ated by the identification of an event meeting a filter definition.Triggers can alsobe set to repeat after being stopped.This mode provides the means of tracking anevent over different capture periods based on time, alarm, or event filter.
Alarms are used to identify that an event threshold or network condition hasoccurred during a capture sequence.The Alarm Monitor is always active during acapture sequence and does not need special configurations to begin monitoringevents.Alarms can be defined and tailored to trigger based on a network’s specificrequirements.They can also be defined to initiate an action such as an audiblealert, an e-mail, or a pager call, among others.
The Alarm log displays the Monitor and Expert alarms that have beenreceived and that have been stored within the Alarm Manager.To bring up the
www.syngress.com
219_sniffer_09.qxd 6/28/02 12:00 PM Page 474

Understanding and Using Triggers and Alarms • Chapter 9 475
Alarm log display, click the Monitor menu, then click Alarm Log. Each alarmdisplayed provides status information, the type of alarm received, the log timewhen the alarm occurred, the severity of the alarm, and a high level descriptionof the alarm.
The Status column of the alarm display identifies whether an alarm is new orhas been acknowledged.Acknowledged alarms are indicated by the i icon.Unacknowledged alarms are indicated with the red dash (–) icon.Alarms can beacknowledged by selecting the alarm and then right-clicking the window.
The Log Time column provides the details of an alarm. It provides the dateand time for each alarm listed.The Severity column provides information on theseverity associated with each alarm listed in the Alarm log. Five different severitylevels are used to identify the criticality of an alarm: Critical, Major, Minor,Warning, and Informational.The level of severity can be defined or tailored tomatch the conditions of the network being monitored.The Description columnprovides a high-level description of each listed alarm.
Sniffer Pro can be configured to trigger external—that is, non-Sniffer Pro-related—actions based on the severity of an alarm.These notifications can beused to alert staff and third-party applications of a detected symptom or condi-tion. Sniffer Pro can notify of an alarm by sounding an audible alarm, sending ane-mail, calling a beeper, sending an alarm message to a pager, and/or starting aVisual Basic script to open a third-party application or send an alarm to a moni-toring agent such as an SNMP console.
Expert alarms are predefined in Sniffer Pro with thresholds that determinewhen a symptom or diagnosis is generated. It is important to note that thedefault thresholds provided with Expert have been engineered to meet specificrequirements to ensure the accurate identification of network events.A solidunderstanding of network protocols, along with a detailed analysis of your spe-cific environment, should be available for review before you modify any of theSniffer Pro Expert alarm thresholds, because modifications will affect the opera-tions of the Expert network solutions provided by Sniffer Pro.
The Sniffer Pro Monitor obtains statistical information on the network usage,packet sizes, error rates, and other network packet data in real time for trend anal-ysis. Monitor alarms are predefined in Sniffer Pro with thresholds to monitor atypical network when you’re capturing data. Based on the type of network beingoperated, the conditions of the network components, and the application beingserviced by be the network, it could be beneficial to modify some of theMonitor alarm thresholds in order to better represent the existing network conditions.
www.syngress.com
219_sniffer_09.qxd 6/28/02 12:00 PM Page 475
476 Chapter 9 • Understanding and Using Triggers and Alarms
A distributed version of Sniffer Pro is available for environments that requiremultiple Sniffer Pro agents monitoring a large dispersed network.The DistributedSniffer System consists of Distributed Sniffer Servers and SniffMaster Consoles.Data communications between a DSS and the SniffMaster Console can be estab-lished in-band (over the LAN connection) or out of band (over an external seriallink such as a modem). Up to four simultaneous LAN connections, or three LANconnections and one serial modem connection, can be active at any one timebetween DSS and a SniffMaster Console.
The Application Response Time Monitor is used to identify slow applicationresponse times and to raise alarms when these occur.An alarm condition is gen-erated based on the Rsp Time variable, indicating what is to be considered a longdelay, and the % Applied field, which indicates the percentage of packetsexchanged between a specific client and server that have response times matchingor exceeding the Rsp Time.
Solutions Fast Track
Introducing Triggers
! Triggers are used to automate Sniffer Pro’s capture operations when leftunattended.
! Triggers can operate only one at a time.That is, a new triggered capturecannot be initiated until the currently active triggered capture is stopped.
Configuring and Using Triggers
! Triggers are defined by clicking the Capture menu, then selectingTrigger Setup.
! The trigger configuration screen is broken into three main sections: thetrigger graphic outline, the start trigger, and the stop trigger.
! The trigger graphic outline provides a visual representation of thecurrent trigger configuration.
! Triggers can be defined based on a time event or alarm condition or as aresult of an event filter.
www.syngress.com
219_sniffer_09.qxd 6/28/02 12:00 PM Page 476

Understanding and Using Triggers and Alarms • Chapter 9 477
! Triggers that are defined based on a time event are initiated at a giventime, meaning that they can start and stop at a specific time of day andday of week.
! Alarm triggers are initiated on the generation of an alarm.
! Event filter triggers are initiated on the identification of an eventmeeting a filter definition.
! Triggers can also be set to repeat after being stopped.This modeprovides the means of tracking an event over different capture periodsbased on time, alarm, or event filter.
Configuring and Using Alarms
! The Alarm log displays the Monitor and Expert alarms that have beenreceived and that have been stored within the Alarm Manager.
! To bring up the Alarm log, click the Monitor menu, then click Alarm Log.
! Each alarm displayed provides status information, the type of alarmreceived, the log time when the alarm occurred, the severity of thealarm, and a high-level description of the alarm.
! Expert alarms are predefined in Sniffer Pro with thresholds thatdetermine when a symptom or diagnosis is generated.
! A solid understanding of network protocols, along with a detailedanalysis of your specific environment, should be available for reviewbefore you modify any of the Sniffer Pro Expert alarm thresholds,because these modifications will affect the operations of the Expertnetwork solutions provided by Sniffer Pro.
! The Sniffer Pro Monitor obtains statistical information on the networkusage, packet sizes, error rates, and other network packet data in realtime for trend analysis.
! Based on the type of network being operated, the conditions of thenetwork components, and the application being serviced by thenetwork, it might be beneficial to modify some of the Monitor alarmthresholds in order to better represent the existing network conditions.
www.syngress.com
219_sniffer_09.qxd 6/28/02 12:00 PM Page 477

478 Chapter 9 • Understanding and Using Triggers and Alarms
Configuring Alarm Notifications
! Sniffer Pro can notify you of an alarm by sounding an audible alarm,sending an e-mail, calling a beeper, sending an alarm message to a pager,and/or starting a Visual Basic script to open a third-party application orsend an alarm to a monitoring agent such as an SNMP console.
! Alarms can be defined and tailored to trigger based on a network’sspecific requirements.
! Alarms can be defined to initiate an action such as an audible alert, an e-mail, or a pager call, among others.
Modifying Alarm Threshold Levels
! Alarms are used to identify that an event threshold or network conditionhas occurred during a capture sequence.
! The Alarm Monitor is always active during a capture sequence and doesnot need special configurations to begin monitoring events.
Application Response Time
! The Application Response Time Monitor is used to identify slowapplication response times and to raise alarms when these occur.
! An alarm condition is generated based on the Rsp Time variable,indicating what is to be considered a long delay, and the % Appliedvariable, which indicates the percentage of packets exchanged between aspecific client and server that have response times matching or exceedingthe Rsp Time.
www.syngress.com
219_sniffer_09.qxd 6/28/02 12:00 PM Page 478

Understanding and Using Triggers and Alarms • Chapter 9 479
Q: Can I have more than one trigger operating at the same time so that I canmonitor two different conditions simultaneously?
A: Although only one trigger can be active at any one time, you may create afilter that has more than one signature.This way you can still monitor the dif-ferent types of traffic you are after using the single trigger.
Q: What are the differences between the various filters?
A: All filters used in Sniffer Pro are defined using the same procedure, but theyare referred to as monitor filters when they’re used to identify traffic duringmonitoring, capture filters when used to identify traffic for capture, and eventfilters when used in a trigger.
Q: I would like to use a protocol that is not defined as a trigger within SnifferPro. Is that possible?
A: Yes.You can define a new protocol filter with the characteristics of the pro-tocol you want to trigger.
Q: Can I define a trigger that combines different start and stop triggered events?
A: Yes.You can define a trigger that starts a capture at a specific time and definea filter-based trigger that stops the capture when it sees a given networkevent.You can use time, alarm, and filter triggers in any combination to startand stop a triggered capture.
www.syngress.com
Frequently Asked Questions
The following Frequently Asked Questions, answered by the authors of this book,are designed to both measure your understanding of the concepts presented in this chapter and to assist you with real-life implementation of these concepts. Tohave your questions about this chapter answered by the author, browse towww.syngress.com/solutions and click on the “Ask the Author” form.
219_sniffer_09.qxd 6/28/02 12:00 PM Page 479

480 Chapter 9 • Understanding and Using Triggers and Alarms
Q: What are Expert alarms, and can they be modified?
A: Expert alarms are predefined in Sniffer Pro with thresholds that determinewhen a symptom or diagnosis is generated.Take care before modifyingExpert alarms, because changing them will impact the performance of theSniffer Pro Expert system.To modify the Expert alarm thresholds, click theTools menu, select Expert Options, then click the Alarms tab.
www.syngress.com
219_sniffer_09.qxd 6/28/02 12:00 PM Page 480

Reporting
Solutions in this chapter:
■ Reporting Fundamentals
■ Creating the Report Template
■ Running and Exporting Reports
■ Creating a Full Report: “Network Is Slow”
Chapter 10
481
! Summary
! Solutions Fast Track
! Frequently Asked Questions
219_sniffer_10.qxd 6/28/02 12:01 PM Page 481

482 Chapter 10 • Reporting
IntroductionNow you are a Sniffer Pro guru.You can analyze the network, isolate problems,proactively take charge of being warned about events reaching a threshold, andleap large protocol stacks in a single bound. If you have more questions, youknow where and how to research the problems and answers.A few questions,though: Can you explain the problems to management or to a client? Can youtake all the outstanding information you have compiled and generate a reportdetailing why the network is acting the way it is? If you can answer “Yes” tothese questions, you have taken a major step in breaking the boundaries betweentechnicians and upper management, and this is the way you can justify that costlyupgrade, if it’s needed. If there is one thing that says it all, it is a graphical chartwith accurate data. If the chart points in the red, the news must be bad, right?
Let’s venture into learning to create reports. By the end of the chapter, youwill be able to write your own.We also view the makings of a sample reportbased on a real-life problem, giving you an idea of how the process works fromstart to finish as well as an idea of what your reports should say.
Reporting FundamentalsReporting is a function that can be considered a headache, but is a necessary partof network and protocol analysis.Any network and protocol analyst in the fieldknows that you need to be able to translate the information the Sniffer Pro pro-tocol analyzer tool provides into a human-readable and understandable language.This isn’t to say that we as protocol analysts speak “Protocolese” and nobody elseunderstands it, but be honest with yourself: Reading hex and binary decodes allday does not make for great dinner conversation and can confuse many high-level corporate officers who might not be as supremely versed in “Protocol-speak” as you.You need to explain your findings in terms that people canunderstand, and this is a main function of creating reports. Reporting informa-tion while describing how it relates to return on investment (ROI) and total costof ownership (TCO) is something you perhaps never had to deal with before,and you might need to learn it now. In other words, you must learn to explainhow the client’s current solution is viable but with your recommendations willbring productivity to a new level.
Creating reports allows you, the technician, to justify a costly networkupgrade, show your management that it really isn’t the network slowing your fileservers, or any other issue in which management approval is required.Your com-pany’s senior vice president most likely will not know why an ancient 4Mbps
www.syngress.com
219_sniffer_10.qxd 6/28/02 12:01 PM Page 482
www.syngress.com
Token Ring network needs to be migrated to Fast or Gigabit Ethernet by yourverbal explanation alone.The $50,000 upgrade might require a report to get thepoint across.When learning about reporting fundamentals, you will find that thismethodology can be applied to any discipline.The beauty of Sniffer Pro is that itwas built to export reports for you. Here are some fundamentals to live by andideas you should think about when you create a report:
■ Create a report with a high amount of professionalism and careIt is not wise to submit a piece that you spent only five minutes on tothe management of your company or a client, whether for a large orsmall business.Your reports say a lot about you and your work ethic.Thelevel of detail and attention, all the way to how thorough you were inretrieving your findings, will reflect on you. Management and clienteleare more likely to trust your opinions when they see that you have put alarge amount of effort into a detailed report. Do not skimp on effort.
■ Try hard to be as nontechnical as possible in your explanationsof very difficult topics Be aware of your audience. For instance,trying to explain to management the reason that your company shouldmigrate from IPX to IP might be simple in your mind, but they mightnot even know what these acronyms stand for. Make sure that you donot assume everyone knows exactly what it is that you are talking about.Make your explanation understandable to the nontechie; never assume alevel of knowledge from anyone, especially with a very esoteric topicsuch as protocol capture or decoding.
NOTE
Whenever possible, explain very granular theories in a high-level format.This is not to suggest that someone who has ascended to the ranks of thehigher management echelon does not know anything about technology.Quite the opposite! For the most part, upper-level managers know a greatmany things at a high-level view due to the nature of their wide range ofresponsibilities. In comparison, you (the “byte catcher”) can start ramblingabout decodes and lose them on too much granularity because that isyour area of responsibility and expertise. Becoming “in tune” with the net-work and speaking in “weird tongues” is easy to do when mastering pro-tocol analysis. To make this report a good read, make sure all yourexplanations of issues are understandable, especially when you’re dealingwith a client who might not know anything about technology.
Reporting • Chapter 10 483
219_sniffer_10.qxd 6/28/02 12:01 PM Page 483

484 Chapter 10 • Reporting
■ Always put graphs and charts into your report as visual aidsthat help the reader understand the problem There is no need toinundate a report with too many visuals, but make sure you use thegraphs and exportable chart-based information to show major trending.We discuss these tools in detail later in the chapter.
■ Keep the report secure, and make sure the readers understandits sensitivity as well The report you create can allow a hacker to doharm to your network if it releases too much information such asdetailed maps of the network, password captures, or anything else of thisnature. In the wrong hands, a report with detailed network informationcan be harmful to you and your network.
■ Make the report look professional You are a professional, so youshould come off as one! A Sniffer Certified Professional wants to live upto that name. It isn’t necessary to go overboard, but use a nice template,and use the sample we provide here as a basic guide to how a reportshould be laid out.All the analysis you perform and professional tech-nical knowledge you use to solve this company’s dilemma will be worth-less if you hand in a shoddy report that looks like you spent a whopping15 minutes creating it.
Now that we have discussed some basic fundamental rules to follow inpreparing your report, let’s examine why this report is needed.
Why You Should Consider Creating a ReportThere are many reasons that you might want to create a network or protocolanalysis report. Instead of going over every reason, large or small, we discuss themost common ones here. Remember that you can apply most of this theory andmethodology anywhere or for any purpose.You will find that report writing is askill unto itself. Here are some of the most common reasons that you shouldconsider creating a report:
■ Upgrading networking components Due to aging or failing equip-ment, you might find that the “ole hub” is simply not working properlyanymore. It might be necessary to purchase a new switch. In a smallenvironment, this might not cost much, but in large environments withmultiple locations and many wiring closets, you could see the numbersadd up considerably. In your report, you’ll want to justify these costs in aclear, coherent manner.
www.syngress.com
219_sniffer_10.qxd 6/28/02 12:01 PM Page 484
Reporting • Chapter 10 485
NOTE
We have found that a great way to add power to a report is to look atcritical network hardware upgrades. Keep in touch with vendor Web sitesand see which equipment is end of life (EOL). EOL equipment gets min-imal support and will be an extra notch in the gun when you’re trying toget a point across. This is often overlooked and is a major reason thatyou might need to upgrade equipment. Although not directly related toprotocol analysis, this is a quick line you can place in a report to addpower when you need it.
■ Removing unnecessary desktop protocols Changing or elimi-nating some of the desktop protocols in use in your organization isanother very common reason for creating a report. IPX and AppleTalkare very prominent in many of today’s networks, but you might wantthem to disappear. Unfortunately, it is not that easy a goal to reach, andmanagement might feel that if these protocols aren’t hurting anything,why remove them? That is why you are on site with your Sniffer Proanalyzer! More important, your report will explain exactly why youneed to remove these protocols.A report that explains that bandwidthconsumption is not always the problematic concern with the issue ofusing excessive protocols can really hit home.Your report can show theharm in binding multiple protocols to NICs and running chatty proto-cols over limited-bandwidth WAN links, as well as a plethora of otherissues on the network that can cause problems and degrade performance.
NOTE
In your report, you might also want to mention the binding order of pro-tocols. If the client does not want excessive protocols removed, you canalways set them in order of importance. Quality of service (QoS) andqueuing strategies will also aid in creating a solution in your report.
■ Upgrading server hardware Upgrading server-based hardware com-ponents can be quite costly. Sometimes it is cheaper to buy a new serveroutright. Regardless, after the few hours you spent with your Sniffer Pro
www.syngress.com
219_sniffer_10.qxd 6/28/02 12:01 PM Page 485

486 Chapter 10 • Reporting
analyzer capturing traffic, you found that 8 of the 15 file and printservers had very old NICs that were creating broadcast storms on thenetwork due to being faulty or not being very responsive to networktraffic. For argument’s sake, the cost of the hardware, downtime on theservers, and the time needed to invest in this upgrade (with a little riskinvolved) could require a report of proof so that this upgrade can be ini-tialed into a project plan and engaged.You will learn present this pointwith the knowledge you acquire within this chapter.
NOTE
You might even want to create a report for your own status or history.Reports are good tools to have, so date them and archive them for his-torical information.
As stated at the beginning of the section, you can create reports for a plethoraof reasons. Let’s look at some other ideas to help you consider the types ofreports you would like to generate.
You can create reports on protocol analysis of applications your company mightwant to implement. For example, reports can be used for performing an analysis ofa new enterprise resource planning (ERP) system, such as the newest version ofSAP /R3, or for implementing a new enterprise messaging application to showapplication flows and possible bandwidth burdens to consider before rolling out thepackage. Imagine the time and money you would save if you found out, in thecourse of researching your report, that the proposed upgrade of your current ERPsolution would result in 40 percent more saturation on the network. If you arerunning a 10BaseT network, this increase could prove to be a problem.
Lastly, don’t limit yourself when you’re thinking of what types of reports youcan create.You can create report to show that a particular network design needsto be changed due to excessive traffic, broadcasts or multicasts that are out ofcontrol, or even improper configuration of network devices such as switches androuters. In sum, don’t limit your thoughts in terms of reporting; you can reporton anything that needs to be a concern on your network.
www.syngress.com
219_sniffer_10.qxd 6/28/02 12:01 PM Page 486

Reporting • Chapter 10 487
Creating the Report TemplateIf you will be going out and analyzing networks (as well as your own), you mightwant to invest some time in creating a report template for yourself.This templatecan be very generic and used for every client you work with.We use MicrosoftWord, but because you might use some other word processor, we won’t get intothe specifics of creating a Microsoft Word template. Instead, we focus on creatingthe contents of a report.
If you do want to learn how to create a Microsoft Word document template with a *.DOT extension, use the Microsoft TechNet Web site(www.microsoft.com/technet) or the Word-based help files.Whichever word processor you use, it should have a similar help system available.
Report ContentsThe contents of your report should be simple. If you ever wrote a report forschool, you are aware of the basic logistics. In the business and technical world,report writing is very much the same.Your goals are to get your point across,provide information and details, and keep the report concise and to the point.Even more important, time is very much a factor. Remember, you are notwriting a book to be read in a one-hour meeting.You might even be puttingyour report on a PowerPoint slide deck to be presented on a screen in a meeting,which makes it even more critical that it be concise.The people to whom youare presenting your report might not have time to get into specific details. It issuggested that you follow these guidelines:
■ Keep the report from 5 to 10 pages, including graphics and charts.
■ At the beginning of the report, include a brief overview and an execu-tive summary of the problems you found. Include the basics of how andwhat you used to perform your analysis.
■ Include network diagrams, topology maps, and any other attachmentsyou need to reference in your report.
■ The body of the report should include detailed findings on eachproblem you discovered.
■ Provide charts, exported reports from Sniffer Pro, and any other metricsyou received from the analyzer (or other tools such as the FlukeLANMeter or operating system troubleshooting tools and event logs).
www.syngress.com
219_sniffer_10.qxd 6/28/02 12:01 PM Page 487
488 Chapter 10 • Reporting
■ Create a report with factual statements of findings, and sum up thereport with a concise summary reiterating these facts.
■ Provide recommendations on how to resolve the issues you have found,and place best practices within the body of the report.
■ When adding your technical suggestions, be nonbiased and highly factual.Let the client or management budget the equipment or whatever else isneeded based on your recommendations. Never give biased opinions; itcan hurt your credibility. If asked for your opinion, however, you can com-ment on past experiences with products or vendors, but tread lightly; don’tbadmouth technologies based solely on nonfactual information.
A very important thing to understand is why you are doing the report in thefirst place. Is it for a proactive or reactive cause? What are your goals? This infor-mation should also go in the report itself as an objective.
Make sure you understand that you are not limited to what is listed here, nordo you have to include everything listed.This list is simply a good foundation forcreating your report.There is nothing like being unprepared and being bom-barded with questions that you are not ready to answer.When you present yourreport, the amount time you took to prepare it will be obvious.
Tools of the TradeNow that you know how to set up a basic report, let’s discuss how to populate itwith the necessary content.You need a few tools to get your report the way youwant it. Believe it or not, you can create a fantastic-looking report with minimalsoftware and a little bit of effort.
You can use any word processor you have installed, but for the purposes ofthis text, we focus on the Microsoft Office suite, since it is most commonly used.Whichever version you use (9x, 2000, or XP), you can make professional-lookingreports.To create topology maps, spreadsheets of network analysis data, or anypresentation-based reporting, Microsoft Office has all you need.The main appli-cations in the suite are Word (word processing), Excel (spreadsheets), andPowerPoint (presentations in slide format).
Another outstanding tool, which is now part of the Microsoft application base,is Visio, a mapping tool that is used to, among other things, make topology maps.In Figure 10.1, you can clearly see what the power of a few minutes of your timeand Visio 2002 can do for you.A nice feature is the ability to copy graphics fromVisio and paste them into Word, PowerPoint, or whichever application you are
www.syngress.com
219_sniffer_10.qxd 6/28/02 12:01 PM Page 488
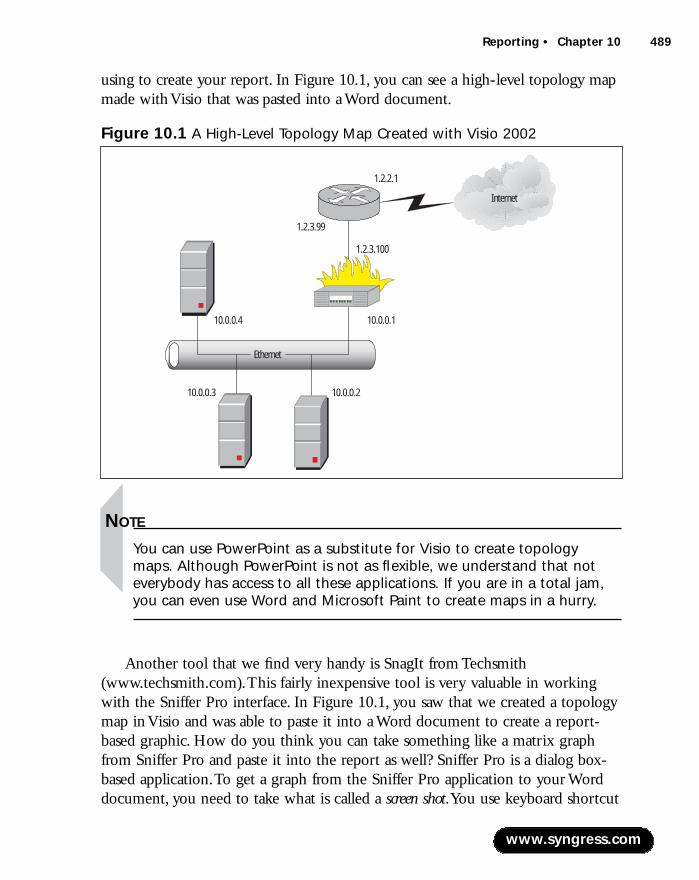
Reporting • Chapter 10 489
using to create your report. In Figure 10.1, you can see a high-level topology mapmade with Visio that was pasted into a Word document.
NOTE
You can use PowerPoint as a substitute for Visio to create topologymaps. Although PowerPoint is not as flexible, we understand that noteverybody has access to all these applications. If you are in a total jam,you can even use Word and Microsoft Paint to create maps in a hurry.
Another tool that we find very handy is SnagIt from Techsmith (www.techsmith.com).This fairly inexpensive tool is very valuable in workingwith the Sniffer Pro interface. In Figure 10.1, you saw that we created a topologymap in Visio and was able to paste it into a Word document to create a report-based graphic. How do you think you can take something like a matrix graphfrom Sniffer Pro and paste it into the report as well? Sniffer Pro is a dialog box-based application.To get a graph from the Sniffer Pro application to your Worddocument, you need to take what is called a screen shot.You use keyboard shortcut
www.syngress.com
Figure 10.1 A High-Level Topology Map Created with Visio 2002
10.0.0.1
10.0.0.2
Ethernet
10.0.0.3
10.0.0.4
1.2.3.100
1.2.3.99
1.2.2.1
Internet
219_sniffer_10.qxd 6/28/02 12:01 PM Page 489

490 Chapter 10 • Reporting
sequences to take screen shots of your entire screen or the active window, placethem in the buffer memory, and then paste them into other applications. So whywould you need SnagIt? For one, it makes taking screen shots faster, easier, andmore manageable. Once you work with the SnagIt interface, you will love it.Second, anyone who has worked with the Sniffer Pro interface and tried to takea simple screen shot will find the process not so simple. It is, in fact, a pain to getan active window in the Sniffer Pro application. Let’s look at why this is so:
1. Open the Sniffer Pro application and start a simple capture. For this exer-cise, you can quickly ping your LAN default gateway about four times.
2. Stop the capture as soon as you have any captured data.You will knowyou captured some data when the Display toolbar icon is no longergrayed out and you can stop and display what was captured. (It is notimportant what you capture, just as long as you get something to view.)
3. Click the Decode tab at the bottom of the Expert dialog box.
4. Now for the tricky part:Take a screen shot of only the decode panes. Donot take a screen shot of the entire Sniffer Pro application.
5. The easiest way to take a screen shot is to use the Print Screen buttonon the top-right side of a standard keyboard. Notice that pressing thiskey takes a screen shot of your entire desktop and places it in buffermemory. (In Windows the Clipboard is buffer memory.)
6. Now open a new Word document and paste in your screen shot bychoosing Edit | Paste.
7. At first glance, you will see that the screen shot is not only of the activewindow (the decode) but also of the Sniffer Pro interface as well as theentire desktop. See our example in Figure 10.2.
8. Now that you see how this works, you can take the next step in tryingto take a screen shot with Sniffer Pro using another handy keystroke, Alt+ Print Screen. Hold the Alt key down and select the Print Screenbutton.When you execute this key combination, you will put only theactive foreground window into the buffer memory. In other words, ifyou had two dialog boxes open and you wanted the one in the fore-ground in your report, you can press Alt + Print Screen and thenpaste the buffer memory contents into the report. Now, try to get thedecode panes without getting the entire Sniffer Pro application.You can
www.syngress.com
219_sniffer_10.qxd 6/28/02 12:01 PM Page 490

Reporting • Chapter 10 491
clearly see that this does not work very well; you are left with whatlooks like Figure 10.2 again.
9. To resolve this issue, open SnagIt from the Programs folder in your Startmenu.You will see the dialog box open; SnagIt will be ready to captureafter you have installed it and configured the basics.When you selectSnagIt, you will be greeted with a capture dialog box as shown in Figure 10.3.
www.syngress.com
Figure 10.2 A Screen Shot of the Entire Sniffer Pro Application
Figure 10.3 The SnagIt Opening Screen
219_sniffer_10.qxd 6/28/02 12:01 PM Page 491

492 Chapter 10 • Reporting
10. The dot above Capture is all you will need to press to start the capture.Now, position the Decode pane the way you want to see it in yourreport. Once it’s positioned, press the Capture dot on the SnagItopening screen, and you will be able to put a box around whatever youwant to capture.
11. Once your material is captured, you can save the file as a *.JPG or*.BMP, among other file types, or you can paste it directly into yourreport.
12. In Figure 10.4, it is easy to see the results of using a tool like SnagIt tocapture exactly what you need, without the drawbacks of a simple PrintScreen execution.
NOTE
As a workaround to using the SnagIt program, you can use MicrosoftPaint. Simply take a full screen shot with the Print Screen keyboardbutton, paste the entire contents into Paint, and cut what you need tosee out of the painting. You can then paste the graphic into a Word doc-ument. You can also paste it into a new Microsoft Paint bitmap and saveit as a *.GIF or other type of file.
You’ll see more benefits of the SnagIt package later in the chapter when welook at pie charts and add them to the report.
This chapter is not intended as a treatise on how to use the SnagIt orMicrosoft Office tools, nor is it a blatant promotion of them. It is more a way tomake your life easier and to look at the tools that have worked for us and that weknow can work for you.Any tool that performs this functionality is useful and
www.syngress.com
Figure 10.4 Using SnagIt to Capture Only What You Need
219_sniffer_10.qxd 6/28/02 12:01 PM Page 492
Reporting • Chapter 10 493
recommended. It is our intention to provide you with ideas and workarounds tousing the basic tools provided with the operating system and, most important, tosave you time, which today is more precious than just about anything. If you needmore help with the SnagIt tool, look in the application help files or on theTechsmith Web site.
Running and Exporting ReportsWe have highlighted the importance of creating reports and the tools you willmost likely need or that will help you to create presentable network and protocolanalysis reports. Let’s look at what the Sniffer Pro application can provide in theform of exportable comma-separated value (*.CSV) files and some other tricks ofthe trade for pulling specific information from Sniffer Pro to use in a report.Welook at the Matrix, Host Table, Protocol Distribution, and Global Statistics viewsin detail.
www.syngress.com
Generating Reports Using the Optional Sniffer Reporter AgentWhen you want to generate professional reports directly from SnifferPro, you need an add-in software program. The Sniffer Reporter Agentis optional and does not come with a standard install of the product.Sniffer Pro Reporter allows you to do trend reporting and forecasting.This application is provided by Network Associates and has the power togenerate many types of highly customizable reports. It functions withthe Matrix, Host Table, Protocol Distribution, and Global Statistics por-tions of the Sniffer Pro application. When Sniffer Reporter Agent isinstalled, a new toolbar icon will appear and be functional within theseviews. It is okay if you do not have this software, because after readingthis chapter you will be able to create a report without using this tool.However, this tool does make it easier to generate a report.
When the application is installed correctly, you will receive this newtoolbar icon:
Configuring & Implementing…
219_sniffer_10.qxd 6/28/02 12:01 PM Page 493
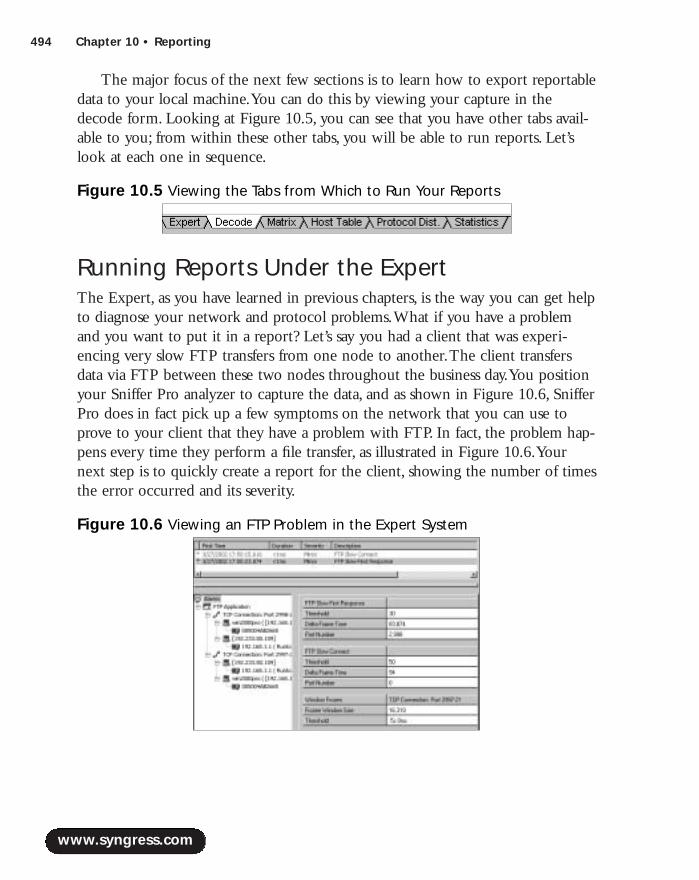
494 Chapter 10 • Reporting
The major focus of the next few sections is to learn how to export reportabledata to your local machine.You can do this by viewing your capture in thedecode form. Looking at Figure 10.5, you can see that you have other tabs avail-able to you; from within these other tabs, you will be able to run reports. Let’slook at each one in sequence.
Running Reports Under the ExpertThe Expert, as you have learned in previous chapters, is the way you can get helpto diagnose your network and protocol problems.What if you have a problemand you want to put it in a report? Let’s say you had a client that was experi-encing very slow FTP transfers from one node to another.The client transfersdata via FTP between these two nodes throughout the business day.You positionyour Sniffer Pro analyzer to capture the data, and as shown in Figure 10.6, SnifferPro does in fact pick up a few symptoms on the network that you can use toprove to your client that they have a problem with FTP. In fact, the problem hap-pens every time they perform a file transfer, as illustrated in Figure 10.6.Yournext step is to quickly create a report for the client, showing the number of timesthe error occurred and its severity.
www.syngress.com
Figure 10.5 Viewing the Tabs from Which to Run Your Reports
Figure 10.6 Viewing an FTP Problem in the Expert System
219_sniffer_10.qxd 6/28/02 12:01 PM Page 494
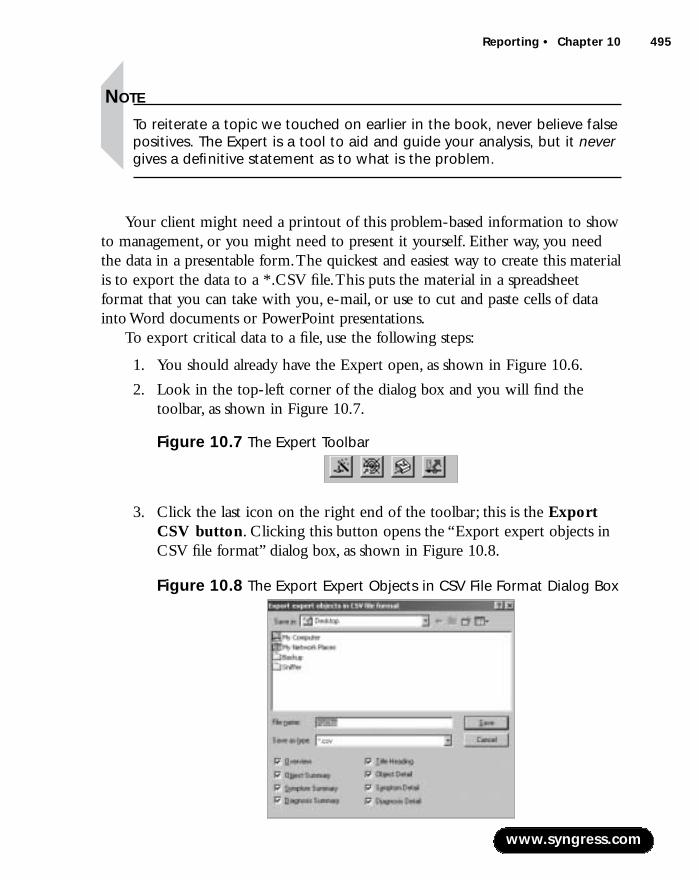
Reporting • Chapter 10 495
NOTE
To reiterate a topic we touched on earlier in the book, never believe falsepositives. The Expert is a tool to aid and guide your analysis, but it nevergives a definitive statement as to what is the problem.
Your client might need a printout of this problem-based information to showto management, or you might need to present it yourself. Either way, you needthe data in a presentable form.The quickest and easiest way to create this materialis to export the data to a *.CSV file.This puts the material in a spreadsheetformat that you can take with you, e-mail, or use to cut and paste cells of datainto Word documents or PowerPoint presentations.
To export critical data to a file, use the following steps:
1. You should already have the Expert open, as shown in Figure 10.6.
2. Look in the top-left corner of the dialog box and you will find thetoolbar, as shown in Figure 10.7.
3. Click the last icon on the right end of the toolbar; this is the ExportCSV button. Clicking this button opens the “Export expert objects inCSV file format” dialog box, as shown in Figure 10.8.
www.syngress.com
Figure 10.7 The Expert Toolbar
Figure 10.8 The Export Expert Objects in CSV File Format Dialog Box
219_sniffer_10.qxd 6/28/02 12:01 PM Page 495
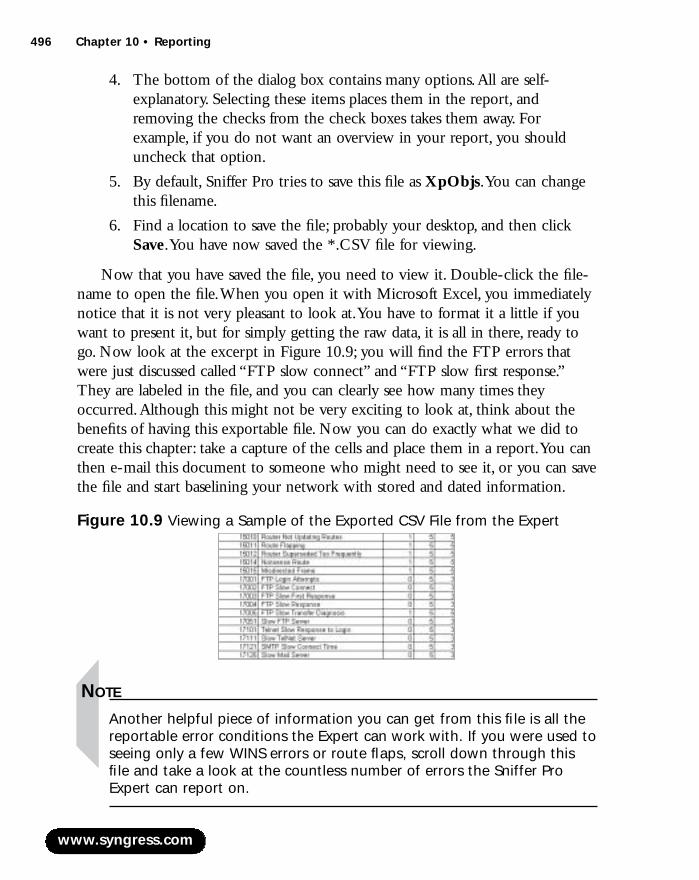
496 Chapter 10 • Reporting
4. The bottom of the dialog box contains many options.All are self-explanatory. Selecting these items places them in the report, andremoving the checks from the check boxes takes them away. Forexample, if you do not want an overview in your report, you shoulduncheck that option.
5. By default, Sniffer Pro tries to save this file as XpObjs.You can changethis filename.
6. Find a location to save the file; probably your desktop, and then clickSave.You have now saved the *.CSV file for viewing.
Now that you have saved the file, you need to view it. Double-click the file-name to open the file.When you open it with Microsoft Excel, you immediatelynotice that it is not very pleasant to look at.You have to format it a little if youwant to present it, but for simply getting the raw data, it is all in there, ready togo. Now look at the excerpt in Figure 10.9; you will find the FTP errors thatwere just discussed called “FTP slow connect” and “FTP slow first response.”They are labeled in the file, and you can clearly see how many times theyoccurred.Although this might not be very exciting to look at, think about thebenefits of having this exportable file. Now you can do exactly what we did tocreate this chapter: take a capture of the cells and place them in a report.You canthen e-mail this document to someone who might need to see it, or you can savethe file and start baselining your network with stored and dated information.
NOTE
Another helpful piece of information you can get from this file is all thereportable error conditions the Expert can work with. If you were used toseeing only a few WINS errors or route flaps, scroll down through thisfile and take a look at the countless number of errors the Sniffer ProExpert can report on.
www.syngress.com
Figure 10.9 Viewing a Sample of the Exported CSV File from the Expert
219_sniffer_10.qxd 6/28/02 12:01 PM Page 496
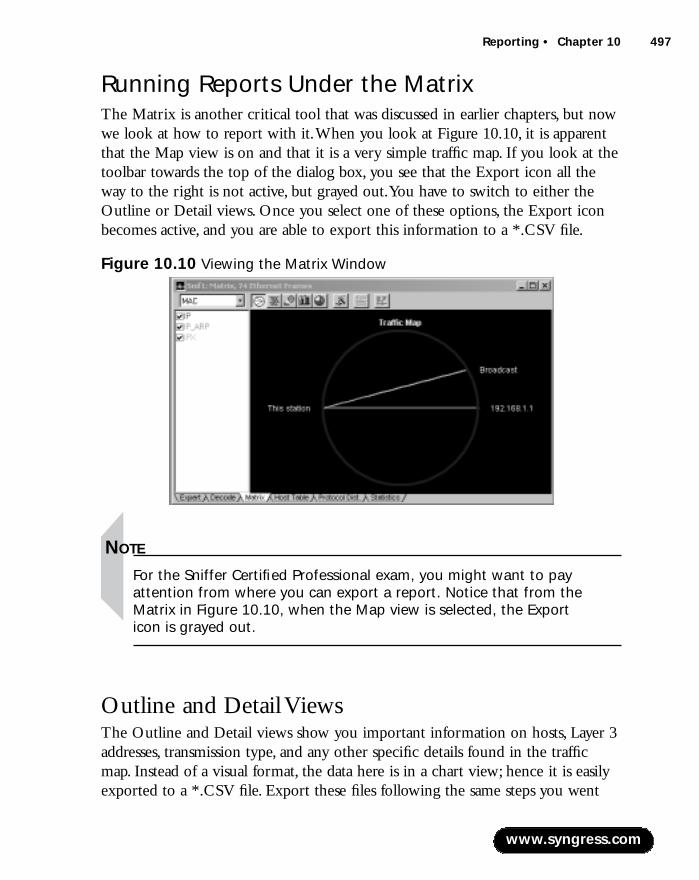
Reporting • Chapter 10 497
Running Reports Under the MatrixThe Matrix is another critical tool that was discussed in earlier chapters, but nowwe look at how to report with it.When you look at Figure 10.10, it is apparentthat the Map view is on and that it is a very simple traffic map. If you look at thetoolbar towards the top of the dialog box, you see that the Export icon all theway to the right is not active, but grayed out.You have to switch to either theOutline or Detail views. Once you select one of these options, the Export iconbecomes active, and you are able to export this information to a *.CSV file.
NOTE
For the Sniffer Certified Professional exam, you might want to pay attention from where you can export a report. Notice that from theMatrix in Figure 10.10, when the Map view is selected, the Export icon is grayed out.
Outline and Detail ViewsThe Outline and Detail views show you important information on hosts, Layer 3addresses, transmission type, and any other specific details found in the trafficmap. Instead of a visual format, the data here is in a chart view; hence it is easilyexported to a *.CSV file. Export these files following the same steps you went
www.syngress.com
Figure 10.10 Viewing the Matrix Window
219_sniffer_10.qxd 6/28/02 12:01 PM Page 497
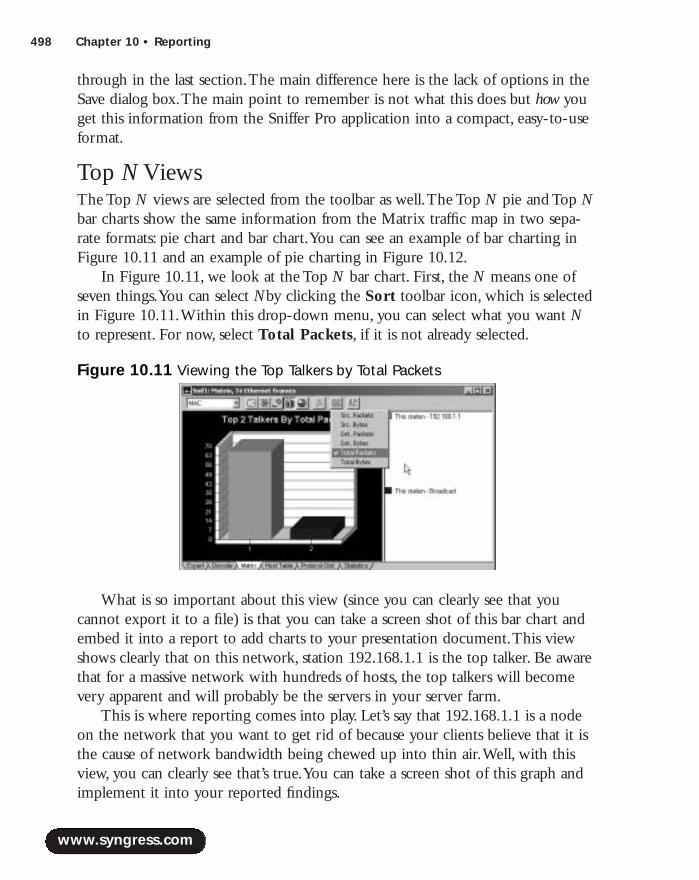
498 Chapter 10 • Reporting
through in the last section.The main difference here is the lack of options in theSave dialog box.The main point to remember is not what this does but how youget this information from the Sniffer Pro application into a compact, easy-to-useformat.
Top NViewsThe Top N views are selected from the toolbar as well.The Top N pie and Top Nbar charts show the same information from the Matrix traffic map in two sepa-rate formats: pie chart and bar chart.You can see an example of bar charting inFigure 10.11 and an example of pie charting in Figure 10.12.
In Figure 10.11, we look at the Top N bar chart. First, the N means one ofseven things.You can select Nby clicking the Sort toolbar icon, which is selectedin Figure 10.11.Within this drop-down menu, you can select what you want Nto represent. For now, select Total Packets, if it is not already selected.
What is so important about this view (since you can clearly see that youcannot export it to a file) is that you can take a screen shot of this bar chart andembed it into a report to add charts to your presentation document.This viewshows clearly that on this network, station 192.168.1.1 is the top talker. Be awarethat for a massive network with hundreds of hosts, the top talkers will becomevery apparent and will probably be the servers in your server farm.
This is where reporting comes into play. Let’s say that 192.168.1.1 is a nodeon the network that you want to get rid of because your clients believe that it isthe cause of network bandwidth being chewed up into thin air.Well, with thisview, you can clearly see that’s true.You can take a screen shot of this graph andimplement it into your reported findings.
www.syngress.com
Figure 10.11 Viewing the Top Talkers by Total Packets
219_sniffer_10.qxd 6/28/02 12:01 PM Page 498
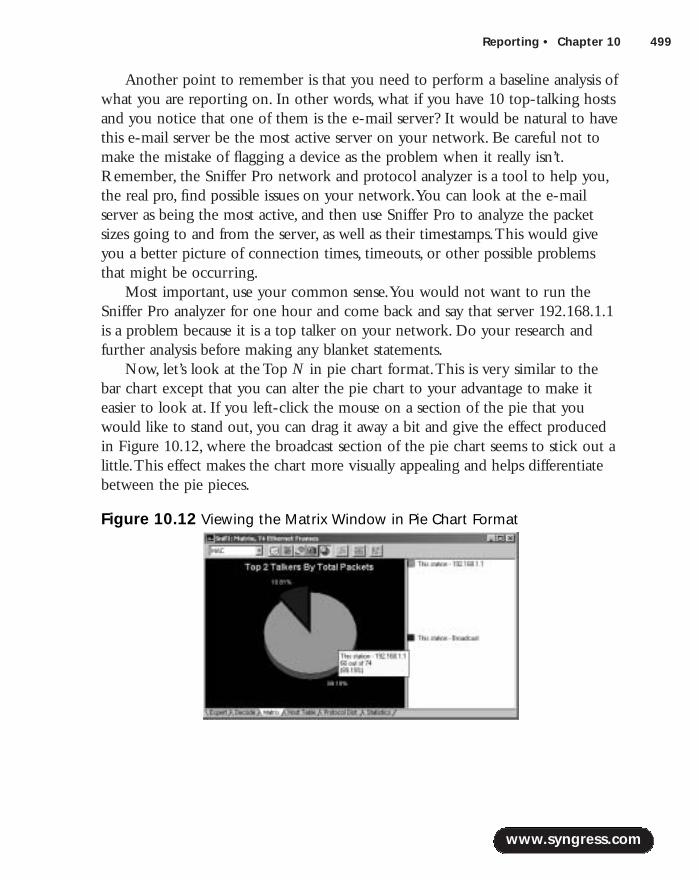
Reporting • Chapter 10 499
Another point to remember is that you need to perform a baseline analysis ofwhat you are reporting on. In other words, what if you have 10 top-talking hostsand you notice that one of them is the e-mail server? It would be natural to havethis e-mail server be the most active server on your network. Be careful not tomake the mistake of flagging a device as the problem when it really isn’t.Remember, the Sniffer Pro network and protocol analyzer is a tool to help you,the real pro, find possible issues on your network.You can look at the e-mailserver as being the most active, and then use Sniffer Pro to analyze the packetsizes going to and from the server, as well as their timestamps.This would giveyou a better picture of connection times, timeouts, or other possible problemsthat might be occurring.
Most important, use your common sense.You would not want to run theSniffer Pro analyzer for one hour and come back and say that server 192.168.1.1is a problem because it is a top talker on your network. Do your research andfurther analysis before making any blanket statements.
Now, let’s look at the Top N in pie chart format.This is very similar to thebar chart except that you can alter the pie chart to your advantage to make iteasier to look at. If you left-click the mouse on a section of the pie that youwould like to stand out, you can drag it away a bit and give the effect producedin Figure 10.12, where the broadcast section of the pie chart seems to stick out alittle.This effect makes the chart more visually appealing and helps differentiatebetween the pie pieces.
www.syngress.com
Figure 10.12 Viewing the Matrix Window in Pie Chart Format
219_sniffer_10.qxd 6/28/02 12:01 PM Page 499
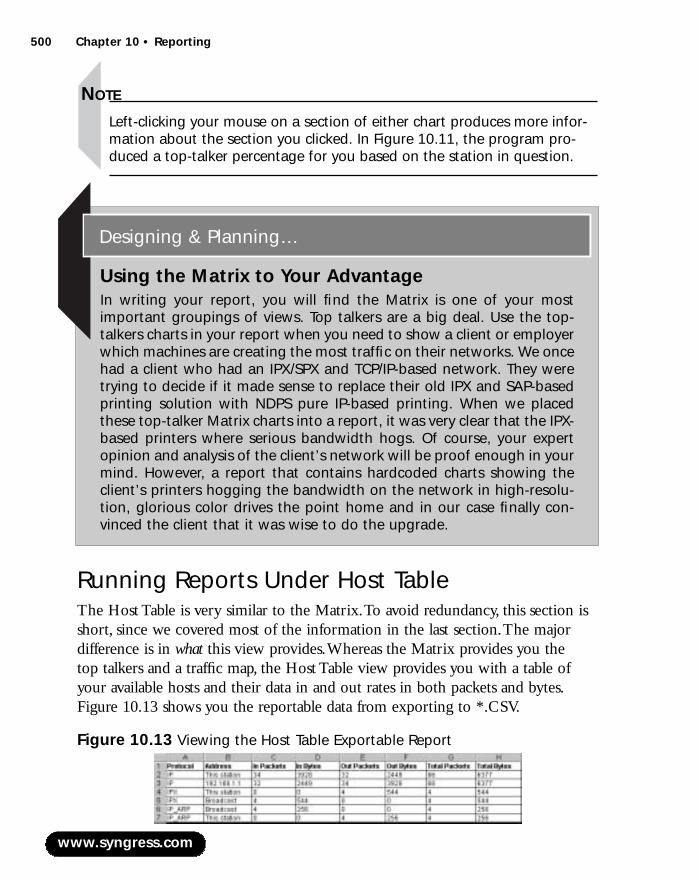
500 Chapter 10 • Reporting
NOTE
Left-clicking your mouse on a section of either chart produces more infor-mation about the section you clicked. In Figure 10.11, the program pro-duced a top-talker percentage for you based on the station in question.
Running Reports Under Host TableThe Host Table is very similar to the Matrix.To avoid redundancy, this section isshort, since we covered most of the information in the last section.The majordifference is in what this view provides.Whereas the Matrix provides you the top talkers and a traffic map, the Host Table view provides you with a table ofyour available hosts and their data in and out rates in both packets and bytes.Figure 10.13 shows you the reportable data from exporting to *.CSV.
www.syngress.com
Using the Matrix to Your AdvantageIn writing your report, you will find the Matrix is one of your mostimportant groupings of views. Top talkers are a big deal. Use the top-talkers charts in your report when you need to show a client or employerwhich machines are creating the most traffic on their networks. We oncehad a client who had an IPX/SPX and TCP/IP-based network. They weretrying to decide if it made sense to replace their old IPX and SAP-basedprinting solution with NDPS pure IP-based printing. When we placedthese top-talker Matrix charts into a report, it was very clear that the IPX-based printers where serious bandwidth hogs. Of course, your expertopinion and analysis of the client’s network will be proof enough in yourmind. However, a report that contains hardcoded charts showing theclient’s printers hogging the bandwidth on the network in high-resolu-tion, glorious color drives the point home and in our case finally con-vinced the client that it was wise to do the upgrade.
Designing & Planning…
Figure 10.13 Viewing the Host Table Exportable Report
219_sniffer_10.qxd 6/28/02 12:01 PM Page 500
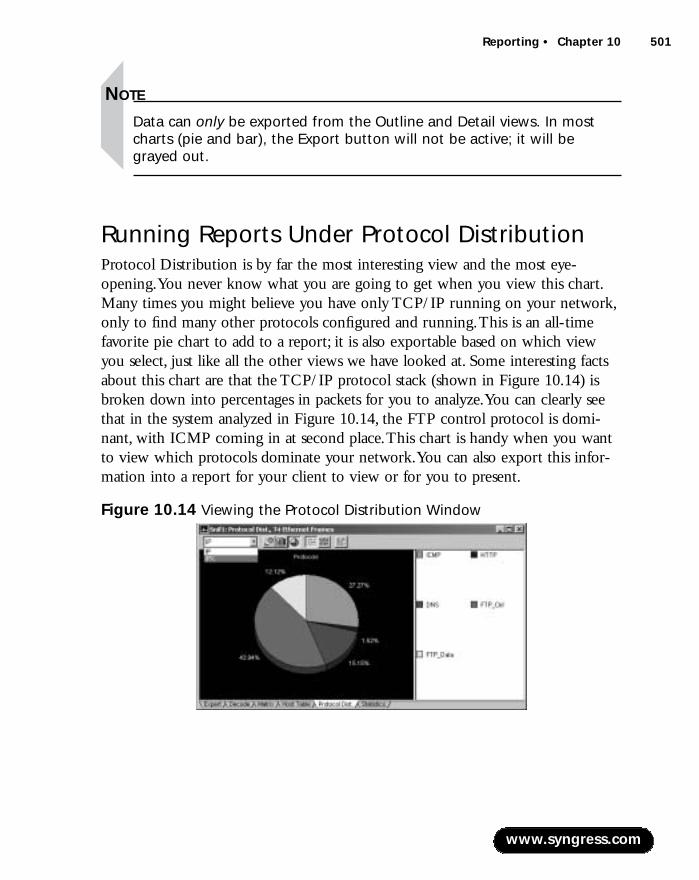
Reporting • Chapter 10 501
NOTE
Data can only be exported from the Outline and Detail views. In mostcharts (pie and bar), the Export button will not be active; it will begrayed out.
Running Reports Under Protocol DistributionProtocol Distribution is by far the most interesting view and the most eye-opening.You never know what you are going to get when you view this chart.Many times you might believe you have only TCP/IP running on your network,only to find many other protocols configured and running.This is an all-timefavorite pie chart to add to a report; it is also exportable based on which viewyou select, just like all the other views we have looked at. Some interesting factsabout this chart are that the TCP/IP protocol stack (shown in Figure 10.14) isbroken down into percentages in packets for you to analyze.You can clearly seethat in the system analyzed in Figure 10.14, the FTP control protocol is domi-nant, with ICMP coming in at second place.This chart is handy when you wantto view which protocols dominate your network.You can also export this infor-mation into a report for your client to view or for you to present.
www.syngress.com
Figure 10.14 Viewing the Protocol Distribution Window
219_sniffer_10.qxd 6/28/02 12:01 PM Page 501
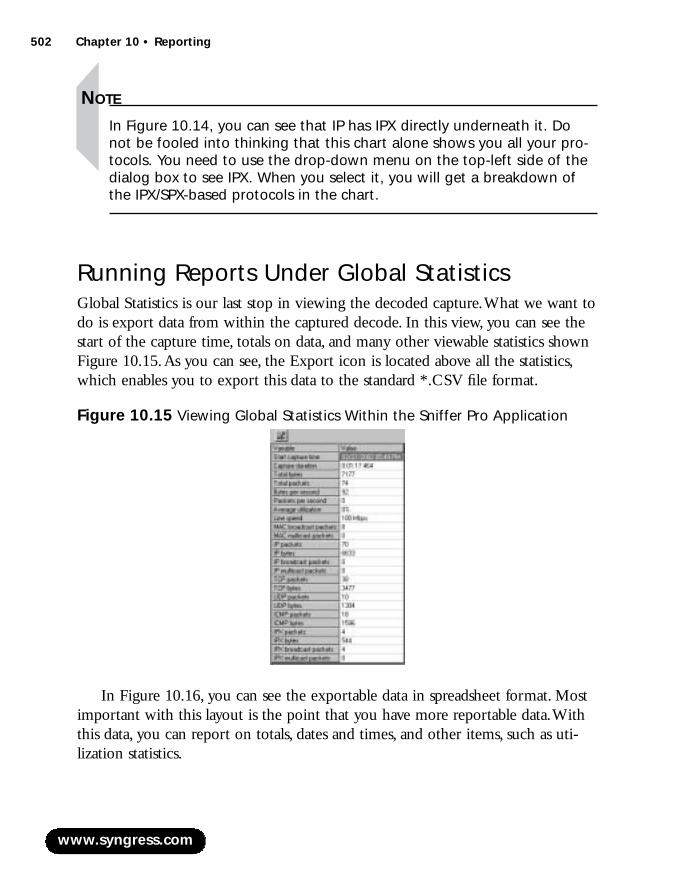
502 Chapter 10 • Reporting
NOTE
In Figure 10.14, you can see that IP has IPX directly underneath it. Donot be fooled into thinking that this chart alone shows you all your pro-tocols. You need to use the drop-down menu on the top-left side of thedialog box to see IPX. When you select it, you will get a breakdown ofthe IPX/SPX-based protocols in the chart.
Running Reports Under Global StatisticsGlobal Statistics is our last stop in viewing the decoded capture.What we want todo is export data from within the captured decode. In this view, you can see thestart of the capture time, totals on data, and many other viewable statistics shownFigure 10.15.As you can see, the Export icon is located above all the statistics,which enables you to export this data to the standard *.CSV file format.
In Figure 10.16, you can see the exportable data in spreadsheet format. Mostimportant with this layout is the point that you have more reportable data.Withthis data, you can report on totals, dates and times, and other items, such as uti-lization statistics.
www.syngress.com
Figure 10.15 Viewing Global Statistics Within the Sniffer Pro Application
219_sniffer_10.qxd 6/28/02 12:01 PM Page 502

Reporting • Chapter 10 503
Other Exportable and Reportable ViewsYou can export usable data from other areas within Sniffer Pro. One importantarea is history sampling. If you choose the Monitor menu and select HistorySamples, you open History Sampling. If you select a sample and execute it (herewe have started Packets/s), you will see the Export button at the bottom-left sideof the open dialog box in Figure 10.17. Once you select this icon, you are able tosave a history spreadsheet to your desktop in the form of a *.CSV file. One thingyou should know is that the output in the spreadsheet is very specific to whatyou are sampling.
www.syngress.com
Figure 10.16 Viewing Global Statistics After They Are Exported to CSV Format
Figure 10.17 Viewing History Sampling Before an Export
219_sniffer_10.qxd 6/28/02 12:01 PM Page 503
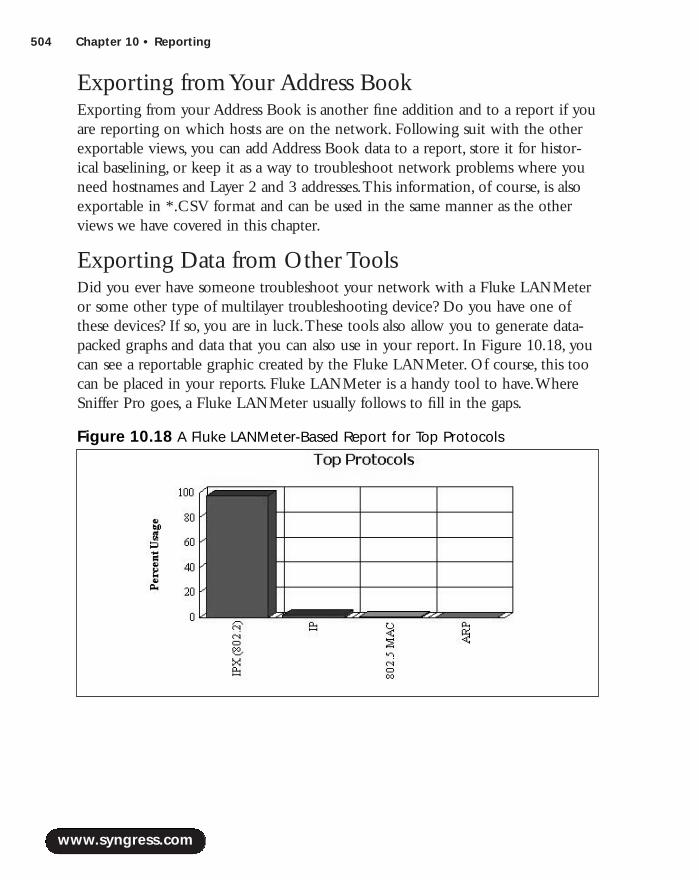
504 Chapter 10 • Reporting
Exporting from Your Address BookExporting from your Address Book is another fine addition and to a report if youare reporting on which hosts are on the network. Following suit with the otherexportable views, you can add Address Book data to a report, store it for histor-ical baselining, or keep it as a way to troubleshoot network problems where youneed hostnames and Layer 2 and 3 addresses.This information, of course, is alsoexportable in *.CSV format and can be used in the same manner as the otherviews we have covered in this chapter.
Exporting Data from Other ToolsDid you ever have someone troubleshoot your network with a Fluke LANMeteror some other type of multilayer troubleshooting device? Do you have one ofthese devices? If so, you are in luck.These tools also allow you to generate data-packed graphs and data that you can also use in your report. In Figure 10.18, youcan see a reportable graphic created by the Fluke LANMeter. Of course, this toocan be placed in your reports. Fluke LANMeter is a handy tool to have.WhereSniffer Pro goes, a Fluke LANMeter usually follows to fill in the gaps.
www.syngress.com
Figure 10.18 A Fluke LANMeter-Based Report for Top Protocols
219_sniffer_10.qxd 6/28/02 12:01 PM Page 504

Reporting • Chapter 10 505
HTML and CSVThe last stop on learning how to retrieve information from Sniffer Pro to putinto a report is to create HTML pages to view on the Web.Anyone can create aWeb page without knowing HTML; Excel and other programs can generateHTML for you.What many people get confused about when trying to generatethis document is that they might not know how to get the program to generateit. In the next scenario, we look at how to create HTML and why.
To create an HTML-based Web page for a report, the trick is to create a*.CSV file first.You can then open the file in Excel and save it as an HTMLdocument. Go to the File menu of your open *.CSV worksheet and select Saveas Web Page. Once you do that, the page is ready to open with your Internetbrowser program.
Another great feature Sniffer Pro offers is that when viewing the Expert, youcan export directly to HTML without having to go through the steps mentionedwith regard to Excel.When you open to the Expert, you will see a toolbar
www.syngress.com
Exporting the Alarm LogAnother not so well-known exportable report comes from the Alarm log.Although alarms are covered in another chapter, this is a good time tohighlight the flexibility of the exportable reports from the Alarm logitself. To export the Alarm log, you need to follow these steps:
1. To open the Alarm log, choose the Monitor menu and selectAlarm Log.
2. When you open the Alarm log, you will see alarms that weretriggered and recorded from previous chapters. You musthave a current alarm in order to export it.
3. Right-click the alarm. You will see a drop-down menu withExport at the very bottom.
4. Select the Export option, which will allow you to produce a*.CSV formatted report.
If you do not have an alarm to look at, you can right-click and seethe Export function available in the menu, but it will be grayed out.
Configuring & Implementing…
219_sniffer_10.qxd 6/28/02 12:01 PM Page 505
506 Chapter 10 • Reporting
button on the top-left corner of the dialog box that looks like a spider web (torepresent the World Wide Web).This button, when selected, gives you the optionto save directly to HTML.
You would export to HTML if you needed to keep an intranet-based Webserver updated with these files or if you wanted to send the report to someonewho does not have a spreadsheet program.Almost every machine comes standardwith a Web browser these days.
As many technicians are unaware, the file type *.CSV (as which you havebeen saving your exported data) stands for comma-separated values.A .CSV fileconsists simply of lines of ASCII text, separated by commas. For this reason, thisformat is easy to import into a spreadsheet program such as Excel or, moreimportant, into a database application such as Access.
Creating a Full Report: “Network Is Slow”In this section, we show you how to create a very simple, informative reportbased on a single problem.You can expand on the report in sections by addingthings you feel are needed.You can also add multiple problems together howeveryou see fit.The purpose of this sample report is to give you some ideas to getstarted. It will not be the solution you use every time, and it might not even beone that fits your needs now, but it will show you how to use the Sniffer Proapplication to get the data you want for the report. In each section of this samereport, we will add notes to show where Sniffer Pro or other tools were used toaid in generating the report.
Your report does not need to be long. Each page of the report should beconcise and not tell too much of the story. Remember all the details we wentover in the first section of this chapter? Now all the things we discussed willcome to life.To start, depending on how you plan to deliver your report, youmight need to create a cover sheet. If you put a PowerPoint presentationtogether, you should have a title slide. If you hand in a Word document as areport, a cover page would be appropriate. It is a matter of choice and profession-alism. In most reports, a title page is recommended. On the title page you can putthe company’s name, points of contact, your business information and name, andany other pertinent information relating to a simple introduction, such as a titlefor the report.
www.syngress.com
219_sniffer_10.qxd 6/28/02 12:01 PM Page 506
Reporting • Chapter 10 507
“The Network Is Slow”In most workplaces, this comment—“The network is slow”—comes up all thetime. It is your job to analyze, find the problems, make recommendations, andplace findings in the report.We are looking for a very short, five-page report dis-cussing the issues and the findings. Since everyone will format this report theirown way, we explain the process by covering which screen shots are applicable,how to get them, and what you might need to put in each section to get yourpoint across. So let’s begin.
As mentioned before, you should put a simple title page on your report.Thistitle page can simply contain only the title; you can even put some of your con-tact information on it.You should have your name, your company if you’re actingindependently, your contact information, and any other pertinent informationabout you.The first page should also contain the name of the company you areservicing and its contact information.You should also date the report.
On the first page following the title page, you should have a very detailedexecutive overview.You can drift on to as many pages as you need to finish thisoverview, but it is very important to be concise with the information.This is notthe place to speak your mind about what you think; the overview should consistonly of facts relating to what you found on the network.You can then use thenext few pages to detail your findings with specifics. Here is a sample of an exec-utive overview:
“When we analyzed the 10.0.1.0 segment with the Sniffer Pro analyzer, itwas apparent that IPX/SPX SAP broadcasts made up 80 percent of the traffic atany given time. During times of heavy network activity, the segment neared satu-ration with a 91 percent traffic level.”
As you can see, we did not recommend anything; we just gave the facts onthe health of the network at the time the report was created.You can continuewith more information such as issues with BPDUs overwhelming a segmentbecause of STP, routing problems with a multihomed server, and the like.Whatever you choose, just keep it factual and to the point.
Pages two through five of your report should contain more information aboutthe low-level details of each individual problem you are analyzing. Let’s say that youfound that SAP broadcasts were exactly what was slowing down the network; thisis where you get into detail of the specifics of your findings.You can use ProtocolDistribution charting to pull a pie chart into your report, showing how SAP takesup 91 percent of the network bandwidth, leaving little room for anything else on
www.syngress.com
219_sniffer_10.qxd 6/28/02 12:01 PM Page 507

508 Chapter 10 • Reporting
the segment. Each paragraph should end with information on what needs to bedone to correct the issue based on your professional recommendations.
Never make something up in your reports. If you don’t know something,research it. If you still don’t know, don’t make recommendations based on second-hand information or guesswork.This report is something that the managementteam of your company or your trusting client will look at and probably base theirdecisions on, since most of them will not know much about what it is you arereporting on. In some cases, you will come across a very knowledgeable staffmember who knows protocol analysis; in most cases, though, you won’t.At anyrate, never blindly make a recommendation without knowing that what you arerecommending is 100-percent correct.The last thing you need is your credibility tobe tarnished. In the course of your work as a Sniffer Certified Professional, manypeople will trust you with data traversing their million- and billion-dollar companynetworks; that is a trust you should treat with great honor.
If you do make a recommendation, lose your biased opinions on certain tech-nology, because you never know who is in your audience. If your problem is withSAP broadcasts, mentioning that the client should migrate its 35 servers awayfrom Novell NetWare is not a good recommendation.You are not there to donetwork redesign, you are there to perform protocol analysis and fix the problemsthe client is having. Most times, when dealing with IPX/SPX, the problem iswith router configuration, a SAP-type configuration error, framing issues, or fil-ters not being put in place.These all are very easy fixes that would cost the com-pany nothing but a minimum of time compared with migrating to an expensivenetwork infrastructure and away from their current solution.
The next page of your report should contain a summary and closure.Thesummary should contain a high-level view of what the client needs to do, and inmany cases, what the network health is now, what it could be if fixed, and whatthe time frame is resolve such issues. Keep it simple and give it closure.
Attached to your report can be the actual spreadsheets, if requested, and atopology map if needed. Be careful with handing out overly detailed topologymaps to just anyone.The wrong person can use this information against you.Thisis one reason that we never recommend making it mandatory to put a topologymap of the network in every report; use maps only when needed.
In summary, a network report is very flexible, the format is of your choice, andthe length is really up to you.This main purpose of this section was to give you,the analyst, a clear picture of what should be put in a report, what not to leave out,what you need to target, the basic structure, and how to get your point across.Thisshould give you a good start in reporting on network and protocol analysis.
www.syngress.com
219_sniffer_10.qxd 6/28/02 12:01 PM Page 508

Reporting • Chapter 10 509
SummaryIn this chapter, we examined at often-overlooked functionality within the SnifferPro application. Often technicians new to Sniffer Pro use the fire and forget tosimply turn on Sniffer Pro, capture some data, and then sift through it to try tofind a problem that might not be very clear.The other side of the coin is, if youdo in fact find something, how do you report these findings to your managementteam or your client?
In reading this book thus far, we hope that you have learned that the fire-and-forget mentality is not a good tactic in the art of protocol and network anal-ysis.That being said, you have had nine other chapters to learn how to refineyour searches and do some very nifty things with this multifaceted tool. Nowyou have the captures, you have solved the problem (you genius!), and the finalstep is to report it.
In this chapter, we covered the reasons you write reports, the tools used to doso, ways to export critical data to add to reports, ways to take screen shots of datawithin the Sniffer Pro application, and other little tidbits of helpful tips to get yourreport done and on someone’s desk in a presentable format.We hope this materialhelps you take that huge leap from technician to supervisor; many technicians findit difficult to explain things at such a high level due to their brains being inundatedwith the detail that makes them get the job done. Unfortunately, that doesn’t meanthat the team you are reporting to will understand this level of detail as well.
Lastly, you can use Sniffer Pro in tandem with other products to generate a fullreport on whatever it is you are troubleshooting.This book is intended to not onlyshow you how to make Sniffer Pro export some CSV files, but also how to shapethem into something much better.When you present your report, your clientshould feel that the network is slow for the reasons you state in your findings.Theclient doesn’t have to understand the details as you do, but the client should feelthat they at least have their finger on the pulse, thanks to your good reporting skills.
Solutions Fast Track
Reporting Fundamentals
! Create a report with a high amount of professionalism and care andmake it look professional.
www.syngress.com
219_sniffer_10.qxd 6/28/02 12:01 PM Page 509
510 Chapter 10 • Reporting
! Try hard to be as nontechnical as possible in your explanations of verydifficult topics. Make sure you get your point across, but be aware of thetechnical level of the crowd you are delivering to, and make sure theyunderstand the concepts covered in your report.
! Always put graphs and charts into your report as visual aids tounderstanding the problem.
! Keep this report secure and make sure the reports’ readers understand itssensitive nature.
Creating the Report Template
! Keep the report from 5 to 10 pages, including graphics and charts.
! At the beginning of the report, give a brief overview and an executivesummary of the problems you have found, including the basics of howand what you used to perform your analysis.
! Attach network diagrams, topology maps, and any other visual aids.
! The body of the report, which includes your detailed findings on eachproblem, should be concise and give a clear definition of the problems. Ifyou can, end with recommendations and possible solutions to theproblems based on your experience.
! Finalize the report with a summary and your technical suggestions.Never state biased opinions; it can hurt your credibility.You can,however, comment on past experiences with products or vendors if youare asked for your opinion.
Running and Exporting Reports
! Tools of the trade are critical in creating reports.You need a spreadsheetprogram to view .CSV files and you might find it easier to use a toolsuch as Snag It to get great screen shots.
! Remember that the Expert is the tool to aid and guide your analysis,never a definitive answer to the problem.
! You can run reports from the Matrix, Protocol Distribution, GlobalStatistics, and Host Table. Make sure you know that you cannot alwaysexport data; to do that, you must be in the right view within the decode.
www.syngress.com
219_sniffer_10.qxd 6/28/02 12:01 PM Page 510

Reporting • Chapter 10 511
Creating a Full Report:“Network Is Slow”
! Always start your report with an entire summary of your findings; neveradd solutions or opinions until you start to explain problems in greaterdetail later in the report. Keep the summary highly factual.
! If you do make a recommendation, don’t include your biased opinionson technology, because you never know who is in your audience.
! End your report with a topology map if needed. Never submit atopology map without thinking about who you are giving it to; if themap is too detailed, it could be a security hazard.
Q: In creating a report, what is the suggested length? How should I go about“sizing” the report for my client?
A: This all depends on what the client is asking for.The deliverables of the pro-ject should be decided up front before any work is done. If your client saysthe network is slow and it is your job to produce a solution and a report, youneed to detail your report so that the project is complete and the clientunderstands both the problem and the solution.
Q: I am looking to create a report on my findings at a client location.The clientis asking my opinion on whether a certain technology is better than another.What should I tell this client? Should I give my biased opinion, or should Ibe subjective?
A: As a technician, you should be able to see the good and bad in all technolo-gies and platforms.Always give a client your unbiased opinion (especially in adocumented report); never give information based on secondhand knowl-edge.You are the expert, you can give your expert opinion, but when you
www.syngress.com
Frequently Asked Questions
The following Frequently Asked Questions, answered by the authors of this book,are designed to both measure your understanding of the concepts presented in this chapter and to assist you with real-life implementation of these concepts. Tohave your questions about this chapter answered by the author, browse towww.syngress.com/solutions and click on the “Ask the Author” form.
219_sniffer_10.qxd 6/28/02 12:01 PM Page 511

512 Chapter 10 • Reporting
start badmouthing a vendor or manufacturer based on nonfactual data, youcould lose your credibility.
Q: When preparing a report, what is the best way to start it, to make the mostimpact on my clients or management?
A: Always start your report with an entire summary of your findings; never addsolutions or opinions until you start to explain problems in greater detail laterin the report. It is important that you really make an effort to keep to thefacts early in the report and expand into your solutions when you do low-level detailing on each problem you address.This approach gives the report asequential flow that the readers can follow and understand.
Q: What is one of the most common reasons for doing a report in the firstplace?
A: For one, your client might request it as part of a protocol analysis survey.Youcould also find it easier to deliver a solution to the client when they canunderstand what it is that you need to do. Other reasons include the fact thatyou are there to do analysis and provide a report of the problems so theclient’s onsite technicians can fix them.This is one of many reasons, but thereasons vary greatly and depend on the particulars of each project.
www.syngress.com
219_sniffer_10.qxd 6/28/02 12:01 PM Page 512

Detecting andPerforming SecurityBreaches withSniffer Pro
Solutions in this chapter:
■ Using Sniffer Pro to Find Holes in Your Network
■ Capturing Clear-Text Passwords
■ Attacks: Password Capture and Replay
■ Domain Name Service Vulnerabilities
■ Server Message Block Vulnerabilities
Chapter 11
513
! Summary
! Solutions Fast Track
! Frequently Asked Questions
219_sniffer_11.qxd 6/28/02 12:03 PM Page 513

514 Chapter 11 • Detecting and Performing Security Breaches with Sniffer Pro
IntroductionIf we were previously reading the Cadillac of books, we just jumped into aFerrari for a spin. In this chapter, we look at using Sniffer Pro with security inmind.This is not a chapter on hacking. Rather, this chapter shows you how tofind vulnerabilities in your own network. It discusses the importance of securityanalysts who have a working knowledge of the basic operations of Sniffer Pro orother similar protocol analyzers.
The first few sections cover issues inherent within IPv4 and how Sniffer Procan be used to exploit the protocol stack’s weakness.
NOTE
Using this technology for mischief is not recommended; such activitycould result in serious legal consequences.
Using Sniffer Pro to Find Holes in Your NetworkThe terrorist attacks of September 11, 2001, changed the focus of security for-ever. Many commentators have compared the events’ worldwide ramifications tothose of December 7, 1941.The resulting awareness of information security andprivacy has created new and demanding challenges for the network professional.
Today’s cyber marketplace does not offer a better addition to a conscientious“white hat” hacker’s arsenal than Sniffer Pro. Because Sniffer Pro is adept at ana-lyzing network and application problems, it is an effective tool in the detectionand prevention of network vulnerabilities.
One only need open morning newspapers to be made aware that threats fromthe Internet are escalating.The names of viruses,Trojans, and, worms—once rele-gated to the “techno-geek” realm—are now mainstream water-cooler conversa-tion. Code Red, Nimda, SirCam, Melissa, Lovebug—the list goes on and on.These names, now relegated to the past, should be of concern to the SnifferCertified Professional (SCP), whose challenges lie in defending against new andyet unnamed malware.
www.syngress.com
219_sniffer_11.qxd 6/28/02 12:03 PM Page 514

www.syngress.com
NOTE
A vast amount of information can be found on the Internet covering thesubjects of malware, viruses, and Trojans. Some good URLs with which tostart your research are www.sarc.com, www.sans.org, and www.cert.org.
In this chapter, we cover the complex subject of vulnerabilities.The military haslong been confronted with the detection and elimination, or at least the mitigation,of vulnerabilities and threats.The military terms used to describe the mechanics ofthese efforts have made their way into the information security world.We use someof these terms and define them in their information security sense.
Delivery and PayloadLet’s begin with two frequently used terms: delivery and payload.What do theymean? The military uses a nuclear missile for a delivery mechanism and a warheadfor the payload.This terminology actually means that the military is defining howa weapon gets to its destination (delivery) and what it delivers once it arrives (pay-load). Other examples might be a B-52 bomber as a delivery mechanism and a15,000-pound daisy-cutter bomb as a payload, or a 20-millimeter cannon as adelivery mechanism and its shell as a payload.
Delivery and payload are fairly simple concepts that can be easily applied toinformation warfare as well. For example, the SirCam virus’s delivery mechanismwas e-mail and its payload was a malware attachment.The Jill.c exploit by DarkSpyrit used an HTML Get request to deliver a buffer overflow payload.A finalexample is the Code Red worm, whose delivery mechanism was an InternetHTML connection and whose payload was a malformed request exploiting ahole in Microsoft’s Internet Information Server.We cover Code Red in moredetail later in this chapter, demonstrating how—using Sniffer Pro—we detectedits presence and mitigated the exploit.
Concerning delivery and payload, the preceding definition implies onedelivery mechanism and one payload.This is not always the case. Just as there arenuclear missiles with multiple warheads, the information warfare world has itsNimdas with multiple delivery techniques and payloads—exploiting e-mail,Internet Explorer browsers, and network shares, all at the same time. It is the jobof the security-minded SCP to constantly research and understand these con-cepts, in order to implement a defense by building and utilizing the various fil-tering capabilities of Sniffer Pro.
Detecting and Performing Security Breaches with Sniffer Pro • Chapter 11 515
219_sniffer_11.qxd 6/28/02 12:03 PM Page 515
516 Chapter 11 • Detecting and Performing Security Breaches with Sniffer Pro
Vulnerabilities in DetailWe begin our discussion of network vulnerabilities by examining three exploitsthat utilized the programming oversight known as a buffer overflow.This exploit,resulting from a failure to check the input to a function in a program, can cause asystem crash, allowing a hacker to have full control of your machine.The bufferoverflow is arguably the most common and notorious hacker technique in usetoday.
Code Red:The ExploitOn June 19, 2001, the CERT Advisory CA-2001-13 Buffer Overflow in IISIndexing Service DLL was released.As usual, it had very little impact on the infor-mation community and went relatively unnoticed by system admins. However,this small but costly programming oversight would prove to be only the begin-ning of what would become a billion-dollar exploit.
NOTE
The CERT Coordination Center (CERT/CC) is a center of Internet securityexpertise located at the Software Engineering Institute, a federallyfunded research and development center operated by Carnegie MellonUniversity.
The System Administration, Networking, and Security (SANS)Institute, founded in 1989, is a cooperative research and education orga-nization through which more than 156,000 security professionals, audi-tors, system administrators, and network administrators share thelessons they are learning and find solutions to the challenges they face.
Global Information Assurance Certification (GIAC) certification, spon-sored by SANS, provides assurance that a certified individual holds thelevel of knowledge and skill necessary for a practitioner in key areas ofinformation security.
The advisory stated that vulnerability existed in the indexing service used byMicrosoft IIS 4.0 and IIS 5.0 running on Windows NT,Windows 2000, and betaversions of Windows XP.This vulnerability allows a remote intruder to run arbi-trary code on the victim’s machine.The advisory description stated that there wasa remotely exploitable buffer overflow in one of the ISAPI extensions installedwith most versions of IIS 4.0 and 5.0.The specific Internet/indexing Service
www.syngress.com
219_sniffer_11.qxd 6/28/02 12:03 PM Page 516

Detecting and Performing Security Breaches with Sniffer Pro • Chapter 11 517
Application Programming Interface was IDQ.DLL.The vulnerability was discov-ered by eEye Digital Security.
On July 19, 2001, the CERT Advisory CA-2001-19 “Code Red”WormExploiting Buffer Overflow in Indexing Service DLL was released.The overviewstated that CERT/CC had received reports of a new self-propagating maliciouscode that exploits IIS systems susceptible to the vulnerability described in CERTAdvisory CA-2001-13 Buffer Overflow in Indexing Service DLL.The reportexplained that two variants of the Code Red worm had already affected morethan 250,000 servers. It was obvious that someone had found a use for the holein IIS. One of the specific uses for this exploit was a payload designed to generatea denial-of-service (DoS) attack on the White House Web server. Fortunately forthe president’s IT staff, the payload did not utilize the DNS service that maps(translates) a name to an IP address. Furthermore, it hardcoded the IP address inthe binary payload. It would prove to be a simple process to change the WhiteHouse Web server’s address in DNS, and that is precisely how the IT staff dealtwith the threat.
Code Red:The System FootprintIn order to detect this type of malicious activity, the SCP should study theexploit and carefully examine the system footprint when available. For thisexploit, the system footprint was provided by the advisory and stated that theCode Red worm activity can be identified on a machine by the presence of theentry in the Web server log files shown in Figure 11.1.
Figure 11.1 A Code Red Footprint
/default.ida?NNNNNNNNNNNNNNNNNNNNNNNNNNNNNNNNNNNNNNNNNNNNNNNNNNNNNNNNNNNNNNN
NNNNNNNNNNNNNNNNNNNNNNNN
NNNNNNNNNNNNNNNNNNNNNNNNNNNNNNNNNNNNNNNNNNNNNNNNNNNNNNNNNNNNNNNNNNNNNNNNNNNN
NNNNNNNNNNNNNNNNNNNNNNNN
NNNNNNNNNNN%u9090%u6858%ucbd3%u7801%u9090%u6805%ucbd3% u7801 etc.
The presence of the entry in the log does not necessarily indicate compro-mise. Rather, it indicates that a Code Red worm attempted to infect themachine.Armed with this knowledge and the old IP address of the White HouseWeb server, the security-minded SCP has the information necessary to detect thisexploit both coming and going.We accomplish this task by building a filter todetect the system footprint (coming) and the old IP address of the White House
www.syngress.com
219_sniffer_11.qxd 6/28/02 12:03 PM Page 517

518 Chapter 11 • Detecting and Performing Security Breaches with Sniffer Pro
Web server (going).The Sniffer Pro interface is placed on the ingress/egress tothe Internet.
NOTE
A system footprint is a group of characters or bytes of data that uniquelyidentify the payload as belonging to a specific exploit. In some cases, thesystem footprint is simply a group of characters, as in Code Red’sdefault.ida? NNNNNN (see Figure 11.1). In more complex payloads, thesystem footprint can be a string of binary data representing the actualcode. Some security professional refer to a system footprint as aSignature.
In Chapter 4, we go into greater detail about building filters to capture andview these exploits; here we briefly touch on configuring this filter.
Code Red:The FilterTo configure the Footprint filter:
1. Select Capture | Define Filter | Profiles | New.
2. Enter a name such as CodeRed (see Figure 11.2).
Next we will configure the Advanced tab:
1. Select OK | Done | Advanced tab.
2. Select the HTTP check box under TCP (see Figure 11.3).
3. Select OK.
4. Select Capture | Define Filter.
5. Select CodeRed from the Settings For: panel.
www.syngress.com
Figure 11.2 New Capture Profile
219_sniffer_11.qxd 6/28/02 12:03 PM Page 518
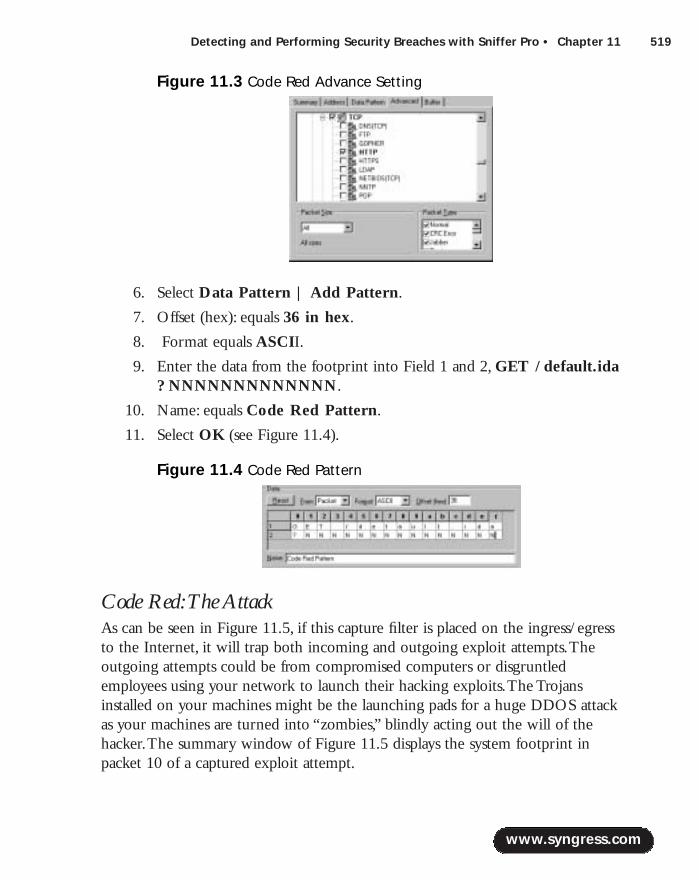
Detecting and Performing Security Breaches with Sniffer Pro • Chapter 11 519
6. Select Data Pattern | Add Pattern.
7. Offset (hex): equals 36 in hex.
8. Format equals ASCII.
9. Enter the data from the footprint into Field 1 and 2, GET /default.ida? NNNNNNNNNNNNN.
10. Name: equals Code Red Pattern.
11. Select OK (see Figure 11.4).
Code Red:The AttackAs can be seen in Figure 11.5, if this capture filter is placed on the ingress/egressto the Internet, it will trap both incoming and outgoing exploit attempts.Theoutgoing attempts could be from compromised computers or disgruntledemployees using your network to launch their hacking exploits.The Trojansinstalled on your machines might be the launching pads for a huge DDOS attackas your machines are turned into “zombies,” blindly acting out the will of thehacker.The summary window of Figure 11.5 displays the system footprint inpacket 10 of a captured exploit attempt.
www.syngress.com
Figure 11.3 Code Red Advance Setting
Figure 11.4 Code Red Pattern
219_sniffer_11.qxd 6/28/02 12:03 PM Page 519
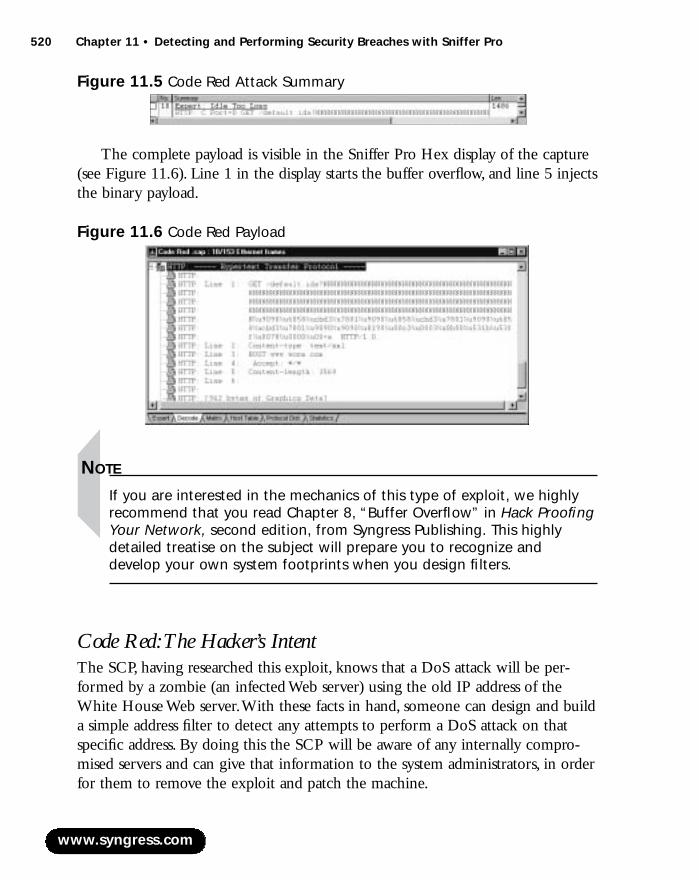
520 Chapter 11 • Detecting and Performing Security Breaches with Sniffer Pro
The complete payload is visible in the Sniffer Pro Hex display of the capture(see Figure 11.6). Line 1 in the display starts the buffer overflow, and line 5 injectsthe binary payload.
NOTE
If you are interested in the mechanics of this type of exploit, we highlyrecommend that you read Chapter 8, “Buffer Overflow” in Hack ProofingYour Network, second edition, from Syngress Publishing. This highlydetailed treatise on the subject will prepare you to recognize anddevelop your own system footprints when you design filters.
Code Red:The Hacker’s IntentThe SCP, having researched this exploit, knows that a DoS attack will be per-formed by a zombie (an infected Web server) using the old IP address of theWhite House Web server.With these facts in hand, someone can design and builda simple address filter to detect any attempts to perform a DoS attack on thatspecific address. By doing this the SCP will be aware of any internally compro-mised servers and can give that information to the system administrators, in orderfor them to remove the exploit and patch the machine.
www.syngress.com
Figure 11.5 Code Red Attack Summary
Figure 11.6 Code Red Payload
219_sniffer_11.qxd 6/28/02 12:03 PM Page 520

Detecting and Performing Security Breaches with Sniffer Pro • Chapter 11 521
The following is an excerpt from the payload of the Code Red .ida worm.The analysis was performed by Ryan Permeh and Marc Maiffret of eEye DigitalSecurity.A disassembly (complete with comments) was done by Ryan “ShellcodeNinja” Permeh.The attack consists of the infected system sending 100k bytes ofdata (1 byte at a time + 40 bytes overheard for the actually TCP/IP packet) toport 80 of www.whitehouse.gov.This flood of data (410 megabytes of data everyfour and a half hours per instance of the worm) would potentially amount to aDoS attack against www.whitehouse.gov.
The assembly code in Figure 11.7 contains the White House IP address.Theaddress (5BF089C6) is displayed in line 2.The entry is in hexadecimal notationand in reverse order.When the order is reversed, the value becomes C6 89 F0 5Bin hex. Using Microsoft Windows’ calculator in scientific mode, the SCP canverify this address by converting the entry to decimal.The address decodes to C6=198, 89 = 137, F0 =240, 5B =91. Next, reassemble the four numbers, addingperiods between the numbers, and it equals 198.137.240.91—the old IP address.The www.whitehouse.gov address was changed to 198.137.240.92 shortly afterthe first attack.
Figure 11.7 White House Socket Setup
Seg000:000008EB C7 85 80 FE FF+ mov dword ptr[ebp-180h]
5BF089C6h ; set ip (www.whitehouse.gov)
Code Red:The White House FilterTo configure the filter:
1. Select Capture | Define Filter | Profiles | New.
2. Enter a filter name such as WhiteHouse.
3. Select OK | Done | Advanced.
4. Under TCP, select the HTTP check box (see Figure 11.8).
5. Select the Address tab.
6. Enter the White House address 198.137.240.91 to Any (see Figure 11.9).
Next we place Sniffer Pro on the egress of the network with the capturefilter selected. Figure 11.10 is a display of three captured packets from an infectedhost attempting to perform a DoS attack on the old White House IP address.
www.syngress.com
219_sniffer_11.qxd 6/28/02 12:03 PM Page 521

522 Chapter 11 • Detecting and Performing Security Breaches with Sniffer Pro
Using the information obtained from the capture filter, the system adminis-trator can be alerted to the existence of any compromised computers on his orher network. Using the IP addresses, the machines can be removed from the net-work and patched or reloaded as necessary.Without this filter, the administratorwould be unaware of the clandestine transmissions leaving the network and pos-sibly subject to downstream litigation.
Code Red II:The ExploitOn August 4, 2001, a variant of Code Red, dubbed Code Red II, or CR-II, wasdiscovered. It was named Code Red II because the delivery mechanism was thesame as Code Red, exploiting the buffer overflow fault in IIS Web servers.
www.syngress.com
Figure 11.8 Advanced Window
Figure 11.9 White House IP Address Selection
Figure 11.10 DoS on the White House
219_sniffer_11.qxd 6/28/02 12:03 PM Page 522
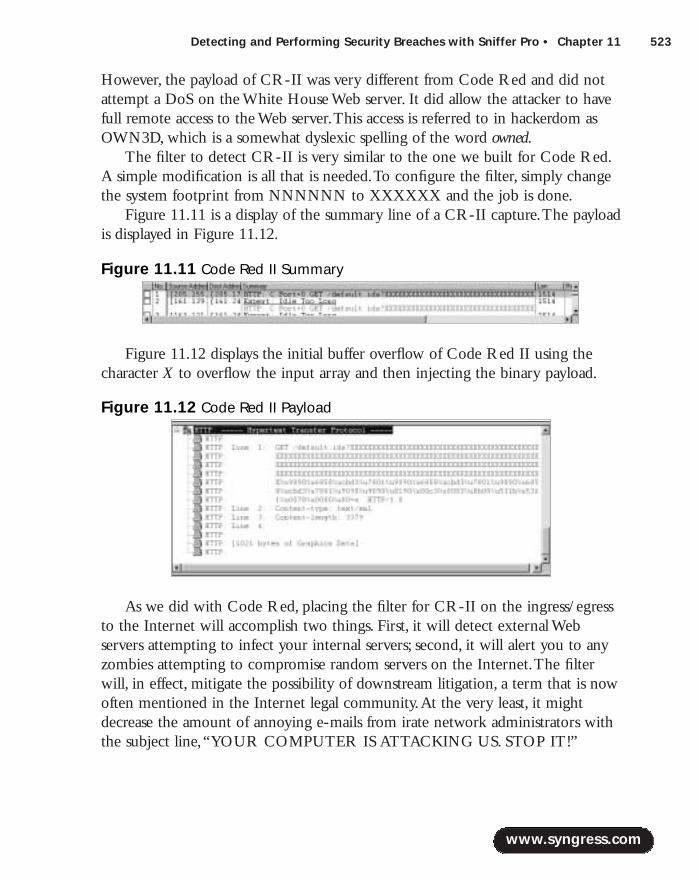
Detecting and Performing Security Breaches with Sniffer Pro • Chapter 11 523
However, the payload of CR-II was very different from Code Red and did notattempt a DoS on the White House Web server. It did allow the attacker to havefull remote access to the Web server.This access is referred to in hackerdom asOWN3D, which is a somewhat dyslexic spelling of the word owned.
The filter to detect CR-II is very similar to the one we built for Code Red.A simple modification is all that is needed.To configure the filter, simply changethe system footprint from NNNNNN to XXXXXX and the job is done.
Figure 11.11 is a display of the summary line of a CR-II capture.The payloadis displayed in Figure 11.12.
Figure 11.12 displays the initial buffer overflow of Code Red II using thecharacter X to overflow the input array and then injecting the binary payload.
As we did with Code Red, placing the filter for CR-II on the ingress/egressto the Internet will accomplish two things. First, it will detect external Webservers attempting to infect your internal servers; second, it will alert you to anyzombies attempting to compromise random servers on the Internet.The filterwill, in effect, mitigate the possibility of downstream litigation, a term that is nowoften mentioned in the Internet legal community.At the very least, it mightdecrease the amount of annoying e-mails from irate network administrators withthe subject line,“YOUR COMPUTER IS ATTACKING US. STOP IT!”
www.syngress.com
Figure 11.11 Code Red II Summary
Figure 11.12 Code Red II Payload
219_sniffer_11.qxd 6/28/02 12:03 PM Page 523
524 Chapter 11 • Detecting and Performing Security Breaches with Sniffer Pro
Nimda:The ExploitIn September 2001, an industrious hacker or hackers, not desirous of reinventingthe wheel (or the exploit), developed what would become one of the most dev-astating Internet worms to date. Said hacker(s) simply bundled together some ofthe better current exploits and added a few new ones.The resulting exploitwould soon be known around the globe as Nimda.
On September 18, 2001, an advisory describing the third in a related groupof exploits was posted on the CERT.org site.At that time, no one knew thisexploit would cost over a billion dollars to clean up.The CERT Advisory CA-2001-26 Nimda Worm overview stated that CERT had received reports of a newmalicious code known as the W32/Nimda worm.This new worm appeared tospread by multiple delivery mechanisms:
■ Client to client via e-mail
■ Client to client via network shares
■ From Web server to client via browsing of compromised Web sites
■ Client to Web server via active scanning for and exploitation of variousIIS 4.0/5.0 directory traversal vulnerabilities
■ Client to Web server via scanning for the back doors left by the CodeRed II and sadmind/IIS worms
Talk about a Swiss army knife of exploits! This one raised the bar on the artof hacking and created a new awareness in security never before seen in govern-ment or the corporate information world. So War Games could actually happen?The apprehension and paranoia experienced by most system administrators wasto be proven justified in the days to come.
Nimda:The System FootprintThe system footprint described in the CERT advisory read more like a dictio-nary of exploits than a footprint or signature.The following are just a fewexploits delivered in its payload.
GET /scripts/root.exe?/c+dir
GET /c/winnt/system32/cmd.exe?/c+dir
GET /d/ winnt/system32/cmd.exe?/c+dir
GET /scripts/..%5c../..%5c../winnt/system32/cmd.exe?/c+dir
GET /_mem_bin/..%5c….%5c../winnt/system32/cmd.exe?/c+dir
GET /_vti_bin/..%5c….%5c../winnt/system32/cmd.exe?/c+dir
www.syngress.com
219_sniffer_11.qxd 6/28/02 12:03 PM Page 524
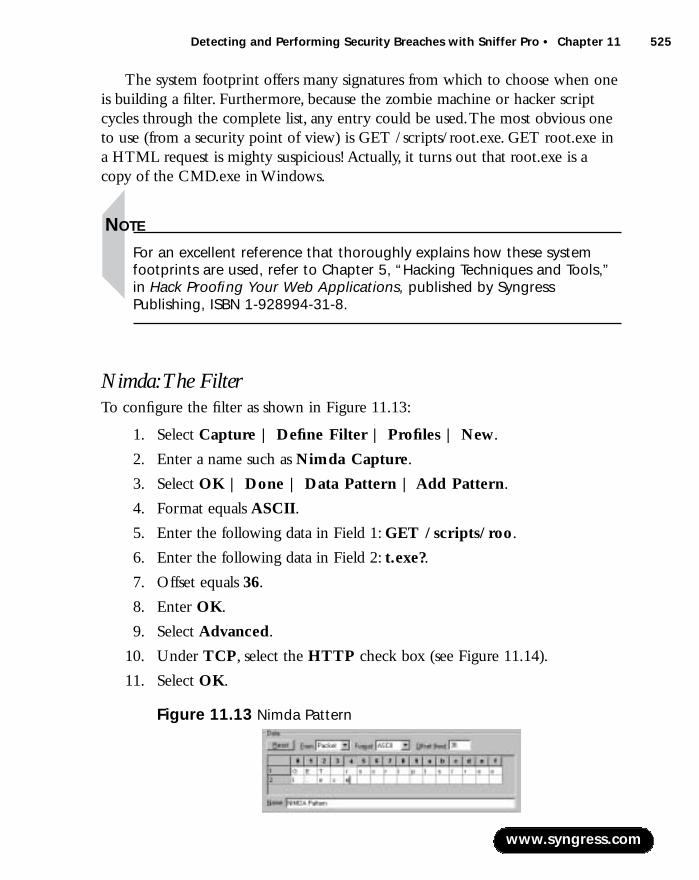
Detecting and Performing Security Breaches with Sniffer Pro • Chapter 11 525
The system footprint offers many signatures from which to choose when oneis building a filter. Furthermore, because the zombie machine or hacker scriptcycles through the complete list, any entry could be used.The most obvious oneto use (from a security point of view) is GET /scripts/root.exe. GET root.exe ina HTML request is mighty suspicious! Actually, it turns out that root.exe is acopy of the CMD.exe in Windows.
NOTE
For an excellent reference that thoroughly explains how these systemfootprints are used, refer to Chapter 5, “Hacking Techniques and Tools,”in Hack Proofing Your Web Applications, published by SyngressPublishing, ISBN 1-928994-31-8.
Nimda:The FilterTo configure the filter as shown in Figure 11.13:
1. Select Capture | Define Filter | Profiles | New.
2. Enter a name such as Nimda Capture.
3. Select OK | Done | Data Pattern | Add Pattern.
4. Format equals ASCII.
5. Enter the following data in Field 1: GET /scripts/roo.
6. Enter the following data in Field 2: t.exe?.
7. Offset equals 36.
8. Enter OK.
9. Select Advanced.
10. Under TCP, select the HTTP check box (see Figure 11.14).
11. Select OK.
www.syngress.com
Figure 11.13 Nimda Pattern
219_sniffer_11.qxd 6/28/02 12:03 PM Page 525
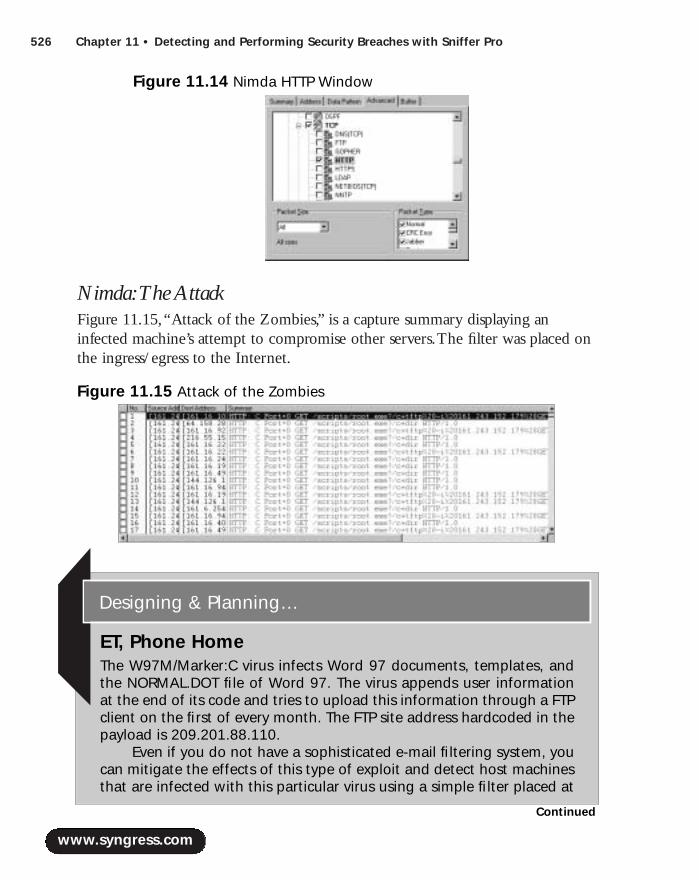
526 Chapter 11 • Detecting and Performing Security Breaches with Sniffer Pro
Nimda:The AttackFigure 11.15,“Attack of the Zombies,” is a capture summary displaying aninfected machine’s attempt to compromise other servers.The filter was placed onthe ingress/egress to the Internet.
www.syngress.com
Figure 11.14 Nimda HTTP Window
Figure 11.15 Attack of the Zombies
ET, Phone HomeThe W97M/Marker:C virus infects Word 97 documents, templates, andthe NORMAL.DOT file of Word 97. The virus appends user informationat the end of its code and tries to upload this information through a FTPclient on the first of every month. The FTP site address hardcoded in thepayload is 209.201.88.110.
Even if you do not have a sophisticated e-mail filtering system, youcan mitigate the effects of this type of exploit and detect host machinesthat are infected with this particular virus using a simple filter placed at
Designing & Planning…
Continued
219_sniffer_11.qxd 6/28/02 12:03 PM Page 526

Detecting and Performing Security Breaches with Sniffer Pro • Chapter 11 527
Capturing Clear-Text PasswordsFrom your grade school and kindergarten days, building and defending dirt fortsor constructing secret club houses, you have been exposed to passwords.“What’sthe password?” is a familiar phrase to us all.What is that magic key that grantsyou entrance into a private world of your own? It is that special word that youand only you know.
This section deals with one of the most basic security implementations: thepassword and its associated vulnerabilities. Chances are, if you purchased this bookonline, you were required to use a password.You might have had to use a pass-word to gain access to your local computer or to send e-mail.The examples ofpassword usage are so numerous that we need not belabor the point.As an SCP,you need to ask the following questions about passwords:
■ How secure are these secret magic keys to the kingdom?
■ What can we do to help prevent passwords from being compromised?
IPv4 and Clear-Text Transfer of InformationIPv4 packets are unencrypted by default. By nature of their functionality, theheader must be able to be read and updated by routers and gateways along a trans-mission path from source to destination.The time to live (TTL) field needs to bedecremented, and the Media Access Control (MAC), or hardware address, will
www.syngress.com
the ingress/egress to your Internet connection. The filter configurationwould include the FTP protocol from the Advanced tab and the IPaddress of 209.201.88.110 to Any from the Address tab. The displayresulting from the implementation of this filter is shown in Figure 11.16.
Packets 1 through 3 in Figure 11.16 are initial FTP SYN requests tothe hacker’s site. The FTP site could be any site that allows anonymouslogons. Hackers store their tool kits and messages on any site that isavailable, including government sites. After detecting this packet, theSCP could inform the system administrator about the existence of thecompromised host by providing the IP source address.
Figure 11.16 W97M/Marker:C FTP Attempt
219_sniffer_11.qxd 6/28/02 12:03 PM Page 527
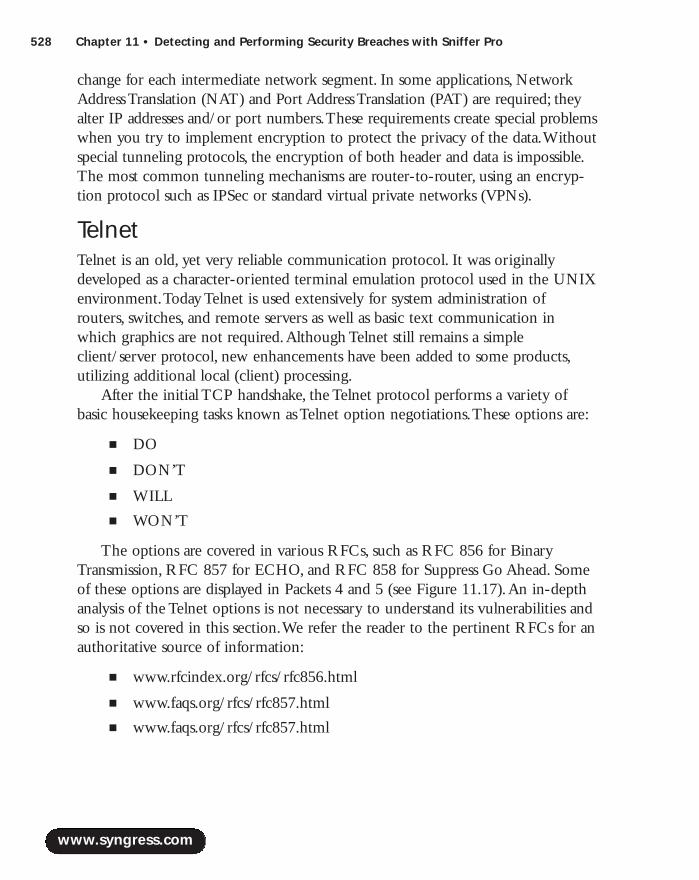
528 Chapter 11 • Detecting and Performing Security Breaches with Sniffer Pro
change for each intermediate network segment. In some applications, NetworkAddress Translation (NAT) and Port Address Translation (PAT) are required; theyalter IP addresses and/or port numbers.These requirements create special problemswhen you try to implement encryption to protect the privacy of the data.Withoutspecial tunneling protocols, the encryption of both header and data is impossible.The most common tunneling mechanisms are router-to-router, using an encryp-tion protocol such as IPSec or standard virtual private networks (VPNs).
TelnetTelnet is an old, yet very reliable communication protocol. It was originallydeveloped as a character-oriented terminal emulation protocol used in the UNIXenvironment.Today Telnet is used extensively for system administration ofrouters, switches, and remote servers as well as basic text communication inwhich graphics are not required.Although Telnet still remains a simpleclient/server protocol, new enhancements have been added to some products,utilizing additional local (client) processing.
After the initial TCP handshake, the Telnet protocol performs a variety ofbasic housekeeping tasks known as Telnet option negotiations.These options are:
■ DO
■ DON’T
■ WILL
■ WON’T
The options are covered in various RFCs, such as RFC 856 for BinaryTransmission, RFC 857 for ECHO, and RFC 858 for Suppress Go Ahead. Someof these options are displayed in Packets 4 and 5 (see Figure 11.17).An in-depthanalysis of the Telnet options is not necessary to understand its vulnerabilities andso is not covered in this section.We refer the reader to the pertinent RFCs for anauthoritative source of information:
■ www.rfcindex.org/rfcs/rfc856.html
■ www.faqs.org/rfcs/rfc857.html
■ www.faqs.org/rfcs/rfc857.html
www.syngress.com
219_sniffer_11.qxd 6/28/02 12:03 PM Page 528

Detecting and Performing Security Breaches with Sniffer Pro • Chapter 11 529
Telnet EchoOne of the first observations a SCP makes in examining a Sniffer Pro trace of aTelnet session is that it seems to be repeating itself (see Figure 11.18).This obser-vation is correct—it does repeat itself. More accurately, the server echoes thecharacters back to the client. In the original implementation, the keyboard outputwas sent to the server and not displayed on the screen. It was the server’s respon-sibility to format and display the characters on the monitor. Each transmissionincludes a one-character payload.This makes Telnet an inefficient protocol fortransmission of large amounts of data.As we know, in today’s computers the char-acters are usually displayed by the local client’s machine, and the server isinstructed to “Not echo.”There is often a feature on the client for turning echoon and off whereby you can control it. However, echo is not a desired setting,because it produces two characters on your screen.
www.syngress.com
Figure 11.17 Telnet Option Negotiation
Figure 11.18 Telnet Login
219_sniffer_11.qxd 6/28/02 12:03 PM Page 529
530 Chapter 11 • Detecting and Performing Security Breaches with Sniffer Pro
Second, the security-minded SCP will immediately observe that the transmis-sion is in clear and readable text.This is a gaping security hole in the Telnet pro-tocol. For the would-be hacker, the transmission readily answers the question,“What’s the password?” If you refer to Figure 11.18, starting at packet 42, youwill see the word password. Packet 44 contains the letter r. Packets 46 through 54contain the remaining letters of the password, redhat, in clear unencrypted text.This is precisely the information a hacker needs to compromise the server.
The Telnet protocol uses destination port 23 to communicate. Hackers use atechnique called reconnaissance probing to determine if your server is listening onport 23.Any scanner (such as Nmap or Snake) is ideal for this purpose.Obviously, a simple Telnet request from the command line of a host directed to aspecific server will accomplish the same thing. However, the fact that a server islistening on port 23 more often results from reconnaissance information gatheredduring a complete scan for network vulnerabilities.
NOTE
You can determine if your server is listening on port 23 using the com-mand-line utility netstat –n.
If the hacker does not have the ability to sniff your local network for Telnettraffic and passwords but knows you are running a Telnet server, he or she canattempt to connect to the server and guess the login/password pair.This processcan be automated using a simple repetitive script.
If you have reason to suspect this type of malicious activity, you can build aSniffer Pro filter to detect failed logins. Placed on the ingress/egress of your net-work, this filter will alert you to password-cracking attempts on all Telnet serversin your network.The filter will produce a minimal amount of false positives, suchas typos, by legitimate users.
The Telnet Login FilterTo configure the Data Capture window to trap the text pattern Login incorrect,perform the following (see Figure 11.19):
1. Select Capture | Define Filter | Profiles | New.
2. Enter a name such as Telnet: Login error.
3. Select OK | Done | Data Pattern | Add Pattern.
www.syngress.com
219_sniffer_11.qxd 6/28/02 12:03 PM Page 530

Detecting and Performing Security Breaches with Sniffer Pro • Chapter 11 531
4. Offset (hex): equals 36 in hex.
5. Format equals ASCII.
6. Enter the following data in Field 1:Login incorrect.
7. Enter Telnet: Login error in the Name field.
8. Enter OK.
The Boolean of Figure 11.20 performs an AND operation on every packet. Ifa packet is a valid packet ANDed with the ASCII pattern “Login incorrect” atoffset 36, Sniffer Pro will detect and trap it.We can optimize this filter’s efficiencyby adding another criterion to the Boolean operation. Let’s use the Advance tabto restrict the packet inspection to Telnet port 23 packets only.
To complete the Telnet login filter configuration (see Figure 11.21):
1. Select the Advanced tab.
2. Scroll down and select the Telnet check box.
3. Select OK.
The results of this filter’s implementation can be seen in Figure 11.22. It isclear that the machine with IP address 161.243.60.37 is under a password-hacking attack by the computer with IP address 161.243.60.5.
www.syngress.com
Figure 11.19 The Data Capture Window
Figure 11.20 Boolean Search Order
219_sniffer_11.qxd 6/28/02 12:03 PM Page 531
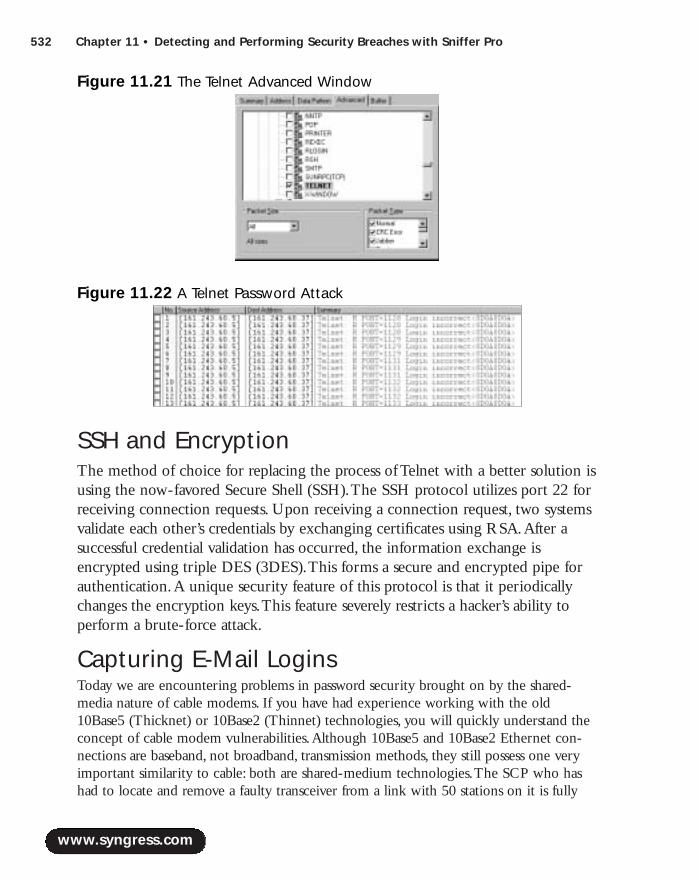
532 Chapter 11 • Detecting and Performing Security Breaches with Sniffer Pro
SSH and EncryptionThe method of choice for replacing the process of Telnet with a better solution isusing the now-favored Secure Shell (SSH).The SSH protocol utilizes port 22 forreceiving connection requests. Upon receiving a connection request, two systemsvalidate each other’s credentials by exchanging certificates using RSA.After asuccessful credential validation has occurred, the information exchange isencrypted using triple DES (3DES).This forms a secure and encrypted pipe forauthentication.A unique security feature of this protocol is that it periodicallychanges the encryption keys.This feature severely restricts a hacker’s ability toperform a brute-force attack.
Capturing E-Mail LoginsToday we are encountering problems in password security brought on by the shared-media nature of cable modems. If you have had experience working with the old10Base5 (Thicknet) or 10Base2 (Thinnet) technologies, you will quickly understand theconcept of cable modem vulnerabilities.Although 10Base5 and 10Base2 Ethernet con-nections are baseband, not broadband, transmission methods, they still possess one veryimportant similarity to cable: both are shared-medium technologies.The SCP who hashad to locate and remove a faulty transceiver from a link with 50 stations on it is fully
www.syngress.com
Figure 11.21 The Telnet Advanced Window
Figure 11.22 A Telnet Password Attack
219_sniffer_11.qxd 6/28/02 12:03 PM Page 532
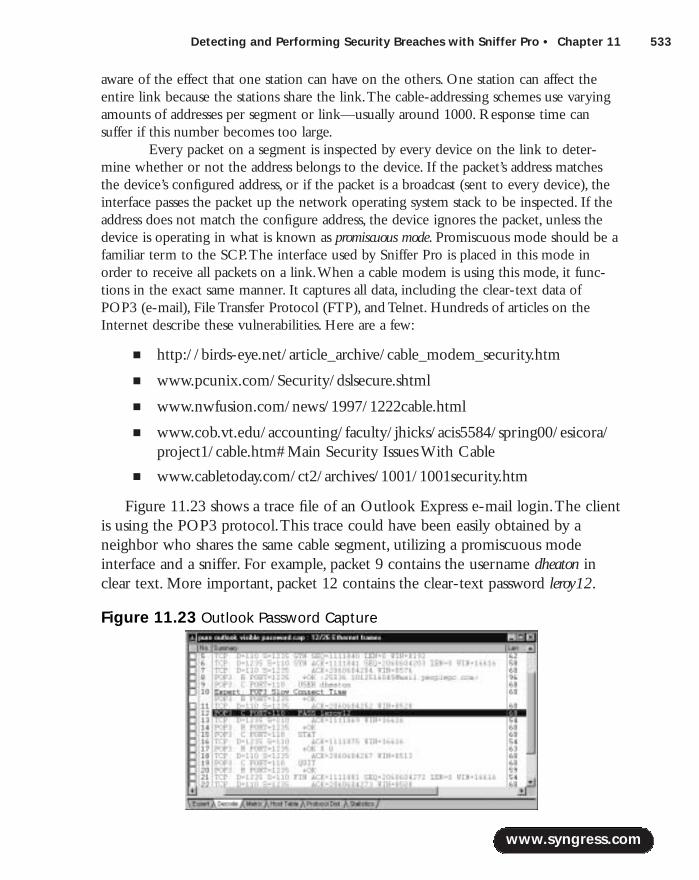
Detecting and Performing Security Breaches with Sniffer Pro • Chapter 11 533
aware of the effect that one station can have on the others. One station can affect theentire link because the stations share the link.The cable-addressing schemes use varyingamounts of addresses per segment or link—usually around 1000. Response time cansuffer if this number becomes too large.
Every packet on a segment is inspected by every device on the link to deter-mine whether or not the address belongs to the device. If the packet’s address matchesthe device’s configured address, or if the packet is a broadcast (sent to every device), theinterface passes the packet up the network operating system stack to be inspected. If theaddress does not match the configure address, the device ignores the packet, unless thedevice is operating in what is known as promiscuous mode. Promiscuous mode should be afamiliar term to the SCP.The interface used by Sniffer Pro is placed in this mode inorder to receive all packets on a link.When a cable modem is using this mode, it func-tions in the exact same manner. It captures all data, including the clear-text data ofPOP3 (e-mail), File Transfer Protocol (FTP), and Telnet. Hundreds of articles on theInternet describe these vulnerabilities. Here are a few:
■ http://birds-eye.net/article_archive/cable_modem_security.htm
■ www.pcunix.com/Security/dslsecure.shtml
■ www.nwfusion.com/news/1997/1222cable.html
■ www.cob.vt.edu/accounting/faculty/jhicks/acis5584/spring00/esicora/project1/cable.htm#Main Security Issues With Cable
■ www.cabletoday.com/ct2/archives/1001/1001security.htm
Figure 11.23 shows a trace file of an Outlook Express e-mail login.The clientis using the POP3 protocol.This trace could have been easily obtained by aneighbor who shares the same cable segment, utilizing a promiscuous modeinterface and a sniffer. For example, packet 9 contains the username dheaton inclear text. More important, packet 12 contains the clear-text password leroy12.
www.syngress.com
Figure 11.23 Outlook Password Capture
219_sniffer_11.qxd 6/28/02 12:03 PM Page 533
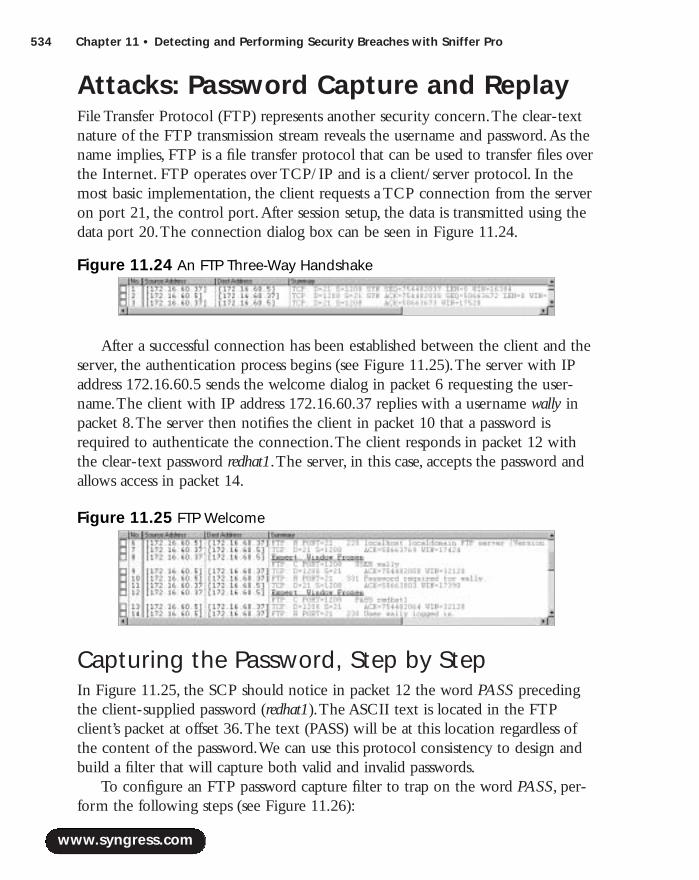
534 Chapter 11 • Detecting and Performing Security Breaches with Sniffer Pro
Attacks: Password Capture and ReplayFile Transfer Protocol (FTP) represents another security concern.The clear-textnature of the FTP transmission stream reveals the username and password.As thename implies, FTP is a file transfer protocol that can be used to transfer files overthe Internet. FTP operates over TCP/IP and is a client/server protocol. In themost basic implementation, the client requests a TCP connection from the serveron port 21, the control port.After session setup, the data is transmitted using thedata port 20.The connection dialog box can be seen in Figure 11.24.
After a successful connection has been established between the client and theserver, the authentication process begins (see Figure 11.25).The server with IPaddress 172.16.60.5 sends the welcome dialog in packet 6 requesting the user-name.The client with IP address 172.16.60.37 replies with a username wally inpacket 8.The server then notifies the client in packet 10 that a password isrequired to authenticate the connection.The client responds in packet 12 withthe clear-text password redhat1.The server, in this case, accepts the password andallows access in packet 14.
Capturing the Password, Step by StepIn Figure 11.25, the SCP should notice in packet 12 the word PASS precedingthe client-supplied password (redhat1).The ASCII text is located in the FTPclient’s packet at offset 36.The text (PASS) will be at this location regardless ofthe content of the password.We can use this protocol consistency to design andbuild a filter that will capture both valid and invalid passwords.
To configure an FTP password capture filter to trap on the word PASS, per-form the following steps (see Figure 11.26):
www.syngress.com
Figure 11.24 An FTP Three-Way Handshake
Figure 11.25 FTP Welcome
219_sniffer_11.qxd 6/28/02 12:03 PM Page 534
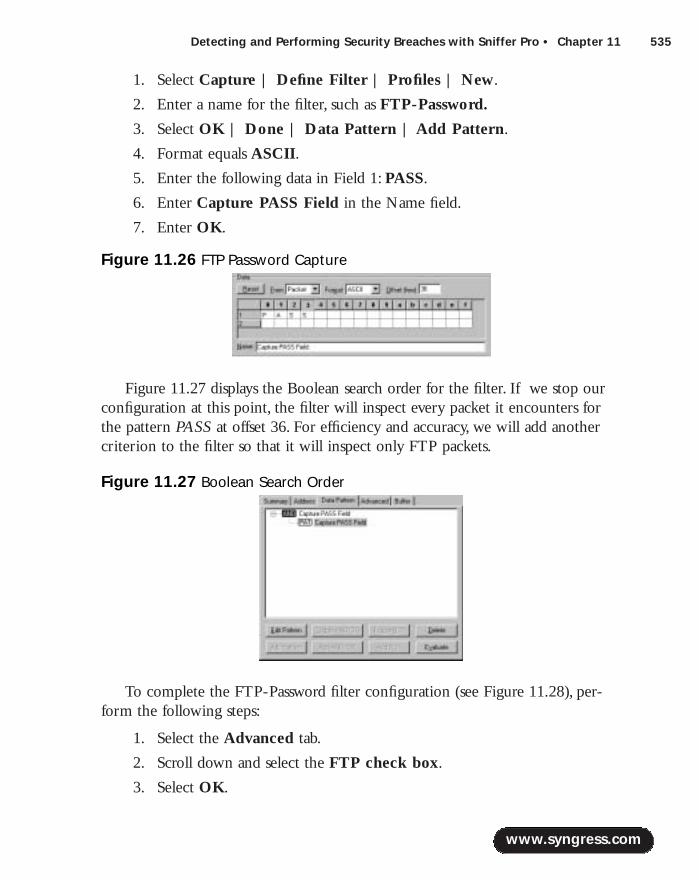
Detecting and Performing Security Breaches with Sniffer Pro • Chapter 11 535
1. Select Capture | Define Filter | Profiles | New.
2. Enter a name for the filter, such as FTP-Password.
3. Select OK | Done | Data Pattern | Add Pattern.
4. Format equals ASCII.
5. Enter the following data in Field 1: PASS.
6. Enter Capture PASS Field in the Name field.
7. Enter OK.
Figure 11.27 displays the Boolean search order for the filter. If we stop ourconfiguration at this point, the filter will inspect every packet it encounters forthe pattern PASS at offset 36. For efficiency and accuracy, we will add anothercriterion to the filter so that it will inspect only FTP packets.
To complete the FTP-Password filter configuration (see Figure 11.28), per-form the following steps:
1. Select the Advanced tab.
2. Scroll down and select the FTP check box.
3. Select OK.
www.syngress.com
Figure 11.26 FTP Password Capture
Figure 11.27 Boolean Search Order
219_sniffer_11.qxd 6/28/02 12:03 PM Page 535

536 Chapter 11 • Detecting and Performing Security Breaches with Sniffer Pro
Replaying the PasswordThe FTP-Password filter we have designed can be used to capture a single pass-word. For some applications, this could be all that is required. Figure 11.29 is acapture display resulting from the use of this filter.The captured data containsone packet displaying the password redhat1.
FTP Password GuessingThe SCP can use the FTP-Password filter very effectively to detect an attempt tocompromise an FTP server. In this situation, there would be many attempts toguess the password, possibly using a brute-force script.The script would repeat-edly try passwords from a password dictionary.The SCP would need to capturemany attempts and look for a common IP address.To do this, we use the SnifferPro trigger function.
To configure the trigger using our FTP-Password capture filter:
1. Select Capture | Trigger Setup.The Trigger Setup Window will bedisplayed (see Figure 11.30).
2. Select the Enable check box under the Stop Trigger (see Figure 11.31).
3. Select Define under the Stop Trigger heading (see Figure 11.32).
www.syngress.com
Figure 11.28 The Advanced Filter Window
Figure 11.29 A Clear-Text Password
219_sniffer_11.qxd 6/28/02 12:03 PM Page 536
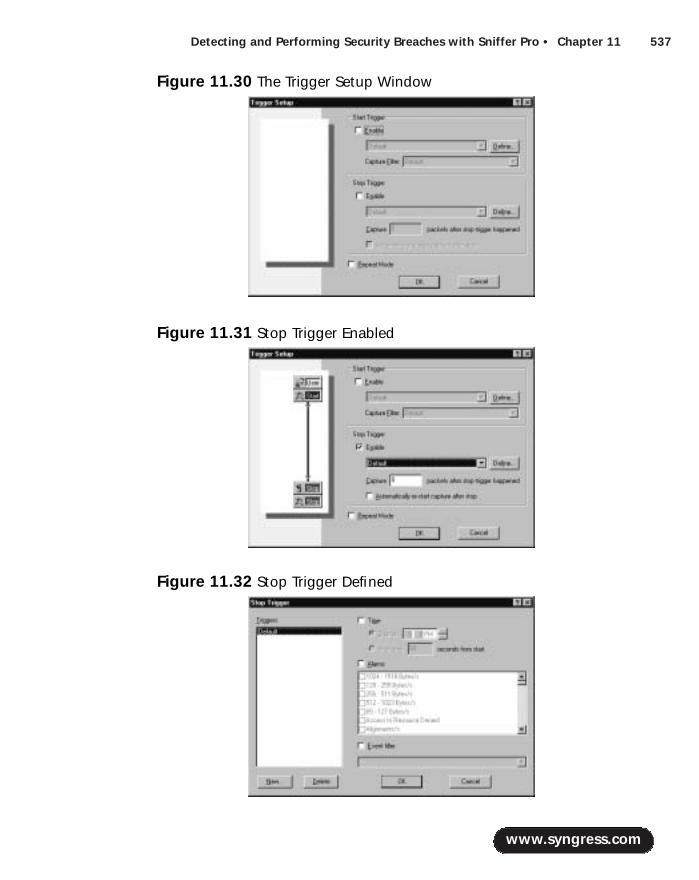
Detecting and Performing Security Breaches with Sniffer Pro • Chapter 11 537
www.syngress.com
Figure 11.30 The Trigger Setup Window
Figure 11.31 Stop Trigger Enabled
Figure 11.32 Stop Trigger Defined
219_sniffer_11.qxd 6/28/02 12:03 PM Page 537
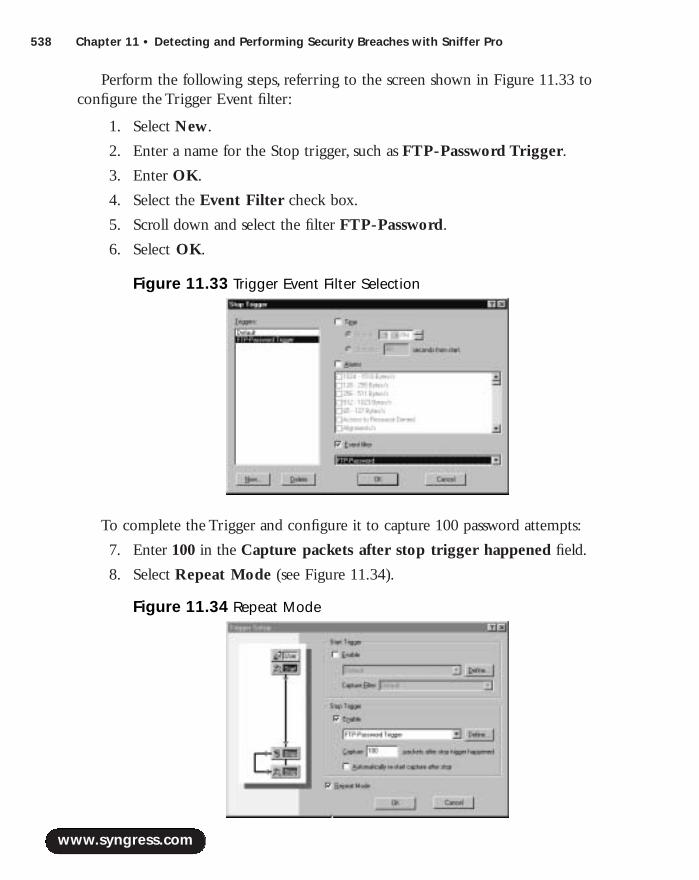
538 Chapter 11 • Detecting and Performing Security Breaches with Sniffer Pro
Perform the following steps, referring to the screen shown in Figure 11.33 toconfigure the Trigger Event filter:
1. Select New.
2. Enter a name for the Stop trigger, such as FTP-Password Trigger.
3. Enter OK.
4. Select the Event Filter check box.
5. Scroll down and select the filter FTP-Password.
6. Select OK.
To complete the Trigger and configure it to capture 100 password attempts:
7. Enter 100 in the Capture packets after stop trigger happened field.
8. Select Repeat Mode (see Figure 11.34).
www.syngress.com
Figure 11.33 Trigger Event Filter Selection
Figure 11.34 Repeat Mode
219_sniffer_11.qxd 6/28/02 12:03 PM Page 538

Detecting and Performing Security Breaches with Sniffer Pro • Chapter 11 539
The Trigger/Filter combination can be adjusted to detect as many password-guessing attempts as desired.As shown in Figure 11.35, the user/client machinewith IP address 172.16.60.37 is trying to guess the FTP password for the serverwith IP address 172.16.60.5.
Simple Network Management ProtocolSimple Network Management Protocol (SNMP), developed in the late 1980s, hasbecome a standard for network management. SNMP is a client/server modelwith a Network Management Station (NMS) that functions as a client queryingan agent that contains a Management Information Base (MIB) database.The mostcommon implementation utilizes a management console to perform NMS func-tions and agents running on routers, hubs, bridges, and network servers.Theseagents respond to queries, collect information, and send traps to the console fordisplay (see Figure 11.36).
The management information stored in the MIB on each agent is vendorspecific. Each manufacturer provides a standard MIB and proprietary extensionsfor its products.An MIB is a collection of managed objects. Each agent (routers,switches, and the like) in Figure 11.36 contains an MIB of managed objects.
www.syngress.com
Figure 11.35 Password Guessing
Figure 11.36 SNMP Network Topology
NETWORK
NetworkManagement
Station
Graphical DisplayNetwork
Server Agent
HUB Agent
Router Agent
Switch Agent
BRIDGE Agent
219_sniffer_11.qxd 6/28/02 12:03 PM Page 539

540 Chapter 11 • Detecting and Performing Security Breaches with Sniffer Pro
Each management object is represented by an object ID (OID).The OID isrepresented by a group of numbers separated by periods (.) defining the object’sposition in the MIB object tree.Without going into greater detail, suffice it to saythat each OID is unique and is used to define a name, metric, or physical condi-tion of a device. For example, a Cisco router OID would be 1.3.6.1.4.1.9.1.1; asysDescr OID would be 1.3.6.1.2.1.1.1.0. Each SNMP managed object belongsto a community defined by a community name.
At the time of this writing, there are three versions of SNMP:
■ SNMPv1 This version uses private and public community strings forsecurity. It has five main operations: Get, Set, GetNext, Response, andTrap (RFC 1155, 1157, 1212).
■ SNMPv2 This version has the new operation GetBulk and better secu-rity, remote configuration in IETF draft (RFC 1441–1452).
■ SNMPv3 This version includes additional strong security and authenti-cation model and remote agent configuration (RFC 2271–2275).
From a security point of view, SNMP’s authentication method is inadequateto prevent the system from being compromised. In Figure 11.37, which shows anSNMP community string, line 3 displays the clear-text community string public.This is a type of default pseudo password, if you will, and can be read by any net-work analysis tool on the market. Hence, it creates a gaping security hole that isjust waiting to be exploited.The default community string for read-only access ispublic, and the default community string for read/write access is private.As shownin line 2, the packet is a capture of SNMP version 1 (SNMPv1).
Altering SNMP control information can render your network useless. In fact,as we shall see, it could potentially have devastating effects on the entire Internet.
On February 12, 2002, CERT Advisory CA-2002-03 was issued, announcingthat there were multiple vulnerabilities in many implementations of SNMP.Tonetwork security professionals, the advisory heading read more like an overused
www.syngress.com
Figure 11.37 SNMP Community String
219_sniffer_11.qxd 6/28/02 12:03 PM Page 540
Detecting and Performing Security Breaches with Sniffer Pro • Chapter 11 541
item on a security conference agenda than current news of a new exploit.Theadvisory overview stated that numerous vulnerabilities had been reported in mul-tiple vendors’ SNMP implementations.These vulnerabilities could allow unau-thorized privileged access, allow DoS, or cause unstable behavior if a site usesSNMP in any capacity.
The Oulu [Finland] University Secure Programming Group (OUSPG)reported the following vulnerabilities:
■ VU#107186 Multiple vulnerabilities in SNMPv1 trap handling
■ VU#854306 Multiple vulnerabilities in SNMPv1 request handling
In summary, the CERT advisory gives many recommendations to mitigatethis vulnerability, including ingress/egress filtering, disabling the SNMP services,applying the appropriate vendor patches, and changing the default communitystrings. Refer to www.cert.org for the specific impact and solutions for this advisory.
Domain Name Service VulnerabilitiesTo paraphrase Bill Shakespeare,“A rose is a rose by any other name.” Followingthat line of reasoning, FileServer1 is FileServer1 by any other name if it has regis-tered its IP address in a Domain Name System (DNS). DNS enables you to usefriendly, readable names to locate resources on a TCP/IP network by linkingnames to IP addresses.Which of the following would be most easily remembered:Syngress.com or 216.238.176.55?
Prior to the implementation of DNS, computers used the hosts file to resolvenames to IP addresses.The hosts file still exists today. On a UNIX or Linuxsystem, the file is located in the /etc directory at /etc/hosts.To read the contentsof the file, simply enter more /etc/hosts at the command prompt. On aMicrosoft NT/2000 machine, enter C:\> type winnt\system32\drivers\etc\hosts at the command prompt. In addition, you can use Notepad or any ofthe available text editors to read the file.The hosts file in the Microsoft directorygives you a sample of the various types of entries (see Figure 11.38).
Every line of the file in Figure 11.36, with the exception of the last line, is acomment.The pound sign (#) at the beginning of a line instructs the program toignore the line.The only line that would be processed in this file as currentlyconfigured is the last line:
127.0.0.1 localhost
www.syngress.com
219_sniffer_11.qxd 6/28/02 12:03 PM Page 541

542 Chapter 11 • Detecting and Performing Security Breaches with Sniffer Pro
The statement maps the IP address 127.0.0.1 to localhost, which is the nameused for the local machine.This mapping is sometimes referred to as the loopbackmapping because a reference to this name or address loops back without transmit-ting packets onto the network interface.
The third line from the bottom would map 102.54.94.98 to rhino.acme.comif the pound sign were removed.You configure the file by adding mappingswithout the pound sign.This file requires manual editing and is therefore subjectto error.The hosts file, albeit state of the art for its time, developed into anadministrative nightmare. System administrators and network engineers began tolook for a better way.The result of their efforts is known as the Domain NameSystem, or DNS.
NOTE
A successful ping operation on the address 127.0.0.1 reveals a greatamount of information about the state of the installed networking soft-ware. The reply packets will display successfully regardless of the condi-tion of the network, providing that the network software is functioningproperly. In fact, the interface cable can be completely disconnectedfrom the network.
www.syngress.com
Figure 11.38 The Windows Hosts File
219_sniffer_11.qxd 6/28/02 12:03 PM Page 542

Detecting and Performing Security Breaches with Sniffer Pro • Chapter 11 543
DNS BasicsDNS is hierarchical in structure. Figure 11.39 is a simplified view of the domainnamespace tree.The logical tree is viewed as being upside down, with the root atthe top level.
DNS is a client/server distributed database management system.The DNScommunication protocol utilizes TCP and UDP via port 53.As shown in Figure11.37, the root of the DNS hierarchy is called the root domain. This root nameserver is configured to recognize the top-level domains and name servers for eachdomain just below the root.This server is the authority when it comes to pro-viding information about the top-level name servers—in other words,authoritative (responsible) for the root domain.
The next group of servers at the top level are responsible for the variousdomains, such as .com and .gov. Some of these domains should be familiar toyou, such as the .com domain.This domain is used by commercial organizations.Recently some of these organizations received a great deal of press in the so-called “dot-com meltdown.” Many dot-com companies consequently filedChapter 11 bankruptcy protection and/or went bankrupt.The following is a listand general description of some of these domains:
■ .com Commercial organizations
■ .gov Governmental organizations
www.syngress.com
Figure 11.39 The DNS Tree
ROOT
.com .gov .edu .mil .net .org .int
Cisco White House MITMicrosoft UCLA NFS Island Attrition NATOArmy
219_sniffer_11.qxd 6/28/02 12:03 PM Page 543
544 Chapter 11 • Detecting and Performing Security Breaches with Sniffer Pro
■ .edu Educational organizations
■ .mil Military organizations
■ .net Networking organizations
■ .org Noncommercial organizations
■ .int International organizations
As you move down the various branches of the tree, you add a prefix to thename of your location. For example, cisco is located at the third level of the .combranch.Therefore, the complete name for the Cisco domain at that point iscisco.com. If there were a domain under cisco for the department named sales, thecomplete domain name for the department would be sales.cisco.com.What wehave just described is known as a fully qualified domain name (FQDN).Thename ends with a period for the root in DNS.
Resource RecordsThe information contained in the DNS database defining the various computersand services are stored in resource records.The resource records are grouped intozones.We cover zones later, in the section on zone transfers.The following is abrief list of some of the resource records of interest to us in this section:
■ SOA Start of authority (the beginning of the zone of authority)
■ NS Name server (the name servers for the zone)
■ A Address record ( maps a FQDN of a host to an IP address)
■ PTR Pointer record ( maps an IP address to a FQDN)
■ CNAME Canonical name (an alias of the FQDN)
■ MX Mail exchange record (specifies mail exchange servers)
DNS RecursionTo put some of these terms into perspective, consider the following example. Inthe network topology shown in Figure 11.40, we see four computers: a hostcomputer named Host at IP address 172.16.60.56; a secondary name servernamed BackupDNS at IP address 172.16.60.55; a primary name server,PrimaryDNS, at IP address 172.16.60.37; and a host computer named Training01at IP address 172.16.60.60.All these computers are members of the DNS domainnamed domain.com.Their FQDNs are:
www.syngress.com
219_sniffer_11.qxd 6/28/02 12:03 PM Page 544
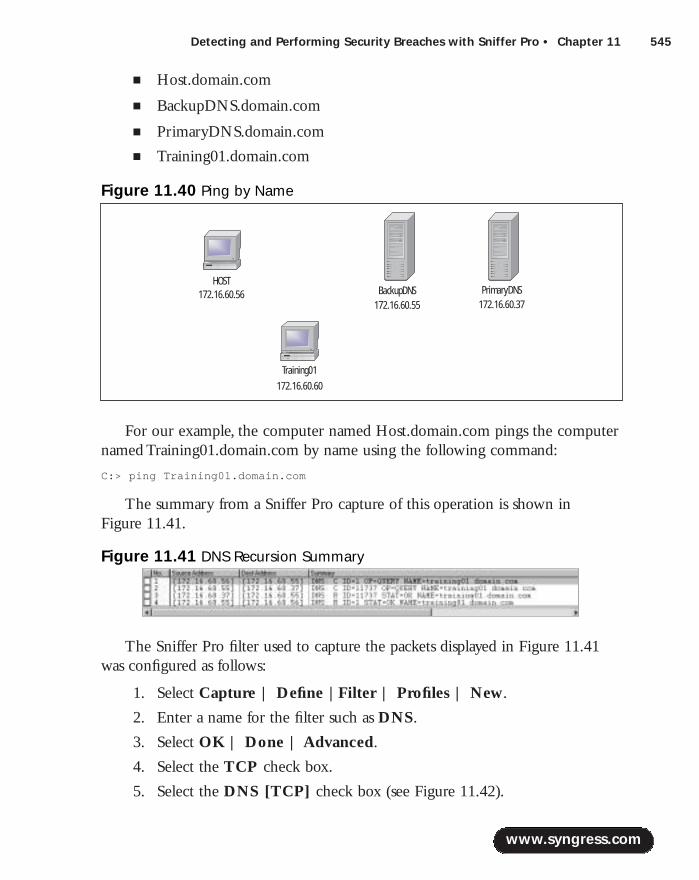
Detecting and Performing Security Breaches with Sniffer Pro • Chapter 11 545
■ Host.domain.com
■ BackupDNS.domain.com
■ PrimaryDNS.domain.com
■ Training01.domain.com
For our example, the computer named Host.domain.com pings the computernamed Training01.domain.com by name using the following command:
C:> ping Training01.domain.com
The summary from a Sniffer Pro capture of this operation is shown in Figure 11.41.
The Sniffer Pro filter used to capture the packets displayed in Figure 11.41was configured as follows:
1. Select Capture | Define |Filter | Profiles | New.
2. Enter a name for the filter such as DNS.
3. Select OK | Done | Advanced.
4. Select the TCP check box.
5. Select the DNS [TCP] check box (see Figure 11.42).
www.syngress.com
Figure 11.40 Ping by Name
BackupDNS172.16.60.55
PrimaryDNS172.16.60.37
HOST172.16.60.56
Training01
172.16.60.60
Figure 11.41 DNS Recursion Summary
219_sniffer_11.qxd 6/28/02 12:03 PM Page 545
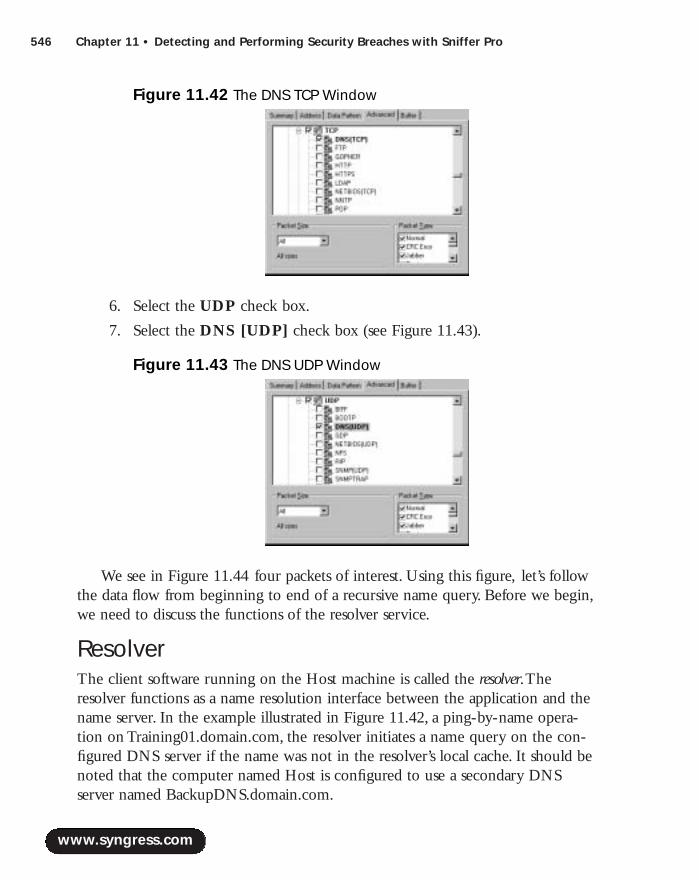
546 Chapter 11 • Detecting and Performing Security Breaches with Sniffer Pro
6. Select the UDP check box.
7. Select the DNS [UDP] check box (see Figure 11.43).
We see in Figure 11.44 four packets of interest. Using this figure, let’s followthe data flow from beginning to end of a recursive name query. Before we begin,we need to discuss the functions of the resolver service.
ResolverThe client software running on the Host machine is called the resolver.Theresolver functions as a name resolution interface between the application and thename server. In the example illustrated in Figure 11.42, a ping-by-name opera-tion on Training01.domain.com, the resolver initiates a name query on the con-figured DNS server if the name was not in the resolver’s local cache. It should benoted that the computer named Host is configured to use a secondary DNSserver named BackupDNS.domain.com.
www.syngress.com
Figure 11.42 The DNS TCP Window
Figure 11.43 The DNS UDP Window
219_sniffer_11.qxd 6/28/02 12:03 PM Page 546
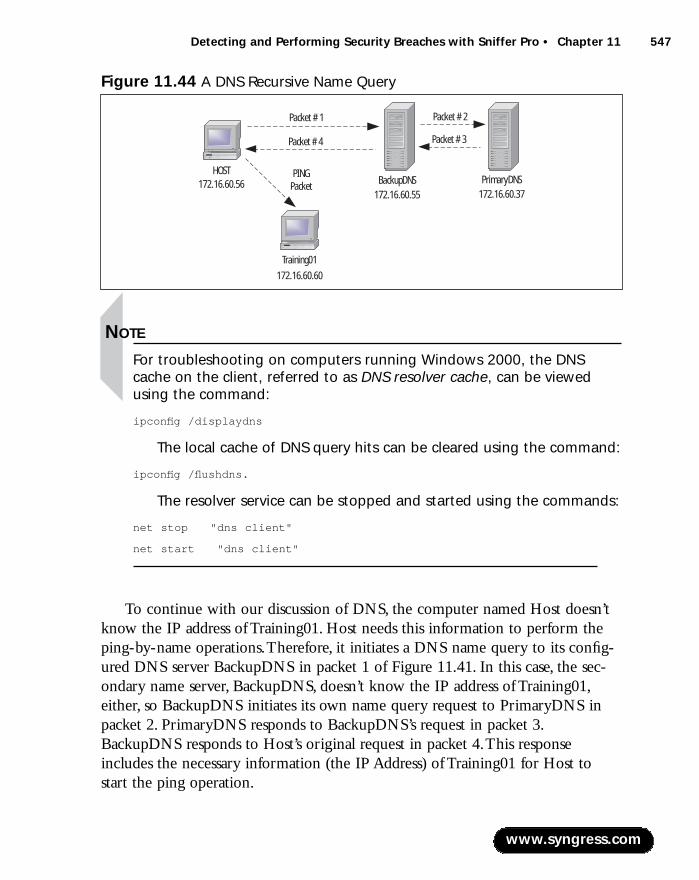
Detecting and Performing Security Breaches with Sniffer Pro • Chapter 11 547
NOTE
For troubleshooting on computers running Windows 2000, the DNScache on the client, referred to as DNS resolver cache, can be viewedusing the command:
ipconfig /displaydns
The local cache of DNS query hits can be cleared using the command:
ipconfig /flushdns.
The resolver service can be stopped and started using the commands:
net stop "dns client"
net start "dns client"
To continue with our discussion of DNS, the computer named Host doesn’tknow the IP address of Training01. Host needs this information to perform theping-by-name operations.Therefore, it initiates a DNS name query to its config-ured DNS server BackupDNS in packet 1 of Figure 11.41. In this case, the sec-ondary name server, BackupDNS, doesn’t know the IP address of Training01,either, so BackupDNS initiates its own name query request to PrimaryDNS inpacket 2. PrimaryDNS responds to BackupDNS’s request in packet 3.BackupDNS responds to Host’s original request in packet 4.This responseincludes the necessary information (the IP Address) of Training01 for Host tostart the ping operation.
www.syngress.com
Figure 11.44 A DNS Recursive Name Query
BackupDNS172.16.60.55
PrimaryDNS172.16.60.37
HOST172.16.60.56
Training01
172.16.60.60
PINGPacket
Packet # 1 Packet # 2
Packet # 3Packet # 4
219_sniffer_11.qxd 6/28/02 12:03 PM Page 547

548 Chapter 11 • Detecting and Performing Security Breaches with Sniffer Pro
Now let’s look at the packet contents in detail.We are using Windows 2000Domain Name System servers.The DNS header of packet 1 is displayed inFigure 11.45. The fields of interest to us are:
■ ID = 1 This ID will be the same in both the request and responsepackets for this query.
■ Command = Query A request for name-to-IP-address resolution.
■ Recursion desired The client instructs the server to resolve the querybefore responding to the client.
■ Question count = 1, Answer count = 0 The packet containing asingle query.
■ Zone Section, Name = training01.domain.com The FQDN ofthe computer in question.
The DNS header of packet 2 is displayed in Figure 11.46. The packet wasgenerated in response to the recursive request by Host in packet 1.As we men-tioned earlier, BackupDNS doesn’t know the IP address of Training01, either.Thefields of interest are the same as in packet 1, and their functionality is identical.The SCP should note that the value of the ID field has changed and is equal to11737. Packet 2 is a brand-new query from BackupDNS to PrimaryDNS, not acopy of Host’s original request.Therefore, it has its own unique ID field:
■ ID =11737
■ Command = Query
■ No Recursion desired
www.syngress.com
Figure 11.45 Packet 1 DNS Header
219_sniffer_11.qxd 6/28/02 12:03 PM Page 548
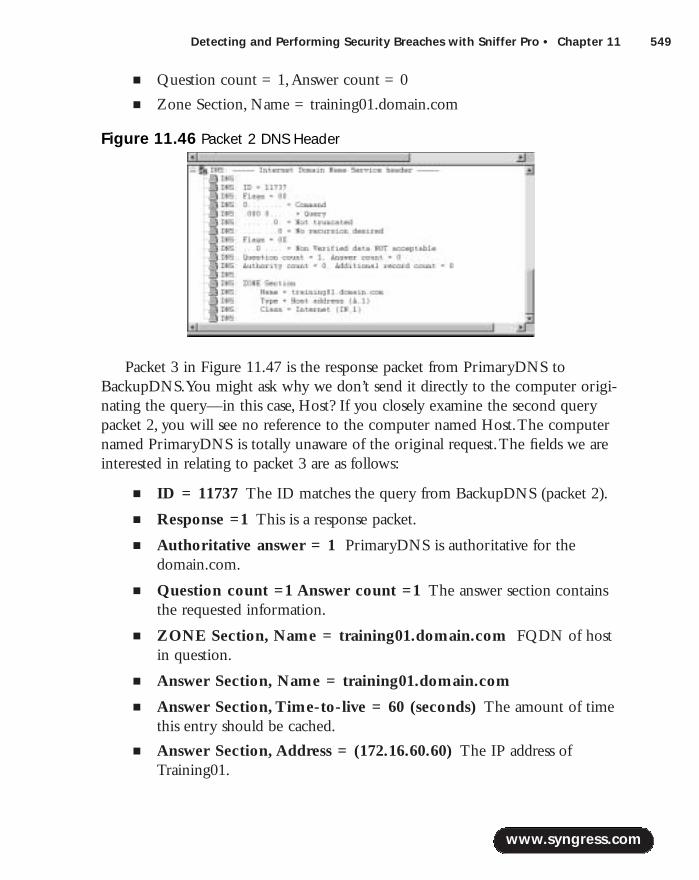
Detecting and Performing Security Breaches with Sniffer Pro • Chapter 11 549
■ Question count = 1,Answer count = 0
■ Zone Section, Name = training01.domain.com
Packet 3 in Figure 11.47 is the response packet from PrimaryDNS toBackupDNS.You might ask why we don’t send it directly to the computer origi-nating the query—in this case, Host? If you closely examine the second querypacket 2, you will see no reference to the computer named Host.The computernamed PrimaryDNS is totally unaware of the original request.The fields we areinterested in relating to packet 3 are as follows:
■ ID = 11737 The ID matches the query from BackupDNS (packet 2).
■ Response =1 This is a response packet.
■ Authoritative answer = 1 PrimaryDNS is authoritative for thedomain.com.
■ Question count =1 Answer count =1 The answer section containsthe requested information.
■ ZONE Section, Name = training01.domain.com FQDN of hostin question.
■ Answer Section, Name = training01.domain.com
■ Answer Section,Time-to-live = 60 (seconds) The amount of timethis entry should be cached.
■ Answer Section, Address = (172.16.60.60) The IP address ofTraining01.
www.syngress.com
Figure 11.46 Packet 2 DNS Header
219_sniffer_11.qxd 6/28/02 12:03 PM Page 549
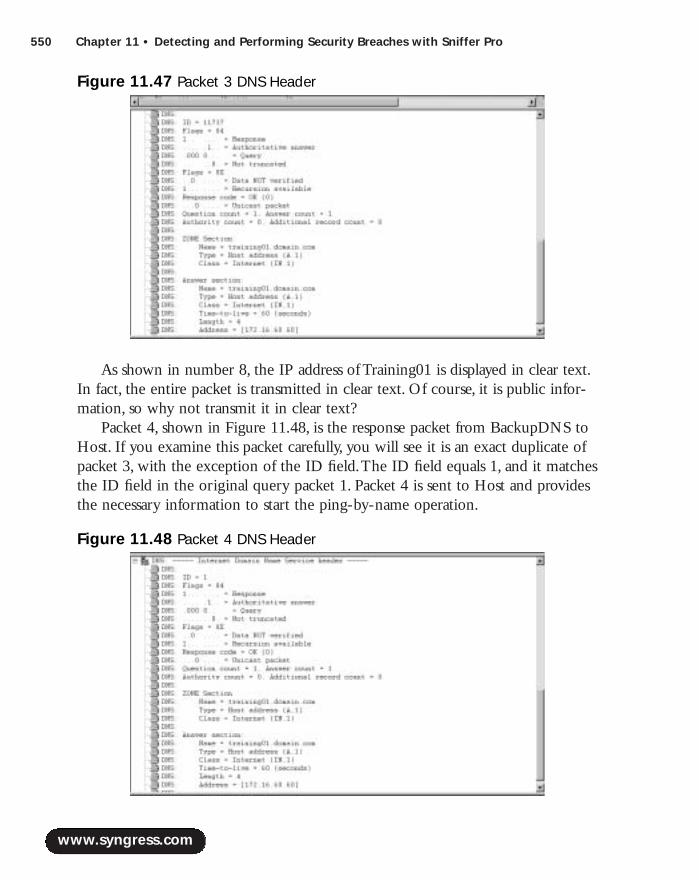
550 Chapter 11 • Detecting and Performing Security Breaches with Sniffer Pro
As shown in number 8, the IP address of Training01 is displayed in clear text.In fact, the entire packet is transmitted in clear text. Of course, it is public infor-mation, so why not transmit it in clear text?
Packet 4, shown in Figure 11.48, is the response packet from BackupDNS toHost. If you examine this packet carefully, you will see it is an exact duplicate ofpacket 3, with the exception of the ID field.The ID field equals 1, and it matchesthe ID field in the original query packet 1. Packet 4 is sent to Host and providesthe necessary information to start the ping-by-name operation.
www.syngress.com
Figure 11.47 Packet 3 DNS Header
Figure 11.48 Packet 4 DNS Header
219_sniffer_11.qxd 6/28/02 12:03 PM Page 550

Detecting and Performing Security Breaches with Sniffer Pro • Chapter 11 551
The preceding information has been at best a brief overview of Domain NameSystem.Volumes have been written on the subject and lifetimes devoted to itsadministration. Having said that, however, in defense of this text, DNS’s vulnerabili-ties have been successfully exploited by hackers with a lot less information..
NOTE
To repent for my literary blasphemy, William Shakespeare actually said,“A rose by any other name would smell as sweet.”
DNS Zone TransfersA DNS zone transfer is basically a file transfer of the zone database from a pri-mary to a secondary server when notified. How often these transfers shouldoccur depends on how static your namespace remains.A network with frequentchanges should have shorter period between transfers. Be aware that a large zonetransfer can become a recourse hog and overload the network.With that in mind,zone transfers are necessary, but their schedules should be the result of carefulplanning.
From a security point of view, DNS zone transfers offer a wealth of recon-naissance information.With this information, a hacker can map your network inpreparation for an attack. Most system administrators prefer to use a name that isdescriptive for each server in their networks. Names such as PrimeDC,WINServer, PrimeDNS, and PayrollSVR save the hacker a great deal of time indetermining which unit to compromise. If the hacker can cause and capture a fullzone transfer, it is a relatively simple matter to construct a map of the entire zone.Armed with this information, a hacker can begin rerouting packets to other loca-tions or create a man-in-the-middle attack, which we discuss next.
Poisoning the DNS CacheThe headline on CNN.com on July 22, 1999, read,“Hillary Gets Hacked.”Thearticle went on to say that someone sympathetic to Rudolph Giuliani, thenmayor of New York City, was possibly playing political tricks on Hillary Clinton’sWeb site. It seems that on July 7, Mrs. Clinton had launched a Web site,www.hillary2000.org, to promote her probable run for the open New York seatin the U.S. Senate. Shortly after the site was put online, a number of visitors
www.syngress.com
219_sniffer_11.qxd 6/28/02 12:03 PM Page 551
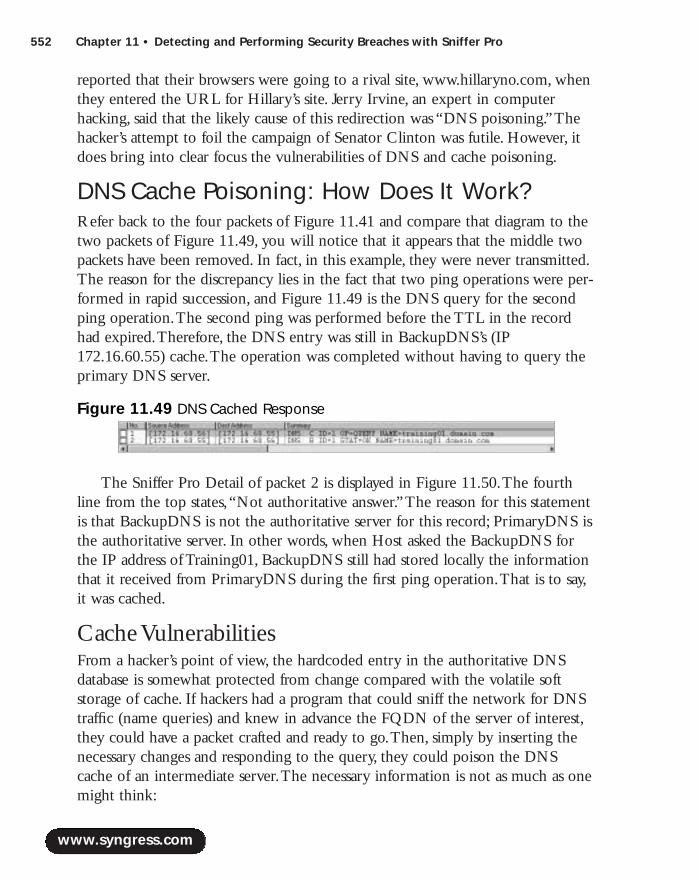
552 Chapter 11 • Detecting and Performing Security Breaches with Sniffer Pro
reported that their browsers were going to a rival site, www.hillaryno.com, whenthey entered the URL for Hillary’s site. Jerry Irvine, an expert in computerhacking, said that the likely cause of this redirection was “DNS poisoning.”Thehacker’s attempt to foil the campaign of Senator Clinton was futile. However, itdoes bring into clear focus the vulnerabilities of DNS and cache poisoning.
DNS Cache Poisoning: How Does It Work?Refer back to the four packets of Figure 11.41 and compare that diagram to thetwo packets of Figure 11.49, you will notice that it appears that the middle twopackets have been removed. In fact, in this example, they were never transmitted.The reason for the discrepancy lies in the fact that two ping operations were per-formed in rapid succession, and Figure 11.49 is the DNS query for the secondping operation.The second ping was performed before the TTL in the recordhad expired.Therefore, the DNS entry was still in BackupDNS’s (IP172.16.60.55) cache.The operation was completed without having to query theprimary DNS server.
The Sniffer Pro Detail of packet 2 is displayed in Figure 11.50.The fourthline from the top states,“Not authoritative answer.”The reason for this statementis that BackupDNS is not the authoritative server for this record; PrimaryDNS isthe authoritative server. In other words, when Host asked the BackupDNS forthe IP address of Training01, BackupDNS still had stored locally the informationthat it received from PrimaryDNS during the first ping operation.That is to say,it was cached.
Cache Vulnerabilities From a hacker’s point of view, the hardcoded entry in the authoritative DNSdatabase is somewhat protected from change compared with the volatile softstorage of cache. If hackers had a program that could sniff the network for DNStraffic (name queries) and knew in advance the FQDN of the server of interest,they could have a packet crafted and ready to go.Then, simply by inserting thenecessary changes and responding to the query, they could poison the DNScache of an intermediate server.The necessary information is not as much as onemight think:
www.syngress.com
Figure 11.49 DNS Cached Response
219_sniffer_11.qxd 6/28/02 12:03 PM Page 552
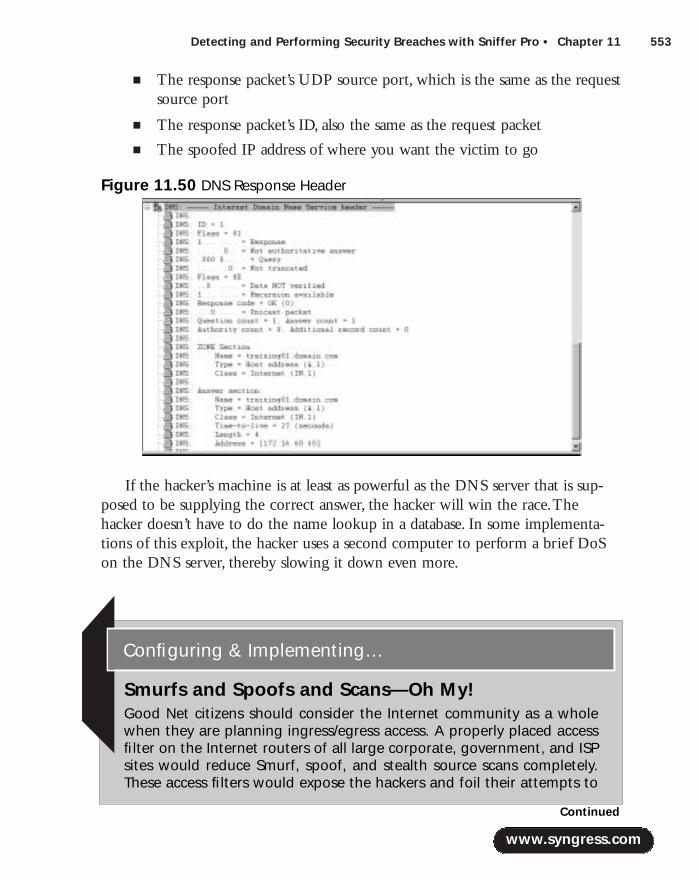
Detecting and Performing Security Breaches with Sniffer Pro • Chapter 11 553
■ The response packet’s UDP source port, which is the same as the requestsource port
■ The response packet’s ID, also the same as the request packet
■ The spoofed IP address of where you want the victim to go
If the hacker’s machine is at least as powerful as the DNS server that is sup-posed to be supplying the correct answer, the hacker will win the race.Thehacker doesn’t have to do the name lookup in a database. In some implementa-tions of this exploit, the hacker uses a second computer to perform a brief DoSon the DNS server, thereby slowing it down even more.
www.syngress.com
Figure 11.50 DNS Response Header
Smurfs and Spoofs and Scans—Oh My!Good Net citizens should consider the Internet community as a wholewhen they are planning ingress/egress access. A properly placed accessfilter on the Internet routers of all large corporate, government, and ISPsites would reduce Smurf, spoof, and stealth source scans completely.These access filters would expose the hackers and foil their attempts to
Configuring & Implementing…
Continued
219_sniffer_11.qxd 6/28/02 12:03 PM Page 553

554 Chapter 11 • Detecting and Performing Security Breaches with Sniffer Pro
www.syngress.com
attack the internal or external network. The main ingredient of theseattacks is a forged source IP address. For example, in the Smurf attack,the perpetrator forges the source address of a victim, possibly on yournetwork, and then performs an ICMP echo command to the broadcastaddress of your network. The flood of response packets is returned tothe victim’s machine, causing a DoS. Spoof attacks are just what theirname implies—someone is spoofing you by pretending to be someoneelse. In this case, the perpetrator is using a forged source addressinstead of an alias name.
A stealth source scan is a reconnaissance scan that uses multiplesource addresses, including the hacker’s. This technique is used tothwart intrusion detection equipment (IDE) and confuses the networksecurity administrator. In the philosophy of Bart Simpson, “Nobody sawme do it. You can’t prove it. It was one of those other guys.” Tools suchas Nmap (and Sniffer Pro) are capable of reconfiguring the sourceaddress of an IP packet. If you ponder the mechanics of these exploits,you arrive at the conclusion that if you never allow a packet to leaveyour network with a source address that is not in your network andnever allow a packet to enter your network with a source address ofyour network, you will keep everyone honest.
If a SCP suspects this type of clandestine activity, the SCP candesign, build, and deploy a filter to detect its presence on theingress/egress of the network.
Let’s configure a filter for the network with an IP address of172.16.0.0. to detect incoming spoof attacks:
1. Select Capture | Define Filter | Profiles | New.
2. Enter a name such as Spoof Filter.
3. Select OK | Done | Data Pattern | Add Pattern.
4. Offset = 1A.
5. Enter hex AC and hex 10 in data field 1. Note: This is hex172, 16; be sure to leave the remaining fields blank. (seeFigure 11.51).
6. Repeat steps 1 through 5 for the Spoof destination addressat Offset 1E (see Figure 11.52).
This filter, when placed at the ingress to the network, detects anyincoming attacks that are spoofing the 172.16.0.0 address space.
Continued
219_sniffer_11.qxd 6/28/02 12:03 PM Page 554

Detecting and Performing Security Breaches with Sniffer Pro • Chapter 11 555
In conclusion, there are other methods of DNS cache poisoning, such assequence ID prediction and altering the Additional Records field. However, anin-depth discussion of these exploits is outside the scope of this chapter.
Server Message Block VulnerabilitiesServer Message Block (SMB) is a high-level command and data protocol usedextensively in the Microsoft world for interprocess communication and file andprint sharing. SMB usually rides on top of Network Basic Input/Output System(NetBIOS), a network communication protocol developed by IBM in the early1980s. NetBIOS is a basic networking protocol with three main functions:Session, Name, and Datagram services.Although NetBIOS can be used overNetBIOS Extended User Interface (NetBEUI), NetBEUI is nonroutable.Therefore, we will limit our discussion to SMB over NetBIOS over TCP/IP.Werefer to the NetBIOS over TCP/IP functions as NetBT, or NBT.
Through the use of the redirector services provided by SMB, computers canlocate, read, write, and delete files on other computers on a network runningSMB. First, logical sessions are established by NetBIOS; then SMB messages areexchanged.The common messages sent and received by SMB are File, Printer,and Session Control.
www.syngress.com
Figure 11.51 Data Pattern
Figure 11.52 Spoof Destination Address
219_sniffer_11.qxd 6/28/02 12:03 PM Page 555
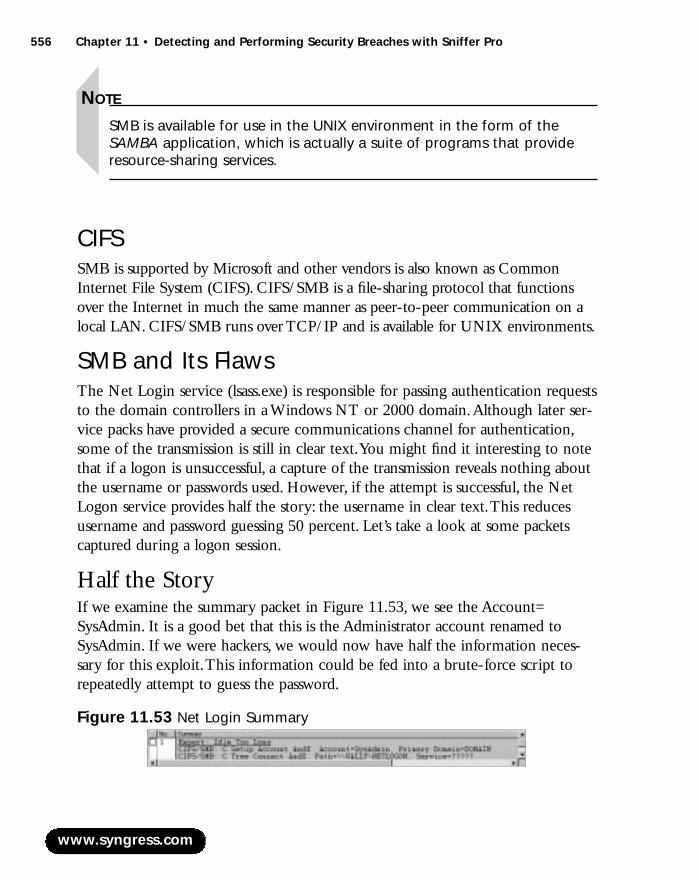
556 Chapter 11 • Detecting and Performing Security Breaches with Sniffer Pro
NOTE
SMB is available for use in the UNIX environment in the form of theSAMBA application, which is actually a suite of programs that provideresource-sharing services.
CIFSSMB is supported by Microsoft and other vendors is also known as CommonInternet File System (CIFS). CIFS/SMB is a file-sharing protocol that functionsover the Internet in much the same manner as peer-to-peer communication on alocal LAN. CIFS/SMB runs over TCP/IP and is available for UNIX environments.
SMB and Its FlawsThe Net Login service (lsass.exe) is responsible for passing authentication requeststo the domain controllers in a Windows NT or 2000 domain.Although later ser-vice packs have provided a secure communications channel for authentication,some of the transmission is still in clear text.You might find it interesting to notethat if a logon is unsuccessful, a capture of the transmission reveals nothing aboutthe username or passwords used. However, if the attempt is successful, the NetLogon service provides half the story: the username in clear text.This reducesusername and password guessing 50 percent. Let’s take a look at some packetscaptured during a logon session.
Half the StoryIf we examine the summary packet in Figure 11.53, we see the Account=SysAdmin. It is a good bet that this is the Administrator account renamed toSysAdmin. If we were hackers, we would now have half the information neces-sary for this exploit.This information could be fed into a brute-force script torepeatedly attempt to guess the password.
www.syngress.com
Figure 11.53 Net Login Summary
219_sniffer_11.qxd 6/28/02 12:03 PM Page 556
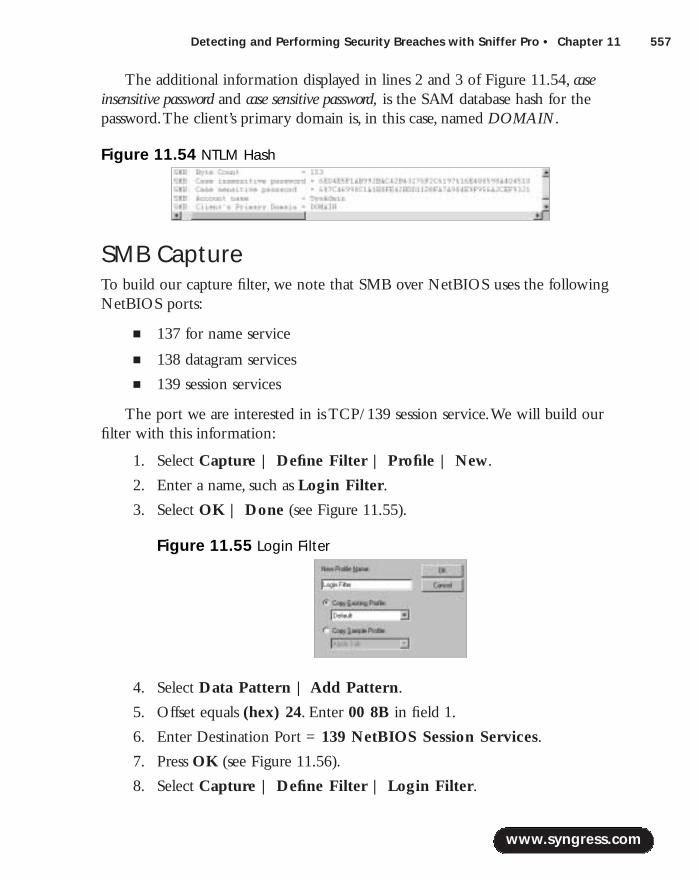
Detecting and Performing Security Breaches with Sniffer Pro • Chapter 11 557
The additional information displayed in lines 2 and 3 of Figure 11.54, caseinsensitive password and case sensitive password, is the SAM database hash for thepassword.The client’s primary domain is, in this case, named DOMAIN.
SMB CaptureTo build our capture filter, we note that SMB over NetBIOS uses the followingNetBIOS ports:
■ 137 for name service
■ 138 datagram services
■ 139 session services
The port we are interested in is TCP/139 session service.We will build ourfilter with this information:
1. Select Capture | Define Filter | Profile | New.
2. Enter a name, such as Login Filter.
3. Select OK | Done (see Figure 11.55).
4. Select Data Pattern | Add Pattern.
5. Offset equals (hex) 24. Enter 00 8B in field 1.
6. Enter Destination Port = 139 NetBIOS Session Services.
7. Press OK (see Figure 11.56).
8. Select Capture | Define Filter | Login Filter.
www.syngress.com
Figure 11.54 NTLM Hash
Figure 11.55 Login Filter
219_sniffer_11.qxd 6/28/02 12:03 PM Page 557
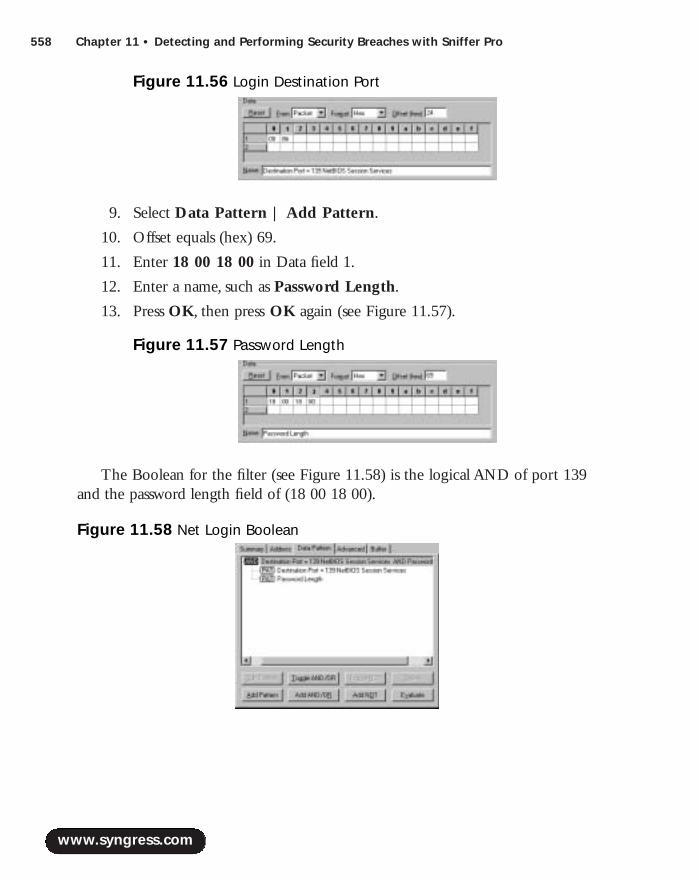
558 Chapter 11 • Detecting and Performing Security Breaches with Sniffer Pro
9. Select Data Pattern | Add Pattern.
10. Offset equals (hex) 69.
11. Enter 18 00 18 00 in Data field 1.
12. Enter a name, such as Password Length.
13. Press OK, then press OK again (see Figure 11.57).
The Boolean for the filter (see Figure 11.58) is the logical AND of port 139and the password length field of (18 00 18 00).
www.syngress.com
Figure 11.56 Login Destination Port
Figure 11.57 Password Length
Figure 11.58 Net Login Boolean
219_sniffer_11.qxd 6/28/02 12:03 PM Page 558

Detecting and Performing Security Breaches with Sniffer Pro • Chapter 11 559
SMB SigningWindows NT 4.0 service pack SP3 addressed the security concerns ofCIFS/SMB by including the capability to sign and verify the source of everypacket transmitted and received.
To enable SMB signing requires a registry hack (manual configuration) on allmachines that would be participating in the signing process.To do so, make thefollowing changes to the system Registry:
■ Hive HKEY_LOCAL_MACHINE
■ Key System\CurrentControlSet\Services\LanManServer\Parameters
■ Name RequireSecuritySignature
■ Type REG_DWORD
■ Value 1
NOTE
Before performing the registry update, refer to pertinent information on the Microsoft Web site at http://support.microsoft.com/support/kb/articles/q161/3/72.asp.
Although the implementation of SMB signing would reduce the hacker’s abilityto perform a man-in-the-middle attack, the overhead on network utilization couldreach 10 to15 percent—a price too high for many network administrators.
www.syngress.com
219_sniffer_11.qxd 6/28/02 12:03 PM Page 559

560 Chapter 11 • Detecting and Performing Security Breaches with Sniffer Pro
SummaryIn this chapter, we have covered many topics of concern to the security-mindedSCP and the networking community as a whole.We have demonstrated how theSCP can use Sniffer Pro to examine a network vulnerability in much the sameway an evidence technician would use a microscope to examine a crime scene.The power of this tool lies in its ability to capture and analyze data, to as fine agranularity as desired.
We covered the latest threats to the Internet and some of the emerging issuesof concern to corporate chief security officers as well system administrators.Using the Sniffer Pro, we captured and dissected the latest malware, revealingtheir diabolical payloads.
The discussion of Microsoft’s buffer overflow vulnerability in IIS laid thegroundwork for developing capture filters for use in examining the group ofrecent exploits known as Code Red, Code Red II, and Nimda.
Continuing our investigation of network vulnerabilities, we covered passwordcracking.The section included building filters to detect and capture attempts tocompromise systems using password guessing.We demonstrated the danger inclear-text transmission of passwords by capturing and playing back logon sessionsof clients such as Telnet, FTP, and Outlook Express.
We examined Domain Name System vulnerabilities, including the topics ofzone transfer reconnaissance and DNS cache poisoning. (The clear-text transmis-sion of DNS packets can provide the would-be hacker with a road map of yournetwork. Furthermore, utilizing cache-poisoning techniques, hackers can sendyour network packets to any destination they choose.)
We discussed System Message Block (SMB) vulnerabilities in detail.We cov-ered NetBIOS, NetBEUI, and NetBT or NBT.We captured and analyzed NetLogin services. Building Sniffer Pro filters, we trapped the account name duringlogin.We concluded with a look at SMB signing as a means to prevent man-in-the-middle attacks.
Solutions Fast Track
Using Sniffer Pro to Find Holes in Your Network
! Delivery and payload are military terms frequently employed to describethe mechanisms used by many viruses,Trojans, and worms during an
www.syngress.com
219_sniffer_11.qxd 6/28/02 12:03 PM Page 560
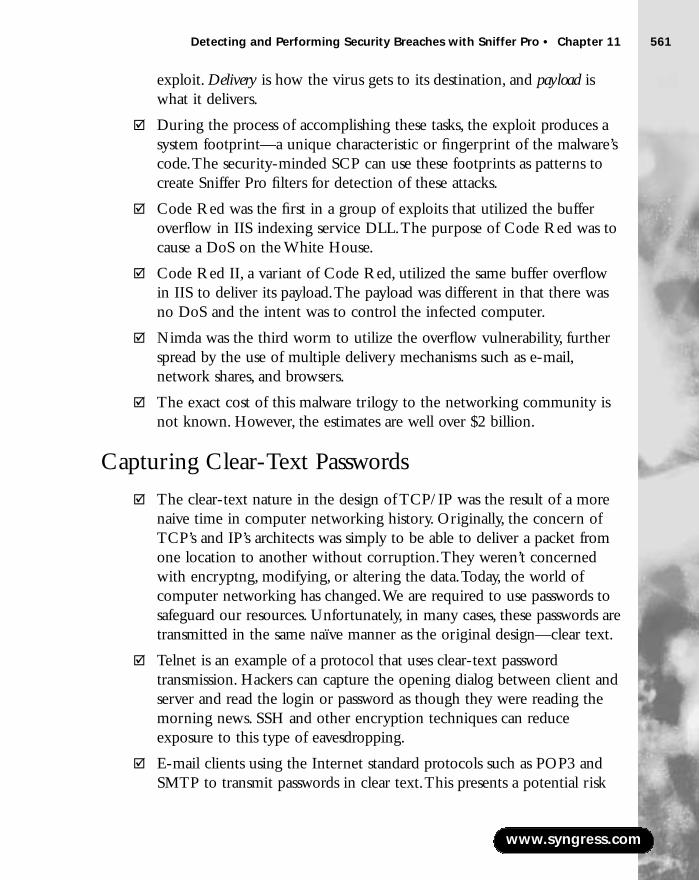
Detecting and Performing Security Breaches with Sniffer Pro • Chapter 11 561
exploit. Delivery is how the virus gets to its destination, and payload iswhat it delivers.
! During the process of accomplishing these tasks, the exploit produces asystem footprint—a unique characteristic or fingerprint of the malware’scode.The security-minded SCP can use these footprints as patterns tocreate Sniffer Pro filters for detection of these attacks.
! Code Red was the first in a group of exploits that utilized the bufferoverflow in IIS indexing service DLL.The purpose of Code Red was tocause a DoS on the White House.
! Code Red II, a variant of Code Red, utilized the same buffer overflowin IIS to deliver its payload.The payload was different in that there wasno DoS and the intent was to control the infected computer.
! Nimda was the third worm to utilize the overflow vulnerability, furtherspread by the use of multiple delivery mechanisms such as e-mail,network shares, and browsers.
! The exact cost of this malware trilogy to the networking community isnot known. However, the estimates are well over $2 billion.
Capturing Clear-Text Passwords
! The clear-text nature in the design of TCP/IP was the result of a morenaive time in computer networking history. Originally, the concern ofTCP’s and IP’s architects was simply to be able to deliver a packet fromone location to another without corruption.They weren’t concernedwith encryptng, modifying, or altering the data.Today, the world ofcomputer networking has changed.We are required to use passwords tosafeguard our resources. Unfortunately, in many cases, these passwords aretransmitted in the same naïve manner as the original design—clear text.
! Telnet is an example of a protocol that uses clear-text passwordtransmission. Hackers can capture the opening dialog between client andserver and read the login or password as though they were reading themorning news. SSH and other encryption techniques can reduceexposure to this type of eavesdropping.
! E-mail clients using the Internet standard protocols such as POP3 andSMTP to transmit passwords in clear text.This presents a potential risk
www.syngress.com
219_sniffer_11.qxd 6/28/02 12:03 PM Page 561
562 Chapter 11 • Detecting and Performing Security Breaches with Sniffer Pro
on a shared medium such as cable modems or DSL if the hacker canutilize a promiscuous interface card.
Attacks: Password Capture and Replay
! File Transfer Protocol (FTP) is the Internet’s file exchange protocol.Theprotocol uses client/server architecture.
! The client/server session negotiation is transmitted in clear text.Thelogin and passwords are completely visible to any would-be hacker whohas the price of a cheap sniffing program.These items can be capturedand replayed with a minimum amount of effort.
! Sniffer Pro can be configured to detect invalid login or passwordattempts and mitigate the risk of using this clear-text protocol. For moreinformation, refer to the section,“Capturing Clear-Text Passwords.”
Domain Name Service Vulnerabilities
! Domain Name Systems have all but replaced the use of hosts files. Someversions, known as Dynamic DNS, automatically update themselves.
! From a security point of view, DNS is a fertile land of your company’sinternal information that—if tilled—could produce devastatinglydangerous information. DNS packets are transmitted in clear text and aresusceptible to eavesdropping. DNS maps your network and provides thehacker with the information necessary to exploit your network.
! DNS uses a caching mechanism for rapid response to requests made byresolvers.The cache is volatile and is subject to malicious altering,known as cache poisoning
Server Message Block Vulnerabilities
! Common Internet File System (CIFS) is an extension of SMB thatallows file sharing over the Internet.
! The Net Login service (lsass.exe) transmits the account name in cleartext, providing a would-be hacker with half the information necessary toexploit the system.
www.syngress.com
219_sniffer_11.qxd 6/28/02 12:03 PM Page 562
Detecting and Performing Security Breaches with Sniffer Pro • Chapter 11 563
! It is possible to sign and verify the source of every packet using SMBsigning.The network overhead can reach 10 to 15 percent.
Q: If I suspect that a particular computer on my network is attempting a DoSattack against another computer from my corporate egress to the Internet,what should I do?
A: You should build a Sniffer Pro address capture filter configured for the addressof the suspected computer. Capture a number of packets and examine them.If the computer is performing a DoS on another computer, the trace willreveal many syn packets to the victim’s IP address, with different source ports,possibly incrementing.The victim’s machine will respond with a syn/ackpacket for each syn packet. However, the attacking computer will notacknowledge it by returning an ack packet.This is known as a half-open con-nection that saturates the victim’s buffers and renders his network connectionuseless. Lately there has been a tendency toward downstream litigation in sit-uations such as this one.
Q: Some of the more sophisticated Trojan back-door programs of today infect avictim’s computer by installing their own version of an e-mail client.Thehome-grown client uses a simple SMTP protocol to send your most personaldocuments to an e-mail account on a public e-mail server such as Hotmail orYahoo! By installing their own client, they avoid the necessity to predictwhich client is in use on the victim’s machine and the programming anoma-lies that could occur while attempting to interface with the client. If you sus-pect this malicious activity, what can you do to detect it?
A: The SCP can build a capture filter, selecting the SMTP port 25 as the destina-tion port logically ANDed with a NOT of the IP address for your network’s e-mail server.This filter will trap any e-mail leaving your network that was
www.syngress.com
Frequently Asked Questions
The following Frequently Asked Questions, answered by the authors of this book,are designed to both measure your understanding of the concepts presented in this chapter and to assist you with real-life implementation of these concepts. Tohave your questions about this chapter answered by the author, browse towww.syngress.com/solutions and click on the “Ask the Author” form.
219_sniffer_11.qxd 6/28/02 12:03 PM Page 563
564 Chapter 11 • Detecting and Performing Security Breaches with Sniffer Pro
generated by a computer other than your e-mail servers.After a successful cap-ture, the IP address can be used to track down the compromised host.
Q: We do not have intrusion detection systems on our network. However, webelieve some of our important servers and client computers have back doorsinstalled and are being controlled from the Internet.What can we do todetermine whether or not our fears are justified?
A: The Internet contains a vast amount of information on Trojan ports andbackdoor exploits. Hundreds of remote control programs are available in thehacking world. In addition, many commercially available versions, such as PCAnywhere and Virtual Network Computing (VNC), are used for systemadministration. By browsing the Internet for security-related information, theSCP can stay current on the latest versions of back-door programs.TheSANS institute offers a comprehensive list of Trojan ports, located atwww.sans.org/newlook/resources/IDAFQ/oddports.htm.To utilize thisinformation, the SCP would build a capture filter using a logical OR opera-tion on all destination ports that are suspect. Some of the main players in theback-door game are Back Orifice (port 31337), SubSeven (port 6713),Whack-a-mole (port 12362), NetSpy (port 31339), Hack’a’Tack (port31789), and RAT (port 1095).This filter would be used on your network atthe ingress/egress to the Internet. Sniffer Pro is capable of capturing manyports and you may be surprised to see what your network is actually beingused for.
Q: We’ve replaced our old hubs with new Layer-2 switches.We are now pro-tected from eavesdropping—correct?
A: Sorry.Admittedly, you have mitigated the risk; however, you have not elimi-nated it.An exploit known as ARP cache poisoning can be used to redirectyour packets to other ports.This technique is similar to port spanning.Hackers redirect these packets by listening for ARP requests.The ARPrequests are broadcast to all ports, and the hackers respond with their ownMAC addresses.The switch places their MAC address in the MAC tablealong with the valid host, unless security settings are in effect. Future packetswill be transmitted to both ports.You can employ virtual LANs (VLANs) tofurther reduce your exposure to ARP cache poisoning.
www.syngress.com
219_sniffer_11.qxd 6/28/02 12:03 PM Page 564
Detecting and Performing Security Breaches with Sniffer Pro • Chapter 11 565
Q: From a security point of view, how can I best utilize the features of SnifferPro?
A: To defend your network against hackers, you must think like a hacker.Armedwith Sniffer Pro, you can detect and defeat attackers. For instance, if you havebeen told by your firewall administrators that they are blocking SubSevenport 6713, build a filter and check it. If you suspect that illegal FTP commu-nications are entering or leaving your network, build an FTP filter and checkit. If a user tells you that the computer she is using is acting strange—almostwith a mind of its own—build a filter with the user’s IP address and check it.The user might not be the only one using the machine. In fact, you mightnot be the only one using yours. Check it!
www.syngress.com
219_sniffer_11.qxd 6/28/02 12:03 PM Page 565

219_sniffer_11.qxd 6/28/02 12:03 PM Page 566

TroubleshootingTraffic for NetworkOptimization
Solutions in this chapter:
■ Fine Tuning Your Network and PerformingProactive Maintenance
■ Finding Unnecessary Protocols with theSniffer Pro
■ Optimizing LAN and WAN traffic with theSniffer Pro
■ Ethernet Optimization
■ NetWare Optimization and MicrosoftOptimization
Chapter 12
567
! Summary
! Solutions Fast Track
! Frequently Asked Questions
219_sniffer_12.qxd 6/28/02 12:25 PM Page 567
568 Chapter 12 • Troubleshooting Traffic for Network Optimization
IntroductionYou should feel by now that using Sniffer Pro is almost as commonplace as log-ging in to a workstation.You should feel comfortable with the Sniffer Pro func-tionality.Although it takes a long time, spent with various protocols stacks, tobecome a master at using this application, you are definitely now at the “profes-sional” level. If you were already doing analysis work, then you should have somepretty well honed skills by now.To this end, we are going to conclude this bookby looking at and troubleshooting traffic for the purpose of fine-tuning and opti-mizing your networks.This chapter will offer you the final topical look atNetwork and Protocol Analysis using the Sniffer Pro LAN Analyzer, as well asreview some of the very important skills you learned earlier.
We have looked at many issues in a granular way in each chapter; this is thechapter where you tie all of those pieces together to make sure you are comfort-able working with Sniffer Pro. It’s very common to find unneeded protocols, toomany broadcasts, or just plain old unexplainable messes that need your attention.
Fine Tuning Your Network andPerforming Proactive MaintenanceIn the early days of networking services, just being connected to other systemswas enough for most users.The ability to transfer files from one desktop toanother, print to remote printers, and connect to the Internet was so new andexciting that people didn’t consider complaining about the speed. In those earlydays, outages were so frequent that most of users didn’t completely trust the con-nection.They still stored files locally, kept paper copies, and got their news fromtelevision.Today, of course, things are very different. Network users expect speed,reliability, and security. In fact, lacking any of these features has cost money and,in extreme cases, destroyed businesses.A healthy network is as important to thesuccess of a business today as electricity or the telephone. In fact, with theimprovements in Voice over IP (VoIP) technology, many companies are consid-ering using their networks to replace their current plain old telephone service(POTS).Also, more and more workers are relying on broadband access to workfrom home.When the lights go out, we blame the electric company. If thephones are dead, we blame the phone company. If the network dies, is too slow,or loses a connections, we blame the network administrator.
www.syngress.com
219_sniffer_12.qxd 6/28/02 12:25 PM Page 568
www.syngress.com
As a network professional, you will want to be proactive and make everyattempt to find problems before they occur.This is the opposite of being reactive,which means taking calls at 3 A.M. when the network is down, saturated, or suf-fering some other disaster.A proactive network professional will use Sniffer Proto tweak the traffic on the network so that it is optimized. For example, you canremove two or three unnecessarily configured protocols on about 200 worksta-tions. By the end of this chapter, you will see how such a change can make a bigdifference. In the hands of a trained professional, Sniffer Pro can do amazingthings. Its versatility, wide range of features, and logging and alerting functionalitymake it a necessary tool for anyone who is responsible for network support. Let’stake a look at some of the ways we can use this award winning application toimprove our network services and prevent problems.
Defining Key Elements of Quality Network PerformanceSo, you want to tweak your network to give you the best performance? So youwant those $30,000 switches to run the way they should? One of the things wewould like you to remember is that putting in expensive equipment that worksfaster as a quick fix only masks the problems on your network. I have seen net-works inundated with broadcast traffic on a 10Mbps hubbed network fixed byadministrators who popped in high-end switches. Some of the issues wereresolved, like hubs simply regenerating all traffic and sending it out every availableport. However, other issues, such as excessive broadcasts, were simply masked by50% better performance. Do you want to be a “50 percenter”? I didn’t think so,so let’s define what we need to address and then learn how to deal with it.Thereare three things that your users will expect from their network:
■ Speed
■ Reliability
■ Security
Without any one of these, you will hear many complaints. If you lose controlof all three, you will see a side of your users that no network engineer shouldever have to see. Let’s take a look at each element and ways to make sure weconsistently provide each of them to users.
Troubleshooting Traffic for Network Optimization • Chapter 12 569
219_sniffer_12.qxd 6/28/02 12:25 PM Page 569
570 Chapter 12 • Troubleshooting Traffic for Network Optimization
Addressing Speed IssuesHow fast does the network respond to requests? Is this speed adequate evenduring peak usage hours and consistent for all users? The most common com-plaints you will hear from users will concern the speed of the network.This isbecause speed is so readily apparent to users. Speed justifies one of the mostimportant aspects of network support: Baselining. Baselining establishes the usageof your network under normal conditions. It will define reasonable expectationsof performance and will be the first information you will use when trou-bleshooting a network issue or considering upgrades. Being an SCP is like beinga doctor.When you go in for a check-up, the doctor consults your medical his-tory and compares it with your current information. Network support engineersshould do the same. In the next section we’ll review baselining and documenta-tion in more detail.
The Sniffer Pro Analysis tool will help you monitor and better utilize orimprove speed by giving you insight into what is going on with your networkutilization.There are many factors involved with improving speed on a network.Let’s take a look at some of the more important ones that will let you reap thebenefits immediately:
■ Remove unnecessary protocol bindings from servers and clients.We rec-ommend stripping everything you can off your network except TCP/IP.You can use the Matrix to find user connections via protocols and findwhich users’ workstations, servers, and printers are using which protocols.
■ Remove unnecessary routing protocols from interfaces that do not needrouting protocols configured. If you are using routing protocols, you canoptimize them as well. Use Sniffer Pro to capture traffic, analyze the fre-quency in which the updates are sent, and set the default update timersin the devices to higher levels.
■ Remove any excessive broadcast or multicasting devices and protocolsthat spew traffic all over your network.
■ Remove hubs and implement switches and, if possible, layer threeswitches in the core.
■ Upgrade to at least Fast Ethernet if not going to Gigabit or 10GigabitEthernet.
www.syngress.com
219_sniffer_12.qxd 6/28/02 12:25 PM Page 570
Troubleshooting Traffic for Network Optimization • Chapter 12 571
NOTE
One massive drawback of switches is that they do not block broadcasts.This is a major misconception of switch buyers. Yes, you eliminate quite afew issues, like packets being sent out all ports to find a destination withthe use of a MAC address mapping table kept in its memory, but that’snot going to stop “broadcast” traffic. Every time a PC on a segmentreceives a broadcast, it must then interrupt the CPU to determine if thePCitself is the destination of the packet.
■ Plan your Backbone appropriately by making sure that media speeds donot create any bottlenecks.
■ Use TCP/IP-based printing and remove any IPX/SPX and SAP trafficthat cause excessive overhead.
■ Look your client over for settings that you can optimize, such as autoframe type selection and browsers.
■ Check your servers to make sure they are not bottlenecking the networkby underperforming.
■ Check your applications with Sniffer Pro to make sure they are notusing small packets. Small packets can choke your devices by overuti-lizing their time to process a million tiny packets instead of fewer“larger” packets.
■ Use Sniffer Pro to assess utilization on the network with the Dashboardand set thresholds accordingly.
NOTE
A common complaint for slow networks is a users login scripts are map-ping either to excessive folders, drive mappings that go nowhere, or tonon-exsistent drives. When someone complains about the network beingslow, research what’s going on when they login to the server and whattheir drive mappings look like. Many times, inaccurate drive mappingswill slow a user down.
www.syngress.com
219_sniffer_12.qxd 6/28/02 12:25 PM Page 571

572 Chapter 12 • Troubleshooting Traffic for Network Optimization
Most of the things in this list have been touched on in other parts of thisbook. In this chapter we compile everything so you can thoroughly analyze andoptimize your network with the Sniffer Pro LAN Analyzer as your guide. If youimplement these helpful tips, you will notice a significant increase in networkfunctionality and performance.
Addressing Reliability IssuesAre your users confident that the network services are available when needed?Reliability is the term we use to describe the phenomenon of network servicesbeing available at least 99.999% of the time.This is also called five nines and isrelates to the term high availability. So are your network resources highly available?The way you achieve reliability in a network is to ensure that your networkresources are redundant and able to fail because backups are at the ready.
Here are a few ways to increase reliability in a network:
■ Test your backup solution before you need it. Make sure you know it works!
www.syngress.com
Performance Tuning Your ServersI would like to recommend a few articles on how to optimize servers fornetwork performance. Many times, the network is in fact high speed,but is choked by an underperforming server that makes the networkseem slow.
■ Performance, Tuning and Optimization for NovellNetware Servers http://support.novell.com/cgi-bin/search/searchtid.cgi?/10012765.htm
■ Windows 2000 Performance Tuning www.microsoft.com/technet/treeview/default.asp?url=/TechNet/prodtechnol/winxppro/proddocs/SAG_MPmonperf_28.asp
There are millions of tweaks, registry hacks, and settings changesthat essentially optimize speed on your network. For clients, you cancheck the binding order of protocols, which will help optimize speed onthe client.
Configuring & Implementing…
219_sniffer_12.qxd 6/28/02 12:25 PM Page 572

Troubleshooting Traffic for Network Optimization • Chapter 12 573
■ Implement load balancing and/or clustering on your servers, firewallsrouters, and switches. (Network devices like Cisco Routers use HSRPor Hot Standby Routing Protocol.)
■ Have an offsite disaster recovery plan for critical network resources.Have a set of tapes sent to it for emergency purposes.
■ Have redundant paths in the form of LAN cabling (using STP) orimplement a dial back up ISDN solution to your WAN links.
■ Implement a redundant solution like RAID 5 and have spare drives atthe ready.
■ Implement redundant power supplies and implement UPS systems foruninterruptible and clean power.
Most importantly, have a disaster recovery plan and capable technicians whocan live by it in a time of crisis.You may also want to run quality assurance teststo make sure all the investments you made actually work.You can use Sniffer Proin conjunction with all these other tips to provide reliable network services.
The Sniffer Pro Network Analyzer provides reliability by offering you “trig-gers” and “alarms” that you can set so when the network hits peak thresholds,you can be warned of issues that are occurring.To show you how you can useSniffer Pro to provide reliability to your network, let’s take this scenario into consideration.
You are concerned about a network segment being overrun by small packets.Small packets would be any packets under 64 bytes.You want to be alerted of aproblem so you can take care of it immediately by finding what devices on yournetwork segment are transmitting such a small packet size.
TIP
If you want to test the use of Sniffer Pro recording small packets, youcan ping yourself with the following:
C:\> ping 192.168.1.1 –t –l 50In this case, the –t will keep the pings continuous, the –l will set the
length of the packets, and the 50 is setting it to 50 bytes.
You diligently baseline your network and monitor it as carefully as you canwith the Sniffer Pro Dashboard. Set all your thresholds to where you need them
www.syngress.com
219_sniffer_12.qxd 6/28/02 12:25 PM Page 573
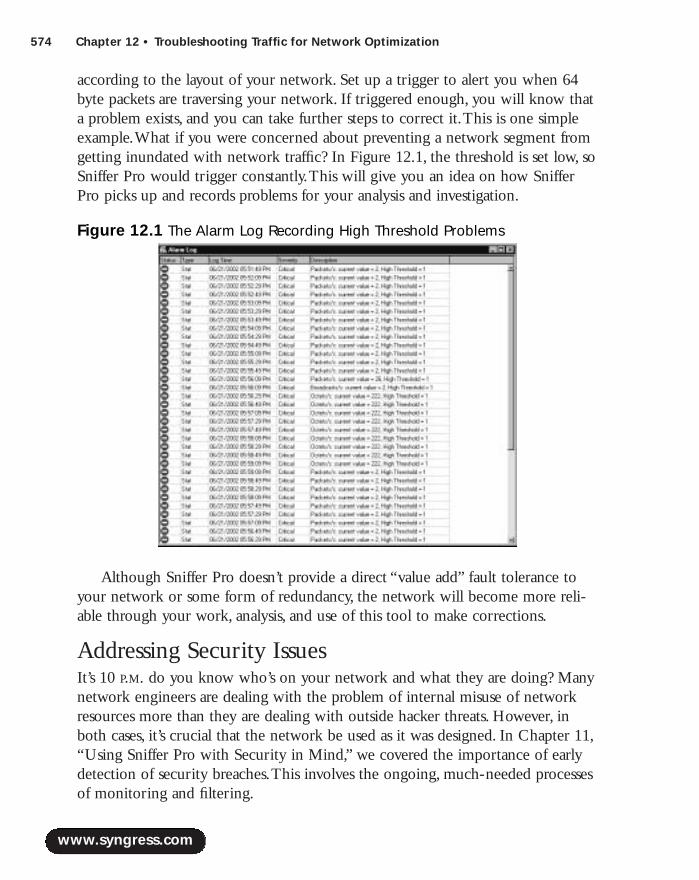
574 Chapter 12 • Troubleshooting Traffic for Network Optimization
according to the layout of your network. Set up a trigger to alert you when 64byte packets are traversing your network. If triggered enough, you will know thata problem exists, and you can take further steps to correct it.This is one simpleexample.What if you were concerned about preventing a network segment fromgetting inundated with network traffic? In Figure 12.1, the threshold is set low, soSniffer Pro would trigger constantly.This will give you an idea on how SnifferPro picks up and records problems for your analysis and investigation.
Although Sniffer Pro doesn’t provide a direct “value add” fault tolerance toyour network or some form of redundancy, the network will become more reli-able through your work, analysis, and use of this tool to make corrections.
Addressing Security IssuesIt’s 10 P.M. do you know who’s on your network and what they are doing? Manynetwork engineers are dealing with the problem of internal misuse of networkresources more than they are dealing with outside hacker threats. However, inboth cases, it’s crucial that the network be used as it was designed. In Chapter 11,“Using Sniffer Pro with Security in Mind,” we covered the importance of earlydetection of security breaches.This involves the ongoing, much-needed processesof monitoring and filtering.
www.syngress.com
Figure 12.1 The Alarm Log Recording High Threshold Problems
219_sniffer_12.qxd 6/28/02 12:25 PM Page 574

Troubleshooting Traffic for Network Optimization • Chapter 12 575
We can’t sit in front of our Sniffer Pro monitoring stations 24 hours a day, 7days a week. In Chapter 8,“Using Filters,” we covered filtering, which allows usto use Sniffer Pro to act as our eyes and ears, alerting us when there’s a situationthat needs our expert attention.
So what can you do to make your network better and make end users hap-pier with the Sniffer Pro? Well, sorry to say, but anytime you implement securityon a network, most users are not happy about that at all.This means you havedone some of the following to increase the productivity of your network:
■ Eliminate bandwidth consumption by using access lists and rules whichwill either block traffic or at least alert you to the fact that the networkis being saturated. Locking down security aids in increasing speed andreliability on the network.
■ Lock down what users can download by restricting certain file types. Ifyou stop users from downloading 800MBs worth of MP3 files from theInternet, then you have just increased speed and reliability on the network.
■ Lock down what users can download by restricting file size.This is justlike restricting file types, but instead of selecting what the end user can’tdownload, you are selecting a maximum size for any downloaded file.Users should be able to download Word documents.
■ Block what users can see. If they can’t see it, then, most times, theywon’t know it’s there.
■ Use logging, filtering, and blocking on the Internet Proxy Server torestrict users to what they are visiting and what they are doing on theInternet.
■ Security auditing is also a nice final touch to security to your network.
As you can see, working on security problems plays a big role in enablingtheother two key elements we discussed, speed and reliability.All you need is a secu-rity policy, like the disaster recovery policy is needed for reliability. It is a guidefor both action and enforcement. Following these simple tips will surely addmore security to your network, thus indirectly increasing its speed and reliability.
So what can Sniffer Pro do to help you increase security for end users tooptimize the network and its traffic use? Glad you asked…because Sniffer Pro isactually really handy at helping you optimize network traffic by nailing top pro-tocols in use.Your boss asks you,“Why is the network so slow? Did we not justimplement new network switches? What is going on?”You run, grab your laptop,
www.syngress.com
219_sniffer_12.qxd 6/28/02 12:25 PM Page 575
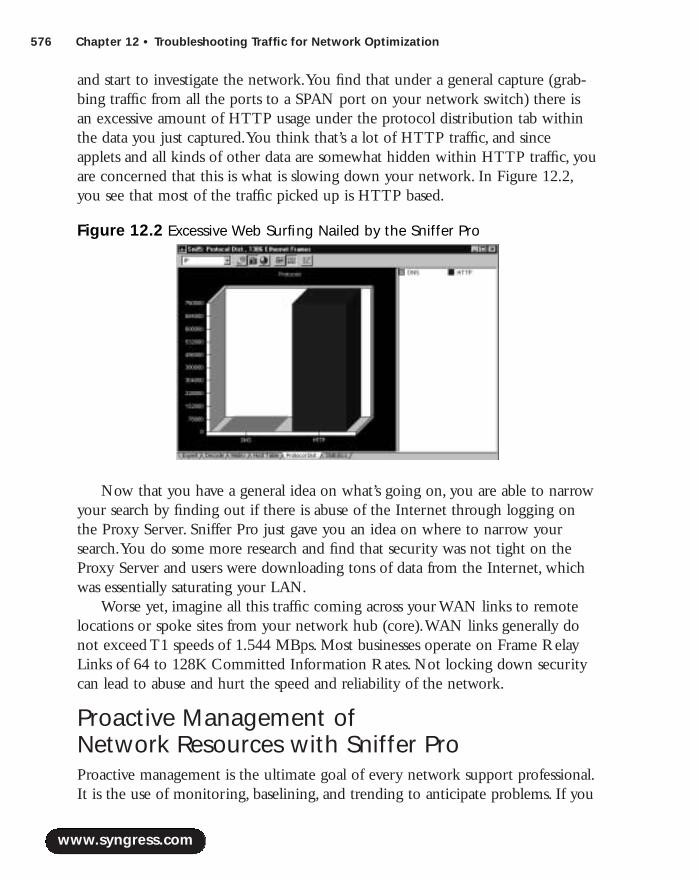
576 Chapter 12 • Troubleshooting Traffic for Network Optimization
and start to investigate the network.You find that under a general capture (grab-bing traffic from all the ports to a SPAN port on your network switch) there isan excessive amount of HTTP usage under the protocol distribution tab withinthe data you just captured.You think that’s a lot of HTTP traffic, and sinceapplets and all kinds of other data are somewhat hidden within HTTP traffic, youare concerned that this is what is slowing down your network. In Figure 12.2,you see that most of the traffic picked up is HTTP based.
Now that you have a general idea on what’s going on, you are able to narrowyour search by finding out if there is abuse of the Internet through logging onthe Proxy Server. Sniffer Pro just gave you an idea on where to narrow yoursearch.You do some more research and find that security was not tight on theProxy Server and users were downloading tons of data from the Internet, whichwas essentially saturating your LAN.
Worse yet, imagine all this traffic coming across your WAN links to remotelocations or spoke sites from your network hub (core).WAN links generally donot exceed T1 speeds of 1.544 MBps. Most businesses operate on Frame RelayLinks of 64 to 128K Committed Information Rates. Not locking down securitycan lead to abuse and hurt the speed and reliability of the network.
Proactive Management of Network Resources with Sniffer ProProactive management is the ultimate goal of every network support professional.It is the use of monitoring, baselining, and trending to anticipate problems. If you
www.syngress.com
Figure 12.2 Excessive Web Surfing Nailed by the Sniffer Pro
219_sniffer_12.qxd 6/28/02 12:25 PM Page 576

Troubleshooting Traffic for Network Optimization • Chapter 12 577
think of yourself as a plumber, proactive management with Sniffer Pro is whatyou use to stop a leak before your feet get wet.We’ll start with the basic func-tionality of Sniffer Pro: Monitoring your network traffic. By watching the flow ofyour network, you’ll be able to build a baseline, discover trends in usage, and,most importantly, stop problems proactively. Run your Sniffer Pro application tomonitor your network in real time.You can look at the Dashboard, as seen inFigure 12.3. Using the Dashboard proactively will allow you to find packets thatare small and inundating you network, broadcast traffic problems, and all kinds ofother problems.You can refer back to Chapter 5 for a discussion of how to base-line your network with the Sniffer Pro network analyzer.
Another way you can manage your traffic is to know how many nodes areactually on your network. By using the Host Table function of the Monitormenu, we can use Sniffer Pro to scan our network and discover all MAC, IP, orIPX addresses. If this has never been done on your network before, look thisinformation over carefully. It’s not unusual to find old systems, long forgotten butstill active and still utilizing bandwidth.Also, you may find unauthorized systems.Make sure you know what each entry in the Host Menu is doing and who isusing it.As Figure 12.4 shows, the Host Table will show you the Top 10 Hosts onyour network by total bytes.This is important information when you want toeliminate problems before they start.
www.syngress.com
Figure 12.3 Viewing the Dashboard in Real Time
219_sniffer_12.qxd 6/28/02 12:25 PM Page 577
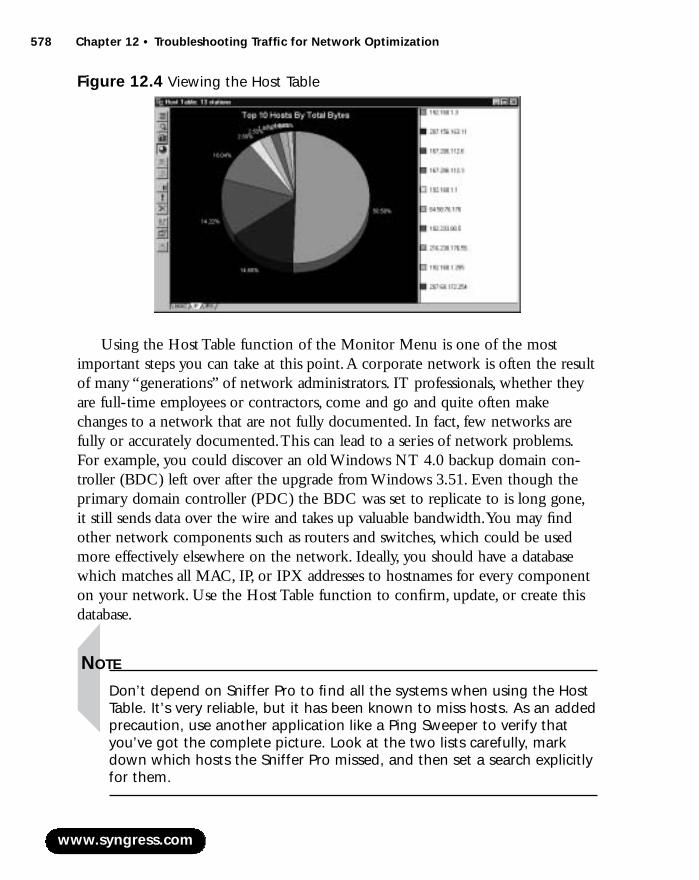
578 Chapter 12 • Troubleshooting Traffic for Network Optimization
Using the Host Table function of the Monitor Menu is one of the mostimportant steps you can take at this point.A corporate network is often the resultof many “generations” of network administrators. IT professionals, whether theyare full-time employees or contractors, come and go and quite often makechanges to a network that are not fully documented. In fact, few networks arefully or accurately documented.This can lead to a series of network problems.For example, you could discover an old Windows NT 4.0 backup domain con-troller (BDC) left over after the upgrade from Windows 3.51. Even though theprimary domain controller (PDC) the BDC was set to replicate to is long gone,it still sends data over the wire and takes up valuable bandwidth.You may findother network components such as routers and switches, which could be usedmore effectively elsewhere on the network. Ideally, you should have a databasewhich matches all MAC, IP, or IPX addresses to hostnames for every componenton your network. Use the Host Table function to confirm, update, or create thisdatabase.
NOTE
Don’t depend on Sniffer Pro to find all the systems when using the HostTable. It’s very reliable, but it has been known to miss hosts. As an addedprecaution, use another application like a Ping Sweeper to verify thatyou’ve got the complete picture. Look at the two lists carefully, markdown which hosts the Sniffer Pro missed, and then set a search explicitlyfor them.
www.syngress.com
Figure 12.4 Viewing the Host Table
219_sniffer_12.qxd 6/28/02 12:25 PM Page 578

Troubleshooting Traffic for Network Optimization • Chapter 12 579
There is another way to find who is on your network. If you need to findhosts within a specific subnet, you can use the Address Book to find hosts onyour network. Open the Address Book by going to Tools | Address Book andclick on the magnifying glass on the right hand side tool bar.This will openthe Autodiscovery dialog box as seen in Figure 12.5.This is a good way to scanentire subnets for hosts, and they will be added directly to the Address Book foryour analysis.
As with the Host Table, do not trust this tool to map out your network. Ihave found that this is also inaccurate at times. It did not find hosts that I knewwere on my network and up and running.You can search for one host by puttingin its IP address and putting the last octet in both the From and To fields in theAutodiscovery options dialog box.You would enter it like this:
From: 10.0.0.5
To: 10.0.0.5
One last way to find connections and traffic on your network is to view theMatrix to find and map out which hosts are connecting to your network andwhat they are communicating to. In Figure 12.6, you see the Matrix in use. Here,I was able to find a host doing a “ping sweep” on the corporate network. Nowthat we’ve confirmed all the valid devices on our network (and possibly elimi-nated some invalid ones!), let’s look at monitoring their activity.
Next up is one last look at the Dashboard.The Dashboard function of SnifferPro is a great way to start monitoring your network and building your baseline.Let’s look at the Dashboard and how to use the data it displays (see Figure 12.7).
www.syngress.com
Figure 12.5 Using the Address Book for Autodiscovery of Subnets
219_sniffer_12.qxd 6/28/02 12:25 PM Page 579
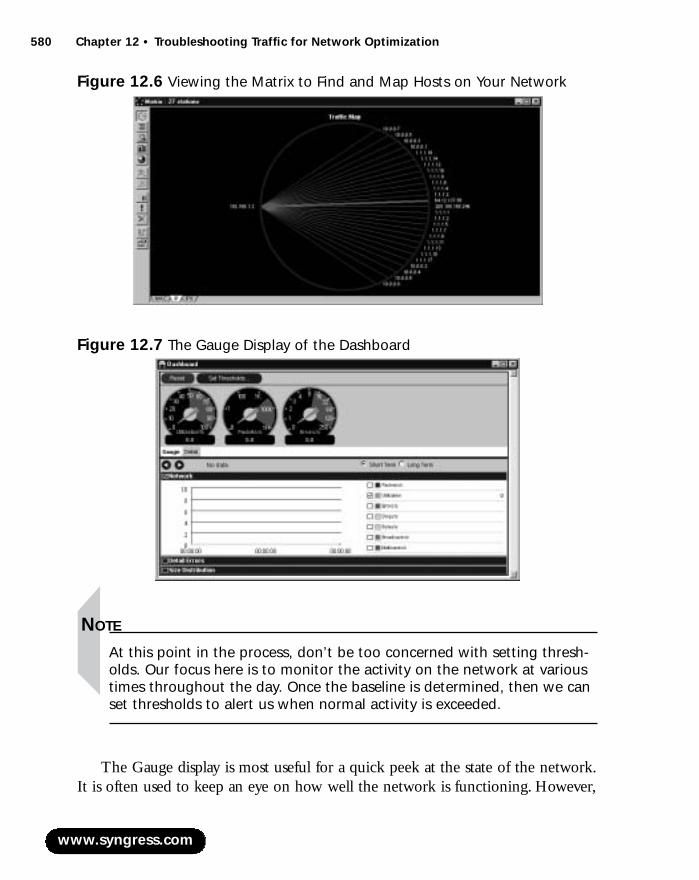
580 Chapter 12 • Troubleshooting Traffic for Network Optimization
NOTE
At this point in the process, don’t be too concerned with setting thresh-olds. Our focus here is to monitor the activity on the network at varioustimes throughout the day. Once the baseline is determined, then we canset thresholds to alert us when normal activity is exceeded.
The Gauge display is most useful for a quick peek at the state of the network.It is often used to keep an eye on how well the network is functioning. However,
www.syngress.com
Figure 12.6 Viewing the Matrix to Find and Map Hosts on Your Network
Figure 12.7 The Gauge Display of the Dashboard
219_sniffer_12.qxd 6/28/02 12:25 PM Page 580
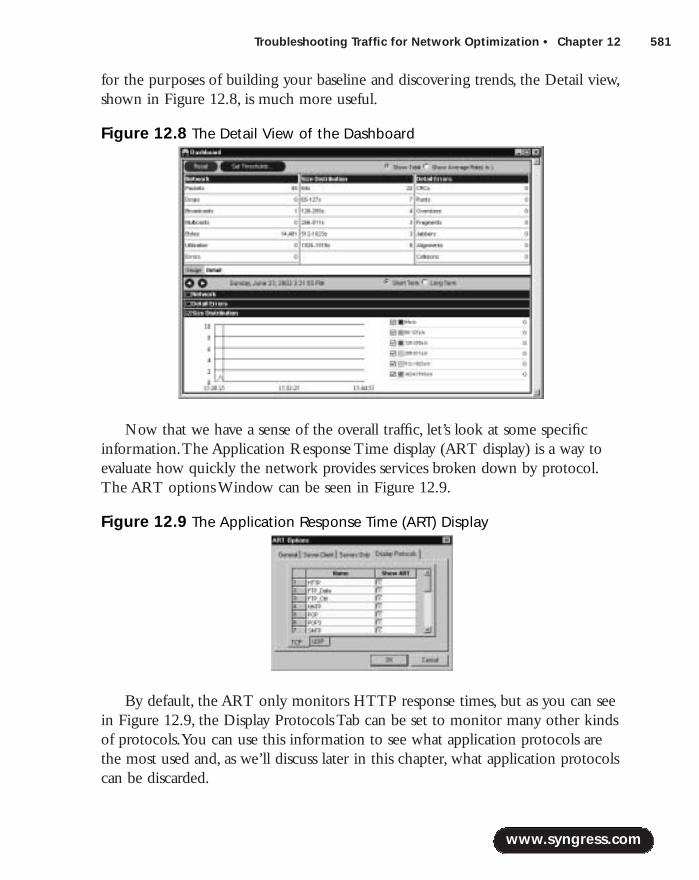
Troubleshooting Traffic for Network Optimization • Chapter 12 581
for the purposes of building your baseline and discovering trends, the Detail view,shown in Figure 12.8, is much more useful.
Now that we have a sense of the overall traffic, let’s look at some specificinformation.The Application Response Time display (ART display) is a way toevaluate how quickly the network provides services broken down by protocol.The ART options Window can be seen in Figure 12.9.
By default, the ART only monitors HTTP response times, but as you can seein Figure 12.9, the Display Protocols Tab can be set to monitor many other kindsof protocols.You can use this information to see what application protocols arethe most used and, as we’ll discuss later in this chapter, what application protocolscan be discarded.
www.syngress.com
Figure 12.8 The Detail View of the Dashboard
Figure 12.9 The Application Response Time (ART) Display
219_sniffer_12.qxd 6/28/02 12:25 PM Page 581
582 Chapter 12 • Troubleshooting Traffic for Network Optimization
NOTE
You learned how to configure ART in Chapter 4, “Configuring Sniffer Proto Monitor Network Applications.”
ART is also a valuable tool to use to make sure there are no unauthorizedapplications being used on your network. For example, instant messaging or filesharing applications pose a serious security risk to any network since they are notbuilt with security in mind and can be misused by hackers. Often, you’ll findpolicies regarding the acceptable usage of Internet access, but nothing regardingstreaming audio, instant messaging, or file sharing applications. If your organiza-tion doesn’t have a policy regarding such applications, encourage them to imple-ment one.
Last, but hardly least, make sure you discuss the expectations and needs of thenetwork with the users.This, as much as anything else, will aide you in your goalof speedy, reliable, and secure network services. One way is to attend the meetings
www.syngress.com
Wear the White HatOne of the most valuable tools you can have, and one of the mostdestructive forces you’ll ever encounter on your network, will be yourusers. Whether users are part of the problem or part of the solutiondepends on how they perceive you. If you are perceived as a heavy-handed dictator using Sniffer Pro like a bloodhound to weed out anyand all network infractions, then you have set yourself up as the enemy.If, on the other hand, you are perceived as a source of assistance, assomeone who uses tools like Sniffer Pro to resolve problems, then you’veadded hundreds of extra hands to your network support team. If youfind that there are users on your network that are not “behaving” andcreating problems for you, you may want to enforce a security policy(with management’s approval and support). If you are a manager, youshould have a security policy in place already.
Designing & Planning…
219_sniffer_12.qxd 6/28/02 12:25 PM Page 582

Troubleshooting Traffic for Network Optimization • Chapter 12 583
of other departments. Make sure the users have reasonable expectations based onthe level of service available. Invite them to give you feedback. Find out howthey use the network and what you can do to make it more effective. Somethingas simple as moving a printer to a more convenient and accessible location can goa long way toward improving communication between you and your users. Justlooking at packets wouldn’t tell you that a majority of users have to schlep downthe hall to retrieve printed documents.
Now that you’ve established how you want to monitor, let’s build our base-line documents. In Chapter 6,“Capturing Network for Data Analysis,” we cov-ered capturing network data in great detail. For the purposes of our baselinedocument, we need to determine several key points:
■ What do we want to monitor? This should be determined by theneeds of the business and information gathered using tools such as ART.Make sure you understand what protocols are the most important to thebusiness goals of the organization.
■ When do we want to monitor? Select specific times to capture trafficto give you a variety of samples and reflect the highest demands on net-work resources and the lowest. For example, you know that first thing inthe morning, as people arrive to work and log on to the network, trafficwill be higher.This data should be compared to a time when thedemands are much lower, such as overnight or on weekends. Use histor-ical samples to build a graphical timeline, which shows the trends of yourorganization’s network usage.A chart, such as the one shown in Figure12.10, can be exported for use in your baseline documents.You can getgreat information from sampling, like spikes and surges in network traffic.You can optimize traffic based on historical sampling.
■ Where do we want to monitor? Later in this chapter we’ll discussattaching directly to switches for analysis. It’s important that you monitorand collect samples from the main access points on your network. Don’trely on data collected just from the obvious points such as your gatewayto the Internet, your Master WINS Server, and PDC. Look at data fromunlikely areas as well. Perform spot checks at various points all over yournetwork to get an accurate picture of where the highest demands arebeing made.
www.syngress.com
219_sniffer_12.qxd 6/28/02 12:25 PM Page 583
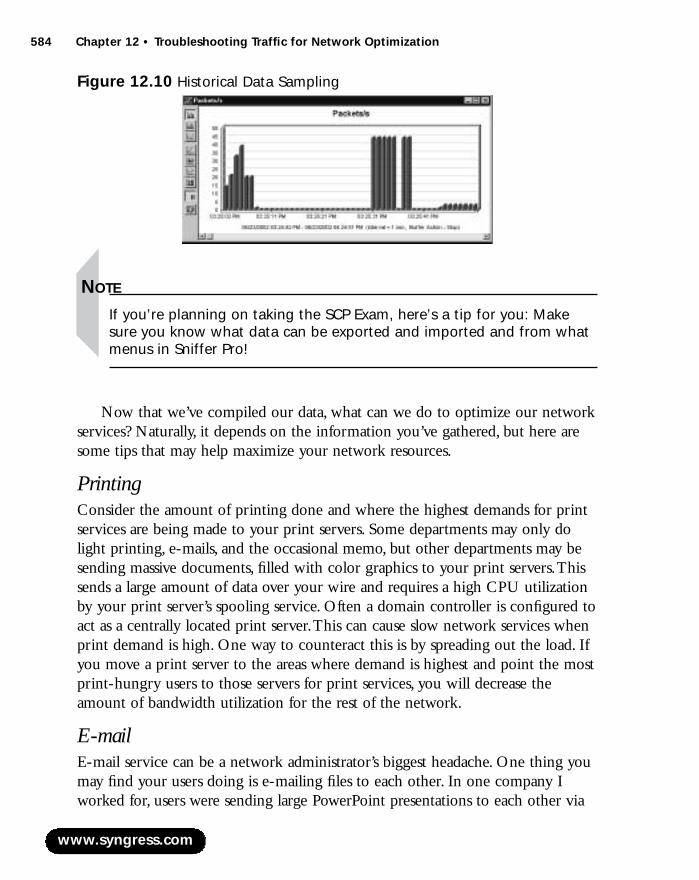
584 Chapter 12 • Troubleshooting Traffic for Network Optimization
NOTE
If you’re planning on taking the SCP Exam, here’s a tip for you: Makesure you know what data can be exported and imported and from whatmenus in Sniffer Pro!
Now that we’ve compiled our data, what can we do to optimize our networkservices? Naturally, it depends on the information you’ve gathered, but here aresome tips that may help maximize your network resources.
PrintingConsider the amount of printing done and where the highest demands for printservices are being made to your print servers. Some departments may only dolight printing, e-mails, and the occasional memo, but other departments may besending massive documents, filled with color graphics to your print servers.Thissends a large amount of data over your wire and requires a high CPU utilizationby your print server’s spooling service. Often a domain controller is configured toact as a centrally located print server.This can cause slow network services whenprint demand is high. One way to counteract this is by spreading out the load. Ifyou move a print server to the areas where demand is highest and point the mostprint-hungry users to those servers for print services, you will decrease theamount of bandwidth utilization for the rest of the network.
E-mailE-mail service can be a network administrator’s biggest headache. One thing youmay find your users doing is e-mailing files to each other. In one company Iworked for, users were sending large PowerPoint presentations to each other via
www.syngress.com
Figure 12.10 Historical Data Sampling
219_sniffer_12.qxd 6/28/02 12:25 PM Page 584

Troubleshooting Traffic for Network Optimization • Chapter 12 585
e-mail.The users were in the same building; some were not more than severalcubicles apart! The files, often 15MB or more, were sent by one user, hit theMTA on the Exchange e-mail server, then sent back down the wire to the nextuser, who reviewed it, made changes, and sent it back. Considering how oftenthis was being done by so many users, this was a sizable drain on network band-width and on the resources of the e-mail server! While the MTA service on theExchange server was processing all those monster-sized files, all the other mailwas backing up behind them.The solution was to build a file server for thatdepartment so the users could share group documents. Using local e-mail serversas file sharing servers can be a waste of valuable network resources.
Unauthorized Internet TrafficUnauthorized Internet traffic can eat up bandwidth that could be used for legiti-mate business purposes.Any company that provides Internet access will have anacceptable usage policy. Make sure you know what that policy covers and deter-mine if it is comprehensive enough based on your monitoring of Internet use. Ifneeded, make sure it restricts the use of bandwidth-hogging, unsecured applica-tions. Stopping by a Web site for sports scores or news headlines may be consid-ered acceptable under the organization’s policies, but things like downloadingvideo highlights of last night’s game, QuickTime movie trailers, real-time stockquotes, instant messaging, and streaming audio music all waste bandwidth andpresent a very real security risk. Monitor for this kind of usage, and make sure aminority of users is not monopolizing Internet access.Table 12.1 lists some of themore notorious applications and the ports they use. Keep in mind that this isonly a portion of the applications of this type and that many applications allowthe user to configure custom ports.
Table 12.1 Popular Network Applications
Application Description Ports
AOL Instant A chat and filesharing Accesses the list of users Messenger application from the AOL server via TCP
5190AOL via TCP/IP A direct link to an AOL TCP port 5190
account over the InternetDirectX Gaming A Microsoft multiplayer TCP/UDP ports 47624 and
gaming protocol 2300-2400
www.syngress.com
Continued
219_sniffer_12.qxd 6/28/02 12:25 PM Page 585
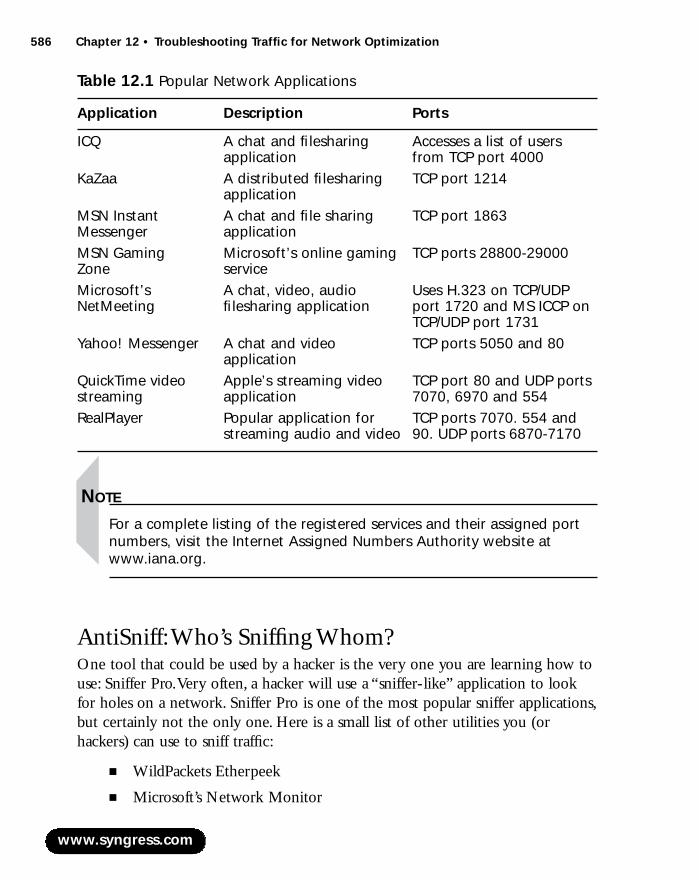
586 Chapter 12 • Troubleshooting Traffic for Network Optimization
ICQ A chat and filesharing Accesses a list of users application from TCP port 4000
KaZaa A distributed filesharing TCP port 1214application
MSN Instant A chat and file sharing TCP port 1863Messenger application MSN Gaming Microsoft’s online gaming TCP ports 28800-29000Zone serviceMicrosoft’s A chat, video, audio Uses H.323 on TCP/UDP NetMeeting filesharing application port 1720 and MS ICCP on
TCP/UDP port 1731Yahoo! Messenger A chat and video TCP ports 5050 and 80
application QuickTime video Apple’s streaming video TCP port 80 and UDP ports streaming application 7070, 6970 and 554RealPlayer Popular application for TCP ports 7070. 554 and
streaming audio and video 90. UDP ports 6870-7170
NOTE
For a complete listing of the registered services and their assigned portnumbers, visit the Internet Assigned Numbers Authority website atwww.iana.org.
AntiSniff:Who’s Sniffing Whom?One tool that could be used by a hacker is the very one you are learning how touse: Sniffer Pro.Very often, a hacker will use a “sniffer-like” application to lookfor holes on a network. Sniffer Pro is one of the most popular sniffer applications,but certainly not the only one. Here is a small list of other utilities you (orhackers) can use to sniff traffic:
■ WildPackets Etherpeek
■ Microsoft’s Network Monitor
www.syngress.com
Table 12.1 Popular Network Applications
Application Description Ports
219_sniffer_12.qxd 6/28/02 12:25 PM Page 586
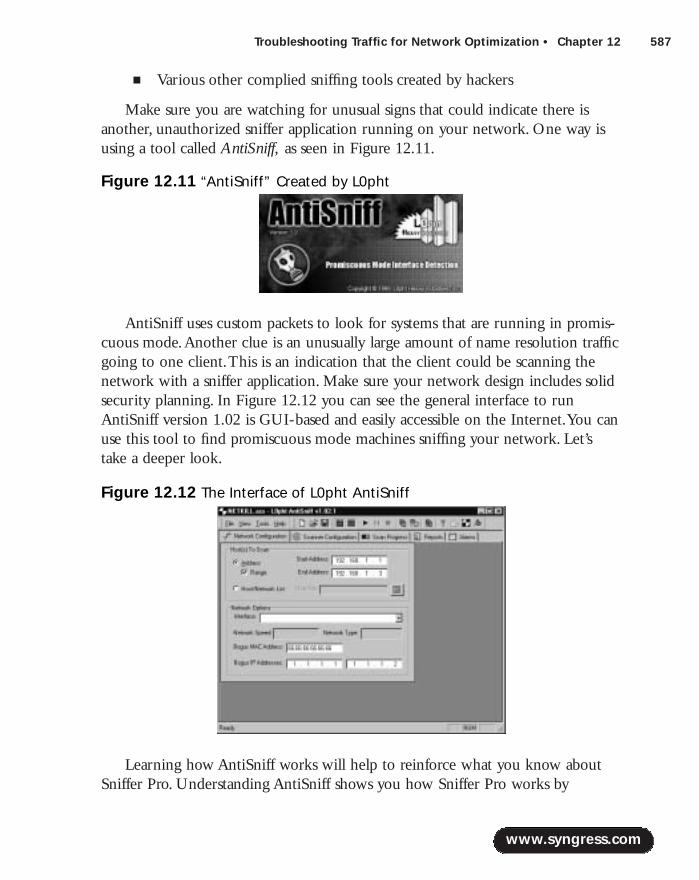
Troubleshooting Traffic for Network Optimization • Chapter 12 587
■ Various other complied sniffing tools created by hackers
Make sure you are watching for unusual signs that could indicate there isanother, unauthorized sniffer application running on your network. One way isusing a tool called AntiSniff, as seen in Figure 12.11.
AntiSniff uses custom packets to look for systems that are running in promis-cuous mode.Another clue is an unusually large amount of name resolution trafficgoing to one client.This is an indication that the client could be scanning thenetwork with a sniffer application. Make sure your network design includes solidsecurity planning. In Figure 12.12 you can see the general interface to runAntiSniff version 1.02 is GUI-based and easily accessible on the Internet.You canuse this tool to find promiscuous mode machines sniffing your network. Let’stake a deeper look.
Learning how AntiSniff works will help to reinforce what you know aboutSniffer Pro. Understanding AntiSniff shows you how Sniffer Pro works by
www.syngress.com
Figure 12.11 “AntiSniff” Created by L0pht
Figure 12.12 The Interface of L0pht AntiSniff
219_sniffer_12.qxd 6/28/02 12:25 PM Page 587

588 Chapter 12 • Troubleshooting Traffic for Network Optimization
exploiting its operation.AntiSniff is network card promiscuous mode detector: Itruns in promiscuous mode to grab all packets on the wire, not just the ones thatare broadcast-based or “destined” to get to the host running Sniffer Pro.AntiSniffsends a series of carefully crafted packets in a certain order to a target machine. Itthen gets the results and performs timing tests against the target, measuring thetiming results while monitoring the target’s responses on the network. It thendetermines if the target is in promiscuous mode.
The proactive side of using AntiSniff is that you will essentially be removing apossible traffic generator on your network. If someone on the network is using asniffer without you knowing, they could essentially be grabbing data, accountnames, passwords, or generating and sending out traffic.You are trying to opti-mize and proactively manage your network, and someone is using your own toolsagainst you! AntiSniff to the rescue!
One cool thing you can get out of AntiSniff is the highly accurate detectionof promiscuous mode Ethernet cards.When AntiSniff is used, you will eliminatethis threat from your network very quickly as well as save your sessions andalarms.Alarming is useful because you can set this application to run and shootyou an e-mail when an alarm is triggered, as seen in Figure 12.13
On the bottom of Figure 12.13 you can see that graphics and noises can bethrown at you as needed as well. Figure 12.14 shows the default image used toalarm you when AntiSniff confirms a security violation.
www.syngress.com
Figure 12.13 Setting Alarms on Your AntiSniff Application
219_sniffer_12.qxd 6/28/02 12:25 PM Page 588

Troubleshooting Traffic for Network Optimization • Chapter 12 589
As always, I stand by my words as a writer, engineer, and analyst to alwaysgive the good and bad on every product I touch. In that spirit, here are some dis-advantages to running AntiSniff that you should be aware of:
■ It’s only going to be simple for someone with knowledge of sniffing andprotocols and deep networking knowledge (all of which you shouldnow have).
■ It is very resource intensive.A dedicated machine (a PC or Laptop) run-ning AntiSniff is recommended. If you run this on your workstation,your machine’s resources will be depleted.
■ If you are setting your network analysis applications to report to anet-work management utility (NMS) that collects traps, then you’re out ofluck,AntiSniff doesn’t support the use of Simple Network ManagementProtocol (SNMP).
■ AntiSniff only functions on the same segment as the machine runningAntiSniff.
NOTE
Other references to scanning tools that are free to you (and Script Kiddiehackers) are found at the @stake website (www.atstake.com) and atSam Spade (www.samspade.org).
Security is something you should take very seriously because you have seenvery clearly that you can grab passwords and perform other “hacker like” activi-ties with the Sniffer Pro.You will be privy to sensitive information: Make sure
www.syngress.com
Figure 12.14 You Are Being Hacked!
219_sniffer_12.qxd 6/28/02 12:25 PM Page 589
590 Chapter 12 • Troubleshooting Traffic for Network Optimization
you keep your capture files secure and the information you find (if sensitive) toyourself and your client. If you are a security professional and you are looking forhackers on your network using a tool like Sniffer Pro, then you now know howto find and eliminate them.
Finding Unnecessary Protocols with the Sniffer Pro Sniffer Pro can be very useful in finding and eliminating bandwidth-hoggingprotocols.There is certainly no need to take up valuable network resources withprotocols, which aren’t being used by your users. In this section we’ll cover howto look for those protocols your network can live without and discuss some ofthe properties of the most common protocols. Let’s think about what the impli-cations of leaving multiple protocols are on a network and why we would evenwant to start removing protocols on your network in the first place. First off, youshould understand why there might be many protocols on your network.
Places to find protocols that you may not know about include:
■ Printers are the most vicious culprits of garbage traffic on your network.You can often eliminate a significant amount of traffic by doing an anal-ysis sweep on your printers.
■ Cisco Routers and the Cisco Discovery Protocol (CDP) are also trafficissues when the CDP starts talking to your Cisco LAN switches.Youwill definitely grab this traffic if it is enabled. Running CDP is a securityrisk.A quick look at Figure 12.15 shows just how revealing it can be. Iwould say to just disable it by going into your routers (and switches) andusing the global configuration command: no cdp run.
NOTE
To turn CDP off, you will have multiple choices of platforms to turn if offfrom. Here is a breakdown of the commands for each:
■ For Cisco IOS on Global: no cdp run■ For Cisco IOS on Interface: no cdp enable■ For Cisco CatOS on Switches: set cdp disable
www.syngress.com
219_sniffer_12.qxd 6/28/02 12:25 PM Page 590

Troubleshooting Traffic for Network Optimization • Chapter 12 591
■ Any old hub, switch, or router (Wellfleet, Bay, Nortel, Synoptic, etc.) maybe broadcasting or multicasting traffic to include breath of life (BOFL)packets. If you are unsure, then look up the Ethertype codes within theframe to figure out what you have captured.
■ Any server running Routing Information Protocol (RIP) or, worse yet,Novell servers acting as routers running Network Link Services Protocol(NLSP), or Internet Packet Exchange (IPX) RIP. Disable Novell Serverrouting if unneeded and add a static router (default gateway) withinInetcfg.nlm to eliminate that traffic.
■ Servers, and other devices using SNMP that is not needed. I have foundservers and other devices still pointing to an NMS that has long beenremoved and have also found devices polling absolutely nothing.All thisis traffic generated on your network.
■ Servers with multiple protocols bound to their interface cards.
■ Novell Clients with auto frame type detection set to “auto.”This is reallybad because essentially every Novell client that boots up has to broadcastto a server to find out what frame type it should be using.This is forevery client in your network… it can add up.
www.syngress.com
Figure 12.15 Viewing Excessive CDP Traffic on Your Network
219_sniffer_12.qxd 6/28/02 12:25 PM Page 591
592 Chapter 12 • Troubleshooting Traffic for Network Optimization
■ Avoid using multiple encapsulation types for IPX; broadcasts will bepropagated for every type in use on your network.You can bind mul-tiple encapsulation types to servers and this adds overhead.
■ Turn off Spanning Tree Protocol (STP) on any port that is not or willnever be connected to other hubs or switches. (Be careful that someonedoesn’t plug one in without you knowing, or you will have a problem!)
■ Old equipment that is malfunctioning like a chattering NIC can create alot of unwanted traffic on your network.Worse yet, it can perform ringresets on Token Rings and bring up ISDN lines if not configured prop-erly. Keep an eye out for problematic devices that need to be repaired orreplaced.
■ AppleTalk (AppleShare) configured hosts are a thing of the past. Mosttimes, you can set the Macs to use IP, but many times the AppleTalk isleft in place all over the network.Think it’s not creating a trafficproblem? Use the Sniffer Pro and you’ll be surprised as to how muchtraffic is still being passed with AppleTalk.
■ Clients with File and Print Sharing (or the Server Service) running aremajor broadcast players.Yes, that simple configuration to enable File andPrint Sharing or enabling the Server Service gives your clients the rightto share folders and Printers and act like a server, but what you also didwas allow that client to participate in the Browser Service.Visit Chapter4 to see the many problems associated with allowing this to happen.
■ NetBIOS-enabled clients are also huge broadcast and bandwidth junkies.As a host on the network uses NetBIOS, it works as a broadcast-basedprotocol.Without the use of a WINS server, you are going to have mas-sive broadcast issues with this protocol. Use a WINS server and if youcan, disable this monster of a protocol if possible.
■ Clients with multiple protocols configured, like IPX and NetBEUI, arealso problematic for two reasons: Binding order slows down the clientand multiple protocols that use broadcast based means of communicationwill add more traffic to your network segment that other devices have todeal with.When you bind multiple protocols to your network interfacecard, you can only transmit via one protocol at a time, and worse yetthere is a preferred binding order. In Figure 12.12, the way to see (andfix) the binding order problem is to do the following:
www.syngress.com
219_sniffer_12.qxd 6/28/02 12:25 PM Page 592
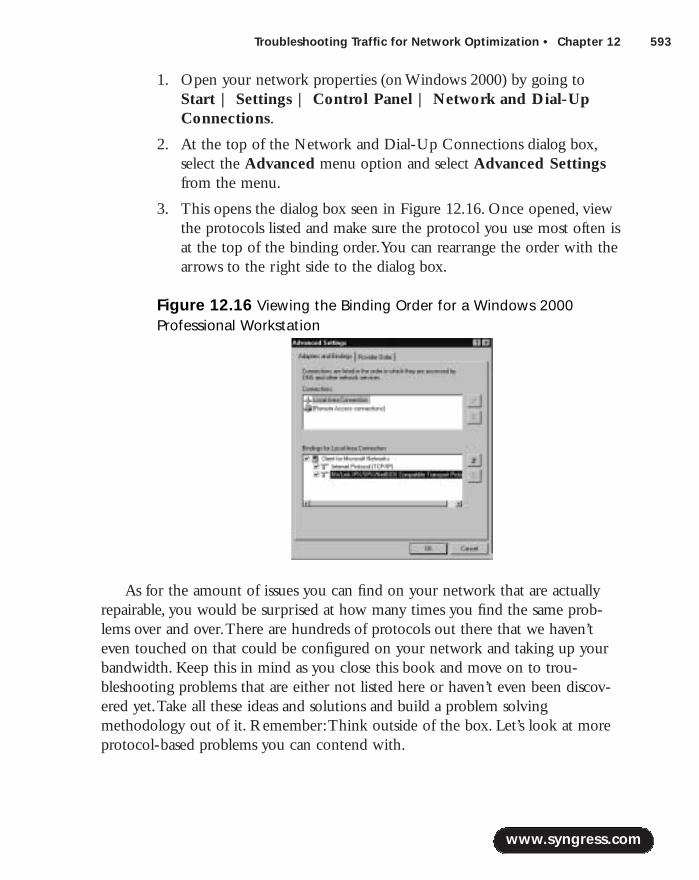
Troubleshooting Traffic for Network Optimization • Chapter 12 593
1. Open your network properties (on Windows 2000) by going toStart | Settings | Control Panel | Network and Dial-UpConnections.
2. At the top of the Network and Dial-Up Connections dialog box,select the Advanced menu option and select Advanced Settingsfrom the menu.
3. This opens the dialog box seen in Figure 12.16. Once opened, viewthe protocols listed and make sure the protocol you use most often isat the top of the binding order.You can rearrange the order with thearrows to the right side to the dialog box.
As for the amount of issues you can find on your network that are actuallyrepairable, you would be surprised at how many times you find the same prob-lems over and over.There are hundreds of protocols out there that we haven’teven touched on that could be configured on your network and taking up yourbandwidth. Keep this in mind as you close this book and move on to trou-bleshooting problems that are either not listed here or haven’t even been discov-ered yet.Take all these ideas and solutions and build a problem solvingmethodology out of it. Remember:Think outside of the box. Let’s look at moreprotocol-based problems you can contend with.
www.syngress.com
Figure 12.16 Viewing the Binding Order for a Windows 2000Professional Workstation
219_sniffer_12.qxd 6/28/02 12:25 PM Page 593

594 Chapter 12 • Troubleshooting Traffic for Network Optimization
Is TCP/IP Perfect?“Is running a pure TCP/IP network the answer to all your questions of problem-atic issues?”The answer to that question is,“Nothing is perfect,” but TCP/IP asof now is by far the best choice. Let’s look at issues related directly to TCP/IP.IP-based networks will of course broadcast and multicast, and the main culprit oftraffic with IP is ARP. Let’s look at the traffic-inducing issues with TCP/IP.
TCP/IP Workstation TrafficAn IP workstation broadcasts an Address Resolution Protocol (ARP) request everytime it needs to resolve a new IP address on your network. For the most part,ARPis not a big broadcast problem on your network, but it is part of the TCP/IP pro-tocol stack and it does create broadcast traffic.TCP/IP workstations will, for themost part, cache addresses for roughly two hours.What’s nice about ARP is that theoverhead is low.Although the broadcasts can add up at times, it will not toppleyour network if the amount of the broadcasting traffic is not in “broadcast storm”limits. In Figure 12.17, you see the captured ARP frame broadcast.
NOTE
To see your workstation ARP cache, open a command prompt and typeArp -a.
TCP/IP Router TrafficTCP/IP will also have broadcast traffic based on your routing protocols config-ured in your routers as well. If you are using anything other than RIP versions 1
www.syngress.com
Figure 12.17 ARP Broadcast Traffic on the LAN
219_sniffer_12.qxd 6/28/02 12:25 PM Page 594
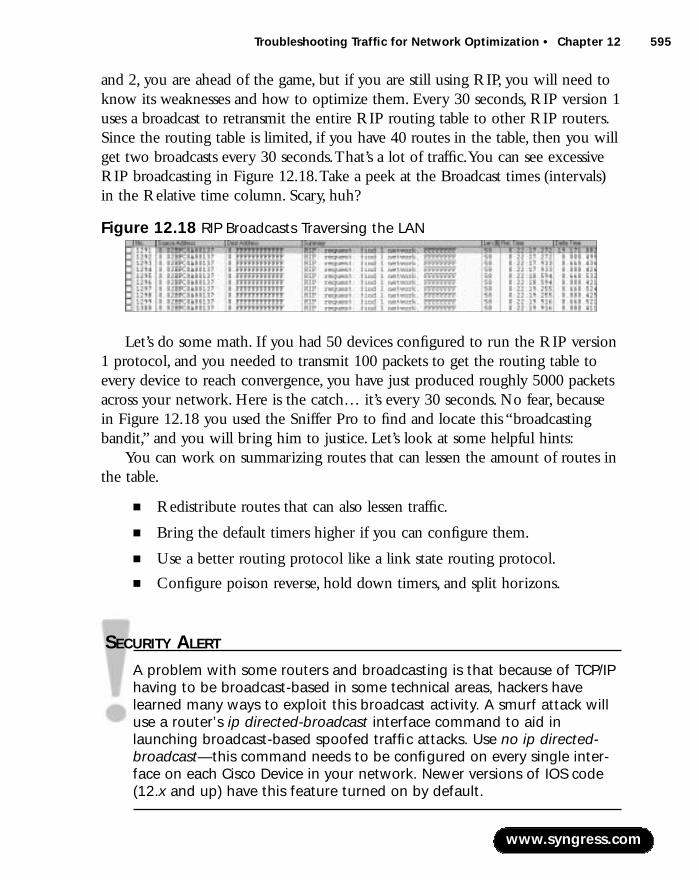
Troubleshooting Traffic for Network Optimization • Chapter 12 595
and 2, you are ahead of the game, but if you are still using RIP, you will need toknow its weaknesses and how to optimize them. Every 30 seconds, RIP version 1uses a broadcast to retransmit the entire RIP routing table to other RIP routers.Since the routing table is limited, if you have 40 routes in the table, then you willget two broadcasts every 30 seconds.That’s a lot of traffic.You can see excessiveRIP broadcasting in Figure 12.18.Take a peek at the Broadcast times (intervals)in the Relative time column. Scary, huh?
Let’s do some math. If you had 50 devices configured to run the RIP version1 protocol, and you needed to transmit 100 packets to get the routing table toevery device to reach convergence, you have just produced roughly 5000 packetsacross your network. Here is the catch… it’s every 30 seconds. No fear, becausein Figure 12.18 you used the Sniffer Pro to find and locate this “broadcastingbandit,” and you will bring him to justice. Let’s look at some helpful hints:
You can work on summarizing routes that can lessen the amount of routes inthe table.
■ Redistribute routes that can also lessen traffic.
■ Bring the default timers higher if you can configure them.
■ Use a better routing protocol like a link state routing protocol.
■ Configure poison reverse, hold down timers, and split horizons.
SECURITY ALERT
A problem with some routers and broadcasting is that because of TCP/IPhaving to be broadcast-based in some technical areas, hackers havelearned many ways to exploit this broadcast activity. A smurf attack willuse a router’s ip directed-broadcast interface command to aid inlaunching broadcast-based spoofed traffic attacks. Use no ip directed-broadcast—this command needs to be configured on every single inter-face on each Cisco Device in your network. Newer versions of IOS code(12.x and up) have this feature turned on by default.
www.syngress.com
Figure 12.18 RIP Broadcasts Traversing the LAN
219_sniffer_12.qxd 6/28/02 12:25 PM Page 595
596 Chapter 12 • Troubleshooting Traffic for Network Optimization
Do you still think TCP/IP is the pristine gem you thought it was? It is stillby far the best out of the bunch and the most widely used, but don’t be fooledby its endearing innocence. It is also by far the most hacked protocol on themarket today as well as being broadcast-based depending on how you have itconfigured.
All in all, you will want to run TCP/IP natively in your environment if youcan. It is by far the most widely used and accepted protocol in use and is abso-lutely not going anywhere anytime soon. It’s the best alternative, and the mostimportant thing for you to remember as a network and protocol analysis techni-cian is that using Sniffer Pro will help you to pinpoint deficiencies in TCP/IP (orany other supported protocol stack) and help you to look like the superstar foroptimizing the traffic on your network. Let’s move on to the other protocols andsee what they have to offer in the way of unwanted traffic that needs optimizing.
www.syngress.com
Benefits of Pure IP EnvironmentsOften, the SCP is asked for an exact list of why it’s better to run TCP/IPand eliminate the use of all other protocols. I have compiled a “Top Ten”list for you to use if asked:
1. Less routing protocols needed, hence reduction of broadcasttraffic and overhead.
2. One protocol bound to all devices, no need to have morethan one protocol bound to slow down the clients.
3. Less network protocol overhead.
4. Management of one technology (that is already hard tounderstand and manage) and it’s easier to manage one pro-tocol instead of multiple protocols.
5. Widely used, accepted, and implemented (universally used onthe Internet).
6. Eliminates the need for protocol gateways, which can be abottleneck.
Configuring & Implementing…
Continued
219_sniffer_12.qxd 6/28/02 12:25 PM Page 596
Troubleshooting Traffic for Network Optimization • Chapter 12 597
Chatty ProtocolsSo, have you heard? “Blah, blah, blah, blah…” Not in the mood for small talk? Youneed to be the “network small talk eliminator.” Networks today are inundatedwith blabbing protocols hogging up your bandwidth.A protocol is considered“chatty” if it is set to broadcast, update, or send messages with an unnecessaryamount of frequency.There are a few contenders for the most broadcast-based,bandwidth-eliminating chosen few.We will look at how to find them with SnifferPro and eliminate their existence if possible. Most times, going to a pure TCP/IPsolution is nothing more than “effort.” Most times, removing protocols that areunneeded is nothing more that planning, redesign, and a few off-hours’ cutovers.Most times, the workload on most MIS departments is so high, planning for thislofty project usually never materializes… but that’s where you, the SCP, come in.Let’s learn how to diagnose chatty protocols and eliminate them.
AppleTalkAppleTalk uses multicasting extensively to advertise services, request services, andresolve addresses. On startup, an AppleTalk host transmits a series of at least 20packets aimed at resolving its network address (a Layer 3 AppleTalk nodenumber) and obtaining local “zone” information. Except for the first packet,which is addressed to itself, these functions are resolved through AppleTalk multi-casts. Let’s look at some issues relating to AppleTalk and how to position SnifferPro to optimize this traffic:
www.syngress.com
7. Less documentation and support personnel needed if config-ured properly.
8. Cost savings because some network devices and applicationscost more when you want (or need) to support multiple pro-tocols. Sometimes higher levels of operating systems take upmore space in memory and need hardware upgrades as well.
9. Training of personnel on one technology (most training facili-ties don’t even go over IPX/SPX or AppleTalk anymore).
10. Novell (the company who was the massive user of this pro-tocol) is moving to a pure IP environment with the release ofNovell Netware version 6. It’s only a matter of time beforethey EOL (End of Life) the use of IPX/SPX as well.
There are more, but this should get the point across.
219_sniffer_12.qxd 6/28/02 12:25 PM Page 597
598 Chapter 12 • Troubleshooting Traffic for Network Optimization
■ You can use Sniffer Pro network analyzer to locate AppleTalk hosts withthe Matrix.After you position Sniffer Pro correctly and captureAppleTalk Traffic, you can use the Matrix to find which hosts on yournetwork are using the AppleTalk protocol.
■ Administrators usually do not even know AppleTalk is running at all. Itlingers in the background until a Protocol Analyst captures it.
■ The AppleTalk Chooser is particularly broadcast intensive.This is themain way that Apple Macintosh end users access network resources.Youcan view the end user’s workstation by using Chooser (located withinthe Apple Menu) to find if AppleShare is running and what resources areavailable to the end user.
■ You can position Sniffer Pro to capture routing traffic from the networkrouters that may be configured with AppleTalk.You will find, however,that the Matrix is one of your greatest tools to find AppleTalk-relatedtraffic.
■ AppleTalk Router Discovery Protocol is a RIP-based protocol imple-mentation that is transmitted by all routers and listened to by every sta-tion, so it is very broadcast intensive.
Sniffer Pro is going to help you to locate these AppleTalk traffic culprits andit’s up to you (and the onsite Systems Engineer) to see if it is OK to removethem or replace them. Let’s look at the AppleTalk routing broadcast problems andsee if we can correct thm.
AppleTalk Routing TrafficAURP and RTMP are AppleTalk-based routing protocols that can also be highly chatty and increase the loss of your precious bandwidth.Although SnifferPro will be hard pressed to help you in finding and locating these problems(unless they traverse your LAN), it would be a shame to not give you, the SCP,ways to optimize the WAN traffic as well. Here are some quick fixes for totaloptimization:
■ Routing Table Maintenance Protocol (RTMP), a Distance vector pro-tocol that has a default update timer of 10 seconds, which is way toomuch).
■ AppleTalk Update-based Routing Protocol (AURP) is anotherAppleTalk routing protocol that allows the creation of a tunnel to
www.syngress.com
219_sniffer_12.qxd 6/28/02 12:25 PM Page 598
Troubleshooting Traffic for Network Optimization • Chapter 12 599
interconnect two networks through TCPIP.AURP uses User DatgramProtocol (UDP), hence it is using TCP/IP. It does not send periodicupdates through the link, so if you have to use an AppleTalk routingprotocol, this one is it.
You really don’t want to be routing with AppleTalk these days, but if you do,you can follow these guidelines to help optimize the traffic on your networks,especially your WAN.
AppleTalk is considered a chatty protocol, but it has a low overhead.Depending on the needs of the MACs connected to your network, considerswitching them from AppleTalk to TCP/IP. Most implementations of AppleTalkhave already been removed or replaced since the volume of Apple computers toPCs is so skewed.This is, however, not the case with Novell Netware’s IPX/SPXprotocol, which we will now look at.
NOTE
The AppleTalk protocol is much more efficient than the IPX/SPX stackbecause AppleTalk discards non-AppleTalk broadcasts sooner thanIPX/SPX discards non-IPX/SPX broadcast
IPX/SPXNovell NetWare’s popularity may have declined since the early ’90s, but you willstill find it the network operating system (NOS) of choice in a great many orga-nizations.You, as the SCP, will need to know how to analyze and diagnose prob-lems with its flagship protocol: IPX/SPX. First, you have to understand why it’sso hard to simply “replace.”As with the AppleTalk clients, you simply needed touse TCP/IP and connect to a server, and that was it.With IPX/SPX, you aretalking about changing the protocol on the server.This is not easily done withoutdisrupting NDS and planning to upgrade many servers simultaneously. Mosttimes it takes upgrading an old NetWare (Intranetware) 4.11 server that usesNWIP to a real (supported) version of TCP/IP, and not NWIP, which isNetware’s version of IP.With all this said (and tons of clients that may only berunning IPX/SPX), the task to “just upgrade” to pure TCP/IP is not so simple.Let’s look at some things that you can do to optimize this chatty traffic.
www.syngress.com
219_sniffer_12.qxd 6/28/02 12:25 PM Page 599

600 Chapter 12 • Troubleshooting Traffic for Network Optimization
IPX has problems with sending tons of traffic as a part of its functionality.Aswith any NOS, it needs to send and collect updates, which has a cost in networkservices. One such collector of network information is the IPX Watchdog pro-tocol.The Watchdog protocol is used to maintain an up-to-date list of theresponding clients on a NetWare network.A client who fails to respond has itsconnection closed.
Some NetWare networks will also use the Sequenced Packet Exchange (SPX)protocol in order to guarantee the sequence and delivery of the IPX packets.Thisalso has an overhead because the SPX protocol uses keep alive messages betweenthe client and the Netware server. Novell’s Service Advertisement Protocol (SAP)and IPX’s Routing Information Protocol (IXP RIP) are considered chatty proto-cols since they both broadcast updates at 60 second intervals by default. Both theIPX SAP and the IPX RIP packets are said to have low overhead, but the fre-quency in which they are sent and the amount of devices sending them can defi-nitely add up. In the structure of an IPX RIP packet, there are 40 bytes of datacarried in the header, and the network information could carry up to 400 bytesof network address (50 entries multiplied by 8 bytes each), for a total of up to440 bytes per packet.
Let’s look at a captured IPX RIP packet within the Summary Pane of theSniffer Pro, as seen in Figure 12.19.You can clearly see in both the IPX Header,as well as the Novell RIP Header, that this is a broadcast packet. Here is how youknow from the Sniffer Pro:
■ In the IPX Header, the Destination Address is 0.FFFFFFFFFFFF
■ In the RIP Header, the Object Network is 0XFFFFFFFF
www.syngress.com
Figure 12.19 Digging Into the IPX RIP Packet With Sniffer Pro
219_sniffer_12.qxd 6/28/02 12:25 PM Page 600

Troubleshooting Traffic for Network Optimization • Chapter 12 601
In a SAP packet, we have 40 bytes of header information.An SAP packet canalso contain up to 7, 64-byte SAP entries for a total of up to 488 bytes per packet.SAPs are sent out every 60 seconds by default. SAP can be seen in Figure 12.20.
You can use the Cisco IOS software to increase the amount of time betweenupdates or to configure static routes to decrease the need for these protocols.Later in this chapter we’ll cover some ways to improve network efficiency byconfiguring these protocols.That being said, let’s move on to the next section,which discusses how to optimize your network using the Sniffer Pro LANAnalyzer to work with LAN- and WAN-based network problems.
NOTE
When you capture SAP traffic with a Sniffer Pro, the decode shows SAPas “NSAP.”
Optimizing LAN and WAN Traffic With the Sniffer ProIn this section we will take a look at cleaning up haywire applications and trafficthat may be traversing your network and finding and eliminating them with SnifferPro.You should be getting better and better at this; being able to find, diagnose, andoptimize LAN and WAN traffic is the pinnacle of your experience with usingSniffer Pro. Let’s look at broadcasts in switched networks first.
Broadcasts in Switched LAN InternetworksAs mentioned earlier in the chapter, be careful not to fall into the trap of thinkingthat installing a switch will solve your network traffic problems. It could create
www.syngress.com
Figure 12.20 Viewing SAP Traffic in Sniffer Pro
219_sniffer_12.qxd 6/28/02 12:25 PM Page 601

602 Chapter 12 • Troubleshooting Traffic for Network Optimization
some as well, so be careful with your designs.When you do install the switches,make sure you take the time to optimize what you have put into production.
First and foremost, switches do not filter broadcasts, multicasts, or unknownaddress frames.They go right through. Switches are susceptible to broadcaststorms (the circulation of broadcasts through the switched network, which causevery high utilization) and can bring a network to its knees very quickly. Let’slook at problems with switched networks with the Sniffer Pro and ways to ana-lyze and optimize those problems. In Figure 12.21, you can see a Cisco SwitchInterface showing that a switch will pass its fair share of broadcast and multicasttraffic. For this example, I created a Broadcast storm, which is why the Broadcastcount is so high.When viewing the packets input, it’s clear that the switch inter-face has seen roughly 22 million packets since its last clearing, both in and out.Of those packets, almost 7 million were broadcast based and almost 350 of themwere multicast based.
This goes to show that you are not immune to broadcast problems when usingswitches; if anything, you are more susceptible to them through misconfiguration.
SECURITY ALERT
For security purposes, if you decide to disable STP, you had better lockthe doors to your closets and make sure nobody has access to yourswitch ports. I generated a systemwide broadcast storm that paralyzed atest segment with a simple crossover cable and STP disabled. You do notwant this to happen to you.
www.syngress.com
Figure 12.21 Broadcast Traffic as Seen on a Cisco Catalyst Switch Interface
219_sniffer_12.qxd 6/28/02 12:25 PM Page 602

Troubleshooting Traffic for Network Optimization • Chapter 12 603
When viewing Figure 12.22, you can see that although the Sniffer Pro isconnected to a switch with Spanned Ports, you still get broadcast traffic traversingthe monitored port that Sniffer Pro is attached to.Traffic is inevitable, and it ishard to fully eliminate all broadcast traffic on your LAN, so it’s best to be familiarwith what applications do broadcast traffic and why they do it. Make sure youbaseline what traffic is normal for your LAN segments.
Spanning Tree ProtocolSpanning Tree Protocol (STP) is the de facto switch link management protocolyou must master as both a network engineer and/or a protocol analyst. STPoffers one major benefit: Path redundancy while preventing switch loops. STPwill maintain a “tree” of all switches and paths in the network, and, if a link goesdown, it will be able to reroute traffic through the redundant links that exist.Theproblem that would occur if STP weren’t enabled would be that if redundantlinks and Mac addresses are learned from two different locations, a loop may (ormore likely will) occur, and traffic would be circulated at a very high rate, whichis known to stop all network traffic within no time at all.The problems with aspanning tree is the excessive time it takes to “learn” what it needs to knowabout hosts connected to the switched network, and the excessive traffic that theBridge Protocol Data Units (BPDUs) generate during normal operations.
One problem we can find and eliminate with the use of Sniffer Pro is theexcessive BPDU traffic generated if you cannot turn Spanning Tree off.There aresome things to be aware of when using the STP on your switched network. If allof your switches are using the default configuration and the other switches deter-mine two of them to have the same path cost, the switch that has the lowest MacAddress will be selected as the root switch. Using Sniffer Pro, you can monitorthe traffic on your network and decide if the correct switch is acting as the rootswitch. If not, raise the priority of the better choice and make that switch thenew root switch.There are many ways to optimize broadcast traffic with the use
www.syngress.com
Figure 12.22 Viewing Switched Broadcast/Excessive Traffic with the Sniffer Pro
219_sniffer_12.qxd 6/28/02 12:25 PM Page 603
604 Chapter 12 • Troubleshooting Traffic for Network Optimization
of Spanning Tree and the best way to work with this traffic is to do one of twothings:
■ Turn Spanning Tree off. It’s not needed unless you have redundant pathsin your network.
■ Leave Spanning Tree on and find ways for it to not slow down yourLAN through optimization.
That being said, let’s look at ways to optimize it if you decide to leave STP on.
Spanning Tree OptimizationAs this chapter states, you will want to know how to troubleshoot and optimizetraffic with Sniffer Pro.To do so, all you need to do is monitor the network uti-lization for acceptable broadcast traffic. If the traffic is not within acceptableranges, optimize your network to get it within acceptable limits. Spanning TreeProtocol has a major downside; it is slow to reach convergence in a very largeenvironment that has a link failure. It is possible to optimize STP operation, butbefore we do so, let’s look at why STP causes network traffic:
The root bridge is selected according to the bridge ID value. (This is alsoconfigurable so you can have your core switches acting as your root bridgeinstead of a closet-based access layer switch.) On the root bridge, all interfaces areplaced in the forwarding state. For each segment that has more than one bridgeconnected to it, a designated bridge is selected that will be the one to forwardframes to the root. Each bridge selects a root port that will be used to forwardframes toward the root bridge. STP selects all the designated bridges and rootports necessary for switched LAN functionality and identifies a loop-free pathbetween the root bridge and all LANs. STP then places the selected bridge inter-faces in to a forwarding state and all the others in a blocked state.The root bridgetransmitting BPDUs every two seconds by default maintains the spanning tree(this is where your traffic continues after convergence). Upon receipt of a BPDUfrom the root bridge, the other bridges transmit their own BPDUs.
NOTE
If you are still in a jam trying to understand how Spanning Tree works,you can visit Cisco’s Web site, where there is a concise article on exactlyhow Switching and Spanning Tree works. It is definitely worth a read ifyou are confused for any reason: www.cisco.com/warp/public/473/lan-switch-cisco.shtml
www.syngress.com
219_sniffer_12.qxd 6/28/02 12:25 PM Page 604
Troubleshooting Traffic for Network Optimization • Chapter 12 605
Some would say that this is acceptable traffic, but that’s for you to decide. Ibelieve that a network can be fine-tuned and operate better when traffic flowand application flow is optimized. Now that you can see that switches runningSTP chat with each other pretty frequently, let’s look at a way to optimize thistraffic without turning STP off.
Optimizing STP TimersIf you are looking to optimize STP traffic, you should focus your efforts on thetimers that send BPDUs.The timers you can optimize are those that sendBPDUs at default intervals across the tree and those that determine when amissing BPDU is indicative of a link failure.The key timer values are set at theroot bridge and are the hello time, max age, and forward delay. Let’s look at thetweaks you can put in for optimization:
■ Configure the hello time, max age, and forward delay timers on your switchin a test lab, so you can make sure you research your switch type for itstunable parameter range. Each switch is different, so you will have toresearch each configuration on each switch separately.
■ You can use portfast to eliminate the wait time for nodes to be learnedby the switch so they can transmit data on the network segment they areattached to more quickly.
■ Eliminate STP where it is not needed, or it will never be used.
NOTE
Take extreme caution when working with and tweaking your infrastruc-ture. Make sure you plan everything out and have a good backout plan.Some Cisco switches write immediately to memory, and a mistake can becostly. Spanning Tree loops and broadcast storms can cripple a networkin just a few minutes.
We have looked at one way to perform analysis using Sniffer Pro to optimizetraffic on your network. Let’s look at another way to use Sniffer Pro. In the nextexample we will connect directly to a switch to analyze it in hopes of improvingnetwork traffic.
www.syngress.com
219_sniffer_12.qxd 6/28/02 12:25 PM Page 605
606 Chapter 12 • Troubleshooting Traffic for Network Optimization
Attach Directly to a Switch for AnalysisThe advantages of a switched network in speed and reliability far outweigh theadded administration responsibilities. In a simple LAN environment using onlyhubs and repeaters, all of the devices attached to the network see all of the traffic.By using properly configured switches, we can decrease the network load bysending packets to their intended recipient more quickly. However, because ofthis load balancing through segmentation, Sniffer Pro will not be able to see thenetwork as a whole unless you attach directly to your switch.
Sniffer Pro can take advantage of your switch’s ability to provide port mir-roring. Port mirroring allows you to mirror or copy the traffic from some or allof the ports on the switch to the port to which your Sniffer Pro system isattached.This ability is usually referred to as SPAN (for Switched Port Analyzer).When someone refers to a “spanned switch,” they are referring to that model’sability to provide port mirroring.
NOTE
Port mirroring and spanning steps are covered in Chapter 4.
One of the most useful features of Sniffer Pro is the ability to connect to andanalyze a switch. Some of the things you can do with this feature are:
■ Set which port will be mirrored and which will act as the mirror porton the switch.
■ Set thresholds on the switch, and, if one of the thresholds is reached,start a capture on the mirrored port.
■ Connect to multiple switches and capture data separately for analysis.
The Switch option under the Monitor Menu allows you to configure thisability. In this section, we’ll look at how to configure this valuable feature andways to optimize your network with it.
First, you’ll need two NICs. One will act as your Transport Interface, and theother will act as your Monitor Interface.
The Transport Interface will use SNMP to talk to the switch over the net-work, so it needs to be connected to a network access point which can reach theswitch by its IP address. SNMP GET requests are used to pull information from
www.syngress.com
219_sniffer_12.qxd 6/28/02 12:25 PM Page 606
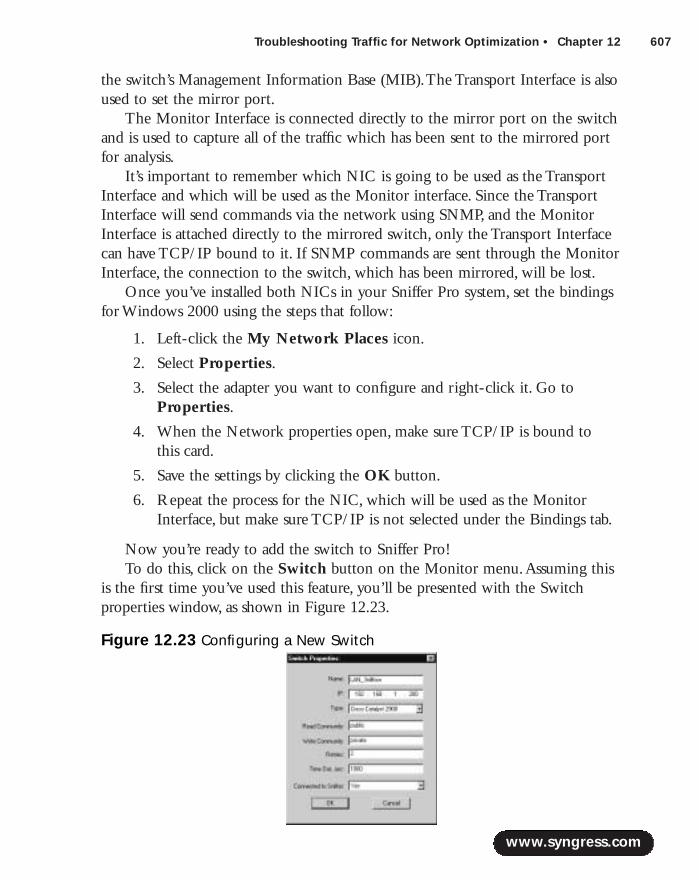
Troubleshooting Traffic for Network Optimization • Chapter 12 607
the switch’s Management Information Base (MIB).The Transport Interface is alsoused to set the mirror port.
The Monitor Interface is connected directly to the mirror port on the switchand is used to capture all of the traffic which has been sent to the mirrored portfor analysis.
It’s important to remember which NIC is going to be used as the TransportInterface and which will be used as the Monitor interface. Since the TransportInterface will send commands via the network using SNMP, and the MonitorInterface is attached directly to the mirrored switch, only the Transport Interfacecan have TCP/IP bound to it. If SNMP commands are sent through the MonitorInterface, the connection to the switch, which has been mirrored, will be lost.
Once you’ve installed both NICs in your Sniffer Pro system, set the bindingsfor Windows 2000 using the steps that follow:
1. Left-click the My Network Places icon.
2. Select Properties.
3. Select the adapter you want to configure and right-click it. Go toProperties.
4. When the Network properties open, make sure TCP/IP is bound to this card.
5. Save the settings by clicking the OK button.
6. Repeat the process for the NIC, which will be used as the MonitorInterface, but make sure TCP/IP is not selected under the Bindings tab.
Now you’re ready to add the switch to Sniffer Pro!To do this, click on the Switch button on the Monitor menu.Assuming this
is the first time you’ve used this feature, you’ll be presented with the Switchproperties window, as shown in Figure 12.23.
www.syngress.com
Figure 12.23 Configuring a New Switch
219_sniffer_12.qxd 6/28/02 12:25 PM Page 607
608 Chapter 12 • Troubleshooting Traffic for Network Optimization
In this window, you’ll need to add the following information about the switch.
■ Name Set the name, which will be used by Sniffer Pro to access thisswitch.This setting is just a way for Sniffer Pro to remember the settingsfor the connection; it doesn’t change anything on the switch itself.Agood naming scheme might include the type of switch and its physicallocation.
■ IP This is the IP address the Transport Interface will use to connect tothe switch.
■ Type Use the drop-down list to select the type of switch you’ll beaccessing.
■ Read Community The default here will be “public,” but in order tobrowse the switch’s MIB, this field will have to match the switch’s ReadCommunity string. In most cases, the default will work, but keep this inmind if you experience problems browsing the MIB.
■ Write Community Again the default setting, in this case “private,”will work for most switches. However, this must match the WriteCommunity string on the switch in order for you to be able to makechanges to the configuration settings of the switch.
■ Retries This specifies the number of times Sniffer Pro should attemptto connect to a switch which is not responding.
■ Time Out, sec This setting determines the number of secondsbetween retries.
■ Connected to Sniffer This can be set as either “Yes” or “No”. SelectYes if your Monitor Interface is connected directly to the switch’smirror port.
SECURITY ALERT
For test purposes, the switch used in this exercise has been sanitized andis using the default SNMP strings of public and private so that theswitches don’t expose the true passwords that were configured. For yoursake, I highly recommend that you change your community strings tosomething besides the default, or I can promise you that you will eventu-ally be exploited.
www.syngress.com
219_sniffer_12.qxd 6/28/02 12:25 PM Page 608

Troubleshooting Traffic for Network Optimization • Chapter 12 609
When configuring the dialog box as seen previously in Figure 12.23, youmust make sure that your switch does in fact have SNMP configured.A failure todo so will not allow you to monitor the switch properly.
Using the Switch Configuration List, select the switch you want to work onand click the Access Switch button. Since this is the first time you’ve accessedthis new switch, and you answered Yes to the Connected to Switch field, you willnow be asked to configure specific settings in the Switch Settings window shownin Figure 12.24.
In this window, you will determine which port to use as the mirror port onthe switch and the refresh rate of the display in the switch window.
Under the Switch Capture Setting tab, you have two values:
■ Analyzer Module Here you set the mirror port by its modulenumber. If the switch only has one module, you won’t see this field.
■ Analyzer Port Here you set the mirror port by the port number.Make sure you attach the cable from the Monitor Interface to this port.Be very sure of which port you designate as the mirror port! If youselect a port already in use, it will disconnect service to the device thatwas using it.
Under the Refresh Rate tab, you will set how often the information for thisswitch is refreshed in the Switch List window. Sniffer Pro gets the informationfrom the switch’s MIB and refreshes the display based on the number of minutesset in this field. Once you’re done, click the OK button to close this window
You can make changes to your configuration in the Switch ConfigurationList window by using the Edit Entry and Delete Entry buttons.There may beseveral switches available depending on how many you have added.You can seeone switch already configured in Figure 12.25.
www.syngress.com
Figure 12.24 The Switch Settings Window
219_sniffer_12.qxd 6/28/02 12:25 PM Page 609
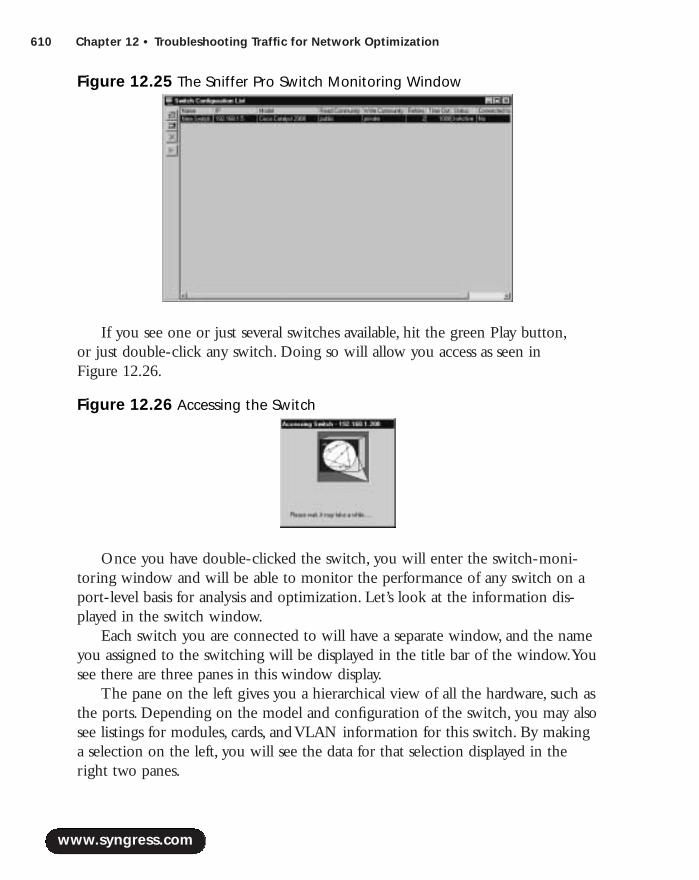
610 Chapter 12 • Troubleshooting Traffic for Network Optimization
If you see one or just several switches available, hit the green Play button,or just double-click any switch. Doing so will allow you access as seen in Figure 12.26.
Once you have double-clicked the switch, you will enter the switch-moni-toring window and will be able to monitor the performance of any switch on aport-level basis for analysis and optimization. Let’s look at the information dis-played in the switch window.
Each switch you are connected to will have a separate window, and the nameyou assigned to the switching will be displayed in the title bar of the window.Yousee there are three panes in this window display.
The pane on the left gives you a hierarchical view of all the hardware, such asthe ports. Depending on the model and configuration of the switch, you may alsosee listings for modules, cards, and VLAN information for this switch. By makinga selection on the left, you will see the data for that selection displayed in theright two panes.
www.syngress.com
Figure 12.25 The Sniffer Pro Switch Monitoring Window
Figure 12.26 Accessing the Switch
219_sniffer_12.qxd 6/28/02 12:25 PM Page 610

Troubleshooting Traffic for Network Optimization • Chapter 12 611
NOTE
You can select multiple objects by holding down the Ctrl key andselecting the objects on the left.
The top pane is the Properties pane. It has two tabs available:
■ The Properties tab displays information sent by the switch’s MIB for theselection in the left pane.
■ The Alarms tab allows you to set up Sniffer Pro to keep an eye on theswitch.We’ll discuss alarms in more detail in the next section.
The bottom pane is the Statistics Pane. It also has two tabs available:
■ The Statistics tab displays statistics on the traffic for the selection in theleft pane.
■ The Details tab displays a deeper level of information for the selectionon the left.
Optimizing with Sniffer ProNow that you’ve connected to the switch, let’s look at ways we can use SnifferPro to get the most out of it.
Once you successfully set up the switch in Sniffer Pro and connected to it,the Switch window provides a wide variety of useful information.You can usethis information to troubleshoot a problem or identify an opportunity to improveyour network services. Some of the information you see will be:
■ Status Is the port up, down, or just unused at the moment?
■ Traffic You can see all the packets as they pass including broadcast,error, or discarded packets and even the total number of bytes that passthrough each port.
If you want to start a capture manually on your switch, follow these steps:
1. First, make sure the Connected to Switch field is set to Yes.You won’t beable to capture traffic manually unless you are directly connected to theswitch.
www.syngress.com
219_sniffer_12.qxd 6/28/02 12:25 PM Page 611

612 Chapter 12 • Troubleshooting Traffic for Network Optimization
2. Select a port or VLAN in the left pane of the Switch window.
3. The Capture Switch Data button will now be available. Click on it, andthe traffic on the port or ports will be sent to the mirror port.
4. You can also capture data by using the Capture button on the SnifferPro toolbar.This will send the data to the Monitor Interface, so makesure that mirroring is configured correctly.
5. However, you may not have time to sit there all day and watch thisinformation. Let Sniffer Pro do it for you by configuring its Alarm fea-ture. Using the Alarm tab in the Switch window, we can configureSniffer Pro to alert us when specified thresholds are reached on theselected objects.
6. To add an alarm, select the port you want to monitor in the pane on theleft of the Switch window.Then select Add Alarm in the Alarm tabwindow. Each alarm will have a separate line in the Alarm window.
Once you click Add Alarm, you will need to provide the following information:
■ Key This will already be set to the port and module number you previ-ously selected.
■ Alarm This drop-down list will have all the available traffic which canbe monitored. Some of the items you can configure Sniffer Pro to watchfor are jabbers, collisions, and CRC errors.
■ Severity This drop-down menu will allow you to determine whataction is taken when one of the alarms is tripped. For example, if analarm is classified at this stage as Minor, the action taken may be to writethe event to the Alarm Log. However, you can also set this alarm to beclassified as Critical and direct Sniffer Pro to start a capture and send youa page alert to inform you of the problem.You configure the actionstaken by using the Alarms tab of the Options box under the Tools menu,or by setting triggers within the Alarm tab of the Switch window.
■ Sample Type The two choices are Absolute and Delta.Absolute will setthe alarm to trip if the condition is greater than the value assigned tothe alarm. Delta will compare the latest statistics to the previous ones.The difference (if there is any) is compared to the Rising and Fallingvalues to see if the alarm should be tripped.
www.syngress.com
219_sniffer_12.qxd 6/28/02 12:25 PM Page 612

Troubleshooting Traffic for Network Optimization • Chapter 12 613
■ Interval This configures the amount of time in seconds between theperiods of polling Sniffer Pro will look for trouble.
■ Startup type This field allows you to set the type of alarm which isgenerated during the first polling period after the alarm is activated onthe switch. It can be set to Rising, Falling, or Both. If set to Rising, thealarm trips if the statistic is higher than or equal to the Rising Thresholdvalue. If set to Falling, the alarm trips if the statistic is equal to or lowerthan the Falling Threshold value. If set to Both, an alarm trips if eithercondition occurs during the first polling period.
■ Rising Threshold This field specifies the value that, if met orexceeded, will trigger an alarm for the selected port.
■ Rising Alarm Action This can be set to Start Capture with Expert (orwithout Expert), Stop Capture, or None. If None is selected, the eventwill still be logged, but no other action will be taken.
■ Falling Threshold This field specifies the value that, if met or notreached, will trigger an alarm for the selected port.
■ Falling Alarm Action Just like the Rising Alarm Action, it specifiesthe action to be taken if the Falling Alarm is triggered.
Once you’ve finished configuring your alarms, click the Install Alarmsbutton to update your switch with the new configuration.
In this section we have looked at how to connect to a switch with Sniffer Proto monitor ports and manage your switch’s traffic via analysis for the purposes oflearning, analysis, and optimization.Another problem that network administratorshave to deal with on a daily basis is the latency experienced across WAN links.Let’s look at potential problems that may arise from this and solutions to themusing Sniffer Pro.
Using Sniffer Pro to Find WAN LatencyAnother problem you may have to contend with (and optimize) is applicationtraffic crippling your WAN connections.Application analysis is the hallmark of anexperienced SCP.A common problem is core network users who go on“remote” assignment and feel the pain and suffering of a dialup connection orslow WAN link. Some applications were just not made to run across a WAN linkvery well. Let’s take a look at a real world example.
www.syngress.com
219_sniffer_12.qxd 6/28/02 12:25 PM Page 613

614 Chapter 12 • Troubleshooting Traffic for Network Optimization
You are the administrator of a database application and run the console toaccess the database from your local workstation.You are happy with the responsetime over the 100 Mbps desktop connection that uplinks to a Gigabit fiber con-nection to the database server.You are then asked to work at a remote locationfor two weeks to help train the end users on the applications you are helping todevelop. Clearly, you would still like to be able to connect to the database in thecore network location for maintenance work.Armed with your laptop, you hitthe road. Upon arriving at the remote location, you find that when trying toconnect to the database, you either connect at miserable speeds that hang yourlaptop or you simply timeout.Yikes! What’s going on?
This is perhaps the most common story ever told by most network engineersand analysts worldwide.They experienced the latency offered by an inundatedWAN link, or their application was simply not made to be operated over a WANlink efficiently. Since some applications were coded to operate well at 10 Mbpsor higher, a 64K Frame Relay link will do them no justice whatsoever. Here iswhat you can do to help solve this problem:
■ As the network or protocol analyst, it is your organization’s responsibilityto make sure that you know what protocols are being introduced intothe network so you can analyze them with Sniffer Pro.
■ Test all applications over a WAN link (simulated if you can) to testresponse times.
■ You can use Timestamps in Sniffer Pro’s Summary pane to analyzeresponse times through Relative, Delta (interpacket), and Absolute timestamp analysis.
■ You can use the Application Response Time (ART) monitor
■ You can work with the application vendor to see if they have any reg-istry hacks or hot fixes you can implement to speed out your applicationover the WAN from the server’s perspective.
■ Implement quality of service (QoS) on your networking hardware toqueue up that application first.
■ You can increase the size of your WAN links or add more of them.
Each suggestion has its own benefits and problems, but a total optimizationstandpoint, you can use these as ideas to figure out how to make the applicationwork better on your network. Remember, it’s not always the network’s fault! Some
www.syngress.com
219_sniffer_12.qxd 6/28/02 12:25 PM Page 614

Troubleshooting Traffic for Network Optimization • Chapter 12 615
applications were just not made to function well over a WAN link. It’s up to you touse your skills and Sniffer Pro to help optimize the traffic that does exist.
NOTE
Do not mistake a latency problem with a bandwidth problem. Do notincrease your bandwidth because an application responds slowly—theincreased bandwidth may not help. Work with your Telco or ISP to getstatistics on overall bandwidth and utilization so you can see if you areoperating at poor levels. Many times, it’s simply that the server’sresponse time is poor, the buffers in routing devices or servers are inun-dated, or a poorly written “latency pig” application will just not functionas advertised.
Solving Network Slowdowns with Sniffer ProIn Chapter 1 we briefly covered the essentials of networking to make sure youhad the basic fundamentals of networking under your belt. In solving LAN slow-downs, you will need to draw on this information. In Chapter 1, you learnedabout the OSI and DOD models and how the TCP/IP protocol stack is brokendown into specific layers with specific functionalities.With TCP/IP, higher layertraffic like File Transfer Protocol (FTP) is functional on the application layer,where TCP will function at the host to host or transport layer.That being said,let’s look at viewing a network slowdown issue with the Sniffer Pro, where thenetwork connection to an FTP server is very slow.
In this exercise, we will look at questions to ask and things to look for, as wellas trace decides for clues and a resolution to your problem.Assuming the net-work layer is forwarding packets via IP correctly, let’s take a look at the TCP andFTP functions while observing the trace in Figure 12.27.
www.syngress.com
Figure 12.27 A View of TCP and FTP Traffic Within the Summary Pane ofSniffer Pro
219_sniffer_12.qxd 6/28/02 12:25 PM Page 615
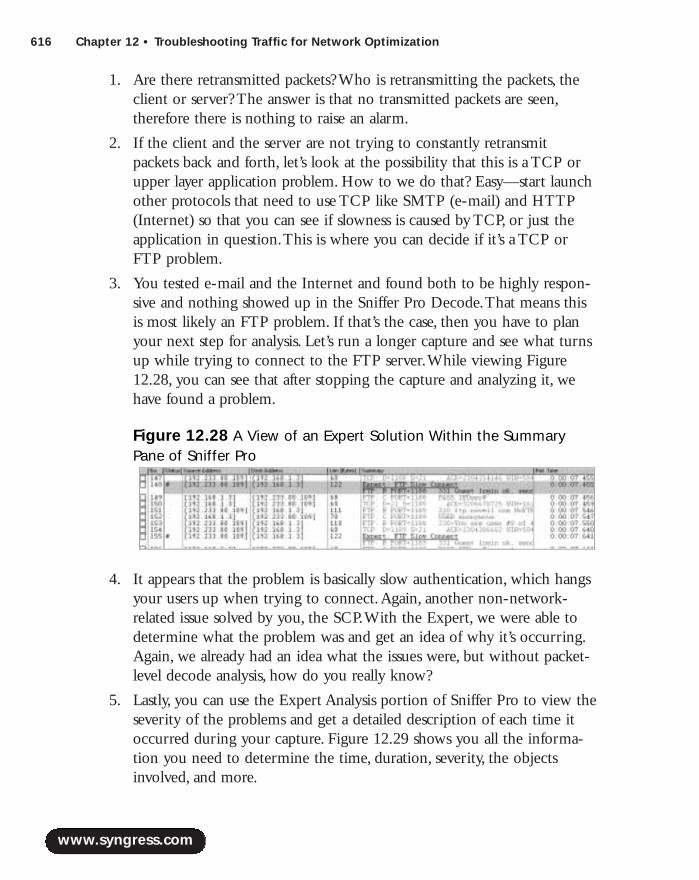
616 Chapter 12 • Troubleshooting Traffic for Network Optimization
1. Are there retransmitted packets? Who is retransmitting the packets, theclient or server? The answer is that no transmitted packets are seen,therefore there is nothing to raise an alarm.
2. If the client and the server are not trying to constantly retransmitpackets back and forth, let’s look at the possibility that this is a TCP orupper layer application problem. How to we do that? Easy—start launchother protocols that need to use TCP like SMTP (e-mail) and HTTP(Internet) so that you can see if slowness is caused by TCP, or just theapplication in question.This is where you can decide if it’s a TCP orFTP problem.
3. You tested e-mail and the Internet and found both to be highly respon-sive and nothing showed up in the Sniffer Pro Decode.That means thisis most likely an FTP problem. If that’s the case, then you have to planyour next step for analysis. Let’s run a longer capture and see what turnsup while trying to connect to the FTP server.While viewing Figure12.28, you can see that after stopping the capture and analyzing it, wehave found a problem.
4. It appears that the problem is basically slow authentication, which hangsyour users up when trying to connect.Again, another non-network-related issue solved by you, the SCP.With the Expert, we were able todetermine what the problem was and get an idea of why it’s occurring.Again, we already had an idea what the issues were, but without packet-level decode analysis, how do you really know?
5. Lastly, you can use the Expert Analysis portion of Sniffer Pro to view theseverity of the problems and get a detailed description of each time itoccurred during your capture. Figure 12.29 shows you all the informa-tion you need to determine the time, duration, severity, the objectsinvolved, and more.
www.syngress.com
Figure 12.28 A View of an Expert Solution Within the SummaryPane of Sniffer Pro
219_sniffer_12.qxd 6/28/02 12:25 PM Page 616

Troubleshooting Traffic for Network Optimization • Chapter 12 617
More Slow Network ProblemsYour job is never done.There is always something to analyze. Here is anothershort list of things that are seen as the cause of some “slow network” problemsthat you can use Sniffer Pro to troubleshoot:
■ Routing Loops Poorly designed networks with routing loops orpoorly defined paths through the internetwork cause delay and possibleslow transmission.
■ Server too fast Retransmission of packets caused by the server beingtoo powerful and sending too much to the client to handle because ofpoor NIC buffers, CPU, or memory.
■ Server too slow Retransmission of packets caused by the clients beingtoo powerful and sending too much to the server to handle because ofpoor NIC buffers, CPU, or memory (this is very common).
■ Too many clients If a server has too many clients connected and theserver is underperforming, then your clients will be affected.
■ Filelock gridlock Filelock problems can create slow access to sharedfiles, which will cause the clients to let you know that the network is slow.
NOTE
In one situation, I was called in to fix a sadly performing network, onlyto upgrade the server. Sixty users were connected to a PC acting as aserver over a 10/100 switched network. The CPU was 133 MHZ, had128MB of RAM, and very little disk space for paging operations. Needlessto say, after running performance monitoring tools on the server andshowing the client the problem was the server, the network analysis ses-sion turned into a server upgrade plan.
www.syngress.com
Figure 12.29 A View of an Expert Description Within the ExpertSystem of Sniffer Pro
219_sniffer_12.qxd 6/28/02 12:25 PM Page 617
618 Chapter 12 • Troubleshooting Traffic for Network Optimization
In each scenario, you can use Sniffer Pro as I used it in the FTP problem tocapture and analyze data to resolve these issues. Let’s take a final look at Ethernetoptimization.
Ethernet OptimizationIn Chapter 1, we covered the basics of network topology. Ethernet is the mostprevalent type of network technology in use today. Ethernet has strengths andweaknesses. It’s important to understand those strengths and weaknesses in orderto ensure you’re getting the best performance out of your network. In this sec-tion, we’ll discuss some ways to configure Ethernet technology.Throughout thisbook we have given you ways to successfully capture, analyze, troubleshoot, andoptimize Ethernet for better performance (Chapter 5 goes over this in greatdetail), but let’s creates a nice distilled list of issues and optimization techniquesyou can apply to your networks today with the help of the Sniffer Pro LANAnalyzer.
Ethernet Issues and the Need for OptimizationEthernet is a widely used, very efficient network technology, but it can causeproblems if it is not monitored and configured correctly. Let’s look at somecommon problems and then cover ways to avoid them.Again, these are not allthe problems you can experience (throughout the book you will find a greatnumber of them); here you will be able to see the most common problems andways to quickly optimize your network to handle them.
Collisions and Collision DomainsEthernet provides a fast, efficient way for systems to communicate on the wire byallowing multiple systems to send packets at the same time.Without some way tocontrol this traffic, no messages would ever reach their intended destination.Although the Carrier Sense Multiple Access / Collision Detect protocol provides ameans for systems to listen and transmit only when the traffic is clear, you maystill experience collisions.To optimize Ethernet you should try to keep the colli-sion domain small.You can do this by switching your network over the fullduplex (which will eliminate collisions) and by replacing old network interfacecards and keeping the drivers updated.
www.syngress.com
219_sniffer_12.qxd 6/28/02 12:25 PM Page 618

Troubleshooting Traffic for Network Optimization • Chapter 12 619
CRC Errors A cyclic redundancy check (CRC) is used to check a block of data for errors. Ifthe calculation at the receiving end differs from the calculation from the sender,the receiver requests the data again. By default, most NICs will be set to autone-gotiate the speed and duplex of the network connection. It’s possible to set thesevalues manually by turning off autonegotiation, but it’s not always ideal. If twoNICs are set differently, one at half duplex and the other at full duplex, it cancause CRC errors as well as other problems.To optimize Ethernet you can dothe following:
■ Make sure your NICs are configured properly. Set them to autonegotiateunless you know for sure your setting on both ends of the network are100% correct. Incorrect settings on port speed and duplex will either killcommunication or create errors.
■ Make sure your cable lengths are within industry specifications. Cablelengths that are too long will cause late collisions and attenuation prob-lems if not regenerated somewhere during the cable run.
■ Watch for interference like EMI. Problems with outside interference willcause errors on the line.
■ Make sure you don’t have too much traffic coming through a bottle-neck.The dropped packets and high rate of collisions at this bottleneckwill generate many errors.
NOTE
Using the show port command in a Cisco catalyst Switch (4000 –6000)will show you error rates. You can also look at just about any Ciscodevice and look at individual interface statistics to find errors as well byusing the show interface command.
BottlenecksIf too much traffic is going through any one source of communication, it mayoverwhelm the device’s ability to process the traffic.This will cause dropped
www.syngress.com
219_sniffer_12.qxd 6/28/02 12:25 PM Page 619
620 Chapter 12 • Troubleshooting Traffic for Network Optimization
packets, which will require the originating system to resend them, increasing theload on your network.To optimize Ethernet you can do the following:
■ Design your network properly with a high-speed backbone and high-speed desktop switching.
■ Make sure your servers aren’t the source of the bottleneck.
■ Make sure your routers aren’t the source of the bottleneck.
■ Make sure your firewalls aren’t the source of the bottleneck.
Unnecessary Broadcasts Unnecessary protocols, which depend on broadcast traffic, can increase theamount of traffic on your network. Such protocols can include IPX/SPX,NetBEUI, and DLC.Also, multicast traffic such as name resolution and switchand bridge updates can consume bandwidth needed for other traffic.To optimizeEthernet you can do the following:
■ Eliminate unneeded protocols from your network hosts (clients, servers,routers, etc.).
■ Eliminate unneeded hosts on your network that are not in use and areperhaps sending out keepalives or some other traffic on the wire (makethe collision domain smaller).
■ Use Switching instead of shared access hubs.
■ Implement VLANs if possible to separate Broadcast Domains or use arouter to block broadcast traffic.
By using Sniffer Pro to monitor your network, you will be able to watch theway all the devices communicate with each other in real time. Here are somethings you can do to improve Ethernet performance with Sniffer Pro:
■ Use the Dashboard religiously to find your utilization statistics in realtime.
■ Watch for high percentages of network utilization. It can vary from net-work to network, but anything over 40% is generally too high on anEthernet network. If you are on a switched network, then anything over70% is too high.
www.syngress.com
219_sniffer_12.qxd 6/28/02 12:25 PM Page 620
Troubleshooting Traffic for Network Optimization • Chapter 12 621
■ Watch for hardware-related errors. Jabbers or failing NICs often causelong or short frames and CRC errors. Correct these problems as theyare found.
■ Use Sniffer Pro to determine your response time.A general rule shouldbe that any response should be less than 100ms.
■ Broadcasts and multicasts should be no more than 20% of all networktraffic.
■ On Ethernet networks there should be no more than 1 CRC error per1 million bytes of data.
TIP
Check your router and switches! Cisco Router CPU utilization should notexceed 75%. To check it, you can use the following commands: showproc cpu and show proc mem (for memory).
Use hubs as little as possible. Often, when expanding a network, people try tosave money and decide to connect via simple hubs. Obviously, a hub provideslittle more than a connection.A well-configured, segmented LAN using properlyconfigured switches can avoid many network problems.
NetWare Optimization and Microsoft OptimizationBoth Novell NetWare and Microsoft Windows NT are considered network oper-ating systems.Their job is to provide fast and reliable client/server services to theuser desktop on the network.
However, every network has its own needs, and the default installation ofyour server systems may not be providing optimum results to your client systems.In this section, we’ll be looking at some ways to configure Windows NT andNetWare to overcome some problems.
www.syngress.com
219_sniffer_12.qxd 6/28/02 12:25 PM Page 621
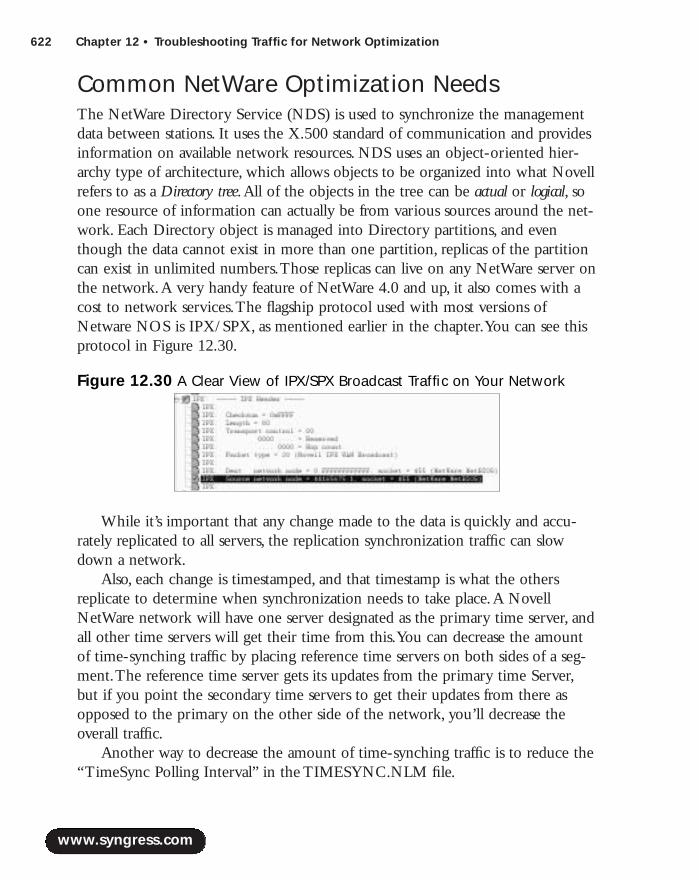
622 Chapter 12 • Troubleshooting Traffic for Network Optimization
Common NetWare Optimization NeedsThe NetWare Directory Service (NDS) is used to synchronize the managementdata between stations. It uses the X.500 standard of communication and providesinformation on available network resources. NDS uses an object-oriented hier-archy type of architecture, which allows objects to be organized into what Novellrefers to as a Directory tree.All of the objects in the tree can be actual or logical, soone resource of information can actually be from various sources around the net-work. Each Directory object is managed into Directory partitions, and eventhough the data cannot exist in more than one partition, replicas of the partitioncan exist in unlimited numbers.Those replicas can live on any NetWare server onthe network.A very handy feature of NetWare 4.0 and up, it also comes with acost to network services.The flagship protocol used with most versions ofNetware NOS is IPX/SPX, as mentioned earlier in the chapter.You can see thisprotocol in Figure 12.30.
While it’s important that any change made to the data is quickly and accu-rately replicated to all servers, the replication synchronization traffic can slowdown a network.
Also, each change is timestamped, and that timestamp is what the othersreplicate to determine when synchronization needs to take place.A NovellNetWare network will have one server designated as the primary time server, andall other time servers will get their time from this.You can decrease the amountof time-synching traffic by placing reference time servers on both sides of a seg-ment.The reference time server gets its updates from the primary time Server,but if you point the secondary time servers to get their updates from there asopposed to the primary on the other side of the network, you’ll decrease theoverall traffic.
Another way to decrease the amount of time-synching traffic is to reduce the“TimeSync Polling Interval” in the TIMESYNC.NLM file.
www.syngress.com
Figure 12.30 A Clear View of IPX/SPX Broadcast Traffic on Your Network
219_sniffer_12.qxd 6/28/02 12:25 PM Page 622
Troubleshooting Traffic for Network Optimization • Chapter 12 623
Earlier in this chapter we discussed the NetWare Watchdog protocol, whichlooks for client systems that are not responding and closes the connection tothem.The Watchdog protocol has three values that you can set from the NetWarecommand prompt:
■ SET DELAY BEFORE FIRST WATCHDOG PACKET Thedefault is 4 minutes and 56.6 seconds.
■ SET DELAY BETWEEN WATCHDOG PACKETS The default is59.3 seconds but can be changed to as short as 15.7 seconds and as longas 20 minutes.
■ SET NUMBER OF WATCHDOG PACKETS If the client doesn’trespond, by default it will send 10 packets before removing it from thenetwork, but this can be increased to as many as100.
NOTE
Use caution when increasing the amount of time it takes for a connec-tion to be closed. This can prevent a user from logging in again. TheCisco IOS offers some additional enhancements to improve Watchdogperformance.
The SPX protocol is used when applications such as Remote Console orRemote Printer, need guaranteed, sequenced delivery of data packets.Thisrequires that both sides of the SPX connection use keepalive requests. On aNetWare 4.0 and higher server, these requests are sent every six seconds.You canincrease the amount of time between the keepalive requests by modifying twoparameters in the NET.CFG file on the clients.Those parameters are:
■ SPX Abort Timeout The default is 540 ticks; each tick is equal to1/18 of a second.
■ SPX Verify Timeout The default is 54 ticks.
Each of these parameters can be increased up to a whopping 65,000 ticks,which would send one keepalive request between the clients per hour.
Earlier in the chapter, we discussed problems with the IPX RIP and SAPprotocols. Novell also offers another routing protocol, Network Link ServicesProtocol (NLSP), which is designed to operate in a similar fashion to the TCP/IP
www.syngress.com
219_sniffer_12.qxd 6/28/02 12:25 PM Page 623
624 Chapter 12 • Troubleshooting Traffic for Network Optimization
Open Shortest Route First (OSPF) protocol. Keep in mind, however, that NLSPdoes not work over dial-on-demand links.
Many networks out there are using NetWare either exclusively or as part of amixed network. Properly monitored and configured, IPX can play very well withothers. By using Sniffer Pro’s IPX monitoring capabilities, you can determinewhether any of the above changes should be implemented.
Common Microsoft Optimization NeedsIn this book we have touched on the Windows operating system while discussingSniffer Pro.This is because it is the predominant network operating system seenacross the world today.That being said, there are some things you can look forimmediately while working with Sniffer Pro and trying to optimize networktraffic. Let’s take a look at some common tweaks you can do to optimize aMicrosoft network:
■ Remove unneeded protocols and run TCP/IP only, if possible.
■ If you are running Windows 2000, make sure it is designed properly inrelation to WINS and DNS. If these are not set up properly, addedlatency with logons and other traffic issues will slow down your net-work.
■ If you need to eliminate NetBIOS broadcast problems, make sure youuse properly designed WINS servers.
■ Make sure your servers have enough hardware resources and are abovethe minimum requirements, if possible.
■ Use System Monitor (in the Performance MMC) on your servers andmake sure your servers are optimized and are not slowing down to givethe appearance of a slow network.
■ Make sure you apply the latest service packs and hotfixes when needed.
■ Eliminate the browser traffic if possible.
In order to get the most out of your Windows systems there are some simplechanges you can make on the server:
■ First, check the amount of RAM your servers have installed and how it’sbeing used. Use the System Monitor to look at two key values,Committed Bytes and the % Committed Bytes. In order to get maximumperformance, you should have twice the average amount of Committed
www.syngress.com
219_sniffer_12.qxd 6/28/02 12:25 PM Page 624
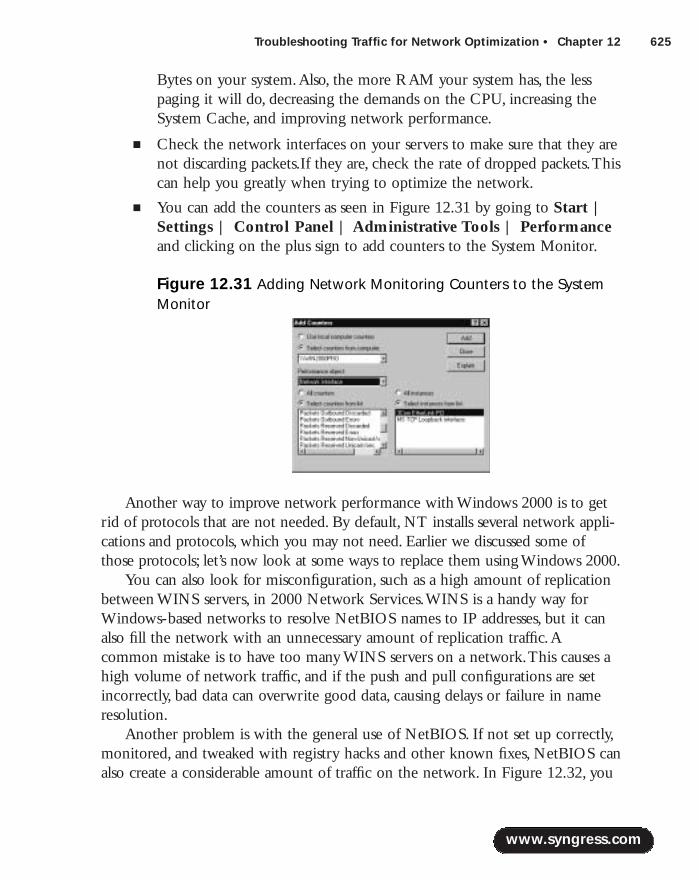
Troubleshooting Traffic for Network Optimization • Chapter 12 625
Bytes on your system.Also, the more RAM your system has, the lesspaging it will do, decreasing the demands on the CPU, increasing theSystem Cache, and improving network performance.
■ Check the network interfaces on your servers to make sure that they arenot discarding packets.If they are, check the rate of dropped packets.Thiscan help you greatly when trying to optimize the network.
■ You can add the counters as seen in Figure 12.31 by going to Start |Settings | Control Panel | Administrative Tools | Performanceand clicking on the plus sign to add counters to the System Monitor.
Another way to improve network performance with Windows 2000 is to getrid of protocols that are not needed. By default, NT installs several network appli-cations and protocols, which you may not need. Earlier we discussed some ofthose protocols; let’s now look at some ways to replace them using Windows 2000.
You can also look for misconfiguration, such as a high amount of replicationbetween WINS servers, in 2000 Network Services.WINS is a handy way forWindows-based networks to resolve NetBIOS names to IP addresses, but it canalso fill the network with an unnecessary amount of replication traffic.Acommon mistake is to have too many WINS servers on a network.This causes ahigh volume of network traffic, and if the push and pull configurations are setincorrectly, bad data can overwrite good data, causing delays or failure in nameresolution.
Another problem is with the general use of NetBIOS. If not set up correctly,monitored, and tweaked with registry hacks and other known fixes, NetBIOS canalso create a considerable amount of traffic on the network. In Figure 12.32, you
www.syngress.com
Figure 12.31 Adding Network Monitoring Counters to the SystemMonitor
219_sniffer_12.qxd 6/28/02 12:25 PM Page 625
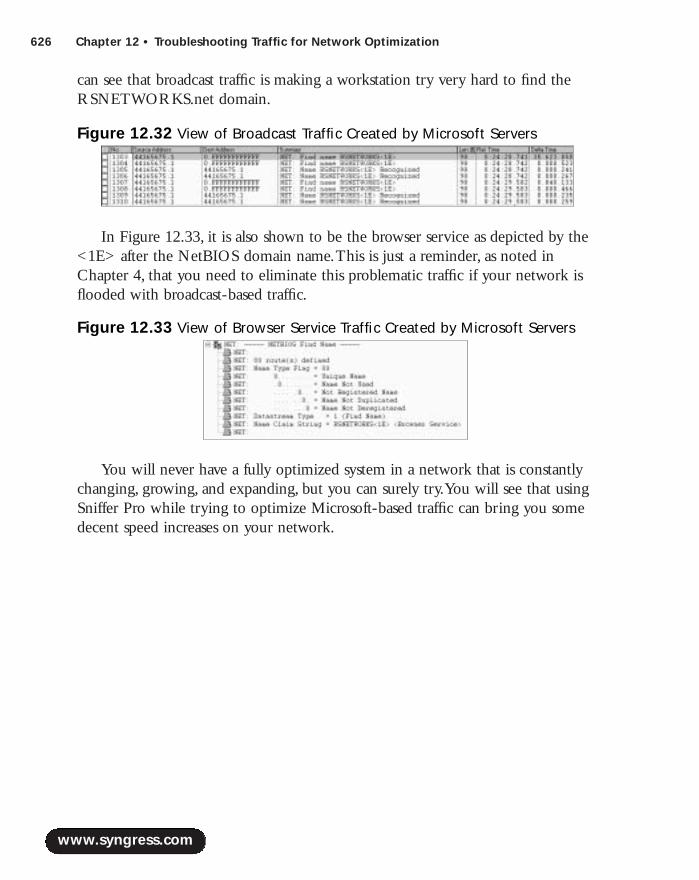
626 Chapter 12 • Troubleshooting Traffic for Network Optimization
can see that broadcast traffic is making a workstation try very hard to find theRSNETWORKS.net domain.
In Figure 12.33, it is also shown to be the browser service as depicted by the<1E> after the NetBIOS domain name.This is just a reminder, as noted inChapter 4, that you need to eliminate this problematic traffic if your network isflooded with broadcast-based traffic.
You will never have a fully optimized system in a network that is constantlychanging, growing, and expanding, but you can surely try.You will see that usingSniffer Pro while trying to optimize Microsoft-based traffic can bring you somedecent speed increases on your network.
www.syngress.com
Figure 12.32 View of Broadcast Traffic Created by Microsoft Servers
Figure 12.33 View of Browser Service Traffic Created by Microsoft Servers
219_sniffer_12.qxd 6/28/02 12:25 PM Page 626
Troubleshooting Traffic for Network Optimization • Chapter 12 627
SummaryWhen I was 10, my parents took me to a traveling circus.While we were waitingto get into the big tent, one of the performers was entertaining the crowd withcard tricks. He wasn’t exactly David Copperfield. He could do the tricks profi-ciently enough, but he lacked showmanship.After every trick, the people in linestarted trying to guess how he did it.The magician was growing frustrated as therubes kept trying to uncover his secrets. Finally, I couldn’t stand it anymore andshouted,“Everybody be quiet! Can’t you see it’s MAGIC?!!”
That’s how your users should think of your network.They shouldn’t be won-dering how it works, why it’s not working, or how it could work better.Your“showmanship” is the result of time spent with products like Sniffer Pro.With itscorrect and consistent usage, your network will work like magic. One thingshould be apparent to all your end users who log in, connect to, and useresources on the network: The network should be transparent to them!
In this chapter we have brought together many of the points discussedthroughout the book.We’ve covered the three most important elements ofquality network services: speed, reliability, and security.
Speed is the most noticeable element to your users and a perceived lack of itwill often be the source of your troubleshooting efforts. By using baselining, wecan set a point of normal operating performance, which is the first step in dis-covering network problems.We can also use it to set reasonable expectations forour users.
Reliability is another of our key elements. Few businesses today can allow forany network downtime. It’s crucial that we, as network professionals, maintain astable network that people can trust to be there when needed.
Security has always been a top priority for network support professionals.Losing control of how your network is being used or who is using it means youhave lost control of your network completely. In Chapter 11,“Detecting andPerforming Security Breaches with Sniffer Pro”, we showed you how to maintaincontrol and how to get it back if you lose it.
Many networks are the result of many hands and many long-gone networkdesigners. It’s not unusual for a network to be filled with legacy devices, applica-tions, and outdated protocols.We covered getting rid of unnecessary protocols toincrease available network bandwidth and how to use the Host Table and ARTfeatures to make sure our users are getting the fastest response our networkresources can provide.
www.syngress.com
219_sniffer_12.qxd 6/28/02 12:25 PM Page 627
628 Chapter 12 • Troubleshooting Traffic for Network Optimization
Switches provide a great way for speeding up a network, as long as they areused correctly and monitored frequently as your network grows.We discussed thesteps for connecting directly to a switch to make sure we see the whole pictureof our network and ways to configure alarms to make sure our switches areworking in the best way at all times.
Finally, we covered things to look out for with some of the most popular network technologies and operating systems and some tips to improve their performance.
We hope you’ve found this book to be a valuable resource. If there is onething that could be given to you as closing statement, this would be it:
“Every network has problems, and every network is configured differently. Each has itsown application flows, devices, and technical staff with varying levels of knowledge andskill. But one thing is certain.Armed with this book and Sniffer Pro, you can and willmake a difference. Go forth and take what you have learned to attack, analyze, optimize,and solve problems.”
Solutions Fast Track
Fine-Tuning Your Network and Performing Proactive Maintenance
! The three elements to a healthy network are speed, reliability, and security.
! Baselining your network gives you a point from which to determine theextent of a problem or if it’s time to upgrade.
! Use the Host Table to discover unknown network systems or resources.
! Monitor your network Internet ports for unauthorized applications.
Finding Unnecessary Protocols with Sniffer Pro
! Every protocol on the network has a cost in bandwidth and systemprocessing time.
! AppleTalk is a very chatty protocol and can often be replaced withTCP/IP.
! NetWare’s IPX/SPX protocols can decrease available bandwidth if notused correctly.
www.syngress.com
219_sniffer_12.qxd 6/28/02 12:25 PM Page 628
Troubleshooting Traffic for Network Optimization • Chapter 12 629
Optimizing LAN and WAN traffic with Sniffer Pro
! The Spanning Tree Protocol (STP) improves switch performance bysetting ideal paths on the network and removing redundant ones.
! When using STP, your switches will use BPDUs to exchangeinformation.
! When attached directly to a switch, Sniffer Pro can mirror a port todecrease the load on the port being monitored.
Ethernet Optimization
! Ethernet can experience collisions, but is generally faster and lessexpensive than Token Ring.
! To optimize Ethernet traffic, keep the collision domain size to aminumim. If you are still using hubs, you need to monitor this closelyand make sure utilization is within specs.
! Hardware related errors such as jabbers, long or short frames, and CRCerrors can be hard to diagnose.
NetWare Optimization and Microsoft Optimization
! Place reference time servers strategically to decrease timesynchronization messages.
! Adjust the SPX keepalive parameters to decrease the amount ofkeepalive messages sent out on the network.
! Make sure your Microsoft Server is optimally configured to utilize thesystem RAM.
! Make sure your Microsoft WINS servers are replicating correctly.
www.syngress.com
219_sniffer_12.qxd 6/28/02 12:25 PM Page 629
630 Chapter 12 • Troubleshooting Traffic for Network Optimization
Q: How do I know when it’s time to upgrade my network?
A: Ideally, before your users begin to complain.The trick is to use stress testingand simulations to push your network into the future so you can know whatto expect as your needs grow. For example, if your network currently serves1,500 people, use Sniffer Pro to generate twice the amount of traffic.Thiswill give you a good idea of what problems you will face as your number ofemployees grows.
Q: Our network is as ideally configured as our resources will allow, yet all I hearis user complaints. How can I explain to them that it’s not the network’sproblem?
A: It’s not unusual for people to blame things they don’t understand.Are theyaware of the resources available? What are their specific complaints? Do theyhave reasonable expectations of the network? The best way to resolve thistype of issue is by getting out of the wiring closet occasionally and meetingwith the users directly.
Q: My network is using DLC to access HP printers. Can I get rid of it?
A: The answer is probably yes. Most HP printers will be able to use TCP/IP inplace of DLC now. Check your printer’s documentation.
Q: I’ve been using Sniffer Pro for years. I’ve read this book from cover to cover.Why do I need to take the SCP exam?
A: Opinions vary on the value of vendor certification, but one thing will alwaysbe true: Nobody ever lost a job by being too experienced and too certified.The SCP exam, like all vendor certifications, covers the topics that themakers of the application, in this case Network Associates, say you shouldknow in order to be considered an expert. Nothing can replace hands-on
www.syngress.com
Frequently Asked Questions
The following Frequently Asked Questions, answered by the authors of this book,are designed to both measure your understanding of the concepts presented in this chapter and to assist you with real-life implementation of these concepts. Tohave your questions about this chapter answered by the author, browse towww.syngress.com/solutions and click on the “Ask the Author” form.
219_sniffer_12.qxd 6/28/02 12:25 PM Page 630

Troubleshooting Traffic for Network Optimization • Chapter 12 631
experience, but studying for this exam may teach you things about SnifferPro you didn’t know before that could be very useful. It also spruces up yourresume.
Q: My company has never been very security conscious.What are some goodWeb sites for updates and information regarding network security issues?
A: First, stay in close contact with your software and hardware vendors. Forexample, if you’re a Cisco customer, you'll find Cisco’s Web site(www.cisco.com) to be a great resource for network security information. Infact, even if you're not, it has a tremendous amount of useful network infor-mation. Naturally, the Network Associates page (www.nai.com) will keep youin the loop with the latest information, patches, and upgrades to Sniffer Pro.Another site to visit every day is the computer emergency response teamcoordination center (CERT/CC). It is the best resource to find the latestinformation on vulnerabilities, attacks, and ways to defend your network.You’ll find them at (www.cert.org).
www.syngress.com
219_sniffer_12.qxd 6/28/02 12:25 PM Page 631

219_sniffer_12.qxd 6/28/02 12:25 PM Page 632
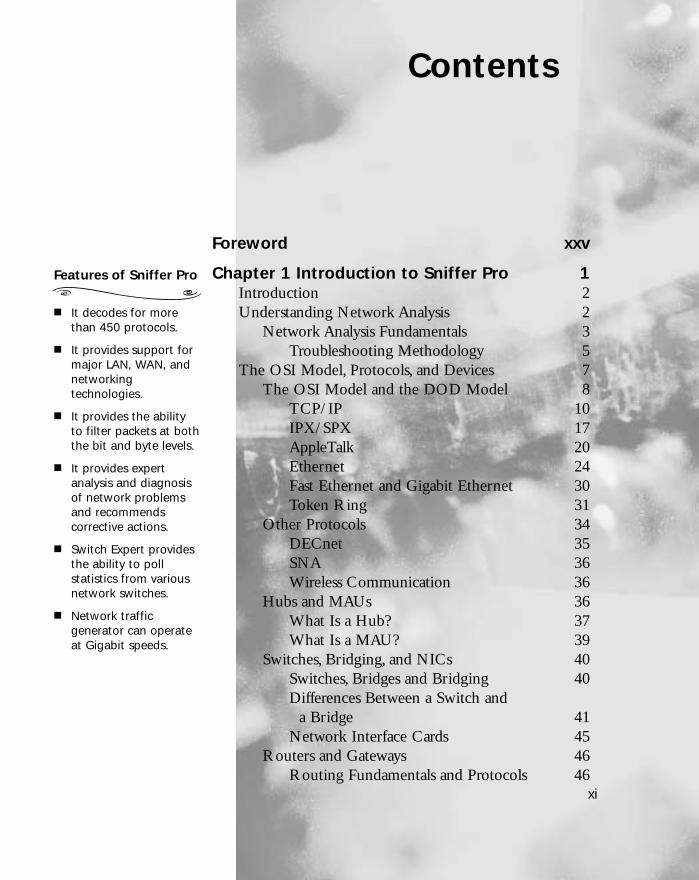
Contents
xi
Foreword xxv
Chapter 1 Introduction to Sniffer Pro 1Introduction 2Understanding Network Analysis 2
Network Analysis Fundamentals 3Troubleshooting Methodology 5
The OSI Model, Protocols, and Devices 7The OSI Model and the DOD Model 8
TCP/IP 10IPX/SPX 17AppleTalk 20Ethernet 24Fast Ethernet and Gigabit Ethernet 30Token Ring 31
Other Protocols 34DECnet 35SNA 36Wireless Communication 36
Hubs and MAUs 36What Is a Hub? 37What Is a MAU? 39
Switches, Bridging, and NICs 40Switches, Bridges and Bridging 40Differences Between a Switch and
a Bridge 41Network Interface Cards 45
Routers and Gateways 46Routing Fundamentals and Protocols 46
Features of Sniffer Pro
■ It decodes for morethan 450 protocols.
■ It provides support formajor LAN, WAN, andnetworkingtechnologies.
■ It provides the abilityto filter packets at boththe bit and byte levels.
■ It provides expertanalysis and diagnosisof network problemsand recommendscorrective actions.
■ Switch Expert providesthe ability to pollstatistics from variousnetwork switches.
■ Network trafficgenerator can operateat Gigabit speeds.
219_sniffer_TOC.qxd 6/28/02 5:00 PM Page xi
xii Contents
Sniffer Pro Fundamentals 48Features of Sniffer Pro 48Other Sniffer Versions and Products 49Other Solutions and Products 50
EtherPeek 50Ethereal 50Agilent Advisor 50
Management and Return on Investment 50Charts and Reporting 51Proactive and Reactive Network
Maintenance 51Sniffer Pro:The Exam 52
Certification Testing and the Sniffer University 52Sniffer Certified Professional 52SCP, SCE, and SCM 54
Other Certifications and Tracks 54Summary 56Solutions Fast Track 56Frequently Asked Questions 58
Chapter 2 Installing Sniffer Pro 61Introduction 62Installing Sniffer Pro Step by Step 62
System Requirements for Sniffer ProInstallation 63
Minimum System Requirements forVersion 4.x 63
Internet Explorer 5 with the VirtualMachine 64
Minimum System Requirements forVersion 3.0 65
Installing Sniffer Pro 4.5 65Licensing 75Read the Readme.txt File 76
Installation of Version 3.x 77Installing Sniffer Pro on Other Platforms
and Hardware 81
Answers to YourFrequently AskedQuestions
Q: Does NAI recommenda particular brand ormodel of laptop onwhich to run SnifferPro?
A: No. Unlike the olderDOS versions of Sniffer,NAI recommends noparticular brand ormodel of system forSniffer Pro. Use yourbest judgment to buya stable and high-performance machine.
Q: Can I connect toSniffer Pro from aremote PC, using theDistributed Sniffer Proconsole?
A: No. Sniffer Pro isstandalone softwareand cannot beaccessed using theDistributed Sniffer Proconsole. To control aSniffer Pro systemremotely, you caninstall remote controlsoftware such as PCAnywhere, VNC, orCarbon Copy.
219_sniffer_TOC.qxd 6/28/02 5:00 PM Page xii
Contents xiii
Laptop Considerations 82Apple Considerations 83
Customizing the Installation 83Configuring Sniffer Pro for Remote Access 83Using a Tablet PC for Portability 84
Configuring Network Interfaces and Drivers 84The Promiscuous NIC 84
Selecting the NIC 85NetPod 86
Replacing Drivers 88Standard NDIS Drivers and Issues 88Sniffer Pro Network Drivers 88NAI Enhanced Drivers for Windows 2000 89Removing Previously Installed PnP
Network Drivers on Windows 98 90Disabling Unnecessary Services on
Ethernet Adapters Attached to Pods 91Changing Network Speeds After
Starting Sniffer Pro 91Enhancing Capture Performance 92Enhancing General System Performance 93Notebook Resource Problems 93Known Issues with Windows 2000 95Installing Gigabit Ethernet, HSSI,
and LM2000 Cards 95Troubleshooting the Installation 97
Failed Installation 97Drivers Not Installing 97
Installing on the Wrong Platform 98Error Messages 98Failing to Delete Sniffer.ini on
an Upgrade 99Building a Technician Tool Kit 99
Summary 101Solutions Fast Track 101Frequently Asked Questions 103
219_sniffer_TOC.qxd 6/28/02 5:00 PM Page xiii
xiv Contents
Chapter 3 Exploring the Sniffer Pro Interface 105
Introduction 106Exploring the Dashboard 106
Real-Time Statistics 106Utilization and Errors 107Setting Thresholds 112Configurable Dashboard Graphs 113
Understanding Menus 114The File Menu 114The Monitor Menu 115The Capture Menu 123The Display Menu 124The Tools Menu 125The Database Menu 125The Window Menu 126Help 127
Understanding the Toolbars 127Starting, Stopping, and Viewing a Capture 129Defining a Wizard 130Opening and Saving a Capture 130Printing 131Other Icons and Functions 132
Miscellaneous Sniffer Pro Tools 132Packet Generator and Loopback Mode 133The Bit Error-Rate Test 135Reporter 136Ping 136Trace Route 137DNS Lookup 138Finger 138WhoIs 138Address Book 139
The Expert 139The Capture 139
False Positives 140
The Global StatisticsToolbar
Bar
Pie
Reset
219_sniffer_TOC.qxd 6/28/02 5:00 PM Page xiv
Contents xv
The Decode Tab 140Matrix 143Host Table 145Protocol Distribution 147Statistics 148
Graphs, Charts, and Maps 148Top Talkers 149Heavy Protocol Distribution 149Creating a List of Hosts on Your Network 150
Using the Address Book 150Adding New Addresses 151Exporting the Address Book 153
Summary 154Solutions Fast Track 154Frequently Asked Questions 157
Chapter 4 Configuring Sniffer Pro to Monitor Network Applications 159
Introduction 160Basic Sniffer Pro Data Capture Operations 160
Starting and Stopping the Capture Process 161Viewing and Dissecting the Capture 166
Monitoring with the Summary,Details, and Hex Panes 166
Sniffer Pro Analyzer Placement 177Sniffer Pro Advanced Configuration 179
Switched Port Analyzer 180How to Set Port Spanning 181How to Set Port Spanning for a VLAN 181
Timestamping Procedures 183Timestamp Columns and Timestamping 183
Viewing and Using the Expert 186The Expert and Objects 187
Troubleshooting with the Expert System 188The Expert Layers 188Expert Alerts and Problems Indicators 193False Positives and Negatives 197
WARNING
Make sure you masterthe art of workingwith timestamps sothat you can trou-bleshoot how long alogin occurs or howlong it takes totransfer a file. Onceyou learn how to builda filter, use time-stamps to isolate aclient/server login tosee how long it takes.You must also masterthis information forthe SCP exam.
219_sniffer_TOC.qxd 6/28/02 5:00 PM Page xv
xvi Contents
Configuring Expert Options 198Application Response Time 205
Adding Custom Protocols to ART 208Configuring Sniffer Pro to Capture andAnalyze NetWare Traffic 209
Sniffer Pro Traffic Capture 210Analyzing the Summary Pane 210Analyzing the Details Pane 211Analyzing the Hex Pane 214
Configuring Sniffer Pro to Capture andAnalyze Microsoft Traffic 214
Sniffer Pro Traffic Capture 215Analyzing the Summary Pane 216Analyzing the Details Pane 216Analyzing the Hex Pane 224
Summary 225Solutions Fast Track 226Frequently Asked Questions 228
Chapter 5 Using Sniffer Pro to Monitor the Performance of a Network 231
Introduction 232Network Performance Issues 232Real-Time Performance Monitoring with
Sniffer Pro 236Using the Dashboard in Real Time 238
The Gauge Tab 239The Detail Tab 241The Network Graph 243The Detail Errors Graph 247The Size Distribution Graph 250Long- and Short-Term Analysis 251Customizing Your View 251
Setting Thresholds 252Baselining,Trending, and Change Management 256
Baselining Over Time 257Trending Tips 257
The Default Utilization% Dial
219_sniffer_TOC.qxd 6/28/02 5:00 PM Page xvi

Contents xvii
Change Management 258Analyzing Ethernet Performance with Sniffer Pro 259
Monitoring the Performance of the Ethernet 259Saturation Levels and Collisions 260Ethernet Framing Problems 262Hardware Problems 267STP Loops and Broadcast Storms 268
Analyzing Token Ring Performance withSniffer Pro 270
Monitoring the Performance of Token Ring 272Setting Up Sniffer Pro to AnalyzeToken Ring 272
Viewing the Dashboard with TokenRing 273
Common Token Ring PerformanceProblems 278
Configuring Thresholds 283Other Token Ring Performance
Solutions 283Analyzing LAN Routing Performance Issues 286
Routing Updates 287Realigning Your Network for Better Performance 289Summary 292Solutions Fast Track 292Frequently Asked Questions 296
Chapter 6 Capturing Network Data for Analysis 299
Introduction 300Capturing Traffic 300
How to Capture Traffic 301Taking Captures from the Menu and
the Toolbar 302Pulling Up the Capture Panel 303
Saving and Using Captures 305Saving Captures 306
File Types 311
Taking Captures fromthe Menu and theToolbar
There are a few differentways of taking captures:
■ By choosing Capture |Start from the Mainmenu
■ By pressing the F10 key
■ By pressing the Startbutton on the maintoolbar (it looks likethe Play button onyour VCR)
219_sniffer_TOC.qxd 6/28/02 5:00 PM Page xvii
xviii Contents
Retrieving and Loading Captures 311Capturing and Analyzing Address Resolution
Protocol 312Capturing ARP Traffic 313Analyzing the Capture 316
Capturing and Analyzing Internet ControlMessage Protocol 318
Capturing ICMP Traffic 318Analyzing the Capture 320
Capturing and Analyzing Transmission ControlProtocol 326
Capturing TCP Traffic 327Analyzing the Capture 329
Capturing and Analyzing User DatagramProtocol 333
Capturing UDP Traffic 334Analyzing the Capture 334
Summary 337Solutions Fast Track 338Frequently Asked Questions 341
Chapter 7 Analyzing Network Issues 343Introduction 344Hey! Why Is the Network So Slow? 344
Using Sniffer Pro to Troubleshoot a SlowNetwork 345
Excessive Collisions and CollisionDomains 345
Collisions on a Network Segment 347Ethernet Specifications 348Collision Domain 349Repeaters 350Ethernet Bridges 353Ethernet Switches 353Determining the Collision Domain 357
Half- and Full-Duplex Communication 358Late Collisions 360
NOTE
Remember, after 16consecutive collisions,the frame is discardedand the collision insome cases might notbe reported to theupper-layer protocols.Application timershave to expire beforea retransmissionattempt occurs. Thisstipulation can causeserious delays andprogram timeouts.
219_sniffer_TOC.qxd 6/28/02 5:00 PM Page xviii

Contents xix
Causes of Late Collisions 360Broadcasts from Hubs 361Broadcast Domains 361
What Does the Expert Say? 362Troubleshooting the Broadcast 363
Resetting Token Ring Networks 366Multi-MAU Configurations 367Token Passing 368
The Active Monitor 369The Standby Monitor 369
Ring Insertion 371Troubleshooting the Token 373
Using Sniffer Pro to Troubleshoot a ChatteringNetwork Interface Card 375
Alignment Errors 376Fragment Errors 378Jabber Errors 378
Using Sniffer Pro to Troubleshoot SmallPackets (Runts) 380
Using Sniffer Pro to Troubleshoot BrowsingBattles 381
Browser Elections 383Troubleshoot Browsing Battles 384Browser Communication 386Announcement! 389
Dynamic Host Configuration Protocol Failure 390BOOTP 390
DHCP Discover 391DHCP Offer 393DHCP Request 395DHCP Ack 396DHCP Release/Renew 397
DHCP Troubleshooting 399Summary 401Solutions Fast Track 402Frequently Asked Questions 404
219_sniffer_TOC.qxd 6/28/02 5:00 PM Page xix
xx Contents
Chapter 8 Using Filters 405Introduction 406What Is Filtering, and Why Filter? 406Using Predefined Filters 407
Filters Available to You by Default 407Creating Filters 409
Using the Filter Dialog Box 411Filter Dialog Box Tabs 411
Selecting Filters from the Main Menu 420Expert-Level Filtering 420
Filtering from One Node to Another 421MAC Address Filtering 423IP Address Filtering 428IPX Address Filtering 433
Troubleshooting with Filters 434Cisco Discovery Protocol 434Routing Information Protocol 437
Summary 439Solutions Fast Track 439Frequently Asked Questions 441
Chapter 9 Understanding and Using Triggers and Alarms 445
Introduction 446Introducing Triggers 448Configuring and Using Triggers 449
The Trigger Graphic Outline 449The Start and Stop Trigger Screens 450
Using the Date/Time Option 451Using the Alarm Option 452Using the Event Filter 453
Trigger Repeat Mode 454Configuring and Using Alarms 455
Alarm Log Display 456The Status Column 459The Alarm Type Column 459The Log Time Column 460
Filters
Sniffer Pro has four typesof filters:
■ Capture filters
■ Display filters
■ Monitor filters
■ Event filters
The Alarm TypeColumn
The Alarm Type columnindicates the type of nodeor the originator of thealarm as defined withinthe Address Book. Thesetypes can include servers,bridges, hubs, and othernetwork devices.
219_sniffer_TOC.qxd 6/28/02 5:00 PM Page xx
Contents xxi
The Severity Column 460The Description Column 460
Configuring Alarms Notifications 460Notification Using a Sound 460Associating an Action with Alarm
Severity 461Define Severity 461Define Actions Notification 462Managing Alarm Actions 463Defining an SMTP Mail Notification 464Defining a Pager Notification 465Defining a Beeper Notification 468
Modifying Alarm Threshold Levels 469Expert Alarm Thresholds 469Monitoring Alarm Thresholds 470
Application Response Time 472Summary 474Solutions Fast Track 476Frequently Asked Questions 479
Chapter 10 Reporting 481Introduction 482Reporting Fundamentals 482
Why You Should Consider Creatinga Report 484
Creating the Report Template 487Report Contents 487Tools of the Trade 488
Running and Exporting Reports 493Running Reports Under the Expert 494Running Reports Under the Matrix 497
Outline and Detail Views 497Top N Views 498
Running Reports Under Host Table 500Running Reports Under Protocol
Distribution 501Running Reports Under Global Statistics 502
NOTE
For the SnifferCertified Professionalexam, you might wantto pay attention fromwhere you can exporta report.
219_sniffer_TOC.qxd 6/28/02 5:00 PM Page xxi

Attacks: PasswordCapture and Replay
■ File Transfer Protocol(FTP) is the Internet’sfile exchange protocol.The protocol usesclient/serverarchitecture.
■ The client/serversession negotiation istransmitted in cleartext. The login andpasswords arecompletely visible toany would-be hackerwho has the price of acheap sniffingprogram. These itemscan be captured andreplayed with aminimum amount ofeffort.
■ Sniffer Pro can beconfigured to detectinvalid login orpassword attempts andmitigate the risk ofusing this clear-textprotocol.
xxii Contents
Other Exportable and Reportable Views 503Exporting from Your Address Book 504Exporting Data from Other Tools 504
HTML and CSV 505Creating a Full Report:“Network Is Slow” 506
“The Network Is Slow” 507Summary 509Solutions Fast Track 509Frequently Asked Questions 511
Chapter 11 Detecting and Performing Security Breaches with Sniffer Pro 513
Introduction 514Using Sniffer Pro to Find Holes in Your Network 514
Delivery and Payload 515Vulnerabilities in Detail 516
Code Red:The Exploit 516Nimda:The Exploit 524
Capturing Clear-Text Passwords 527IPv4 and Clear-Text Transfer of Information 527Telnet 528
Telnet Echo 529The Telnet Login Filter 530
SSH and Encryption 532Capturing E-Mail Logins 532
Attacks: Password Capture and Replay 534Capturing the Password, Step by Step 534Replaying the Password 536
FTP Password Guessing 536Simple Network Management Protocol 539
Domain Name Service Vulnerabilities 541DNS Basics 543
Resource Records 544DNS Recursion 545
Resolver 546DNS Zone Transfers 551Poisoning the DNS Cache 551
219_sniffer_TOC.qxd 6/28/02 5:00 PM Page xxii

Contents xxiii
DNS Cache Poisoning: How Does It Work? 552Cache Vulnerabilities 552
Server Message Block Vulnerabilities 555CIFS 556SMB and Its Flaws 556
Half the Story 556SMB Capture 557
SMB Signing 559Summary 560Solutions Fast Track 561Frequently Asked Questions 563
Chapter 12 Troubleshooting Traffic for Network Optimization 567
Introduction 568Fine Tuning Your Network and Performing
Proactive Maintenance 568Defining Key Elements of Quality
Network Performance 569Addressing Speed Issues 570Addressing Reliability Issues 572Addressing Security Issues 574
Proactive Management of NetworkResources with Sniffer Pro 576
AntiSniff:Who’s Sniffing Whom? 586Finding Unnecessary Protocols with the
Sniffer Pro 590Is TCP/IP Perfect? 594
Chatty Protocols 597AppleTalk 597IPX/SPX 599
Optimizing LAN and WAN Traffic Withthe Sniffer Pro 601
Broadcasts in Switched LAN Internetworks 601Spanning Tree Protocol 603
Attach Directly to a Switch for Analysis 606Optimizing with Sniffer Pro 611
TIP
If you want to test theuse of Sniffer Prorecording smallpackets, you can pingyourself with the fol-lowing:C:\> ping192.168.1.1 –t –l 50The –t will keep thepings continuousThe –l will set thelength of the packets,and the 50 is setting itto 50 bytes
219_sniffer_TOC.qxd 6/28/02 5:00 PM Page xxiii

xxiv Contents
Using Sniffer Pro to Find WAN Latency 613Solving Network Slowdowns with
Sniffer Pro 615More Slow Network Problems 617
Ethernet Optimization 618Ethernet Issues and the Need for
Optimization 618Collisions and Collision Domains 618CRC Errors 619Bottlenecks 619Unnecessary Broadcasts 620
NetWare Optimization and MicrosoftOptimization 621
Common NetWare Optimization Needs 622Common Microsoft Optimization Needs 624
Summary 627Solutions Fast Track 628Frequently Asked Questions 630
Index 633
219_sniffer_TOC.qxd 6/28/02 5:00 PM Page xxiv

Document3 4/3/02 4:04 PM Page 1