Smart Model Based Coordinated Control Based on Feeder Losses, Energy Consumption, and Voltage...
12
This article was downloaded by: [76.254.18.46] On: 06 November 2013, At: 09:46 Publisher: Taylor & Francis Informa Ltd Registered in England and Wales Registered Number: 1072954 Registered office: Mortimer House, 37-41 Mortimer Street, London W1T 3JH, UK Electric Power Components and Systems Publication details, including instructions for authors and subscription information: http://www.tandfonline.com/loi/uemp20 Smart Model Based Coordinated Control Based on Feeder Losses, Energy Consumption, and Voltage Violations Ahmet Onen a , Danling Cheng b , Reza Arghandeh a , Jaesung Jung a , Jeremy Woyak b , Murat Dilek b & Robert P. Broadwater a b a Department of Electrical and Computer Engineering , Virginia Polytechnic Institute and State University , Blacksburg , Virginia , USA b Electrical Distribution Design, Inc. , Blacksburg , Virginia , USA To cite this article: Ahmet Onen , Danling Cheng , Reza Arghandeh , Jaesung Jung , Jeremy Woyak , Murat Dilek & Robert P. Broadwater (2013) Smart Model Based Coordinated Control Based on Feeder Losses, Energy Consumption, and Voltage Violations, Electric Power Components and Systems, 41:16, 1686-1696, DOI: 10.1080/15325008.2013.835362 To link to this article: http://dx.doi.org/10.1080/15325008.2013.835362 PLEASE SCROLL DOWN FOR ARTICLE Taylor & Francis makes every effort to ensure the accuracy of all the information (the “Content”) contained in the publications on our platform. However, Taylor & Francis, our agents, and our licensors make no representations or warranties whatsoever as to the accuracy, completeness, or suitability for any purpose of the Content. Any opinions and views expressed in this publication are the opinions and views of the authors, and are not the views of or endorsed by Taylor & Francis. The accuracy of the Content should not be relied upon and should be independently verified with primary sources of information. Taylor and Francis shall not be liable for any losses, actions, claims, proceedings, demands, costs, expenses, damages, and other liabilities whatsoever or howsoever caused arising directly or indirectly in connection with, in relation to or arising out of the use of the Content. This article may be used for research, teaching, and private study purposes. Any substantial or systematic reproduction, redistribution, reselling, loan, sub-licensing, systematic supply, or distribution in any form to anyone is expressly forbidden. Terms & Conditions of access and use can be found at http://www.tandfonline.com/page/terms- and-conditions
Transcript of Smart Model Based Coordinated Control Based on Feeder Losses, Energy Consumption, and Voltage...

This article was downloaded by: [76.254.18.46]On: 06 November 2013, At: 09:46Publisher: Taylor & FrancisInforma Ltd Registered in England and Wales Registered Number: 1072954 Registeredoffice: Mortimer House, 37-41 Mortimer Street, London W1T 3JH, UK
Electric Power Components and SystemsPublication details, including instructions for authors andsubscription information:http://www.tandfonline.com/loi/uemp20
Smart Model Based Coordinated ControlBased on Feeder Losses, EnergyConsumption, and Voltage ViolationsAhmet Onen a , Danling Cheng b , Reza Arghandeh a , Jaesung Jung a
, Jeremy Woyak b , Murat Dilek b & Robert P. Broadwater a ba Department of Electrical and Computer Engineering , VirginiaPolytechnic Institute and State University , Blacksburg , Virginia ,USAb Electrical Distribution Design, Inc. , Blacksburg , Virginia , USA
To cite this article: Ahmet Onen , Danling Cheng , Reza Arghandeh , Jaesung Jung , Jeremy Woyak ,Murat Dilek & Robert P. Broadwater (2013) Smart Model Based Coordinated Control Based on FeederLosses, Energy Consumption, and Voltage Violations, Electric Power Components and Systems, 41:16,1686-1696, DOI: 10.1080/15325008.2013.835362
To link to this article: http://dx.doi.org/10.1080/15325008.2013.835362
PLEASE SCROLL DOWN FOR ARTICLE
Taylor & Francis makes every effort to ensure the accuracy of all the information (the“Content”) contained in the publications on our platform. However, Taylor & Francis,our agents, and our licensors make no representations or warranties whatsoever as tothe accuracy, completeness, or suitability for any purpose of the Content. Any opinionsand views expressed in this publication are the opinions and views of the authors,and are not the views of or endorsed by Taylor & Francis. The accuracy of the Contentshould not be relied upon and should be independently verified with primary sourcesof information. Taylor and Francis shall not be liable for any losses, actions, claims,proceedings, demands, costs, expenses, damages, and other liabilities whatsoever orhowsoever caused arising directly or indirectly in connection with, in relation to or arisingout of the use of the Content.
This article may be used for research, teaching, and private study purposes. Anysubstantial or systematic reproduction, redistribution, reselling, loan, sub-licensing,systematic supply, or distribution in any form to anyone is expressly forbidden. Terms &Conditions of access and use can be found at http://www.tandfonline.com/page/terms-and-conditions

Electric Power Components and Systems, 41:1686–1696, 2013
Copyright © Taylor & Francis Group, LLC
ISSN: 1532-5008 print/1532-5016 online
DOI: 10.1080/15325008.2013.835362
Smart Model Based Coordinated Control Based onFeeder Losses, Energy Consumption, and
Voltage Violations
AHMET ONEN,1 DANLING CHENG,2
REZA ARGHANDEH,1 JAESUNG JUNG,1
JEREMY WOYAK,2 MURAT DILEK,2 and
ROBERT P. BROADWATER1;2
1Department of Electrical and Computer Engineering, Virginia Polytechnic
Institute and State University, Blacksburg, Virginia, USA2Electrical Distribution Design, Inc., Blacksburg, Virginia, USA
Abstract There can be significant benefits to utilities for implementing automatedand controllable devices. However, due to both the cost of smart devices and the
cost of implementing the required monitoring, communication, and control, it is oftennot cost effective to update all devices on the system at once. This article presents an
economic evaluation of a model-based distribution control scheme that is independent
of circuit topology and integrates legacy and modern control equipment. Distributedengineering workstation simulation results show cost saving to both the customers
and utility due to reduction of demand and losses. These cost savings provide thebasis for assessing which feeders should be upgraded with smart devices.
Keywords power distribution control, power systems modeling, power system lossand energy reduction
1. Introduction
Most of the electric power distribution feeders in operation today were constructed with
technology that is now decades old. As new customers are connected and existing loads
change, utilities face the need to upgrade systems to prevent overloads and low voltages.
Even when the loads are not changing, utilities may face incentives from regulatory
agencies to improve reliability. Recent technological advancements have given utilitiesnew ways of resolving overloads and low voltages and improving reliability. Some
technological improvements involve retrofitting older equipment with new control and
communication devices. Such technologies can be more cost efficient than the traditional
solution of building new substations and lines.
One example of equipment that may often be cost effectively retrofitted is the shunt
capacitor. A capacitor may have been installed with no more control than a manually
Received 22 April 2013; accepted 13 August 2013.Address correspondence to Mr. Ahmet Onen, Department of Electrical and Computer
Engineering, Virginia Tech, Virginia Polytechnic Institute and State University, 302 WhittemoreHall, Blacksburg, VA 24061-0111. E-mail: [email protected]
1686
Dow
nloa
ded
by [
76.2
54.1
8.46
] at
09:
46 0
6 N
ovem
ber
2013

Model-based Coordinated Control 1687
operated, ganged, three-phase switch. In many such cases, the capacitor must be switched
off manually during low-load seasons. Leaving the capacitor on during the low-load
seasons would cause unacceptably high voltages or leading power factors [1, 2]. The
cost of sending a crew to switch a capacitor manually varies depending on the utility’s
labor costs and the location of the capacitor, but in some cases, switching a capacitor on
and off once per year can cost $400 per year [1]. Because of the switching cost, manuallyoperated capacitors are switched infrequently and may operate inefficiently for much of
the year.
A common upgrade to the manually switched capacitor would be a local controller
that either switches based on time clock settings (to switch off during hours of lower
expected load) or based on a local voltage measurement (to switch off when the voltageexceeds a certain threshold and switch back on when the voltage falls below another
threshold).
Local controllers make decisions with very limited data (historical loading data
for time-controlled capacitors or a local voltage measurement for voltage-controlled
capacitors). The switching implemented with local controllers may be far from optimal.
With communications technology, decisions could be made at a centralized controllerwhere a detailed model and many real-time measurements are taken into account to
determine set-points for local controllers. For example, if a local controller for a switched
capacitor uses voltage set points that specify a range for control, the centralized controller
could update the voltage set-points.
The set-points determined by the centralized controller would coordinate the capac-itor banks operation with other controllable devices on the feeder. The set-points to the
switched capacitor may change due to a number of conditions, including (1) changes in
loading level; (2) reconfiguration of the feeder; (3) a change in the operational strategy,
such as a voltage conservation reduction strategy or operating the feeder to supply the
maximum load. Not only switched capacitors would be considered by the centralizedcontroller, but set-points would also be specified for voltage regulators, substation trans-
former load tap changers (LTCs), and other devices, such as distributed energy resources.
Many works have been written that explain the effects of capacitor control on system
performance. In [3], an algorithm was described for optimal capacitor placement based on
determining nodes for which their voltages most affect losses in the system. A dynamic
programming-based algorithm for determining the optimum number, location, and sizeof capacitors was presented in [4]. A dynamic programming was used in [5] to determine
optimal controller switching to reduce feeder losses. In [6], the use of computer software
was explored to find solutions to the problem of optimum location and size based on the
calculation of kVAR miles, feeder losses, and power factors. The author of [7] discussed
volt-VAR control of capacitors and optimum capacitor bank installation with advanceddistribution automation. In [8], the authors proposed a coordinated control algorithm
to achieve better voltage and reactive power compensation and operation times of the
LTC and switched capacitors; that work, however, not consider load voltage dependency.
A voltage control method based on voltage violations when distributed generators are
installed was explored in [9]. In [10], voltage issues were explored by injecting newdistributed resources and a coordinated voltage regulation method to get rid of voltage
rise problems was provided. Centralized control was investigated in [11] by transformer
tap changing without considering other control devices.
The work here focuses on the economic benefit of coordinated model-based control;
that is, the actions of all automated control devices are coordinated through the centralized
model calculations. Such coordination includes (1) coordination with devices that are
Dow
nloa
ded
by [
76.2
54.1
8.46
] at
09:
46 0
6 N
ovem
ber
2013

1688 A. Onen et al.
still operating using local controls that cannot be affected by the centralized model
control calculations (i.e., no communications); (2) coordination of control devices when
reconfigurations occur and a feeder either gains or loses automated control devices; and
(3) coordination when the control objective for the feeder changes, such as changing
from the most efficient feeder operations (i.e., minimizing losses of the feeder itself) to
conservation voltage reduction.The operating strategy for a coordinated model-based control may be changed in
real time [12]. One operating strategy that may be used is reduction of feeder losses.
Another operating strategy is conservation voltage reduction, where the energy delivered
to customer loads is reduced by operating the loads at lower but acceptable voltage
levels. The reduction in energy results in a lower feeder demand and also lower electricbills to customers. Yet another strategy that may be employed by the coordinated model-
based control is to maximize the amount of load that may be served by the feeder. This
strategy typically results in the feeder being operated at higher but acceptable voltage
levels, where overloads and/or low voltages are being avoided.
This article is organized as follows: The distribution system model under study
is described in Section 2. Time-varying load estimation and coordinated control areintroduced in Sections 3 and 4, respectively. Case studies and a discussion of the results
are provided in Section 5, and finally, conclusions are given in Section 6.
2. System Model
This study evaluates a model containing 17,437 components, or objects, in 11 feeders
supplied by 7 different substation transformers. The geographic topology of the feeders is
shown in Figure 1.
The load on the system consists of residential and small commercial customers,
totaling 21,991 customers served by 3472 distribution transformers. The system has16 fixed shunt capacitors, 12 switched shunt capacitors, and 1 voltage regulator.
All 12 switchable capacitors have gang-operated controllers. Besides the seven sub-
station transformers, each with an LTC, there is also one voltage regulator in the system
that regulates all three phases independently. Table 1 presents additional details for these
control devices.
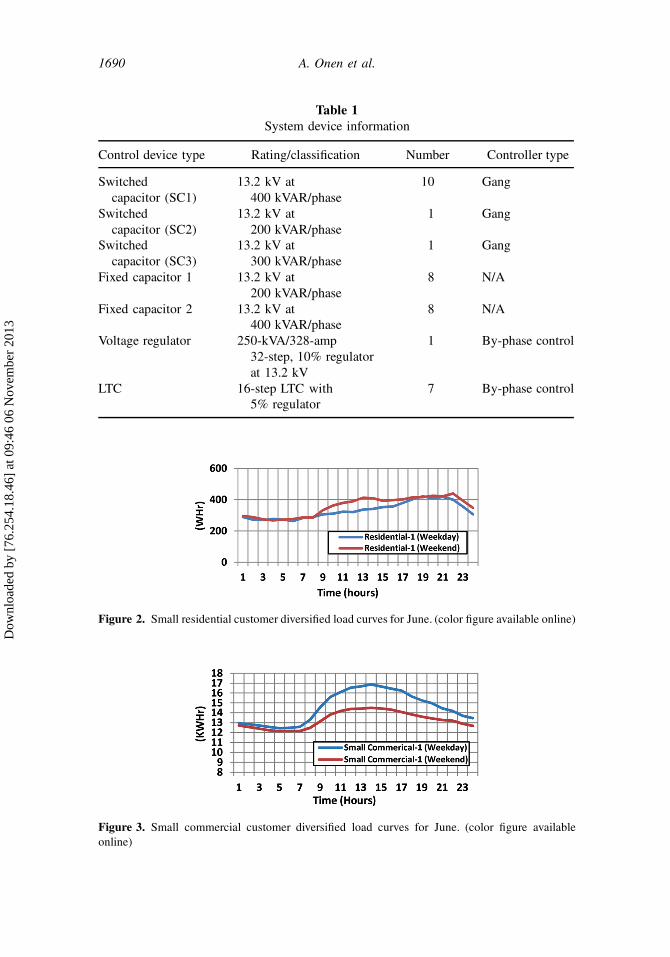
3. Time Varying Load and Cost of Energy
In this article, customers are grouped into classes to perform customer class-based
load estimation. The customer kWhr consumption billing data is used to formulate
the estimates of loads, including class-based diversity factors and kWhr-to-peak-kWconversion factors [13].
Hourly load data for different types of customers that are aggregated at each service
location are used in the load flow study [14]. Figures 2 and 3 illustrate two diversified
load curves, one for small commercial and the other for small residential customers,
in June.An accurate assessment of the cost savings available from loss reduction depends
not only upon calculating the consumption and losses at different times of the day and
year but also upon calculating the cost of energy accurately at the corresponding times
of day and year. Utilities operating in regions with competitive electric energy markets
pay different prices for energy at different times of day. These prices vary by location
(primarily due to congestion in the transmission system) and are called locational marginal
Dow
nloa
ded
by [
76.2
54.1
8.46
] at
09:
46 0
6 N
ovem
ber
2013

Model-based Coordinated Control 1689
Figure 1. Eleven-feeder system used in study. (color figure available online)
prices (LMPs). Since the power system model used in this study comes from the state
of New York, corresponding LMP data from the New York independent system operator
was used in calculating the cost of losses at each hour [15].
4. Coordinated Control Algorithm
The local control approach is far from being an optimal approach, with local controlsettings for controllable devices based on very limited data, such as data that does not
change with changing conditions of the circuit, such as time, or circuit measurements at
only a single point in the circuit.
The coordinated control approach used in this paper is article on [16]. The coor-
dinated control system operates using an integrated system model (ISM) as describedin [6].
The coordinated control algorithm is used here with two control strategy objectives.
The first is minimizing the overall feeder loss. The other is conservation voltage reduc-
tion, which aims to minimize the overall customer voltage while maintaining the volt-
age throughout the system such that every customer is served within a specified voltage
range [17]. The control algorithm is described next.
Dow
nloa
ded
by [
76.2
54.1
8.46
] at
09:
46 0
6 N
ovem
ber
2013
1690 A. Onen et al.
Table 1
System device information
Control device type Rating/classification Number Controller type
Switched
capacitor (SC1)
13.2 kV at
400 kVAR/phase
10 Gang
Switched
capacitor (SC2)
13.2 kV at
200 kVAR/phase
1 Gang
Switched
capacitor (SC3)
13.2 kV at
300 kVAR/phase
1 Gang
Fixed capacitor 1 13.2 kV at
200 kVAR/phase
8 N/A
Fixed capacitor 2 13.2 kV at400 kVAR/phase
8 N/A
Voltage regulator 250-kVA/328-amp
32-step, 10% regulator
at 13.2 kV
1 By-phase control
LTC 16-step LTC with5% regulator
7 By-phase control
Figure 2. Small residential customer diversified load curves for June. (color figure available online)
Figure 3. Small commercial customer diversified load curves for June. (color figure available
online)
Dow
nloa
ded
by [
76.2
54.1
8.46
] at
09:
46 0
6 N
ovem
ber
2013

Model-based Coordinated Control 1691
Step 1: The control algorithm first discovers all the controllable devices in the
model, which, in this study, includes switched shunt capacitors, voltage reg-
ulators, and substation transformers with LTCs. In the following discussion,
capacitors are single-step devices, since here they only have two control
states—on and off. Voltage regulators and transformer LTCs are multi-
step devices, since there is a range of valid control states. In addition todiscovering the devices, the control algorithm also discovers the existing set-
points of these devices. Since the algorithm is designed to be run in real time,
multi-step devices are only allowed to move within a user-specified number
of steps from their current position. Also, no two capacitors on a single
feeder may be switched at the same time. This is to prevent unacceptablevoltage flicker.
Step 2: For each loop, customer voltages and system losses are calculated.
Step 3: The system is first analyzed for overloads and/or voltage limit violations, and
the controllers are adjusted first to reduce loading on overloaded components
and/or to eliminate low voltages if possible. Once overloads or low voltages
are addressed, the algorithm then considers the selected control strategy,which in this case is either conservation voltage reduction or minimizing
feeder losses.
Step 4: The solution found is saved and serves as the starting state for coordinated
control analysis at the next time point.
Step 5: When the algorithm has finished, it provides the list of control devices thatminimizes the selected control strategy objective function.
In this study, the coordinated control process is automatically run for every hourwithin a year, or 8760 time points are analyzed. The economic benefits may then be
computed using the system losses, the energy consumption, and the worth of the energy
using the hourly LMP data.
5. Simulations and Results
The study consists of two parts. In Part I, system losses and energy delivered will beanalyzed. Part II addresses the value of coordinated control in eliminating low voltage
problems.
Part I
The simulation results will be grouped by feeder and by substation transformer. Table 2
shows the number and types of controllable devices for each feeder and with which
transformer the feeder is associated, where the abbreviation Xfrm is used for transformer.
Figure 4 presents a comparison of the losses with and without the coordinated control.
The “existing” system uses local voltage control for all device types. The coordinatedcontrol algorithm is permitted to operate the regulating transformers in the substation,
voltage regulator, and switchable capacitors. As discussed in Section 2, the hourly
calculated losses are aligned with LMP cost data in calculating the worth of the losses.
The loss savings realized on each feeder varies based on the number of controllable
devices and relative difference in control states as determined by the local controller
versus the coordinated controller. Since different devices will provide different savings
Dow
nloa
ded
by [
76.2
54.1
8.46
] at
09:
46 0
6 N
ovem
ber
2013

1692 A. Onen et al.
Table 2
Devices distribution
Feeder no. Number of devices Device types
Xfrm1 1 1 LTC
2 3 (2) SC1, LTC
3 2 SC1, LTC4 1 LTC
Xfrm2 5 3 SC1, VR, LTC
Xfrm3 6 3 SC1, SC2, LTC
7 2 SC1, LTC
Xfrm4 8 3 (2) SC1, LTCXfrm5 9 3 SC1, SC3, LTC
Xfrm6 10 2 SC1, LTC
Xfrm7 11 1 LTC
to the utility, it is helpful to compare the cost of implementing the coordinated control
with the savings due to reduction in losses. The estimated costs of upgrading each
individual device (all switched capacitor types, voltage regulators, and LTCs) with the
remote communication and control equipment needed for coordinated control are $8000.This cost is based upon having radio communications in place and does not take into
account the cost of the communication infrastructure.
In addition to the cost of upgrading the individual devices, the utility faces additional
costs of implementing the communication and control infrastructure. Approximate costs
have been provided in Figure 5 for each substation, so the cost savings from the lossreduction may be compared to the installation costs to calculate a payback period.
Figure 4. Comparison of losses and savings. (color figure available online)
Dow
nloa
ded
by [
76.2
54.1
8.46
] at
09:
46 0
6 N
ovem
ber
2013

Model-based Coordinated Control 1693
Figure 5. Annual savings and payback period. (color figure available online)
Using the data from Figure 5, the utility can identify feeders for which coordinated
control is cost effective. As mentioned in Section 4, the algorithm may be run to either
minimize feeder losses or minimize the average voltage. When the voltage is reduced,
constant-impedance loads, like incandescent lighting, are also reduced.
Next, using coordinated control to implement conservation voltage reduction willbe considered. Table 3 shows the reduction in energy consumption, where all loads are
modeled as constant current. Calculation of the worth of energy is based on an estimated
flat rate of $0.10 per kWhr.
Table 3
Savings for customer side
Feeder
no.
Local control
energy delivered
(mWhr)
Coordinated control
energy delivered
(mWhr)
Reduced
energy
(%)
Worth
($K)
Xfrm1 1 24,805.46 24,386.53 1.69 41.89
2 39,347.39 38,304.41 2.65 104.30
3 40,939.62 40,273.43 1.63 66.62
4 19,495.82 19,152.65 1.76 34.32Xfrm2 5 39,551.63 39,188.71 0.92 36.29
Xfrm3 6 57,675.62 58,363.69 �1.19 �68.81
7 39,742.50 39,547.24 0.49 19.53
Xfrm4 8 21,038.63 20,374.83 3.16 66.38
Xfrm5 9 26,594.37 26,280.67 1.18 31.37
Xfrm6 10 22,611.45 22,453.09 0.70 15.84Xfrm7 11 44,296.78 44,915.01 �1.40 �61.82
Dow
nloa
ded
by [
76.2
54.1
8.46
] at
09:
46 0
6 N
ovem
ber
2013

1694 A. Onen et al.
Table 3 shows that for most feeders, coordinated control with conservation voltage
reduction results in reduction in energy consumption and savings to the utility customer.
There are two feeders for which the coordinated control does not reduce the energy
consumption below that of the local control: feeders 6 and 11. This is because in these
feeders, low-voltage violations exist that are not taken into account by the local con-
trollers but are corrected by the coordinated control. Next, in Part II, coordinated controlcorrection of low voltages will be considered.
Part II
In this part, the simulation is performed for the year 2017 where the load growth has
resulted in a number of low-voltage problems (below 114 V on the secondary side of
the distribution transformers). Table 4 compares the performance of coordinated control
with local control.There are 2486 load points in the model, and the analysis is performed for 8760 differ-
ent time or loading points. This results in 21,777,360 evaluations of load points at which
low voltages could exist. Table 4 shows the count and also percentage of low-voltage
points for the local control strategy and also for the coordinated control strategy. Overall
the local control has a total of 1.5706% low voltages, whereas the coordinated controlreduces this number to 0.2008%. The utility will need to spend money to correct the low-
voltage problems. With the local control, all feeders in the system have low-voltage prob-
lems. However, with the coordinated control, four of the feeders have no low-voltage
problems, and the low-voltage problems in all feeders are significantly reduced with the
coordinated control.
Table 4
Comparison of number of locations with voltage less than 114 between local control
and coordinated control
Feeder
no.
Localcontrol
count of
low voltages
Low voltages
with local
control aspercent of
time-varying
loads (%)
Coordinatedcontrol
count of
low voltages
Low voltages
with coordinated
control aspercent of
time-varying
loads (%)
Xfrm1 1 598 0.0252 0 0.0000
2 4370 0.1327 70 0.0021
3 46 0.0023 0 0.0000
4 547 0.0484 41 0.0036Xfrm2 5 3596 0.1425 1225 0.0486
Xfrm3 6 5311 0.2743 936 0.0483
7 5122 0.2670 553 0.0288
Xfrm4 8 0 0.0000 0 0.0000
Xfrm5 9 1677 0.0674 4 0.0002
Xfrm6 10 10,576 0.5889 1242 0.0692Xfrm7 11 185 0.0218 0 0.0000
Dow
nloa
ded
by [
76.2
54.1
8.46
] at
09:
46 0
6 N
ovem
ber
2013

Model-based Coordinated Control 1695
6. Conclusion
Model-based coordinated control is compared with local control on a system consisting
of 11 feeders that have very different combinations of controllers. Three comparisons are
considered.
In the first comparison, the feeder losses with local control are compared withcoordinated control for minimizing feeder losses. In this comparison, payback periods
of coordinated control investments are calculated based on the loss savings. Some of
the payback periods, such as five years, would justify the investment in coordinated
control without any other considerations. However, some of the payback periods, such
as 150 years, are too long to justify the investment.
In the second comparison, local control is compared with coordinated control forconservation voltage reduction. In nine of the feeders, there is considerable savings due
to the reduction in energy consumption, and these savings could also be used to justify
investments in coordinated control.
In the third comparison, local control is compared with coordinated control for elim-
inating low-voltage problems. There are significantly more low-voltage problems withthe local control, and with local control, all feeders have low-voltage problems. However,
with the coordinated control, four of the feeders do not have low-voltage problems, and
the low-voltage problems that need correction are significantly less with the coordinated
control, which will result in a saving to the utility.
Across the three comparisons—minimizing feeder losses, minimizing energy con-sumption, and eliminating low voltages—the coordinated control shows significant
advantages over the local control.
References
1. Willis, H. L., Power Distribution Planning Reference Book, 2nd ed., New York: M. Dekker,
Chap. 9, 2004.
2. Gönen, T., Electric Power Distribution System Engineering, 2nd ed., Boca Raton, FL: CRC
Press, Chap. 8, 2008.
3. Abdel Salam, T. S., Chikhani, A. Y., and Hackam, R., “A new technique for loss reduction
using compensating capacitors applied to distribution system with varying load condition,”
IEEE Trans. Power Delivery, Vol. 9, No. 2, pp. 819–827, April 1994.
4. Duran, H., “Optimum number, location, and size of shunt capacitors in radial distribution
feeders: A dynamic programming approach,” IEEE Trans. Power Apparat. Syst., Vol. PAS-87,
No. 9, pp. 1769–1774, September 1968.
5. Hsu, Y. Y., and Kuo, H. C., “Dispatch of capacitors on distribution system using dynamic
programming,” IEEE Proc. C, Vol. 140, No. 6, pp. 433–438, November 1993.
6. Dilek, M., and Broadwater, R. P., “An introduction to integrated design in electrical distribu-
tion,” IEEE Power Eng. Soc. Winter Mtg., Vol. 2, pp. 991–994, 2002.
7. Zavoda, F., “Advanced distribution automation (ADA) applications and power quality in
smart grids,” 2010 China International Conference on Electricity Distribution, Nanjing, 13–
16 September 2010.
8. Choi, J.-H., Ahn, S.-J., Nam, H.-K., Kim, J.-C., and Moon, S.-I., “The coordinate control
method of LTC transformer and capacitor banks at distribution substation,” J. Elect. Eng.
Technol., Vol. 7, No. 3, pp. 320–329, 2012.
9. Jung, W.-W., and Song, I.-K., “Configurable, hierarchical, model-based control of electrical
distribution circuits,” IEEE Trans. Power Syst., Vol. 26, No. 3, pp. 1072–1079, 2011.
10. Shivarudraswarny, R., and Gaonkar, D. N., “Coordinated voltage regulation of distribution net-
work with distributed generators and multiple voltage-control devices,” Elect. Power Compon.
Syst., Vol. 40, No. 9, pp. 1072–1088, 2012.
Dow
nloa
ded
by [
76.2
54.1
8.46
] at
09:
46 0
6 N
ovem
ber
2013

1696 A. Onen et al.
11. Chang, C. S., and Huang, J. S., “Centralized control of transformer tap changing for voltage
stability enhancement,” Elect. Power Compon. Syst., Vol. 27, No. 10, pp. 1041–1054, 2010.
12. Diwold, K., Yan, W., De Alvaro Garcia, L., Mocnik, L., and Braun, M., “Coordinated voltage-
control in distribution systems under uncertainty,” 47th International Universities Power En-
gineering Conference (UPEC), pp. 1–6, London, 4–7 September 2012.
13. Sargent, A., Broadwater, R. P., Thompson, J. C., and Nazarko, J., “Estimation of diversity and
kWHR-to-peak-kW factors from load research data,” IEEE Trans. Syst., Vol. 9, pp. 1450–1456,
1994.
14. Broadwater, R. P., Sargent, A., Yarali, A., Shaalan, H. E., and Nazarko, J., “Estimating
substation peaks from load research data,” IEEE Trans. Power Delivery, Vol. 12, pp. 451–
456, 1997.
15. “Locational marginal pricing (LMP): Basics of nodal price calculation,” available at: http://www.
caiso.com/docs/2004/02/13/200402131607358643.pdf
16. Hambrick, J., and Broadwater, R., “Configurable, hierarchical, model-based control of electrical
distribution circuits,” IEEE Trans. Power Syst., Vol. 26, No. 3, pp. 1072–1079, 2011.
17. Lauria, D., “Conservation voltage reduction (CVR) at northeast utilities,” IEEE Trans. Power
Delivery, Vol. 2, No. 4, pp. 1186–1191, 1987.
Dow
nloa
ded
by [
76.2
54.1
8.46
] at
09:
46 0
6 N
ovem
ber
2013