SMART HELMET - Department of ECE
148
SMART HELMET MOUNTED MOTORCYCLE P ROXIMITY SENSOR WITH HELMET DISPLAY GROUP 22 J ULIAN B ONNELLS COMPUTER E NGINEERING J ORGE DE GOUVEIA COMPUTER E NGINEERING J EREMY REIMERS E LECTRICAL E NGINEERING BLAKE S CHERSCHEL COMPUTER E NGINEERING Senior Design I Project Documentation December 6, 2016
-
Upload
khangminh22 -
Category
Documents
-
view
2 -
download
0
Transcript of SMART HELMET - Department of ECE

SMART HELMET MOUNTED MOTORCYCLE PROXIMITY SENSOR WITH HELMET DISPLAY
GROUP 22
JULIAN BONNELLS COMPUTER ENGINEERING JORGE DE GOUVEIA COMPUTER ENGINEERING
JEREMY REIMERS ELECTRICAL ENGINEERING BLAKE SCHERSCHEL COMPUTER ENGINEERING
Senior Design I Project Documentation
December 6, 2016


i
TABLE OF CONTENTS
List of Figures ................................................................................................................................. vii
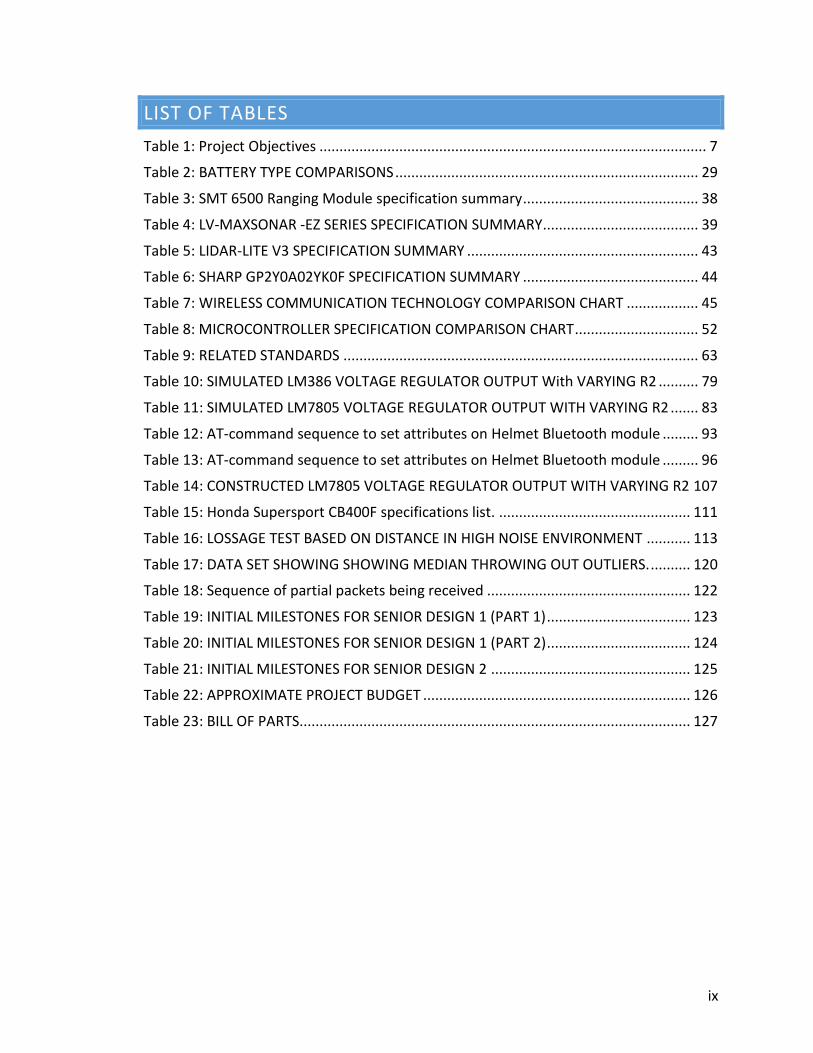
List of Tables ................................................................................................................................... ix
1 Executive Summary .................................................................................................................. 1
2 Project Description................................................................................................................... 2
2.1 Team member biographies ................................................................................................. 2
2.1.1 Julian Bonnells .......................................................................................................... 2
2.1.2 Jorge De Gouveia ..................................................................................................... 2
2.1.3 Jeremy Reimers ........................................................................................................ 3
2.1.4 Blake Scherschel ....................................................................................................... 3
2.2 Project Motivation and Goals ......................................................................................... 4
2.3 Objectives ....................................................................................................................... 6
2.3.1 Consumer demographics ......................................................................................... 8
2.4 Requirements Specifications .......................................................................................... 9
2.4.1 System Performance Requirements ........................................................................ 9
2.4.2 BIKE-Mounted Module .......................................................................................... 10
2.4.2.1 Hardware Requirements ..................................................................... 10
2.4.2.2 Software Requirements ....................................................................... 10
2.4.3 Rear-Mounted Module .......................................................................................... 11
2.4.3.1 Hardware Requirements ..................................................................... 11
2.4.4 Heads-Up Display Module...................................................................................... 12
2.4.4.1 Hardware Requirements ..................................................................... 12
2.4.4.2 Software Requirements ....................................................................... 12
2.5 House of Quality Analysis ............................................................................................. 12
3 Research Related to Project Definition .................................................................................. 15
3.1 Existing Similar Projects and Products .............................................................................. 15
3.1.1 SKULLY AR-1 Augmented Reality Helmet ............................................................... 15
3.1.2 NUVIZ Motorcycle Heads-Up Display ..................................................................... 16
3.1.3 BMW Motorrad Vision Heads-Up Display .............................................................. 18
3.1.4 BikeHUD by BIKESYSTEMS ..................................................................................... 19
3.2 Technologies Relevant to Project ..................................................................................... 20
3.2.1 Proximity Detection ............................................................................................... 20

ii
3.2.1.1 Lasers ................................................................................................... 21
3.2.1.2 Radio Waves ........................................................................................ 21
3.2.1.3 Ultrasound Waves ............................................................................... 22
3.2.1.4 Infrared ................................................................................................ 24
3.2.2 Wireless Data Transmission ................................................................................... 25
3.2.2.1 Wi-Fi ..................................................................................................... 25
3.2.2.2 Bluetooth ............................................................................................. 25
3.2.2.3 ZigBee .................................................................................................. 27
3.2.3 Power Management .............................................................................................. 28
3.2.3.1 Bluetooth low energy .......................................................................... 28
3.2.3.2 Battery Selection ................................................................................. 28
3.2.3.2.1 Alkaline ............................................................................................ 29
3.2.3.2.2 Lithium-Ion ...................................................................................... 30
3.2.3.2.3 Sealed Lead Acid ............................................................................. 30
3.2.3.2.4 Nickel-Metal Hydride ...................................................................... 31
3.2.3.3 Battery Charger.................................................................................... 31
3.2.3.3.1 Lithium-Ion Charging Algorithm ...................................................... 32
3.2.4 Visual Display ......................................................................................................... 32
3.2.4.1 LCD Display .......................................................................................... 33
3.2.4.2 LED Display........................................................................................... 33
3.2.4.3 Transparent OLED Display ................................................................... 34
3.2.4.4 LCOS ..................................................................................................... 34
3.2.5 Motorcycle Interface .............................................................................................. 35
3.2.5.1 On-Board-Diagnistics (OBD) ................................................................ 35
3.2.5.2 Dash LED Status Interception .............................................................. 36
3.3 Strategic Components and Part Selections .................................................................. 37
3.3.1 Proximity Detection ............................................................................................... 37
3.3.1.1 Sonar .................................................................................................... 37
3.3.1.2 LIDAR .................................................................................................... 42
3.3.1.3 Infrared ................................................................................................ 44
3.3.2 Wireless Data Transmission ................................................................................... 45
3.3.2.1 Wi-Fi ..................................................................................................... 46
3.3.2.2 Bluetooth ............................................................................................. 47

iii
3.3.2.3 ZigBee .................................................................................................. 48
3.3.3 Power Management .............................................................................................. 48
3.3.3.1 Solar Power .......................................................................................... 49
3.3.3.2 Battery Power ...................................................................................... 49
3.3.3.3 Motorcycle Power Supply .................................................................... 50
3.3.4 Microcontrollers..................................................................................................... 52
3.3.4.1 Arduino ................................................................................................ 53
3.3.4.2 MSP430 ................................................................................................ 54
3.3.4.3 Raspberry Pi ......................................................................................... 54
3.3.5 Motorcycle Interface .............................................................................................. 55
3.3.5.1 On-Board-Diagnostics (OBD) ............................................................... 55
3.3.5.2 Dash LED Status Interception .............................................................. 55
3.3.6 Visual Display ......................................................................................................... 55
3.3.6.1 LED Strip ............................................................................................... 56
3.3.6.2 OLED Non-transparent Screen ............................................................ 56
3.4 Summary of Selected Parts........................................................................................... 56
3.5 Possible Architectures and Related Diagrams .............................................................. 58
3.5.1 Proximity Sensor Helmet Architecture Draft ................................................................ 58
3.5.2 Three Microcontroller System Architecture Draft ........................................................ 59
3.5.3 Two Microcontroller System Architecture Draft .......................................................... 60
4 Related Standards & Design Constraints ............................................................................... 63
4.1 Standards .......................................................................................................................... 63
4.2 Design Impact of Relevant Standards ............................................................................... 64
4.2.1 Safety Standards .................................................................................................... 64
4.2.2 Bluetooth Communication ..................................................................................... 64
4.2.3 Lithium-Ion Rechargeable Battery ......................................................................... 64
4.2.4 Programming Language Standards ........................................................................ 64
4.2.4.1 Version Control .................................................................................... 65
4.2.5 Arduino Development Guidelines .......................................................................... 65
4.2.4.1 Naming Conventions ........................................................................... 66
4.2.4.2 Function Formatting Conventions ....................................................... 66
4.3 Economic and Time Constraints ....................................................................................... 67
4.4 Environmental Constraints ............................................................................................... 68

iv
4.5 Safety and Health Constraints .......................................................................................... 68
4.6 Manufacturability and Sustainability Constraints............................................................. 69
4.7 Scheduling concerns and time constraints ....................................................................... 69
5 Project Hardware and Software Design Details ..................................................................... 71
5.1 Initial Design Architecture and Related Diagrams ........................................................ 71
5.2 Bike-Mounted Motorcycle Interface Module............................................................... 73
5.2.1 Subsystem Overview .............................................................................................. 73
5.2.1.1 Arduino ATmega MCU ......................................................................... 73
5.2.1.2 Bluetooth Transmitter ......................................................................... 74
5.2.1.3 Interface to motorcycle ....................................................................... 75
5.2.1.4 Interface to proximity sensors ............................................................. 77
5.2.1.5 Power ................................................................................................... 77
5.2.2 Schematics and Simulation Test ............................................................................ 78
5.3 Rear-Mounted Proximity Detection Module ................................................................ 79
5.3.1 Subsystem Overview .............................................................................................. 79
5.3.1.1 Proximity Sensors ................................................................................ 80
5.3.1.2 Voltage Regulator ................................................................................ 81
5.3.1.3 Interface to Bike-Mounted module ..................................................... 82
5.3.2 Schematics and Simulation Test ............................................................................ 82
5.3.2.1 Voltage Regulator ................................................................................ 82
5.4 Helmet Heads-Up Display (HUD) Module .................................................................... 84
5.4.1 Subsystem Overview .............................................................................................. 84
5.4.1.1 Arduino Atmega MCU .......................................................................... 84
5.4.1.2 Bluetooth Receiver .............................................................................. 85
5.4.1.3 Visual Display ....................................................................................... 86
5.4.1.4 Power ................................................................................................... 86
5.4.1.5 Battery Charger.................................................................................... 86
5.4.1.6 Audio Amplifier .................................................................................... 87
5.4.2 Schematics and Simulation Test ............................................................................ 87
5.4.2.1 Battery Charger.................................................................................... 87
5.4.2.2 Audio Amplifier .................................................................................... 88
5.5 Software Design ............................................................................................................ 90
5.5.1 Software Design Goals ........................................................................................... 91

v
5.5.2 Bike-Mounted Module Controller.......................................................................... 92
5.5.2.1 Wireless Transmitter ........................................................................... 93
5.5.2.2 Proximity Sensors ................................................................................ 94
5.5.3 Helmet HUD ModuleController ............................................................................. 95
5.5.3.2 Wireless Transmitter ........................................................................... 96
5.5.3.2 Visual Display ....................................................................................... 97
5.5.4 Software Libraries ......................................................................................................... 98
5.5.4.1 Visual Display ............................................................................................ 99
5.5.4.2 Proximity Sensor ....................................................................................... 99
5.5.4.3 Serial Network Connection ..................................................................... 100
5.6 Summary of Design ..................................................................................................... 101
6 Project Prototype Construction and Coding ........................................................................ 104
6.1 Integrated Breadboard Test ....................................................................................... 104
6.1.1 Battery Charger .................................................................................................... 104
6.1.2 Audio Amplifier .................................................................................................... 105
6.1.3 Voltage Regulator ................................................................................................ 106
6.1.4 Proximity Sensor .................................................................................................. 108
6.2 PCB Vendor and Assembly.......................................................................................... 109
6.3 Final Coding Plan ........................................................................................................ 109
7 Project Prototyping Testing Plan ......................................................................................... 110
7.1 Hardware Test Environment ...................................................................................... 110
7.1.1 Motorcycle Testing .............................................................................................. 110
7.2 Hardware Specific Testing .......................................................................................... 111
7.2.1 MCU ..................................................................................................................... 111
7.2.1.1 Wireless Data Transmission ............................................................... 112
7.2.2 Proximity Sensors ................................................................................................. 114
7.2.3 Power Supply ....................................................................................................... 115
7.2.3.1 Motorcycle Power ............................................................................. 115
7.2.3.2 Solar Power ........................................................................................ 115
7.2.5 Visual Display ....................................................................................................... 115
7.3 Software Test Environment ........................................................................................ 116
7.4 Software Specific Testing ............................................................................................ 117
7.4.1 Arduino ................................................................................................................ 117

vi
7.4.1.1 Visual Display ..................................................................................... 118
7.4.1.1.1 Visibility and Readability ............................................................... 118
7.4.1.2 Proximity Sensor ................................................................................ 119
7.4.1.2.1 Accuracy and Delay ....................................................................... 119
7.4.1.2.2 Unit Conversion and Loss of Precision .......................................... 120
7.4.1.2.3 Consolidating Multiple Readings .................................................. 121
7.4.1.3 Bluetooth Communication ................................................................ 121
8 Administrative Content ........................................................................................................ 123
8.1 Milestone Discussion .................................................................................................. 123
8.2 Budget and Finance Discussion .................................................................................. 125
8.3 Bill of Parts Purchased ................................................................................................ 127
9 Conclusion ............................................................................................................................ 129
Appendices ................................................................................................................................... 130
Appendix A - Copyright Permissions ........................................................................................ 130
Appendix B - Datasheets .......................................................................................................... 133
Appendix C – Software ............................................................................................................. 134
Work Cited ................................................................................................................................... 134

vii
LIST OF FIGURES
Figure 1: UNITED STATES MOTORCYCLE REGISTRATION IN 2014 BY STATE ...................... 8
Figure 2: House of Quality Analysis .................................................................................. 13
Figure 3: SKULLY AR-1 TECHNICAL CONCEPT ART (CREDIT: SKULLY SYSTEMS 2014) ....... 15
Figure 4: NUVIZ RIDE:HUD Concept Rendering (Credit: NUVIZ 2013) .............................. 17
Figure 5: BMW Mottorad Heads-Up Display Concept Rendering (Credit: BMW 2015) ... 18
Figure 6: BikeHUD Adventure (Credit: Bikesystem 2016) ................................................ 20
Figure 7: Sound wave reflecting off the best case scenario object .................................. 24
Figure 8: ACI interface between application controller and BLE device .......................... 27
Figure 9: OBD-II WITH CAN SUPPORT PIN DIAGRAM ....................................................... 36
Figure 10: LZ-MAXSONAR -EZ1 BEAM PATTERN ............................................................... 40
Figure 11: Beam Width Testing Methodology .................................................................. 41
Figure 12: ESP-01 chip to USB serial pin configuration .................................................... 46
Figure 13: ATMEGA328P PIN MAPPING ........................................................................... 53
Figure 14: MSP430 PIN MAPPING ..................................................................................... 54
Figure 15: PROXIMITY SENSOR MOUNTED HELMET ARCHITECTURE DESIGN DIAGRAM 59
Figure 16: THREE MICROCONTROLLER SYSTEM ARCHITECTURE DESIGN DIAGRAM ....... 60
Figure 17: TWO MICROCONTROLLER SYSTEM ARCHITECTURE DESIGN DIAGRAM ......... 61
Figure 18: HIGH LEVEL PROJECT BLOCK DIAGRAM ........................................................... 72
Figure 19: BIKE-MOUNTED MOTORCYCLE INTERFACE MODULE OVERVIEW ................... 73
Figure 20: Cc2540 Bluetooth Low-Energy Serial module pin map (credit: evothings.com)........................................................................................................................................... 74
Figure 21: Honda CB400F wires connecting to the LEDs .................................................. 75
Figure 22: Interface circuit for motorcycle turn signal module ........................................ 76
Figure 23: SIMULATED ADJUSTABLE LINEAR VOLTAGE REGULATOR CIRCUIT ................. 78
Figure 24: REAR-MOUNTED PROXIMITY MODULE OVERVIEW ........................................ 80
Figure 25: LV-MAXSONAR -EZ1 SERIES PIN MAPPING ...................................................... 80
Figure 26: SIMULATED ADJUSTABLE LINEAR VOLTAGE REGULATOR CIRCUIT ................. 83
Figure 27: REAR-MOUNTED PROXIMITY MODULE OVERVIEW ........................................ 84
Figure 28: Cc2540 Bluetooth Low-Energy Serial module pin map (credit: evothings.com)........................................................................................................................................... 85
Figure 29: SIMULATED MCP73831 BATTERY CHARGING CIRCUIT .................................... 88
Figure 30: MCP73831-2 CHARGING CURRENT, BASED ON SWITCHES ............................. 88

viii
Figure 31: SIMULATED LM386 LOW-VOLTAGE AUDIO AMPLIFIER ................................... 89
Figure 32: LM386 VOLTAGE INPUT VS VOLTAGE OUTPUT (NOT TO SCALE) .................... 89
Figure 33: BIKE-MOUNTED MOTORCYCLE INTERFACE SOFTWARE FLOW ....................... 93
Figure 34: PROXIMITY SENSORS SOFTWARE FLOW DIAGRAM ........................................ 95
Figure 35: Helmet HUD module software flow ................................................................ 96
Figure 36: VISUAL DISPLAY SOFTWARE FLOW DIAGRAM ................................................. 98
Figure 37: Received bytes to packet construction lifecycle............................................ 101
Figure 38: CONSTRUCTED MCP73831 BATTERY CHARGING CIRCUIT............................. 104
Figure 39: MCP73831-2 CHARGING A 4.2V BATTERY OVER TIME .................................. 105
Figure 40: CONSTRUCTED LM386 LOW-VOLTAGE AUDIO AMPLIFIER ........................... 106
Figure 41: CONSTRUCTED LM7805 VOLTAGE REGULATOR CIRCUIT .............................. 107
Figure 42: CONSTRUCTED LV-MAXSONAR -EZ1 MB1010 CIRCUIT ................................. 108
Figure 43: DISTANCE VS. ACCURACY FOR MB1010 PROXIMITY SENSING ...................... 108
Figure 44: Visual Display Testing..................................................................................... 116
Figure 45: ARDUINO, BLUETOOTH, PROXIMITY, AND VISUAL DISPLAY TESTING ........... 117
Figure 46: Purchased Items (Part 1) ................................................................................ 128
Figure 47: Purchased Items (Part 2) ................................................................................ 128
ix
LIST OF TABLES
Table 1: Project Objectives ................................................................................................. 7
Table 2: BATTERY TYPE COMPARISONS ............................................................................ 29
Table 3: SMT 6500 Ranging Module specification summary ............................................ 38
Table 4: LV-MAXSONAR -EZ SERIES SPECIFICATION SUMMARY ....................................... 39
Table 5: LIDAR-LITE V3 SPECIFICATION SUMMARY .......................................................... 43
Table 6: SHARP GP2Y0A02YK0F SPECIFICATION SUMMARY ............................................ 44
Table 7: WIRELESS COMMUNICATION TECHNOLOGY COMPARISON CHART .................. 45
Table 8: MICROCONTROLLER SPECIFICATION COMPARISON CHART ............................... 52
Table 9: RELATED STANDARDS ......................................................................................... 63
Table 10: SIMULATED LM386 VOLTAGE REGULATOR OUTPUT With VARYING R2 .......... 79
Table 11: SIMULATED LM7805 VOLTAGE REGULATOR OUTPUT WITH VARYING R2 ....... 83
Table 12: AT-command sequence to set attributes on Helmet Bluetooth module ......... 93
Table 13: AT-command sequence to set attributes on Helmet Bluetooth module ......... 96
Table 14: CONSTRUCTED LM7805 VOLTAGE REGULATOR OUTPUT WITH VARYING R2 107
Table 15: Honda Supersport CB400F specifications list. ................................................ 111
Table 16: LOSSAGE TEST BASED ON DISTANCE IN HIGH NOISE ENVIRONMENT ........... 113
Table 17: DATA SET SHOWING SHOWING MEDIAN THROWING OUT OUTLIERS. .......... 120
Table 18: Sequence of partial packets being received ................................................... 122
Table 19: INITIAL MILESTONES FOR SENIOR DESIGN 1 (PART 1) .................................... 123
Table 20: INITIAL MILESTONES FOR SENIOR DESIGN 1 (PART 2) .................................... 124
Table 21: INITIAL MILESTONES FOR SENIOR DESIGN 2 .................................................. 125
Table 22: APPROXIMATE PROJECT BUDGET ................................................................... 126
Table 23: BILL OF PARTS.................................................................................................. 127


1
1 EXECUTIVE SUMMARY
The Smart Helmet system is planned to be a solution for any motorcycle rider that wishes to increase his or her awareness, and safety, while driving. The concept of proximity sensing in automobiles is not a new concept, and has been realized in different projects, and commercial products, before this one. However, such realizations tend to have their own set of advantages and disadvantages associated with them. The design and implementation of the Smart Helmet system seeks to maximize the advantages from similar products, while avoiding, or minimizing, the disadvantages. What sets the Smart Helmet apart from existing products is the lower cost and ease of use to ensure any motorcycle rider can afford and use it.
The Smart Helmet system will be able to gather proximity information of surrounding objects, using proximity sensors, to scan a wide field behind the rider, in order to determine if other vehicles are close by. The system will draw power from the motorcycle and interpret electrical signals from the bike, such as signaling, speed, and other tachometer information. Data will be sent wirelessly from the motorcycle-mounted module and received by the helmet module. The helmet display will alert the rider if a vehicle is too close to the motorcycle, and an audible tone will sound.
In order to implement these features and bring the design to fruition, careful consideration was taken when selecting each hardware component. Because this project did not receive any third-party funding, cost was a limiting factor in our design. This financial consideration directly affected the type of proximity sensor and visual display that were ultimately chosen, although stability of the product was not sacrificed in our decision to keep costs low.
Since the very nature of operating a motor vehicle at high speeds is inherently dangerous, additional considerations were taken to ensure that the Smart Helmet design did not interfere with the rider’s ability to safely drive. The heads-up display had to be unobtrusive to the rider’s vision of the road around them. Additionally, the other modules, namely the proximity sensors and bike-mounted module, had to be situated so that they did not restrict any movement, or weigh down the rider.
The final Smart Helmet design encompasses all the design elements previously discussed to bring a comprehensive product capable of helping the typical motorcyclist be safer while on the road. It is our hope that the smart helmet can reduce accidents, reduce road congestion, and make the road a safer place for all drivers.

2
2 PROJECT DESCRIPTION
2.1 TEAM MEMBER BIOGRAPHIES
With each of us having a strong passion for computer and electronic technology even from a young age, our team has come together, joining our technological knowledge and experience, in order to create the Smart Helmet. This is our first major project as a team, and we have high hopes for creating a modern and innovative product. With each of us graduating from the University of Central Florida in May 2017, we hope to use this experience as a building block to help shape our careers.
2.1.1 JULIAN BONNELLS
Starting from when he was old enough to use a computer, Julian Bonnells has always been enthralled by technology. He was always looking to better understand the science of how computers work and what they were made of. Born in Fort Lauderdale, Florida, Julian always knew that he wanted to grow up and work with computers. At a young age, he preferred math and logic classes to other subjects and always tended to gravitate towards computer-oriented classes.
Currently 23 years old, Julian is pursuing a bachelor's degree in Computer Engineering. He hopes to obtain a master’s degree once he has completed his undergraduate studies. Using the skills that he has gained from various projects and internships throughout his academic career, Julian hopes to contribute his knowledge of software and hardware to the overall Smart Helmet design.
2.1.2 JORGE DE GOUVEIA
Jorge De Gouveia, since his early childhood days, has been fascinated with space travel. Born in Caracas, Venezuela but raised in Weston, Florida he always envisioned himself becoming an astronaut or a crucial member of the Mission Control team. Jorge dreamed of being able to hear the countdown for a space shuttle launch. Whether it be behind the pilot seat or furiously checking pre-launch diagnostics he wanted to feel the adrenaline that is space travel. His childhood dream, coupled with his love for videogames and the Esports scene, is what pushed him to pursuing a computer engineering degree at the University of Central Florida. Jorge De Gouveia just wants to make an impact in the world.
Now 22 years of age and a senior at the UCF Jorge’s goal is to be able to apply his programming knowledge in the real world and integrate it with hardware in order to make a product that could be of use to the general public. Jorge sees Smart Helmet not only as an invaluable learning experience but also a gateway to either of his dream careers as a software engineer in the space industry or in the video game industry. Creating a

3
videogame that is loved by thousands of people or being on a team that discovers the next big space discovery is what drives him to be the best computer engineer that he can be.
2.1.3 JEREMY REIMERS
Jeremy Reimers has a passion for electronics. He was born in Ermelo, South Africa, and raised in Lakeland, Florida. He and his family came to this country with a fresh start for the opportunity of a better life. He grew up never having much, but always had a fascination for how things worked. Whenever something broke, fixing it was always the only option, and for years, the newest technology he had was the family’s MS-DOS computer.
Now at 28 years old, Jeremy is a senior at the University of Central Florida in Electrical Engineering, continuing his passion for learning how things work, and learning how to improve them. He has experience with electronics design and assembly, programming, 3D Modelling, and IT. He hopes to use his skills to improve the way of life for few, or for many, but overall aims to make a positive impact on the world. For the Smart Helmet, he will be utilizing his skills to ensure proper power is provided to all necessary components of the system.
2.1.4 BLAKE SCHERSCHEL
From a very young age, Blake Scherschel has had a fascination with computers and computer software. He was born in Binghamton, NY and grew up in the Tampa Bay Area, Florida. At the age of 13, he found an interest with computers when given the opportunity to scrap old computer parts together to make a better personal computer. Throughout grade school he learned Basic and later C# for the use of making a video game.
Even today at the age of 23, he can be found spending a significant amount of his time programming and tinkering for fun. Much deliberation was had over the decision of which major to pursue: computer engineering or computer science. After taking a few introductory level classes in engineering, he knew that he wanted to be an engineer. To have a fuller understanding of the lowest level topics of computers only pushed his already deep excitement for programming even deeper. Currently, Blake has had three internships at Lockheed Martin, Blizzard Entertainment, and Leidos Engineering, and hopes to utilize his skills to their potential on the Smart Helmet project. He hopes to benefit the team in any way he can, but primarily focusing on software architecture and low level systems design.

4
2.2 PROJECT MOTIVATION AND GOALS
The thrill of riding a motorcycle is something many people marvel for. What usually gets in the way of the enjoyment is the dangers that come with sharing the road with other vehicles at high speeds. According to the U.S. Department of Transportation’s National Highway Traffic Safety Administration (NHTSA), in 2014, 92,00 motorcyclists were injured and 4,586 died in motorcycle related crashes in the United States. The NHTSA concluded that motorcyclists are six times as likely to suffer a fatal injury compared to car passengers.
Staying safe while driving a vehicle can already be a difficult task but it gets ever more risky while operating a motorcycle. Most drivers have a lot to keep track of while on the road: speed, directions, unobservant drivers sharing the road, and make any possible effort to avoid potential collisions. Motorcyclists are forced, more than ordinary drivers, to stay watchful of the potential dangers around them and the fatal mistakes they could be victim to.
Modern technology has improved the safety features of most regular vehicles, but motorcycles have seemingly not benefitted from the same technological revolution. What motorcyclists need is a solution to safety concerns that all motorists have, while additionally assisting the driver in a few quality of life improvements on the road. This project aims to do just that by giving motorcyclists an easy and effective way of staying aware of the potential dangers lingering outside of their natural field of view.
By incorporating a Heads-Up Display (HUD) on the front of the helmet, motorcyclists should not have to rotate their entire body and head away from their line of travel to know if there are vehicles to the side, back, or even their blind spots. With our solution the driver will have an effective way of visually (and also audibly in critical scenarios) being notified of vehicles surrounding the bike to potentially save the rider’s life.
Although not designed to be a complete replacement to manually checking hazards, our device will help in the occurrences where a simple mistake could have lead to a fatal outcome.
The device will be lightweight and easily portable. It will be divided into two parts: wireless attached helmet HUD, and a Rear-Mounted area detection sensor which will be connected to a motorcycle interface. Although meant to interface with the motorcycle (to detect turn signals and other information about the bike), the entire device is meant to be mounted on and used by any motorcycle with supported standard connections.

5
The sensor and bike interface will be powered via the on-vehicle battery, and will send the critical information, wirelessly, to the helmet HUD. While riding, the helmet will always be listening for information sent from the bike, and will very frequently update, so the rider can always see current bike information. Low range wireless is planned, not only to prolong battery life, but to also avoid possible interference with communication.
The helmet HUD will be battery powered, and designed to run at very low power. It will last for hours on a single charge, and, with solar power, even longer. Home charging will also be available for the then helmet is not in use. Since the helmet HUD is the only part of the device that will need charging, user maintenance of the device will be simple and straightforward.
Others have attempted to deliver similar functionality, but they are either too unreliable or too overpriced for the realistic consumer. Our device aims to be a dependable and simple solution at a fraction of the price. The planned consumers for our project will be vendors, seeking to sell next generation safety equipment to motorcyclists. The design goals listed will be used as guidelines when developing the hardware and software requirements. In summary, our project seeks to meet the following goals:
● Research, design, and implement a cost-efficient motorcycle proximity detection
solution ● Incorporate distance sensing methodologies to detect objects from a far ● Successfully detect oncoming automobiles while in motion ● Integrate wireless communication between microcontrollers to transmit
proximity data ● Implement the design to be easily applicable for other automobile systems ● Design the Smart Helmet to be operable by many types of users with little to no
training required ● Follow industry standards to ensure safety, reliability and environmental care
Assuming all of the above goals are met, our project will also attempt to meet the following extended goals:
● Incorporate a flexible, transparent display for the helmet module ● Utilize a Global Positioning System (GPS) device to include navigation data to the
user ● Implement a live visual feed so the user can see what is behind them

6
● Include a brightness dimmer so that the use can dim or brighten the visual display ● Provide customization settings for the visual display that the user can configure ● Integrate mobile technology, such as a cellphone, into the project to control and
diagnose the Smart Helmet ● Implement a temperature sensor to provide weather details to the user
2.3 OBJECTIVES
Motorcycle safety is an ever-growing concern, and the rider must be aware of any dangers around them, even if they cannot see them. With the Smart Helmet, the rider will not only be more aware of danger, but will also be less of a danger to surrounding drivers. By always being able to keep their eyes on the road, and knowing if cars are around them without looking, the motorcyclist can vastly improve road safety.
The Smart Helmet will be equipped with a Heads-Up Display (HUD) that will communicate with the bike, and show bike information to the rider, so they will never have to look away from the road. The HUD with be mounted to the helmet, by the visor, and will have minimal visibility obstruction. This will allow the rider to see the information without losing sight of the road ahead. The visual display will be bright enough, with high enough contrast, for full daytime visibility.
The HUD will be designed to give a visual proximity warning to the rider, when the rider is signaling to merge, but is not clear to do so. An audible tone will also sound if the rider is not clear to merge, alerting the driver even more so, to help avoid an accident. The smart helmet will be lightweight, as to not over encumber the user, and communicate with the bike wirelessly, in order to give full freedom of motion. A minimum of a 2-hour battery life is expected from a full charge, with prolonged life from solar panels constantly charging the battery. USB charging will also be an option for when the Smart Helmet is not in use.
The design will be hard-wired into an existing helmet and bike. It is not our goal to be able to move the system from bike to bike, but instead, create a system unique to each bike to ensure the system runs stable. Our aim is to implement this system into a bike which has no internal computer, and so must be unique to the bike. We plan to counteract the constraint of one bike per system by keeping costs low, so more than one system can more easily be purchased if need be.
To ensure that the specified goals in Section 2.2 are met, each goal has been broken down into measurable objectives in Table 1. These objectives will be used to develop requirement specifications as well as help with overall design choices.

7
TABLE 1: PROJECT OBJECTIVES
Project Goal Objectives
Research, design, and implement a cost-efficient motorcycle proximity detection solution
● Research specific components related to distance ranging, wireless communication, power management, and displaying data
● Test components to ensure total system compatibility
● Design and print a PCB that supports all elements of the final design
Incorporate distance sensing methodologies to detect objects from a far
● Research different ranging technologies and determine which type of sensor best fits our project design
● Test to ensure that the selected sensor is capable of detecting automobiles
Successfully detect oncoming automobiles while in motion
● Test the system in a real-life setting to ensure full functionality
Integrate wireless communication between microcontrollers to transmit proximity data
● Research different wireless communication technologies and their impact on the system design
● Ensure that wireless transceivers are capable of sending and receiving data
Implement the design to be easily applicable for other automobile systems
● Use modular design practices to ensure easy transition to a different system
● Minimize hardware limitations by not only relying on motorcycle data
Design the Smart Helmet to be operable by many types of users with little to no training required
● Follow design principles to ensure that users have minimal trouble when interacting with the system
● Use easy-to-understand symbols when displaying data to user
Follow industry standards to ensure safety, reliability and environmental care
● Research standards related to the components of the system
● Ensure that we correctly implement hardware by following these standards

8
2.3.1 CONSUMER DEMOGRAPHICS
Based on the Bureau of Transportation 2014 statistics, there are currently over 8.4 million registered motorcycles in the United States. Within this population, 2.2 million of those registered motorcycles are located in California, Florida, Texas, Ohio, and Pennsylvania. The 2014 U.S. motorcycle registration location has been illustrated in a state chart, Figure 1, below.
FIGURE 1: UNITED STATES MOTORCYCLE REGISTRATION IN 2014 BY STATE
Ideally, the Smart Helmet’s target demographic would be every motorcycle rider in the United States. This is especially true since every state minus Illinois, Iowa, and New Hampshire all have some degree of helmet wearing law. However, with a limited budget and even greater limited advertising options, the Smart Helmet has decided to narrow in on their target demographic and target Florida motorcycle owners.
According to the 2014 study, Florida has the second most registered motorcycles in the country at 558,123 motorcycles. Florida only trails California who has an estimated 813,771 registered motorcycles. Even though motorcycles only make up 4% off all registered vehicles in the state, 19% of fatal vehicle accidents involve a motorcycle. This means that even though motorcycles make up a small percentage of total population in the state they have a high crash rate and a high fatality rate of those crashes.
Smart Helmet’s goal is to reduce motorcycle related injuries and deaths by a method of prevention. If we are able to raise the motorcyclist’s awareness of the dangers surrounding them, we will be able to make an impact on reducing accidents involving motorcycles. By targeting Florida, the state that the Smart Helmet team is based in, we

9
will be attempting to affect the state with the second greatest motorcycle population and the state with the most motorcycle related deaths in the nation.
The challenges that our target demographic brings us involve convincing Florida riders that this new technology indeed improves safety without a high cost and without obscuring a rider’s vision. This targeted demographic highly values safety according to a survey done by AAA Consumer Pulse. Even though Florida’s motorcycle law only requires motorcyclists 20 years and younger to wear a helmet, 86% of motorcyclist acknowledged that they wear helmets. This high motorcycle safety awareness is a positive characteristic of this demographic and leads us to believe that the Smart Helmet will be a success and will positively affect the lives of riders across the state of Florida.
2.4 REQUIREMENTS SPECIFICATIONS
The smart helmet will include two wireless communicating systems: the Mounted Motorcycle Interface and the Helmet Heads Up Display (HUD). These two systems operate completely asynchronously and communicate via wireless transmissions.
The Mounted Motorcycle Interface is further divided into two parts: the Bike-Mounted Motorcycle Interface and Rear-Mounted Proximity Detection Module. The Bike-Mounted Motorcycle Interface is involved with hosting the MCU, wireless transmitter, and interface for reading the status and diagnostics from the bike. The Rear-Mounted Proximity Detection Module is involved with utilizing proximity detection and feeding the results to the Bike-Mounted Motorcycle Interface. Although they operate under the same wired connected system, they are specified separately for clarity.
2.4.1 SYSTEM PERFORMANCE REQUIREMENTS
These three modules will work in conjunction to give the rider the best riding experience we can help to deliver.
● The system shall have three communication modules each with separate functions ● The system shall have a bike-mounted module and helmet module ● The system shall be able to detect surrounding automobiles in close range to the
rider ● The system shall provide ranging data to a visual display that the user can easily
see

10
● The system shall interface with the motorcycle inputs to read the driver’s intentions whilst driving
● The bike-mounted module system shall draw power from the motorcycle ● The helmet system shall draw power from a rechargeable battery ● The helmet system shall utilize solar energy for extended energy usage
2.4.2 BIKE-MOUNTED MODULE
The Bike-Mounted Motorcycle Interface module will be mounted directly onto the back of the motorcycle. It will read rider’s inputs (turn signal, etc.), listen for proximity information from the Rear-Mounted proximity detection module, and send uniform information wirelessly to the Helmet Heads-up Display (HUD) module. Wireless range is planned to extend to at least fifty feet, in between the two endpoints. A low wireless range is meant to preserve battery life, but is still long enough to easily and properly connect with the helmet Heads-Up Display (HUD) module easily. The Bike-mounted motorcycle interface module will be powered using the motorcycle’s existing battery to ensure the longest battery life possible.
2.4.2.1 HARDWARE REQUIREMENTS
● The Bike-Mounted module shall be mounted onto the back of the motorcycles, in
between the seat and brakelights. ● The Bike-Mounted module shall be able to interpret motorcycle signals ● The Bike-Mounted module shall be able to detect when the turning signal is
activated on the motorcycle ● The Bike-Mounted module shall be able to interface with the Rear-Mounted
module’s proximity sensors to receive ranging data ● The Bike-Mounted module shall be able to wirelessly communicate with the
helmet module to send proximity and awareness data ● The Bike-Mounted module shall be able to wirelessly communicate to up to 50
feet away ● The Bike-Mounted module shall draw power from the motorcycle
2.4.2.2 SOFTWARE REQUIREMENTS
● The Bike-Mounted module shall include functions to activate proximity sensors
and receive ranging data ● The Bike-Mounted module shall be able to consolidate ranging data from all
sensors to provide an accurate distance reading ● The Bike-Mounted module shall implement processes to structure and send data
over wireless communication ● The Bike-Mounted module shall be able to convert ranging data into the
appropriate units of measurement

11
2.4.3 REAR-MOUNTED MODULE
The Rear-Mounted proximity detection module will consist of 8 proximity sensors, mounted on the rear of the motorcycle, to gauge a wide field behind the motorcycle. If the rider is signaling to merge, but an object is within 20 feet of the bike, an alert will be sent to the helmet Heads-Up Display (HUD) module. The Rear-Mounted proximity detection module will be connect directly to, and powered by extension of Bike-Mounted module. It is our goal to implement high tech sensors that will work in any weather to ensure rider safety.
The proximity sensors will have very little delay in between distance readings to ensure that the most up-to-date information is available to the user. The proximity sensors that are available for this project are well enough advanced that measurement time should be close to instantaneous. The datasheets for the proximity sensors considered coupled with testing done by the Smart Helmet team ensure that the proximity sensors will issue no delay on the system’s performance. The unit conversion from the default units that the proximity sensors records into the units that the Smart Helmet team needs is just a simple, quick arithmetic conversion that is handled by the Arduino with high level programming language on the front-facing module. Overall, this relatively low processing time by the proximity sensors allow leeway for the Arduino to transmit the data to the helmet HUD module via Bluetooth. Because the Rear-Mounted module is essentially just all of the proximity sensors in a daisy-chain configuration, there are no applicable software requirements.
2.4.3.1 HARDWARE REQUIREMENTS
● The Rear-Mounted module shall be positioned on the rear end of the motorcycle ● The Rear-Mounted module shall contain proximity sensors in a daisy-chain series ● The Rear-Mounted module shall be able to collect ranging data from all proximity
sensors ● The Rear-Mounted module shall communicate with the Bike-Mounted module
and transmit ranging data to it ● The Rear-Mounted module shall receive power from the Bike-Mounted module ● The Rear-Mounted module shall be able to detect an automobile within 20 feet of
the motorcycle ● The Rear-Mounted module shall enforce minimal delay between proximity sensor
readings

12
2.4.4 HEADS-UP DISPLAY MODULE
The Helmet Heads-Up Display (HUD) module will be located in the helmet of the user. It will listen for information from Bike-Mounted module wirelessly, and display bike information to rider via a Heads-Up Display (HUD). The module will also alert the rider, visually and audibly, if an object is in a critical proximity to the bike. It will be powered by a 4.2V rechargeable battery pack, which will also be accessible by the user incase it needs a replacement. Solar panels will also be installed onto the helmet in order to extend battery life during the daytime. A minimum battery life of 2 hours is available, though it is expected that the battery should last quite a bit longer on a full charge, especially on a bright day.
2.4.4.1 HARDWARE REQUIREMENTS
● The HUD module shall be mounted on the rider’s helmet ● The HUD module shall implement a wireless communication technology to receive
data from the Bike-Mounted module ● The HUD module shall contain a visual display to display vital information to the
rider ● The HUD module shall implement an audio device that will alert the rider of any
dangerous distancing conditions ● The HUD module shall be enclosed in order to prevent damage from
environmental conditions ● The HUD module shall be powered via solar charging and by rechargeable battery
2.4.4.2 SOFTWARE REQUIREMENTS
● The HUD module shall implement functions to control the visual display to show
relevant data ● The HUD module shall use methodologies for receiving wireless data ● The HUD module shall be able to consolidate ranging data to provide an accurate
reading ● The HUD module shall be able to detect when the device is first powered on to
display a splash screen ● The HUD module shall be able to display a symbolic representation of the distance
to the visual display
2.5 HOUSE OF QUALITY ANALYSIS
The design is planned to be very power efficient, with at least 70% efficiency, in order to gain the longest use from a single charge, and utilize a small battery. Utilizing microcontroller-programmed IC’s as the source of computing power should deliver the

13
power efficiency needed, as well as keeping power usage low, though they are slightly costly. Low power consumption can be improved on by using low power modes when necessary, only turning one components as they are needed, and by using a HUD that can still be visible in daylight while still using a low brightness.
A decently high resolution of the screen is crucial to the HUD so the user can see the information despite the screen being very close to the user’s eyes. This, however, will possibly be the most expensive component of the project, and will take a lot of time to find a company that can produce it in a reasonable size and cost. Having all other components in a small size will be very easily achievable since most components will be comprised of very small parts (resistors, capacitors, ICs, etc.), and can be spread out if necessary. The house of quality can be seen in Figure 2.
FIGURE 2: HOUSE OF QUALITY ANALYSIS
Sound quality with a high amplitude is something that needs attention, though high quality is not necessary. The user will only need to hear a clear tone, triggered by the Rear-Mounted proximity detection module. Amplitude of the sound will be more important than quality, and a worthy tradeoff needs to be found between amplitude and power use. The user will need to clearly hear the sound among regular daily traffic. A

14
power amplifier may be necessary to boost the amplitude, but if an amp is needed, there will be a big toll on power consumption, and it may need to be located on the bike itself instead of the helmet.
Sensor accuracy for the proximity sensor is also very crucial. The user will need to know whether or not the road around them is clear. An accurate and long range sensor, however, is expensive, power consuming, and sometimes larger. A worthy trade-off will need to be found between sensor accuracy and price, with accuracy being at least 90% of objects in range. The sensor will also need to use less than 12V of power, as the motorcycle battery does not exceed that.
The goal of the whole project is to keep cost below $600 by researching and selecting exactly the right parts to meet our standards, while buying from the cheapest manufacturers. It was also use less than 5V for average voltage needs in the helmet Heads-Up Display (HUD) module, and be lightweight enough to not over encumber the user, weighing less than 10 lbs. between the helmet and bike. Implementation time, that is, the time is will take to add the Smart Helmet system to a bike, is planned to be no more than 3 weeks.

15
3 RESEARCH RELATED TO PROJECT DEFINITION
The following subsections contain all research used to aid in the design of the Smart Helmet and part selection for the Smart Helmet. These subsections contain existing similar products, research on technologies relevant to the Smart Helmet, part analysis, part selection, and summary of selected parts. All of the research topics below influenced the design of the Smart Helmet in some way or another.
3.1 EXISTING SIMILAR PROJECTS AND PRODUCTS
The following sections represent projects that are related to the Smart Helmet project definition, providing analysis on who began the project, how well it was funded, how well consumers liked it, and if or how it may have failed. By researching companies who have attempted similar projects, we hope to improve on them, learn from their mistakes, and succeed where they have failed.
3.1.1 SKULLY AR-1 AUGMENTED REALITY HELMET
Skully Helmets Inc. was founded in Silicon Valley in 2013, by Marcus Weller, an Industrial Psychologist, along with his brother, Mitchell Weller, a Director in human resources for the U.S. Army. They sought to brand themselves as pioneers in Heads-Up Display (HUD) technology solutions, with a focus of integrating their technology into the head protection industry.
FIGURE 3: SKULLY AR-1 TECHNICAL CONCEPT ART (CREDIT: SKULLY SYSTEMS 2014)

16
In October 2013, they unveiled their augmented reality helmet, The Skully AR-1, at the worldwide DEMO conference, and immediate impressions were overwhelmingly positive. Concept art of the helmet with technical specifications can be seen if Figure 3. The helmet design was lightweight and aerodynamic, featuring an Ultra wide angle rearview camera, an anti-fog, anti-scratch, anti-glare visor, as well as Bluetooth, GPS, and internet connectivity via smartphone. The helmet was also DOT/ECE certified. On top of these features, Skully added on their own unique, patented technology:
● Skully Synapse™: An intelligent Heads-Up Display (HUD) which displays GPS
data, proximity sensor data, and a live view of the helmet-mounted rearview camera.
● Skully Operating System: Skully OS allowed for users to make phone calls, play
music, and enter GPS locations, all via voice command. Skully OS was planned to be compatible with Android and iPhone.
In August 2014, Skully Helmets Inc. began to take preorders for their helmet, using a crowdfunding campaign, raising $2.4 million. Major companies, including Intel, decided to invest as well, bringing total funding to $11 million. In addition to funding and investments, the asking price for the helmet was $1,500. Despite a high cost, over 3,000 people pre-ordered the helmet, but unfortunately, due to unknown problems, which caused delays in production, no more than 20-100 units were ever shipped.
In July 2016, Marcus Weller was forcibly removed as CEO after investors disagreed with an LeSports deal he brought to the table, and was replaced by Martin Fitcher. Skully Helmets Inc. shut down in the same month and is expected to declare bankruptcy, despite Intel trying to negotiate a funding round to keep it going. A lawsuit arose after the shutdown, accusing the founders of using the funding for personal use.
3.1.2 NUVIZ MOTORCYCLE HEADS-UP DISPLAY
In 2013, NUVIZ was created as a joint project between HOLOEYE Systems, and APX Labs. HOLOEYE has a focus on designing customized modulated Liquid Crystal on Silicon (LCOS) micro displays, where high brightness, high contrast, and a decently high resolution were required. APX has a focus on software and mobile device development. Holoeye was in charge of the hardware for NUVIZ, while APX handled all software necessities. The goal of NUVIZ was to create a retrofittable head-up display that can attach to any full-face or modular helmet, and together, they created the NUVIZ Ride: HUD.
The NUVIZ Ride:HUD attaches to a helmet using a high-strength adhesive pad. It is equipped with an LCOS display, that projects upwards onto a transparent combiner,

17
located just outside the helmet visor. Projecting onto a clear surface for the display allows the user to see the HUD while also not losing sight of the road ahead. The focal length of the projection was adjusted to 30ft, so the user would not need to readjust their vision when looking between the HUD and the road. A concept rendering of the HUD can be seen in Figure 4.
FIGURE 4: NUVIZ RIDE:HUD CONCEPT RENDERING (CREDIT: NUVIZ 2013)
The HUD allows the user to use GPS navigation, record video with a Bike-Mounted 8MP camera, view telemetry data, make phone calls, listen to music, and much more. All data is generated via a smartphone using Bluetooth, with a custom Ride:CLOUD app, for android and iPhone. A wireless controller is used as well, that is designed to be mounted to the handlebar of the bike, to control on-screen menus. The controller was designed specifically with the user wearing gloves in mind. Buttons were made large enough to be used while wearing gloves, but the entire controller was still small enough as to not obstruct the rider’s ability to steer.
The internal computer is powered by a quad-core 1.2 GHz ARM Processor, with 8GB flash memory. The ARM processor provides a lot of computing power, and is very compact. It also features a motion sensor, altimeter, temperature sensor, Wi-Fi, and Bluetooth 4.0.

18
The battery is designed to be replaceable, last at least 4 hours from a full charge, and can be charged using the bike’s existing 12V battery power supply.
In November 2013, after NUVIZ had all their design ideas in place, they began a crowdfunding campaign, raising $200,000 in order to begin building final designs. Upon receiving the funding and working on final designs, they ran into too many issues in created what they originally promised. Major delays occurred, and all of the crowdsourced funding they received was refunded to the backers. As of September 2016, NUVIZ is still working on their final product, but no release date or final products are in sight.
3.1.3 BMW MOTORRAD VISION HEADS-UP DISPLAY
BMW’s motorcycle division, BMW Motorrad, has been hard at work on their own Heads-Up Display for motorcycle helmets, though it is still very early in development. They presented two prototype designs at CES 2016, with big responses from the press, despite very few given specifications.
Their design features a “mini-computer”, integrated speakers, and a glass display over the right-eye of the user. The HUD will be paired to the motorcycle so that information such as tire pressures, oil level, fuel level, speed, gear position, and speed limit can be displayed on the interface. Menus will be controlled wirelessly via a multi-controller, fitted on the handlebars.
A camera is also integrated into the rear of the helmet, allowing the user to see behind them. This can effectively make mirrors obsolete and allow for safer and more aerodynamic bike designs. BMW hopes to bring the helmet to market within the next couple of years. A concept rendering of the Heads-Up Display can be seen in Figure 5.
FIGURE 5: BMW MOTTORAD HEADS-UP DISPLAY CONCEPT RENDERING (CREDIT: BMW 2015)

19
3.1.4 BIKEHUD BY BIKESYSTEMS
BikeHUD by BIKESYSTEMS was founded in 2010 by Dave Vout, with the idea of safety in mind, never wanting the driver to take their eyes off the road. In 2012, the first prototypes were created, and in May 2013, the final design was ready for market. BIKEHUD was released in November 2013 at the UK Bike Show, with shipping early January 2014, for $485, or $549 when optioned up with the GPS navigation kit and speed camera warning system.
The design featured a modular design, that can integrate into any existing helmet, bike, and sound system, and displays key motorcycle data, GPS, audio, rear vision, and proximity safety alerts. The way this information is gathered however, is unique from other designs. BIKEHUD has its own GPS, but takes engine tachometer readings from a sensor coiled around one of the spark plugs, and splices into the bike's wiring to get a hold of indicator signals and neutral light. The system is powered from the bike itself.
The helmet has a monocle attachment, a near eyes display inside of helmet, which uses “infinity focus” so the user won't have to refocus vision between display and road. This display is wired out of the rear of the helmet into an HDMI port in the BikeHUD ECU, located on the bike. The display only shows up to 3 pieces of information a time, and changes based on turning on an indicator, riding past a speed camera, or if the driver is low on fuel.
On the down side, the system has a few problems. The monocle itself is not transparent, and so can feel intrusive, or block too much of the driver’s vision, and needs to be placed perfectly in order for the driver to see it correctly. Resolution and brightness are also very poor. The wiring from the helmet to the bike is also too long and can get caught. The port that the wire plugs into is not weatherproof and is prone to water damage, which can make the entire system unusable.
In order to combat some of these negativities, BIKESYSTEMS released the BikeHUD Adventure Gen2 in May 2016, and it is currently the world’s only commercially available heads-up display (HUD) unit for motorcycle helmets. The new design features forward and rear-facing cameras, Bluetooth sound system, a phone answering system with head gestures to answer or deny the call, and GPS data is now pulled from a smartphone app. Along with these additions, they have also upgraded to an HD display, reduced the size by 1/8th, and made the system wireless, with 8 hours of battery life. The helmet also has

20
the option to plug into the bike for additional power while riding. The BikeHUD Adventure can be seen in Figure 6.
FIGURE 6: BIKEHUD ADVENTURE (CREDIT: BIKESYSTEM 2016)
It is clear that it is better to start with a simpler design to get a product off the ground, then build on as the company grows, instead of trying to create everything possible from the start. Starting simple allows a company to quickly produce a working product, that meets expectations, and then build the company name over time to ultimately achieve a perfect product. We strongly take analysis of these companies into consideration when designing our smart helmet, and hope to follow in the footsteps of BIKESYSTEMS in order to be successful.
3.2 TECHNOLOGIES RELEVANT TO PROJECT
The following section discusses the available technologies that were considered when creating our design. Extensive research was conducted on existing technologies to help us to decide which specific components will be included in the Smart Helmet. Not all technologies listed below were included in the final design; all included technologies are outlined in section 3.3. Each subsection covers basic definitions and applications for the types of technologies considered.
3.2.1 PROXIMITY DETECTION
A proximity sensor is defined as a device capable of detecting the presence of nearby objects without the use of physical contact. The technology works by emitting an

21
electromagnetic field and detecting the changes in the return signal. The maximum range of which the sensor can detect an object is referred to as the nominal range, and that distance depends on the type of proximity sensor used. Several types of proximity sensors were considered for our design, each with their own benefits and drawbacks.
3.2.1.1 LASERS
A laser rangefinder uses a laser beam to determine the distance of an object, to which the sensor is pointed at. This is accomplished by measuring the time between when the laser beam is first transmitted towards the target and when the beam is returned. The actual equation that laser rangefinders use to determine distance is derived from the distance traveled formula where d is distance, x is speed, and t is time travelled:
𝑑 = 𝑥𝑡
LiDAR UK expanded on this formula by using the Time of Flight method. This method records the time it takes for a light pulse to travel to a target and back. Since the light photon from the sensor must travel both ways, the distance calculation is divided by two. The measured time is compared against the speed of light and an accurate distance measurement is formed. The calculation is written below:
𝐷𝑖𝑠𝑡𝑎𝑛𝑐𝑒 = (𝑆𝑝𝑒𝑒𝑑 𝑜𝑓 𝐿𝑖𝑔ℎ𝑡 𝑥 𝑇𝑖𝑚𝑒 𝑜𝑓 𝐹𝑙𝑖𝑔ℎ𝑡)/2
Depending on the sensor, the beam can travel anywhere from a few millimeters to several kilometers. Laser sensors fire up to 150,000 pulses per second which allow for extremely precise readings. These laser systems are broken down into four main components: lasers, scanners and optics, photodetector and receiver electronics, and navigation and positioning systems.
Overall, laser sensors offer high accuracy and precision with high maximum recording distance. The drawback in using this sensor for our design is that the transmitted beam is narrow, and not conical, which will only provide feedback at a specified angle from the motorcycle.
3.2.1.2 RADIO WAVES
A radar sensor uses radio waves, transmitted between 50 MHz to 40 GHz, in order to detect objects at a distance. This type of sensor is able to detect airships, water vessels,

22
spacecraft, missiles, motor vehicles, weather formations, and terrain. Coined during World War II, the Radio Detection And Ranging sensor was initially used by the United States Navy. A radar sensor consists of a transmitter and receiver, which transmits and receives electromagnetic waves in the radio domain. Once the return signal is captured, a processor is used to determine the range, angle, or velocity of the radar pulse.
The maximum range of a radar system is limited by the line of sight of the object and the radar sensitivity and power. Radar signal is susceptible to signal noise and interference. These unwanted signals could originate from both internal and external forces. The signal-to-noise ratio is defined as the ratio of the signal power to the noise power within the desired signal. The higher the radar system’s signal-to-noise ratio, the better it is at filtering these unwanted signals. Increased power is generally the trade-off to reduce noise, but certain modulation techniques can be used to reduce noise without using more power.
3.2.1.3 ULTRASOUND WAVES
An ultrasonic transceiver is a proximity sensor that is capable of both, transmitting and receiving ultrasound waves, and converting those waves to electrical signals. Similar to radar and sonar systems, ultrasonic devices are able to evaluate radio and sound waves that have been echoed from a target, in order to detect distance from the sensor, or track moving objects.
There are three different properties that can be evaluated by ultrasonic sensors: time of flight, Doppler shift, and amplitude attenuation. Each of these properties are for different sensing purposes. Time of flight measures distance, Doppler shift measures velocity, and amplitude attenuation measures distance, directionality, or attenuation coefficient.
Since the Smart Helmet will need to be able to measure the distance of foreign objects, an ultrasonic sensor that measures the time of flight seems to be the most applicable. When measuring the time of flight there are two distinct modes of operation: reflection mode and direct measurement mode. In reflection mode, the transmitter and receiver are combined into one unit and the sensor fires out sound waves and measures the time it takes for the waves to hit an object and bounce back. While in direct measurement mode, the receiver and transmitter are two separate units. The receiver is mounted on the foreign object and the sensor calculates how long it takes the wave to go from the transmitter to the receiver. Because it is unrealistic to mount receivers on every obstacle a motorcyclist may encounter, the most realistic type of ultrasonic sensor for this project is a time of flight reflection mode sensor.
Ultrasonic sensors are able to generate high frequency sound waves and interpret the echo which is received back to the system. This type of sensor is typically used for

23
measuring wind speed and direction, tank fluid levels, and speed through air and water. When measuring speed, the ultrasonic sensor uses multiple detectors and calculates the speed from relative distances in the air or water. This type of system typically generates sound waves in the ultrasonic range by converting electrical energy into sound, and then converting the received sound echo back into electrical energy which can then be measured.
The ultrasonic sound waves produced by these sensors are at a frequency that is above what a human ear can hear. The average human ear has a range of 20 Hz to 20 kHz, while most ultrasound sensors produce a vibration anywhere from 40 kHz to 250 kHz. This means that most of the sound emitted from these types of sensors cannot be picked up by the human ear and are thus silent. However, since ultrasonic sensors do rely on sound vibrations it makes them susceptible to background noise disruptions.
Background noise is unavoidable in natural settings and can be a factor in the performance for ultrasonic sensors. In general, background noises lessen as the level of frequency increases. A smaller amount of background noise is received as frequency is increased. By increasing the contrast between the signal and the noise frequency, the noise can be filtered out. And so, ultrasonic sensors that operate at lower frequencies have to account for a great amount of background noise, while sensors operating at a higher frequency can generally deal with less background noise.
The Time of Flight of the sound vibrations is used in determining the distance of an object. Unlike the speed of light, the speed of sound is given as a function of temperature. Other factors that affect the speed of sound are humidity and air pressure. Thus, the sensors must be able to determine the temperature that the sound vibrations are travelling in to receive an accurate reading or they must use some compensation tactic. The speed of sound equation is given below:
𝑣 = 331 𝑚/𝑠 + 0.6 𝑚/𝑠/𝐶 ∗ 𝑇
v is the speed of sound, T is the temperature of the air in Celsius
After an ultrasonic vibration is fired through a sensor and it travels through a medium to reach an object the sound wave must bounce back to the receiver. The size of the object the sound wave is bouncing to and the shape of the object are the two many determinants of how well the sound wave with reflect back. The best case scenario is that the object

24
the sound wave is bouncing to is larger than the entire sound wave, perpendicular to the sound beam, and is a totally flat surface. This will ensure that the majority of the sound wave will bounce directly back to the receiver. Figure 7 shows this best case scenario.
FIGURE 7: SOUND WAVE REFLECTING OFF THE BEST CASE SCENARIO OBJECT
The four main types of surface shapes are flat, parabolic, jagged, and porous. When a sound vibration hits a flat surface at a perpendicular angle it will bounce back larger covering more surface area. If a sound wave bounces off a parabolic sound wave it will bounce back in a straight line, not increasing in size. On a jagged surface, the sound wave will scatter in different directions depending on the angles created by the jagged object. The worst case scenario is a porous surface, or a surface with holes/spaces which allow waves to pass through, when a sound wave hits this type of surface the majority of the wave will pass through and not create a bounce back that will return to the transducer.
In a real world scenario, there are many factors that determine the accuracy and effectiveness of an ultrasonic sensor. However, due to their extremely large range and ability to reject sound vibrations outside of the frequency they are measuring, ultrasonic sensors are a popular choice for measuring the distance of small objects, humans, and vehicles.
3.2.1.4 INFRARED
A passive infrared sensor (PIR sensor) is an electronic sensor that is able to measure the infrared light, ranging from 300 GHz to 430 THz, radiating from objects in the sensor’s field of view. The sensor is able to detect changes in the amount of infrared radiation based on the temperature and surface characteristics of the objects in front of the sensor. When something, like a human or vehicle, moves in front of the sensor, the temperature at the point in the sensor’s field of view will fluctuate accordingly. The sensor will then convert the resulting change in the incoming infrared radiation into a change in the output voltage which signifies a detection state. Infrared is generally used to illuminate dark objects, as in night vision or space observation. Tracking can be used, but Infrared alone is generally poor when it comes to calculating distance.

25
3.2.2 WIRELESS DATA TRANSMISSION
Wireless data communication can be defined as the transfer of information between two or more points that are not connected by an electrical conductor or any physical connection. For our device, diagnostic information along with proximity sensor data must be wirelessly transmitted to the helmet module to be displayed to the user. To accomplish this task of wirelessly transmitting data we had to look at several different technologies that were compatible with our existing design, evaluating the advantages and disadvantages for each.
3.2.2.1 WI-FI
Wi-Fi is a wireless networking technology defined by the IEEE 802.11 standard. It allows for wireless communication via high frequency radio waves in cooperation with other devices to make a wireless local area network (WLAN). This type of communication is widely used by personal computers, cellular devices, video game consoles, and other smart devices. Wi-Fi signal typically has a range of about 20 meters, being affected by hardware properties, physical objects, and other electrical signal producing devices.
Wi-Fi communication operates by using the 2.4 GHz and 5 GHz ISM radio bands, which are radio bands reserved for the use of radio frequency energy for industrial, scientific, and medical purposes. Wi-Fi communication allows for ease of integration and convenience, allowing multiple users to access network resources from any location within range of the access point. Wi-Fi is also a low-power form of communication, allowing for more resources to be distributed elsewhere. Wi-Fi communication, however, is subject to both interference from external sources as well as slow transmission speed.
A Wi-Fi communication network depends on a radio frequency (RF) module to transmit and receive radio signals between several devices. These RF modules are vital in creating an integrated transceiver for cellular wireless operations. By definition, an RF transceiver module incorporates both a transmitter and receiver. Typically, these transceivers are used for a half-duplex system where wireless communication between two devices is provided in both directions, but not simultaneously.
3.2.2.2 BLUETOOTH
Bluetooth technology is another method of networking over high frequency radio waves and is defined by the IEEE 802.15.1 standard. Although it shares the same ISM frequencies as Wi-Fi, it is incompatible and typically has different uses among the devices that use the technology. Bluetooth aims to allow for a low-power wireless connection between two

26
devices. It is used as a technology for devices that need to be energy efficient and typically not demanding on distance.
Devices that utilize Bluetooth are computer and cellular peripherals like wireless keyboards, mice, and headsets, but many other devices utilize the technology. Bluetooth has many versions, but all Bluetooth communication transmits data from one single device to another on the 2.4GHz to 2.485GHz ISM band. The process of how data is transmitted can vary based on the Bluetooth version, which in turn implies that some versions are incompatible with others. Bluetooth 3.0 typically has a maximum range of 20 meters, whereas Bluetooth 4.0 has a maximum range of 60 meters. Both Bluetooth 3.0 and Bluetooth 4.0 are able to transmit data at 25 Mbits/s provided the receiving device is within range with minimal noise and interference.
Bluetooth is considered low-power as it uses maximum power only when it is required, thus preserving battery life and allowing for optimal resource allocation on the device. The later versions of Bluetooth utilize Low Energy (LE) communication, which allows the devices to have extended periods of radio silence while preserving the connection and minimizing energy consumption.
The Bluetooth LE Shield communicates with the main Arduino board through the Application Controller Interface (ACI). The Application Controller Interface is similar to the Serial Peripheral Interface (SPI) specification, which uses a master-slave architecture with a single master for reading and writing data. A visual representation of the ACI interface is shown in Figure 8. Both ACI and SPI exchange clock data through MOSI, MISO, and SCK lines. Because the Bluetooth LE device can receive data at any time, it does not require the Slave Select (SS) line. Instead, the Bluetooth LE Shield has two different input and output lines: REQN and RDYN.
REQN and RDYN represent two active low hand-shake signals for the application controller and BLE device respectively. When the master requests data from the BLE shield, REQN is brought low by the application controller until the device sets RDYN low as well. When requesting data, the master generates the clock and reads out the data. Once the master has completed reading data, REQN will be released and in turn the BLE device will release RDYN, thus restarting the cycle. With this interface, the Bluetooth LE Device will also be able to send data back to the application controller, by setting the RDYN line low. This feature will not be used on this project, and the helmet Bluetooth module will act only as a slave to receive data from the mounted module.

27
FIGURE 8: ACI INTERFACE BETWEEN APPLICATION CONTROLLER AND BLE DEVICE
Unlike Wi-Fi communication, which is access-point, centered, Bluetooth is usually symmetrical between two Bluetooth device endpoints. This symmetry allows for more simple applications between communicating devices, as there is no client configuration required to establish a Bluetooth link. The devices with Bluetooth compatibility are able to connect to each other through short range, ad hoc networks known as piconets. A piconet consists of two or more devices occupying the same physical channel and allows for one master device to interconnect with up to seven active slave devices.
3.2.2.3 ZIGBEE
ZigBee is a non-standardized wireless protocol based off a derivative of Bluetooth defined as IEEE 802.15.4. It attempts to improve on power efficiency and range compared to traditional Bluetooth. We noticed, when comparing ZigBee to Bluetooth Low Energy (BLE), that ZigBee had a longer range and was less susceptible to interference, but also demanded relatively more power.
ZigBee mainly benefits from its concentration on mesh networking by allowing an arbitrary amount of devices to communicate on the network. Although it benefits from Bluetooth’s communication efficiency, it on average used around four times more power when in an actively sending and receiving state. It is best used for devices where the range on signal needs to exceed close-range wireless communication. BLE operates at around
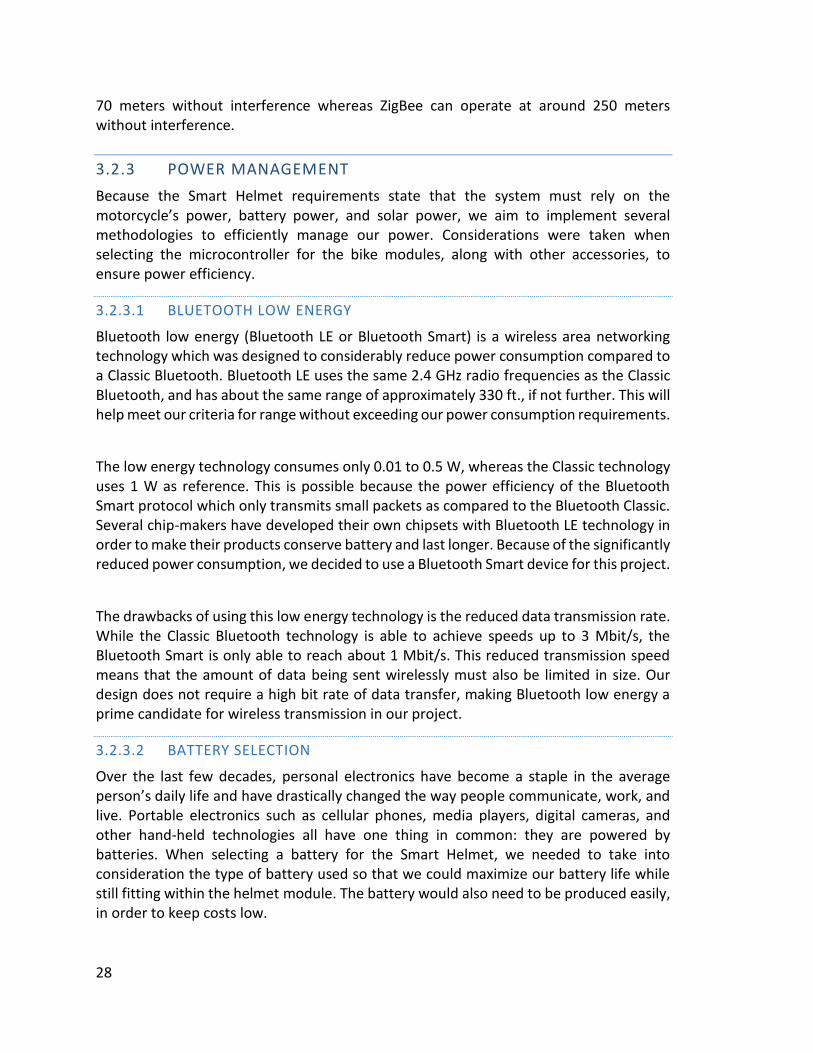
28
70 meters without interference whereas ZigBee can operate at around 250 meters without interference.
3.2.3 POWER MANAGEMENT
Because the Smart Helmet requirements state that the system must rely on the motorcycle’s power, battery power, and solar power, we aim to implement several methodologies to efficiently manage our power. Considerations were taken when selecting the microcontroller for the bike modules, along with other accessories, to ensure power efficiency.
3.2.3.1 BLUETOOTH LOW ENERGY
Bluetooth low energy (Bluetooth LE or Bluetooth Smart) is a wireless area networking technology which was designed to considerably reduce power consumption compared to a Classic Bluetooth. Bluetooth LE uses the same 2.4 GHz radio frequencies as the Classic Bluetooth, and has about the same range of approximately 330 ft., if not further. This will help meet our criteria for range without exceeding our power consumption requirements.
The low energy technology consumes only 0.01 to 0.5 W, whereas the Classic technology uses 1 W as reference. This is possible because the power efficiency of the Bluetooth Smart protocol which only transmits small packets as compared to the Bluetooth Classic. Several chip-makers have developed their own chipsets with Bluetooth LE technology in order to make their products conserve battery and last longer. Because of the significantly reduced power consumption, we decided to use a Bluetooth Smart device for this project.
The drawbacks of using this low energy technology is the reduced data transmission rate. While the Classic Bluetooth technology is able to achieve speeds up to 3 Mbit/s, the Bluetooth Smart is only able to reach about 1 Mbit/s. This reduced transmission speed means that the amount of data being sent wirelessly must also be limited in size. Our design does not require a high bit rate of data transfer, making Bluetooth low energy a prime candidate for wireless transmission in our project.
3.2.3.2 BATTERY SELECTION
Over the last few decades, personal electronics have become a staple in the average person’s daily life and have drastically changed the way people communicate, work, and live. Portable electronics such as cellular phones, media players, digital cameras, and other hand-held technologies all have one thing in common: they are powered by batteries. When selecting a battery for the Smart Helmet, we needed to take into consideration the type of battery used so that we could maximize our battery life while still fitting within the helmet module. The battery would also need to be produced easily, in order to keep costs low.

29
When selecting a battery that is right for our design, we needed to consider three key attributes. First was the energy density of the battery, meaning that the size and weight of the battery must be small enough to fit within the helmet module. The next major consideration was the life cycle of the battery. Because we wanted a rechargeable battery, it was imperative that it could last many recharge cycles without having to be replaced. The last key attribute is the capacity of the battery, or how much charge it could dispense without a charger, or additional power supply present. Because the battery is to be used in conjunction with a solar panel to deliver power, a large maximum capacity is not critical to the design but is desirable. For each battery that was considered for our design, an overview is located below in Table 2.
TABLE 2: BATTERY TYPE COMPARISONS
As shown above in Table 2, each battery that was considered was weighed against different key features and attributes to determine the best battery for the Smart Helmet design. The cells that are highlighted in blue represent the most desirable option for that criteria. The battery types shown in the above table are discussed in greater detail in the following sections. After detailed review, the Li-Ion battery is the most reliable solution for the Smart Helmet design.
3.2.3.2.1 ALKALINE
Alkaline batteries are very commonly used throughout the United States, accounting for over 80% of manufactured batteries. This type of battery depends upon the reaction between zinc and manganese oxide to properly function. Because this type of battery is a primary cell battery, it is designed to be used once and then discarded. Unlike a rechargeable battery, once the electrochemical reaction has taken place within the alkaline battery, the chemicals that were used are gone forever. Attempts to recharge this type of battery could lead to a rupture and therefore a leakage of hazardous liquids.

30
Although they are not rechargeable, alkaline batteries have a low self-discharge rate and are relatively inexpensive when compared to other batteries. This type of battery was initially considered for the Smart Helmet design because of the ease-of-use and low cost. However, because it is not rechargeable, the alkaline battery was not considered for the final design.
3.2.3.2.2 LITHIUM-ION
For the helmet module, a rechargeable Lithium-Ion (Li-Ion) battery will be used in order to power the device whenever the solar panel does not receive enough light. This type of battery contains lithium ions which move from the negative electrode to the positive electrode during discharge and back again when charging. Li-Ion batteries use a lithium compound as one electrode material, whereas a non-rechargeable lithium battery uses a metallic lithium. They are also capable of producing more power per ounce than most non-lithium counterparts. As a result, lithium-ion batteries tend to be lighter.
The decision to use a rechargeable battery stems from the requirement that the battery will have to be powered via solar panel. Li-Ion batteries are capable of recharging without having to be fully drained first, which is preferable for our design. The rechargeable battery must also be able to continue to power the helmet module for an extended period of time, should the solar panel stop receiving adequate sunlight.
The most apparent downside to using a Lithium-ion battery is the quick degradation experienced by the battery. This type of battery will typically last two to three years, regardless if it is being actively used or not. Because this battery will be used with the helmet module, it will be subject to possible high temperatures outside. It is recommended to keep the temperature of these batteries below 85°F, which is not always possible while depending on the rider’s location. At extremely high temperatures, the Li-Ion battery may even explode due to immense heat expansion, which is a great safety concern. Another downside of using this type of battery is that the initial cost is typically higher than other types of rechargeable batteries. But despite higher costs, overall battery life will be cheaper than alternatives due to easy recharging capabilities.
3.2.3.2.3 SEALED LEAD ACID
The rechargeable sealed lead acid (SLA) battery was another choice for the Smart Helmet design. This type of battery is typically less expensive than other rechargeable batteries, and also has a relatively low self-discharge rate. Another appeal of this type of battery is that it can be installed and mounted in any orientation due to the construction of the battery; it is completely sealed to avoid any leakage. This type of battery is typically used for larger portable devices, where large amounts of storage is needed at a lower cost. Some applications for this battery include powering motor vehicles, wind and solar power management systems, and as uninterruptible power supplies for both indoor and outdoor use.

31
Although this type of battery is an excellent solution for many types of power management systems, it is not ideal for the Smart Helmet design. The SLA battery has a low energy density and short life-cycle, when compared to other rechargeable batteries. Simply put, this type of battery would not fit well within the helmet module, and would not provide adequate charging capability.
3.2.3.2.4 NICKEL-METAL HYDRIDE
A nickel-metal hydride (NiMH) battery is a type of rechargeable battery that uses nickel oxide hydroxide and a hydrogen-absorbing alloy to function. Unlike the Nickel-Cadmium (NiCd) battery which uses cadmium instead of the hydrogen-absorbing alloy, the NiMH battery has a higher energy density and are generally more cost effective. Due to their low internal resistance, the NiMH battery is useful for many high-current drain applications. The NiMH battery was developed as an alternative to the rechargeable alkaline batteries, which failed due to a short life-cycle and fast degradation.
The biggest limitation when using the NiMH battery is the high discharge rate. When recharged repeatedly, the performance of this type of battery begins to deteriorate after just a few hundred cycles. These types of batteries also require a more controlled charging setup due to the heat that is generated during charging. Additionally, the NiMH battery must be fully discharged periodically to stop the growth of crystalline formations which could damage the battery. Because of the high maintenance that this battery requires, it is not a suitable choice for the final Smart Helmet design.
3.2.3.3 BATTERY CHARGER
Battery chargers work by pushing current through a battery. The battery stores a portion of that current passing through, and over time, this charges the battery. Chargers either use a constant current, or constant voltage to charge a battery. In order to help ensure batteries don’t severely overcharge, the current of the charger tends to only be about 5% of the batteries maximum rated current output.
In the case of lithium batteries, charging involves shunting lithium ions, which are lithium atoms that are missing an electron, back and forth, from an electrode with a lot of ions, to one with few. Ions hold a positive charge, due to the lack of an electron, and they easily move to the electrode with fewer ions. As the ion start to accumulate at the electrode, it becomes more difficult to add additional ions. Because of this, later stages of charging take more time than earlier stages.
32
Overcharging is far more dangerous, and harmful to the battery than undercharging. Once a battery is fully charged, the extra energy has very limited space to go. As a result, the battery will heat up, which can cause it to rupture, or, in extreme cases, explode. To prevent this, some chargers automatically turn off after a preset time, regardless of whether or not the battery is charged. Overcharging can still occur with these kinds of chargers, but is less severe. More intelligent chargers have a sensor to gauge the amount of charge stored in a battery by measuring changes in battery voltage over time, and cell temperature. When the charger knows the battery is fully charged, it will automatically reduce, or stop current to the battery to stop overcharging from happening.
3.2.3.3.1 LITHIUM-ION CHARGING ALGORITHM
The preferred charging algorithm for the Lithium-Ion battery is a Constant Current-Constant Voltage algorithm that can be broken up into four different stages: trickle charge, fast charge, constant voltage charge, and charge termination. Using this charging algorithm, a deeply depleted Li-Ion battery will be fully charged in approximately 165 minutes, depending on the battery charger being used.
If the Li-Ion cell voltage is below ~2.8V, then the trickle charge phase is initiated. This first stage is meant to charge very depleted cells with a constant current of 0.1C maximum. The charger may have a timer to automatically terminate the charge if the minimum voltage threshold is not met within a specified amount of time. Once the cell voltage has risen above the minimum threshold, the fast charging phase starts. Typically, in linear chargers, the charging current is ramped up as the cell voltage increases in order to reduce heat dissipation in the pass element. The maximum charge current will be reached during this phase and most of the battery voltage will be replenished as well. Once the cell voltage reaches ~4.2V, fast charging ends and constant voltage mode begins. During this phase, the applied charge current is reduced towards zero while the battery voltage remains constant. The final termination stage can be triggered by two different methods, depending on the type of charger. One method is if the charge current drops below 0.07C. The other method is using a timer that starts once the voltage charge phase begins and stops the charging a few hours after. Both of these methods result in the termination of charging to the Li-Ion battery.
3.2.4 VISUAL DISPLAY
A visual display can be defined as a device with a screen, or monitor, that displays characters or graphics that represent meaningful data. For the Smart Helmet, a visual display will be immediately visible to the rider which will display proximity information about the cars around the motorcycle as well as motorcycle diagnostics. Several different types of visual displays were considered, each having their own benefits and downsides.

33
Ultimately, the display we chose had to be small enough to not obscure any of the rider’s vision of the road and other cars while still big enough to display all the pertinent details. Ideally, the visual display will be mounted so that it is in the rider’s peripheral vision as to not create a safety hazard while operating the motorcycle.
3.2.4.1 LCD DISPLAY
A liquid-crystal display (LCD) is a display that uses light-modulating properties of liquid crystals; a matter which has properties between those of conventional liquids and those of crystals. The pixel density of the display is what determines how much content can be shown, from a simple 7-segment display to a more complex image or graphic.
Typically used for computer monitors, televisions, digital cameras, and other portable devices, the LCD has almost completely replaced the cathode ray tube (CRT) display in almost all applications. Rather than using individual light emitting components, such as an LED display, the LCD display relies solely on a backlight as its light source. This may cause problems if the display is viewed in direct sunlight, but can be remedied by the display having a matte-based surface which features a light-scattering anti-reflection layer to ease viewing.
3.2.4.2 LED DISPLAY
A light-emitting diode (LED) display can be defined simply as an array of LEDs arranged as individual pixels to make up a video display. An LED display can provide improved response time, improved contrast, better viewing angles, and a wider color range than a traditional LCD display. The LEDs that make up the display can either be a single color or multi-colored depending on the needs of the system and preference of the designer. Because of the brightness of these diodes, LED displays are the ideal choice for eye-catching advertisements and large scale animated billboards, among many other applications. Another benefit of these light-emitting diodes is that they have a very long lifetime, often lasting years without any maintenance.
For the Smart Helmet, an LED display would be used in lieu of a traditional LCD screen. These LEDs would be used to indicate distance between the rider and an automobile in the bike’s blind spot. This approach was considered due to the ease of installation and usage, but it cannot be used for displaying any diagnostic information from the motorcycle.
34
3.2.4.3 TRANSPARENT OLED DISPLAY
An organic light-emitting diode (OLED) display is very similar to that of an LED display in that they both are digital displays capable of showing detailed, in-depth colors and images. The defining difference between the OLED display and the LED display is that the emissive electroluminescent layer is a film of organic compound that emits light in response to electrical current. What this basically means is that instead of using n-type and p-type semiconductor layers, like an LED display, the OLED display uses organic molecules to produce its electrons and holes. By having thousands of red, green, and blue colored OLEDs in tandem, this type of display is able to produce complex high-resolution picture.
Transparent OLED displays are a relatively new technology that allows for dynamic or interactive information to be displayed on a transparent surface glass. This type of display allows users to see what is shown on the glass video screen while still being able to see through it. Each pixel in a transparent OLED display is made up of 4 sub-pixels: red, green, blue, and a clear section. Color is then created by the combination of the colored pixels and the clear section creates the transparency. Transparent OLED displays are able to achieve greater than 100% NTSC color space, which is a measure of the number of colors that the display is capable of showing. This advanced color performance, along with the brightness characteristics of the display, create a very vibrant viewing experience than that of a LCD or regular LED display.
The biggest technical problem for the OLED technology is the limited lifetime of the organic materials. Degradation of these displays occurs due to the buildup of nonradiative recombination centers and luminescence quenchers in the emissive zone. Additionally, OLED displays are very sensitive to water and the organic materials can be instantly damaged if they come in contact. The other major drawback of this technology for our project is the unavailability of a display that meets our needs. This type of display is no longer being produced in a size that would be suitable for a helmet display, and therefore cannot be considered in the final design.
3.2.4.4 LCOS
The liquid crystal on silicon (LCOS) micro display uses a reflective active-matrix liquid-crystal layer situated on top of a silicon backplane to deliver a sharp and smooth projection. This type of display was originally developed for projection televisions but now sees applications in optical communications networks, high-resolution light structuring, and optical pulse shaping. The LCOS display uses a complementary metal-oxide semiconductor (CMOS) chip to control the voltage on the reflective aluminum electrodes beneath the chip’s surface, each controlling a single pixel. The high aperture ratio and small pixel size that this technology delivers allows for a crisp picture quality and excellent contrast, conveying a richer gray scale performance and more natural image.

35
Although this type of display can be used for large scale projections, the LCOS technology is also found in pico-projectors, which bring image projection to a handheld device. In terms of a motorcycle helmet heads-up display, this type of technology can be used to project a small virtual image from within the helmet to a transparent or partially reflective material located directly in front of the rider. This reflected image will appear to the viewer as a virtual image that does not obstruct their view of the environment in front of them.
When used in direct sunlight, it may be very difficult to identify projected text and graphics without some type of shading or cover for the image. This would prove a major problem for the design, as the rider would be viewing the projected text and images during the day. The other major drawback of this technology for the Smart Helmet would be the extensive modifications needed to support a pico-projector from within the helmet. The helmet would have to be altered to allow for the space required to mount the projector internally, while still meeting safety standards.
3.2.5 MOTORCYCLE INTERFACE
When considering how to interface with a motorcycle a very large concern arises. Just like full sized cars and other automobiles, interfaces with these vehicles can vary based on type, age, and the company that produced it. For the Smart Helmet we researched a few different options for how to interface with the widest range of the motorcycles so that as many people as possible can use it.
3.2.5.1 ON-BOARD-DIAGNISTICS (OBD)
Most modern vehicles offer a digital serial communication port for external devices to interface with the information that the vehicle's computer is recording. Modern vehicles offer this to some degree, but motorcycles typically condense this connection to a USB connection. Instead of using On-Board-Diagnostics (OBD), most motorcycles use a similar protocol called Controller Area Network (CAN bus) to allow communication between internal and internal digital devices on the motorcycle. The conflicting issue with this, however, is that motorcycles did not widely start using this practice until the late 2000s and early 2010s. Because of this, a significant portion of motorcycles would be incompatible with this type of diagnostics connection. Figure 9 below shows the pin layout for the CAN bus protocol.

36
FIGURE 9: OBD-II WITH CAN SUPPORT PIN DIAGRAM
3.2.5.2 DASH LED STATUS INTERCEPTION
With the ever-evolving technology of communicating between vehicles and external devices, there has been a wide branch of practices that now exist in which they all are not compatible with each other. Instead, an option exists where an external device could just read the status of an LED (ex. On-dash turn signal state) to read simple diagnostic information about the vehicle's state. Instead of binding to any kind of protocol, an interception could be connected between the motorcycle and the dash LEDs to read the information. Although more of a brute-force approach, this method is universal for all bikes that have any variety, or even existence, of communication ports.
This would work simply as a pin extender piece for the connections leading to the dash LEDs. Even motorcycles dating back decades use a 4-16 pin connection between the motorcycle and the dash. Although some bikes utilize unique connections, most bikes new and old share the same type of connector. This makes designing a universal system of interfacing with the motorcycle possible by merely designing adapters for the few variations in the connections.
The example to use is the motorcycle that would be used for the demo of the Smart Helmet. A Honda Supersport 1976 CB400F will be used to test the universal abilities of this type of connection. The CB400F has two separate positive power lines leading to the dash with a male-to-female adapter connecting two parts of the wire. The interface would use an adapter piece that extends the male-to-female to extract the line to test for power of the LED.

37
3.3 STRATEGIC COMPONENTS AND PART SELECTIONS
In order to design and implement the Smart Helmet within budget and time constraints, extensive research went into the advantages and disadvantages of each individual component for the system. The decision to include a component in the final design was decided based on several factors that weighed cost, functionality, efficiency, and practicality.
3.3.1 PROXIMITY DETECTION
Proximity sensors will be mounted on the back of the motorcycle and will be used to detect a wide field behind the rider. Budget is ultimately the biggest constraint when choosing the type of proximity sensor. Since our project budget is relatively small compared to existing products it limits the options available for different types of proximity sensors. The initial budget of $75 for the proximity sensors must be shared between two sensors since there will be one sensor mounted on each rear side of the motorcycle. The three main types of proximity sensors that were considered are sonar, LIDAR, and infrared sensors. The three types of proximity sensors will be judged based on: cost, range, beam width, size and weight, as well as ability to detect smaller objects, low power consumption, ease of use, and detection ability at high speeds.
3.3.1.1 SONAR
Ultrasonic sensors use high frequency sound waves to detect and localize objects. These sensors record the time of flight of the sound waves transmitted to and from nearby objects. From this time of flight, they are able to calculate the distance and output a range reading.
When selecting an ultrasonic sensor, it is important to consider the frequency of the sensors. A lower frequency sensor will give the sensor a longer range. However, this lowers the measurement resolution and makes the sensor more susceptible to background noise interference. On the contrast, a higher frequency sensor will give you a smaller range but will have greater measurement resolution and will be less susceptible to background noise.
Sonar sensors specifically must also factor in temperature, humidity, and air pressure into their measurements. These factors impact the speed of sound which is a reading that the
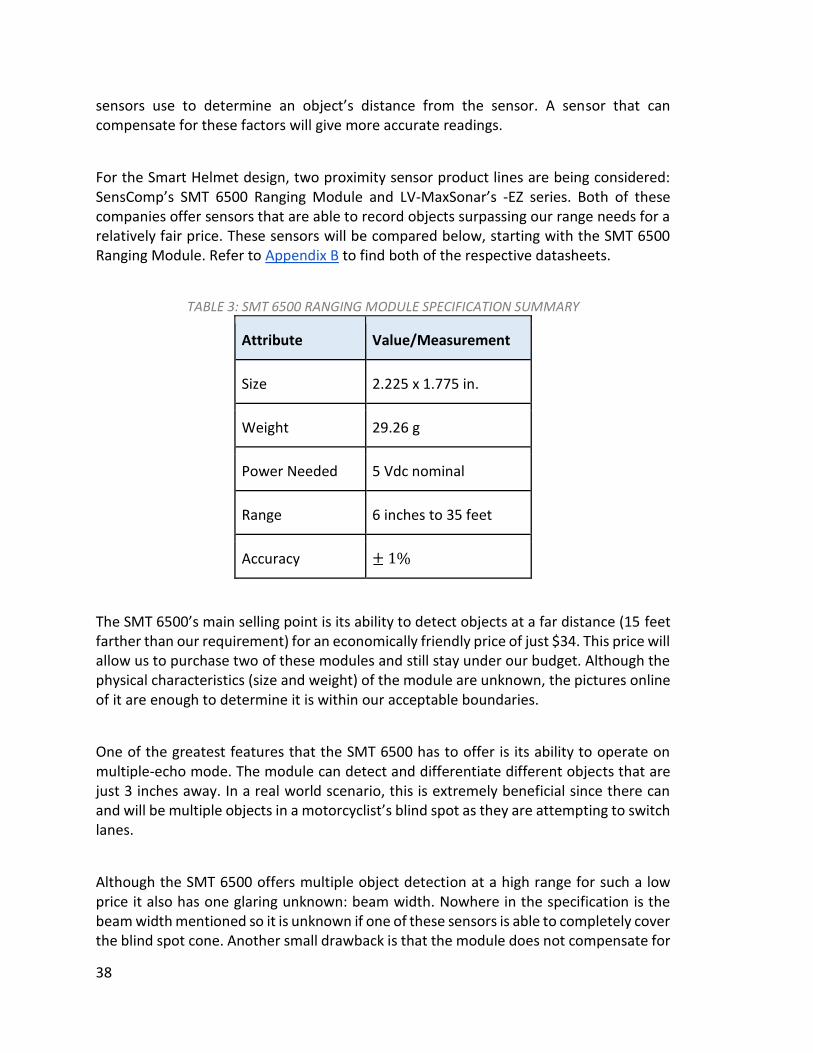
38
sensors use to determine an object’s distance from the sensor. A sensor that can compensate for these factors will give more accurate readings.
For the Smart Helmet design, two proximity sensor product lines are being considered: SensComp’s SMT 6500 Ranging Module and LV-MaxSonar’s -EZ series. Both of these companies offer sensors that are able to record objects surpassing our range needs for a relatively fair price. These sensors will be compared below, starting with the SMT 6500 Ranging Module. Refer to Appendix B to find both of the respective datasheets.
TABLE 3: SMT 6500 RANGING MODULE SPECIFICATION SUMMARY
Attribute Value/Measurement
Size 2.225 x 1.775 in.
Weight 29.26 g
Power Needed 5 Vdc nominal
Range 6 inches to 35 feet
Accuracy ± 1%
The SMT 6500’s main selling point is its ability to detect objects at a far distance (15 feet farther than our requirement) for an economically friendly price of just $34. This price will allow us to purchase two of these modules and still stay under our budget. Although the physical characteristics (size and weight) of the module are unknown, the pictures online of it are enough to determine it is within our acceptable boundaries.
One of the greatest features that the SMT 6500 has to offer is its ability to operate on multiple-echo mode. The module can detect and differentiate different objects that are just 3 inches away. In a real world scenario, this is extremely beneficial since there can and will be multiple objects in a motorcyclist’s blind spot as they are attempting to switch lanes.
Although the SMT 6500 offers multiple object detection at a high range for such a low price it also has one glaring unknown: beam width. Nowhere in the specification is the beam width mentioned so it is unknown if one of these sensors is able to completely cover the blind spot cone. Another small drawback is that the module does not compensate for

39
temperature differences. However, it is to be assumed that this lack of compensation is present in the accuracy reading of the module which is a fantastic ±1%. Overall the SMT 6500 appears to be a great option for this project, however, more testing is required to ensure that all blind spots are fully covered.
The LV-MaxSonar -EZ Series is the other ultrasonic sensor line we are considering. The -EZ series specifications fit well with our needs at a fair price of just $30. There are five different models in this series, all of which are similar in specifications with the main difference being sensitivity. The five models are the: MB1000, MB1010, MB1020, MB1030, and the MB1040. Below is Table 4 containing a general specification summary.
TABLE 4: LV-MAXSONAR -EZ SERIES SPECIFICATION SUMMARY
Attribute Value/Measurement
Size (LxWxH) 15.52 x 22.36 x 20.00 mm (0.61 x 0.88 x 0.79
in.)
Weight 4.23 g
Power Needed 2.5 to 5.5 V
Range 0 to 254 in. (6.45 meters)
Beam diameter at distances Dependent on model and size of object
The -EZ series offers a high quality line of sensors that fulfill our range requirement of 20 feet. Size, weight, and power consumption are also all within our limits. The -EZ series provide options when choosing sensitivity levels. The smaller the model number the wider the beam and higher sensitivity the model has. The larger the model the narrower the beam and better noise tolerance the model has. Having the option of choosing the beam pattern while not sacrificing any range performance is one of the greatest traits this series has. Below is Figure 10 showing the beam pattern of the MB1010, one of the more sensitive models.

40
Figure 10 shows that this model will be able to meet our expectations. Most of the objects a motorcyclist will be fearing in their blind spots will be 11 inches or wider in size. The beam pattern chart above shows that the MB1010 will be able to detect them anywhere from 1ft to 20ft away. Overall the -EZ series is a great option for the Smart Helmet design simply because it passes all of our needs while still giving options.
FIGURE 10: LZ-MAXSONAR -EZ1 BEAM PATTERN
We went ahead and purchased one of each of the sonar sensors that we were considering and tested them to see if they met our needs in a real world setting. Both of the sensors had some unknowns associated with them that needed to be answered and could only be answered through extensive testing. The SMT 6500’s biggest unknown is the beam pattern. If it is tested to have a wide enough beam pattern for our needs than it can stand out as a favorite because of its ability to detect multiple objects. The -EZ line has a clear beam pattern for each model which will still need to be verified in a lab setting to ensure that it does cover the entirety of a motorcyclist’s blind spot. The -EZ series also must be tested for its ability to handle multiple objects at once.
Both of the options must also be tested for noise rejection. If these sonar sensors are unable to reject unwanted noise, they will trigger unnecessary readings, which will mess with the project as a whole. Finally, both of these sensors will need to be tested at high speeds. It is clear that these sensors will be able to operate when the bike is idle, but it is unknown if when driving the sound waves will be able to bounce back in time and if high speeds produce extra unnecessary background noise that is not rejected.

41
For the initial round of testing, the Smart Helmet team wanted to prove which module is better at detecting different sized objects at different distances and different angles. We made three imitation objects sized at the length and width of a pedestrian, a motorcyclist, and a standard automobile. We then set up the sensors in an open area where they could not pick up any readings. The first test conducted was just a distance. Each object was placed directly in front of the sensors at various distances in order to see if the sensors could pick up and return an accurate measurement for each object size and distance.
Afterwards we attempted to determine the beam width for each of the sensors. Starting at 90°, or directly in front of the sensors, we placed our artificial objects 3 ft. away from the sensors are recorded the measurement. If the sensor was able to accurately pick up the object, we increased/decreased the angle in an attempt to get a full 180° cone. Once the full cone was determined for 3 ft. the test was repeated at further distances and with different sized objects. An illustration of the second test is shown in Figure 11 below. The red dots are the locations where the different objects would be placed and have their distance measured.
FIGURE 11: BEAM WIDTH TESTING METHODOLOGY
The Smart Helmet team has decided that a sonar sensor will most likely be the sensor that we choose. They are the only type of sensors that give an acceptable range with a beam pattern that is capable of covering a cone-like blind spot. Both of these model types will be tested in a lab setting and in a real world setting to determine which is the right fit for this project.

42
Following the initial round of testing, the Smart Helmet team has decided to choose the LV-MaxSonar -EZ1 as the sensor of choice for this project. The outdoor testing verified that the -EZ1 was capable of measuring foreign objects of up to 20 feet away. However, the beam width, or area of detection, was far below the desired requirements. Although the -EZ1 sensor failed to meet our standards, MaxSonar offers a chaining solution that will increase the range of detection.
Multiple LV-MaxSonar -EZ sensors are capable of being physically chained together to allow them to run simultaneously or cascading one after another. When chained together, multiple sensors can be placed in different locations or angles in order to increase the detection area. When the sensors are sent a trigger, each sensor will return their own reading. The microcontrollers will be tasked with running an algorithm that will correctly determine that actual range of the object the proximity sensors will be detecting.
The option of chaining these cheap, effective, narrow-beam sensors is the most appealing option given our limited budget. The Smart Helmet team is confident enough to create software that will properly trigger the sensors and create an algorithm that will correctly modify the proximity data to determine the actual distance measurement.
3.3.1.2 LIDAR
LIDAR sensors work by firing hundreds of thousands of light pulses per second at objects. The sensors use the Time of Flight method to calculate the distance the light pulses travelled in order to calculate how far objects are from the sensor. The LIDAR-Lite v3 from Garmin was the main LIDAR sensor considered for this project.
A summary of the LIDAR-Lite’s specifications is listed in Table 5 below. For more information on this sensor, refer to Appendix B to find the respective datasheet.

43
TABLE 5: LIDAR-LITE V3 SPECIFICATION SUMMARY
Attribute Value/Measurement
Size (LxWxH) 20 x 48 x 40 mm (0.8 x 1.9 x 1.6 in.)
Weight 22 g
Power Needed 5 Vdc nominal
Range 40 m (131 ft.)
Beam diameter at distances ≤ 1 𝑚 12 x 2 mm (0.47 x 0.08 in.)
Beam diameter at distances ≥ 1 𝑚 ≃ 𝐷𝑖𝑠𝑡𝑎𝑛𝑐𝑒/100
Accuracy ≤ 5𝑚 ±2.5 𝑐𝑚 (1 𝑖𝑛. )
Accuracy ≥ 5𝑚 ±10 𝑐𝑚 (3.9 𝑖𝑛. )
Overall, the LIDAR-Lite v3 is an extremely powerful measurement sensor. It’s reliable and powerful ranging that’s suitable for just about any smaller drone, robot, and vehicle application. The sensor is relatively small and lightweight and therefore would be easy to mount onto a motorcycle. Unfortunately, the LIDAR-Lite v3 has some significant drawbacks in that it is far too expensive for this project and the beam diameter is far too narrow to be of any practical use.
The Smart Helmet project is designed to be able to detect any vehicle approaching a motorcyclist’s blind spot, which is shaped like a cone behind the rider. The LIDAR-Lite v3’s beam diameter at 10 ft. away is an insufficient 1.2 inches. Coupled with a price of $149.99, which is double our budget for this part, it is an unrealistic part choice.
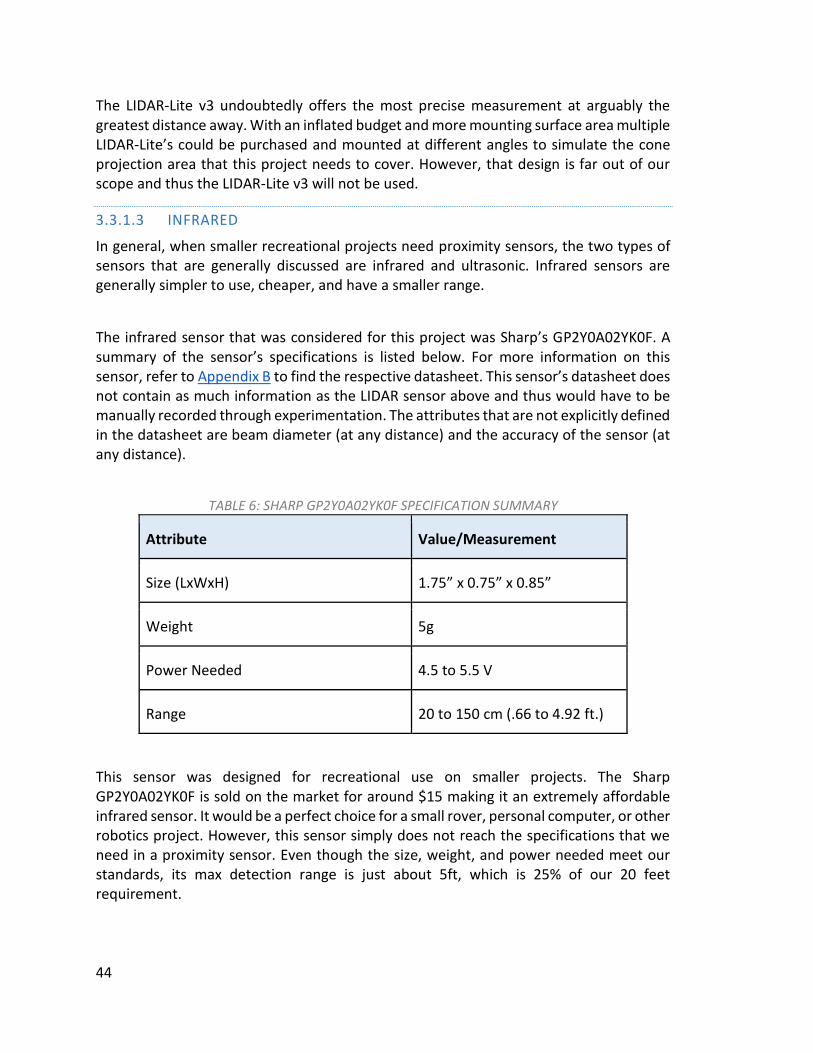
44
The LIDAR-Lite v3 undoubtedly offers the most precise measurement at arguably the greatest distance away. With an inflated budget and more mounting surface area multiple LIDAR-Lite’s could be purchased and mounted at different angles to simulate the cone projection area that this project needs to cover. However, that design is far out of our scope and thus the LIDAR-Lite v3 will not be used.
3.3.1.3 INFRARED
In general, when smaller recreational projects need proximity sensors, the two types of sensors that are generally discussed are infrared and ultrasonic. Infrared sensors are generally simpler to use, cheaper, and have a smaller range.
The infrared sensor that was considered for this project was Sharp’s GP2Y0A02YK0F. A summary of the sensor’s specifications is listed below. For more information on this sensor, refer to Appendix B to find the respective datasheet. This sensor’s datasheet does not contain as much information as the LIDAR sensor above and thus would have to be manually recorded through experimentation. The attributes that are not explicitly defined in the datasheet are beam diameter (at any distance) and the accuracy of the sensor (at any distance).
TABLE 6: SHARP GP2Y0A02YK0F SPECIFICATION SUMMARY
Attribute Value/Measurement
Size (LxWxH) 1.75” x 0.75” x 0.85”
Weight 5g
Power Needed 4.5 to 5.5 V
Range 20 to 150 cm (.66 to 4.92 ft.)
This sensor was designed for recreational use on smaller projects. The Sharp GP2Y0A02YK0F is sold on the market for around $15 making it an extremely affordable infrared sensor. It would be a perfect choice for a small rover, personal computer, or other robotics project. However, this sensor simply does not reach the specifications that we need in a proximity sensor. Even though the size, weight, and power needed meet our standards, its max detection range is just about 5ft, which is 25% of our 20 feet requirement.
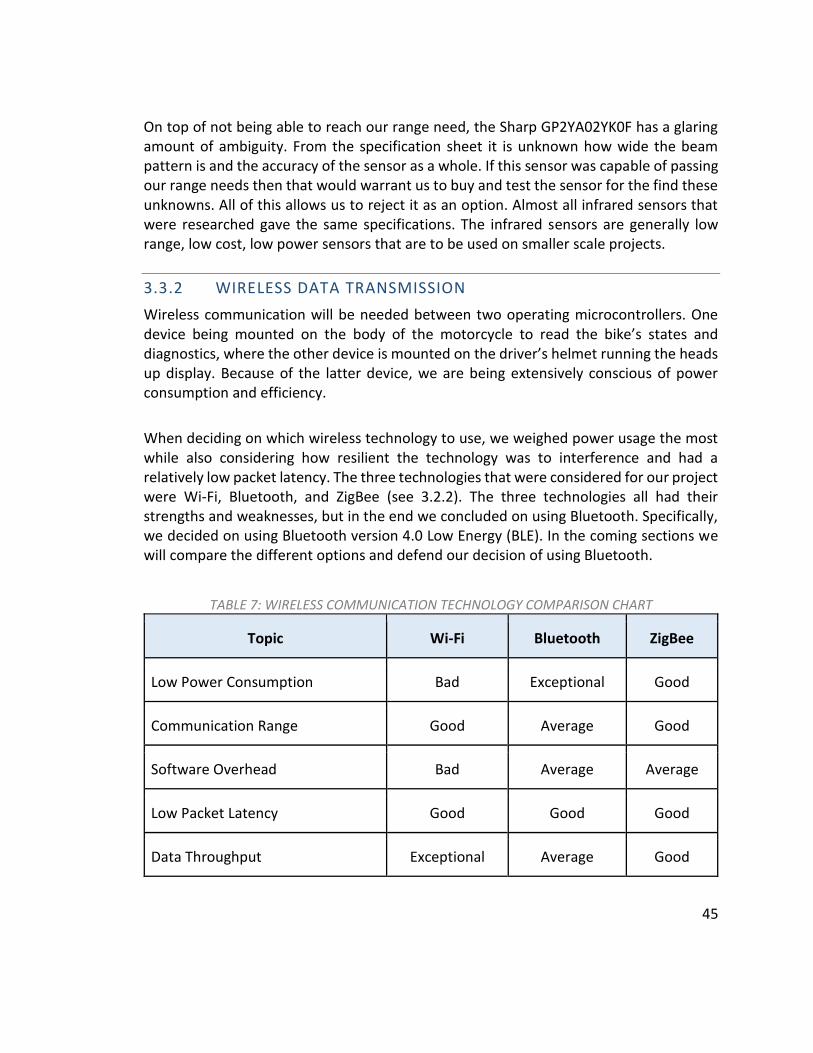
45
On top of not being able to reach our range need, the Sharp GP2YA02YK0F has a glaring amount of ambiguity. From the specification sheet it is unknown how wide the beam pattern is and the accuracy of the sensor as a whole. If this sensor was capable of passing our range needs then that would warrant us to buy and test the sensor for the find these unknowns. All of this allows us to reject it as an option. Almost all infrared sensors that were researched gave the same specifications. The infrared sensors are generally low range, low cost, low power sensors that are to be used on smaller scale projects.
3.3.2 WIRELESS DATA TRANSMISSION
Wireless communication will be needed between two operating microcontrollers. One device being mounted on the body of the motorcycle to read the bike’s states and diagnostics, where the other device is mounted on the driver’s helmet running the heads up display. Because of the latter device, we are being extensively conscious of power consumption and efficiency.
When deciding on which wireless technology to use, we weighed power usage the most while also considering how resilient the technology was to interference and had a relatively low packet latency. The three technologies that were considered for our project were Wi-Fi, Bluetooth, and ZigBee (see 3.2.2). The three technologies all had their strengths and weaknesses, but in the end we concluded on using Bluetooth. Specifically, we decided on using Bluetooth version 4.0 Low Energy (BLE). In the coming sections we will compare the different options and defend our decision of using Bluetooth.
TABLE 7: WIRELESS COMMUNICATION TECHNOLOGY COMPARISON CHART
Topic Wi-Fi Bluetooth ZigBee
Low Power Consumption Bad Exceptional Good
Communication Range Good Average Good
Software Overhead Bad Average Average
Low Packet Latency Good Good Good
Data Throughput Exceptional Average Good

46
3.3.2.1 WI-FI
When considering wireless technologies, the first one to be considered was the ever popular Wi-Fi defined as IEEE 802.11. This technology is used extensively by a wide range of devices and is easily the most popular amongst devices that communicate on networks that host an array of high bandwidth devices. Although popular, it is certainly overkill for the requirements of this project. Wi-Fi requires a support for MAC address broadcasting which is typically used a security precaution for information sensitive communications over the network. Wi-Fi also requires that packets of information be formatted as a TCP/IP connection stream or as a UDP broadcast listener. This adds an excessive amount of computational overhead and increases the software complexity. Our devices are not broadcasting sensitive information and managing network streams is not necessary when only two devices are involved.
The tests used for Wi-Fi are as follows. The simplest and cheapest Wi-Fi modules on the market are the ESP8266 series chips. Utilizing a serial input-output interface, it is able to communicate with any device able to reliably read a serial signal. With the following schematic, an interface can be built between the module and a USB connection (5V),
FIGURE 12: ESP-01 CHIP TO USB SERIAL PIN CONFIGURATION
When the ESP-01 is capable of interfacing with a USB connection, tests can be run on the chip using a simple serial communication. When finding the appropriate settings to communicate with the chip, a serial baud rate of 115200 must be used with odd parity bits. Communication with the device is done via the Hayes command set (also known as

47
AT commands) using single byte ASCII characters. Depending on if the GPIO2 pin is set to ground or not determines if the device should boot into programming mode (grounded) or standard operation mode (not grounded; left open).
In Figure 12 above, the GPIO2 pin is set to ground which tells the device to operate in device programming mode. In device programming mode, we can set low-level settings and even update the firmware running on the ESP8266 chip. When a configuration is decided on and uploaded, the chip is restarted with the GPIO2 pin set to open to boot into normal operation mode. In normal operation mode the user can set various settings including client or server mode, number of allowed connections, connection type (TCP or UDP), and more.
For the scope of the Smart Helmet, a single connection between the device running on the motorcycle (server) and the other device running on the helmet (client). The operating connection mode was set to UDP and a data rate was tested. With the two modules within 5 meters of each other, a data rate of 10 Mbps was achieved. Although an impressive speed, the Smart Helmet is not depending on a fast connection as the amount of data being transmitted is relatively minimal. The problem arises in the power usage. The ESP-01 consumes a significant amount of power compared to its counterparts, so the benefits cannot outweigh the problems that would arise with battery life of the helmet.
In conjunction with the increased overhead of the information being broadcasted comes a significant increase in power consumption. Since Wi-Fi relies on an extensive amount of communication to hold a proper connection, the power usage is orders of magnitude more than the other options we considered. Our conclusion on the technology was to find an alternative option that does not overshoot our goals and can be power efficient.
3.3.2.2 BLUETOOTH
Since the number of devices that are being connected will never exceed two, Bluetooth was our next consideration. Bluetooth is defined as IEEE 802.15.1 and comes in many different versions. We were specifically interested in Bluetooth 4.0 Low Energy (BLE) because of the low energy consumption and minimal overhead. Since one of our devices will be battery powered we wanted to a wireless technology that would not waste energy while still meeting the needs of the project stated earlier.

48
Outside of power consumption, another requirement would be for the wireless communication to have a comfortable range and be resilient to interference. Although BLE does not guarantee packet delivery (similar to TCP/IP with Wi-Fi), it does verify that the packet’s information validity by discarding packets that were found to be corrupted via inference or otherwise. Our device will be sending a complete snapshot of all information in every broadcast, which allows for some packets to be ‘dropped’ and the device will still behave normally as long as the packet loss is less than extreme. The device will still operate with up to around 80% packet loss and would have an effective range of over 50 ft.
Along with BLE’s efficiency and packet validation, it also offers an attractive method of linking two endpoints by requiring the pairing of the devices only once. This pairing persists through power loss and eliminates a significant amount of software overhead that would normally be needed to initiate the connection between the devices. Not only does this eliminate some of the complexity of the software that has to run on microcontroller, but it also makes the connection of the two devices relatively automatic and secure.
Even though security of the information itself is not a worry, we are concerned about external devices maliciously injecting false packets. One hundred percent certainty of security cannot be guaranteed in any project, but by using BLE the device is significantly harder to manipulate by a malicious device. In the end, BLE was an easy choice for us to make for the project.
3.3.2.3 ZIGBEE
After considering Bluetooth, the next step would be to go with ZigBee which is based off of a derivative of Bluetooth technology defined as IEEE 802.15.4. ZigBee tries to be a better version of Bluetooth Low Energy by having increased range and a higher effective bandwidth. Though these may seem like positives for our project, BLE already offers enough range and bandwidth for our project. The issue with using ZigBee over BLE would be a 2-4 times increase in power consumption for the same information at the same broadcast rate. Thus, even though ZigBee could offer a higher sample rate, it would not be worth the energy consumption. Surpassing our current target for broadcast rate would be hardly noticeable and would only diminish the quality of the product by decreasing battery life. The final conclusion was to stay with BLE as it offers all of the features we need for significantly less power usage.
3.3.3 POWER MANAGEMENT
Power management is one of the most crucial aspects of this project, not only in regards to prolonging battery life, but also in regards to power distribution. The battery life in the helmet Heads-Up Display (HUD) module will need to be maximized by using the lowest

49
power components possible, and also extended using solar power and a lithium battery pack. Power going to the Bike-Mounted motorcycle interface module, as well as the Rear-Mounted proximity detection module will need to be limited as to not over-power the components and break them. Voltage regulator circuits will be put into place to control the voltage going into these 2 modules.
3.3.3.1 SOLAR POWER
Solar power is crucial in extending battery life. One, or multiple, solar panels will be place in the helmet in order to maintain a constant charge during the daytime. The panels will be sealed to prevent water and weather damage the terminals. The panels will be small enough to be form-fitting, but large enough to provide enough power. The panels will be wired directly to the same charging circuit at the USB.
A 4.5V battery pack is being considered for the project. To supply solar power in order to prolong and charge the battery, 2 different solar panels are being considered. One is a 5V, 40 mA solar panel measuring at 43x34mm. The small size will fit well onto the helmet, and open more options to where it can be placed. However, 40mA will give a very slow charge, almost too slow to consider. More than one of these solar panels can be placed in series to increase current flow, and a voltage regulator can be used to limit the voltage going into the battery charger. This may be a viable option if placement of the other panel proves difficult or hindering to the design.
The other solar panel in consideration is a 3V, 120 mA panel, measuring 60x55mm. The current is far better than the 5V alternative, but the size of the panel may be difficult to work with, or even hinder the design. However, if we could place 2 of these in series, the battery life could possibly be extended indefinitely throughout daytime use. Both panels will be ordered and tested for this project to see which will work better between physical placement, and battery life extension.
3.3.3.2 BATTERY POWER
Lithium rechargeable batteries will be implemented into the final design, not only to keep costs down, but also to prolong the battery life, and to provide enough power to the helmet. When compared to Nickel-Cadmium batteries, Lithium batteries produce more power per weight, does not require a full discharge in order to recharge, do not suffer from memory effect, and create non-hazardous waste. The rechargeable feature is why we are considering lithium most for this project.

50
Solar power will be used to keep a charge during riding, and a USB port will be added to allow the helmet to be charged at home. Access to the battery will also be available at the user level, so it can be replaced if need be. Three lithium AA batteries, in series to create a 4.5V battery pack, are planned for power to the helmet, but may be changed based on size and power needs. We will be looking at three different battery charging controllers for this project, and deciding which will be chosen based on power output, efficiency, average charging time, size, and cost. Any additional features the controllers have will be taken into consideration as well. The 3 controllers we will be looking are the MCP73831, the MCP73861, and the MAX1811.
The MCP73831-X comes in 4 different varieties, each with a different max charging voltage, from 4.2V to 4.5V. It is equipped to charge lithium ion and lithium polymer batteries, and has a high accuracy preset voltage regulation of 0.75%. Charge current can range from 15mA to 500mA, based on battery needs. Charge status output is also available for notifying if a battery is fully charged or not. An onboard thermal regulator is also available, which will turn the chip off if it exceeds 85 degrees C. Size of the chip is only 2mm x 3mm and is available for under $0.20 apiece. This chip is highly recommended for this project for thermal regulation and voltage output.
The MCP7386X is very similar to the MCP73831. It comes in 4 different varieties as well, with 4.1V, 4.2V, 8.2V, and 8.4V varieties, and is also equipped to charge lithium ion and lithium polymer batteries, as well as has a high accuracy preset voltage regulation of 0.5%. Charge current sits at a 1.2A maximum, with an indicator output to tell when a battery is fully charged. An onboard thermal regulator is also available, which will turn the chip off if it exceeds 85 degrees C. Size of the chip is 4mmx4mm. This would also be a good choice for the project, with some aspects exceeding that of the MCP73831, however, the chip has reached the end of its life, and availability is limited.
The MAX1811 is a single-cell lithium-ion battery charger can be configured to charge batteries to either 4.1, or 4.2 volts, with a high accuracy preset voltage regulation of 0.5%. Battery charging current can be switched between 100mA and 500mA, with a charge status indicator output to signify when the battery has reached a full charge. It is also equipped with special safety features which monitor battery voltage and current and checks for faults. Thermal regulation also comes standard on this chip to ensure it does not overheat. Size of the chip is 4mm x 5mm and is available for about $1.50 apiece. While this is a very good chip, the MCP73831 is the best value of these 3, and will be selected for this project.
3.3.3.3 MOTORCYCLE POWER SUPPLY
In order to control the amount of power needed for the proximity sensor, as well as the other on-bike components, two different voltage regulator will be examined to determine

51
which will be the better fit to meet power demands, without exceeding power limitations. Both the LM7805 and the LM7812 voltage regulators will be summarized to determine the best fit for this project, as far as current output, maximum and minimum voltage outputs, cost, and any additional features the may include. The average voltage from the motorcycle battery is 12V. Power will need to be limited to the maximum power needs, both for the Bike-Mounted motorcycle interface module, as well as the Rear-Mounted proximity detection module, using a different voltage regulator circuit for each.
The LM7805 voltage regulator can handle a minimum voltage input of 7V, and a maximum voltage input of 25V. Minimum voltage output is rated between 4.8V to 5.2V, and can be increased up to 25V with additional circuit components. Maximum output current is measured between 1.5A to 2.2A. Additional features include thermal-overload protection, short-circuit current limiting, and power dissipation capability. This voltage regulator is available for about $1 and offers a wide variety of output voltages that will be very suitable for this project.
The LM7812 voltage regulator can handle a minimum voltage input of 7V, and a maximum voltage input of 30V. Minimum voltage output is rated between 4.8V to 5.2V, and can be increased up to 15.6V with additional circuit components. Maximum output current is measured between 1A to 2.2A. Additional features include thermal-overload protection and short-circuit current limiting. This voltage regulator is available for under $0.50, offers a wide variety of output voltages, and is more inclined to higher voltage applications than the LM7805, though it can still handle low voltages.
The proximity sensors will trigger an audible alert for the rider when objects are in too close of a range to the bike. The ideal audio amplifier for this project will be able to produce a loud enough sound to alert the driver in regular riding conditions, but will also require low power for optimal use. The LM386 and the NJM2113 Low Voltage Audio Amplifiers will be analyzed for this project for voltage and current requirements, gain, optimal frequency, and cost.
The LM386 is battery operated, with an input voltage requirement of 4V to 18V. The current drain is around 3.5mA for a 4V input, to 4.8mA for a 12V input. Amplification is up to 46 dB depending on the addition component configuration and input frequency. A frequency between 500 Hz to 1K is optimal for both, amplification and low distortion, but frequencies as high as 50 kHz can be used without amplification loss. Very few additional
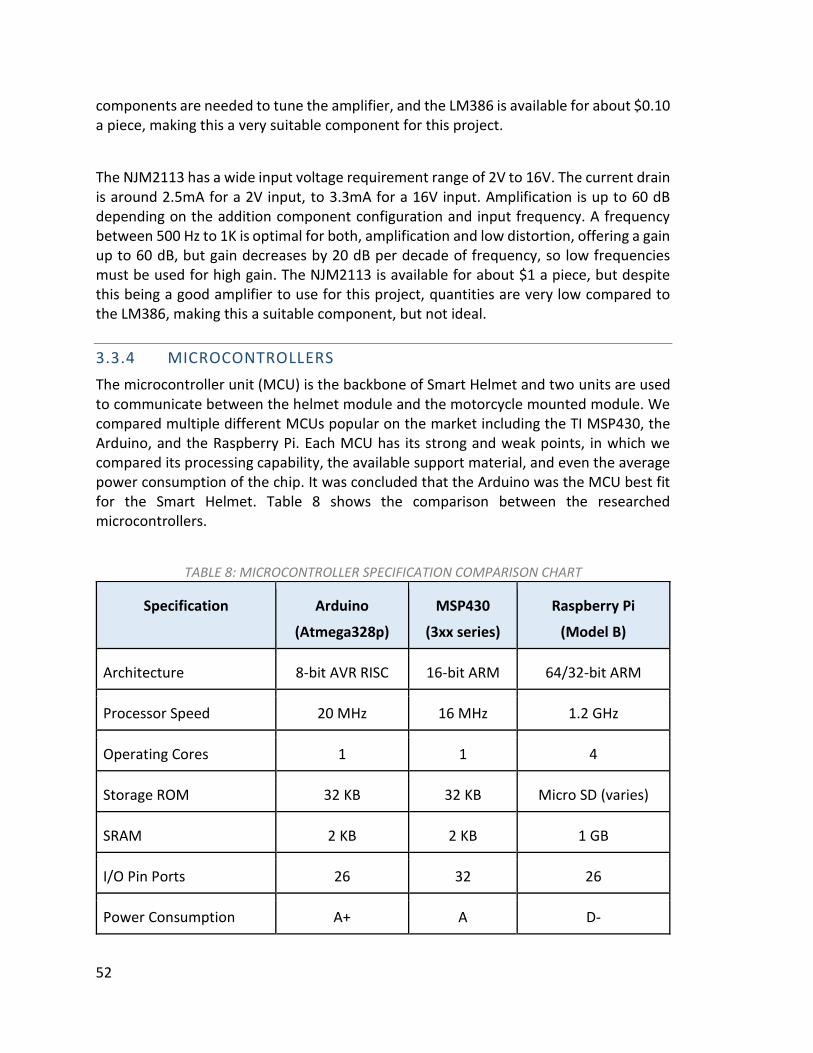
52
components are needed to tune the amplifier, and the LM386 is available for about $0.10 a piece, making this a very suitable component for this project.
The NJM2113 has a wide input voltage requirement range of 2V to 16V. The current drain is around 2.5mA for a 2V input, to 3.3mA for a 16V input. Amplification is up to 60 dB depending on the addition component configuration and input frequency. A frequency between 500 Hz to 1K is optimal for both, amplification and low distortion, offering a gain up to 60 dB, but gain decreases by 20 dB per decade of frequency, so low frequencies must be used for high gain. The NJM2113 is available for about $1 a piece, but despite this being a good amplifier to use for this project, quantities are very low compared to the LM386, making this a suitable component, but not ideal.
3.3.4 MICROCONTROLLERS
The microcontroller unit (MCU) is the backbone of Smart Helmet and two units are used to communicate between the helmet module and the motorcycle mounted module. We compared multiple different MCUs popular on the market including the TI MSP430, the Arduino, and the Raspberry Pi. Each MCU has its strong and weak points, in which we compared its processing capability, the available support material, and even the average power consumption of the chip. It was concluded that the Arduino was the MCU best fit for the Smart Helmet. Table 8 shows the comparison between the researched microcontrollers.
TABLE 8: MICROCONTROLLER SPECIFICATION COMPARISON CHART
Specification Arduino
(Atmega328p)
MSP430
(3xx series)
Raspberry Pi
(Model B)
Architecture 8-bit AVR RISC 16-bit ARM 64/32-bit ARM
Processor Speed 20 MHz 16 MHz 1.2 GHz
Operating Cores 1 1 4
Storage ROM 32 KB 32 KB Micro SD (varies)
SRAM 2 KB 2 KB 1 GB
I/O Pin Ports 26 32 26
Power Consumption A+ A D-
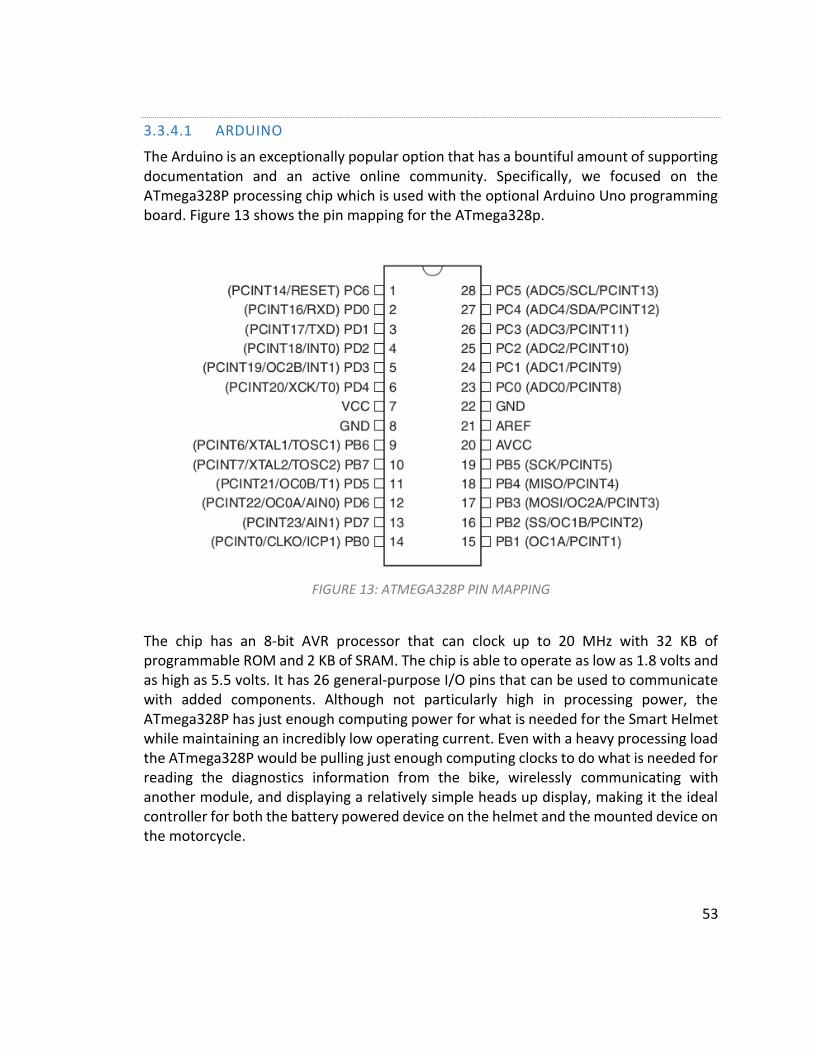
53
3.3.4.1 ARDUINO
The Arduino is an exceptionally popular option that has a bountiful amount of supporting documentation and an active online community. Specifically, we focused on the ATmega328P processing chip which is used with the optional Arduino Uno programming board. Figure 13 shows the pin mapping for the ATmega328p.
FIGURE 13: ATMEGA328P PIN MAPPING
The chip has an 8-bit AVR processor that can clock up to 20 MHz with 32 KB of programmable ROM and 2 KB of SRAM. The chip is able to operate as low as 1.8 volts and as high as 5.5 volts. It has 26 general-purpose I/O pins that can be used to communicate with added components. Although not particularly high in processing power, the ATmega328P has just enough computing power for what is needed for the Smart Helmet while maintaining an incredibly low operating current. Even with a heavy processing load the ATmega328P would be pulling just enough computing clocks to do what is needed for reading the diagnostics information from the bike, wirelessly communicating with another module, and displaying a relatively simple heads up display, making it the ideal controller for both the battery powered device on the helmet and the mounted device on the motorcycle.

54
3.3.4.2 MSP430
The MSP430 is another popular microcontroller that has a significant amount of supporting documentation. Although not quite as popular as the Arduino for hobbyists, the MSP430 is widely used among Universities around the world. The MSP430 uses a 16-bit ARM processor that can clock up to 16 MHz with 32 KB of programmable ROM and 2 KB of SRAM. The chip can support up to 32 I/O pins. Although similar to the Arduino’s Atmega328p in processing power and supporting I/O, it suffers from extremely limited expandability. The Arduino community offers a wider array of information and open source material to learn how to interface with various modules. The MSP430 is the closest match to the Arduino, but does not offer the support necessary for a swiftly designed high quality product. Figure 14 shows the pin mapping for the MSP430 device.
FIGURE 14: MSP430 PIN MAPPING
3.3.4.3 RASPBERRY PI
The Raspberry Pi is the higher end advanced option of the previously mentioned MCUs. The Raspberry Pi has an integrated chip that is difficult to separate from the programming board. The Raspberry Pi is a fully functioning computer board with USB and video outputs. It sports a 1.2 GHz quad-core ARM based processor with over 1GB of SRAM.
Although around the same size as the Arduino’s programming board, the processing chip is not separable from the programming board and consumes an exceedingly higher amount of energy. The Raspberry Pi offers a plethora of processing power and features that would not be utilized with the Smart Helmet and was deemed a significant overkill for the task it would have to support. There is an alternative, smaller version called the Pi Zero, but even it is orders of magnitude greater in processing power compared to what this project requires.

55
3.3.5 MOTORCYCLE INTERFACE
When choosing how to interface with the motorcycle for turn signal states and diagnostics, there are realistically only two options available. One being to rely on modern practices by interfacing with an On-Board-Diagnostics (OBD) interface, and the other option being to intercept the LED states on the dash of the motorcycle. Both options come with their benefits and pitfalls, but in the end, the Smart Helmet will intercept the LED states directly. Although this option may seem like the more extreme, it allows the project to be almost completely universal for all motorcycles even dating back decades. It was concluded that the Smart Helmet project will use a male-to-female large wire splitter to reference the LED status’ on the dash.
3.3.5.1 ON-BOARD-DIAGNOSTICS (OBD)
The On-Board-Diagnostics (OBD) standard is useful for many different ways. The ease of use is the biggest benefit when considering integrating with any project. It utilizes a simple serial-line connection between the motorcycle and the client, which can even be condensed down to a USB cable, or smaller. The glaring pitfall with this option is that it only exists on the newest models of motorcycles. Motorcycles using OBD only started to begin to exist in the late 2000s and early 2010s. Since the Smart Helmet aims to be a universally used device, we avoided using OBD on this reason alone. Alongside that issue, another potential problem would arise when considering that many motorcycle manufacturers have created their own standards to these connections, making a truly universal connection impossible with OBD.
3.3.5.2 DASH LED STATUS INTERCEPTION
The Smart Helmet aims to be a truly universally used device that can benefit as many motorcycle riders as possible. The best way we could accomplish this is to use a male-to-female large wire splitter to intercept the wires leading to the turn signal LEDs on the dash of the motorcycle. Using this line, a voltage reading is marked and used to determine if the driver is meaning to make a turn or not. Although this method seems excessive, it was the only way we could accomplish true universal compatibility with as many motorcycles as possible.
3.3.6 VISUAL DISPLAY
When choosing the visual display that will be used on the Smart Helmet there were two options that were considered: LED strips and a non-transparent OLED screen. The visual display needs to be able to display all of the necessary information in a clear, easy to read format. On top of visibility and readability, price, size, voltage consumption, and coding flexibility were factors in determining which visual display would be used for this project.

56
It was concluded that the Smart Helmet team will be using an OLED non-transparent screen for the visual display.
3.3.6.1 LED STRIP
One of the options for the visual display is using an LED strip. This option is cheap, easy to install, and easy to program. The LED strips come in varying sizes and color customizations that would be able to signal varying degrees of danger to the ride. Two sets of LED strips would be attached to the left and right side of the helmet and would be able to signal to the rider on either side of the motorcycle respectively.
Even though the LEDs offer a simple and cheap solution, the main drawback is that the LEDs are too binary for this project. Only being able to light a strip of LEDs limits the amount of information the Smart Helmet can display to the rider. Because of this limitation, the LED strip will not be used for this project.
3.3.6.2 OLED NON-TRANSPARENT SCREEN
The other option for the visual display is a non-transparent OLED screen. OLED displays vary in sizes and color options while remaining relatively low cost. The OLED screen that was considered for the Smart Helmet is the 128x64 OLED LCD LED white display by DIYmall. This display is small enough in size at 0.96” inch that will not obstruct the rider’s field of vision, but large enough to be able to display all the output that we need. The 128x64 OLED screen is marketed at $9.99 and under on reliable sites such as Amazon.
This specific screen was considered because it is compatible with the Arduino series. There are multiple open source libraries available that allow for customizable display options. These libraries make it possible to display multiple data simultaneously in varying fonts and font sizes. The 128x64 white OLED screen by DIYmall only requires 5V to operate which fulfills our power requirements. All of these features at such a low cost led the Smart Helmet team to choose this screen as the visual display for the Smart Helmet.
3.4 SUMMARY OF SELECTED PARTS
For Voltage Regulation to the Bike-Mounted motorcycle interface module, the Rear-Mounted proximity detection module, and the helmet Heads-Up Display (HUD) module, both the LM7805 Voltage Regulator, and the LM7812 Voltage Regulator were tested. Only the LM7805 Voltage Regulator is used in the final design, but the LM7812 Voltage Regulator was purchased and tested as well in case a backup incase further testing shows the LM7805 to be insufficient or unstable.
For audio amplification, built in audio amplifier on the arduino board is going to be used, primarily due to the fact that it uses very low power, very compact, and can amplify to

57
the desired level when using a small digital speaker. Mounting the amplifier and speaker to the bike helmet was the chosen design, but further testing will be done to see if the design can be improved.
For battery charging in the helmet, the MCP73831 Battery Charge Controller is going to be used. The controller features high safety features, along with exactly the charging capabilities we’re looking for. Small size of the chip will allow for a very compact circuit, but soldering prove to be an issue, and a pre-soldered board had to be ordered. Charging through USB allows for a charging current of 500mA. This allows the battery to be charged, from empty to full, in about an hour and a half.
For the proximity sensors the LV-MaxSonar -EZ1 MB1010 is going to be used. The LV-MaxSonar -EZ1 MB1010’s relatively low cost and ability to accurately detect objects up to 20 feet away are what made the decision easy. Unfortunately the -EZ1 MB1010 is unable to detect objects in a wide range so 8 sensors total were included in the final design. Since this line of sensors are relatively cheap, the Smart Helmet team is comfortable enough to raise the budget for the proximity sensors a bit in order to buy multiple of these sensors. The MaxSonar series has daisy-chaining ability that allows multiple sensors to be hooked up to one module. So these sensors will be mounted at different angles for the two sides of the bike in order to achieve the detection field range that we are looking for. All of these factors is what led the team to choose the MaxSonar series as our proximity sensors. Further testing will be done to determine the best angle configuration that the sensors need to be placed at in order to get the optimal blind spot detection range.
For wireless transmission we chose to go with the HM-10 Bluetooth Low-Energy 4.0 Serial Cc2540. These modules are extremely cheap which makes them an easy choice for cost efficient integration. It uses very low energy because of the nature of Bluetooth Low-Energy and can be very efficient with its energy usage. It interfaces with other modules and MCUs via a serial connection which only requires two pins of connection. This allows the MCU to only use the absolutely necessary few pin slots, giving the project flexibility to which MCU to use without worrying about pin count.
Interfacing with the motorcycle will be accomplished by using a male-to-female large wire pin two-way splitter. This extremely bare-bone setup allows the project to interface with nearly any motorcycle regardless of make and year.
58
For the visual display, the 128x64 Oled LCD LED White Display Module by DIYmall will be used. This visual display has high customization options available to allow for multiple data to be displayed simultaneously. The 128x64 OLED display is a suitable size that is able to display all of the data while not obstructing the field of view of the user.
3.5 POSSIBLE ARCHITECTURES AND RELATED DIAGRAMS
The following subsections contains possible design architectures that were considered for this project. Each architecture has their own respective pros and cons but cost, efficiency, and effectiveness were the deciding factors in choosing an initial design architecture. The Smart Helmet team decided on choosing a three module design: a master module that is mounted on the front on the bike, a slave module that is mounted on the rear end of the bike, and slave module that is mounted on the rider’s helmet. The master module will intercept turn signal flags and request proximity readings from the rear mounted slave module. The master module will then interpret the data and send it to the helmet slave module to be displayed to the rider.
3.5.1 PROXIMITY SENSOR HELMET ARCHITECTURE DRAFT
The first architecture draft that was created was a system where the proximity sensors were directly mounted on the helmet. This type of system would have two main subsystems the master Bike-Mounted Module and the Slave Helmet HUD Module. The Bike-Mounted Module is powered by the motorcycle, which would contain a voltage regulator that would control the incoming voltage from 12V to 5V. From there the Arduino MCU would intercept the turn signal flags from the motorcycle. If the flags are raised high, the Arduino MCU on the Bike-Mounted Module would structure the data for transmission to the Helmet HUD Module. The two subsystems would communicate with a master/slave Bluetooth connection. If the Helmet HUD Module receives a ping from the Bike-Mounted Module, the Arduino mounted on the helmet would awake from idle, initiate the sensors, and gather range data. The HUD Module will then convert the range data into the proper display format and display it to the rider on the visual displays mounted onto the helmet visor. An overview diagram of this two module system is illustrated in Figure 15.

59
FIGURE 15: PROXIMITY SENSOR MOUNTED HELMET ARCHITECTURE DESIGN DIAGRAM
This two-module architecture design simplifies the communication between the subsystems as a whole. In the design aspect, it seems efficient and capable of producing a product that meets our standards. What caused the Smart Helmet team to move away from this architecture design is having the proximity sensors mounted onto the helmet. With such limited space on the helmet, daisy chaining four to six sensors onto the helmet becomes problematic. The biggest determinant as to why the Smart Helmet team has moved on from this architecture design is the fact that the sensors will be constantly changing their relative position to the motorcycle. A motorcyclist is constantly moving their head, which will tamper with the angles that the proximity sensors will be measuring. This ambiguity in readings will lead to unreliable results.
3.5.2 THREE MICROCONTROLLER SYSTEM ARCHITECTURE DRAFT
Following the two module design, the Smart Helmet team created a three-microcontroller system architecture draft. The main modification from the previous draft is that the proximity sensors were moved to the rear of the motorcycle and another Arduino was added to the rear of the motorcycle. This created a three-module subsystem that consisted of the master Bike-Mounted Module and two slave modules the Rear-Mounted
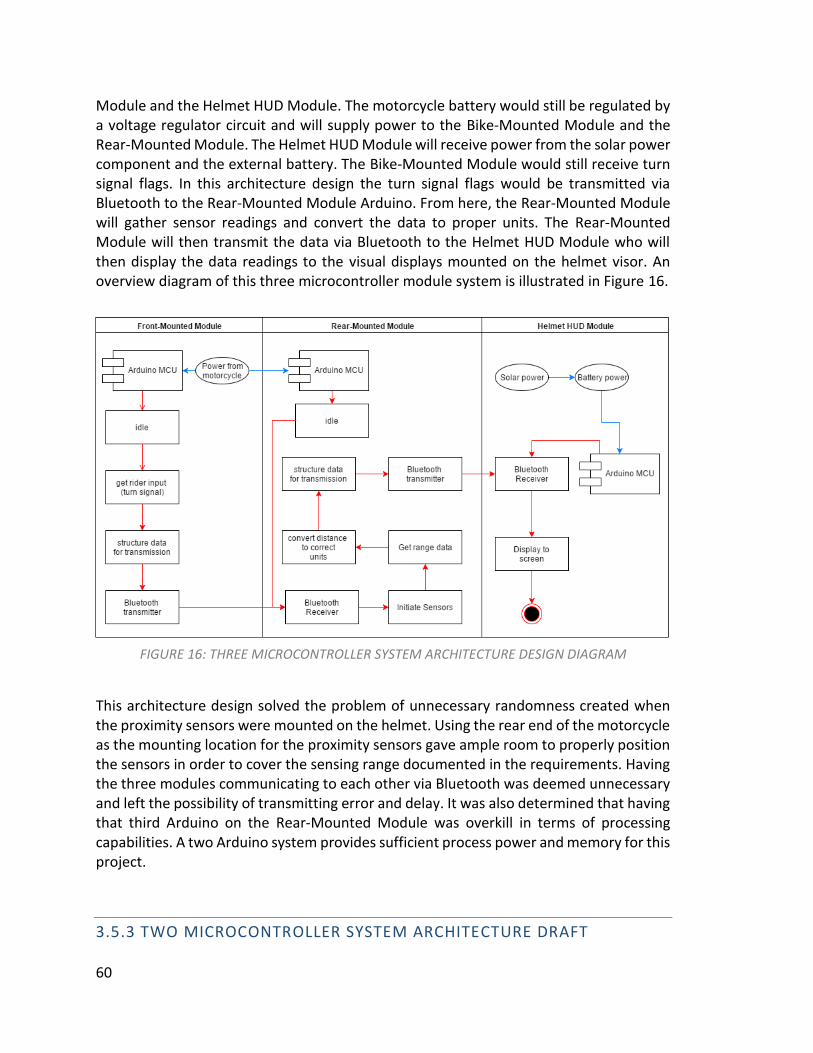
60
Module and the Helmet HUD Module. The motorcycle battery would still be regulated by a voltage regulator circuit and will supply power to the Bike-Mounted Module and the Rear-Mounted Module. The Helmet HUD Module will receive power from the solar power component and the external battery. The Bike-Mounted Module would still receive turn signal flags. In this architecture design the turn signal flags would be transmitted via Bluetooth to the Rear-Mounted Module Arduino. From here, the Rear-Mounted Module will gather sensor readings and convert the data to proper units. The Rear-Mounted Module will then transmit the data via Bluetooth to the Helmet HUD Module who will then display the data readings to the visual displays mounted on the helmet visor. An overview diagram of this three microcontroller module system is illustrated in Figure 16.
FIGURE 16: THREE MICROCONTROLLER SYSTEM ARCHITECTURE DESIGN DIAGRAM
This architecture design solved the problem of unnecessary randomness created when the proximity sensors were mounted on the helmet. Using the rear end of the motorcycle as the mounting location for the proximity sensors gave ample room to properly position the sensors in order to cover the sensing range documented in the requirements. Having the three modules communicating to each other via Bluetooth was deemed unnecessary and left the possibility of transmitting error and delay. It was also determined that having that third Arduino on the Rear-Mounted Module was overkill in terms of processing capabilities. A two Arduino system provides sufficient process power and memory for this project.
3.5.3 TWO MICROCONTROLLER SYSTEM ARCHITECTURE DRAFT

61
From the two previous architecture designs, the Smart Helmet team was able to design a two-microcontroller architecture system that met all of our requirements. This architecture draft is similar to the previous one in that the proximity sensors were still mounted on the motorcycle but the Rear-Mounted Module Arduino has been removed. Instead, the proximity sensors are hard wired to the Front-Facing Module Arduino. Once again, the Bike-Mounted Module and the Rear-Mounted Module are powered by the motorcycle battery while the Helmet HUD Module is powered by the combination of solar power and external battery power. Once the turn signal flags are intercepted by the Bike-Mounted Module, the Bike-Mounted Arduino initiates the proximity sensors to record the data. This Arduino then processes all of the proximity data and prepares it to be transmitted via Bluetooth the Helmet HUD Module. In this architecture design, the Bike-Mounted Module acts as the master while the Helmet HUD Module acts as the slave. Once the data is received by the Helmet HUD Module it is displayed as normal to the rider via the visual displays. Figure 17 below shows the two-microcontroller system architecture design.
FIGURE 17: TWO MICROCONTROLLER SYSTEM ARCHITECTURE DESIGN DIAGRAM

62
This design architecture system was chosen as the design that the Smart Helmet team will move forward with. The Bike-Mounted Module Arduino has sufficient processing power, pins, and memory to handle intercepting the turn signal flags, initiating the proximity sensors, handling all proximity data, and handling all Bluetooth communication. This system allows for design flexibility in case more components need to be added or modified without having an overkill of microcontrollers.

63
4 RELATED STANDARDS & DESIGN CONSTRAINTS
Standards provide a basis for new and developing technologies in the United States. By following standards, we are able to simplify project development and ensure that all safety precautions are followed. By using standards, we can develop our design faster, easier, and at a reduced rate. Different types of standards will be followed for our project ranging from safety standards to hardware standards.
4.1 STANDARDS
Table 9 lists the standards followed for our project. The first couple of standards relate to safety, which is the ultimate goal of our project and were researched first. Following the safety standards, we also researched different wireless communication standards related to Bluetooth. Finally, we researched different standards for hardware safety related to Lithium-Ion batteries.
For the software portion of our project, we researched various programming language standards and guidelines that would help us write code that is more coherent. Because we chose to work with the Arduino IDE, we chose to adhere to the C11 programming language standard when writing code for the microcontrollers. Additionally, we followed the Arduino development guide to for naming conventions and overall code functionality.
TABLE 9: RELATED STANDARDS
Standard Name
IEC 61508 Functional Safety of Electrical/Electronic/Programmable Electronic Safety-related Systems
NFPA 70 National Electrical Code
IEEE 802.15.1
Wireless Medium Access Control (MAC) and Physical Layer (PHY) specifications for Wireless Personal Area Networks (WPAN)
IEEE 1625 IEEE Standard for Rechargeable Batteries for Multi-Cell Mobile Computing Devices
ISO/IEC 9899:2011 Information technology - Programming languages - C (C11)

64
4.2 DESIGN IMPACT OF RELEVANT STANDARDS
The Smart Helmet design will adhere to various standards in order to maximize compatibility with other applications. Using standards allows us to follow common defined characteristics for the hardware that we choose. The speed of development for the Smart Helmet design will also improve by using consistent standards throughout the entire design and implementation process.
4.2.1 SAFETY STANDARDS
In Table 9, standards IEC 61508 and NFPA 70 detail the safety standards followed for our project. The main goal of our project is to increase user safety while on the road, so following these standards is of paramount importance. Our design does not contain any hazardous materials, so we will primarily focus on safety regarding electrical components. The battery charger, located on the helmet module, contains a Lithium-Ion battery, so considerations have to be taken to ensure maximum safety for the rider. This is done by adhering to the safety standards.
4.2.2 BLUETOOTH COMMUNICATION
Bluetooth will be used for wireless communication between the Bike-Mounted MCU and helmet MCU. Bluetooth was originally standardized by IEEE as standard 802.15.1 in 2002 and 2005. This standard covers wireless personal area network (WPAN) standards. This standard specifically defines physical layer and Media Access Control (MAC) specification for wireless connectivity. The two modules that are Bluetooth dependent are able to connect and exchange data wirelessly to one another. The signal frequency for the wireless communication is regulated to be between 2400 and 2483.5 MHz. Both Arduino MCUs will follow this Bluetooth standard when transmitting and receiving wireless data.
4.2.3 LITHIUM-ION RECHARGEABLE BATTERY
A Lithium-Ion rechargeable battery will be used to power the helmet module alongside solar power. The IEEE 1625 standard details approaches to designing, testing, and evaluating a cell, battery pack, or host device. This IEEE standard establishes how to safely utilize Lithium-Ion batteries to prevent possible accidents. This standard discusses how the safety of the battery system depends on the cells, battery pack, host device, power supply, accessories, the user, and the system environment. All of these issues were considered when choosing the battery, battery charging, and internal circuitry for the helmet module design. This standard is to be followed during the Smart Helmet design process in order to ensure our safety when dealing with the Lithium-Ion batteries.
4.2.4 PROGRAMMING LANGUAGE STANDARDS
Standard ISO/IEC 9899:2011 specifies the form and establishes the interpretation of programs written in the C programming language. This standard will provide us naming

65
conventions, syntax, semantics, and overall flow to create portable, well-defined, C code. For personal preference, we have also decided to use a version control platform so that we could easily collaborate without having to be face to face.
4.2.4.1 VERSION CONTROL
In order to handle version control for our software, we looked into several code collaboration tools. Although there are plenty of free tools that are available, we only considered using GitHub and SourceTree. This following discussion will evaluate the pros and cons of each tool mentioned.
One of the most popular and widely used collaboration tools available is GitHub. This web-based Git repository hosting service allows for version control and code management for virtually anyone who uses it. Because it is open source, many other companies have integrated GitHub control into their software, making it that much easier to use. GitHub offers code reviewing, issue tracking, organization techniques and many other useful features. Being students, we had access to the Student Developer Pack, which allows us to host an unlimited number of private repositories for no cost.
The second collaboration tool that we considered is called SourceTree. Using a visual Git interface, SourceTree allows the user to create and manage a repository. By creating a visual Git display, the tool allows for easy code management and lets the user avoid having to enter in command line inputs. SourceTree allows for code review, and provides an easy-to-understand interface for managing commits and code changes. SourceTree is completely free for small development teams, which is perfect for this project.
After considering the tools mentioned, we decided that we would use SourceTree for our code collaboration needs. Although GitHub is a wonderful version control tool, we went with SourceTree because of personal preferences. By default, SourceTree allows us to create a private repository at no cost so we can ensure that there is no possibility of someone using our intellectual property. It is important to protect our code so that no other project can use it and claim it as their own.
4.2.5 ARDUINO DEVELOPMENT GUIDELINES
The Arduino style guide has a list of coding conventions that are strongly recommended to be followed when developing for the Arduino microcontroller. Although not technically standards, these guidelines will be relevant to our project because we will be writing code

66
with the Arduino IDE and following the specifications. Relevant guidelines include writing easy-to-follow code, commenting functions and processes, consistent variable naming conventions, and structuring of the entire code. In following these guidelines, we hope that our code is easy to read and simple to understand.
4.2.4.1 NAMING CONVENTIONS
We will be following the following naming conventions when working on all code written in the C programming language. Following this convention will help create readable and easy-to-follow code.
● All variable and function names will be descriptive for code reviewing purposes.
The type and purpose of every variable and function should be inferable from the name in an isolated context.
● Function names will begin with a lowercase letter and all subsequent words will be uppercase. This practice is also known as camelcase.
○ Ex: int readSensorData(void) ● Locally scoped variable names will be leading lowercase and all subsequent words
will start with uppercase. (camelcase) ○ Ex: int magnitudeSensor = 0
● Global module variable names will be all lowercase and all subsequent words will be separated by an underscore.
○ Ex: int sensor_range_data = 0 ● Constant variable names will be in all uppercase.
○ Ex: const int DELAY = 50 ○ Ex: #define DELAY 50
● Constant variable names with more than one word will be separated by underscores.
○ Ex: const int MAX_BUFFER_SIZE = 8192 ○ Ex: #define MAX_BUFFER_SIZE 8192
● Namespace names will be leading uppercase and all subsequent words will be leading uppercase.
○ Ex: namespace WirelessComm { }
4.2.4.2 FUNCTION FORMATTING CONVENTIONS
All functions in the code are to adhere to the following conventions.
● All functions will have the following header so that the name and description of
the function is easily visible.
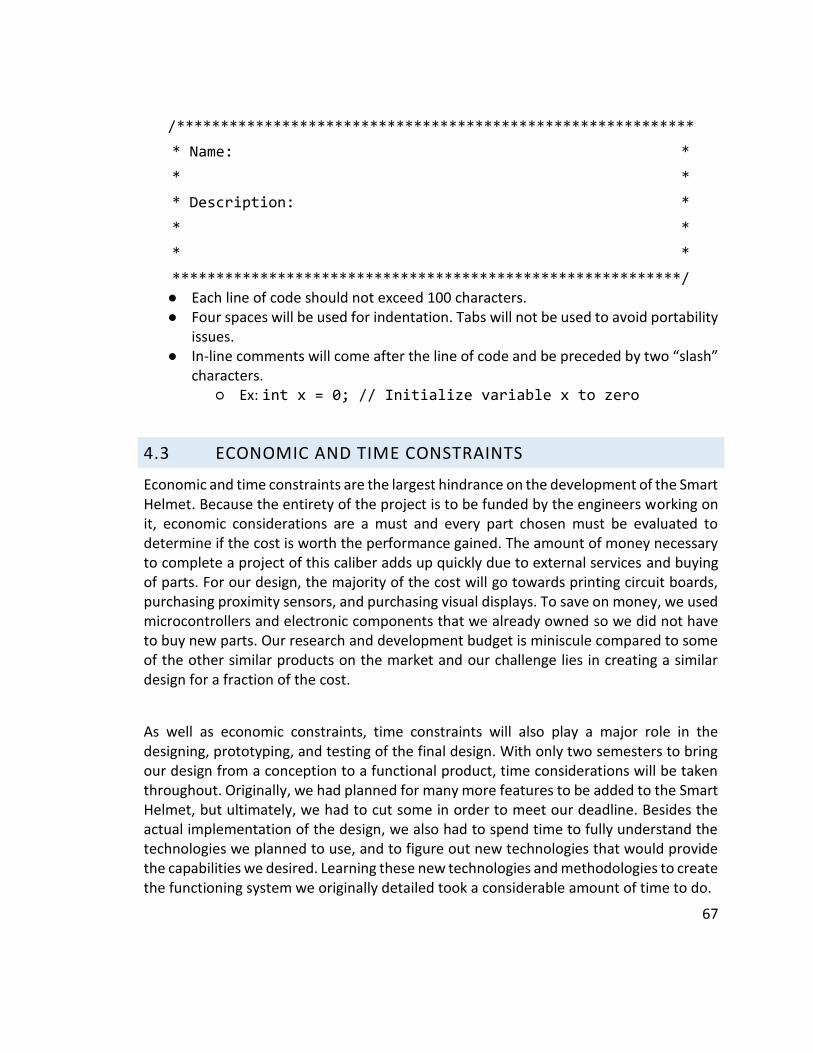
67
/***********************************************************
* Name: *
* *
* Description: *
* *
* *
**********************************************************/ ● Each line of code should not exceed 100 characters. ● Four spaces will be used for indentation. Tabs will not be used to avoid portability
issues. ● In-line comments will come after the line of code and be preceded by two “slash”
characters. ○ Ex: int x = 0; // Initialize variable x to zero
4.3 ECONOMIC AND TIME CONSTRAINTS
Economic and time constraints are the largest hindrance on the development of the Smart Helmet . Because the entirety of the project is to be funded by the engineers working on it, economic considerations are a must and every part chosen must be evaluated to determine if the cost is worth the performance gained. The amount of money necessary to complete a project of this caliber adds up quickly due to external services and buying of parts. For our design, the majority of the cost will go towards printing circuit boards, purchasing proximity sensors, and purchasing visual displays. To save on money, we used microcontrollers and electronic components that we already owned so we did not have to buy new parts. Our research and development budget is miniscule compared to some of the other similar products on the market and our challenge lies in creating a similar design for a fraction of the cost.
As well as economic constraints, time constraints will also play a major role in the designing, prototyping, and testing of the final design. With only two semesters to bring our design from a conception to a functional product, time considerations will be taken throughout. Originally, we had planned for many more features to be added to the Smart Helmet, but ultimately, we had to cut some in order to meet our deadline. Besides the actual implementation of the design, we also had to spend time to fully understand the technologies we planned to use, and to figure out new technologies that would provide the capabilities we desired. Learning these new technologies and methodologies to create the functioning system we originally detailed took a considerable amount of time to do.

68
4.4 ENVIRONMENTAL CONSTRAINTS
Multiple environmental constraints have extended the requirements of the Smart Helmet. Since we chose to add the ability for the helmet’s microcontroller to draw solar power, it would also need to be able to operate without sunlight. We chose to buffer the power via a rechargeable battery to avoid power loss without sunline and to avoid using disposable batteries.
Another environmental constraint would be rain and water while the device is in use. Because of this we have required the device to operate while being rained on by being water resistant and properly sealed. Water can easily cause damage to any electronic device and by properly sealing the electronics of the device, we can avoid any malfunction that could occur.
The last environmental constraint would be temperature. The device should be able to function properly in realistically extreme cold or hot climates. Motorcyclists travel to all types of climates and with that brings certain temperatures that could malfunction the device. We have considered this and have designed the device to operate at realistic driving temperatures. Temperature specifically affects the performance of sonar proximity sensors. As stated in section 3.2.1.3, the speed of sound varies depending on the temperature. Molecules that have higher temperatures contain more energy and are able to vibrate faster. We made sure to choose a sonar proximity sensor that either factors in temperature as a part of its distance calculation, or they compensate the error in some way.
4.5 SAFETY AND HEALTH CONSTRAINTS
The Start Helmet’s primary goal is to keep the motorcyclist safe, and thus have considered as many safety and health concerns as possible. First and foremost, if the device were to malfunction in any way, the view of the driver must not be hindered in any way. Because of this, we decided to keep the heads-up display to the edges of helmet’s front view as to never interfere with the driver’s sight of the dangers he or she will need to stay aware of. In addition, the design of the heads-up display is minimalistic and even if put the most extreme visual mode will not hinder the motorcyclist’s view of the road.
In reference to our environmental concerns, the device should be able to operate at a wide realistic range of temperatures. If the temperature or conditions were to reach an unexpected state and the battery for the helmet were to malfunction, we designed the casing and positioning of the battery to be safely outside the helmet as to avoid dangers of a malfunctioning battery.

69
The final constraint for safety would be to keep the device that is mounted on the motorcycle should be completely out of the way for the driver to properly control the vehicle. The device should not, in any way, stop the driver from performing any action that is required for safe driving. Because of this, we have designed the motorcycle mounted device to be tucked into the body of the bike to be completely out of the way of legs and arms of the driver.
4.6 MANUFACTURABILITY AND SUSTAINABILITY CONSTRAINTS
Our design is very dependent on specific ICs being very available on the market. If any of these chips were to be phased out due to a newer design, components of the smart helmet would need to be redesigned in order to maintain sustainability, otherwise the product will either become more expensive due to low supply of parts, or purely non-manufactural.
As for the LM7805 Voltage regulator, the LM386 low-voltage audio amplifier, and the MCP73831 battery charge controller, multiple manufacturers are available, so a shortage of supply is not foreseen anytime soon. However, as for the proximity sensors and HUD display, product manufacturers are more specific and supply could more easily change. This can be avoided by evolving our design over time. Newer screens and sensors will be available as time progresses, and as other technology evolves, so will the Smart Helmet.
Regardless of how technology may change, it will always be our goal to try to produce an affordable, stable, and safe product. We must also always follow strict guidelines on safety and standards. Regardless of component cost and availability, a single lawsuit or law violation can bring our entire product to a halt. And so, safety and adhering to environmental standard must always come before profit.
4.7 SCHEDULING CONCERNS AND TIME CONSTRAINTS
The senior design project is grueling not only because it forces senior engineering students to step out of their comfort zone and research, design, implement, test, and present a new project but because of the unavoidable scheduling concerns and time constraints. Every member on the Smart Helmet team is currently taking other advanced courses at UCF while holding a part time job or internship. This often would tamper with our meeting plans and forced us to become creative when it came to planning and

70
assigning roles for the project. To battle these scheduling concerns and limited time constraint we had to maximize our team together as a group and constantly document all of our progress/conflicts. From the start of the project we set up an instant messaging chat, this allowed us to quickly communicate with each other when we needed a simple question answered or if we needed to schedule a meeting time.
Besides the active instant message chat, we loosely implemented an Agile development methodology. Specifically our development process resembles that of Scrum, a subset of Agile, which involves creating a backlog, release backlogs, sprints, periodic meetings, burndown charts, retrospective meetings, and individual work. At the start of the project, the Smart Helmet together as a team developed the project idea based on a dire need of improving motorcycle safety. From there, once again as a team, we developed requirements and a design for the Smart Helmet. Each team member was then assigned active roles on specific parts of the project. From here, the team members could individually research each component of the project and begin designing each component. The research and design process was deemed as our first sprint.
Throughout this designing process, the Smart Helmet team would hold small meetings updating the team of each of their progress. Here the team members documented what they did since the last meeting, discussed what they plan to do next, and brought up issues that need to be resolved individually or as a team. The meetings were/are critical to the development process since it kept the end design vision unified.
At the end of our first sprint, the Smart Helmet team had chosen all of the parts for this project. The first retrospective meeting was held where we discussed all the parts chosen and figured out if all the parts were compatible. Following the retrospective meeting, the testing sprint began.
As individual components were finished being design, each team member was able to start testing their component individually. As the components passed each isolated test, the team members could begin combining components and begin subsystem testing while not wasting time of the other team members whose components are not involved. Simultaneously, team members was tasked with documenting all of their work in the team’s Google Drive and incorporate it into this project documentation.
This development process will continue into senior design 2 until the project is completed. This loose version of Scrum maximizes our time by allowing the individual members work simultaneously on different components. The scrum meetings and retrospective meetings made use of our limited time together and kept the team’s goals unified and clear.

71
5 PROJECT HARDWARE AND SOFTWARE DESIGN DETAILS
Section 5 and all of its subsections detail the hardware and software design process of combing each individual component into one system with all of its subsystems. The Smart Helmet project is divided into two main subsystems, the helmet HUD module and the mounted motorcycle interface. From here, the subsections divide the subsystems into smaller and smaller subsystems and discuss their hardware schematics, software design goals, and software design and software communication where applicable.
5.1 INITIAL DESIGN ARCHITECTURE AND RELATED DIAGRAMS
The entire design is best represented visually in Figure 18. The design is split into two major parts: the mounted motorcycle interface module (left) and the helmet heads-up display (right). The two major parts operate independently with separate MCUs and power sources and communicate over wireless transmissions (center). Although the mounted motorcycle interface module is one interconnected system, we describe the processor, wireless, bike diagnostics, and power regulation (all in 5.2) separate from the Rear-Mounted proximity sensors (5.3). The entire helmet heads-up display (5.4) is described in a single section.
As shown in Figure 18, different sections of the system’s design was managed by various members of the team. The assignments were distributed to best fit each team member’s strengths and weaknesses. Each team member chose which part of the project they wanted to work on based on their past experiences or other projects they they’ve worked on. The project assignments are also indicative of what each team member researched for the overall design.

72
FIGURE 18: HIGH LEVEL PROJECT BLOCK DIAGRAM

73
5.2 BIKE-MOUNTED MOTORCYCLE INTERFACE MODULE
The Bike-Mounted Interface Module is the device in charge of reading inputs from the Rear-Mounted Proximity Sensors and transmitting the received information wirelessly to the Helmet Heads-Up Display.
5.2.1 SUBSYSTEM OVERVIEW
Five components interact together to make up the Bike-Mounted Motorcycle Interface Module: the Arduino MCU & voltage regulator, the Bluetooth transmitter, the motorcycle interface, the motorcycle battery, and the proximity sensors. The Arduino MCU is the main distributer of data and power. It regulates how much voltage will be drawn from the bike and distributes it accordingly. The Arduino component is tapping into the motorcycle’s interface to intercept the turn signal statuses. Simultaneously, the proximity sensors are from the Rear-Mounted module and they draw in distance readings of foreign objects. These readings will be sent back to the Arduino to be analyzed. If a turn signal is active, the Arduino will send the proximity data to the Bluetooth transmitter so the data can be transmitted to the HUD module. A summary of this interaction is pictured in Figure 19 below.
FIGURE 19: BIKE-MOUNTED MOTORCYCLE INTERFACE MODULE OVERVIEW
5.2.1.1 ARDUINO ATMEGA MCU
The MCU will utilize an Atmega328p which is commonly found on the Arduino Uno development boards as an all-in-one computing chip. The Arduino Uno is used as the

74
programming terminal for the chip, and the Arduino Uno will not be used once the Atmega has been properly programmed. The Atmega processing chip is capable of operating on its own with proper connections to a stable voltage source and a clock timing device.
The input voltage can be any stable value from as low as 1.8V and as high as 5.5V. A target input voltage of 5V was selected to be provided by the power transformer. The value of 5V was selected with the intention of properly powering all of the connected components while also supporting any possible additions to the project.
The Atmega328p chip does house its own clock timing device, but this timer is problematic for the use of the Smart Helmet project. The internal timer of the chip is known to be inaccurate which would severely cripple our ability to utilize technologies that rely on hardware timed events like serial connections. The internal timer on the chip is also only rated to run at a max of 8kHz which would be a bottleneck for processing capabilities in the project. The concluded option was to utilize a clock timing device being a crystal oscillator that is rated for speeds of 16MHz. This allows the device to run only 20% slower than it would if still installed on the Arduino Uno.
5.2.1.2 BLUETOOTH TRANSMITTER
The Bike-Mounted Motorcycle Interface MCU will be utilizing a Bluetooth module via a 2-pin serial connection. The module that the Smart Helmet will be using is the Cc2540 Bluetooth BLE 4.0 Serial module. Below, in Figure 20, is a reference to the module with the respective pins that are accessible for the MCU.
How the MCU communicates with the device is fairly simple when using a serial connection. Using the open source AltSoftSerial library, the MCU can communicate with the module as if it were an input-output byte stream. A byte stream is very similar to a file, except the ability to seek and measure size is not possible. A serial connection can also closely relate to a network connection stream.
FIGURE 20: CC2540 BLUETOOTH LOW-ENERGY SERIAL MODULE PIN MAP (CREDIT: EVOTHINGS.COM)

75
The Bluetooth transmitter can support a 3.3V or 5V power source. This is because this specific module has a digital 5V to 3.3V internal step down converter to safely connect to 5V devices. Since 5V is a common standard for most systems, this feature was especially attractive for the Smart Helmet project.
The hardware connection of a serial connection between two endpoints is incredibly minimalistic. Two pins are required as input and output for each endpoint and should be connected to the other’s inverse pins for proper communication. This, however, does mean that serial connections are asynchronous. This adds a small amount of overhead for the software to regulate how fast the stream can be used.
5.2.1.3 INTERFACE TO MOTORCYCLE
The Bike-Mounted Motorcycle MCU has the task of continuously watching the status of the motorcycle’s turn signal switch. This switch is controlled by the driver of the motorcycle and a signal of high would indicate that the driver is intending to turn or merge in that direction. The Smart Helmet project uses this information to warn and potentially stop the driver from accidentally merging or turning into a hazard on the road.
This interface is accomplished by reading and measuring the voltage effected by the turn signal switch. The demo motorcycle used as a test for the interfacing is the Honda Supersport CB400F. With this motorcycle, a connection can be established under the handlebars to read the status of the turn signal as seen below in Figure 21.
FIGURE 21: HONDA CB400F WIRES CONNECTING TO THE LEDS

76
These two wires can be used as the interface for determining the state of the turn signal by measuring the active voltage at that point in the motorcycle’s circuitry. To safely accomplish this, a simple voltage divider is needed to step down the 12V source that typically is used to power the LEDs. The Atmega328p is very adaptable in its ability to read analog inputs, but the voltage must be within a specific range to avoid damaging the MCU. Any voltage below 5V is considered safe for the MCU, but a target of ~3V will be used for extra precaution against possible damage.
To divide a voltage in a circuit, a voltage divider is used to split the voltage over at least two resistors. Two resistors selected based on the following voltage divider formula.
𝑉𝑜𝑢𝑡 = 𝑉𝑖𝑛 ∗𝑅2
𝑅1 + 𝑅2
The target voltage for our system in 3V and the input voltage of the system in 12V. Thus, the following equation can be deduced to the following.
3 = 12 ∗𝑅2
𝑅1 + 𝑅2 ∴
𝑅2
𝑅1 + 𝑅2= 0.25
This gives the resistor ratio being ¼. Since the system should not pull any significant amount of current, a large base resistance is used and the two resistor values were concluded to be [𝑅1 = 30𝑘𝛺] and [𝑅2 = 10𝑘𝛺]. With the two resistor values known, a simple voltage divider circuit is built and used. Figure 22 below shows the interface circuit design for the Motorcycle turn signal module, internal to the bike.
FIGURE 22: INTERFACE CIRCUIT FOR MOTORCYCLE TURN SIGNAL MODULE

77
The above circuit allows the MCU to safely read for a high or low voltage from the motorcycle’s turn signal module. While a more standard way of interfacing with the motorcycle was definitely preferred, this was the most universal way to support as many motorcycles as possible to use the Smart Helmet project.
5.2.1.4 INTERFACE TO PROXIMITY SENSORS
The Bike-Mounted Module MCU will be wired directly to the proximity sensors on the Rear-Mounted Module. Because the proximity sensors return analog data, the sensors will be wired to the analog pins on the microcontroller. The sensors only need +5V for power and they will return distance data whenever triggered by the software. The analog data returned will be a distance representation of the output voltage. For a +5V power supply, the distance representation will be approximately 9.8mV/inch. This measurement will be translated into feet through software.
In order to handle the multiple sensors that the design will be using, the sensors must be wired in such a way that multiple readings will be accepted. This can be accomplished by wiring each sensor to it’s own analog pin on the microcontroller. The other option is to multiplex the distance readings and only accept one reading at a time on one analog pin. This approach will save valuable space on the microcontroller because only one analog output pin will be utilized. The process of triggering the sensor daisy chain is very similar to just triggering a single sensor. Provided there is adequate power, the TX pin on the sensors is brought high momentarily and the chain sequence begins.
5.2.1.5 POWER
The Bike-Mounted Motorcycle Interface Module get its power directly from the motorcycle battery, but the voltage needs to be reduced in order to prevent over-voltage to the circuitry. The voltage regulator circuit in Figure 23 will be inserted between the motorcycle battery and the Bike-Mounted Motorcycle Interface Module. Voltage will be decreased from 12V to supply the correct amount of power needed for the Bike-Mounted Motorcycle Interface Module.
The voltage regulator circuit is design to increase the standard voltage output of the LM7805, giving an output between 5V to about 8.3V. The resistors in this circuit are configured to add current back into the output, that would otherwise have just gone to ground. Increased current in the output means increased output voltage. To control this output voltage, R2 is varied. By increasing the value of R2, more current is added back into the circuit and output voltage is increased. Current over R1 must not be made too
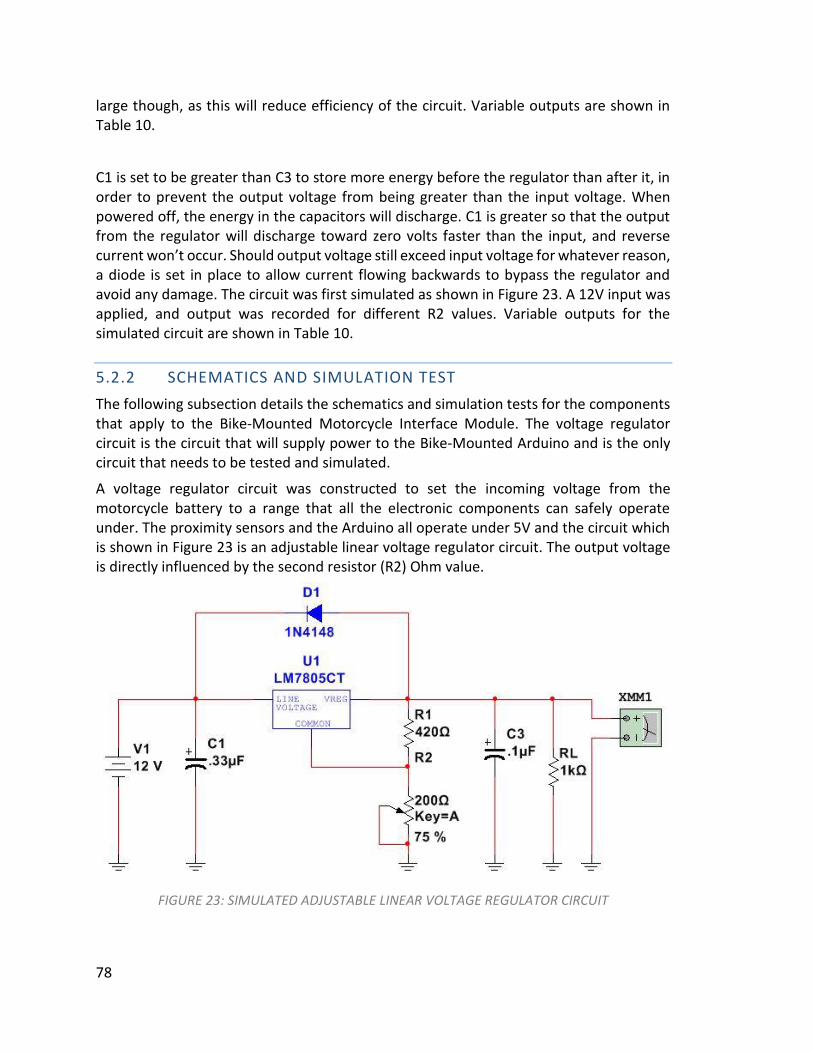
78
large though, as this will reduce efficiency of the circuit. Variable outputs are shown in Table 10.
C1 is set to be greater than C3 to store more energy before the regulator than after it, in order to prevent the output voltage from being greater than the input voltage. When powered off, the energy in the capacitors will discharge. C1 is greater so that the output from the regulator will discharge toward zero volts faster than the input, and reverse current won’t occur. Should output voltage still exceed input voltage for whatever reason, a diode is set in place to allow current flowing backwards to bypass the regulator and avoid any damage. The circuit was first simulated as shown in Figure 23. A 12V input was applied, and output was recorded for different R2 values. Variable outputs for the simulated circuit are shown in Table 10.
5.2.2 SCHEMATICS AND SIMULATION TEST
The following subsection details the schematics and simulation tests for the components that apply to the Bike-Mounted Motorcycle Interface Module. The voltage regulator circuit is the circuit that will supply power to the Bike-Mounted Arduino and is the only circuit that needs to be tested and simulated.
A voltage regulator circuit was constructed to set the incoming voltage from the motorcycle battery to a range that all the electronic components can safely operate under. The proximity sensors and the Arduino all operate under 5V and the circuit which is shown in Figure 23 is an adjustable linear voltage regulator circuit. The output voltage is directly influenced by the second resistor (R2) Ohm value.
FIGURE 23: SIMULATED ADJUSTABLE LINEAR VOLTAGE REGULATOR CIRCUIT

79
This adjustable linear voltage regulator circuit was designed using Multisim. When simulated with varying R2 Ohm values the output voltage was modified as shown in Table 10. As the resistor value increased the output voltage also increased in voltage. For this project design, it is likely that no resistor will be used in R2 since most of the components on the Front-Facing-Module require 5V to operate as intended.
TABLE 10: SIMULATED LM386 VOLTAGE REGULATOR OUTPUT WITH VARYING R2
Vi (V) R1(Ohm) R2(Ohm) Vo(V)
12 420 0 5.00
12 420 50 5.82
12 420 100 6.64
12 420 150 7.46
12 420 200 8.28
5.3 REAR-MOUNTED PROXIMITY DETECTION MODULE
The Rear-Mounted Proximity Detection Module is the subsystem in charge of receiving input flags from the Bike-Mounted Interface Module and reading in proximity data from the proximity sensors.
5.3.1 SUBSYSTEM OVERVIEW
Three components interact to make up the Rear-Mounted Proximity Detection subsystem: the proximity sensors, the Arduino MCU & voltage regulator, and the motorcycle battery. The motorcycle battery sends voltage to the Arduino MCU that is regulated by the voltage regulator. The proximity sensors then receive 5V of power and begin to measure distance readings. These proximity distances are sent back to the Arduino. From here, the Arduino can analyze the data and send it to the HUD display if needed. A summary of these interactions is illustrated in Figure 24 below.

80
FIGURE 24: REAR-MOUNTED PROXIMITY MODULE OVERVIEW
5.3.1.1 PROXIMITY SENSORS
The Rear-Mounted proximity sensors will connected to the Arduino MCU located on the front of the motorcycle. The sensors will receive a power supply voltage of +5V from the Arduino and will in turn output ranging data. There are 7 pins on the LV-MaxSonar -EZ1 Series as shown in Figure 25. Depending on the desired output, the various pins can be connected to the Arduino to achieve analog, pulse width, or serial output. The most simple configuration of this sensor is to connect pin 3 to the MCU, as this will output analog distance.
FIGURE 25: LV-MAXSONAR -EZ1 SERIES PIN MAPPING
For the Smart Helmet design, several of the LV-MaxSonar -EZ1 will be connected together to form a daisy chain of sensors. Typically, when using multiple ultrasonic sensors in a single system interference will occur when the sensors communicate with each other. This sensor, however, was engineered to overcome this problem. This common problem can avoided by chaining the sensors together by utilizing one of three different methods.
The first chaining method is described as an Analog Output Commanded Loop. The first sensor in the series will gather ranging data, and then trigger the next sensor to range. This cycle repeats for each sensor until the last sensor is triggered and the sequence is terminated. This method can be implemented by connecting the TX pin of the current sensor to the RX pin of the next. The BW pin is also held high for each sensor so that the TX output sends a pulse instead of serial data. To start the sequence the first sensor’s RX

81
pin is momentarily brought high and then returned to ground. This initial RX pulse will start the sensor chain.
The next chaining method is extremely similar to the previous, known as an Analog Output Constant Loop. Unlike the previous method which completes once the final sensor has been triggered, this method will go on run continuously until power is removed from the sensors. This is achieved by connected the TX pin of the last sensor to the RX pin of the first. The loop is still initiated in the same way as the previous method, where the RX pin on the first sensor is momentarily brought high and then back low.
The final chaining method is known as an Analog Output Simultaneous Operation. Unlike the previous two methods, this method does not rely on the subsequent sensor to trigger the next in the series. Instead, all sensors are tied to one RX line and are all triggered simultaneously by the MCU. Once triggered, the sensors all take ranging readings at the same time. This method is considered unstable and is sensitive to how the other sensors in the series are relatively positioned, so it must be fully tested before implementing.
5.3.1.2 VOLTAGE REGULATOR
The Rear-Mounted Proximity Detection Module get its power directly from the motorcycle battery, but the voltage needs to be reduced in order to prevent over-voltage to the circuitry. The voltage regulator circuit in Figure 26 will be inserted between the motorcycle battery and the Rear-Mounted Proximity Detection Module. Voltage will be decreased from 12V to supply the correct amount of power needed for the Rear-Mounted Proximity Detection Module.
The voltage regulator circuit is design to increase the standard voltage output of the LM7805, giving the output voltage a range between 5V to 8.28V. The resistors in this circuit are configured to push some additional current back into the output, that would otherwise have just gone to ground. Increased current in the output means increased output voltage. To control this output voltage, R2 is made variable. By increasing the resistance of R2, more current is pushed back into the circuit and output voltage is increased. Current over R1 must not be made too large though, as this will reduce efficiency of the circuit.
C1 is set to be greater than C3 to store more energy before the regulator than after it, in order to prevent the output voltage from being greater than the input voltage. When powered off, the energy in the capacitors will discharge. C1 is greater so that the output

82
from the regulator will discharge toward zero volts faster than the input, and reverse current won’t occur. The circuit was simulated, as shown in Figure 26. A 12V input was applied, and output was recorded for different R2 values. Variable outputs for the simulated circuit are shown in Table 11.
5.3.1.3 INTERFACE TO BIKE-MOUNTED MODULE
The Rear-Mounted Module will interface with the MCU on the Bike-Mounted Module by physical connection. A wire will run from the rear of the bike to the front, effectively connecting the sensors to the Arduino. Because the sensors output an analog voltage, only one pin on the MCU will be needed to receive ranging data.
In order to use more than one sensor, we will need to use more than one analog pin on the microcontroller. This may prove problematic if we later decide to use more sensors that analog pins available. One solution to this problem is to include additional microcontrollers in the design. With more microcontrollers present, more analog pins will be available to us. The other, more viable, solution would be to multiplex the sensor outputs to one analog pin on the microcontroller. By utilizing a multiplexer, we will be able to have all sensor outputs available on one analog pin.
5.3.2 SCHEMATICS AND SIMULATION TEST
The following subsection details the schematics and simulation tests for the components that apply to the Rear-Mounted Module. The voltage regulator circuit is the circuit that will supply power to the Rear-Mounted Module and is the only circuit that needs to be tested and simulated. The motorcycle battery’s voltage runs through a voltage regulator to set the voltage at 5V before it powers the proximity sensors.
5.3.2.1 VOLTAGE REGULATOR
This is the same voltage regulator that regulates the voltage to the Bike-Mounted Module. The proximity sensors will receive 5V of voltage when R2 is set to 0 Ohms. The circuit, which was constructed in Multisim, is illustrated in Figure 26 below.
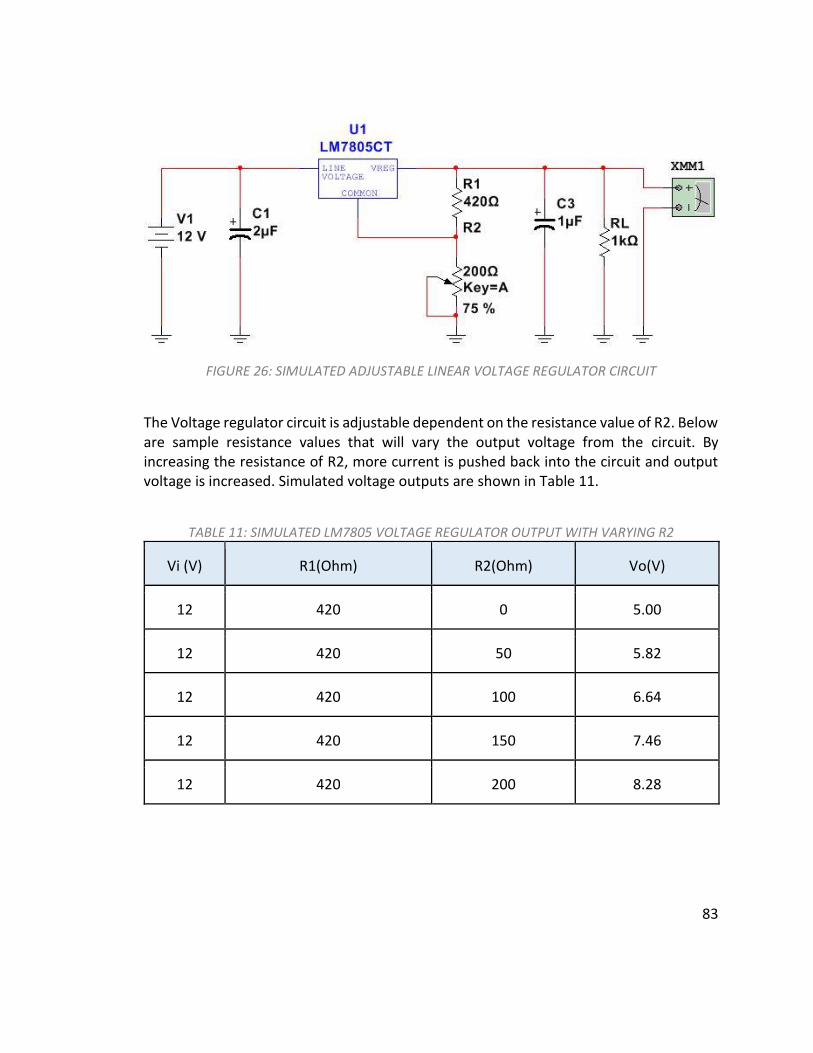
83
FIGURE 26: SIMULATED ADJUSTABLE LINEAR VOLTAGE REGULATOR CIRCUIT
The Voltage regulator circuit is adjustable dependent on the resistance value of R2. Below are sample resistance values that will vary the output voltage from the circuit. By increasing the resistance of R2, more current is pushed back into the circuit and output voltage is increased. Simulated voltage outputs are shown in Table 11.
TABLE 11: SIMULATED LM7805 VOLTAGE REGULATOR OUTPUT WITH VARYING R2
Vi (V) R1(Ohm) R2(Ohm) Vo(V)
12 420 0 5.00
12 420 50 5.82
12 420 100 6.64
12 420 150 7.46
12 420 200 8.28

84
5.4 HELMET HEADS-UP DISPLAY (HUD) MODULE
The Helmet Heads-Up Display (HUD) Module is the subsystem in charge of receiving proximity analysis from the Bike-Mounted Motorcycle Interface Module and displaying it to the rider on the OLED visual displays. The HUD module receives power from both the solar component and the battery component.
5.4.1 SUBSYSTEM OVERVIEW
The HUD subsystem is composed of 5 parts interacting together: the helmet Arduino, the Bluetooth receiver, the Bluetooth transmitter, the mobile battery/solar power component, and the visual display. The Arduino and the visual display receive power from the power component. As data gets transmitted from the Bluetooth transmitter to the Bluetooth receiver, the Arduino determines what type of visual display is needed. Once the correct visual display needed is determined, the Arduino sends the proximity analysis to the visual display to be displayed to the user. No information is sent back to the front module subsystem. A summary of these interactions is illustrated in Figure 27 below.
FIGURE 27: REAR-MOUNTED PROXIMITY MODULE OVERVIEW
5.4.1.1 ARDUINO ATMEGA MCU
Similar to the MCU that will run on the Bike-Mounted Module, the Helmet MCU will utilize the Atmega328p computing chip. Although the Atmega328p chip is most commonly known for being part of the Arduino Uno development package, the Smart Helmet will only utilize the Arduino Uno development board for programming the chip and not for real time use. The chip is a completely independent device as long as there is a consistent stable flow of power and a timing device for the clock.

85
The Atmega328p is capable of operating at a range of voltage from 1.8V to 5.5V. The target supplied voltage for the MCU was decided to be 5V to operate in a stable setting with a wide option of expandable components.
Although the Atmega328p can operate independently from the Arduino Uno development board, an added timing device is required for the clock. The chip does host an internal timer but it is widely known to be inconsistent and is not recommended to use with any software that requires precise timing. This is the reason why the decision was made to avoid using the internal timer. For a proper serial connection to exist for the Bluetooth module, exact hardware timers must function as expected to communicate without data invalidation. The choice of timing devices was set to be a 16MHz crystal oscillator. This will have the chip operate only 20% slower than if it were still connected to the Arduino Uno, and still guaranteeing valid hardware timers.
5.4.1.2 BLUETOOTH RECEIVER
A second copy of the Bluetooth transmitter module will be used that will be used with the Bike-Mounted Module. Both endpoints of the Smart Helmet has to operate with the same standard, thus both endpoints will be using Bluetooth Low-Energy 4.0 with the Cc2540 Serial Bluetooth module. Below, in Figure 28, is a reference to the module with the respective pins that are accessible to the MCU.
Communication between the MCU and the Bluetooth module is fairly straightforward. The Bluetooth module uses a two pin serial connection to communicate to other hardware. A serial connection can be closely related to a network connection or a file buffer but without the ability to seek or peek data in the stream.
FIGURE 28: CC2540 BLUETOOTH LOW-ENERGY SERIAL MODULE PIN MAP (CREDIT: EVOTHINGS.COM)

86
Serial communication is asynchronous, which relies on precise hardware timing to operate as expected. This is the biggest case for using a crystal oscillator for the clock timer on the MCU. The tradeoff for such a minimalistic connection is a small amount of software overhead involved with properly utilizing the byte stream that is created with a proper connection.
5.4.1.3 VISUAL DISPLAY
The visual display that will present blind spot distance data to the rider will be a 0.96” I2C OLED display sold by DIYMall. This display uses very little power, only 0.08W, when compared to other types of visual displays such as TFT and LCD. This display was also chosen because of its high contrast, which makes it easily viewable even when outside in sunlight. The display requires either 3.3V or 5V supply voltage to power on, which it receives from the Arduino MCU. The resolution is relatively small at 128x64, but is large enough for the data that we need to present the rider with. This visual display uses two input/output pins that act as a clock signal and data signal.
The I2C-bus data signal (SDA) acts as a communication channel between the Arduino MCU and the display. Both the data and the acknowledgement are sent through this signal. The other IO pin is the clock signal (SCL). Transmission of information on the SDA line depends on the clock signal on this pin. Each transmission of data takes place during a single clock period of SCL. The clock is provided by the Arduino MCU, which acts as a master control.
Internal to this display is a SSD1306 CMOS driver that controls the OLED dot-matrix display. The internal Graphic Display Data RAM (GDDRAM) on this chip is 128 x 64 bits wide and is divided into eight pages, from 0 to 7. When one data byte is written into the GDDRAM, the corresponding page of the current column is filled. By manipulating the GDDRAM buffer, we will be able to output our desired data to the visual display.
5.4.1.4 POWER
The primary power source for the helmet module will be from the solar panel situated on top of the rider’s helmet. The solar panel will be able to deliver +5V of operating power to the microcontroller and the battery charger. The battery charger will be responsible for charging the Lithium-Ion rechargeable battery, so a constant +5V from the solar panel is necessary. If adequate sunlight cannot be reached, the solar panel will stop supplying power and instead the battery will be the main source of power for the microcontroller.
5.4.1.5 BATTERY CHARGER
The battery charging circuit shown in Figure 29 features adjustable current charging from 15mA to 500mA. Constant power supply of 3V to 6V is required. Power can also be drawn from a USB port, which produces 5V and 500mA. When using USB for charging, charge current should not be set higher. Charging current is adjusted using the switchboard. Current based on which switches are active can be seen in Figure 30. Charging a

87
completely dead battery to full takes 165 minutes, with most of the charging being completed within 120 minutes. The red LED signifies power the battery is currently charging. Once fully charged, the green LED will light up.
5.4.1.6 AUDIO AMPLIFIER
The audio amplifier circuit in Figure 29 is equipped with a 100K potentiometer to vary the gain between 64x to 190x. The Input capacitor, C2, helps to filter out unwanted noise to produce a clear, undistorted output signal. C1 controls the overall gain of the amplifier and is set to 10uF. C3 and C4 both works to filter out noise as well, and R1 ensures helps control the current going to the output. The output is a measure of the amplified signal across C5.
The amplifier circuit works by taking a low-voltage signal into the positive amplifier terminal. This signal is amplified using the DC power source into the negative amplifier terminal. Gain is set to 190x by the capacitor between pins 1 and 6. This gain is always the same, but output voltage is reduced by reducing the input signal. It’s easier, and more stable, to reduce the input signal voltage rather than the output voltage.
A 12V DC power source is recommended for this circuit. As DC power decreases, amplitude decreases, but distortion also increases. With a DC input of 4.5V, 100x gain can be achieved, but with very heavy distortion. Further testing will be performed to see if a clear enough tone is produced from a 4.5V input. If so, the amplifier and speaker can be placed in the helmet. If not, they will need to be placed on the bike, and amplification will need to be at its maximum for the rider to hear it.
5.4.2 SCHEMATICS AND SIMULATION TEST
The following subsections contain the schematics and simulation tests for the circuits in the Helmet HUD Module. The Helmet HUD Module will be receiving power from the battery charger. The other circuit present in the Helmet HUD Module is the audio amplifier. When the motorcyclist is at maximum risk there were be an audible alert that is amplified by the circuit shown below.
5.4.2.1 BATTERY CHARGER
The battery charger was built and simulated in Multisim. This simulated circuit, which is shown in Figure 29, has adjustable current charging. This current charging is adjusted using the switchboard. When the circuit is fully charged, a green LED will light up. Otherwise, a red LED will light up. The different charging currents based on current active

88
switches on the switchboard can be seen in Figure 30. The more active switches the greater the charging current is.
FIGURE 29: SIMULATED MCP73831 BATTERY CHARGING CIRCUIT
FIGURE 30: MCP73831-2 CHARGING CURRENT, BASED ON SWITCHES
5.4.2.2 AUDIO AMPLIFIER
The audio amplifier circuit was built and simulated in Multisim. The circuit that was simulated is shown in Figure 31. A simulated multimeter was also included in the circuit

89
design and the input voltage vs output voltage graph can be seen in Figure 32. These simulated circuits will be the basis for when we implement the real hardware.
FIGURE 31: SIMULATED LM386 LOW-VOLTAGE AUDIO AMPLIFIER
FIGURE 32: LM386 VOLTAGE INPUT VS VOLTAGE OUTPUT (NOT TO SCALE)

90
5.5 SOFTWARE DESIGN
The software for the Smart Helmet is split into two parts operating on two separate asynchronous MCUs. The two MCUs will be running completely independently of each other and will only communicate over wireless transmissions. Many different languages were considered for the design of the Smart Helmet, which all depended on which MCU was chosen and how often information had to be recorded and transmitted. For each option of MCU was considered, various languages could become an impossibility.
Initially, it is assumed to use a fully compiled language since our software does not need to benefit from dynamic linking or runtime changes to the underlying code. The options for fully compiled languages were roughly Assembly, C, and C++. Out of the options it is obvious that using C++ would yield the best results for the least amount of effort, making it the more efficient option. Programming in Assembly for most embedded devices leads to tedious repetitive use of valuable production time, and is usually deemed as an overkill over options like C or C++ since memory is typically not so much of an issue with modern MCUs.
Secondly, it is typical to consider using managed languages like C# or Java, but the overhead of a managed virtual machine is usually outweighed over the numerous benefits that managed languages can provide. Both C# and Java offer easy to integrate modules that can extend current code seamlessly even without the need to restart the program in execution. With the simple and fixed nature of the Smart Helmet, these benefits would be mostly overlooked and would only cause potential slowdowns in operation.
Since the decision of which MCU to use was decided to be the Atmega328p, managed languages instantly were out of consideration. The Atmega328p runs with only 2KB of RAM and would have an extremely difficult time operating with that little of memory. Although small, 2KB of RAM is all that is needed to perform all of the required tasks of the project. With the help of various public Arduino library add-ons, the Atmega328p can be used to its highest efficiency and significantly reduced both the power and monetary cost of the project.
The Arduino suite of compilers for the Atmega328p runs as a C/C++ hybrid. The primary standards rooted from is the C99, but benefits from various parts of modern C++ in terms of basic classes. Most of the standard C libraries are not included and are not an option when working with the Atmega328p. For the standard libraries that are included (ex. String.h), it is considered bad practice to utilize them. For such a low-memory device, the Atmega328p can suffer from inefficient memory allocations in String.h which can lead to cryptic errors once the cap is reached inadvertently.
91
The single most prominent potential issue when working with such a low-memory device is running out of memory for the stack and heap. Arduino compiled code has no initial way of knowing how much memory is left for the heap and stack. Instead of resorting to unorthodox ways of monitoring memory, it is traditionally standard to write code that runs in as much of a static memory allocation state as possible. Very little memory should be allocated during runtime. Storing memory manually in program memory space can benefit the author by storing large chunks of invariant data to free up as much operating memory as possible. The cost of storing data in this section is the increased latency of the read.
5.5.1 SOFTWARE DESIGN GOALS
The overall software design for displaying information can be modeled off of Smith’s and Moiser’s guideline for developing a user interface. Smith and Mosier offer five high-level goals to organizing a display on a system: consistency of data display, efficient information assimilation by the user, minimal memory load on the user, compatibility of data display with data entry, and flexibility for user control of data display. The last goal is not applicable to this display scenario since so little data is being displayed.
In the software testing for the visual display, the testing team must ensure that, at any point in displaying the proximity analysis, the same presentation format is being used throughout. This will ensure that the user does not confused when and if a new presentation format appears. The method of presenting the warning display will impact the other three goals. Using a simple 5 star asterisk categorization system to measure the level of threat will have efficient information assimilation, low memory load on the user, and is very compatible with the type of data being displayed (a measurement).
Depending on distance away an oncoming vehicle is, the proximity reading will be categorized into a 0-5 rating system, where zero is no threat and five is an immediate danger. This simple rating system will be presented to the user with asterisk(s). The low rating scale and minimal items being displayed not only correlate well with the type of data being displayed but also are a minimal memory load on the user. The user will not have to process the information given to them; they will be simply react to the information being displayed instantaneously.
Even with the limited amount of pixels allowed on the display it is important not to overwhelm the user. There will only be two levels of intensity: the simple asterisk categorization display and a “Danger!” display when an oncoming vehicle is dangerously close to the user. The second level of intensity will distinguish itself as a major threat indicator since no other scenario will include such a high intense display. The “Danger!”

92
level will also include a harsh audio cue to help notify the user of the rare emergency condition.
The warning display interface will be designed with a straightforward model. There will be no more than four font size and no more than three fonts in an effort to not overwhelm the user. A maximum of four colors will be used, this is already achieved by using an LED display that only prints in white. These guidelines ensure that the user is getting a clear representation of the data that they need without unnecessary distractions.
This method of interface design also caters to universal usability. The main source of information is a series of asterisk, which is universally readable to any user. The only English word, “Danger”, is also coupled with a harsh audio tone and the asterisk rating system. This unique scenario will be able to quickly teach the users what “Danger” means if they are unfamiliar with the word, say English is not their first language.
All of these design goals and guidelines help set the foundation to an interface design that is simple to read and will minimize errors. Having an efficient interface design is imperative to the project because the display will be used in such a dangerous, fast-paced environment. The implementation of these goals and standards help meet the requirement of creating a visual display that neither obstructs the user’s field of view nor distracts the user from their view.
5.5.2 BIKE-MOUNTED MODULE CONTROLLER
The Bike-Mounted module controller runs completely asynchronously from the Helmet Mounted module. The controlling MCU is tasked with constantly reading the proximity sensor and bike diagnostic information to then send to the wireless transmitter. The Helmet Module then would receive and interpret this data for display on the HUD.
The overall flow of the software running on the Bike-Mounted module is as follows. The Bike-Mounted module is connected to a dedicated power source being the motorcycle’s main battery. Although energy usage is not a large concern, the goal of the software still attempts to be efficient and to not waste power when certain conditions are not met. If the wireless module is not connected then the processor can enter an inactive state waiting for a connection to be secured. Figure 33 shows the Bike-Mounted Module software flow.

93
FIGURE 33: BIKE-MOUNTED MOTORCYCLE INTERFACE SOFTWARE FLOW
5.5.2.1 WIRELESS TRANSMITTER
Interfacing with the Bluetooth Low-Energy 4.0 transmitter can be done a few different ways. The easiest and concluded best way to interface with the transmitter is over a 2-pin serial connection using AT-commands for setting attributes on the module. When the transmitter is not connected, it can accept the following AT-command settings for setting the transmitter attribute. Note that all brackets ‘[‘ and ‘]’ are not included in the actual setting and exists solely for readability. This sequence of commands is only needed to be sent once or if the transmitter somehow has become corrupted or reset its attributes.
TABLE 12: AT-COMMAND SEQUENCE TO SET ATTRIBUTES ON HELMET BLUETOOTH MODULE
AT-Command Transmitter Response Purpose
1 AT+RENEW OK+RENEW Resets device to factory default.
2 AT+ADDR[?] OK+LADD[Bike MAC] To retrieve the MAC address of this transmitter.
3 AT+MODE[0] OK+Set[0] Set the transmitter into passthrough mode.
4 AT+ROLE[0] AT+Set[0] Set the transmitter as the master device.

94
5 AT+PASS[Shared Pass]
OK+PASS[Shared Pass] Sets the shared password between master and slave transmitter.
7 AT+RESET OK+RESET Restarts the device with the newly set attributes.
8 AT+CON[Helmet MAC]
OK+CONNA Connects to the Bike device transmitter.
With these AT-commands set on the transmitter, it will automatically connect once it is powered on. Thus, for the software side of the wireless communication, a simple serial connection is used to send all data to and from each device.
5.5.2.2 PROXIMITY SENSORS
The coding logic for the two sides of proximity sensors are identical even though they are working independently from each other. The sensors are waiting in idle, in an effort to conserve energy, while waiting from a signal from the bike-mounted Arduino MCU. Once the Arduino MCU detects that a turn signal has been activated, the Arduino sends a signal to activate the respective proximity sensor to begin detecting objects and measuring the distance to those objects. It is important to note, at no point in time shall both sensors detect objects simultaneously. When driving, one cannot activate both turn signals.
Before a loop that continuously reads the sensor can begin, functions need to be incorporated to initially setup the sensor. The sensor mode, input and output pins, and the baud rate being used must be configured first. Following that, a “read sensor” function must be created that will read in measurements and convert the measurements to the proper units. Once these functions are created, a turn signal flag can be passed from the Arduino to the proximity sensor to start the sensing process.
Once the turn signal flag is received, a loop is initiated to start recording measurements. The proximity sensor will detect nearby objects and transmit the distance measurement to the Arduino MCU. The MCU then converts the received measurement to the correct units. Once the distances are measured and converted to the proper units, the Arduino MCU can then handle transmitting the results to the helmet module. Next, a small delay is issued before the next measurement, this delay is used to allow the sensor to measure objects at set intervals. For this project, the delay will be around 50 ms, in order to avoid drastic positional changes in the distance of the foreign objects. This loop will continue until the turn signal flag is switched to low. Below, in Figure 34, is a software flow diagram that shows the logic in a simplified form.

95
FIGURE 34: PROXIMITY SENSORS SOFTWARE FLOW DIAGRAM
5.5.3 HELMET HUD MODULECONTROLLER
The Helmet HUD module runs completely asynchronously from the Front Mounted module. The controlling MCU is tasked with listening to the wireless transmitter and processing the received data as the status for the sensors and diagnostics of the motorcycle.
The overall flow of the software running on the Helmet HUD module is as follows. Since the Helmet is not connected to a dedicated power source and is instead running off of battery and solar power, the goal of the software is to be efficient and to not waste power when certain conditions are met. If the wireless module is not connected then the processor can enter an inactive state waiting for a connection to be secured. In addition, if the wireless module is connected but not receiving transmissions then the module should enter a low process tick rate until a transmission is received. Figure 35 details this software flow with a visual representation.

96
FIGURE 35: HELMET HUD MODULE SOFTWARE FLOW
5.5.3.2 WIRELESS TRANSMITTER
Interfacing with the Bluetooth Low-Energy 4.0 transmitter is done the same way as the transceiver on the Bike Mounted module. It was concluded that the best way to interface with the transmitter is over a serial connection using AT-commands for setting attributes on the module. The following AT-command settings were used for setting the transmitter. Note that all brackets ‘[‘ and ‘]’ are not included in the actual setting and exists solely for readability. This sequence of commands is only needed to be sent if the transmitter somehow has become corrupted or reset its attributes.
TABLE 13: AT-COMMAND SEQUENCE TO SET ATTRIBUTES ON HELMET BLUETOOTH MODULE
AT-Command Transmitter Response Purpose
1 AT+RENEW OK+RENEW Resets device to factory default.
2 AT+ADDR[?] OK+LADD[Helmet MAC] To retrieve the MAC address of this transmitter.
3 AT+MODE[0] OK+Set[0] Set the transmitter into passthrough mode.
4 AT+ROLE[1] AT+Set[1] Set the transmitter as the slave device.

97
5 AT+PASS[Shared Pass]
OK+PASS[Shared Pass] Sets the shared password between master and slave transmitter.
7 AT+RESET OK+RESET Restarts the device with the newly set attributes.
8 AT+CON[Bike MAC] OK+CONNA Connects to the Bike device transmitter.
The transmitter does not require resetting the attributes after the two endpoints have been linked, thus making the software interface fairly straightforward. When a connection has been established, the transmitter can be communicated over serial and the data is automatically transmitted to the other endpoint.
5.5.3.2 VISUAL DISPLAY
The coding for the visual displays that are mounted on the motorcycle helmet are similar to the proximity sensor code. The visual display will be mounted on the visor of the helmet not obscuring the rider’s field of vision. When the visual display receives power, a start up display of the Smart Helmet logo will be displayed. Following that, the display will be in idle mode waiting for an input. The input will come when the front-facing module on the motorcycle transmits proximity data to the helmet MCU. The helmet module will determine which of the range indicators the input falls into. From here the module will clear the display if there are any previous visual indicators. The new output will now be projected onto the display. The visual display will then loop back and wait for a new input.
The initial setup for the visual display is to download and import the U8G library from GitHub. This library is compatible with the DIYmall LED display that is being used for the Smart Helmet. This is a graphics display library that allows for multiple fonts, monospace and proportional fonts, mouse-cursor support, and landscape/portrait mode. It is important to note that this library is compatible with the Arduino. At the start of the visual display code, the correct constructor for the 128x64 DIYmall display must be included.
To output to the visual display the drawStr class from the u8g library will be used. This uses pixel locations and a string to output to the display. Before a string can be outputted

98
to the display, the color index and font must be set using setColorIndex and setFont respectively.
The coding logic for displaying the proximity warning is just a continuous loop that runs while the helmet module has power. If there is input from the bike module, then set the font and color index. Then display the correct warning display based on distance the object is away. Then return to the start of the loop waiting for another input to come in from the motorcycle module. Below, in Figure 36, is a software flow diagram that shows the logic in a simplified form.
FIGURE 36: VISUAL DISPLAY SOFTWARE FLOW DIAGRAM
5.5.4 SOFTWARE LIBRARIES
Coding in C/C++ on the Visual Studio or Arduino IDE opens up a range of open source libraries that are available to use. Software libraries are pre-written classes and procedures that will ease development of software programs by assisting both the programmer and the programming language compiler in building and executing software. Instead of having to create duplicate functions, one can import Arduino compatible libraries. The following subsections document software components, the libraries that are currently being used by the Smart Helmet Team, and what functionality the imported libraries are providing.

99
5.5.4.1 VISUAL DISPLAY
Already discussed in the software design for the visual display on the Helmet HUD Module is the Arduino Monochrome Graphics Library u8glib. This library is a universal graphics library for OLEDs and GLCDs for embedded systems. The u8glib library can be found in Appendix C for download and more information.
This library comes with over 70 functions that used to aid displaying information on an OLED or GLCD display. This library is compatible with hundreds of displays including the 128x64 OLED display chosen for this project. The drawing functions taking pixel position inputs to properly position the data on the screen. On top of aiding in the proper position of the data, u8glib allows for customization of fonts, font sizes, and font colors (if the display supports multiple colors). On top of displaying data types such as strings, characters, integers, and floats the u8glib allows the programmer to draw shapes using pixel positions.
The simplification of displaying data coupled with the ability to make more dynamic displays made choosing u8glib quite easy. Although the Smart Team is satisfied with this graphics library, other graphics libraries that are compatible with the Arduino will be researched and used if they fit any needs in our requirements.
5.5.4.2 PROXIMITY SENSOR
One of the issues documented by users is ping delay with ultrasonic sensors. To combat this, a software developer created the NewPing library. This library is compatible with the entire Arduino line-up and solves most lag and ping frustrations.
The ping methods that are included in the method are arguably the most beneficial methods for this project. Methods such as sonar.ping_in() and sonar.ping_() return a distance measurement in specific units, eliminating the need for the Smart Helmet team to manually perform unit conversions. The NewPing library also includes a median ping method, where the method will request a series of measurements from the proximity sensors and calculate the median in an attempt to eliminate any and all outliers.
The NewPing library also offers timer methods. These methods will call functions at a certain frequency specified. These timer functions could be beneficial in auto syncing the proximity sensors to run at specific frequencies. Another use of these timer functions is to automate the recording intervals. The pseudo code explaining this is as followed: while

100
the turn signal flag is raised, call the ping function using timer at a certain frequency. When the flag is lowered, use timer_stop to stop measuring readings.
On paper, the NewPing library seems to add many positives while almost no negatives. The fact that they automate much of the proximity sensor readings is appealing. However, because these functions are pre-coded, it does not allow for much modification and tweaking to our specific needs. Because of this, the Smart Helmet team will use this library as a reference, but generate all of our proximity sensor software on our own.
5.5.4.3 SERIAL NETWORK CONNECTION
Serial communication is utilized by the Smart Helmet project by being the method that the MCU communicates with the wireless transmitters. Serial connections are extremely minimalistic in their hardware setup by only using two pins to communicate. Although a convenient setup on the hardware level, it does require additional functionality on the software side to be properly utilized.
A serial connection in hardware is essentially a byte stream without the ability to seek to a specific index. Some would compare a serial connection to a network stream or a file read/write buffer. In the end, a serial connection is just an input-output stream that acts like a two-way byte queue. This style of communication is exactly how devices over a network communicate and is how a serial connection can operate with such minimal hardware.
In software, the Smart Helmet utilizes an Arduino compatible open source library called AltSoftSerial. This library uses the hardware level timers to precisely time all transmission bits sent over the serial connection. There is a standard Arduino library intended for the same use called SoftwareSerial, but this library is widely referred to as unreliable and inaccurate in its ability to maintain a proper connection without incorrectly reading bytes sent over the wire.
The issues presented with using this type of connection is its inability to safely deliver all message packets. When the two Bluetooth endpoints experience severe interference or have too much distance between them, then data can be lost without any immediate way to verify its delivery. This, however, is not an issue with the Smart Helmet, as each packet of information is completely independent of the next and will continue to operate as expected even if a significant amount of the packets are lost in transmission.
The ability to safely read multiple consecutive bytes to form a packet is the ability to recognize when a packet has been only partially sent. We have produced a method in our

101
software where it can dynamically detect when a packet has been only partially received and will discard the message in this scenario. Figure 37 below illustrates this lifecycle.
FIGURE 37: RECEIVED BYTES TO PACKET CONSTRUCTION LIFECYCLE.
5.6 SUMMARY OF DESIGN
The Smart Helmet will be divided into three smaller subsystems: the Bike-Mounted Module, the Rear-Mounted Module, and the Helmet HUD Module. There will be two Arduinos on the Smart Helmet, one located on the Bike-Mounted Module acting as the master and another on the Helmet HUD Module acting as the slave. The Bike-Mounted Module will be in charge of receiving any and all inputs from the motorcycle, initiating proximity sensor readings, consolidating and analyzing any proximity data, and initiating data transfer via Bluetooth communication to the Helmet HUD Module.

102
There will be three main power sources charging the system. The Helmet HUD Module will be powered by a combination of a solar power and a rechargeable lithium battery, the MCP73831. The other power source will be the motorcycle battery, which will power both the Bike-Mounted Module and the Rear-Mounted Module. A voltage regulator circuit will be designed and implemented onto the motorcycle battery to set the output voltage to an appropriate voltage that allows for a safe operation level for each subsystem and subcomponent.
The Bike-Mounted Module is composed of four subcomponents: an Arduino Atmega MCU, a Bluetooth transmitter, an interface to the motorcycle, and an interface to proximity sensors. The Arduino MCU is responsible for implementing any and all software for the Bike-Mounted Module. The Bluetooth transmitter will prepare proximity data information to be transferred to the Helmet HUD Module. There will be a physical connection from the Arduino MCU to the motorcycle, in order to intercept the motorcycle’s turn signal flags. Finally, the proximity sensors will be wired to the pins of the Arduino Atmega MCU.
The Rear-Mounted Module is a subsystem of the daisy-chained proximity sensors. There will be two sets of the daisy-chained sensors, one on the rear left hand side of the motorcycle and the other on the rear right hand side of the proximity sensor. Both of these sets of proximity sensors will be powered via the voltage regulator circuit. The proximity sensor sets will receive input commands from the Bike-Mounted Arduino Atmega MCU.
The Helmet HUD Module subsystem will be located on the motorcyclist’s helmet. This subsystem will be composed of a slave Arduino Atmega MCU, a Bluetooth receiver, visual displays, a combination power source (solar power and lithium rechargeable battery), and an audio amplifier. The combination power sources will be responsible for maintaining and regulating power to the entire subsystem. The Helmet HUD Arduino will be responsible for receiving any and all proximity analysis data from the Bike-Mounted Module and prepare it for display onto the visual displays. The Helmet HUD Arduino will also be responsible for triggering an audible response when appropriate.
The coding logic for this project is to implement a master and slave component system. The Helmet HUD Module and Rear-Mounted Module will both be sitting in idle waiting for input signals from the Bike-Mounted Module. Whenever the Bike-Mounted Module intercepts a high turn signal flag, the Bike-Mounted Module will request proximity readings from the respective proximity sensor set. After receiving the set of proximity readings, the Bike-Mounted Module will run a median sorting algorithm and will detect the correct measurement reading of the oncoming obstacle. The Bike-Mounted Module

103
will then prepare this proximity analysis to be transmitted to the Helmet HUD Module using a 2-pin serial connection and AT-commands. At this point, if the turn signal flag has returned to low, the proximity sensors will return to idle. If the turn signal is still high, the proximity reading process will repeat again.
Once the Helmet HUD Module receives the proximity analysis, the Helmet HUD Arduino will determine which visual display will need to output the data. Using u8glib, the Helmet HUD Arduino will then draw the proximity analysis data onto the correct visual display. If the oncoming obstacle is an immediate danger to the motorcyclist, the Helmet HUD Arduino will trigger an audio response from the audio amplifier. After displaying the information, the Helmet HUD Module will sit in idle waiting for more proximity data analysis from the Bike-Mounted Module.

104
6 PROJECT PROTOTYPE CONSTRUCTION AND CODING
Section 6 documents the integration of smaller components to create subsystems. These subsystems are tested on a breadboard and are eventually combined together to create an initial prototype. The final coding plan documents all software components that make up the entire Smart Helmet project. These software components will be running on the two Arduinos, one that is a part of the Bike-Mounted Interface Module and one that is a part of the HUD Module.
6.1 INTEGRATED BREADBOARD TEST
The following subsections document the testing of smaller subsystems on a breadboard. The integrated breadboard test is done to ensure no faulty parts were issued to the Smart Helmet team and that each subcomponent is capable of functioning in a greater system. The integrated breadboard also serves as a test to verify the design did not have any short or open circuits.
6.1.1 BATTERY CHARGER
The battery charger circuit using the MCP73831-2 was constructed, using the simulated circuit from Figure 29 as a reference, and shown below in Figure 38. A battery pack was connected and charged from 3.7V to 4.2V. The graphic data of charge over time can be seen in Figure 39. As the charge of the battery increased, input of current of the charger remained at a relatively constant 400 mA. Once the charge reached 95% of the maximum charge, the input current automatically dropped gradually, in order to prevent possible over-charge, ensuring no damage to the battery.
FIGURE 38: CONSTRUCTED MCP73831 BATTERY CHARGING CIRCUIT

105
FIGURE 39: MCP73831-2 CHARGING A 4.2V BATTERY OVER TIME
6.1.2 AUDIO AMPLIFIER
The LM386 Low-Voltage audio amplifier circuit was constructed, using the simulated circuit in Figure 27 as a reference. Audio gain reflected that of the simulated test. Heavy audio distortion did occur when DC gain voltage was below 9V. Further modifications to the circuit can possibly improve this to the point where a single tone, at the right frequency, can be heard very clearly with no fuzz or crackling of the audio. Ideal amplification and sound clarity occurred with a 12V DC gain voltage. The speaker in the Figure 40 is merely a speaker used to test the circuit.
After further design improvements, it was decided that the built in audio amplifier of the Arduino was sufficient enough to avoid using this audio amplifier at all. The final design includes a small digital oscillator speaker that uses very low power, but still emits a loud enough tone for the rider to hear in traffic.

106
FIGURE 40: CONSTRUCTED LM386 LOW-VOLTAGE AUDIO AMPLIFIER
6.1.3 VOLTAGE REGULATOR
The LM7805 Voltage regulator circuit was constructed, as shown below in Figure 41, using the simulated circuit in Figure 26 as a reference. A 12V DC input was placed at the input. R1 was measured to be 427.2 Ohms, and R2 was varied. Results of the output versus the input can be seen below in table 14. Results of the output very closely matched that of the simulated circuit.
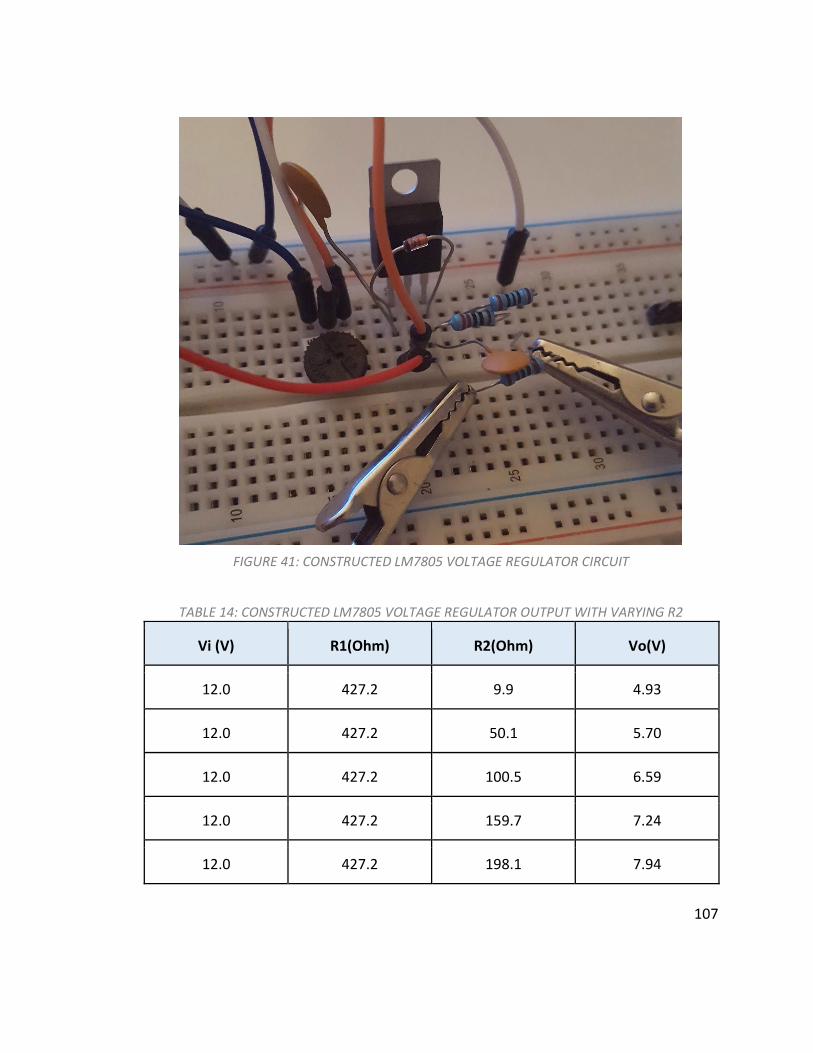
107
FIGURE 41: CONSTRUCTED LM7805 VOLTAGE REGULATOR CIRCUIT
TABLE 14: CONSTRUCTED LM7805 VOLTAGE REGULATOR OUTPUT WITH VARYING R2
Vi (V) R1(Ohm) R2(Ohm) Vo(V)
12.0 427.2 9.9 4.93
12.0 427.2 50.1 5.70
12.0 427.2 100.5 6.59
12.0 427.2 159.7 7.24
12.0 427.2 198.1 7.94

108
6.1.4 PROXIMITY SENSOR
Figure 42 shows the initial proximity sensor testing that was performed. This test was completed with the LV-MaxSonar -EZ1 MB1010 proximity sensor, an Arduino Uno, and a 128x64 resolution OLED visual display. The sensor is powered via +5V from the Arduino. The analog output pin 3 is also connected so that the microcontroller may receive analog ranging data. The distance information that is received by the Arduino is displayed in inches, but can be converted to a different unit by the MCU.
FIGURE 42: CONSTRUCTED LV-MAXSONAR -EZ1 MB1010 CIRCUIT
Figure 43 is a visual representation of the accuracy of the LV-MaxSonar -EZ1 MB1010 proximity sensor. Using an object that has the similar shape to that of an oncoming automobile, we were able to determine how accurate the sensor was at varying distances away. The accuracy of the sensor was determined by comparing how many correct distance measurements the sensor was able to take versus the number of incorrect measurements. A measurement would be considered incorrect if the reported distance did not match the actual distance of the object.
FIGURE 43: DISTANCE VS. ACCURACY FOR MB1010 PROXIMITY SENSING

109
6.2 PCB VENDOR AND ASSEMBLY
Once we have completed all breadboard testing, and our design is finalized, we will be using Elecrow for our PCB assembly. In order to produce a PCB, Elecrow requires PCB Gerber Files, a Bill of Materials, Quantity and PCB spec, as well as Parts mapping for soldering with parts machine, or a simple mapping for hand soldering, any specific requirements, or some reminders to avoid mistakes. Once all details are submitted, the PCB will be completed in 3~5 days after the order is confirmed, with an extra 1~2 days for shipping. For cost, PCB fabrication is about $20, PCB assembly is about $2, Engineer Start is $10, and an additional charge is added for any components that must be purchased by Elecrow. Overall, a completed PCB will cost between $35 - $40.
The PCB prototype will likely be drawn out using Eagle PCB Design. Fritzing is another possible alternative. First, we will be prototype breadboard and fully test them all out together on the bike. Once all systems are working as they should, PCB design and manufacturing will begin. A few other PCB developers are being considered (apcircuits, scl, 4pcb), but we are likely going with Elecrow for fast assembly time and low cost.
6.3 FINAL CODING PLAN
For each subsystem in the design, all hardware components will be tested using the applicable Arduino microcontroller. Using the Bike-Mounted Module MCU, the proximity sensors and Bluetooth transmitter will be tested. Using the Helmet HUD Module MCU, the visual display and Bluetooth receiver will be tested. To support this testing, different parameters, delays, and various values will be used in software.
The proximity sensors will initially be tested individually to ensure functionality. This will be accomplished in software by taking an analog reading and applying the correct scale factor. Once the individual sensors have all been tested, the daisy chain configuration will undergo similar testing. The simplest method of testing is to connect each sensor in the series to it’s own analog pin. Once connected, an analog reading will be taken for each pin in the series. The appropriate scale factor will be applied and the resulting distance will be converted into feet.
Once the distance data has been verified to be accurate, the Bluetooth transmitter and receiver will be tested to ensure valid wireless communication between microcontrollers, and to ensure that the visual display is properly displaying the correct data.
110
7 PROJECT PROTOTYPING TESTING PLAN
The following subsections in Section 7 document the testing plan for the initial prototype. The testing will be split up into hardware and software testing. The testing environments for both hardware and software will be discussed before breaking down the prototype into subsystems and subcomponents. Each subcomponent will be tested individually before being integrated into a subsystem. After all subsystems pass testing, they will be incorporated to create the entire Smart Helmet prototype that will be tested thoroughly.
7.1 HARDWARE TEST ENVIRONMENT
Testing for hardware components will be done in two different environments. The first environment will be enclosed, while the second one is outdoors. We needed to test in both indoor and outdoor locations due to the nature of the hardware we are testing. Because the hardware will be used outside, testing needed to be done at a realistic setting.
The first environment will be an enclosed, indoor area where there are no active weather conditions. The temperature inside this area will be room temperature, which is around 72° F. This first environment will be to ensure that the received hardware has no defects or other miscellaneous faults that could skew subsequent testing results. Initial testing is done to ensure that our circuits were designed correctly and to our liking before field-testing.
The second testing environment will be outside so that we are able to test more comprehensive pieces of the final design. The system will be tested during a sunny day, without any hazardous weather conditions. Although a motorcycle rider may use the Smart Helmet during any weather conditions, the design will only be tested during a clear sunny day as per the requirement specifications. As long as these conditions are met, we will be able to successfully test our prototypes completely.
7.1.1 MOTORCYCLE TESTING
The motorcycle that is being used for testing the Smart Helmet is a Honda Supersport CB400F 1976. The use of such an antique model of motorcycle is not incompatible because the goal of the Smart Helmet project is to be interface-able with almost any make and model.
This motorcycle provides a helpful amount of interesting edge cases that will help the design of the project be compatible with almost any other motorcycle. One of the most obvious issues is that the vehicle is completely analog in its operation. There are no initial

111
digital computers existent on the bike, which pushes the requirements of the project to account for motorcycle that do not have an on-board computer, or specifically, an On-Board-Diagnostics (OBD) interface.
TABLE 15: HONDA SUPERSPORT CB400F SPECIFICATIONS LIST.
Manufacturer Honda
Production 1976
Model CB400F
Engine 408 cc inline 4-cylinder
Top speed 104 mph
Transmission 6-speed manual
Power 28 kW @ 8500 rpm
Weight 392 lb
The motorcycle is still capable of speeds and operations of a modern motorcycle. The motorcycle has a 408 cc inline four cylinder engine with a 6 speed manual transmission for a max speed of 104 miles per hour.
7.2 HARDWARE SPECIFIC TESTING
The following sections outline how the hardware will be tested for the prototype design. Testing will be done in one or two environments, as detailed in section 7.1. Success conditions must be met for every component in order to ensure full system integration during the final construction.
7.2.1 MCU
Testing the Arduino microcontrollers will be accomplished by ensuring that the loaded program on the boards correctly controls the different elements of the system. Both the Bike-Mounted and helmet controllers will need to be tested to ensure that the system

112
performs the way we want. Both microcontrollers must be able to communicate with each other as well as the different components on the bike from which we are displaying or receiving data.
The Bike-Mounted module will first be tested to ensure that it correctly signals the proximity sensors to start recording and sending distance data. Once this data has been received by the MCU, the on board program must convert the data into a format that is usable. Testing will be considered a success if the MCU can correctly trigger the proximity sensors to start recording and if the MCU is able to correctly receive the sensor data. Next, we must ensure that the MCU can sense when the motorcycle’s turn signals have activated. This testing will be accomplished on the motorcycle that we plan to use for the final demo. Testing will be considered a success if the MCU can correctly identify which turn signal is active. Finally, the Bike-Mounted MCU must be able to transmit valid data to the helmet module. This testing will comprise of sending the converted proximity data over a Bluetooth connection. Testing will be considered a success if the MCU is able to transmit the data that is provided.
The helmet module’s microcontroller must also be tested to ensure complete functionality. Firstly, the MCU must be tested to see if it can accurately receive wireless data sent by the Bike-Mounted module. This wireless data will be received over Bluetooth connection. This testing will be considered a success if the helmet MCU is able to receive valid data. Next, the helmet module must be tested to ensure that it can display visual information to the rider. This will be accomplished by displaying mock data and ensuring that it appears in the way that we want. Testing will be considered a success if the MCU data is displayed appropriately on the visual display.
7.2.1.1 WIRELESS DATA TRANSMISSION
Invalid or corrupted data being transmitted can mislead the driver of the motorcycle to be in a confusing situation. Testing for the wireless transmitters is done to see if the transmitter is programmed correctly, the device is tolerant to being under and overpowered, and how far the two devices can be between each other and still operate correctly.
The initial test to simple know that the communication is working as intended is to have both devices powered on. When both transmitters display a solid red LED light, then it can be concluded that a connection is established. When data is correctly displayed on the Helmet HUD then the conclusion is that the wireless is working as specified. Further tests can be done to extensively test the wireless transmitter specifically.
One of the scenarios tested for the wireless transmission is the range that the two endpoints are capable of being between each other. The single highest concern for

113
wireless transmissions can be the level of noise in the air of the transmissions, so knowing the range that the two endpoints can communicate from while under extreme noise is vital. A test was setup where a third-party high-power wireless transmitter would emit a consistent level of noise on the same frequency that the two devices were communicating one. The transmitters use Bluetooth Low-Power 4.0 which use frequencies around 2.4 GHz. A standard router was used to broadcast a noise signal measuring at 20 dBm (nominal) on the operating frequency. The results are as follows with each sample packet being 10 bytes long at 10 Hz.
TABLE 16: LOSSAGE TEST BASED ON DISTANCE IN HIGH NOISE ENVIRONMENT
Range (feet) Packet Loss
(percent lost per 10 Hz)
3 ft. 0%
6 ft. 0%
10 ft. 5%
15 ft. 8%
20 ft. 30%
30 ft. 60%
The Smart Helmet project will typically be used within 6 feet of each endpoint, so the tests can concluded that our decision of using Bluetooth Low-Energy 4.0 is a valid choice for this project. Even with a percentage of data possibly being lost, the device will still work as intended with up to ~80% percent packet loss.
Another test can be done on the wireless transmitters to test how tolerant the module is to being under and overpowered. A test was conducted where the device was communicating at the specified rate and the voltage was dropped from 5V to 1V for one second. The Bluetooth module is capable of operating between 3.3V and 5V but also has a digital regulator to know when it is over or under powered. During the one second of the voltage being dropped to 1V, the device successfully and safely powered off for the

114
duration of the power shortage. Another test was conducted where a high level of power was used with the device being 12V. Expectedly, the module successfully powered off and operated as a low resistance short for the duration of the overpowering. Because of these two tests we can conclude that the wireless module is safely capable of handling odd fluctuations in power if the issue was to arise.
A final test can be conducted where the device is installed incorrectly to the MCU. Although an edge case, the test proved importance as many modules can be permanently damaged if power is supplied to the incorrect pin. All four pins of the wireless transmitter were installed in a random order to test this concern. Expectedly, the device would not power up unless all four pins are connected correctly and power is delivered to the correct pin. Because of this test we can safely test the module is scenarios where the pin configuration may have to be experimented with without worrying about damaging the component.
7.2.2 PROXIMITY SENSORS
Testing for the proximity sensors will take place both indoors and outdoors. First, we must ensure that the sensors are able to accurately communicate with the Bike-Mounted MCU. This will involve placing objects are varying distances from the sensors and verifying that the sensors are able to detect the varying differences. Firstly, however, we must test to make sure that the sensors can be correctly configured. The sensors need to be configured to use the correct mode of operation, the correct input and output pins, and the right baud rate.
Once it has been confirmed that each sensor is working correctly, we will then daisy chain all the sensor together and test the comprehensive accuracy. Using multiple sensors, we will be able to consolidate the data that is received from each sensor to achieve maximum accuracy. There are several configurations that can be used to connect the sensors, which will have to be tested as well.
Beyond testing the different wiring setups to achieve proper daisy chaining, the angle setups for each proximity sensor must also be tested. The proximity sensors that are daisy chained together must be setup up in such a way that their respective angles relative to where they are mounted on the bike covers a significant width detection range that covers a motorcyclist’s blind spot. The sensor may end up placed on the same level and just tilted at various angles or they may need to be placed at different locations on the bike to cover certain blind spots.

115
7.2.3 POWER SUPPLY
The following subsections detail how the power management systems for the Helmet HUD Module were tested. Testing was completed to ensure full functionality of the hardware component and to ensure that integration will be straightforward. The hardware components detailed in the following sections are vital to the HUD module functionality, so thorough testing is essential.
7.2.3.1 MOTORCYCLE POWER
The hardware testing for the motorcycle power involves gathering readings from the motorcycle battery to ensure that it is outputting 12V. This is done using a multimeter and measuring the voltage output in different environments. Following this, the voltage regulator circuit must be implemented onto the system. Resistor values for R2 need to match the simulated testing resistances and the multimeter must measure the output voltage. If the measured results do not match the expected results from the simulation, the circuit must be fixed or redesigned.
If the multimeter measures the correct voltage readings, the subsystems that receive power from the motorcycle battery can be connected. If the voltage readings from the connected system match the expected simulated results then the motorcycle battery voltage drawing and voltage regulation circuit are functional.
7.2.3.2 SOLAR POWER
The solar power components were tested first to see if they are capable of generating charge and second if they are able to generate sufficient charge. The first test would be placing a dead battery and allow the solar panels to attempt to charge the battery. LEDs could be used to signal battery life. If the solar panels are capable of charging the battery, then the rest of the Helmet HUD Module could be activated. If the solar panels are capable of providing sufficient power without any external charging, then they will be deemed functional for this project. It was concluded that the solar panels can output up to 100mA of current, sufficient enough to battery charging.
7.2.5 VISUAL DISPLAY
The visual display must be tested to ensure complete functionality. A preliminary test was completed by showing the string “Smart Helmet”. By successfully displaying this string, we were confident that the display would work for our needs. The visual display testing can be seen in Figure 44 below.

116
FIGURE 44: VISUAL DISPLAY TESTING
7.3 SOFTWARE TEST ENVIRONMENT
The majority of the software for this project is going to be produced on either the Arduino IDE or Microsoft Visual Studio. Both of these IDE’s are capable of creating, editing, testing, and implementing software on the Arduino Uno. While the Arduino IDE is simpler and more intuitive, Visual Studio offers more in depth features that allow for better testing of certain test requirements.
There will be two physical test environments used to test software, the senior design lab and an outside setting. The senior design lab is an enclosed area that simulates that of a lab test settings, where various testing equipment, constant environment conditions (i.e. temperature), and wide range of availability. This test environment will be used to ensure that the software initial software created has no defects or other miscellaneous errors that could tamper with the subsequent field-testing. The outside setting simulates the environment that the final product will be operating under, limited testing resources, environment ambiguity, and limited peripheral equipment. Both of these settings are required for the software testing of this project because both are capable of solving unique testing requirements to ensure the final project can operate in any and all scenarios.

117
7.4 SOFTWARE SPECIFIC TESTING
The following subsections detail the software testing conditions that the Smart Helmet needs to be tested for. The subsections divide the Smart Helmet into subcomponents and document the testing procedure that may be present for that component. The software will be implemented on the two Arduinos and only the subcomponents that interact with the Arduino will require software and software testing.
7.4.1 ARDUINO
The following subsections detail the software test cases that need to be tested on the Arduino. The Arduinos will be running all of the software for the project and must be tested with each additional component individually and with all of the other components integrated together. Figure 45 shows three components: the Bluetooth transceivers, the proximity sensor, and the visual display integrated with Arduinos. In this testing scenario, two Arduinos are communicating wirelessly via Bluetooth. The first Arduino, left, is recording proximity readings from the proximity sensors, converting the measurement to inches, and transmits the data via Bluetooth to the second Arduino. The second Arduino, right, receives the data and outputs it to the visual display.
FIGURE 45: ARDUINO, BLUETOOTH, PROXIMITY, AND VISUAL DISPLAY TESTING

118
This test scenario simulates how the two subsystems will be working when integrated onto the motorcycle and helmet respectively. The first Arduino will act as the master and perform any and all measurement recordings and unit conversions. The second Arduino will act as the slave and receive data input wirelessly from the motorcycle module and display it to the rider on the visual display mounted on the helmet.
This integrated testing was performed in the senior design lab setting. Not pictured in the figure are data readings, ping requests, and data conversions which were instead displayed on the IDE console. With the console, the testers were able to evaluate each step in the code and were able to pinpoint any and all errors using the debugger and make the necessary adjustments.
7.4.1.1 VISUAL DISPLAY
The following subsection discuss the software test requirements for the visual display. These test requirements must pass individually on just the visual display component alone before the visual display can be integrated into the testing prototype. The current testing requirements are readability and visibility of the data being displayed on the visual display.
7.4.1.1.1 VISIBILITY AND READABILITY
For the software side of the visual display both visibility and readability of the outputs need to be tested. This readability testing will help cater to the design goals and guidelines discussed in the software design goals section. The U8g library offers multiple font and font size settings for any outputted string/text. Different font configurations will need to be tested while the visual display is mounted to determine which fits the need for the current output.
All of the information being displayed needs to be as outputted as large as possible while not being cut off on the limited 128x64 pixel display. Different classes such as setScale2x2, setFont, and drawStr will need to be tested in order to achieve maximum readability while not exceeding our display pixel size. Options such as setScale2x2, which zooms in on the display, gives flexibility when designing the display interface when adjusting font size alone is not enough. The test cases that need to be test include a scenario where there is no threat and a scenario where this maximum threat. The scenario where there is no threat will display little to no output to the user while the maximum threat scenario will display the most output to the user. The text settings will need to be configured so that the output not only fits on the display but also maximizes available space for both scenarios.
On top of testing for an optimal display interface the visual display must be tested while it is changing from one reading to another. There should be almost no overlapping of the

119
output from one reading to the next as that would tamper with the readability of the data. Some ways that this could be implemented would to incorporate a clear screen function that clears the screen before displaying the new data. While in theory this seems possible and beneficial to the user, it must be tested so that it doesn’t unintentionally create a blinking effect when transitioning from scene to scene as blinking should only be used sparingly and for emergency conditions. Other methods of ensuring no overlapping of data need to be tested. This will be tested by feeding the visual display module multiple sets of proximity data and monitoring the timing of when the old data is being removed from the display and the new data is being outputted to the display.
7.4.1.2 PROXIMITY SENSOR
The following subsections discuss the software specific test cases associated with the proximity sensors. The proximity sensors are subject to error because of the ambiguity the scenarios that they will be running in will present. Because of this the software associated with them need to be properly calibrated and be able to adjust and offset the data if/when randomness impacts the measurement readings.
7.4.1.2.1 ACCURACY AND DELAY
When using the proximity sensors, they are subjected to producing an accuracy error. This is because at one instance of a distance measurement, that proximity sensor may not be able to detect the object and will return the maximum distance or they will pick up a faulty object and return an inaccurate distance. Some of this error is negated with proper daisy chaining and angle positioning of the proximity sensors, but the majority of accuracy conservation is implemented in the software design.
Testing out the Pulse-Width mode is a simple way to improve accuracy. This setting will record the width of the pulse instead of a distance measurement, which will then be converted to the proper distance units using a conversion. If this still does not produce accurate and precise enough readings that meet the requirements, a median reading system can be implemented.
This system will use the pulse width or analog reading setting. Instead of taking in one input and process the data to be displayed to the helmet HUD module, the front-facing module will record a series of measurements, sort them from least to greatest, and take the median. Then it will process the median value and transmit it to the helmet HUD module. Using the median will throw out most outlier values that the sensors may pick up. The median and not the mean will be used because mean values are still impacted by outliers. In theory, this process sounds reliable but delay and memory storage begin to
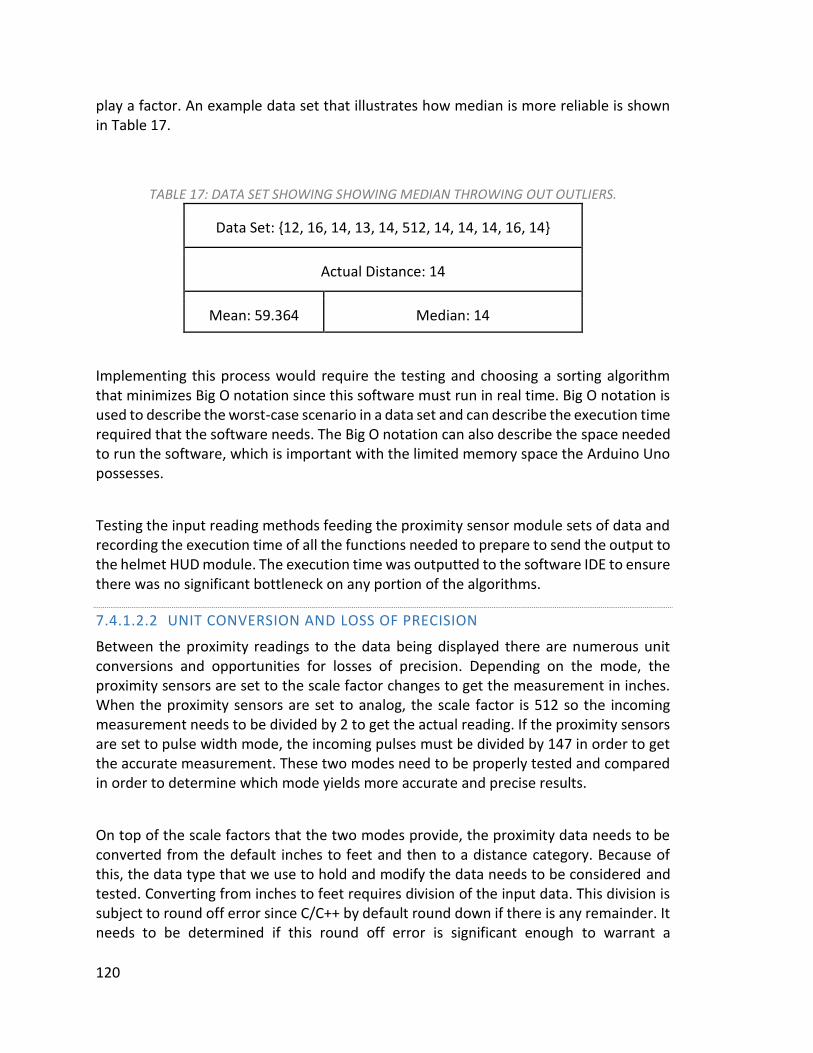
120
play a factor. An example data set that illustrates how median is more reliable is shown in Table 17.
TABLE 17: DATA SET SHOWING SHOWING MEDIAN THROWING OUT OUTLIERS.
Data Set: {12, 16, 14, 13, 14, 512, 14, 14, 14, 16, 14}
Actual Distance: 14
Mean: 59.364 Median: 14
Implementing this process would require the testing and choosing a sorting algorithm that minimizes Big O notation since this software must run in real time. Big O notation is used to describe the worst-case scenario in a data set and can describe the execution time required that the software needs. The Big O notation can also describe the space needed to run the software, which is important with the limited memory space the Arduino Uno possesses.
Testing the input reading methods feeding the proximity sensor module sets of data and recording the execution time of all the functions needed to prepare to send the output to the helmet HUD module. The execution time was outputted to the software IDE to ensure there was no significant bottleneck on any portion of the algorithms.
7.4.1.2.2 UNIT CONVERSION AND LOSS OF PRECISION
Between the proximity readings to the data being displayed there are numerous unit conversions and opportunities for losses of precision. Depending on the mode, the proximity sensors are set to the scale factor changes to get the measurement in inches. When the proximity sensors are set to analog, the scale factor is 512 so the incoming measurement needs to be divided by 2 to get the actual reading. If the proximity sensors are set to pulse width mode, the incoming pulses must be divided by 147 in order to get the accurate measurement. These two modes need to be properly tested and compared in order to determine which mode yields more accurate and precise results.
On top of the scale factors that the two modes provide, the proximity data needs to be converted from the default inches to feet and then to a distance category. Because of this, the data type that we use to hold and modify the data needs to be considered and tested. Converting from inches to feet requires division of the input data. This division is subject to round off error since C/C++ by default round down if there is any remainder. It needs to be determined if this round off error is significant enough to warrant a

121
float/double data type to contain/modify the proximity data. The argument against using one of these two types is that they require more memory storage, which is already limited on the Arduino.
7.4.1.2.3 CONSOLIDATING MULTIPLE READINGS
One method already discussed of improving the accuracy of the proximity measurements is to use multiple sensors in one reading. This as discussed earlier, would involve chaining the sensors together and running them either simultaneously or subsequently of each other in a short time period. This will produce multiple readings results from different angles and distances in the hopes of covering more area.
The downside of using this design implementation is that while it has the potential for a higher measurement area it exposes more error risk that must be covered by the software. The Arduino will now take in multiple readings from different pins and must identify the correct readings via an algorithm. Different algorithm that modify and select the proper measurement distance must be thoroughly tested in first the lab setting and then in the outside setting to confirm accurate readings.
One variable that must be properly tuned is the distance offset that each sensor creates when mounted in different locations. This offset must be measured on the bike and hard-coded on the software as a either global variables or definitions. The other main testing requirement is testing the algorithm that chooses the correct reading. After adjusting the readings using the offset discussed above, an algorithm will run that will choose as the most accurate/most dangerous readings and use that as the reading that will be displayed.
One of the algorithms that can be tested is simply choosing the readings that returns the smallest distance. If the sensors are positioned in such angles that only the blind spot is being measured, then the smallest reading should, theoretically, indicate how close the oncoming vehicle or threat truly is. If simply choosing the smallest distance measured produces skewed results in the testing sessions other algorithms will need to be developed in order to produce results that meet the performance requirements stated for this project.
7.4.1.3 BLUETOOTH COMMUNICATION

122
Bluetooth communication acts very similar to a standard network connection but is unable to guarantee data packet delivery. Since data cannot be guaranteed over a wireless network, certain methods must be implemented so that lost messages cannot interfere with the functionality of the device.
As explained in the software design sections of this document, there is a method in place to trace a packet’s delivery status so that partial packets will not be counted. A test could be run where purposely fractured packets would be sent to acknowledge that packets are being received properly. In Table 18 below, the Buffer row shows the status of the buffer for each sequence of bytes that are received.
TABLE 18: SEQUENCE OF PARTIAL PACKETS BEING RECEIVED
At Sequence 1 the header for packet ‘A’ is received, so the buffer prepares an array of 3 bytes. Sequence 2 and 3 are two bytes of packet A being received. Sequence 4 is when a byte of packet B is received without a header. Because packet B is not preceded by a header the data is discarded and the buffer is reset. Sequence 6 through 9 is a normal retrieval of packet sequence C.

123
8 ADMINISTRATIVE CONTENT
For this project, our group has created a list of milestones to be achieved throughout the design. By completing the tasks on time, we will be able to stay on task and ensure that the project is completed in a timely manner. The milestones created for this project cover the construction, testing, and final presentation of the project.
8.1 MILESTONE DISCUSSION
The milestones in Table 19 show who is responsible for each task, and when that specific task should be completed by. To measure the progress of our project, we focused on capturing the start and finish points of every task, and nothing in between. This method was implemented because each task’s work estimations were not initially available. Using this start to finish technique, a percentage of progress was gained when a task would start and when it is completed.
TABLE 19: INITIAL MILESTONES FOR SENIOR DESIGN 1 (PART 1)
# Task Responsible Start End Status
1 Ideas Group 8/22/16 8/26/16 ✓
2 Project Selection Group 8/30/16 9/2/16 ✓
3 Role Assignment Group 9/6/16 9/8/16 ✓
Project Report
4 Divide And Conquer Group 9/6/16 9/9/16 ✓
5 Table Of Contents Group 10/4/16 11/4/16 ✓
6 Final Document Group 10/4/16 12/6/16 ✓
Research
7 Motorcycle Computer Interpreter
Julian Bonnells 9/6/16 11/25/16 ✓

124
TABLE 20: INITIAL MILESTONES FOR SENIOR DESIGN 1 (PART 2)
8 Bike Interfacing Blake Scherschel 9/6/16 11/25/16 ✓
9 Display Method Selection Blake Scherschel 9/6/16 11/25/16 ✓
10 Wireless Transmitter/Receiver Blake Scherschel 9/6/16 11/25/16 ✓
11 Object Proximity Tracking Jorge De Gouveia 9/6/16 11/25/16 ✓
12 Helmet Display Output Julian Bonnells 9/6/16 11/25/16 ✓
13 Proximity Visual Alert Jorge De Gouveia 9/6/16 11/25/16 ✓
14 Battery Charger Jeremy Reimers 9/6/16 11/25/16 ✓
15 Solar Panel Jeremy Reimers 9/6/16 11/25/16 ✓
16 Helmet Battery Voltage Regulator
Jeremy Reimers 9/6/16 11/25/16 ✓
17 Motorcycle Battery Voltage Regulator
Jeremy Reimers 9/6/16 11/25/16 ✓
18 Audio Amplifier Jeremy Reimers 9/6/16 11/25/16 ✓
Design
19 Order Parts Group 10/1/16 11/18/16 ✓
20 Preliminary Testing with Breadboard
Group 11/19/16 12/1/16 ✓
21 Finalize Breadboard Test Group 12/7/16 1/31/17 x
22 Finalize Code Group 1/1/17 2/25/17 x
23 Design and Order PCB Group 2/1/17 3/1/17 x

125
TABLE 21: INITIAL MILESTONES FOR SENIOR DESIGN 2 # Task Responsible Start End Status
Implementation 24 Build Prototype Group 2/25/17 3/25/17 x 25 Test Prototype Group 3/1/17 4/1/17 x 26 Redesign (If applicable) Group 3/15/17 4/15/17 x 27 Finalize Prototype Group 3/30/17 4/30/17 x 28 Final Presentation Group TBD TBD x
Unfortunately, not all milestones for the design and testing portion were completed on time by the set deadlines. However, this is true for most projects of this caliber. Although the template was in place, external conflicts caused some tasks to be completed at different times than intended.
We have decided that the working design prototype should be completed no later than April, to give us ample time to redesign, if necessary, and add additional features. We are confident that we can meet all of these milestones and create a working prototype on time.
8.2 BUDGET AND FINANCE DISCUSSION
In order to create a product that can provide for consumer needs, as well as being affordable to the consumer, design and manufacturing costs must stay low. The only competing company right now has their product available for retail at around $500. To compete with this, we can either design a simpler product for less, an equal product at similar price point, or a better product for more. Our goal is to create a simpler product for less, so that even the consumer on a budget can have more safety on the road.
In order to keep costs low, power efficiency must be high, and cheap, yet reliable, components must be utilized to the best of their ability. Proximity sensors and a helmet display are the two most expensive pieces of equipment in our design. Research is being done to find sensors that fit our constraints for no more than $75. They will need to sense objects in at least a 20ft range, with 90% accuracy, in most weather conditions. The helmet display is going to have to be either small enough, or transparent enough, to allow for maximum visibility by the rider, while also being visible enough to be usable. It will also need to be bright enough to be seen in daylight, while keeping power consumption to a minimum. Our target cost for the display is $75.

126
PCB design will need to be done by a reputable manufacturer, but also for cheap. If we begin mass production of the smart helmet, all costs, especially PCB costs will fall, but as for the testing and design phase, cost is going to be high. Lots of testing through breadboards will be done prior to PCB design in order to ensure we get it right the first time. Most other costs will vary, but variation with be mostly negligible due to the individual components being very cheap. A $50 overhead is in the budget for unplanned expenses, though we will try to stay close to our individual component costs. A full rundown of component costs can be seen in Table 22.
TABLE 22: APPROXIMATE PROJECT BUDGET
Proximity Sensors $240
Wireless $30
Helmet Visor Display $20
Voltage Regulators $10
Battery charger $5
Solar Panel $10
Battery $5
Helmet $25
PCBs $40
Miscellaneous $50
Total $435

127
8.3 BILL OF PARTS PURCHASED
Summary of all purchased parts to be tested for the final product. Some parts will not be used in the final product design, but were purchased simply for a comparison of which would better meet our design specification. All parts are pictured as well in Figures 46 and 47 below.
TABLE 23: BILL OF PARTS
Part Part Number Quantity Price per unit Running Total
Micro USB Female B Type Port A1612 4 $0.74 $2.96
Breadboard N/A 3 $0.99 $5.93
Breadboard wires N/A 1 $6.00 $11.93
Miscellaneous Electronics N/A 1 $12.86 $24.79
Solar Panel, 5V 40mA N/A 4 $1.12 $29.27
Solar Panel, 3V 120mA N/A 4 $1.99 $37.23
Battery Charging Controller MCP73831T 10 $0.12 $38.43
Voltage Regulator, 5V LM7805 10 $0.32 $41.63
Voltage Regulator, 12V LM7812 10 $0.30 $44.63
Audio Amplifier LM386 10 $0.50 $49.63
Proximity Sensor, LV-MaxSonar MB1010 2 $30.00 $109.63
Proximity Sensor, SMT 6500 615078LF 2 $33.95 $177.53
Visual Display FZ1112 2 $9.99 $197.51
Arduino Uno Microcontroller EL-CB-001 2 $9.99 $217.49
Wireless Bluetooth Module JL-07X3-001 2 $12.89 $243.27
Fortunately, we were able to avoid having to spend the entire amount listed in Table 23 because we had various components already. The Arduino microcontrollers and the various electronics were already owned, saving on total cost. Additionally, we were able to use other hardware not listed in Table 23 to test the various hardware. For microcontrollers, we were able to test with a Raspberry Pi 2 and an MSP430, components that we owned from previous projects.

128
FIGURE 46: PURCHASED ITEMS (PART 1)
FIGURE 47: PURCHASED ITEMS (PART 2)

129
9 CONCLUSION
The goal of the Smart Helmet project is to significantly increase safety and awareness for motorcycle drivers. With an accessible and convenient way for drivers to stay aware of their blind spots, the Smart Helmet will be a vital asset for any motorcyclist interested in adding a blanket of safety while on the road. While not intended to be a replacement for any existing road safety practices, the Smart Helmet gives drivers an added assurance of safety.
The Smart Helmet team spent the majority of their time researching and designing a system that was capable of performing accurate proximity readings and communicating to its subsystems with minimal delay. The limited budget proved to be the limiting reagent to this project. The cheaper proximity sensors unfortunately did not have the wide angle reading that was required by the requirements. Because of this, the Smart Helmet team had to design a daisy-chain solution that used multiple proximity sensors for each blind spot. As the implementation process continues into next semester, the Smart Helmet team will need to focus on developing an accurate proximity measurement algorithm that will take in multiple proximity sensor measurements and consolidate them into one final measurement.
From this project, the Smart Helmet team has learned how to incorporate smaller subsystems into one greater project. Concepts such as power management, wireless communication, visual displays, and proximity sensor readings were all researched and implemented from scratch. On top of the engineering aspects learned, the Smart Helmet team gained valuable communication and teamwork skills that will be valuable in the future.
Moving forward, the Smart Helmet team plans to adhere to the milestone schedule discussed in the previous section. If the Smart Helmet team is able to properly create a working model ahead of schedule they can attempt to incorporate bonus features such as a Global Positioning System (GPS) device to include navigation data to the user, a live visual feed so the user can see what is behind them, and a brightness dimmer so that the use can dim or brighten the visual display.

130
APPENDICES
APPENDIX A - COPYRIGHT PERMISSIONS

131

132

133
APPENDIX B - DATASHEETS
LV-MaxSonar -EZ Series http://maxbotix.com/documents/LV-MaxSonar-EZ_Datasheet.pdf SensComp SMT 6500 Ranging Module http://www.senscomp.com/pdfs/6500-ranging-modules-spec.pdf LIDAR-Lite v3 http://static.garmin.com/pumac/LIDAR_Lite_v3_Operation_Manual_and_Technical_Specifications.pdf Sharp GP2Y0A02YK0F https://www.sparkfun.com/datasheets/Sensors/Infrared/gp2y0a02yk_e.pdf MCP73831/2 Li-Ion Battery Charger https://www.sparkfun.com/datasheets/Prototyping/Batteries/MCP73831T.pdf

134
Selecting the Right Battery System for Cost-Sensitive Portable Applications http://ww1.microchip.com/downloads/en/AppNotes/01088a.pdf Life Cycle Impacts of Alkaline Batteries with a Focus on End-Of-Life http://www.epbaeurope.net/documents/NEMA_alkalinelca2011.pdf SSD1306 Visual Display https://cdn-shop.adafruit.com/datasheets/SSD1306.pdf
APPENDIX C – SOFTWARE
Universal Graphics Library (monochrome OLEDs and GLCDs) https://github.com/olikraus/u8glib NewPing Proximity Sensor Library http://playground.arduino.cc/Code/NewPing Arduino IDE https://www.arduino.cc/en/Main/Software Microsoft Visual Studio https://www.visualstudio.com/vs/ Eagle PCB Design https://cadsoft.io/ NI Multisim http://www.ni.com/multisim/
WORK CITED Tsantilas, Spiros. "BMW Shows Motorcycle Helmet Head-up Display." New Atlas. N.p.,
5 Jan. 2016. Web. 25 Nov. 2016. "SKULLY AR-1 The World's Smartest Motorcycle Helmet." Indiegogo. SKULLY Systems,
12 Apr. 2014. Web. 10 Nov. 2016. "The First HEAD-UP DISPLAY For Your Motorcycle Helmet." Kickstarter. NUVIZ, 18 Aug.
2013. Web. 15 Oct. 2016. "BIKEHUD Is the First Augmented Vision Product Developed Specifically for
Motorcyclists." Bike-Hud. Motorcycle Information System Technologies Ltd, 1 Jan. 2015. Web. 10 Oct. 2016.

135
Kamtekar, K. T., Monkman, A. P. and Bryce, M. R. (2010), Recent Advances in White
Organic Light-Emitting Materials and Devices (WOLEDs). Adv. Mater., 22: 572–582. doi:10.1002/adma.200902148
"Monitor LED Backlighting." Monitor LED Backlighting. N.p., n.d. Web. 06 Dec. 2016. Collings, N. (2011). "The Applications and Technology of Phase-Only Liquid Crystal on
Silicon Devices". IEEE Journal of Display Technology. 7 (3): 112–119. doi:10.1109/JDT.2010.2049337.
"Bluetooth Radio Interface, Modulation & Channels". Radio-Electronics.com. "Motorcycles." . | National Highway Traffic Safety Administration (NHTSA). N.p.,
o n.d. Web. 12 Nov. 2016. "Ultrasonic Distance Sensor." Arduino-info - Ultrasonic Distance Sensor. N.p.,
o n.d. Web. 14 Nov. 2016. "Ultrasound." Sensors:ultrasound · SensorWiki.org. N.p., n.d. Web. 02 Nov.
o 2016. Bell, Rob. "A Beginner's Guide to Big O Notation." A Beginner's Guide to Big O
o Notation - Rob Bell. N.p., 23 June 2009. Web. 06 Nov. 2016. "Light Detection and Ranging." Light Detection and Ranging. National Oceanic
o and Atmospheric Administration, 15 Apr. 2011. Web. 19 Oct. 2016. "How Does LiDAR Work?" Lidar-uk.com. LiDAR, n.d. Web. 18 Oct. 2016. "Choosing an Ultrasonic Sensor for Proximity or Distance Measurement Part 1:
o Acoustic Considerations." Choosing an Ultrasonic Sensor for Proximity or o Distance Measurement Part 1: Acoustic Considerations | Sensors. Sensors
Online, 1 Feb. 1999. Web. 18 Oct. 2016.
"Introduction to Sound." Introduction to Sound. NDT Resource Center, n.d. Web. o 18 Oct. 2016.
"Ultrasonic Sensing." Sensors - Ultrasonic Sensing. Rockwell Automation, n.d. o Web. 19 Oct. 2016.

136
"Number of Registered U.S. Motorcycles by State 2014 | Statistic." Statista. N.p., o n.d. Web. 20 Nov. 2016.
"Highway Statistics 2015 - Policy | Federal Highway Administration." Highway Statistics 2015 - Policy | Federal Highway Administration. U.D. Department of Transportation Federal Highway Administration, 2015. Web. 20 Nov. 2016.
"Table 1-11: Number of U.S. Aircraft, Vehicles, Vessels, and Other Conveyances |
Bureau of Transportation Statistics." Table 1-11: Number of U.S. Aircraft, Vehicles, Vessels, and Other Conveyances | Bureau of Transportation Statistics. United States Department of Transportation, n.d. Web. 21 Nov. 2016.
Barrett, Rick. "Harley-Davidson Seeks to Meet Changing Demographics."
Harley-Davidson Seeks to Move Throttle to Meet Changing Demographics. Journal Sentinel, 21 Mar. 2015. Web. 21 Nov. 2016.
Edge, Dirck. "J.D. Power Study: U.S. Motorcycle Riders Aging, and Leaving
Market." Motorcycle Daily. N.p., 16 Dec. 2010. Web. 21 Nov. 2016. "Motorcycle Helmet Use." Motorcycle Helmet Use. IIHS HLDI, Dec. 2016. Web. 3
Dec. 2016. "What Is Agile? What Is Scrum?" CPrime. N.p., 15 July 2016. Web. 3 Dec. 2016. Smith, Sidney L., and Jane N. Moiser. "GUIDELINES FOR DESIGNING USER
INTERFACE SOFTWARE." (n.d.): n. pag. The MITRE Corporation, Aug. 1986. Web. 2 Dec. 2016. <http://www.dfki.de/~jameson/hcida/papers/smith-mosier.pdf>.
Shneiderman, Ben. "Ben Shneiderman." The Eight Golden Rules of Interface
Design. University of Maryland, n.d. Web. 06 Dec. 2016. <https://www.cs.umd.edu/users/ben/goldenrules.html>.
"Measures of Central Tendency." Mean, Mode and Median - Measures of Central Tendency - When to Use with Different Types of Variable and Skewed Distributions | Laerd Statistics. Laerd Statistics, n.d. Web. 03 Dec. 2016. <https://statistics.laerd.com/statistical-guides/measures-central-tendency-mean-mode-median.php>.