Small Wind Power Plants Energy Engineering and Management
110
Small Wind Power Plants Feasibility Study Viktor Kádek Thesis to obtain the Master of Science Degree in Energy Engineering and Management Supervisor: Prof. Rui Manuel Gameiro de Castro Examination Committee Chairperson: Prof. Duarte de Mesquita e Sousa Supervisor: Prof. Rui Manuel Gameiro de Castro Member of the Committee: Dr. António Luiz Moura Joyce November 2017
-
Upload
khangminh22 -
Category
Documents
-
view
2 -
download
0
Transcript of Small Wind Power Plants Energy Engineering and Management

Small Wind Power PlantsFeasibility Study
Viktor Kádek
Thesis to obtain the Master of Science Degree in
Energy Engineering and Management
Supervisor: Prof. Rui Manuel Gameiro de Castro
Examination Committee
Chairperson: Prof. Duarte de Mesquita e SousaSupervisor: Prof. Rui Manuel Gameiro de Castro
Member of the Committee: Dr. António Luiz Moura Joyce
November 2017

ii

Dedicated to my son Antoni, who was born during work on this thesis, and my wife Daria, who provided
me her endless support.
iii

iv

Acknowledgments
This master thesis is based on work conducted within the InnoEnergy Master’s School, in the MSc pro-
gramme Clean Fossil and Alternative Fuels Energy. This program is financially supported by InnoEnergy,
and its partners, especially the Instituto Superior Tecnico in Lisbon, Portugal and Silesian University of
Technology based in Gliwice, Poland. The author of this work was also receiving a scholarship from
InnoEnergy, which is gratefully recognised.
In the first place, I would like to express my honest gratitude to my IST supervisor – Prof. Rui Castro
for his continuous support and valuable pieces of knowledge which he carefully provided during all the
work and for his willingness to respond to numerous e-mails of me.
I also owe my sincere thanks like to thank Dr Krzysztof Pikon – my supervisor and InnoEnergy
programme coordinator at SUT in Poland. Dr Pikon gave us unreplaceable support and valuable lessons
for our professional and personal lives.
My gratitude also belongs to my two colleagues from CEZ Group, Mr. Roman Tusl and Mr. Marek
Karhan, for revealing their valuable years of experience, which helped me to profile the work into objec-
tive and realistic scope within the Czech Republic.
I thank the InnoEnergy officials for giving me these memorable years full of an extraordinary expe-
rience and knowledge which opened the doors of opportunities for me and allowed me to enter into
professional career successfully.
Furthermore, my appreciation belongs also to all professors in Gliwice and Lisbon for their knowledge
and skills that they have been passing on me during the recent years.
I also want to acknowledge my friends and classmates from all over the world I got to know during
InnoEnergy studies and for shaping my life and supporting me when I needed it the most.
Finally, I would love to thank my parents and my beloved wife for their endless support, motivation
and patience during the nights that I spent studying and writing academic works.
v

vi

Resumo
Esta dissertacao estuda a viabilidade da instalacao de pequenas turbinas eolicas domesticas para
aplicacoes de pequena e media potencia, como, por exemplo, quintas, pequenas industrias, ou bairros
residenciais na Republica Checa.
Na primeira parte, e estudada a situacao energetica atual na Republica Checa e comparada com
a situacao em Portugal. Posteriormente, sao aprofundadas, tanto as condicoes climaticas, como os
requisitos legais relativamente a energia eolica e as correspondentes polıticas de apoio e suporte para
geracao domestica, na Republica Checa.
Na segunda parte, e focada a simulacao e otimizacao da instalacao de energia renovavel para uma
quinta de producao de produtos lacteos. Neste estudo, sao avaliados 4 cenarios. para um perıodo de 30
anos. Primeiramente, aborda-se a solucao ligada a rede de distribuicao, usando geracao eolica como
fonte interna de geracao. (ambos com e sem polıticas de suporte). Na segunda variante, e estudada
a solucao isolada da rede de distribuicao, contendo geracao eolica, paineis fotovoltaicos, gerador AC
e baterias (mais uma vez, com e sem polıticas de suporte). Finalmente, sao comparados todos os
resultados com o abastecimento atraves da rede tradicional AC, sem o uso de energias renovaveis.
O cenario que conduz a um melhor indicador de avaliacao economica e a solucao isolada da rede,
com polıticas de suporte. Contudo, o abastecimento atraves da rede tradicional AC e ainda mais barato.
Ainda assim, e revelado que as polıticas de suporte sao ainda cruciais para este tipo de instalacoes e
afetam significativamente os resultados economicos de todo o projeto.
Palavras-chave: energia renovavel, turbina eolica, subsıdios, viabilidade, simulacao
vii

viii

Abstract
This thesis studies feasibility of installing small domestic wind turbines for objects of small to medium
power consumption, like for instance farms, smaller manufacturers, or neighbourhoods in the scope of
the Czech Republic. In the first part, the paper reviews current energy situation of the Czech Republic
and compares to the one in Portugal. Thereafter, the climate conditions and legal requirements are stud-
ied in more detail, with respect to the wind energy and subsidies policies for domestic wind generation
in the Czech Republic.
In the second part, this work focuses on simulation and optimisation of renewable energy instalment
for a model dairy farm. For a study period of 30 years, we evaluate four scenarios altogether. Firstly, a
grid-connected solution using wind generation and electricity injections from a distribution grid (both with
and without subsidies). Additionally, in the grid-connected variant, we will assess the economic feasibility
of adding batteries in such an installation, with the constraint of maximum 5 % of allowed unmet load
(which will be injected from the grid). The second variant simulates an off-grid instalment with wind
generation, photovoltaics, AC generator and batteries (again, with and without subsidies). Finally, we
compared all the results with a traditional AC grid connection without using renewables.
The best scenario was the off-grid solution with subsidies. However, traditional AC grid was still a
bit more efficient. Furthermore, we reveal that subsidies are still crucial for such instalments and can
significantly affect the economic results of the whole project.
Keywords: renewable energy, wind turbine, subsidies, feasibility, simulation
ix

x

Contents
Acknowledgments . . . . . . . . . . . . . . . . . . . . . . . . . . . . . . . . . . . . . . . . . . . v
Resumo . . . . . . . . . . . . . . . . . . . . . . . . . . . . . . . . . . . . . . . . . . . . . . . . . vii
Abstract . . . . . . . . . . . . . . . . . . . . . . . . . . . . . . . . . . . . . . . . . . . . . . . . . ix
List of Tables . . . . . . . . . . . . . . . . . . . . . . . . . . . . . . . . . . . . . . . . . . . . . . xiii
List of Figures . . . . . . . . . . . . . . . . . . . . . . . . . . . . . . . . . . . . . . . . . . . . . xv
Nomenclature . . . . . . . . . . . . . . . . . . . . . . . . . . . . . . . . . . . . . . . . . . . . . . xvii
Glossary . . . . . . . . . . . . . . . . . . . . . . . . . . . . . . . . . . . . . . . . . . . . . . . . xix
1 Introduction 1
1.1 Motivation . . . . . . . . . . . . . . . . . . . . . . . . . . . . . . . . . . . . . . . . . . . . . 1
1.2 Topic Overview . . . . . . . . . . . . . . . . . . . . . . . . . . . . . . . . . . . . . . . . . . 2
1.3 Objectives . . . . . . . . . . . . . . . . . . . . . . . . . . . . . . . . . . . . . . . . . . . . . 3
1.4 Thesis Outline . . . . . . . . . . . . . . . . . . . . . . . . . . . . . . . . . . . . . . . . . . 4
2 Energy in the Czech Republic 5
2.1 Basic Economy of the Czech Republic . . . . . . . . . . . . . . . . . . . . . . . . . . . . . 6
2.2 Power System Structure in the Czech Republic . . . . . . . . . . . . . . . . . . . . . . . . 7
2.2.1 Transmission System . . . . . . . . . . . . . . . . . . . . . . . . . . . . . . . . . . 7
2.2.2 Distribution System . . . . . . . . . . . . . . . . . . . . . . . . . . . . . . . . . . . 8
2.2.3 Energy Market and Market Coupling . . . . . . . . . . . . . . . . . . . . . . . . . . 10
2.3 Energy Composition of the Czech Republic . . . . . . . . . . . . . . . . . . . . . . . . . . 11
2.3.1 Total Primary Energy Supply . . . . . . . . . . . . . . . . . . . . . . . . . . . . . . 11
2.3.2 Power Mix . . . . . . . . . . . . . . . . . . . . . . . . . . . . . . . . . . . . . . . . . 13
2.3.3 GHG Emissions . . . . . . . . . . . . . . . . . . . . . . . . . . . . . . . . . . . . . 14
2.3.4 Public Opinion . . . . . . . . . . . . . . . . . . . . . . . . . . . . . . . . . . . . . . 16
2.3.5 Future Projections . . . . . . . . . . . . . . . . . . . . . . . . . . . . . . . . . . . . 18
3 Conditions for Wind Power in the Czech Republic 21
3.1 Climate Conditions . . . . . . . . . . . . . . . . . . . . . . . . . . . . . . . . . . . . . . . . 22
3.1.1 Energy from Wind . . . . . . . . . . . . . . . . . . . . . . . . . . . . . . . . . . . . 22
3.1.2 Wind Maps . . . . . . . . . . . . . . . . . . . . . . . . . . . . . . . . . . . . . . . . 23
3.2 Non-climate Conditions . . . . . . . . . . . . . . . . . . . . . . . . . . . . . . . . . . . . . 27
xi

3.2.1 Technical Feasibility . . . . . . . . . . . . . . . . . . . . . . . . . . . . . . . . . . . 28
3.2.2 Noise Limits . . . . . . . . . . . . . . . . . . . . . . . . . . . . . . . . . . . . . . . . 29
3.2.3 Protection of Nature . . . . . . . . . . . . . . . . . . . . . . . . . . . . . . . . . . . 31
4 Legislation Processes 35
4.1 Institutions . . . . . . . . . . . . . . . . . . . . . . . . . . . . . . . . . . . . . . . . . . . . 35
4.2 Tools . . . . . . . . . . . . . . . . . . . . . . . . . . . . . . . . . . . . . . . . . . . . . . . . 38
4.2.1 Installations above 10 kW of the nominal power . . . . . . . . . . . . . . . . . . . . 40
4.2.2 Installations under 10 kW of the nominal power . . . . . . . . . . . . . . . . . . . . 42
5 Simulation and optimisation 45
5.1 Simulation Software . . . . . . . . . . . . . . . . . . . . . . . . . . . . . . . . . . . . . . . 46
5.2 Power Consumption Object . . . . . . . . . . . . . . . . . . . . . . . . . . . . . . . . . . . 47
5.2.1 Power Load of the Farm . . . . . . . . . . . . . . . . . . . . . . . . . . . . . . . . . 47
5.2.2 Location and Climate of the Farm . . . . . . . . . . . . . . . . . . . . . . . . . . . . 49
5.3 Components . . . . . . . . . . . . . . . . . . . . . . . . . . . . . . . . . . . . . . . . . . . 54
5.3.1 Grid-connected Solution . . . . . . . . . . . . . . . . . . . . . . . . . . . . . . . . . 54
5.3.2 Off-grid Solution . . . . . . . . . . . . . . . . . . . . . . . . . . . . . . . . . . . . . 55
5.3.3 Wind Turbines . . . . . . . . . . . . . . . . . . . . . . . . . . . . . . . . . . . . . . 55
5.3.4 PV Panels . . . . . . . . . . . . . . . . . . . . . . . . . . . . . . . . . . . . . . . . . 58
5.3.5 Batteries . . . . . . . . . . . . . . . . . . . . . . . . . . . . . . . . . . . . . . . . . 59
5.3.6 AC Generators . . . . . . . . . . . . . . . . . . . . . . . . . . . . . . . . . . . . . . 60
5.3.7 Other installation components . . . . . . . . . . . . . . . . . . . . . . . . . . . . . 61
5.4 Other input data . . . . . . . . . . . . . . . . . . . . . . . . . . . . . . . . . . . . . . . . . 62
6 Results 65
6.1 Variant ON WITHOUT . . . . . . . . . . . . . . . . . . . . . . . . . . . . . . . . . . . . . . 65
6.2 Variant ON WITH . . . . . . . . . . . . . . . . . . . . . . . . . . . . . . . . . . . . . . . . . 67
6.3 Variant OFF WITHOUT . . . . . . . . . . . . . . . . . . . . . . . . . . . . . . . . . . . . . 70
6.4 Variant OFF WITH . . . . . . . . . . . . . . . . . . . . . . . . . . . . . . . . . . . . . . . . 73
6.5 Evaluation and Comparison . . . . . . . . . . . . . . . . . . . . . . . . . . . . . . . . . . . 74
7 Conclusion 77
7.1 Case Study . . . . . . . . . . . . . . . . . . . . . . . . . . . . . . . . . . . . . . . . . . . . 77
7.2 Future Proposals . . . . . . . . . . . . . . . . . . . . . . . . . . . . . . . . . . . . . . . . . 79
Bibliography 81
A iHOGA Reports A.1
xii

List of Tables
2.1 Key Energy Indicators of Czech Republic and Portugal [14] . . . . . . . . . . . . . . . . . 11
4.1 Green bonuses and Feed-in tariffs prices for windenergy [44]. . . . . . . . . . . . . . . . . 42
5.1 Mean values of a model farm [51] . . . . . . . . . . . . . . . . . . . . . . . . . . . . . . . . 48
5.2 Model predictions for monthly and total kWh electricity consumption of a modified small-
sized farm from January to June [51] . . . . . . . . . . . . . . . . . . . . . . . . . . . . . . 49
5.3 Model predictions for monthly and total kWh electricity consumption of a small-sized farm
from July to December [51] . . . . . . . . . . . . . . . . . . . . . . . . . . . . . . . . . . . 49
5.4 Main characteristic of the model object and location [51, 53]. . . . . . . . . . . . . . . . . 51
5.5 Characteristics of wind turbines selected for the optimisation. . . . . . . . . . . . . . . . . 57
5.6 Input database of PV panels [57, 58, 59] . . . . . . . . . . . . . . . . . . . . . . . . . . . . 58
5.7 Input database of PV panels [63, 60, 64, 61, 65] . . . . . . . . . . . . . . . . . . . . . . . 61
5.8 Input database of AC generators . . . . . . . . . . . . . . . . . . . . . . . . . . . . . . . . 61
5.9 Properties of generic hybrid inverter . . . . . . . . . . . . . . . . . . . . . . . . . . . . . . 62
5.10 Additional input data . . . . . . . . . . . . . . . . . . . . . . . . . . . . . . . . . . . . . . . 63
6.1 Optimal components for ON WITHOUT scenario. . . . . . . . . . . . . . . . . . . . . . . . 65
6.2 Economic results of optimisation of ON WITHOUT scenario. . . . . . . . . . . . . . . . . . 66
6.3 Optimal components for ON WITH scenario. . . . . . . . . . . . . . . . . . . . . . . . . . . 68
6.4 Economic results of optimisation of ON WITH scenario. . . . . . . . . . . . . . . . . . . . 68
6.5 Optimal components for OFF WITHOUT scenario. . . . . . . . . . . . . . . . . . . . . . . 71
6.6 Economic results of optimisation of OFF WITHOUT scenario. . . . . . . . . . . . . . . . . 71
6.7 Economic results of optimisation of OFF WITH scenario. . . . . . . . . . . . . . . . . . . . 74
6.8 Comparison of initial costs and NPVs of all scenarios . . . . . . . . . . . . . . . . . . . . . 74
7.1 Comparison of initial costs and NPVs of all scenarios . . . . . . . . . . . . . . . . . . . . . 78
xiii

xiv

List of Figures
1.1 World power capacities additions in renewables sector [1]. . . . . . . . . . . . . . . . . . . 2
1.2 EU Power Mix 2000 vs. 2015 [3]. . . . . . . . . . . . . . . . . . . . . . . . . . . . . . . . . 3
2.1 Location of the Czech Republic [4]. . . . . . . . . . . . . . . . . . . . . . . . . . . . . . . . 5
2.2 Comparison of the basic macroeconomic indicators [6, 5, 7]. . . . . . . . . . . . . . . . . 6
2.3 Transmission network of the Czech Republic [10]. . . . . . . . . . . . . . . . . . . . . . . . 8
2.4 Exchange rates through the transmission network of the Czech Republic [10]. . . . . . . . 9
2.5 Division of the distribution system in the Czech Republic [11]. . . . . . . . . . . . . . . . . 9
2.6 Market coupling formations - EU countries [12]. . . . . . . . . . . . . . . . . . . . . . . . . 10
2.7 TPES of Czech Republic and Portugal [14]. . . . . . . . . . . . . . . . . . . . . . . . . . . 12
2.8 Power Mix of Czech Republic and Portugal [14]. . . . . . . . . . . . . . . . . . . . . . . . 13
2.9 GHG emissions per GDP in the Czech Republic [19]. . . . . . . . . . . . . . . . . . . . . . 15
2.10 GHG emissions per capita in the Czech Republic [19]. . . . . . . . . . . . . . . . . . . . . 15
2.11 Public Opinion About Coal Mining [20]. . . . . . . . . . . . . . . . . . . . . . . . . . . . . . 16
2.12 View on the active surface coal mine in the north of the Czech Republic [21] . . . . . . . . 17
2.13 Public Opinion About Wind Power Plants in Czech Republic [22]. . . . . . . . . . . . . . . 17
2.14 Public Opinion About Wind Power Plants in Portugal [23]. . . . . . . . . . . . . . . . . . . 17
3.1 Multi-blade wind turbine [26]. . . . . . . . . . . . . . . . . . . . . . . . . . . . . . . . . . . 21
3.2 Scheme of the available power from wind. . . . . . . . . . . . . . . . . . . . . . . . . . . . 22
3.3 Streamlines of wind [30]. . . . . . . . . . . . . . . . . . . . . . . . . . . . . . . . . . . . . . 24
3.4 Wind map of Europe [30] . . . . . . . . . . . . . . . . . . . . . . . . . . . . . . . . . . . . 25
3.5 Wind map of the Czech Republic [31] . . . . . . . . . . . . . . . . . . . . . . . . . . . . . 26
3.6 Map of extreme impact winds in the Czech Republic [31] . . . . . . . . . . . . . . . . . . 26
3.7 Average wind speed determined by absolute frequency [32] . . . . . . . . . . . . . . . . 27
3.8 Typical power output of a wind turbine [34] . . . . . . . . . . . . . . . . . . . . . . . . . . 27
3.9 Proper location of wind turbine [36] . . . . . . . . . . . . . . . . . . . . . . . . . . . . . . 28
3.10 Stand-alone and rooftop wind turbines [35, 38]. . . . . . . . . . . . . . . . . . . . . . . . . 29
3.11 Tilt-down towers [39, 40]. . . . . . . . . . . . . . . . . . . . . . . . . . . . . . . . . . . . . 29
3.12 Experimental wind power plant in Krusne hory [41] . . . . . . . . . . . . . . . . . . . . . . 30
3.13 Construction of a wind power plant [42, 43]. . . . . . . . . . . . . . . . . . . . . . . . . . . 31
xv

3.14 Territories suitable for the location of wind power plants [44] . . . . . . . . . . . . . . . . . 33
4.1 Legislation: Institutions and tools . . . . . . . . . . . . . . . . . . . . . . . . . . . . . . . . 35
4.2 Legislation scheme for renewable micro-sources . . . . . . . . . . . . . . . . . . . . . . . 39
4.3 Connection scheme in case of using Green Bonuses support mechanism . . . . . . . . . 40
4.4 Connection scheme in case of using Feed-in tariff support mechanism . . . . . . . . . . . 41
4.5 Comparison of subsides with real elctricity prices [44] . . . . . . . . . . . . . . . . . . . . 43
5.1 Scheme of the simulation variants . . . . . . . . . . . . . . . . . . . . . . . . . . . . . . . 45
5.2 Schematic representation of the iHOGA software . . . . . . . . . . . . . . . . . . . . . . . 47
5.3 Scheme of the milk production electricity consumption model [51] . . . . . . . . . . . . . . 48
5.4 Power load curve for a model farm [51] . . . . . . . . . . . . . . . . . . . . . . . . . . . . . 50
5.5 Average daily load distribution of the model farm . . . . . . . . . . . . . . . . . . . . . . . 50
5.6 Final load for the month of June, including variability . . . . . . . . . . . . . . . . . . . . . 51
5.7 ”Vysocina” Region and location of the model farm . . . . . . . . . . . . . . . . . . . . . . 51
5.8 Monthly average wind speed and power demand of the model location [51, 53] . . . . . . 52
5.9 Wind speed throughout a year. . . . . . . . . . . . . . . . . . . . . . . . . . . . . . . . . . 52
5.10 Probability distribution of the wind speed on the model farm . . . . . . . . . . . . . . . . . 53
5.11 Monthly average daily irradiation and power demand of the model location [51, 53] . . . . 53
5.12 Irradiation on the model farm throughout a year. . . . . . . . . . . . . . . . . . . . . . . . . 54
5.13 Scheme of the grid-connected solution . . . . . . . . . . . . . . . . . . . . . . . . . . . . . 55
5.14 Scheme of the off-grid solution . . . . . . . . . . . . . . . . . . . . . . . . . . . . . . . . . 55
5.15 Monthly average temperature at hub height [53] . . . . . . . . . . . . . . . . . . . . . . . . 56
5.16 Performance curves of simulated wind turbines . . . . . . . . . . . . . . . . . . . . . . . . 57
5.17 Annual inflation rate for wind turbines . . . . . . . . . . . . . . . . . . . . . . . . . . . . . . 58
5.18 Wind turbines. . . . . . . . . . . . . . . . . . . . . . . . . . . . . . . . . . . . . . . . . . . 58
5.19 PV panel Victron Energy SPP101-12 [57] . . . . . . . . . . . . . . . . . . . . . . . . . . . 59
5.20 Batteries used in simulation. . . . . . . . . . . . . . . . . . . . . . . . . . . . . . . . . . . . 60
6.1 Net present costs for installation and O&M of all components - ON WITHOUT scenario . 66
6.2 Composition of total costs per technology . . . . . . . . . . . . . . . . . . . . . . . . . . . 67
6.3 Total annual energy . . . . . . . . . . . . . . . . . . . . . . . . . . . . . . . . . . . . . . . 68
6.4 Net present costs for installation and O&M of all components - ON WITH scenario . . . . 69
6.5 Composition of total costs per technology - ON WITH scenario . . . . . . . . . . . . . . . 69
6.6 Total annual energy for ON WITH scenario . . . . . . . . . . . . . . . . . . . . . . . . . . 70
6.7 Net present costs for installation and O&M of all components - OFF WITHOUT scenario . 72
6.8 Composition of total costs per technology - OFF WITHOUT scenario . . . . . . . . . . . . 73
6.9 Total annual energy for OFF WITHOUT scenario . . . . . . . . . . . . . . . . . . . . . . . 73
6.10 Comparison of initial costs and NPVs of all scenarios . . . . . . . . . . . . . . . . . . . . . 75
xvi

Nomenclature
Greek symbols
ρ Air density [kg/m3]
Roman symbols
A Area [m2]
cE Efficient speed [m/s]
ci Speed (given) [m/s]
Cp Betz’s power coefficient [−]
Cnom Nominal capacity [W ]
E Energy [J ]
Imax Max. current [A]
Isc Short-cut current [A]
m Mass [kg]
n Frequency [s−1]
P Power [W ]
Pnom Nominal power [W ]
t Time [s]
v Velocity [m/s]
Vnom Nominal voltage [V ]
x Average value of the wind speed [m/s]
x Modus, the most commonly measured value of the speed [m/s]
xvii

xviii

Glossary
AC Alternating current
CEER Council of European Energy Regulators
CER Central Europe Region
CHP Combined Heat and Power
CTSO The Czech Transmission System Operator -
CEPS
DC Direct current
DSO Distribution System Operator
ERO The Energy Regulatory Office of the Czech Re-
public
EU European Union
GDP Gross Domestic Product
GHG Greenhouse Gases
GWEC The Global Wind Energy Council
IEA International Energy Agency
LCOE Levelised cost of energy
MIT The Ministry of Industry and Trade of the Czech
Republic
MPPT Maximum power point tracking
MPP Maximum power point
Mtoe Million Tonnes of Oil Equivalent
NASA National Aeronautics and Space Administration
NATO North Atlantic Treaty Organization
NGO Non-governmental organization
NPV Net Present Value
OECD Organisation for Economic Co-operation and
Development
O&M Operation and maintenance
PE Primary Energy
PV Photovoltaic
xix

PXE Prague Stock Exchange
RES Renewable energy sources
SEF The State Environmental Fund of the Czech
Republic
TFC Total Fuel Consumption
TPES Total Primary Energy Supply
TSO Transmission System Operator
UK The United Kingdom of Great Britain and
Northern Ireland
UN United Nations
USA The United States of America
V4 Visegrad Group (Visegrad Four) - a cultural and
political alliance of Czech Republic, Hungary,
Poland and Slovakia
VAT Value added tax
WEO World Energy Outlook
WG Wind generation
xx

Chapter 1
Introduction
Currently, the Earth is facing several key challenges, such as growing population levels, rising demands
of people, severe environmental pollution and degradation of traditional (fossil) resources. The common
denominator of all these issues is energy and its efficient generation and usage. These difficulties, and
much more, are bringing us on the edge of the sustainability. Luckily, most of the people already realised
the seriousness of the problem and impact of decisions made regarding the environment.
1.1 Motivation
In order to meet the rising energy demands of the growing world’s population and preserve our environ-
ment in the inhabitable state, we must take smart and systematic steps. Fortunately, modern science
has already developed several working solutions, and the next step to take is to the decision makers -
governments, public and private companies, visionaries, and last, but not least, the communities. Es-
pecially the latter is the most efficient driving force, in many cases as it can react to the changes very
promptly.
Talking about the working environmentally and financially friendly solutions, the most used technolo-
gies nowadays is wind generation (WG) and photovoltaic (PV) units. These principles are the most
promising and belong to the most developed renewable energy sources (RES) of electrical energy. The
main advantages are their non-depleting and non-polluting nature, but the drawback can be their site-
dependency and unforeseeable intermittent behaviour. However, these disadvantages can be overcome
by using proper energy storage system or integrating two or more resources into a hybrid system. Both
forename technologies are currently in a continuous development phase and are becoming a significant
game changer in the field.
The framework of this work will focused on the Czech Republic mostly. Unlike in most of the Europe
countries, wind generation is not a popular source of clean energy here. The reasons are various:
political (mainly), historical and climatic. Doubtful public opinion is not an exception. There are strong
political driving forces in favour of conventional energy generation (nuclear, coal) and quite an ignorance
towards alternative energy sources. Public opinion of the masses is also strongly affected by this political
1

blindness. There is also a lack of legislative background and support for either domestic or industrial
generation of renewable energy, mainly wind energy.
Therefore, may this work be a guide for future stakeholders interested in installing and using wind
generation as a source of electricity for households, communities, farmers and small manufacturers.
The less legislative and informative support is in the Czech Republic, the stronger is the motivation to
deliver a complete overview for the interested target group.
1.2 Topic Overview
According to the IEA, the renewables industry achieved an important milestone in 2015, when the annual
power capacity additions exceeded the conventional fossil and nuclear sources. Moreover, 150 GW of
power additions in RES was a new record and was nearly 4-times bigger than a decade before, when
these capacity additions were also at an all-time record [1].
As is visible in Figure 1.1 these outstanding power capacities additions in 2015 were led by WG.
New wind power capacities installed (65 GW) in 2015 were roughly 35% higher than the previous year,
and by the end of the year, there were around 433 GW of wind power globally. The absolute leader in
the sector is China, with half of the wind power additions, followed by the EU (led by Germany) and the
USA. These three countries (or political formations) accounted approximately 80% of the global wind
power additions. Still, the majority of new wind installations were located in developing countries, and
this trend will probably continue. For instance, cumulative wind power installed at the end of 2015 in
China (145 GW) was higher than in all EU countries combined (141.6 GW) [1, 2].
Figure 1.1: World power capacities additions in renewables sector by types and share [1].
Inside the EU, in 2015 as much as 44.2% of new power installations came from wind power. This
reflects a rapidly growing trend of WG. However, even market inside of the EU is not consistent, as
almost half of the every new GW installed took place in Germany, which makes this country a leader in
WG in the EU (45 GW installed). Germany is followed by Spain (23 GW), the UK (nearly 14 GW), France
and Italy (both around 10 GW). Denmark, Poland, Portugal and Sweden each have installed more than
2

5 GW [2].
Growing significance and share of RES in the EU power mix can also be observed from Figure 1.2.
While the share of wind generation in 2000 EU power mix was just 2.4%, only 15 years later this share
rose to 15.6% (nearly 142 GW in total), while the share of conventional energy sources such as coal or
nuclear fell from 24.4% to 17.5% and from 22.6% to 13.2%, respectively. Solar PV generation witnessed
even bigger increase - from 0.02% to 10.5% [3].
Figure 1.2: Comparison of EU power mix in year 2000 and 2015 [3].
Wind power has also witnessed significant cost decreases. Indicative global costs for new onshore
installations have been reduced by about 30% on average (between 2008 and 2015). This reduction has
been accomplished mainly by increasing capacity factors than decreasing investments expenses. Gen-
erally, new wind turbine installations with improved maximum power point tracking (MPPT) are capable
of generating more power while working in lower wind speed areas [1].
With these improved technologies and falling investment costs, the chances for a successful imple-
menting of wind turbines are higher even in the areas, where we could not imagine it in the past. This can
help people in remote rural areas without access to energy nor sufficient solar radiation to use PV units.
WG can be utilised both in on-grid or off-grid mode and open a broad scale of possible applications,
from huge offshore wind farms to decentralised domestic (community) installations.
1.3 Objectives
The principal objective of this thesis is to provide a complete overview of wind generation in the Czech
Republic. Secondly, to deliver a feasibility study of several installations of wind power plants focused
on the sustainability and economic efficiency of a smaller wind power plants dedicated to households,
communities, farmers and manufacturers. The aim is also to develop a case study and determine its
potential in the framework of small wind generation in the Czech Republic.
The secondary objective is to promote RES in the Czech Republic and point out the advantages and
3

drawbacks of the policy in the country.
1.4 Thesis Outline
The thesis is divided into two main parts: Theoretical and Computational (Case Study) part. In the
first part, a brief overview of the energy situation and policy in the Czech Republic will be presented.
This chapter will be followed by analysis of climate conditions with regards to wind generation. We will
also determine a location for the further computational modelling. Analysis legislation background is
also a fundamental part of the work, support mechanisms, feed-in tariffs, permission processes and
weaknesses of the policies will be explained in more details. Later we will identify and describe our
target group and its energy needs to understand better and design the proper energy system. Also, we
will focus on research on the current wind turbine technologies and technical solutions and alternatives
for domestic use.
In the second part, a complex techno-economical assessment for an on-grid and off-grid installation
will be conducted under the framework of iHOGA software. We will focus on evaluating feasibility of such
installations for a model object in a real location in the Czech Republic. The simulation and optimisation
will be focused on minimisation of the total costs (and incomes) for a study period of 30 years.
4

Chapter 2
Energy in the Czech Republic
The Czech Republic is a middle sized landlocked country in the Central Europe Region (CER) covering
nearly 80,000 square kilometres and bordering with Germany on the west side, Austria on the south
side and Poland and Slovakia on the east side. Despite the fact that this country was under the strong
influence of Eastern Block for more than a four decades, the Czech Republic, a home for more than 10
million inhabitants, is a member of OECD, NATO, EU and V4.
Figure 2.1: Location of the Czech Republic (dark green) within the EU (light green) and Europe [4].
The Czech Republic is very similar to Portugal regarding area, inhabitants and nominal GDP ($200 bil-
lion), yet very different in the energy policy, climate conditions and public opinion towards RES. Therefore
we will focus and compare this country with respect to Portugal - which is an appropriate sample regard-
ing many factors [5].
In order to better understand and analyse the energy situation and public opinion on RES, the follow-
ing chapter will be dedicated to economic, demographic and climate description and comparison with
Portugal.
5

2.1 Basic Economy of the Czech Republic
After the Velvet Revolution in 1989 and dissolution of Czechoslovakia in 1993, Czech Republic undertook
a significant economic transformation and became the most developed and progressive economy of the
former Eastern Block. In 2004 the Czech Republic joined the EU together with other nine countries
mostly from the former Eastern Block. The Czech Republic quickly became a competitive member of
this organisation, and as of April 2017, the unemployment rate of this country hit the lowest level in the
EU with 3.2%. Also, the poverty index is the second lowest of OECD countries after Denmark [6].
The most important industries are machinery (namely motor vehicles), metallurgy, electronics and
glass. The industry sector counts 37.5% of the overall GDP.
Figure 2.2: Comparison of the basic economic indicators between Portugal and Czech Republic [6, 5, 7].
6

As one can observe from Figure 2.2, these macroeconomic indicators are very similar and compara-
ble between the Czech Republic and Portugal. One of the few exceptions is unemployment rate; while
Portugal hits nearly 10% rate, the Czech Republic remains the EU top country with only 3.2%. This
is caused by stronger orientation towards industry (nearly 38% of the nominal GDP) and cheap labour
price compared to other European countries [6, 5, 7].
Although many of these fundamental economical and geographical indicators are very similar, the
situation in another essential sector is a complete opposite to each other. In the following chapter, we
will look closer on the Energy and Power Industry, and we will analyse the reasons for such differences.
2.2 Power System Structure in the Czech Republic
With nearly 20 000 $ GDP and more than 21 000 MW total installed generating capacity, the Czech Re-
public belongs to the category of high system size with high income per capita. After historical economic
changes in 1989 (fall of ”iron curtain”), when everything, including power structure, was completely state-
owned and integrated, the power structure overcame several major reforms and is now dominated by
three vertically integrated companies:
• Ceske Energeticke Zavody - CEZ Group,
• E.ON Group,
• Prazska energetika - PRE Group.
These three corporations hold a license for distribution of electricity as well as for electricity trading
and account for more than 95 % of final customers’ consumption [8, 9].
The Energy Regulatory Office of the Czech Republic (ERO) was founded only on January 1, 2001,
as an institution with responsibility for regulation of Czech power sector. The ERO mainly controls prices,
supports renewable energy sources, heat and power generation, protects consumers, grants licences
and permissions, supports fair market competition and supervises the energy market [9].
The Czech Transmission System Operator (CTSO) possess its licence granted by the ERO as the
only TSO operator in the country. The CTSO was established in 1998 by separation from CEZ, which
was the absolute energy monopoly until that time. This was on of the first step towards liberalisation of
the energy market in the Czech Republic. It is responsible for the long-distance high-voltage electricity
transmission and also takes care for the stability of frequency and power. CTSO is also allowed to trade
the electricity to secure stability parameters and power reserve [9].
2.2.1 Transmission System
As was stated before, the transmission system of the Czech Republic is maintained by the only one
TSO operator - Czech Transmission System Operator. The construction of the transmission system
began before World War II and was completed in the 1980s, both during the era of common federation
Czechoslovakia. This means that even current TSO/DSO systems in Czechia and Slovakia are very
7

well connected and the electricity exchange is intense even if the current borders are relatively short in
comparison to other neighbouring countries (see Figure 2.4 and 2.3).
The backbone transmission network currently consists of 400 kV power lines and 220 kV lines, which
are currently used mostly as reserve lines. The transmissions system also holds 41 substations with 71
transformers. There is also older 110 kV grid which is no longer used since the 1970s [10].
Figure 2.3: 400 kV and 220 kV transmission network of Czech power system [10]
The Czech 400 and 220 kV transmission grid is very important also from the international point of
view and is interconnected with transmission systems of all neighbouring countries via cross-border
lines. As one can see in Figure 2.4, the real electricity exchange with Germany much exceeded the
planned rates, and it is not a secret that Germany is sending part of their electricity from North to South.
This electricity comes from large wind farms and has intermittent character; therefore it exceeds plans
and causes a lot of technical difficulties for CTSO.
2.2.2 Distribution System
After the Velvet Revolution in 1989, distribution system was divided into eight regional DSO companies.
In 1994 they were opened to foreign investors, and within a few years, they formed the distribution
structure we know today (see Figure 2.5). Nowadays, whole distribution system in the Czech Republic
is operated by three DSOs. CEZ is responsible for the largest part in North and Central Czechia and
serves more than 3.5 million customers. E.ON is the second biggest DSO here, serving more than 1.3
million consumers in the southern part of the country. Finally, Prague, the capital city, has its own DSO
8

Figure 2.4: Exchange rates through the transmission network of the Czech Republic [10]
called PRE with about 700 000 consumers.
Figure 2.5: Division of the distribution system in the Czech Republic [11]
As the unbundling process was implemented mainly formally, the relationship between the only TSO
in Czechia (CEPS) and the biggest DSO CEZ is comparable to the one in France. Both these companies
are mainly owned by the government with many interconnections between them.
Regarding foreign investments, CEZ is the biggest utility and public company in Central and Eastern
9

Europe. Besides the Czech Republic, they operate in Germany, Poland, Slovakia, Hungary, Romania,
Bulgaria and Turkey. Two other DSOs in Czechia also has a strong dependence on CEZ as it is the
major electricity producer here. CEZ Group is often considered as the most important company of the
Czech Republic [11].
2.2.3 Energy Market and Market Coupling
Market coupling is a functional mechanism of trading between particular European countries which was
created in order to eliminate threatening and overloading power systems. This process is one of the
fundamental steps to establish the Energy Union.
First countries which were connected in the framework of market coupling were France, Belgium and
the Netherlands in November 2016. This interconnection is known as Trilateral Market Coupling (TLC).
Positive results of this joint system encouraged other nation to join this principle, and in 2010 Germany
entered the TLC formation as well. In 2014 and 2015, the UK, Scandinavian and Baltic countries joined
the TLC formation together with Spain, Portugal and Italy (see Figure 2.6).
Figure 2.6: Market coupling formations - EU countries [12]
The Czech Republic joined market coupling group called 4M. This formation involves the Czech
10

Republic, Slovakia, Hungary and Romania. This project started in 2012 and since then has been de-
veloping successfully [13]. The aim of the project is to connect daily electricity markets on principle
of implicit allocation of cross-border capacities, similarly as in the case of Portuguese-Spanish project
MIBEL.
2.3 Energy Composition of the Czech Republic
The energy sector in the Czech Republic is an entirely different situation than in Portugal. While Portugal
is in the leading group of countries in terms of clean energy, Czech Republic still has a strong focus
towards carbon-based energy sources. More than half of the electricity generation has its origin in coal.
In the following chapter, we will analyse total primary energy supply (TPES) and production, total fuel
consumption (TFC), power mix and energy resources of both Czech Republic and Portugal.
On of the essential energy characteristics is primary energy (PE). PE is a form of energy found in
nature, and that has not been converted or transformed. This energy is usually contained in raw fuels,
and other forms of energy obtained as input to a system. Total primary energy supply is an indicator
which presents the sum of production and imports. This term refers to a stage of energy before any
process of conversion or transformation.
Before analysing the energy sector, we are also obligated to introduce another important indicator:
Million Tonnes of Oil Equivalent (Mtoe). Mtoe is a unit of energy and is characterised as the amount of
energy released by burning one million tonnes of crude oil.
2.3.1 Total Primary Energy Supply
As one can observe from the Table 2.1, TPES of the Czech Republic is almost twice that high than
TPES of Portugal even if the population is nearly the same. In other words, Czech residents, industry,
transport and commercial sector consume nearly two times more primary energy. Two major reasons
cause this phenomenon. First of all, as we know from the Chapter 2.1, Czech economy is much more
orientated on industry sector, namely heavy industry, which consumes much more energy comparing to
other sectors, mainly coal, oil and electricity. Secondly, the climate conditions of the Czech Republic are
much colder than in Portugal; especially winter is much cooler and longer than in Portugal. Therefore,
unlike in Portugal, every Czech household is equipped with a domestic boiler (mostly gas, biomass or
coal) which is usually used for a significant part of the year.
Country TPES TPES per capita Electricity consumption per capita CO2 emission per capitaMtoe Mtoe/Million MWh tCO2
Czech Republic 42.1 4.00 6.38 9.44Portugal 22 2.12 4.81 4.54IEA average - 4.44 8.71 9.88
Table 2.1: Key Energy Indicators of Czech Republic and Portugal [14]
Emission of CO2 is more than twice that big in the Czech Republic than in Portugal, but still lower
11

than the average of IAE countries. It is needless to say that this is also caused by the stronger orientation
towards heavy industry and coal generally. On the other hand, when we focus on the development of
CO2 emissions in time (1990 - 2015), we will find out that emission of CO2 per capita in Portugal has
risen by more than 20% since 1990, while in the Czech Republic they have dropped by almost 40%,
even if this country is orientated towards coal more than Portugal. This improvement can be caused by
the continuous implementation of strict emission limits and carbon cleaning technologies in the industry
[14].
If we focus on composition the TPES of both countries in Figure 2.7, we can observe several notable
differences. Firstly, the Czech Republic is much more dependent on coal (39% of the overall TPES)
compared to 15% in Portugal). As was stated before, this is caused by stronger concentration to the
heavy industry but also by the higher number of coal power plants and domestic coal heating in house-
holds. Domestic heating is also responsible for higher gas use in case of the Czech Republic. On the
other hand, Portugal uses more oil than the Czech Republic (9.46 Mtoe compared to 8.42 Mtoe). The
principal reason is simple: while the Czech Republic is a land-locked country with no marine services,
Portugal has broad access to the ocean and is a key country regarding global marine transportation.
Therefore, this sector accounts for the significant difference in oil supply. Furthermore, while there are
no nuclear power plants in Portugal, they are an important energy source in the Czech Republic and
account for nearly 7.2 Mtoe of TPES.
Figure 2.7: Composition of total primary energy supply in the Czech Republic and Portugal [14]
12

2.3.2 Power Mix
Regarding electricity generation, in 2015 the Czech Republic generated 82.6 TWh of electricity while
Portugal only 51.3 TWh. Reasons for such a difference were already discussed before. However, what
is more interesting, is the composition of electricity generation or, in other words, the power mix of both
countries which is presented in Figure2.8 [14].
Figure 2.8: Composition of 2015 power mix in Czech Republic and Portugal (RES expanded) [14].
In the year 2015, RES in the Czech Republic counted 12% (namely: biofuels 6%, solar 3%, hydro
2%, and wind only 1%), while in Portugal green electricity sources reach as much as 48% (wind 23%,
hydro 17%, biofuels 7%, and solar 2%). For comparison, the average share of RES in IEA countries is
24%.
Focusing on the composition of carbon-based and renewable energy sources in both power mixes,
almost no similarity can be found. The Czech Republic is clearly dependent on coal, which is responsible
for more than a half of annual electricity generation. Summing up all carbon based sources we get 56%
share. In Portugal, the share of the carbon-based energy sources is similar (52%), but coal forms only
a bit more than a half of this share. Nearly half of the carbon-based electricity generated in Portugal
comes from gas, which is considered as much less harmful to the environment than coal. Attitude to
13

nuclear power generation is another major contrast between the countries. While there is no commercial
nuclear power plant in Portugal, the Czech Republic has been relying on the stability of nuclear power
since the mid-1980s, when first commercial reactors were put into operation. From that moment, the
nuclear energy sector has been gradually improving and today reaches nearly 4 GWe, and another
4.8 GWe are planned or proposed. Nuclear electricity generations account for almost quarter of the
annual production in the Czech Republic [15].
There is another entirely different story between the countries: attitude towards RES. Even if the situ-
ation with clean energy has got much better during last decade, RES still counts only 12% of the annual
electricity generation, which is half of the IEA countries average (24%). On the other hand, Portugal is
one of the leading countries regarding the use of RES. They form nearly half of the annual generation,
which is high above the IEA average. Furthermore, in May 2016 Portugal achieved a historical record
and ran for four consecutive days completely on renewable energy. This indicates that Portugal can be
even more ambitious in transition to 100% renewable energy [16].
Wind and hydro generation are two major renewable contributors in Portugal (23% and 17 - 30%,
respectively). In the Czech Republic, these two energy sources together form only 3%. This data shows
that the Czech Republic has still not used its potential in the field of wind energy mainly, which is broadly
affected by climate conditions but not only. Public opinion and state policies also take an important role
in developing wind generation.
One of the key reason of such a coal-orientated power industry in the Czech Republic is domestic
fossil resources. The mining industry has a long tradition and strong fundaments here. In 2015, more
than 8 million of tonnes of coal was produced in the coal mines of the Czech Republic. That is even
more than all 24 coal power plants can consume, so the Czech Republic exports 1% of the produced
coal. In contrast with Portugal which closed the last coal mine in 1994 and is a 100% coal importer from
that time [17, 18].
2.3.3 GHG Emissions
Greenhouse gases emissions are inseparably associated with country’s power mix. As we discussed be-
fore, not only power industry in the Czech Republic is strongly orientated towards fossil energy sources.
Therefore we can expect higher levels of GHG emissions. The main sources of GHG emissions are coal
orientated power industry, heavy metallurgy industry, transport and domestic coal heating.
As is visible from Figure 2.9 and 2.10, the Czech Republic has a strong potential for improvements in
the environment field. In terms of CO2 eq. per GDP, the emissions of the Czech Republic reaches more
than twice the average of the EU-28, which makes this country the fifth biggest contributor to EU GHG
emissions. Regarding GHG emissions per capita, the situation is even worse, and the Czech Republic
is the fourth worst country in this ranking [19].
14

Figure 2.9: GHG emissions per GDP in the Czech Republic, 2016 [19].
Figure 2.10: GHG emissions per capita in the Czech Republic, 2016 [19].
15

2.3.4 Public Opinion
The opinion of the public and government is a key factor which can have a significant impact on the state
energy policy. Therefore, it is very often influenced by all the stakeholders: government, corporations,
local political forces or NGOs. All of these parties are trying to get people’s opinion on their side. What is
interesting is the unclear attitude of a part of NGOs; usually, they blame nuclear and coal power industry,
but in the Czech Republic it is not rare to meet an NGO fighting against RES (i.e.: Wind turbines are too
noisy, and harm birds, or PV cells are toxic for the environment, and so forth.). This influences people a
lot, and it is one of the reasons of such weak support of RES here.
Regarding the coal industry, there was an opinion poll undertaken in 2015 by NGO ”Stem” with the
following question: ”What should we do with the coal resources of the Czech Republic?”. The answer
was quite surprising. While RES are getting more and more accessible and efficient, the majority of the
Czech people still think we should use the most of all available and known coal resources or search for
other resources of this prehistorical commodity. As is visible in Figure 2.11, less than one-fifth of the
population is against coal mining [20].
Figure 2.11: Public poll about coal mining in the Czech Republic 2015 [20].
Although most of the Czech people are aware of the effects of coal mining on nature and land view,
they are still in favour of coal mining, especially surface coal mining, which is the most harmful way of
getting this resource. In Figure 2.12 the dramatic effects of surface coal mining are presented, located
in the north of the Czech Republic. This region is the source of the major part of the national coal
production. Industry in this area is orientated only on mining, and therefore there is a high rate of
unemployment. Acid rains also occur from time to time here as nature is significantly devastated here.
Another public poll was conducted under the framework of NGO ”Rainbow Movement” (note: trans-
lated from Czech ”Hnutı Duha”) in the end of the year 2016. This time, the poll focused on wind power
plants and this question was asked: ”Would you agree with building a wind power plant by an investor
close to the town you live in?”. The results are presented in Figure 2.13 [22].
From the data shown in Figure 2.13, one can conclude that only 25% of Czech population would
agree with constructing a wind power plant in their areas, while more than a half of the people would dis-
agree with locating an environmentally harmless energy source like wind power plant near their houses.
In other words, Czech people are more in favour of electricity generation from coal rather than wind.
A similar public poll was conducted in Portugal in 2013 with entirely different results, shown in Fig-
ure 2.14. The results are notably different. While only a quarter of the population would agree with a
16

(a) (b)
Figure 2.12: View on the active surface coal mine in the north of the Czech Republic [21].
new wind power plant in their surrounding, the willingness of Portuguese nation towards wind energy
is much more positive; 86% of the population would agree with building a new wind power plant in a
municipality they live in.
Figure 2.13: Public poll about wind power plants in the Czech Republic, 2016 [22].
Figure 2.14: Public poll about wind power plants in Portugal, 2013 [23].
This significant difference in attitude of the people can be partially caused by the composition of the
national economy. Czech economy focuses more on heavy industry, and there are thousands of jobs in
this sector. Naturally, people are afraid of losing jobs, as well as coal corporations do not want to cut
their revenues and profits.
17

However, we can not forget, that renewable sector also creates thousands of jobs and generates
huge profits. There were almost 10 million jobs in renewable energy sector in 2015, and this trend
continues to raise. It is just about the attitude of people, organisations and government [24].
2.3.5 Future Projections
It is needed to say that despite Czech’s relatively strong focus on fossil sources for electricity generation,
the government realises the growing importance of RES and they know the turn into renewables is un-
avoidable, especially under the framework of the EU. The bottleneck, however, is insufficient legislation
environment and very cold public opinion. Even large Czech energy corporations more likely invest into
RES in a foreign country with a better regulation environment (e.g. Germany, Romania) than in their
countries of origin. This is a clear sign of insufficient legislation background for both domestic or industry
RES.
Talking about future projections, the Czech Republic will definitely stay with the nuclear energy and
even strengthen its position. Nowadays, they are planning modernisation and enhancement of capacity
for both their nuclear power plants. This is emerging very doubtful and rather negative opinion of their
southern neighbour - Austria, as both of the power plants are located very close to their common border.
However, Czech’s nuclear power plants are considered as on of the most secured nuclear power plants
in the world. Thanks to the intensive lobbying of the government and corporations there is also a positive
public opinion about nuclear energy, in contrast with their neighbour, Austria.
Regarding coal industry, the situation is not that clear. Both government and corporations realise,
that coal industry will be shrinking during next decades and this trend is rather unavoidable. Fossil power
engineering has strong fundaments because of historical, but also economic reasons. There are regions
which are completely dependent on coal industry (mining, logistic, power plants) and therefore even the
public opinion is against slowing the coal industry down. To sum up the current situation in this field:
both government and corporations know the turn away from fossils will happen, but so far they do not
know when, so they keep it on the same levels. On the other hand, the future investments into coal
power plants are not planned anymore.
However, in the field of domestic solar energy source (both thermic and PV) it shines for better
times. Thanks to several factors as massive support programmes for domestic users, constantly cheaper
and more efficient solar technologies, or relatively more sunny days, people are turning into domestic
solar generation more and more. In the year 2016, there were 540 projects accepted in the support
programme ”Nova zelena usporam” (New green for savings, translated.) with the overall power of more
than 4.8 MW. This last trend is giving new hope for the renewable industry [25].
This programme is indeed a part of The National Programme to Abate Climate Change Impacts
in the Czech Republic that has been developed under the requirements of the European Council and
was passed by the Czech government. The programme investigates the impacts of the climate change
happening across various sectors and sets a national strategy leading towards a reduction of the neg-
ative impacts. It includes data on GHG emissions in the Czech Republic, covering projections of future
18

development, and offers suggestions for measures to reduce GHG emissions. Its main targets for the
period starting after the end of the first commitment period of the Kyoto Protocol include the following
demands [1]:
• Reduce CO2 emissions per capita by 3% until 2020, compared to 2000.
• Reduce total aggregate CO2 emissions by 25% until 2020, compared to 2000.
• Increase the share of RES in primary energy consumption to 20% until 2030.
To sum it up, the Czech Republic has still to make much effort to get at least closer to the EU average,
regarding GHG emissions and share of RES. The fundamental thing is that the government has already
realised this need and is slowly preparing for the shift towards renewables. However, comparing to other
European countries like Germany, Austria or Portugal, the Czech Republic is still a few years or decades
behind.
19

20

Chapter 3
Conditions for Wind Power in the
Czech Republic
In fact, wind energy is also a form of solar energy as the wind is a product of sun. Wind is generated by a
horizontal flow of air masses due to temperature and pressure differences in various altitudes. Rotation
and shape of the surface of the Earth and also have a significant impact on the direction and robustness
of this air flows.
Potential of wind energy is known from ancient history when original sailboats were powered by the
wind. The very first applications of wind-powered motors to generate mechanical work were recorded in
ancient China, Egypt and medieval Europe as well. A dynamic growth of wind power could be witnessed
during the colonisation of the western part of the USA. There were more than 6 million of small multi-
blade wind turbines primarily used to pump water from underground to reservoirs (see Figure 3.1).
Figure 3.1: Multi-blade wind turbine used mainly during the colonisation of the USA [26].
The beginning of the 19th century has brought a breakthrough in this industry. Thanks to the invention
of the dynamo, the aerodynamic forces pushing on the rotor blades could transform the wind power not
only to mechanical work but also to the electricity, as we know today.
The rise of modern wind power has begun during (or thanks to) the oil crisis in the 1970s. Both signif-
icant rises in fuel prices and environmental concerns associated with limited supplies of fossil resources
21

have led to the reassessment of energy policies and development of RES, especially in developed coun-
tries. Another important impulse for the rise of wind generation was the embargo of OPEC countries on
oil exports to the USA and other industrialised countries. Czech wind generation industry flourished in
1990 - 1995, but has stagnated subsequently [27].
As the importance of wind power has been rising during the last years, various public opinions
and myths (both positive or negative) have been triggered as well. In the following chapter, we will
analyse climate conditions for the wind power in the Czech Republic and also assess the impact on the
environment.
3.1 Climate Conditions
Climate (including the wind) conditions in the Czech Republic are studied mainly by the Institute of
Atmospheric Physics of the Czech Academy of Sciences and the Czech Hydrometeorological Institute.
Targets of these studies are especially [28]:
• Determination of wind potential field in the country (creation of wind maps).
• Identify the amount of wind energy in a given location and altitude (using scientific knowledge).
• Development of methods for assessing the optimal location for building wind power plant.
• Improving methods for electricity generation prediction (in terms of wind power), which is an es-
sential factor for maintaining the stability of the national power structure.
3.1.1 Energy from Wind
Wind turbines obtain their energy from the reduction of speed of the surrounding flowing air - the wind.
In other words, the kinetic energy of the wind is (partially) converted into kinetic energy of the rotor of
the wind turbine, which is subsequently converted into electric energy. As can be seen in Figure 3.2,
the kinetic energy of the flowing mass E through a surface withe area A during the time t is given by
equation 3.1.
Figure 3.2: Scheme of the available power from wind.
E =1
2mv2 =
1
2(Avtρ)v2 =
1
2Atρv3 , (3.1)
22

where m is the mass of the air, v is the velocity of the wind and ρ is the density of the air.
Then, because energy is the integral of power, the power P of the wind passing through a surface
with area A, which is considered as perpendicular to the direction of the air flow, is:
P =dE
dt=
1
2(ρA
dx
dt)v2 . (3.2)
P =1
2ρAv3 . (3.3)
Where x is the thickness of the volume of air.
Now, we introduce the Betz’s law (published in 1919 by the German physicist Albert Betz) which
shows the maximum power that can be obtained from any Newtonian fluid (including the wind) indepen-
dently on the design of a particular wind turbine. It was proven, that the theoretical maximum energy
which can be captured by a wind turbine is 16/27 or 59.3% of the kinetic energy of the wind [29].
Then, the maximum power of wind turbine is:
Pmax = Cp1
2Aρv3 , (3.4)
where Cp is the power coefficient with maximum value of 0.593. However, modern large wind turbines
can reach maximum value for Cp from 0.45 to 0.50 [29].
3.1.2 Wind Maps
As we already stated in the previous section, wind characteristics are dependent on the roughness of
the terrain. Flowing of the air is strongly deformed by the surface of the Earth. Therefore, the intensity
of the wind is typically lower in the lowlands while stronger in the mountainous areas. In Figure 3.3 we
can see, how is the wind changed by a hill.
Also, as one can observe from equation 3.4, the power of the wind rises with the third power of wind
speed. Accordingly, it is the wind speed which is one of the most important parameters for determining
a proper spot for a wind turbine. Another relevant parameter is the direction of the wind. However, we
can solve this (partly) by using wind turbine with rotating nacelle.
Europe
For a preliminary estimation of a proper area for a wind turbine, we usually use the wind maps, in which
the spatial distribution of the wind speed (or wind power) is graphically visualised. To get a general
picture, first, we analyse wind map of whole Europe, which can be seen in Figure 3.4. Countries with the
most favourable conditions for wind power are Ireland, the UK, Norway, Denmark, France, Netherlands,
Belgium, Spain, Austria and Poland. All these countries actively invest into wind power. What also do
these countries have in common is the access to the sea or ocean, and therefore they can use off-shore
wind power, which is very intensive, rather stable and can be implemented in a very extensive way, as
there are not as many demographical and geological obstacles. When we look closely into the land
23

(a)
(b)
Figure 3.3: (a) Streamlines of wind over a mountain. The more closely are the lines to each other, thefastest is the flow of the wind. (b) The vertical profile of wind speed [30].
itself, Portugal and the Czech Republic has very similar wind conditions and rather an average one.
Still, Portugal uses much more wind power than the Czech Republic (see Figure 2.8). The answers
are various, but one of them is the access to the ocean, which is a huge resource of wind energy and
Portugal has successfully implemented its first testing off-shore wind power plant.
From this very general and approximate estimation, we can conclude that the climate conditions
for wind power in the Czech Republic are not too different from the other countries (e.g.: Germany or
Romania), which are implementing wind generation at much greater extent.
Czech Republic
Thanks to the new web application created by the Institute of Atmospheric Physics of the Czech Academy
of Sciences we are able to illustrate a very accurate wind map of the Czech Republic, in the Figure 3.5.
This map and data were simulated and calculated directly for the use of small wind power plants, as the
data comes from the altitude of 10 meters above the ground level [31].
Most of the modern wind turbines are able to generate electricity at the minimal speed of the wind
4 m/s. To achieve economic feasibility of a wind turbine project, we need the minimum average wind
speed of 4.5 m/s. In Figure 3.5, this speed is represented by yellow colour. We can see that a reasonably
significant part of the surface of the Czech Republic is marked as yellow thus with favourable minimum
wind speed [32, 33].
However, minimum speed is not the only limit for a wind turbine (especially the smaller ones). The
majority of wind turbines generate maximum power at around 15 m/s. If there is stronger wind, the wind
turbine must stay stopped and braked against any movement. Furthermore, blades of the rotor usually
24

Figure 3.4: Wind map of Europe for height of 50 meters above the ground level [30].
turn into the position with the lowest resistance to the air flow. Accordingly, analysis of extremal wind
conditions and their frequency on the site is a fundamental step before taking further as the economic
feasibility is essentially dependent on the amount of generated electricity, so we want the turbine to
operate as much as possible [32].
In Figure 3.6 we can observe a map of heavy impact winds which occur at the frequency of 5 years
or more (at the altitude of 10 meters above the ground level). As we can deduct from this map, most of
the surface lays on the lowest boundary of the scale, and there are no significantly dangerous areas.
The average annual wind speed is usually determined by the absolute frequency of measured wind
speeds during the year. The majority of wind turbines generate maximum power at around 15 m/s
(effective wind speed). In areas with the average annual wind speed of 4.5 m/s, the effective wind speed
is reached only for few hours a year.
In Figure 3.7, we can see the average wind speed determined by the absolute frequency of wind
speeds (left-hand side) and estimated electricity generated throughout a year (right-hand side) depend-
ing on the wind speed, where E [kWh] is amount energy produced at a given wind speed, n [days]
represents frequency, x [m/s] stands for the average value of the wind speed, x [m/s] for modus, the
25

Figure 3.5: Wind map of the Czech Republic, calculated for the altitude of 10 metersabove the ground level [31].
Figure 3.6: Map of extreme impact winds in the Czech Republic with frequency of 5 years or lower,calculated for the altitude of 10 meters above the ground level [31].
most commonly measured value of the speed, ci [m/s] is the given speed and cE [m/s] represents the
most economic (efficient) value of the speed regarding the electricity production [32].
Regarding only the climate conditions for wind energy in the Czech Republic, we can conclude, that
there are rather favourable wind conditions for implementing either small domestic wind power plant or
big industrial one. Although there are countries with far better conditions, there are also countries with
26

Figure 3.7: Average wind speed determined by the absolute frequency of wind speeds and estimatedelectricity generated throughout a year at a given speed [32].
comparable or even worse conditions which are implementing wind power at a much more intensive
level.
It is also needed to say, that before the final selection of the site for placement of wind turbine, a long-
term wind speed measurement should be performed on the site. Then we can calculate the estimated
power generated using the wind frequency and power curve (see Figure 3.8) of the specific wind turbine.
Figure 3.8: Typical power output (power curve) of a wind turbine [34].
3.2 Non-climate Conditions
Wind speed and climate conditions are not the only limits that have an impact on the decision about
installing wind turbines and determining the right spot. There are other important limitations and restric-
tions which we need to take into account during the assessment of the feasibility of the wind power plant,
such as:
• Technical feasibility: especially the geological subsoil (when to be placed on a tower constructed
on the ground) or the load capacity of the roof (when to be placed on a building).
27

• Noise limits: the wind turbine should be constructed far enough from the residential area to meet
the noise regulation.
• Protection of nature: Wind turbine should not disturb the landscape character.
• Migrating birds: Wind power plant can not interfere with migrating routes of endangered species.
3.2.1 Technical Feasibility
Wind turbines can be situated either on its own tower (most of the cases) or the rooftop of a building.
Generally, to achieve a cost-effective wind power, we need steady and sustained winds. There is a rule
of thumb that a wind turbine should be located at least 9 meters higher than any obstacles within 150
meters (see Figure 3.9)[35].
Figure 3.9: Proper distance of a wind turbine from other objects in order to avoidturbulent non-steady winds) [36].
However, if we intend to emplace a turbine on the rooftop, we must be double-careful as a residential
rooftop usually does not offer either steady or sustained wind. As the wind speed rises with altitude,
top of the houses are often lower than we need. Furthermore, more obstacles can negatively affect
the character of the wind since they are closer. All these barriers, including the rooftop itself, causes
turbulence in the wind. These choppy gusts of wind coming from random direction significantly decrease
the power output of the turbine and causes more mechanical stress that cuts the turbine’s lifetime [35].
If we still need to place the turbine on the roof top because of some reasons, according to a recent
study, turbines should be mounted more to the centre of the rooftop rather than at the perimeter, because
of the turbulence which is higher around the outside of the roof. Still, the best suggestion, in general, is
to avoid mounting turbines on the rooftops [37].
Moreover, a stand-alone wind turbine as is depicted in the Figure 3.10b, has another huge advantage.
It can be installed as a tilt-down tower. In case of maintenance or severe winds which can break the wind
turbine, we can tilt the turbine down to horizontal position, so it does not get broken, see Figure 3.11.
28

(a) (b)
Figure 3.10: (a) Small wind turbine mounted on the rooftop of a residential house [35]. (b) Three typesof towers for a stand-alone wind turbine [38].
(a) (b)
Figure 3.11: Different types of tilt-down systems of small wind power plants [39, 40].
3.2.2 Noise Limits
The impact of acoustic emissions from wind power plants to the surrounding is often overemphasised
by environmentalists who stand against the wind power. However, the noise of small wind farms is often
the cause of disputes at the communal level.During the operation, two kinds of noise are generated by
the turbine.
Firstly, there is mechanical noise, which is created by the moving parts in the engine room/box of
the turbine (generator including fan, gearbox, pitching mechanism, brakes, and so forth). The amount
of this kind of noise emitted into the surrounding environment is dependent on the quality of individual
mechanical parts (e.g. gears in the gearbox) but also on the general assembly and adjustment of internal
and external parts (e.g. bonnet or nacelle). However, the majority of currently produced wind turbines
have these elements and parameters optimised [33].
The second type of noise is aerodynamical sound which is generated by the interaction of flowing
29

air with the surfaces of the blades on the rotor and releasing of air vortexes behind the blades edges.
The frequency spectrum of this sound is very balanced and decreases as the frequency rises. This
aerodynamical noise is currently being reduced by more modern blade designs [33].
The intensity of a perceived noise by a human ear is greatly influenced by the ratio of the wind turbine
noise intensity to the intensity of other noise, referred as background noise. It is known, that the noise
generated by the viscous and turbulent friction of air on the rough surface of the earth can reach very
high values (especially in a mountain terrain). For instance, during a windstorm or a hurricane, it is
almost impossible to hear a human voice because of the intensive background noise. There was an
experimental test on one of the very first wind power plants in the Czech Republic (served mainly for
experimental reasons) in Krusne hory, depicted in the Figure 3.12. The measurements showed, that
during the winds up to 5 m/s the level of background noise was between 30 and 40 dB, but at the wind
speeds around 6 m/s the background noise ranged from 33 to 47 dB and at wind speed above 8 m/s the
background noise exceeded 45 dB [33].
Figure 3.12: Experimental wind power plant in Krusne hory, one of the very first wind power plants inthe Czech Republic (1993) [41].
The Czech Government Regulation No. 502/200 Sb. on the protection of health from adverse effects
of noise and vibrations sets the maximum permissible level of the noise from the wind farms in daylight
(6-22h) to 50 dB and 40 dB in the night. However, the Regulation does not take into the account the case
when the background noise exceeds the noise generated by the wind farm. In Germany, for instance, the
approach is different. The recommendation is to build the wind turbine/farm more than 300 meters from
an individual house and more than 500 meters from the group of houses (e.g. village, neighbourhood,
and so forth) [33].
There is also another adverse health effect generated by the wind turbine, but applicable only to cer-
tain sensitive individuals. The stroboscopic effect arises from the sunlight and alternating rotor blades.
This effect is only visible in the low sunlight. When planning larger wind farms, this effect should also be
taken into the assessment of the project.
30

3.2.3 Protection of Nature
It is obvious that (so far) no energy source is completely carbon free. Every mean of energy generation
produces either direct or indirect carbon footprints. However, electricity production from wind power
leaves a minimal negative environmental impact in comparison with traditional energy sources. Wind
turbines do not burden the environment with any waste neither they need any fuel. They do not produce
gaseous or solid emissions, including CO2 or other greenhouse gases, into the atmosphere. When
using wind power, we do not need to store used fuel or fly ash, they do not require any water, nor they
produce any waste heat.
Landscape Character
When constructing a wind turbine, the construction site is burdened very less comparing to other power
plants. The adaptation of surrounding terrain is necessary only for a short period of construction to allow
heavy machinery to access the building site. Once the construction is completed, the terrain is restored.
The construction itself is relatively short; it takes up to two months. Obviously, in the case of small
domestic wind turbines, the construction time takes only a few days or weeks. After discontinuation of
the plant, it can be disassembled within two days. Unlike solar power plants, wind farms also allow using
the agricultural land at it (almost) original range.
(a) (b)
Figure 3.13: (a) Concrete fundaments for a large wind turbine. (b) Escalation of arotor for a wind turbine [42, 43].
When constructing a wind power plant in the Czech Republic, the Law No. 114/92 Sb. On Nature and
Landscape must be respected. It is forbidden to escalate turbines in national parks, nature reserves,
protected areas of the first zone and near national monuments. However, most of the areas wind highest
wind speed potential are also national parks or areas of protection (approximately 60 - 70 %). Currently,
this is a significant bottleneck for the wind power development in the Czech Republic, and some envi-
ronmentally friendly compromise solution should be considered [33].
The landscape is one of the most sensitive aspects of wind power and should be taken into account
carefully. Although a not small group of individuals can find the turbine aesthetical, some may not. This
31

subjective character of this issue leads to difficulties during the assessment. Currently, there are no
official methodologies for emplacement the wind power plants not to burden the land view, and if there
are some unofficial, they do not take into the account the physical laws for an efficient wind power (e.g.
they recommend to plant trees near the turbines, which causes turbulences in the air flow) [33].
It must be admitted that wind turbine, especially large commercial ones, disrupt the original land-
scape. However, they do not interrupt it more than some factories, coal or nuclear power plant, blocks
of concrete buildings, and so forth. Usually, it is only a matter of approach and choice and argument
on disrupting the landscape is often misused by the anti wind power protagonists. Let’s believe, that
the public opinion on these, in my opinion, elegant devices, will become more positive and will open the
gates for a bloom of the wind power in the Czech Republic
Protection of Migrating Birds
Protection of avifauna is often a subject of discussion and sharp disputes with ornithologists and bird
protectors as the wind power is a relatively new process in the Czech Republic and there is no significant
experience in this field. At the same time process, there is no systematic and long-term observation that
would prove the negative impact of wind turbines on the birds and short-term experience also do not it.
According to the Law No. 100/2001 Sb. on the Assesment of Environmental Impact of the project,
it is obligatory to assess the impact on the fauna, flora and ecosystems. In the Czech Republic, there
is only one official publication which studies the impact of the wind power plants on the birds. The
experiment was conducted one month before and after the construction of the experimental wind power
plant in Krusne hory (see Figure 3.12). The conclusion of the research was following: ”It was found that
no deserving locality protection was affected by the construction of the wind power plant. In the vicinity,
there was no nesting site of any endangered species, except for the Carpodacus Erythrinus, whose
nest occurrence was recorded after the construction of the wind power plant. The presented results
are evidence that the operation of the wind farm does not significantly affect birds nesting communities.
The detected differences in the open area near the wind power plant are undoubtedly unrelated to its
operation. It was not possible to analyse the situation during autumn migration for time reasons. Based
on our own results and the experience of foreign authors, it can be assumed that the wind power plant
will not have a significantly disturbing effect on avifauna [33].”
In the foreign literature, many research observations can be found on the behaviour of migrating
birds at wind farms. Generally speaking, migrating birds usually fly over these visible obstacles, in rare
cases, they fly through them. A rather more complicated situation occurs at night or fog. It turns out that
sailing birds can feel the turbulences of the flow of winds from wind turbines up to a few hundred meters.
Foreign statistics show that the average number of bird collisions per kilometre of continuously located
wind turbines corresponds to the number of birds killed by the car crash on a kilometre of a busy road
and is much smaller than the number of bird accidents per kilometre of the power transmission lines [33].
In the Figure 3.14 we can see a map of the Czech Republic with all protected nature areas and main
storks migration routes. As we stated before, it is forbidden by law to construct any wind turbine in the
national parks and other areas with the highest protection (red areas in the Figure 3.14). Other protected
32

Figure 3.14: Territories suitable for the location of wind power plants with regards on natureprotection [44].
areas or territories with migration routes may require additional permissions issued by a respective insti-
tute. However, when constructing small wind turbines which are intended mainly for domestic generation
and consumption, it is obviously not that big interference to the landscape. Thus it does not require that
much assessments and permissions as in the case of large commercial wind power plants. We will
discuss the legislation background and permission process for the small domestic wind power plant in
the next section.
33

34

Chapter 4
Legislation Processes
Under the term Legislation, we will discuss two main topics, which are undoubtedly related to each other
(see Figure 4.1). Legislation generally is created by Institution and executed by Instruments, such as
permissions, regulations, support mechanisms, feed-in tariffs, and so forth. In the following section, we
will deliver an overview of these institutions and instruments in the Czech Republic and briefly explain
their impact on the current situation in RES (especially wind power) in the Czech Republic.
Figure 4.1: Legislation: Institutions and tools.
4.1 Institutions
International Institutions
Regarding institutions with an international scope, there is a countless number of them, largely with a
non-governmental or intergovernmental base. These organisations usually focus on reporting, predic-
tions and recommendations in power generation and policies, which can result in national laws and bills.
However, there are also executive organisations under the framework of the EU which issue binding
regulations for its members.
35

The International Energy Agency was established in 1974 - in the wake of the oil crisis - and consists
of 29 member countries (most of the EU countries, Turkey, Japan, New Zealand, Australia, the USA
and Canada). This Paris-based autonomous intergovernmental institution works under the framework
of the OECD and acts as a policy advisor for its member countries. Within their scope, they focus on
the ”3Es” which are three main fields of interest: energy security, economic growth and environmental
protection. The IEA possess with a broad role in promoting alternative energy sources (including RES),
rational energy policies and international power technology cooperation. One of their flagship outcomes
is the World Energy Outlook, an annual widely recognised publication, source for global projections and
analyses [1].
The Global Wind Energy Council is an international member-based organisation for the wind power
industry, founded in 2005 as a credible multinational forum. Its mission is to promote and establish the
wind power as the answer to current world energy challenges, giving valuable economic and environ-
mental benefits. The GWEC represents over 1500 companies, organisations and institutions in more
than 80 countries and they work at the highest international political level to create policies environment
for wind power. Their annual publications, Global Wind Energy Outlooks and Global Wind Reports pro-
vide valuable analyses, reports and predictions for the wind power industry, in particular for the member
countries [2].
The WindEurope (formerly known as the European Wind Energy Association) is a Brussels-based
organisation focused on promoting the wind power in Europe, with over 600 members in more than 50
countries. Their goal is to become a leading voice in wind power industry and the driving force for the
sector in the future.
Although there are much more other international organisations, associations and institutions, they
usually do not such an executive impact on national policies, but rather they play a role of a predictor or
a reporter. Besides these organisations, there are also international treaties such as the Kyoto Protocol
or the Paris Agreement, which have been signed under the framework of the UN and the subject of such
agreements is usually reflected in the national policies afterwards. However, national institutions have
more direct impact on the current energy situation and policies. In the following sections, we will briefly
describe most of the governmental stakeholders in public policies for energy.
Energy Regulatory Office
The Energy Regulatory Office of the Czech Republic (ERO) was set up on 1 January 2001 as a central
body of state administration for power regulation. The ERO’s task is to supervise the Czech power
industry, particularly in the following means:
• Regulation of energy prices,
• Promotion and support of RES, secondary energy sources and combined heat and power (CHP)
generation,
• Protection of consumers’ interests and licences holders,
36

• Issuing licences for new power plants (above 10 kW),
• Supervising the competition conditions,
• Promoting competition in the energy sector,
• Market surveillance in the power sector.
The ERO also maintains active contacts with other similar European offices and is a member of the
Council of European Energy Regulators (CEER) [44].
State Environmental Fund
The State Environmental Fund of the Czech Republic (SEF) is a specifically focused institution which is
an important financial resource for the activities regarding protection and improving the environment. It
is one of the fundamental economic tools for fulfilment:
• obligations arisen from international agreements on the protection of the environment,
• obligations arisen from membership in the EU,
• national environmental policies.
The SEF is the main tools for various support mechanisms regarding the environment. Its revenues
consist mainly of payment for polluting or damaging the environments (waste water discharge fees,
land tax, air pollution charges, waste disposal fees). The Minister of the Environment decides on the
particular use of the funds, usually on the basis of the advisory body - the Council of the Fund. It is
needed to say that these revenues are not a part of the National Budget.
The SEF ensures especially:
• promotion and support mechanisms for environmental improvement projects and associated con-
sultancy and advisory activities,
• evaluation of the applications for the financial support of the environmental projects
• creating and ensuring various support programs and policies
• final evaluation of the projects and their achieved effects.
During the existence of the SEF, it has provided support for nearly 20 000 project in a total amount
of 4.8 billion euros [45].
Ministry of Industry and Trade
The Ministry of Industry and Trade of the Czech Republic (MIT) (formerly called the Ministry of Economy)
is governmental ministry established in 1992. It is a central state administration body for national policies
in the field of industry, trading, commodities and economic relations with foreign nations.
The MIT coordinates administration of:
37
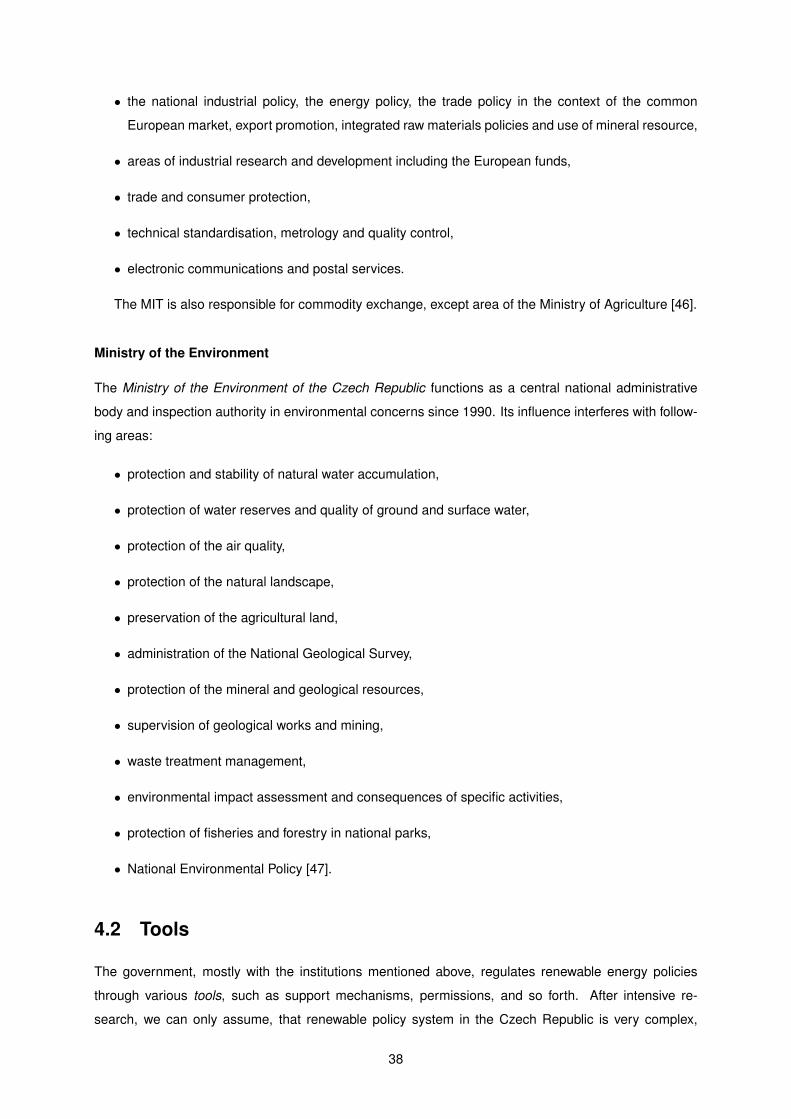
• the national industrial policy, the energy policy, the trade policy in the context of the common
European market, export promotion, integrated raw materials policies and use of mineral resource,
• areas of industrial research and development including the European funds,
• trade and consumer protection,
• technical standardisation, metrology and quality control,
• electronic communications and postal services.
The MIT is also responsible for commodity exchange, except area of the Ministry of Agriculture [46].
Ministry of the Environment
The Ministry of the Environment of the Czech Republic functions as a central national administrative
body and inspection authority in environmental concerns since 1990. Its influence interferes with follow-
ing areas:
• protection and stability of natural water accumulation,
• protection of water reserves and quality of ground and surface water,
• protection of the air quality,
• protection of the natural landscape,
• preservation of the agricultural land,
• administration of the National Geological Survey,
• protection of the mineral and geological resources,
• supervision of geological works and mining,
• waste treatment management,
• environmental impact assessment and consequences of specific activities,
• protection of fisheries and forestry in national parks,
• National Environmental Policy [47].
4.2 Tools
The government, mostly with the institutions mentioned above, regulates renewable energy policies
through various tools, such as support mechanisms, permissions, and so forth. After intensive re-
search, we can only assume, that renewable policy system in the Czech Republic is very complex,
38

non-uniform and ever-changing. Therefore, it is complicated to orientate in this extremely dynamic poli-
cies. For instance, after contacting institutions of various municipalities and getting their statements on
the permitting processes for small domestic wind turbines, we obtained entirely different answers on the
necessary procedures.
To be more specific, in small town of Veznice, which is a home to one of the first and biggest commer-
cial wind farm in the Czech Republic, one does not need almost any agreement from the institutions, as
long as the wind turbine is for domestic purposes, located on the own land and is not higher than specific
parameters given by the aviation authorities. In contrast with the capital city of Prague, where every new
construction is a subject to the Land Use Plan of the city, and it involves extremely high bureaucratic
processes to obtain a permission even for a small domestic wind turbine.
Therefore, it is not possible to generalise the process of getting a building permit for a new domestic
wind turbine in the Czech Republic. However, the situation is quite different in the field of support
mechanisms, feed-in tariffs and licences from the energy regulatory authorities and therefore in the
following sections we will focus on these tools further.
The legislation background for the connection of a new domestic renewable source is illustrated in
the Figure 4.2. When installing a new power source, one has two alternatives according to the nominal
power of the system.
Figure 4.2: Legislation scheme for renewable micro-sources
39

4.2.1 Installations above 10 kW of the nominal power
For the installations of RES with the nominal power above 10 kW, it is obligatory to get a license from the
Energy Regulatory Office of the Czech Republic, which involves more administration and bureaucracy.
However, with the license, it is possible to become an official energy market participant and reach on
one of the two support mechanisms, based on the amount of produced electricity. One has a freedom
to choose either Green Bonuses or Feed-in Tariff, which are described in the following sections.
Green Bonuses
Surpluses are purchased by individual traders on the electricity market, and the DSO pays for each kW
produced according to the price decision in the given year, which is regularly issued by the ERO (see
Table 4.1) and it varies for every renewable energy systems and year of the construction.
The possibility of higher economic efficiency compared to the feed-in tariffs is given by the amount
of own consumption and the price of electricity. In this solution, all the energy produced is preferably fed
into the sub-distribution system of the building, where it is preferably consumed by its own appliances
and surpluses are supplied to the distribution system via a 4-quadrant electricity meter. Scheme of such
a solution is illustrated in the Figure 4.3.
Figure 4.3: Connection scheme in case of using Green Bonuses support mechanism
40

This method is particularly convenient when the energy can be produced and consumed at least
partially at the same time. The advantage is saving in the installation of a new connection - the power
plant will be connected to the existing distribution. The disadvantage is purchase price per 1 kWh,
compared to the feed-in tariffs. This drawback of the lower purchase price is compensated by saving
electricity purchased directly from the distribution network.
Feed-in Tariffs
For this case, the buyer of the electricity produced in renewable micro-source is the DSO or TSO and
the fixed price for the whole period is guaranteed by law. Similarly, as in the case of Green bonuses, the
price level strongly depends on the mean of renewable energy production and year of the installation.
Comparison of Feed-in tariffs and Green bonuses is shown in the Table 4.1.
In this solution, all generated energy is supplied directly to the distribution system’s transfer point.
This place is usually an electric pillar equipped with an electricity meter that measures all the electricity
produced. All produced electrical energy is sold to the DSO and supplied to the distribution system.
Scheme of such a solution is illustrated in the Figure 4.4.
This connection method is suitable for larger installations, especially where the power plant is built
only for the purpose of supply to the grid. The advantage of this option is the higher purchase price
per kWh delivered compared to the electrical connection. At the same time, however, the owner has
to pay the share for connection according to the law - approximately 20EUR/Amp and to set up a new
supply point - the necessity of further investment. Also, any energy consumed by the own facility must
be bought from the DSO - it is not possible to directly use self-produced energy.
Figure 4.4: Connection scheme in case of using Feed-in tariff support mechanism
41

In the Table 4.1 and Figure 4.5 we can see price levels for both Green bonuses and Feed-in tariffs
compared to actual prices of the electricity on the Prague Stock Exchange. One can easily observe,
that prices of subsidies copy the trendline of actual prices on the stock market, but are significantly
higher. This regulation gives an undoubted advantage to RES. However, this state is not sustainable for
the long-term view as renewables must (and some of them already are) a competitive mean of energy
production compared to the traditional sources.
Table 4.1: Green bonuses and Feed-in tariffs prices for windenergy [44].
Supported renewable energy systemDate of commissioning Level of subsidies
from toFeed-in tariff
[EUR/MWh]
Green bonuses
[EUR/MWh]
Wind Energy
- 31.12.2003 153.48 134.34
1.1.2004 31.12.2004 138.67 119.53
1.1.2005 31.12.2005 131.93 112.79
1.1.2006 31.12.2006 120.44 101.30
1.1.2007 31.12.2007 118.34 99.20
1.1.2008 31.12.2008 115.43 96.29
1.1.2009 31.12.2009 105.28 86.14
1.1.2010 31.12.2010 98.51 79.36
1.1.2011 31.12.2011 96.36 77.22
1.1.2012 31.12.2012 94.26 75.11
1.1.2013 31.12.2013 87.83 68.68
1.1.2014 31.12.2014 81.81 62.67
1.1.2015 31.12.2015 78.87 59.72
1.1.2016 31.12.2016 75.38 56.24
1.1.2017 31.12.2017 73.89 54.75
To summarise it, if we want to trade the electricity which we produced, it is necessary to get a license
from the Energy Regulatory Office. With the license, we can choose from two schemes: Green bonuses
(lower price, but paid for every kWh produced regardless on the own consumption rate) or Feed-in tariff
(higher price, but we must supply all the production to the distribution network).
Green bonuses are an undoubtedly better option for an object with significant part of own consump-
tion, for instance, households, manufactories or farms. On the other hand, if we want to build a power
farm which the only option will be to produce and sell energy, without own consumption, using Feed-in
tariff is the more economical choice.
4.2.2 Installations under 10 kW of the nominal power
Since 2016, for RES installations under 10 kW of the nominal power, which usually includes smaller
domestic PV or wind power systems, the process is much more simplified. First of all, it is not necessary
to obtain a license from the ERO (however, it is needed if one wants to trade the self-produced energy
as in the section 4.2.1). Then, if we fulfil conditions given by law and ensure that there are no surpluses
42

Figure 4.5: Comparison of Feed-in tariffs and Green bonuses with actual prices of electricity on thePrague Stock Exchange market (PXE) [44].
flowing into the distribution grid, we do not even need permission from the DSO - this is the simplified
process. Otherwise, we need to undertake the standard process, which involves the permission of the
DSO.
Simplified Process
Relatively new law from 2016, on the conditions of connection to the power grid, allows the connection
of micro-sources to the distribution system in two modes: simplified or standard. The applicant for the
connection of the micro-source may, in the fulfilment of the conditions set out below, make a micro-
source installation at his supply point and then only ask the DSO to change the connection contract
which entitles it to put the micro-source into operation.
Conditions for the simplified process of connection of micro-source[48]:
• applies only to the connection to the low voltage distribution system (at an existing supply point),
• the installed power of the micro-source shall not exceed 10 kW,
• another plant is no longer connected to the supply point,
• the applicant will produce electricity only for own consumption (at the supply point), and electricity
will not be supplied to the grid (any unauthorised supply to the grid will be penalized in accordance
with paragraph 3.28 of the ERO price decision). This means that the value of the reserved power
is always 0,
43

• the current loop impedance value at the point of connection to the distribution grid (the measure-
ment is provided at the applicant’s costs) shall be less than:
– 0.47 Ω for micro-sources up to 16 Amp per phase (corresponding to a total installed capacity
of up to 10 kW for a 3-phase connection or 3.7 kW for a 1-phase connection),
– 0,75 Ω for micro-sources up to 10 Amp per phase (corresponding to a total installed capacity
of not more than 6,9 kW for a 3-phase connection or 2,3 kW for a 1-phase connection),
If any of the conditions is not met, the applicant must undertake the standard process.
Standard Process
If the applicant requires a non-zero value of the reserved power (which means that there may be sur-
pluses flowing to the distribution grid) or the impedance values measured at the supply point prior to
installing the micro-source are exceeding the permitted limit values, the simplified connection process
procedure can not be used and the installation of the micro-source can be started up to standard connec-
tivity assessment, in which case it is necessary to apply for a contractual relationship with the DSO [48].
After getting an agreement from the DSO and putting the micro-source into operation, it is possible
to supply surpluses to the distribution grid. In this case, a form of selling the surpluses depends on each
electricity supplier. Usually, they have special tariffs for prosumers, and they offer a discount from the
tariffs based on the amount of energy supplied to the grid. Another supplier offers a flat rate of around
50 EUR for every prosumer, independently of the amount of energy supplied to the grid. Obviously, these
rates are so low compared to the level of investments expenditures, that we cannot expect significant
incomes from that. Bothe mentioned-above modes are quick and almost administration-free, but they
are also less economically efficient, compared to the variants mentioned in the section 4.2.1.
Support mechanisms for installation under 10 kW
Unfortunately, installations under 10 kW of the nominal power cannot reach on production amount based
support mechanisms like Green bonuses or Feed-in tariffs, unless they received a license from the
ERO, which is, of course, a more complicated process. The only option of government support for small
domestic micro-sources, which did not have the license, is to get a one-time financial support based on
the level of installation investments.
This programme is called New Green for Savings and is operated by the State Environmental Fund.
Through this fund, we can get a maximum support for a micro-source with an accumulation of energy
up to 50 % (or approximately 6000 EUR) of the total investments, which is not a negligible amount.
Unfortunately, the programme only supports solar thermic and solar photovoltaic micro-sources, so there
is no possibility to get a support for a small domestic wind turbine [49].
44

Chapter 5
Simulation and optimisation
The following chapter will be dedicated to a techno-economic simulation, in which two possible scenarios
will be assessed: off-grid and on-grid installation. Further more, we will assess economic feasibility of
using batteries for the grid-connected solution with regards to the constraints. Both of the variants will
be evaluated with and without subsidies, to prove or disprove the economic feasibility of these support
mechanisms, as can be seen in Figure 5.1. The simulation and optimisation process will be run in
iHOGA software which is described in Section 5.1. It is needed to state, that we set the constraint of
maximum 5 % of grid-injected electricity (95 % or electricity must be produced by the domestic RES).
Figure 5.1: Scheme of the simulation variants.
The object of the simulation will be a small wind power plant, complemented by a PV generation and
diesel generator in case of the off-grid installation. The element of the energy consumption will be a
model of a small dairy farm which is described further in Section 5.2.
In the simulation, we will consider both costs and incomes. Since the character of the model object -
45

small dairy farm - is designed to profit from electricity selling, but mainly to minimise electricity expendi-
tures, we will subtract all the incomes from the expenditure and present the results in Net Present Value
(NPV).
5.1 Simulation Software
We will simulate and optimise the variants as mentioned earlier in a software tool called iHOGA (Hy-
brid Optimization by Genetic Algorithm), which was developed at the University of Zaragoza, Spain.
This software is primarily used for simulation and optimisation of stand-alone hybrid systems for power
generation based on RES. This software models systems with electricity load (both DC and AC) and
hydrogen consumption, as well as the use of water from reservoir tank [50].
The calculations can cover following technology elements [50]:
• PV panels,
• wind turbines,
• hydroelectric turbines,
• conventional generator (diesel or gasoline),
• fuel cells,
• electrolyser,
• hydrogen reservoir,
• batteries (lithium or lead acid),
• DC/AC inverter.
The iHOGA software comes with a wide database of all the components mentioned above.
It is possible to simulate and optimise systems connected or disconnected to AC grid with own
load curve. iHOGA also enables net metering. iHOGA can even model and estimate the lifetime of
batteries, which are usually the most expensive and replaced element of RES installations. The software
uses advanced multi-objective optimisation models such as the genetic algorithm. Optimisation is the
minimization of the total installation costs (or maximisation of the profits) over the facility lifetime, related
to the initial moment of the investment (Net Present Value, NPV). Therefore the optimisation is usually
economic (mono-objective). The scheme of simulation input and output variables is shown in Figure
5.2 [50].
Besides others, a significant advantage of the iHOGA software is the possibility of the automatic
irradiation, temperature and wind data for any geographic location from the official NASA’s web. The
software also takes into the account the possibility of selling surplus electricity to the AC grid, to buy the
unmet power load from the AC grid, as well as to trade the surplus hydrogen produced in the electrolyser
and stored in the reservoir [50].
46
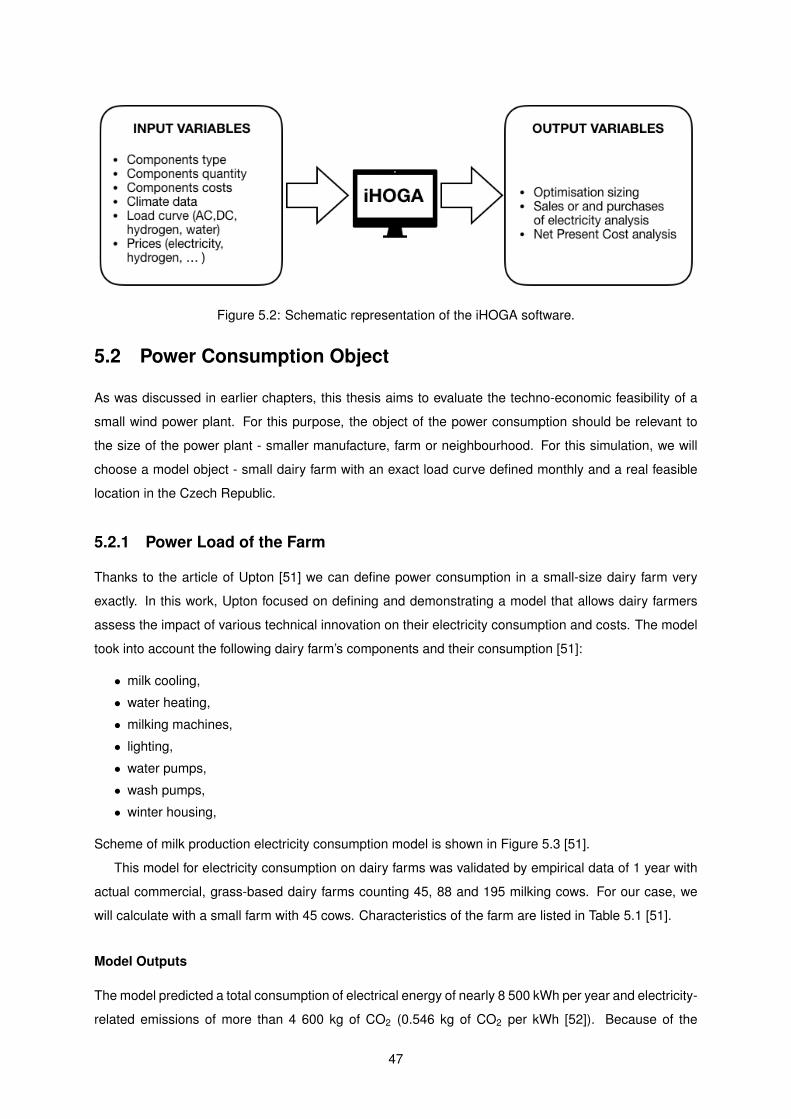
Figure 5.2: Schematic representation of the iHOGA software.
5.2 Power Consumption Object
As was discussed in earlier chapters, this thesis aims to evaluate the techno-economic feasibility of a
small wind power plant. For this purpose, the object of the power consumption should be relevant to
the size of the power plant - smaller manufacture, farm or neighbourhood. For this simulation, we will
choose a model object - small dairy farm with an exact load curve defined monthly and a real feasible
location in the Czech Republic.
5.2.1 Power Load of the Farm
Thanks to the article of Upton [51] we can define power consumption in a small-size dairy farm very
exactly. In this work, Upton focused on defining and demonstrating a model that allows dairy farmers
assess the impact of various technical innovation on their electricity consumption and costs. The model
took into account the following dairy farm’s components and their consumption [51]:
• milk cooling,
• water heating,
• milking machines,
• lighting,
• water pumps,
• wash pumps,
• winter housing,
Scheme of milk production electricity consumption model is shown in Figure 5.3 [51].
This model for electricity consumption on dairy farms was validated by empirical data of 1 year with
actual commercial, grass-based dairy farms counting 45, 88 and 195 milking cows. For our case, we
will calculate with a small farm with 45 cows. Characteristics of the farm are listed in Table 5.1 [51].
Model Outputs
The model predicted a total consumption of electrical energy of nearly 8 500 kWh per year and electricity-
related emissions of more than 4 600 kg of CO2 (0.546 kg of CO2 per kWh [52]). Because of the
47

Figure 5.3: Scheme of the milk production electricity consumption model [51].
Table 5.1: Mean values of a model farm [51]
Small farm characteristics
Farm area (ha) 48
Dairy herd size 45
Stocking density (cows/ha) 1.68
Annual milk production (litre/year) 255 278
Annual milk production per cow (litre/year) 476
limitation of the education version of iHOGA software, which sets maximum average load to 10 kWh per
day, we have to set the maximum annual load to 3 650 kWh. This means that all values regarding power
consumption of the model farm will be multiplied by a correction factor of 0.429. The adjustment will set
the total annual power load to 3 645 kWh (9,99 kWh per day - allowable limit).
The calculations were made on a monthly basis. Upton’s work dealt with three farms of different size,
in case of our modified small farm, water and wash pumps were not used for cleaning. Assuming that
all appliances are supplied by the grid, the total annual electricity price was calculated to 750.4 EUR
(1 EUR = 25.97 CZK) for the value of circuit breaker of 3 x 40 Amp at E.ON distribution. Therefore, the
unitary price for 1 kWh is 0.2056 EUR. The total model outputs are listed in Tables 5.2 and 5.3 [51].
Then, the total load power curve distributed by months is shown in Figure 5.4 [51].
After knowing monthly power consumption, we specify further daily load. The daily load is given in
48

Table 5.2: Model predictions for monthly and total kWh electricity consumption of amodified small-sized farm from January to June [51]
Model outputs January February March April May June
Milk cooling (kWh) 0 75.5 163 174 179 171,6
Water heating (kWh) 0 109 121 274 118 114
Milking machine (kWh) 0 75 112 95 98 95
Automatic scrapers (kWh) 62 56 0 0 0 0
Lighting (kWh) 36 15 4 3 3 3
Total electricity consumption (kWh) 98 331 401 390 399 384
Total electricity costs (EUR) 16 68 82 80 82 79
Electricity-related emissions (kg of CO2) 42 181 218 212 218 209
Table 5.3: Model predictions for monthly and total kWh electricity consumption of asmall-sized farm from July to December [51]
Model outputs July August September October November December Total
Milk cooling (kWh) 170 160 146 119 69 0 1 425
Water heating (kWh) 108 98 95 89 79 0 1 048
Milking machine (kWh) 98 98 95 98 52 0 914
Automatic scrapers
(kWh)0 0 0 0 0 62 181
Lighting (kWh) 3 3 3 3 2 15 77
Total electricity
consumption (kWh)379 359 338 309 201 78 3 646
Total electricity
costs (EUR)78 74 69 64 41 16 750
Electricity-related
emissions (kg of CO2)206 196 184 169 110 42 953
hourly distribution for each day of a month; we assume that all days of a particular month are identical. To
simulate real conditions, we introduce daily and hourly variability of 5 %. This randomness is generated
by the iHOGA software itself. Additionally, we consider only AC load (230 V), and we assume that the
model farm does not have any DC or hydrogen consumption.
In Figure 5.5 we can see a percentage distribution of the load throughout an average day (before
introducing variability).
After introducing this randomness, a monthly load distribution (for the month of June) is illustrated in
Figure 5.6 as obtained from the iHOGA software.
5.2.2 Location and Climate of the Farm
After describing power demand patterns and power load curve of the model farm, we set a possible
location of the object. Taking into regards all climate, biological, geographical and other important con-
ditions, the most feasible location for a farm which is supposed to use all climate conditions for the wind
energy, yet be sufficient enough for a high production yield, is the region of Vysocina (literally translated
49

Figure 5.4: Power load curve for a model farm, distributed by months [51].
Figure 5.5: Average daily load distribution of the model farm, before introducing random variability.
as Highlands Region), shown in Figure 5.7.
This countryside region is known as a very ”green” area, with rich nature, many hills, and perfect
conditions for farming - a significant number of Czech farms are located here. It is also one of the
windiest locations in the Czech Republic, and most of the few Czech wind power plants are located
here, as is shown in Figure 3.5.
The location’s climate data relevant for our simulation were downloaded from NASA Surface meteo-
rology and Solar Energy database and are listed in Table 5.4 [53].
Additionaly, we can see a monthly average wind speed and daily solar irradiation (horizontal and
50

Figure 5.6: Final load for the month of June including 5 % hourly and daily variability, as obtained fromiHOGA.
Figure 5.7: ”Vysocina” Region and location of the model farm (white dot) in the Czech Republic.
Table 5.4: Main characteristic of the model object and location [51, 53].
Characteristics of the Model Farm Unit Value
Latitude N 49.677
Longitude E 15.592
Elevation m 427
Annual wind speed average (at 10 m) m/s 7.4
Annual air temperature average C 7.8
Annual horizontal daily solar radiation average kWh/m2/d 2.99
51

tilted) in Figure 5.8 and 5.11. We can say that the average wind speed in this location is favourable
enough for installing a wind turbine [53].
Figure 5.8: Monthly average wind speed and power demand of the model location [51, 53].
In Figure 5.8 we can see that especially in the winter months, the power load curve does not meet
the average wind speed. In other words, during the months of the minimum power demand, there is
the highest average wind speed and vice versa. This complication can be solved by installing batteries
of larger capacity, or by selling the surplus electricity during the winter months to the grid. Both these
possible solutions will be assessed and evaluated in the simulation, and we will optimize the best solution
from the economic point of view.
Figure 5.9: Wind speed throughout a year on the model farm as modelled and obtained from iHOGA.
Since our model object is a small farm in a hilly area, the class of surface roughness we set is 2.5
which correspondents with agricultural land with many houses, bushes and plants, or preserving hedges
8 meters high with an approximate distance of 250 meters. Additionally, we can see the probability
52

distribution of the wind speed (Figure 5.10) and wind speed throughout the whole year (Figure 5.9). The
probability distribution is showing us, that wind with speed from 3 to 6 m/s are the most probable to
occur.
Figure 5.10: Probability distribution of the wind speed on the model farm as modelled and obtainedfrom iHOGA.
Regarding solar irradiation, the monthly daily average for horizontal and tilted surface is illustrated
in Figure 5.11. We assume PV panels slope of 30 and Azimuth 0, no tracking device, and ground
reflectance 0.2 which is a nominal value for green vegetation and some soil type [54]. After generating
model data for each time step in iHOGA simulation, we obtain solar irradiation data throughout a whole
year, depicted in Figure 5.12.
Figure 5.11: Monthly average daily irradiation (horizontal and tilted) and load of the modellocation [51, 53]
53

Figure 5.12: Irradiation on the model farm throughout a year as modelled and obtained from iHOGA.
5.3 Components
As was illustrated in Figure 5.1, we will simulate and optimise two possible connection variants: AC grid
connected or an off-grid solution. Then, both variants will be evaluated with incentives and without.
The iHOGA simulation and optimisation software is able to run genetic algorithms to propose tech-
nology components and its amount in order to provide the optimal solution from the economic point of
view. The optimisation is mono-objective, focused on overall value (NPV).
In the following sections, schemes and components for both cases will be introduced and described.
For every simulation, there is a database of components that were hand-picked according to the available
renewable technology market in the Czech Republic (or Central Europe, if it was available in Czech
market). Note that all prices were updated according to the price lists in manufacturers’ catalogues.
Prices were introduced without VAT, as all farms are usually treated as a legal person and therefore can
acquire these technologies without VAT.
5.3.1 Grid-connected Solution
Firstly, we will simulate, optimise and evaluate a grid-connected solution, consisting of the following
components:
• wind turbines,
• batteries (optional),
• DC/AC inverter,
• grid connection.
Note, that batteries are only optional because their economical feasibility will be assessed during the
simulation. Scheme of the grid connection is illustrated in Figure 5.13.
54

Figure 5.13: Scheme of the grid-connected solution for the model farm.
5.3.2 Off-grid Solution
Second option to be evaluated is an off-grid installation containing:
• wind turbines,
• PV panels,
• AC generator,
• batteries,
• DC/AC inverter.
Scheme of the off-grid installation is depicted in Figure 5.14.
Figure 5.14: Scheme of the off-grid solution for the model farm.
5.3.3 Wind Turbines
Since wind turbine is the key component of the simulation, we chose the input database very precisely.
It is needed to say that domestic wind generation, comparing to domestic PV systems, is not that de-
55

veloped field and the offer and availability of the technologies is rather limited, especially on the Czech
market. Therefore, during analysing, we had to search for the wind turbines on the global market which
may cause additional transportation and shipping fees. This fact was simulated by multiplying all acqui-
sition costs by a factor of value 1.1.
We introduced two types of costs: acquisition and replacement costs. The first-mentioned costs
include the wind turbine itself, tower and foundation. Replacement costs consist only from the wind
turbine (without a tower), as we assume that lifetime of a tower is higher than the wind turbine.
In addition, we assume that battery charger is included in the infrastructure of a wind turbine and
we also consider the effect of temperature on the power output (Temperature affects density of the air
which has an impact on the power generated by the wind turbine). To consider this effect, we use the
ERBS data reduction model which generates synthetic hourly data of surrounding temperature from
monthly average temperatures at hub height. The monthly average temperature during a year is shown
in Figure 5.15. Air density ρ at 427 meters above sea level is 1.176 kg/m3.
Figure 5.15: Monthly average temperature at hub height [53].
For the simulation and optimisation, we selected nine wind turbines from three different manufac-
turers: Southwest (USA), Bornay (Spain) and Hummer (China) - see Table 5.5. The maximum power
output varies from 0.55 kW (Southwest Air-X) to 27 kW (Hummer HWP-20). The price range is between
1 040 to 24 200 EUR.
In Figure 5.16, one can observe that wind speed with the maximum power output is much higher
that the most probable wind speeds (green area). Therefore, we expect that smaller wind turbine will be
more economically efficient for the installation. During the optimisation, we considered the windspeed
calculated to the hub height of the particular wind turbine.
Since wind turbines are the subject of intensive research, development and both public and scientific
attention, a continuous decrease in wind turbine costs is expected. Therefore, we introduce a negative
56

Table 5.5: Characteristics of wind turbines selected for the optimisation.
NameType Cost Replacement C. O&M Height Lifetime
[EUR] [EUR] [EUR/yr] [m] [yr]
Southwest Air-X DC 1040 693 55 9 10
Southwest Whisper 100 DC 3152 2547 94 11 15
Southwest Whisper 500 DC 10670 9020 215 15 15
Bornay 600 DC 4681 3361 94 13 15
Bornay 1500 DC 5363 4043 108 13 15
Bornay 3000 DC 8311 6600 166 15 15
Bornay 6000 DC 13262 11000 246 15 15
Hummer HWP-10 DC 15400 10450 308 16 20
Hummer HWP-20 DC 24200 18700 484 16 20
Figure 5.16: Performance curves of simulated wind turbines.
annual inflation rate for wind turbine costs of -1 % with maximum reduction of wind generation technolo-
gies costs of -25 %. This limit would be reached in nearly 29 years, see Figure 5.17.
57

Figure 5.17: Expected annual inflation rate for wind turbine costs.
(a) Southwest Air-X [55] (b) Hummer HWP-20 [56]
Figure 5.18: Wind turbines.
5.3.4 PV Panels
In order to ensure stable power output for the off-grid variant of our model system, solar PV panels are
an integral part of such an installation. As we can observe from Figures 5.8 and 5.11, solar irradiation
compensates lower wind speeds during summer months when there is higher power load. Therefore
such a hybrid wind-solar installation seems like an ideal solution for off-grid schemes.
In Table 5.6, we described the main characteristics of PV panels selected for the simulation. Unlike
in the case of wind turbines, PV panels have a wide offer even in the less developed Czech PV market
(comparing to Portugal). Therefore we could introduce an exact data, especially regarding the pricing
conditions.
Table 5.6: Input database of PV panels [57, 58, 59]
NameVnom Isc Pnom Cost O&M Lifespan Coef. Temp.
[V] [A] [Wp] [EUR] [EUR/yr] [yr] [%/C]
Victron Energy SPP101-12 18 6.32 100 123 1.23 25 -0.48
Victron Energy SPP280-12 36 7.70 280 437 4.37 25 -0.47
AmeriSolar 150 AS-6P18 18.2 8.70 150 128 1.28 30 -0.43
Canadian Solar S26P-260 30.4 8.56 260 146 1.46 25 -0.41
Jinko JKM260P-V 31.1 8.98 260 146 1.46 25 -0.41
Jinko JKM270P-V 31.7 9.09 270 153 1.53 25 -0.41
Kyocera KT265-6MCA 31 9.26 265 227 2.27 25 -0.45
Q.ANTUM Q.PEAK-G4.1 32.4 9.77 300 170 1.70 25 -0.39
BenQ PM060P00 31.2 8.83 260 161 1.61 25 -0.39
Zero (without PV)* 12 0 0 0 0 100 -1
58

We selected nine PV panels with nominal power ranging from 100 to 300 Wp and price level from
123 to 437 EUR (VAT excluded). Additionally, we introduced a virtual Zero PV panel, which represents
the possibility of excluding PV panels from the simulation.
Figure 5.19: PV panel Victron Energy SPP101-12 [57].
Besides O&M costs for each particular PV panel, we also included a fixed O&M cost for the whole PV
system at the level of 40 EUR per year. These costs are independent of the number and the type of the
PV panels used for the photovoltaic generator. Fixed operator cost and costs for maintenance material
are included, regardless of the size of the generator. The total expense for operation and maintenance
of the PV generator will be the fixed costs and individual costs of each PV panel multiplied by the number
of panels in the PV generator.
The iHOGA program calculates the power generated by the PV panels at each time step as a function
of irradiance and short-circuit current. However, a safety Loss Factor (LF≥1) must be implemented
which takes into account the dirtiness of the panels, shading, orientation errors, and so forth. For our
purposes, we set the Loss Factor to 1.2.
Similarly as in the case of wind turbines, according to the situation in PV market and R&D, we expect
a cost reduction in solar PV technologies. Therefore, we set the annual inflation rate for PV panels costs
to -1.5 % and the maximum reduction in current PV costs to -40 %. This limit would be reached in nearly
34 years.
5.3.5 Batteries
Batteries are also an essential element of stand-alone renewable energy systems. In case of assess-
ment the grid-connected variant, we will assess if there is economic feasibility to install a battery into the
system. In the off-grid case, we assume that battery is a necessary part of the installation and we will
evaluate which type of the battery is the most efficient for our model farm.
For the simulation, we selected 21 lead-acid battery plus one virtual zero battery for evaluating the
case without any form of energy storage (especially for the grid-connected case). The nominal capacities
of the batteries vary from 5.1 to 686 Ah, and the price range is between 40 and 256 EUR. Among this
selection, there are two types of batteries: OPzV and OPZS. They are both tubular lead acid batteries.
59

They have a higher lead content, and more surface is providing them with a higher energy density and
longer lifetime. The difference between OPzS and OPzV is following: OPzS is a flooded cell, which
means that the electrolyte (generally sulfuric acid) is in liquid form inside the cell. These types of cells
require occasional top ops with distilled water. On the other hand, in OPzV battery, the electrolyte within
the battery is in gel form which allows for recombining the electrolyte back into the water and allowing
for very little maintenance.
(a) FIAMM LM150 - an OPZS flooded battery [60] (b) Hoppecke 250 - a OPzV battery [61]
Figure 5.20: Batteries used in simulation.
In the case of lead-acid batteries, the state of charge of the batteries, as well as the maximum current
allowed by them can be calculated according to several models. For our case, we will use the simplest
model - model Ah (used by Schuhmacher in 1993) [62].
Besides the O&M costs of each battery, we introduce a fixed O&M costs 30 EUR per year for whole
battery installation.
Similarly as with PV panels and wind turbines, batteries are a technology in which significant re-
sources are being invested. Therefore a continuous drop in prices is expected. We set annual inflation
rate for batteries costs to -2 % and maximum costs reduction to -40 %. With these settings, the price
limit for batteries costs should be reached in around 25 years.
5.3.6 AC Generators
Regarding the off-grid variant of our case study, an AC generator is a crucial element in order to ensure
stability and backup option. Although we will design the energy storage to last for at least six days, an
object like a farm must have a backup source as it can directly affect lives of the animals.
We introduced four possible AC generators: two diesel and two gasoline powered. Their rated power
output range from 0.5 kVA to 3 kVA and price changes from 250 to 1050 EUR (see Table 5.8). We also
assumed the annual inflation rate of the fuel costs at the level of 2 %.
60

Table 5.7: Input database of PV panels [63, 60, 64, 61, 65]
NameCnom Voltage Cost O&M Imax Float life
[Ah] [V] [EUR] [EUR/yr] [A] [yr]
FIAMM LM150 162 2 110 1.1 32.4 15
FIAMM LM250 270 2 137 1.37 54 15
FIAMM LM350 390 2 165 1.65 78 15
FIAMM LM490 546 2 216 2.16 109 15
Hoppecke 250 206 2 166 1.66 41.2 18
Hoppecke 310 258 2 192 1.92 51.6 18
Hoppecke 350 390 2 178 1.78 78 20
Hoppecke 370 309 2 218 2.18 61.8 18
Hoppecke 420 468 2 213 2.13 93.6 20
Hoppecke 490 546 2 232 2.32 109.2 20
Hoppecke 600 686 2 256 2.56 137.2 20
Trojan 27 TMX 97 12 150 1.50 19.4 12
Trojan 27 TMH 106 12 195 1.95 21.2 12
Trojan 30 XHS 120 12 160 1.60 24 12
Trojan J150 134 12 154 1.54 26.8 12
Trojan J185-P 189 12 175 1.75 37.8 12
Sonneschein 6.6 S 5.1 12 40 0.4 1 18
Sonneschein 27 G5 23.5 12 110 1.1 4.7 18
Sonneschein 41A 34 12 119 1.19 6.8 18
Sonneschein 85A 74 12 238 2.38 14.8 18
Sonneschein 90A 78 12 255 2.55 15.6 18
Rolls 24 HT 80 68 12 166 1.66 13.6 15
Zero (without battery) 0 2 0 0 0 100
Table 5.8: Input database of AC generators
TypePapparent Cost O&M Life Fuel price Inflation (fuel price)
[kVA] [EUR] [EUR/h] [h] [EUR/litre] [%/yr]
Diesel 1.9 kVA 1.9 800 0.14 10000 1.15 2
Diesel 3 kVA 3 1050 0.17 10000 1.15 2
Gasoline 0.5 kVA 0.5 250 0.2 1000 1.25 2
Gasoline 1 kVA 1 400 0.2 1000 1.25 2
5.3.7 Other installation components
As our installation will contain elements, which produce DC output as well as we will charge and dis-
charge batteries, we need additional essential auxiliary devices, such as:
• inverter
• battery charger (rectifier)
• PV battery controller
61

Thanks to the development in RES area, many manufacturers started to produce hybrid all-in-one
devices that join the functionalities of all devices mentioned above. Since the offer of these devices is
extensive and they are not the objects of the primary interest, we introduced a generic all-in-one inverter
with properties described in Table 5.9.
Table 5.9: Properties of generic hybrid inverter
Generic Hybrid Inverter Properties
Power (VA) 5000
Lifespan (yr) 10
Acquisition cost (EUR) 3000
VDCmin (V) 12
VDCmax (V) 24
5.4 Other input data
To simulate the real conditions most accurately, we have to introduce additional input data and assump-
tions before running the optimisation.
For the grid-connected solution, we will allow purchasing unmet load from AC grid at a fixed price
including tax, DSO fees, and contracted current fees. Therefore we also set annual inflation for electricity
prices. Additionally, in the subsidies-free variants, we will not allow selling excess electricity to the AC
grid. Selling excess energy will be allowed only in the grid-connected variant with subsidies. In the
Czech Republic, neither net metering nor smart meters are available readily on the market, and the grid
is also not ready for purchasing excess electricity. Therefore, surpluses injected to the grid are not paid.
Furthermore, they can be even a matter of additional fees to the DSO if they excess certain level.
The situation will be different if we take subsidies into account. As was mentioned in section 4.2.1,
one can choose between Feed-in tariffs and Green bonuses. The Green bonuses are paid out for every
kWh of produced electricity, while Feed-in tariffs for every kWh injected to the distribution grid. Therefore,
for installations where we expect that significant part of the generated electricity will be consumed on the
same site, the Green bonuses are the preferred option. For this purposes, we will assume that our model
power plant will be deployed in 2017. We will also assume a one-time investment into connection to the
AC grid at the level of 1 500 EUR. This investments cover all the expenditures regarding constructing a
new supply point on a field without previous connection.
In case of the off-grid variant, we can use neither Feed-in tariffs nor Green bonuses. The only
possibility to reach on support mechanisms is to get a one-time financial aid as high as 6 000 EUR
for the PV part of the installation (note that maximum financial aid is 50% of the overall PV installation
costs).
We consider residual costs of the installation after the study period (based on the remaining life-time).
Additionally, we will assume a constant quota loan for 80% of the initial cost of investment, duration of
15 years and interest rate 7 %. All other input data are shown in Table 5.10
62

Table 5.10: Additional input data
Additional input data
Fixed buy price of the electricity (total) EUR/kWh 0.2056
Fixed sell price of the electricity in case of Green bonuses EUR/kWh 0.0548
Fixed sell price of the electricity in case of Feed-in tariffs EUR/kWh 0.0739
Maximum allowed unmet load purchased from AC grid % 5
Annual inflation rate % 2
Amount of days of energy autonomy (for the off-grid soulution) day 6
Time step for the simulation min 60
Study period yr 30
Nominal interest rate (price of money) % 6
Annual real discount rate % 3.92
Installation cost (fixed) EUR 300
Installation cost (variable) % of initial cost 2
Amount of loan % of initial cost 80
Loan interest rate % 7
Duration of loan yr 15
63

64

Chapter 6
Results
As was mentioned in Chapter 5, we ran simulation and optimisation for four possible scenarios:
• Grid-connected solution without subsidies - Variant ON WITHOUT,
• Grid-connected solution with subsides - Variant ON WITH,
• Off-grid solution without subsidies - Variant OFF WITHOUT,
• Off-grid solution with subsidies - Variant OFF WITH.
The simulation and optimisation in iHOGA software was mono-objective, the object was NPV over a
30 years study period.
6.1 Variant ON WITHOUT
In this case, the optimisation ran by means of enumerative method, where all possible combinations
were evaluated. This guarantees to obtain the optimal solution. The program evaluated 3 872 possible
combinations in less than two minutes. The optimal technologies together with all Net Present Costs
within studied 30 year period are listed in Table 6.1. Furthermore, we proved that using batteries for
this installation is economically efficient taking into consideration the constraint of max. 5 % of injected
power. Note, that we assumed residual value of the components at the and of study period based
proportionally on the level of remaining capacities and lifespan.
Table 6.1: Optimal components for ON WITHOUT scenario.
COMPONENTS
Technology Type (amount) Nom. CapacityInstallation - NPV O&M NPV Total NPV
[EUR] [EUR] [EUR]
Wind turbine Bornay 3000 (1) 3 kW 9 793,5 2 899,8 12 693.3
BatteriesHoppecke 600
(6s x 3p = 18)600 Ah 6 023.1 1 674.2 7 697.3
Inverter Generic 5 kVA 5 485.92 N/A 5 485.92
65

Regarding expenditures for the technical components, NPVs for all components, including O&M
costs, are shown in Figure 6.1. Note, that in year 30 there are negative costs (incomes) for the compo-
nents, this comes from assumption of residual value of the technology.
Figure 6.1: Net present costs for installation and O&M of all components - ON WITHOUT scenario.
Economic outputs of the optimisations are shown in Table 6.2. Additionally, composition of the total
expenditures is illustrated in Figure 6.2.
Table 6.2: Economic results of optimisation of ON WITHOUT scenario.
ECONOMIC RESULTS
Total cost without residual value (NPV) EUR 29 759.5
Total cost with residual value (NPV) EUR 27 927.7
Initial cost of investment EUR 16 536.9
Annual quota for 80% loan (7 % rate for 15 years) EUR 1 452.5
Purchasing from AC grid (NPV) EUR 555.2
Levelized cost of energy EUR/kWh 0.27
Total CO2 emissions kg CO2/yr 271
As can be seen in Figure 6.2 and 6.1, wind takes nearly half of the total costs. This is given mainly
because the technology is more complex to instal (foundations, tower). On the other hand, after the
first 15 years, when the lifespan of wind turbine ends, it is not needed to change whole installation, but
mainly only rotor part. This rapidly minimizes the second investments: while the initial investments in
66

Figure 6.2: Composition of total costs per technology.
wind turbine are nearly 8 500 EUR, after the 15 years we pay only around 2 500 EUR (in NPV). Second
highest investment consist of batteries installation. In this case, the initial investment is something more
than a 4 500 EUR, while the second one, after 15 years, makes 3 500 EUR. Total costs in inverter are
the third highest. However, this is mainly given by the shorter lifetime of the device - in 30 years period
we need to change it three times.
Energy Balance
In Figure 6.3 we can see total annual energy produced during a year by our model power plant. The
unmet load, which had to be injected from the grid, reached as little as 5%, which means that 95%
of all electricity produced came from the domestic renewable source. Additionally, we can observe a
significant amount of excess energy: 4 426 kWh, which is even more than the annual consumption of
the model farm itself (3 646 kWh). This energy could be used for additional equipment in farm, or for
neighbouring households, after adjustments in energy storage infrastructure, indeed.
6.2 Variant ON WITH
In this scenario, we evaluated a grid-connected installation with government support mechanisms. As
we had two options of subsidies (Green bonuses and Feed-in tariff), we firstly ran sample simulation
with both setting. Feed-in tariffs had much better economic results, so we present this variant of support
mechanism.
The whole setup remained the same as in the ON WITHOUT scenario, except the fact that we
allowed selling excess energy for 0.07389 EUR/kWh (see Table 5.10). The optimisation ran by means
of enumerative method, where all possible combinations were evaluated. This guarantees to obtain
the optimal solution. The program evaluated 7 744 possible combinations in less than three minutes.
67

Figure 6.3: Total annual energy as obtained from iHOGA
The optimal technologies together with all Net Present Costs within studied 30 year period are listed in
Table 6.3. Please note that we assumed residual value of the components at the end of study period.
Table 6.3: Optimal components for ON WITH scenario.
COMPONENTS
Technology Type (amount)NominalCapacity
Installation - NPV O&M NPV Total NPV[EUR] [EUR] [EUR]
Wind turbine Hummer HWP-10 (1) 15 kW 17 363,9 5 377 22 740.9
BatteriesHoppecke 600
(6s x 2p = 12)600 Ah 4 525.9 1 407.1 5 933
Inverter Generic 5 kVA 5 485.92 N/A 5 485.92
NPVs for all technical components, including O&M costs, are shown in Figure 6.4. Note, that in year
30 there are negative costs (incomes) for the components, this comes from assumption of residual value
of the technology.
Economic outputs of the optimisation of variant ON WITH are shown in Table 6.4. Additionally,
composition of the total expenditures for this scenario is illustrated in Figure 6.5.
Table 6.4: Economic results of optimisation of ON WITH scenario.
ECONOMIC RESULTS
Total value without residual value (NPV) EUR 18 041
Total value with residual value (NPV) EUR 17 094.9
Initial cost of investment EUR 22 201.4
Annual quota for 80% loan (7 % rate for 15 years) EUR 1 950.1
Purchasing from AC grid (NPV) EUR 405
Selling to AC grid (NPV) EUR 19 382.1
Levelized cost of energy EUR/kWh 0.16
Total CO2 emissions kg CO2/yr 317
68

Figure 6.4: Net present costs for installation and O&M of all components - ON WITH scenario.
Figure 6.5: Composition of total costs per technology - ON WITH scenario.
As can be seen in Figure 6.5 and 6.4, comparing to ON WITHOUT case, wind takes even higher
part of the total costs - 65 %. This is given mainly because it is more profitable to produce and sell the
electricity for the incentive price. On the other hand, because of more powerful technology, initial costs
are significantly higher, more than 22 000 EUR, and annual loan quota as well. However, higher initial
costs are compensated by earnings from selling electricity to the grid. Overall Net Present Earnings
69

from selling the electricity makes more than 19 000 EUR. Additionally, thank to the higher energy yield
and installed power we need 30% less batteries (12) comparing to the ON WITHOUT case.
Energy Balance
In Figure 6.6 we can see total annual energy produced during a year by our model power plant. The
unmet load, which had to be injected from the grid, is almost negligible (3%) and 97% of electricity
is generated from the domestic renewable source. Additionally, we can observe a significant amount
of excess energy, when the wind power plant produced more than 32 kWh, while model farm itself
consumes nearly ten times less (3 646 kWh). Small portion of this energy was stored in batteries
(1 684 kWh), but the most significant part (14 689 kWh) was injected and sold to the grid.
Figure 6.6: Total annual energy for ON WITH scenario as obtained from iHOGA
6.3 Variant OFF WITHOUT
This scenario is different from the previous two. As a main condition for this installation we set up
autonomous off-grid function. To ensure independence from the AC distribution grid, we added PV
panels to use more resources and an AC generator as a backup device. We assume that the system is
totally independent and not connected to the grid, there we will not consider costs regarding connection
to the distribution grid which represented 1 500 EUR in grid-connected cases. However, we do consider
residual costs of the components.
As the total number of all possible combinations was very high (28 385 280 cases), evaluating all of
them would take approximately 8 days. Therefore, we chose the optimisation to run by means of Genetic
Algorithm, which took around 12 hours. This does not guarantee to obtain the optimal combinations of
component, but it is very probable to obtain the optimal or a solution near the optimal. The optimal
technologies together with all Net Present Costs within studied 30 year period are listed in Table 6.5.
Please note that we assumed residual value of the components at the and of study period.
70

Table 6.5: Optimal components for OFF WITHOUT scenario.
COMPONENTS
Technology Type (amount)NominalCapacity
Installation - NPV O&M NPV Total NPV[EUR] [EUR] [EUR]
Wind turbine Southwest AIR X (1) 0.4 kW 1 473.2 960.2 2 433.4
PV PanelsJinko JKM260P-V
(1s x 26p = 26)260 Wp 4 066.2 1 361 5 427
BatteriesHoppecke 600
(6s x 1p = 6)600 Ah 2 938.1 1 140 4 078.1
Inverter Generic 5 kVA 5 485.92 N/A 5 485.92AC generator Gasoline 0.5 kVA 250 256.4 506.4
NPVs for all technical components, including O&M costs, are shown in Figure 6.4. Note, that in year
30 there are negative costs (incomes) for the components, this comes from assumption of residual value
of the technology.
Economic outputs of the optimisation of variant OFF WITHOUT are shown in Table 6.6. Additionally,
composition of the total expenditures for this scenario is illustrated in Figure 6.8.
Table 6.6: Economic results of optimisation of OFF WITHOUT scenario.
ECONOMIC RESULTS
Total value without residual value (NPV) EUR 19 999.8
Total value with residual value (NPV) EUR 18 960.7
Initial cost of investment EUR 10 113.9
Annual quota for 80% loan (7 % rate for 15 years) EUR 888.4
Levelized cost of energy EUR/kWh 0.18
Total CO2 emissions kg CO2/yr 321
As can be seen in Figure 6.8 and 6.7, comparing to grid-connected cases, wind takes a very minor
part of the total costs (13 %). By comparing costs of technology, PV panels take a much higher share
(regarding total NPVs), namely 5 427 EUR compared to the wind turbine (2 433 EUR). However, this is
not the highest NPV expenditure of the installation. The highest share takes the inverter and auxiliary
technologies (5 486 EUR). This means that there is a large potential for optimisation and minimisation
of the costs and efficiency of such technologies and the whole installation would be much more eco-
nomically efficient if those technologies would be cheaper. On the other hand, this off-grid installation,
even without subsidies, is slightly cheaper than the grid-connected solution with subsidies (ON WITH) -
by 3 366 EUR, talking in NPV over 30 years. Levelized cost of energy for the OFF WITHOUT scenario
is also cheaper (0.18 EUR/kWh). Additionally, thanks to the variability of resources, we need even fewer
batteries (6) than in both grid-connected, which also led to expenditures minimisation.
Also, the initial cost of investment is only 10 114 EUR, while in case of the grid-connected solution
with subsidies (ON WITH), it is as high as 22 419 EUR, which makes this scenario much more available.
In case of annual quotas for the 80% loan, one would pay only 888 EUR per year (in case of ON WITH
71

Figure 6.7: Net present costs for installation and O&M of all components - OFF WITHOUT scenario.
scenario it is 1 950 EUR).
In Figure 6.9 we can see total annual energy produced during a year by our model power plant. The
unmet load, which had to be generated by the AC generator, is negligible (0.1%) and the rest of the total
energy is produce by RES. We can observe that energy produced by PV generator is approximately
12 times higher than form a wind turbine (7 511 kWh compared to 622 kWh). When we compare NPVs
costs and energy produced by particular technology (in 30 years), in case of PV panels it is 42 kWh/EUR
while in case of wind turbine it makes only 7 kWh/EUR. This means that PV generation is much more
efficient in this case, mainly because of availability of resources and price of the components. Addition-
ally, AC generator runs only as little as 31 hours per year and batteries are charging and discharging
even less energy than in case of both grid-connected solutions.
72

Figure 6.8: Composition of total costs per technology - OFF WITHOUT scenario.
Figure 6.9: Total annual energy for OFF WITHOUT scenario as obtained from iHOGA
6.4 Variant OFF WITH
This variant assesses an off-grid scenario with financial support in the form of subsidies. The prop-
erties and possibilities for support mechanisms in case of an off-grid are described in more detail in
Section 4.2.2. In general, it is only possible to obtain a one-time financial support as high as 50 % of
initial costs for PV part of the installation only (including batteries and inverter). This means that the
composition of components, the annual energy produced by individual technology will remain exactly
the same as in scenario OFF WITHOUT.
Because the total initial investment for PV (3 796 EUR), batteries (1 536 EUR) and inverter (3 000 EUR)
makes 8 332 EUR, we are eligible to obtain 50 % of these expenditures. Therefore, we will subtract
4 166 EUR from the initial costs. All components and amount of the energy produced per year remain
73

the same, we present only economic results in Table 6.7.
Table 6.7: Economic results of optimisation of OFF WITH scenario.
ECONOMIC RESULTS
Total value without residual value (NPV) EUR 15 833.8
Total value with residual value (NPV) EUR 14 794.7
Initial cost of investment EUR 5 947.9
Annual quota for 80% loan (7 % rate for 15 years) EUR 339.4
Levelized cost of energy EUR/kWh 0.14
Total CO2 emissions kg CO2/yr 321
After introducing subsidies, total investments for the installation are significantly reduced. With initial
costs 15 834 EUR (14 975 EUR when taking into account residuals value of components) and with
LCOE of 0.14 kWh is this scenario far more efficient than the rest of the variants. Furthermore, because
the financial aid from a government is just a one-time act and not continuous process as in the case of
Green bonuses or Feed-in tariffs, we have a higher certainty of the incomes, because it is not possible
to predict for sure if levels or conditions of Feed-in tariff or Green bonuses will change or not.
Although this OFF WITH variant is the most optimal one among studied 4 cases, we will evaluate
economical feasibility compared to a traditional supplying from AC grid (without any domestic source) in
the following section.
6.5 Evaluation and Comparison
We ran four simulations in iHOGA software, considering power load of a model farm, composition of
various renewable components and their prices on current market and availability of resources in the
location. The outcome of the simulation and optimisation was the optimal composition of technology,
optimised in regards to the lowest Net Present Cost for a studied period of 30 years.
In Table 6.8 and Figure 6.10 we can see comparison of all earlier mentioned cases.
Table 6.8: Comparison of initial costs and NPVs of all scenarios
VariantInitial costs
NPV NPVLCOE
with residual values without residual values[EUR] [EUR] [EUR] [EUR/kWh]
ON WITHOUT 16 536.9 27 927.7 29 759.5 0.27
ON WITH 22 201.4 17 094.9 18 041 0.16
OFF WITHOUT 10 113.9 18 960.7 19 999.8 0.18
OFF WITH 5 947.9 14 794.7 15 883.8 0.14
AC Grid 1 500 N/A 14 601 0.13
As one can observe, the economically worst option is a grid-connected scenario without subsidies.
With this scenario, the LCOE is 0.27 EUR, which is almost twice that much as in case of the best option:
off-grid with subsidies (0.14 EUR).
74

Figure 6.10: Comparison of initial costs and NPVs of all scenarios.
On the other hand, the best option (regarding NPV) is the off-grid installation with subsidies, where
the initial costs are only as low as 5 948 EUR which is far lesser than all other options. The NPV, in this
case, reach only 14 795 EUR.
We can make two conclusions: options with financial supports are more efficient, which was ex-
pected. Secondly, off-grid installations are more profitable than grid-connected. This is a valuable
observation, as off-grid installations, besides the NPV, have more advantages such as independence
on AC grid, political decisions, or natural disasters. Therefore, investing in an off-grid project can pay off
faster.
Finally, we compared all the scenarios to a standard AC grid scheme, where we supply all the power
from a DSO network. In this case, we assumed that the costs regarding connecting to the distribution
network are as high as 1 500 EUR and the annual bill for the electricity costs is 750 EUR. The NPV of
such a configuration was 14 601 EUR (LCOE 0.13 EUR). This is the most efficient option, but we must
take into account, that the difference between the standard AC connection and an off-grid installation
is only 194 EUR in 30 years (see Table 6.8). Taking into account other, non-economical advantages
of the off-grid scheme mentioned above, we do recommend installing an off-grid system (assuming the
possibility of the support mechanism).
We also proved, that the actual renewable market and political situation in the Czech Republic does
not to compute renewables with conventional resources. Without the support mechanisms, the RES
would not be economically efficient at all.
75

76

Chapter 7
Conclusion
In first (theoretical) part of this work, we researched the economic background of the power field in
the Czech Republic, comparing to Portugal. After introducing all common and all different element in
country’s economy, we found out the attitude towards has many differences. While population, area,
or GDP is almost identical between those two countries, approach toward power engineering is an
entirely different story. While 49 % share of the power mix in Portugal belongs to renewables, it is
only 12 % in the Czech Republic. In Portugal, the majority of the public is in favour of wind energy (or
renewables at all). The opposite situation occurs in the Czech Republic, where the majority of people
are in favour of maximising the use of available and known coal resources or searching for a new one.
Additionally, almost two-thirds of Czechs would not agree with building a new wind power plant near
their municipalities. In Portugal, 86% of the people would agree with such an installation. Therefore,
in order to improve the national power mix towards renewables, we found out it is crucial to educate
people about the advantages of these new technologies. Additionally, power field in the Czech Republic
relies on Nuclear Power even more than in RES and the nuclear creates one-third of the overall power
generation in the Czech Republic.
Regarding legislation conditions for wind power in the Czech Republic, the laws are still not clear
and universal. Most of the wind power (or RES in general) legislation is in hands municipalities and not
unified. Therefore, when searching a new location for a wind power plant (even small domestic one), it
is crucial to make legislation research of the location as the initial step of the project. On the other hand,
support mechanisms for RES are quite developed in the Czech Republic, even if the whole renewable
sector is still in the beginning. The government offers two types of support mechanisms (Feed-in tariffs
and Green bonuses) based on the amount of generated electricity and also a one-time financial aid 50 %
of the initial costs (up to 6 000 EUR), but only for domestic PV panels.
7.1 Case Study
The second part of the work dealt with a case study focused on simulation and optimisation of a RES
instalment for a small model farm. For this purpose, we used the iHOGA Software, which is capable of
77

evaluating numerous variants of renewable instalments taking into account all climate data and economic
conditions. The aim was to evaluate four possible scenarios: grid-connected variant (with and without
subsidies), which was based on wind generation and injecting unmet power from the distribution network.
It is needed to stay, that we constrained maximum unmet power to 5% of the total annual consumption.
We also evaluated the economic feasibility of the batteries for this case - batteries were feasible even
for grid-connected cases. The other two scenarios were off-grid installations with and without subsidies.
For the off-grid variant, we used wind generation complemented with PV panels, batteries and a backup
AC generator.
Firstly, we described the object of the power load: we chose a small dairy farm, which’s electricity
consumption was described into much details in a previous study [51]. When we had the power load
for every month in the year, we determined the location of the model object (see Figure 5.7). To obtain
optimal results from the wind turbines, we chose of the windiest regions in the Czech Republic - the
Vysocina region. With the iHOGA software, we downloaded real measured data about wind speed and
solar irradiance directly for this location which we used for the simulation of energy potential in the area
(see Table 5.4).
After determining the data about the object of the power consumption - small dairy farm, we re-
searched the Czech and Central European Market to pick possible components such as wind turbines,
solar panels and batteries. We only used a generic inverter as it was not an object of primary focus.
Then we run several simulations to find the optimal results. The optimisation was mono-objective, fo-
cused on minimising the Net Present Costs over the studied 30 years period. We did take into account
residual costs of the components after this period, as well as inflation rate for specific technologies (in
case of renewable technologies, the inflation rate was negative as we expect that these prices will be
dropping down continuously).
Against our expectations, the results were more in favour of the off-grid solutions (see Table 7.1).
Additionally, besides the better NPV, this independence on the national grid brings also non-financial
advantages like resistance against electricity prices fluctuations or legislative regulations or partial resis-
tance against natural or human disasters (e.g. war). Also, initial costs in both off-grid cases were much
lower than in grid-connected scenarios.
Table 7.1: Comparison of initial costs and NPVs of all scenarios
VariantInitial costs
NPV NPVLCOE
with residual values without residual values[EUR] [EUR] [EUR] [EUR/kWh]
ON WITHOUT 16 536.9 27 927.7 29 759.5 0.27
ON WITH 22 201.4 17 094.9 18 041 0.16
OFF WITHOUT 10 113.9 18 960.7 19 999.8 0.18
OFF WITH 5 947.9 14 794.7 15 883.8 0.14
AC Grid 1 500 N/A 14 601 0.13
When we took into account the subsidies, they had a significant effect on improving the NPV, and
therefore we can state that government incentive has still sense in boosting the RES in the Czech
78

Republic.
It is also needed to stay, that in the most efficient case - an off-grid scenario with subsidies, the
amount of energy generated by wind was approximately 11 times lower than the PV generation. Giving
it in numbers, while PV panels generated 42 kWh/EUR (amount of investments in PV panels), wind-
generated only 7 kWh/EUR. Therefore, we assume that solar energy has more potential and is more
visible than wind energy solely. However, combined solar and wind system can optimally complement
each other.
Finally, we compared all the scenarios mentioned above with a traditional connection to the AC Grid.
With LCOE of 0.13 EUR/kWh, it was still better than the most optimal off-grid scenario (0.14 EUR/kWh).
However, the difference in total NPV over the 30 years period was less than 200 EUR, which is only
1.4 %. Taking into account the independence, and other non-financial advantages, we would recom-
mend the off-grid scenario.
7.2 Future Proposals
Since we found out, that there probably higher potential in solar generation than in wind power, we
would recommend working on similar optimisation using primarily solar power, to prove if our hypothesis
is right.
Additionally, all the examined scenarios could not compete with a conventional AC grid without sup-
port mechanism. The only thing how to overcome this is to improve the technology, make it more efficient
and minimise the investment costs.
79

80

Bibliography
[1] International Energy Agency. World Energy Outlook 2016. OECD, 2016. ISBN 9789264264946.
[2] Global Wind Energy Council. Global Wind Energy Outlook 2016. 2016. URL http://files.gwec.
net/files/GlobalWindEnergyOutlook2016.
[3] The European Wind Energy Association. Wind in power: 2015 European statistics. EWEA, 2016.
[4] Wikipedia. Czech republic — Wikipedia, The free encyclopedia, 2017. URL https://en.
wikipedia.org/wiki/Czech_Republic. [online; accessed 17-June-2017].
[5] International Monetary Fund. Report for selected countries and subjects. website, 2017.
[6] Eurostat. Unemployment statistics, 2017. URL http://ec.europa.eu/eurostat/
statistics-explained/index.php/Unemployment_statistics. [online; accessed 18-June-
2017].
[7] Central Intelligence Agency. The world factbook, 2017. URL https://www.cia.gov/library/
publications/the-world-factbook/geos/ez.html. [online; accessed 18-June-2017].
[8] M. Vagliasindi and J. Besant-Jones. Power Market Structure: Revisiting Policy Options, chapter
Czech Republic, pages 147–159. World Bank. doi: 10.1596/9780821395561 CH05. URL https:
//elibrary.worldbank.org/doi/abs/10.1596/9780821395561_CH05. ISBN:978-0-8213-9557-8.
[9] Ales Rod. Electro-Energy Sector in Czech Republic: Present Sit-
uation, Opportunities and Threats, 2015. URL http://4liberty.eu/
electro-energy-sector-in-czech-republic-present-situation-opportunities-and-threats/.
[online; accessed 08-July-2017].
[10] CEPS. Ceska Energeticka Prenosova Soustava, 2017. URL http://www.ceps.cz. [online; ac-
cessed 08-July-2017].
[11] Filip Jirous. Integration of electricity from renewables to the electricity grid and to the electricity mar-
ket – RES INTEGRATION, 2011. URL http://www.eclareon.com/sites/default/files/czech_
republic_-_res_integration_national_study_nreap.pdf. [online; accessed 16-July-2017].
[12] eurelectric.org. Power statistics and trends: The five dimensions of the energy union,
2015. URL http://www.eurelectric.org/the-five-dimensions-of-the-energy-union/
internal-energy-market/. [online; accessed 16-July-2017].
81

[13] OENERGETICE.cz. Market coupling – propojovanı evropskych energet-
ickych trhu, 2015. URL http://oenergetice.cz/elektrina/trh-s-elektrinou/
market-coupling-propojovani-evropskych-energetickych-trhu/. [online; accessed 16-
July-2017].
[14] International Energy Agency. Energy policies of iea countries, 2016. URL https://www.iea.org/
countries/membercountries/. [online; accessed 24-June-2017].
[15] World Nuclear Association. Nuclear power in czech republic, 2017. URL http:
//www.world-nuclear.org/information-library/country-profiles/countries-a-f/
czech-republic.aspx. [online; accessed 25-June-2017].
[16] Science Alert. Portugal just ran for 4 straight days entirely
on renewable energy, 2016. URL https://www.sciencealert.com/
portugal-just-ran-for-4-straight-days-entirely-on-renewable-energy. [online; ac-
cessed 25-June-2017].
[17] Mbendi Information Services. Coal mining in portugal - overview, 2016. URL https://www.mbendi.
com/indy/ming/coal/eu/po/p0005.htm. [online; accessed 25-June-2017].
[18] OENERGETICE.cz. Tezba a spotreba cerneho uhlı v Cr, 2017. URL http://oenergetice.cz/
uhli/tezba-cerneho-uhli-v-cr/. [online; accessed 25-June-2017].
[19] European Environment Agency. Trends and projections in the Czech Republic 2016. EEA, 2016.
[20] Stem.cz - Non-profit Organisation. Verejne mınenı o energetice – leden 2015, 2015. URL https:
//www.stem.cz/verejne-mineni-o-energetice-leden-2015/. [online; accessed 25-June-2017].
[21] Fototuristika. Zamek jezerı a mesıcnı krajina, 2012. URL http://www.fototuristika.cz. [online;
accessed 25-June-2017].
[22] Focus Agency. Nazory ceske populace na majetkove zapojenı obcı a obcanu do projektu
vetrnych elektraren, 2016. URL http://hnutiduha.cz/sites/default/files/publikace/2017/
02/hnuti_duha_2016_vitr.pdf. [online; accessed 25-June-2017].
[23] Fernando Ribeiro and Paula Ferreira and Madalena Araujo and Ana Cristina Braga. Public opinion
on renewable energy technologies in Portugal. Energy, 69:39 – 50, 2014. ISSN 0360-5442. doi:
http://dx.doi.org/10.1016/j.energy.2013.10.074. URL http://www.sciencedirect.com/science/
article/pii/S0360544213009419.
[24] International Renewable Energy Agency. Renewable Energy and Jobs - Annual Review 2016.
IRENA, 2016.
[25] Na zeleno. Pocet domacıch solarnıch elektraren v Cesku roste. stojıme
na zacatku noveho boomu?, 2017. URL http://www.nazeleno.cz/energie/
pocet-domacich-solarnich-elektraren-v-cesku-roste-stojime-na-zacatku-noveho-boomu.
aspx. [online; accessed 07-July-2017].
82

[26] Travelling Australia. Travelling australia, 2005. URL http://www.travelling-australia.info/
CollBarkly/APics2A.html. [online; accessed 25-July-2017].
[27] M. Kuljovsky. Navrh vetrne elektrarny (wind power plant design). Master’s thesis, Brno University
of Technology, 2014.
[28] M. Havranek. Vetrna elektrarna grid-off, princip, ucinnost, navratnost (off-grid wind power plant,
principle, efficiency, economy). Master’s thesis, Brno University of Technology, 2013.
[29] T. Burton. Wind Energy Handbook. John Wiley & Sons, 2008. URL https://books.google.cz/
books?id=eb3JjwEACAAJ. ISBN: 0-471-48997-2.
[30] DTU Wind Energy: Department of Wind Energy. Global wind atlas, 2017. URL http://
globalwindatlas.com. [online; accessed 26-July-2017].
[31] Institute of Atmospheric Physics of the Czech Academy of Sciences. Wind map for small wind power
plants, 2017. URL http://vitr.ufa.cas.cz/male-vte/#. [online; accessed 26-July-2017].
[32] J. Skorpık. Vyuzitı energie vetru. Transformacnı technologie,, 2006. URL http://www.
transformacni-technologie.cz/04.html#menu. ISSN: 1804-8293.
[33] Motlik J., Samanek L., Stekl J., Bebar L., Lisy M., Pavlas M., Barinka R., Klimek
P., Knapek J., Vasicek J.,. Obnovitelne zdroje energie: a moznosti jejich vyuziti pro
CR (Renewable energy sources: possibilities of use for the Czech Republic). CEZ,
a.s., 2014. URL https://www.cez.cz/edee/content/file/vzdelavani/obnovitelne_zdoje_
energie_a_moznosti_jejich_vyuziti_pro_cr.pdf.
[34] The Liquid Green. Offshore wind. URL http://theliquidgrid.com/the-tech-pool/
offshore-wind/. [online; accessed 27-October-2017].
[35] ENGINEERING.com. Tom lombardo: Wind map for small wind power plants, 2015. URL
http://www.engineering.com/ElectronicsDesign/ElectronicsDesignArticles/ArticleID/
9556/Rooftop-Wind-Turbines-Are-They-Worthwhile.aspx. [online; accessed 26-July-2017].
[36] Windpower Engineering & Development. How high should your small wind turbine be?, 2009.
URL http://www.windpowerengineering.com/construction/high-small-wind-turbine/. [on-
line; accessed 26-July-2017].
[37] Amir Bashirzadeh Tabrizi and Jonathan Whale and Thomas Lyons and Tania Urmee. Rooftop
wind monitoring campaigns for small wind turbine applications: Effect of sampling rate and averag-
ing period. Renewable Energy, 77():320 – 330, 2015. ISSN 0960-1481. doi: http://dx.doi.org/
10.1016/j.renene.2014.12.037. URL http://www.sciencedirect.com/science/article/pii/
S0960148114008647.
[38] WindAid Institute. Redesigning the wind turbine tower assembly, 2016. URL http://windaid.org/
redesigning-the-wind-turbine-tower-assembly/. [online; accessed 26-July-2017].
83

[39] Kingston Renewable Energy. The fluxy wind turbine, tower and foundation system is a complex
and dynamic electro-mechanical structure., 2015. URL http://www.kre.ie/towers.html. [online;
accessed 26-July-2017].
[40] David Darling. Small wind electric system tower, 2015. URL http://www.daviddarling.
info/encyclopedia/S/AE_small_wind_electric_system_tower.html. [online; accessed 26-
July-2017].
[41] CEZ Group. Company website, 2017. URL www.cez.cz. [online; accessed 29-July-2017].
[42] Mike Lee, 2007. URL http://www.geograph.org.uk/photo/517353. [online; accessed 29-July-
2017].
[43] Australian Government: Department of Environment and Energy. Wind power on
the way!, 2003. URL http://www.antarctica.gov.au/about-antarctica/history/
exploration-and-expeditions/modern-expeditions/this-week-in-antarctica/2003/
mawson2/wind-power-on-the-way! [online; accessed 29-July-2017].
[44] Energy Regulatory Office of the Czech Republic. Institutional website, 2017. URL http://www.
eru.cz/en/. [online; accessed 30-July-2017].
[45] The State Environmental Fund of the Czech Republic. Institutional website, 2017. URL http:
//en.sfzp.cz/sekce/585/sef/. [online; accessed 15-August-2017].
[46] The Ministry of Industry and Trade of the Czech Republic. Institutional website, 2017. URL https:
//www.mpo.cz/en/. [online; accessed 15-August-2017].
[47] The Ministry of the Environment of the Czech Republic. Institutional website, 2017. URL https:
//www.mzp.cz/en/ministry. [online; accessed 13-September-2017].
[48] CEZ Distribution. Mikrozdroj (zdroj do 10 kw provozovany bez licence), 2016. URL http://
www.cezdistribuce.cz/cs/pro-zakazniky/potrebuji-vyresit/mikrozdroj.html. [online; ac-
cessed 15-September-2017].
[49] State Environmental Fund. Official web of the new green for savings programme, 2017. URL
http://www.novazelenausporam.cz. [online; accessed 15-September-2017].
[50] State Environmental Fund. ihoga software - software for simulation and optimization of renewable-
based electricity supply systems, 2017. URL https://ihoga-software.com/en/. [online; ac-
cessed 30-September-2017].
[51] J. Upton and M. Murphy and L. Shalloo and P.W.G. Groot Koerkamp and I.J.M. De Boer. A
mechanistic model for electricity consumption on dairy farms: Definition, validation, and demon-
stration. Journal of Dairy Science, 97(8):4973 – 4984, 2014. ISSN 0022-0302. doi: https:
//doi.org/10.3168/jds.2014-8015. URL http://www.sciencedirect.com/science/article/pii/
S0022030214003993.
84

[52] EFEKT - energie efektivne, 2017. URL https://www.mpo-efekt.cz/cz/ekis/i-ekis/3172. [on-
line; accessed 26-October-2017].
[53] NASA - Atmospheric Science Data Centre. Nasa surface meteorology and solar energy: Retscreen
data, 2017. URL https://eosweb.larc.nasa.gov/cgi-bin/sse/retscreen.cgi?email=rets@
nrcan.gc.ca. [online; accessed 1-October-2017].
[54] W. Marion and S. Wilcox. Solar data radiation manual for buildings. 01 1995.
[55] ECODIRECT, 2017. URL http://www.ecodirect.com/SWWP-Air-X-Land-24V-WT-p/
swwp-air-x-land-24v-wt.htm. [online; accessed 15-October-2017].
[56] Wind Turbine Models, 2017. URL https://en.wind-turbine-models.com/turbines/
1682-hummer-h25.0-100kw. [online; accessed 15-October-2017].
[57] Obchod Solar, 2017. URL https://www.obchodsolar.cz/. [online; accessed 8-October-2017].
[58] Solar Partner, 2017. URL http://shop.solarpartner.cz/. [online; accessed 8-October-2017].
[59] IF-TECH, 2017. URL https://shop.iftech.cz. [online; accessed 8-October-2017].
[60] Off-grid Europe, 2017. URL http://www.off-grid-europe.com. [online; accessed 14-October-
2017].
[61] Battery Import, 2017. URL https://www.battery-import.cz/. [online; accessed 14-October-
2017].
[62] J. Schuhmacher. Insel - interactive simulation of renewable electrical energy supply systems, 1993.
Reference Manual.
[63] E-shop Terms, 2017. URL http://eshop.terms.eu. [online; accessed 14-October-2017].
[64] Krannich Solar, 2017. URL https://de.krannich-solar.com. [online; accessed 14-October-
2017].
[65] CPC Battery Services Ltd, 2017. URL http://cpcbatteries.co.uk/home/1989934. [online; ac-
cessed 14-October-2017].
85

86

Appendix A
iHOGA Reports
In the following pages, we provide optimisation reports as we obtained with the iHOGA Software for
variants ON WITHOUT, ON WITH and OFF WITHOUT.
A.1

'&9ROWDJH9$&9ROWDJH9
:LWKRXW39SDQHOV%DWW23=6+RSSHFNH&Q $āKV[S(WRWDO N:KGDXW:LQG7'&%RUQD\:DWPV3WRWDON:
:LWKRXW$&*HQHUDWRU:LWKRXW)XHO&HOO:LWKRXW(OHFWURO\]HU,QYHUWHU*HQHULF&+UDWHGSRZHU9$
:LWKRXW+\GUR7XUELQH
3URMHFWXSOQHSRVOHGQ\KRJD6ROXWLRQ
13&2)7+(6<67(0\HDUVOLIHWLPHFRPSDULQJWRRQO\$&JULGN:K\U13& ¼7RWDO6\VWHP&RVWV13&¼/HYHOL]HGFRVWRIHQHUJ\¼N:K%DWWHU\EDQN&RVWV13&¼:LQGWXUELQHV&RVWV13&¼,QYHUWHU&RVWV13&¼
%$77(5,(6
:,1'
,19$8;
,167$//$7,21),1$1&,1*2WURV
&21752/675$7(*<
,)7+(32:(5352'8&('%<7+(5(1(:$%/(6285&(6,6+,*+(57+$1/2$'&+$5*(7KH%DWWHULHVDUHFKDUJHGZLWKWKHVSDUHSRZHUIURPUHQHZDEOH
,)7+(32:(5352'8&('%<7+(5(1(:$%/(6285&(6,6/(667+$1/2$'',6&+$5*(7KHZKROHQRWVXSSOLHGSRZHUWRPHHWWKHORDGPXVWEHVXSSOLHGE\WKH%DWWHULHV,IWKH%DWWHULHVFDQQRWVXSSO\WKHZKROHWKHUHVWZLOOEHXQPHWORDG
7KHUHLVQR$&*HQHUDWRU
7KHUHLVQR)XHO&HOO
(1(5*<%$/$1&('85,1*<($52YHUDOO/RDG(QHUJ\N:K\U)URP5HQHZDEOH8QPHWORDGN:K\UORDG([FHVV(QHUJ\N:K\U(QHUJ\GHOLYHUHGE\39JHQHUDWRUN:K\U(QHUJ\GHOLYHUHGE\:LQG7XUELQHVN:K\U(QHUJ\GHOLYHUHGE\+\GUR7XUELQHN:K\U(QHUJ\GHOLYHUHGE\$&*HQHUDWRUN:K\U+RXUVRI$&*HQHUDWRURSHUDWLRQK\U
39%DWWHU\FKDUJHFRQWUROOHULQFOXGHGLQELGLLQYHUWHU
(QHUJ\GHOLYHUHGE\)XHO&HOON:K\U+RXUVRI)XHO&HOORSHUDWLRQK\U(QHUJ\DW(OHFWURO\]HUN:K\U+RXUVRI(OHFWURO\]HURSHUDWLRQK\U(QHUJ\FKDUJHGE\%DWWHULHVN:K\U(QHUJ\GLVFKDUJHGE\%DWWHULHVN:K\U%DWWHULHV/LIHWLPH\HDUV
7RWDO&2HPLVVLRQVNJ&2\U(PLVVLRQVRI$&JHQHUDWRUGXHWRFRQVXPSWLRQRIOLWUH\UNJ&2\U
/2$')2//2:,1*62&PLQEDWWHULHV
&20321(176
/2$'
8QP
HW
%X\
([F
:,1'
&%
$7
'%
$7
(1(5
*<N:K
:7 ,19
32:(5
N:
%X\6HOO%RXJKW(QHUJ\13&¼6ROG(QHUJ\(OHFWULFDO(13&¼+13&¼
(VROGWR$&JULGN:K\U(3XUFKDVHGIURP$&JULGN:K\U
:LWKRXWEDWWHU\FKDUJHU
,QLWLDO,QYHVWPHQW¼/RDQDQQXDOTXRWD¼&RVW$&JHQIXHOVW\HDU¼

'&9ROWDJH9$&9ROWDJH9
:LWKRXW39SDQHOV%DWW23=6+RSSHFNH&Q $āKV[S(WRWDO N:KGDXW:LQG7'&+XPPHU+:3:DWPV3WRWDON:
:LWKRXW$&*HQHUDWRU:LWKRXW)XHO&HOO:LWKRXW(OHFWURO\]HU,QYHUWHU*HQHULF&+UDWHGSRZHU9$
:LWKRXW+\GUR7XUELQH
3URMHFWXSOQHSRVOHGQ\KRJD6ROXWLRQ
13&2)7+(6<67(0\HDUVOLIHWLPHFRPSDULQJWRRQO\$&JULGN:K\U13& ¼7RWDO6\VWHP&RVWV13&¼/HYHOL]HGFRVWRIHQHUJ\¼N:K%DWWHU\EDQN&RVWV13&¼:LQGWXUELQHV&RVWV13&¼,QYHUWHU&RVWV13&¼
%$77(5,(6
:,1'
,19$8;
&21752/675$7(*<
,)7+(32:(5352'8&('%<7+(5(1(:$%/(6285&(6,6+,*+(57+$1/2$'&+$5*(7KH%DWWHULHVDUHFKDUJHGZLWKWKHVSDUHSRZHUIURPUHQHZDEOH
,)7+(32:(5352'8&('%<7+(5(1(:$%/(6285&(6,6/(667+$1/2$'',6&+$5*(7KHZKROHQRWVXSSOLHGSRZHUWRPHHWWKHORDGPXVWEHVXSSOLHGE\WKH%DWWHULHV,IWKH%DWWHULHVFDQQRWVXSSO\WKHZKROHWKHUHVWZLOOEHXQPHWORDG
7KHUHLVQR$&*HQHUDWRU
7KHUHLVQR)XHO&HOO
(1(5*<%$/$1&('85,1*<($52YHUDOO/RDG(QHUJ\N:K\U)URP5HQHZDEOH8QPHWORDGN:K\UORDG([FHVV(QHUJ\N:K\U(QHUJ\GHOLYHUHGE\39JHQHUDWRUN:K\U(QHUJ\GHOLYHUHGE\:LQG7XUELQHVN:K\U(QHUJ\GHOLYHUHGE\+\GUR7XUELQHN:K\U(QHUJ\GHOLYHUHGE\$&*HQHUDWRUN:K\U+RXUVRI$&*HQHUDWRURSHUDWLRQK\U
39%DWWHU\FKDUJHFRQWUROOHULQFOXGHGLQELGLLQYHUWHU
(QHUJ\GHOLYHUHGE\)XHO&HOON:K\U+RXUVRI)XHO&HOORSHUDWLRQK\U(QHUJ\DW(OHFWURO\]HUN:K\U+RXUVRI(OHFWURO\]HURSHUDWLRQK\U(QHUJ\FKDUJHGE\%DWWHULHVN:K\U(QHUJ\GLVFKDUJHGE\%DWWHULHVN:K\U%DWWHULHV/LIHWLPH\HDUV
7RWDO&2HPLVVLRQVNJ&2\U(PLVVLRQVRI$&JHQHUDWRUGXHWRFRQVXPSWLRQRIOLWUH\UNJ&2\U
/2$')2//2:,1*62&PLQEDWWHULHV
&20321(176
/2$'
8QP
HW
%X\
([F
6HOO
:,1'
&%
$7
'%
$7
(1(5
*<N:K
:7 ,19
32:(5
N:
%X\6HOO%RXJKW(QHUJ\13&¼6ROG(QHUJ\(OHFWULFDO(13&¼+13&¼
(VROGWR$&JULGN:K\U(3XUFKDVHGIURP$&JULGN:K\U
:LWKRXWEDWWHU\FKDUJHU
,QLWLDO,QYHVWPHQW¼/RDQDQQXDOTXRWD¼&RVW$&JHQIXHOVW\HDU¼

'&9ROWDJH9$&9ROWDJH9
39SDQ-LQNR-.039:SV[S3WRWDO N:SúVORSH%DWW23=6+RSSHFNH&Q $āKV[S(WRWDO N:KGDXW:LQG7'&6RXWKZHVW$,5;:DWPV3WRWDON:
[$&*HQ*DVROLQHN9$RIUDWHGSRZHUN9$:LWKRXW)XHO&HOO:LWKRXW(OHFWURO\]HU,QYHUWHU*HQHULF&+UDWHGSRZHU9$
:LWKRXW+\GUR7XUELQH
3URMHFWXSOQHSRVOHGQ\KRJD6ROXWLRQ
13&2)7+(6<67(0\HDUVOLIHWLPHFRPSDULQJWRRQO\$&JULGN:K\U13& ¼7RWDO6\VWHP&RVWV13&¼/HYHOL]HGFRVWRIHQHUJ\¼N:K39*HQHUDWRU&RVWV13&¼%DWWHU\EDQN&RVWV13&¼:LQGWXUELQHV&RVWV13&¼$&*HQHUDWRU&RVWV13&¼,QYHUWHU&RVWV13&¼$&*HQHUDWRU)XHO&RVWV13&¼
39%$77(5,(6
:,1'
,19$8;
,167$//$7,21),1$1&,1*2WURV
&21752/675$7(*<
,)7+(32:(5352'8&('%<7+(5(1(:$%/(6285&(6,6+,*+(57+$1/2$'&+$5*(7KH%DWWHULHVDUHFKDUJHGZLWKWKHVSDUHSRZHUIURPUHQHZDEOH
,)7+(32:(5352'8&('%<7+(5(1(:$%/(6285&(6,6/(667+$1/2$'',6&+$5*(7KHSRZHUQRWVXSSOLHGWRPHHWWKHORDGZLOOEHVXSSOLHGE\WKH%DWWHULHVLIWKH\FDQQRWVXSSO\WKHZKROHWKHUHVWZLOOEHVXSSOLHGE\WKH$&*HQHUDWRU
3JHQ ,1):
7KHUHLVQR)XHO&HOO
(1(5*<%$/$1&('85,1*<($52YHUDOO/RDG(QHUJ\N:K\U)URP5HQHZDEOH8QPHWORDGN:K\UORDG([FHVV(QHUJ\N:K\U(QHUJ\GHOLYHUHGE\39JHQHUDWRUN:K\U(QHUJ\GHOLYHUHGE\:LQG7XUELQHVN:K\U(QHUJ\GHOLYHUHGE\+\GUR7XUELQHN:K\U(QHUJ\GHOLYHUHGE\$&*HQHUDWRUN:K\U+RXUVRI$&*HQHUDWRURSHUDWLRQK\U
39%DWWHU\FKDUJHFRQWUROOHULQFOXGHGLQELGLLQYHUWHU
(QHUJ\GHOLYHUHGE\)XHO&HOON:K\U+RXUVRI)XHO&HOORSHUDWLRQK\U(QHUJ\DW(OHFWURO\]HUN:K\U+RXUVRI(OHFWURO\]HURSHUDWLRQK\U(QHUJ\FKDUJHGE\%DWWHULHVN:K\U(QHUJ\GLVFKDUJHGE\%DWWHULHVN:K\U%DWWHULHV/LIHWLPH\HDUV
7RWDO&2HPLVVLRQVNJ&2\U(PLVVLRQVRI$&JHQHUDWRUGXHWRFRQVXPSWLRQRIOLWUH\UNJ&2\U
$&*HQHUDWRU0LQLPXP3RZHU:
:KHQHYHUWKHSRZHUWREHVXSSOLHGE\WKH$&*HQHUDWRULVORZHUWKDQ3FULWLFDOBJHQ :WKH$&JHQHUDWRUUXQVDWIXOOSRZHURUDWDUDWHQRWH[FHHGLQJWKHPD[LPXPHQHUJ\WKDW%DWWHULHVFDQDEVRUEHFKDUJLQJWKH%DWWHULHVXQWLORI62&LVUHDFKHG
/2$')2//2:,1*62&PLQEDWWHULHV
&20321(176
/2$' ([F 39
:,1'
$&*(1
&%
$7
'%
$7
(1(5
*<N:K
39 :7 *(1 ,19
32:(5
N:
(VROGWR$&JULGN:K\U(3XUFKDVHGIURP$&JULGN:K\U
%DWWHU\FKDUJHU$&'&FRQYHUWHULQFOXGHGLQELGLLQYHUWHU
,QLWLDO,QYHVWPHQW¼/RDQDQQXDOTXRWD¼&RVW$&JHQIXHOVW\HDU¼