Slip rate and past earthquakes along the Astaneh fault (Iran)
17
Research Paper Using luminescence dating of coarse matrix material to estimate the slip rate of the Astaneh fault, Iran M. Rizza a, * , S. Mahan b , J-F. Ritz a , H. Nazari c , J. Hollingsworth d , R. Salamati c a Laboratoire Géosciences Montpellier, UMR 5243, Université Montpellier 2, France b US Geological Survey, Box 25046, M.S. 974, Denver, CO 80225, USA c Research Institute for Earth Sciences, Geological Survey of Iran, PO Box 131851494, Tehran, Iran d Division of GPS, California Institute of Technology, MC 100-23, Pasadena, CA 91125, USA article info Article history: Received 20 May 2010 Received in revised form 2 February 2011 Accepted 1 March 2011 Available online 21 March 2011 Keywords: Luminescence dating Tectonics Alluvial fans Geomorphology Faulting Iran Alborz abstract In this paper, we present optically and infrared stimulated luminescence (OSL and IRSL) ages for four samples from alluvial fan surfaces in the Astaneh Valley. This valley is located in the north-east part of the Alborz range in Iran. Our morphologic interpretations recognize at least three generations of fans in the study area, all of which have been displaced along the left-lateral strike-slip Astaneh fault. Because of the dry, loose, and sometimes complex juxtaposition of the target sediments, we collected the samples in total darkness beneath dark plastic layers placed atop the pit openings. Luminescence ages of the fans are w55 ka, w32 ka and w16 ka. These ages are concurrent with periods of loess deposition and wet climatic conditions previously recorded in the Arabia-Iranian region. They allow estimation of a hori- zontal slip rate of w2 mm/yr along the Astaneh fault, which is consistent with additional slip rates determined for the Holocene period along faults further west of the Astaneh fault. Ó 2011 Elsevier B.V. All rights reserved. 1. Introduction In arid environments, the absence of organic material and large scale fine-grained deposits often precluded radiocarbon or lumines- cence dating, so ages of alluvial surfaces are sometimes estimated by correlation with reported global and regional climatic events (Karakhanian et al., 2004). However, ample success in dating alluvial deposits has been previously reported in geologically diverse regions of Iran by using luminescence techniques (Thomas et al.,1997; Fattahi et al., 2006; Fattahi and Walker, 2007; Fattahi et al., 2007; Frechen et al., 2009; Karimi et al., 2009; LeDortz et al., 2009; Walker et al., 2009; Fattahi et al., 2010; Hollingsworth et al., 2010a). Luminescence dating assumes that the material is reset by solar exposure before deposition and subsequent burial as it circulates along its transport path (Murray et al., 1995; Olley et al., 1998; Wintle and Murray, 2006). In the natural environment, the resetting of mineral grains is a function of various factors such as: the rate of deposition, the turbidity of the water that may have moved the grain to its present location, and the previous cycles of erosion and deposition that the sediment endured before the most recent transport. All these factors influence the resetting of the residual signal to varying degrees and the final measured total equivalent dose could overestimate the age of the deposition of the sediments. In particular, young fluvial deposits can contain reworked quartz grains with a range of inherited lumines- cence levels (Jain et al., 2004; Madsen and Murray, 2009). Within fluvial environments, the luminescence of quartz grains is more readily reset in sunlight when compared to the luminescence of feldspar grains, and for this reason quartz is the preferred mineral to use when attempting to date these deposits (Wallinga, 2002). For this study, the only suitable material for luminescence dating that we found came from alluvial fan deposits and thus we expected that the time of sunlight exposure could be widely varied for many of the grains. The sediment contained within the alluvial fans showed a large range in grain size due to divergent geologic sources and it was difficult to find any large exposures or massive and continuous layers with fine grains (<300 mm). Samples for luminescence dating are usually collected with an opaque tube or taken as one cohesive block of material if indurate. Thus fine layered material that is supported by a very coarse sand or gravel matrix is rarely collected because of the uncertain nature of the stability of the sediment package. In this area setting, the nature of the deposits made it necessary to sample and finger sieve these loose sediments into a tube or dark * Corresponding author. Tel.: þ33 4 67 14 45 94; fax: þ33 4 67 14 36 42. E-mail address: [email protected] (M. Rizza). Contents lists available at ScienceDirect Quaternary Geochronology journal homepage: www.elsevier.com/locate/quageo 1871-1014/$ e see front matter Ó 2011 Elsevier B.V. All rights reserved. doi:10.1016/j.quageo.2011.03.001 Quaternary Geochronology 6 (2011) 390e406
-
Upload
independent -
Category
Documents
-
view
1 -
download
0
Transcript of Slip rate and past earthquakes along the Astaneh fault (Iran)
lable at ScienceDirect
Quaternary Geochronology 6 (2011) 390e406
Contents lists avai
Quaternary Geochronology
journal homepage: www.elsevier .com/locate/quageo
Research Paper
Using luminescence dating of coarse matrix material to estimate the slip rate ofthe Astaneh fault, Iran
M. Rizza a,*, S. Mahan b, J-F. Ritz a, H. Nazari c, J. Hollingsworth d, R. Salamati c
a Laboratoire Géosciences Montpellier, UMR 5243, Université Montpellier 2, FrancebUS Geological Survey, Box 25046, M.S. 974, Denver, CO 80225, USAcResearch Institute for Earth Sciences, Geological Survey of Iran, PO Box 13185 1494, Tehran, IrandDivision of GPS, California Institute of Technology, MC 100-23, Pasadena, CA 91125, USA
a r t i c l e i n f o
Article history:Received 20 May 2010Received in revised form2 February 2011Accepted 1 March 2011Available online 21 March 2011
Keywords:Luminescence datingTectonicsAlluvial fansGeomorphologyFaultingIranAlborz
* Corresponding author. Tel.: þ33 4 67 14 45 94; faE-mail address: [email protected] (M. Rizz
1871-1014/$ e see front matter � 2011 Elsevier B.V.doi:10.1016/j.quageo.2011.03.001
a b s t r a c t
In this paper, we present optically and infrared stimulated luminescence (OSL and IRSL) ages for foursamples from alluvial fan surfaces in the Astaneh Valley. This valley is located in the north-east part ofthe Alborz range in Iran. Our morphologic interpretations recognize at least three generations of fansin the study area, all of which have been displaced along the left-lateral strike-slip Astaneh fault. Becauseof the dry, loose, and sometimes complex juxtaposition of the target sediments, we collected the samplesin total darkness beneath dark plastic layers placed atop the pit openings. Luminescence ages of the fansare w55 ka, w32 ka and w16 ka. These ages are concurrent with periods of loess deposition and wetclimatic conditions previously recorded in the Arabia-Iranian region. They allow estimation of a hori-zontal slip rate of w2 mm/yr along the Astaneh fault, which is consistent with additional slip ratesdetermined for the Holocene period along faults further west of the Astaneh fault.
� 2011 Elsevier B.V. All rights reserved.
1. Introduction
In arid environments, the absence of organic material and largescale fine-grained deposits often precluded radiocarbon or lumines-cence dating, so ages of alluvial surfaces are sometimes estimated bycorrelation with reported global and regional climatic events(Karakhanian et al., 2004). However, ample success in dating alluvialdeposits has been previously reported in geologically diverse regionsof Iranbyusing luminescence techniques (Thomas et al.,1997; Fattahiet al., 2006; Fattahi and Walker, 2007; Fattahi et al., 2007; Frechenet al., 2009; Karimi et al., 2009; LeDortz et al., 2009; Walker et al.,2009; Fattahi et al., 2010; Hollingsworth et al., 2010a).
Luminescence dating assumes that the material is reset by solarexposurebeforedepositionandsubsequentburial as it circulatesalongits transport path (Murray et al., 1995; Olley et al., 1998; Wintle andMurray, 2006). In the natural environment, the resetting of mineralgrains is a functionof various factors suchas: the rateofdeposition, theturbidity of the water that may have moved the grain to its presentlocation, and the previous cycles of erosion and deposition that thesediment endured before the most recent transport. All these factors
x: þ33 4 67 14 36 42.a).
All rights reserved.
influence the resettingof the residual signal tovaryingdegreesand thefinalmeasured total equivalent dose could overestimate the age of thedeposition of the sediments. In particular, young fluvial deposits cancontain reworked quartz grains with a range of inherited lumines-cence levels (Jain et al., 2004; Madsen and Murray, 2009). Withinfluvial environments, the luminescence of quartz grains is morereadily reset in sunlight when compared to the luminescence offeldspar grains, and for this reason quartz is the preferred mineral touse when attempting to date these deposits (Wallinga, 2002).
For this study, the only suitable material for luminescencedating that we found came from alluvial fan deposits and thus weexpected that the time of sunlight exposure could be widely variedfor many of the grains. The sediment contained within the alluvialfans showed a large range in grain size due to divergent geologicsources and it was difficult to find any large exposures or massiveand continuous layers with fine grains (<300 mm). Samples forluminescence dating are usually collected with an opaque tube ortaken as one cohesive block of material if indurate. Thus finelayered material that is supported by a very coarse sand or gravelmatrix is rarely collected because of the uncertain nature of thestability of the sediment package.
In this area setting, the nature of the depositsmade it necessary tosample and finger sieve these loose sediments into a tube or dark
M. Rizza et al. / Quaternary Geochronology 6 (2011) 390e406 391
plastic bag only when securely beneath heavy dark plastic blankets.This is a typical field procedure that has been used elsewhere in Iranto collect coarse material from alluvial surfaces for luminescenceanalyseswhen it is difficult to drive a tube into the exposure (Thomaset al., 1997; Fattahi et al., 2006, 2007). Results from the opticallystimulated luminescence (OSL) and infrared stimulated lumines-cence (IRSL) signals were then used to assess whether this approachsucceededornot. Thegeochronological dataobtainedalsoenabledusto estimate a slip rate for theAstaneh fault (Fig.1) and to demonstratethe viability for dating coarse material in tectonically active areas.
2. Study area and OSL collecting
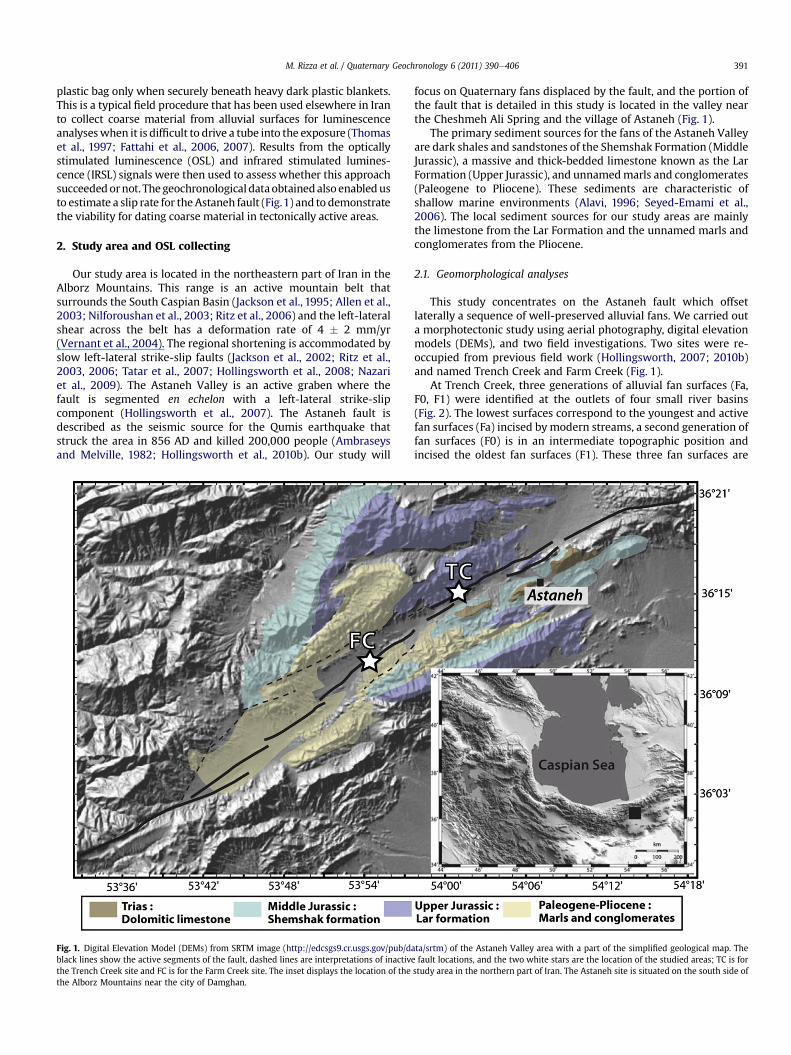
Our study area is located in the northeastern part of Iran in theAlborz Mountains. This range is an active mountain belt thatsurrounds the South Caspian Basin (Jackson et al., 1995; Allen et al.,2003; Nilforoushan et al., 2003; Ritz et al., 2006) and the left-lateralshear across the belt has a deformation rate of 4 � 2 mm/yr(Vernant et al., 2004). The regional shortening is accommodated byslow left-lateral strike-slip faults (Jackson et al., 2002; Ritz et al.,2003, 2006; Tatar et al., 2007; Hollingsworth et al., 2008; Nazariet al., 2009). The Astaneh Valley is an active graben where thefault is segmented en echelon with a left-lateral strike-slipcomponent (Hollingsworth et al., 2007). The Astaneh fault isdescribed as the seismic source for the Qumis earthquake thatstruck the area in 856 AD and killed 200,000 people (Ambraseysand Melville, 1982; Hollingsworth et al., 2010b). Our study will
Fig. 1. Digital Elevation Model (DEMs) from SRTM image (http://edcsgs9.cr.usgs.gov/pub/dablack lines show the active segments of the fault, dashed lines are interpretations of inactivethe Trench Creek site and FC is for the Farm Creek site. The inset displays the location of thethe Alborz Mountains near the city of Damghan.
focus on Quaternary fans displaced by the fault, and the portion ofthe fault that is detailed in this study is located in the valley nearthe Cheshmeh Ali Spring and the village of Astaneh (Fig. 1).
The primary sediment sources for the fans of the Astaneh Valleyare dark shales and sandstones of the Shemshak Formation (MiddleJurassic), a massive and thick-bedded limestone known as the LarFormation (Upper Jurassic), and unnamedmarls and conglomerates(Paleogene to Pliocene). These sediments are characteristic ofshallow marine environments (Alavi, 1996; Seyed-Emami et al.,2006). The local sediment sources for our study areas are mainlythe limestone from the Lar Formation and the unnamed marls andconglomerates from the Pliocene.
2.1. Geomorphological analyses
This study concentrates on the Astaneh fault which offsetlaterally a sequence of well-preserved alluvial fans. We carried outa morphotectonic study using aerial photography, digital elevationmodels (DEMs), and two field investigations. Two sites were re-occupied from previous field work (Hollingsworth, 2007; 2010b)and named Trench Creek and Farm Creek (Fig. 1).
At Trench Creek, three generations of alluvial fan surfaces (Fa,F0, F1) were identified at the outlets of four small river basins(Fig. 2). The lowest surfaces correspond to the youngest and activefan surfaces (Fa) incised bymodern streams, a second generation offan surfaces (F0) is in an intermediate topographic position andincised the oldest fan surfaces (F1). These three fan surfaces are
ta/srtm) of the Astaneh Valley area with a part of the simplified geological map. Thefault locations, and the two white stars are the location of the studied areas; TC is for
study area in the northern part of Iran. The Astaneh site is situated on the south side of

M. Rizza et al. / Quaternary Geochronology 6 (2011) 390e406392
mantled by a pebble pavement showing desert varnish thatdarkens from surface Fa to F1. The focus of this paper is in thewestern part of the area, where the F1 fan surfaces have been left-laterally displaced by the Astaneh fault. At the West Basin outlet,
Fig. 2. (a) Aerial photograph showing a comprehensive view of the Trench Creek site (36�150
fault and the white squares are the location of the two sites. (b) Geomorphologic interpretadotted red line is a supposed inactive Quaternary fault. The same color range represents difforange color range are the West Basin (WB) fans; in olive are the West Middle Basin (WMB) f(EB) fans. The OSL sample locations are approximated on each fan. c) Detail of the west areathe F1 fan. (For interpretation of the references to color in this figure legend, the reader is
the right bank riser between F1 and F0 surfaces is displaced hori-zontally by 57� 5m (AeA0 , Fig. 2b and c). At theWest Middle Basinoutlet, the left bank riser between F1 and F0 surfaces is displacedhorizontally by 59 � 14 m (BeB0, Fig. 2b and d).
55.66”N; 54�03001.70”E). The red triangles represent the surface rupture of the Astanehtions for the study area. The Astaneh fault is represented by the solid red line and theerent fan generations deposited through time for the river basins. From left to right: inans; in blue are the East Middle Basin (EMB) fans; and shown in green are the East Basinwith the offset of the riser F1/F0. d) Detail of the east area with the offset incision insidereferred to the web version of this article.)
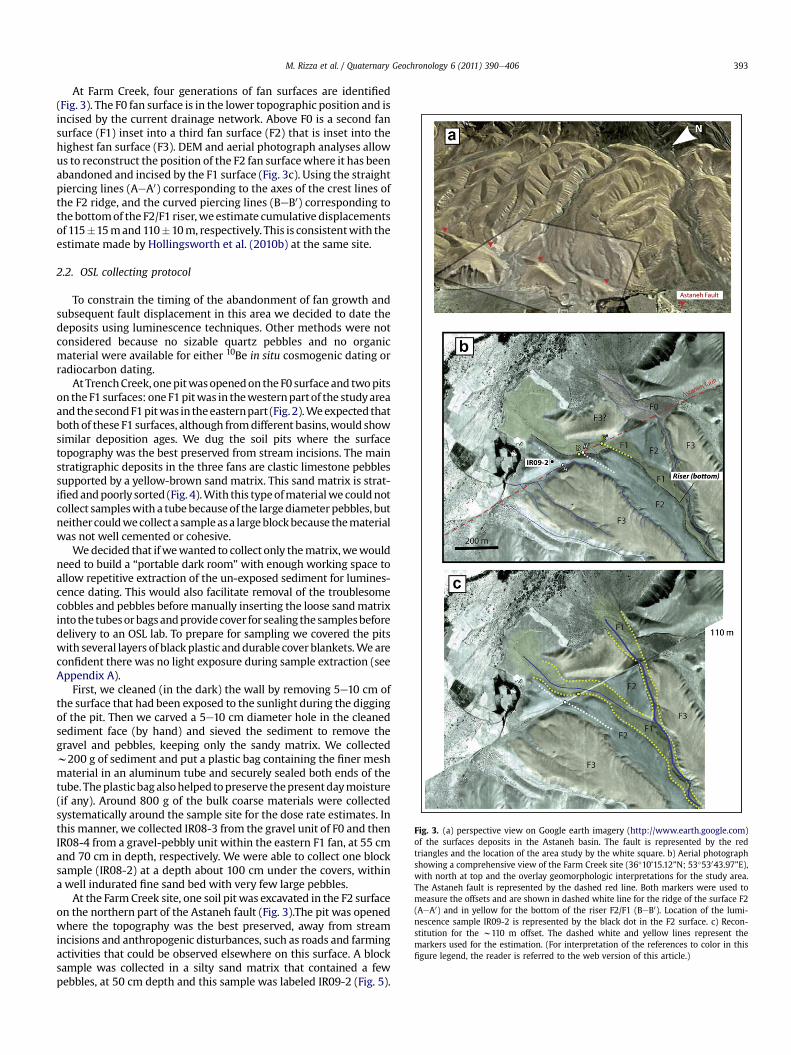
Fig. 3. (a) perspective view on Google earth imagery (http://www.earth.google.com)of the surfaces deposits in the Astaneh basin. The fault is represented by the redtriangles and the location of the area study by the white square. b) Aerial photographshowing a comprehensive view of the Farm Creek site (36�10’15.12”N; 53�53043.97”E),with north at top and the overlay geomorphologic interpretations for the study area.The Astaneh fault is represented by the dashed red line. Both markers were used tomeasure the offsets and are shown in dashed white line for the ridge of the surface F2(AeA0) and in yellow for the bottom of the riser F2/F1 (BeB0). Location of the lumi-nescence sample IR09-2 is represented by the black dot in the F2 surface. c) Recon-stitution for the w110 m offset. The dashed white and yellow lines represent themarkers used for the estimation. (For interpretation of the references to color in thisfigure legend, the reader is referred to the web version of this article.)
M. Rizza et al. / Quaternary Geochronology 6 (2011) 390e406 393
At Farm Creek, four generations of fan surfaces are identified(Fig. 3). The F0 fan surface is in the lower topographic position and isincised by the current drainage network. Above F0 is a second fansurface (F1) inset into a third fan surface (F2) that is inset into thehighest fan surface (F3). DEM and aerial photograph analyses allowus to reconstruct the position of the F2 fan surfacewhere it has beenabandoned and incised by the F1 surface (Fig. 3c). Using the straightpiercing lines (AeA0) corresponding to the axes of the crest lines ofthe F2 ridge, and the curved piercing lines (BeB0) corresponding tothe bottomof the F2/F1 riser,weestimate cumulative displacementsof 115�15mand110�10m, respectively. This is consistentwith theestimate made by Hollingsworth et al. (2010b) at the same site.
2.2. OSL collecting protocol
To constrain the timing of the abandonment of fan growth andsubsequent fault displacement in this area we decided to date thedeposits using luminescence techniques. Other methods were notconsidered because no sizable quartz pebbles and no organicmaterial were available for either 10Be in situ cosmogenic dating orradiocarbon dating.
At TrenchCreek, onepitwasopenedon the F0 surfaceand twopitson the F1 surfaces: one F1pitwas in thewesternpartof the studyareaand thesecondF1pitwas in theeasternpart (Fig. 2).Weexpected thatboth of these F1 surfaces, although fromdifferent basins,would showsimilar deposition ages. We dug the soil pits where the surfacetopography was the best preserved from stream incisions. The mainstratigraphic deposits in the three fans are clastic limestone pebblessupported by a yellow-brown sand matrix. This sand matrix is strat-ifiedandpoorly sorted (Fig. 4).With this typeofmaterialwe couldnotcollect sampleswith a tubebecauseof the largediameterpebbles, butneithercouldwecollect a sampleasa largeblockbecause thematerialwas not well cemented or cohesive.
Wedecided that ifwewanted to collect only thematrix,wewouldneed to build a “portable dark room” with enough working space toallow repetitive extraction of the un-exposed sediment for lumines-cence dating. This would also facilitate removal of the troublesomecobbles and pebbles before manually inserting the loose sandmatrixinto the tubesorbagsandprovidecover for sealing thesamplesbeforedelivery to an OSL lab. To prepare for sampling we covered the pitswith several layers of black plastic anddurable cover blankets.We areconfident there was no light exposure during sample extraction (seeAppendix A).
First, we cleaned (in the dark) the wall by removing 5e10 cm ofthe surface that had been exposed to the sunlight during the diggingof the pit. Then we carved a 5e10 cm diameter hole in the cleanedsediment face (by hand) and sieved the sediment to remove thegravel and pebbles, keeping only the sandy matrix. We collectedw200 g of sediment and put a plastic bag containing the finer meshmaterial in an aluminum tube and securely sealed both ends of thetube. Theplasticbagalsohelped topreserve thepresentdaymoisture(if any). Around 800 g of the bulk coarse materials were collectedsystematically around the sample site for the dose rate estimates. Inthis manner, we collected IR08-3 from the gravel unit of F0 and thenIR08-4 from a gravel-pebbly unit within the eastern F1 fan, at 55 cmand 70 cm in depth, respectively. We were able to collect one blocksample (IR08-2) at a depth about 100 cm under the covers, withina well indurated fine sand bed with very few large pebbles.
At the Farm Creek site, one soil pit was excavated in the F2 surfaceon the northern part of the Astaneh fault (Fig. 3).The pit was openedwhere the topography was the best preserved, away from streamincisions and anthropogenic disturbances, such as roads and farmingactivities that could be observed elsewhere on this surface. A blocksample was collected in a silty sand matrix that contained a fewpebbles, at 50 cm depth and this sample was labeled IR09-2 (Fig. 5).

Fig. 4. Field photos of the soil pits and accompanying logs showing details of the sediments making up IR08-2, IR08-3 and IR08-4 samples. The black dots represent the location ofthe samples.
M. Rizza et al. / Quaternary Geochronology 6 (2011) 390e406394
We noted that this block sample was collected close to thesurface within a carbonate-rich surficial layer. We also recognizedthat both carbonate alteration and/or adjunction of eolian materialcould be responsible of the rejuvenation of the deposits on the topof the fan surface.
3. Experimental details
3.1. Dosimetry
Around 600 g of bulk sample were dried, sealed in a plasticplanchet (Murray et al., 1987) and placed in a gamma-ray spectrom-eter to measure the concentration of radiogenic Thorium (Th),Potassium (K) and Uranium (U) for each sample. Dose rates were
Fig. 5. Collection of the IR09-2 block sample in the F2 surface at Farm Creek. Thelocation of the soil pit is in a flat part of the crest line, where the topography seems tobe the best preserved.
calculated using radioisotope concentration, burial depth, elevation,geomagnetic latitude (Prescott and Hutton, 1994) and present daymoisture. Alpha and beta attenuation contributions were estimated(Aitken,1985) for theveryfinegrain sampleportions (i.e. polymineralIRSL). All elemental concentrations and dose rates are shown inTable1. The concentrations for Th, K, andUare very low, reflecting theinfluence of the limestone and sandstone source material.
3.2. Sample preparation protocol
In the OSL laboratory the entire part of the plastic bag containedwithin the tube was used for the quartz separation for IR08-3 andIR08-4. For samples IR08-2 and IR09-2, we kept only thematerial inthe center of the block after removing the light-exposed edges. Theblock edges were painted in the lab, the paint was allowed to dry,and then the edges were rigorously trimmed off to get to the center.If any paint showed up in the sieves during the prep process, thesample fraction was thrown away and a new portion was used.
All our samples were prepared using standard OSL measures.First, 4N Hydrochloric acid (HCl) was introduced over the course oftwo days to remove the calcium carbonate and then 35% hydrogenperoxide (H2O2) was used to remove organics and organic residueleft by the dissolution of the carbonates.We sieved thematerial andkept only the 250-180 mm,180-150 mm, and 150-90 mmfractions andthe 4e11 mmsilt fractionwas also saved for use in IRSL.We used twoheavy liquid solutions to separate feldspar (2.57e2.58 g/ml) andisolate the quartz fraction (2.64e2.67 g/ml). The isolated quartzwasetched in a 50% Hydrofluoric acid (HF) solution for 40 min and thenrinsed in an 8NHCl solution. After drying, this portionwas re-sievedto save the pure quartz grains and to discard the broken, and thussmaller, plagioclase grains that survived the heavy liquid process. Insomesamples, plagioclasewas veryplentiful and separated fromthequartz grains, when dried, as a fine white powder.
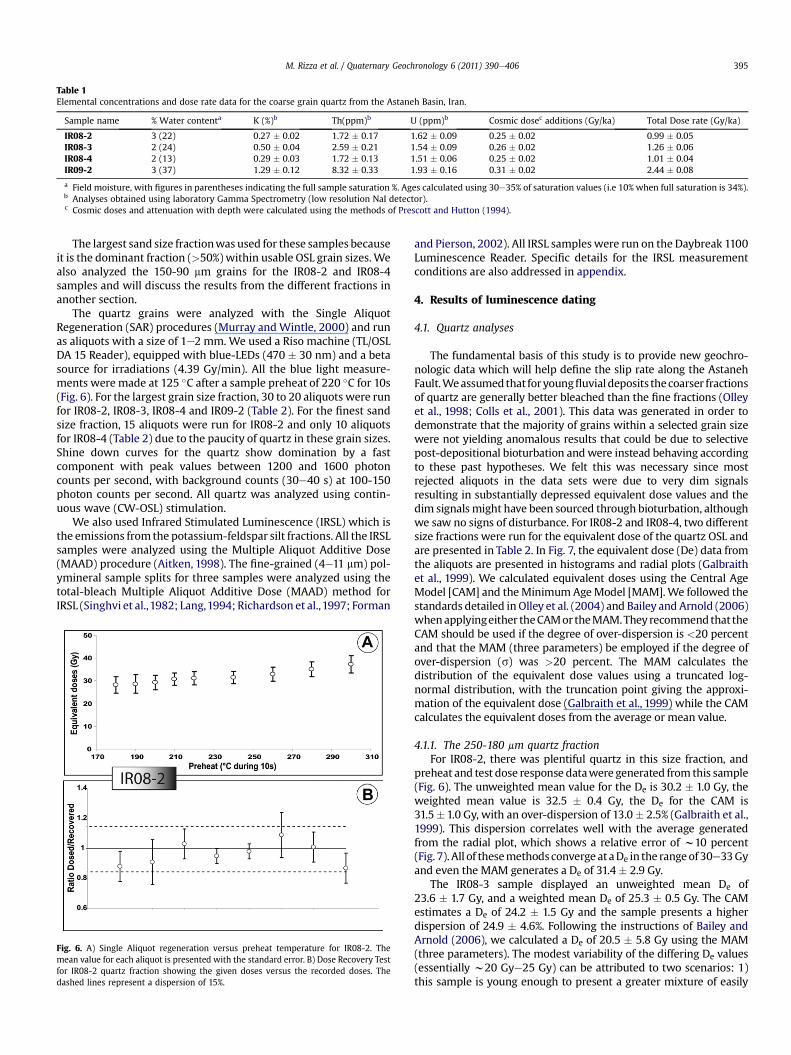
Table 1Elemental concentrations and dose rate data for the coarse grain quartz from the Astaneh Basin, Iran.
Sample name % Water contenta K (%)b Th(ppm)b U (ppm)b Cosmic dosec additions (Gy/ka) Total Dose rate (Gy/ka)
IR08-2 3 (22) 0.27 � 0.02 1.72 � 0.17 1.62 � 0.09 0.25 � 0.02 0.99 � 0.05IR08-3 2 (24) 0.50 � 0.04 2.59 � 0.21 1.54 � 0.09 0.26 � 0.02 1.26 � 0.06IR08-4 2 (13) 0.29 � 0.03 1.72 � 0.13 1.51 � 0.06 0.25 � 0.02 1.01 � 0.04IR09-2 3 (37) 1.29 � 0.12 8.32 � 0.33 1.93 � 0.16 0.31 � 0.02 2.44 � 0.08
a Field moisture, with figures in parentheses indicating the full sample saturation %. Ages calculated using 30e35% of saturation values (i.e 10% when full saturation is 34%).b Analyses obtained using laboratory Gamma Spectrometry (low resolution NaI detector).c Cosmic doses and attenuation with depth were calculated using the methods of Prescott and Hutton (1994).
M. Rizza et al. / Quaternary Geochronology 6 (2011) 390e406 395
The largest sand size fractionwas used for these samples becauseit is the dominant fraction (>50%) within usable OSL grain sizes.Wealso analyzed the 150-90 mm grains for the IR08-2 and IR08-4samples and will discuss the results from the different fractions inanother section.
The quartz grains were analyzed with the Single AliquotRegeneration (SAR) procedures (Murray andWintle, 2000) and runas aliquots with a size of 1e2 mm. We used a Riso machine (TL/OSLDA 15 Reader), equipped with blue-LEDs (470 � 30 nm) and a betasource for irradiations (4.39 Gy/min). All the blue light measure-ments were made at 125 �C after a sample preheat of 220 �C for 10s(Fig. 6). For the largest grain size fraction, 30 to 20 aliquots were runfor IR08-2, IR08-3, IR08-4 and IR09-2 (Table 2). For the finest sandsize fraction, 15 aliquots were run for IR08-2 and only 10 aliquotsfor IR08-4 (Table 2) due to the paucity of quartz in these grain sizes.Shine down curves for the quartz show domination by a fastcomponent with peak values between 1200 and 1600 photoncounts per second, with background counts (30e40 s) at 100-150photon counts per second. All quartz was analyzed using contin-uous wave (CW-OSL) stimulation.
We also used Infrared Stimulated Luminescence (IRSL) which isthe emissions from the potassium-feldspar silt fractions. All the IRSLsamples were analyzed using the Multiple Aliquot Additive Dose(MAAD) procedure (Aitken, 1998). The fine-grained (4e11 mm) pol-ymineral sample splits for three samples were analyzed using thetotal-bleach Multiple Aliquot Additive Dose (MAAD) method forIRSL (Singhvi et al.,1982; Lang,1994; Richardson et al.,1997; Forman
Fig. 6. A) Single Aliquot regeneration versus preheat temperature for IR08-2. Themean value for each aliquot is presented with the standard error. B) Dose Recovery Testfor IR08-2 quartz fraction showing the given doses versus the recorded doses. Thedashed lines represent a dispersion of 15%.
and Pierson, 2002). All IRSL samples were run on the Daybreak 1100Luminescence Reader. Specific details for the IRSL measurementconditions are also addressed in appendix.
4. Results of luminescence dating
4.1. Quartz analyses
The fundamental basis of this study is to provide new geochro-nologic data which will help define the slip rate along the AstanehFault.Weassumedthat foryoungfluvialdeposits thecoarser fractionsof quartz are generally better bleached than the fine fractions (Olleyet al., 1998; Colls et al., 2001). This data was generated in order todemonstrate that the majority of grains within a selected grain sizewere not yielding anomalous results that could be due to selectivepost-depositional bioturbation andwere instead behaving accordingto these past hypotheses. We felt this was necessary since mostrejected aliquots in the data sets were due to very dim signalsresulting in substantially depressed equivalent dose values and thedim signalsmight have been sourced through bioturbation, althoughwe saw no signs of disturbance. For IR08-2 and IR08-4, two differentsize fractions were run for the equivalent dose of the quartz OSL andare presented in Table 2. In Fig. 7, the equivalent dose (De) data fromthe aliquots are presented in histograms and radial plots (Galbraithet al., 1999). We calculated equivalent doses using the Central AgeModel [CAM] and theMinimumAgeModel [MAM].We followed thestandards detailed in Olley et al. (2004) and Bailey and Arnold (2006)whenapplyingeither theCAMortheMAM.They recommendthat theCAM should be used if the degree of over-dispersion is <20 percentand that the MAM (three parameters) be employed if the degree ofover-dispersion (s) was >20 percent. The MAM calculates thedistribution of the equivalent dose values using a truncated log-normal distribution, with the truncation point giving the approxi-mation of the equivalent dose (Galbraith et al., 1999) while the CAMcalculates the equivalent doses from the average or mean value.
4.1.1. The 250-180 mm quartz fractionFor IR08-2, there was plentiful quartz in this size fraction, and
preheat and test dose response datawere generated from this sample(Fig. 6). The unweighted mean value for the De is 30.2 � 1.0 Gy, theweighted mean value is 32.5 � 0.4 Gy, the De for the CAM is31.5�1.0 Gy, with an over-dispersion of 13.0� 2.5% (Galbraith et al.,1999). This dispersion correlates well with the average generatedfrom the radial plot, which shows a relative error of w10 percent(Fig. 7).All of thesemethods converge ataDe in the rangeof30e33Gyand even the MAM generates a De of 31.4� 2.9 Gy.
The IR08-3 sample displayed an unweighted mean De of23.6 � 1.7 Gy, and a weighted mean De of 25.3 � 0.5 Gy. The CAMestimates a De of 24.2 � 1.5 Gy and the sample presents a higherdispersion of 24.9 � 4.6%. Following the instructions of Bailey andArnold (2006), we calculated a De of 20.5 � 5.8 Gy using the MAM(three parameters). The modest variability of the differing De values(essentially w20 Gye25 Gy) can be attributed to two scenarios: 1)this sample is young enough to present a greater mixture of easily
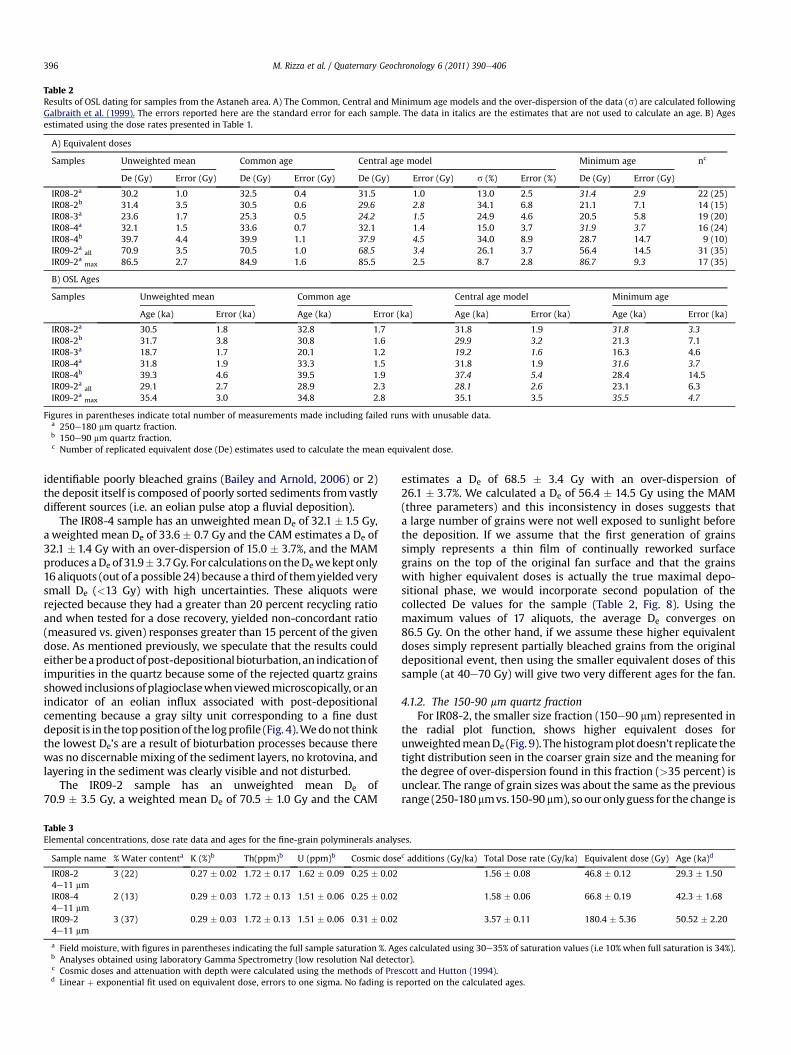
Table 2Results of OSL dating for samples from the Astaneh area. A) The Common, Central and Minimum age models and the over-dispersion of the data (s) are calculated followingGalbraith et al. (1999). The errors reported here are the standard error for each sample. The data in italics are the estimates that are not used to calculate an age. B) Agesestimated using the dose rates presented in Table 1.
A) Equivalent doses
Samples Unweighted mean Common age Central age model Minimum age nc
De (Gy) Error (Gy) De (Gy) Error (Gy) De (Gy) Error (Gy) s (%) Error (%) De (Gy) Error (Gy)
IR08-2a 30.2 1.0 32.5 0.4 31.5 1.0 13.0 2.5 31.4 2.9 22 (25)IR08-2b 31.4 3.5 30.5 0.6 29.6 2.8 34.1 6.8 21.1 7.1 14 (15)IR08-3a 23.6 1.7 25.3 0.5 24.2 1.5 24.9 4.6 20.5 5.8 19 (20)IR08-4a 32.1 1.5 33.6 0.7 32.1 1.4 15.0 3.7 31.9 3.7 16 (24)IR08-4b 39.7 4.4 39.9 1.1 37.9 4.5 34.0 8.9 28.7 14.7 9 (10)IR09-2a all 70.9 3.5 70.5 1.0 68.5 3.4 26.1 3.7 56.4 14.5 31 (35)IR09-2a max 86.5 2.7 84.9 1.6 85.5 2.5 8.7 2.8 86.7 9.3 17 (35)
B) OSL Ages
Samples Unweighted mean Common age Central age model Minimum age
Age (ka) Error (ka) Age (ka) Error (ka) Age (ka) Error (ka) Age (ka) Error (ka)
IR08-2a 30.5 1.8 32.8 1.7 31.8 1.9 31.8 3.3IR08-2b 31.7 3.8 30.8 1.6 29.9 3.2 21.3 7.1IR08-3a 18.7 1.7 20.1 1.2 19.2 1.6 16.3 4.6IR08-4a 31.8 1.9 33.3 1.5 31.8 1.9 31.6 3.7IR08-4b 39.3 4.6 39.5 1.9 37.4 5.4 28.4 14.5IR09-2a all 29.1 2.7 28.9 2.3 28.1 2.6 23.1 6.3IR09-2a max 35.4 3.0 34.8 2.8 35.1 3.5 35.5 4.7
Figures in parentheses indicate total number of measurements made including failed runs with unusable data.a 250e180 mm quartz fraction.b 150e90 mm quartz fraction.c Number of replicated equivalent dose (De) estimates used to calculate the mean equivalent dose.
M. Rizza et al. / Quaternary Geochronology 6 (2011) 390e406396
identifiable poorly bleached grains (Bailey and Arnold, 2006) or 2)the deposit itself is composed of poorly sorted sediments fromvastlydifferent sources (i.e. an eolian pulse atop a fluvial deposition).
The IR08-4 sample has an unweighted mean De of 32.1 �1.5 Gy,a weighted mean De of 33.6 � 0.7 Gy and the CAM estimates a De of32.1 � 1.4 Gy with an over-dispersion of 15.0 � 3.7%, and the MAMproduces aDe of 31.9� 3.7Gy. For calculations on theDewekept only16 aliquots (out of a possible 24) because a third of themyielded verysmall De (<13 Gy) with high uncertainties. These aliquots wererejected because they had a greater than 20 percent recycling ratioand when tested for a dose recovery, yielded non-concordant ratio(measured vs. given) responses greater than 15 percent of the givendose. As mentioned previously, we speculate that the results couldeitherbeaproductofpost-depositional bioturbation, an indicationofimpurities in the quartz because some of the rejected quartz grainsshowed inclusions of plagioclasewhenviewedmicroscopically, or anindicator of an eolian influx associated with post-depositionalcementing because a gray silty unit corresponding to a fine dustdeposit is in the toppositionof the logprofile (Fig. 4).Wedonot thinkthe lowest De’s are a result of bioturbation processes because therewas no discernable mixing of the sediment layers, no krotovina, andlayering in the sediment was clearly visible and not disturbed.
The IR09-2 sample has an unweighted mean De of70.9 � 3.5 Gy, a weighted mean De of 70.5 � 1.0 Gy and the CAM
Table 3Elemental concentrations, dose rate data and ages for the fine-grain polyminerals analys
Sample name % Water contenta K (%)b Th(ppm)b U (ppm)b Cosmic dose
IR08-24e11 mm
3 (22) 0.27 � 0.02 1.72 � 0.17 1.62 � 0.09 0.25 � 0.02
IR08-44e11 mm
2 (13) 0.29 � 0.03 1.72 � 0.13 1.51 � 0.06 0.25 � 0.02
IR09-24e11 mm
3 (37) 0.29 � 0.03 1.72 � 0.13 1.51 � 0.06 0.31 � 0.02
a Field moisture, with figures in parentheses indicating the full sample saturation %. Agb Analyses obtained using laboratory Gamma Spectrometry (low resolution NaI detecc Cosmic doses and attenuation with depth were calculated using the methods of Pred Linear þ exponential fit used on equivalent dose, errors to one sigma. No fading is r
estimates a De of 68.5 � 3.4 Gy with an over-dispersion of26.1 � 3.7%. We calculated a De of 56.4 � 14.5 Gy using the MAM(three parameters) and this inconsistency in doses suggests thata large number of grains were not well exposed to sunlight beforethe deposition. If we assume that the first generation of grainssimply represents a thin film of continually reworked surfacegrains on the top of the original fan surface and that the grainswith higher equivalent doses is actually the true maximal depo-sitional phase, we would incorporate second population of thecollected De values for the sample (Table 2, Fig. 8). Using themaximum values of 17 aliquots, the average De converges on86.5 Gy. On the other hand, if we assume these higher equivalentdoses simply represent partially bleached grains from the originaldepositional event, then using the smaller equivalent doses of thissample (at 40e70 Gy) will give two very different ages for the fan.
4.1.2. The 150-90 mm quartz fractionFor IR08-2, the smaller size fraction (150e90 mm) represented in
the radial plot function, shows higher equivalent doses forunweightedmeanDe (Fig. 9). Thehistogramplot doesn’t replicate thetight distribution seen in the coarser grain size and the meaning forthe degree of over-dispersion found in this fraction (>35 percent) isunclear. The range of grain sizes was about the same as the previousrange (250-180 mmvs.150-90 mm), so our onlyguess for the change is
es.
c additions (Gy/ka) Total Dose rate (Gy/ka) Equivalent dose (Gy) Age (ka)d
1.56 � 0.08 46.8 � 0.12 29.3 � 1.50
1.58 � 0.06 66.8 � 0.19 42.3 � 1.68
3.57 � 0.11 180.4 � 5.36 50.52 � 2.20
es calculated using 30e35% of saturation values (i.e 10% when full saturation is 34%).tor).scott and Hutton (1994).eported on the calculated ages.

Fig. 7. Results of the OSL dating on the 250-180 mm quartz grains. (a) : Distribution of equivalent doses (De) in histograms. N represents the total aliquots number. (b) Radial plots ofthe measured doses following Galbraith et al., 1999.
M. Rizza et al. / Quaternary Geochronology 6 (2011) 390e406 397

Fig. 8. Results of the OSL dating on the 250-180 mm quartz grains for the higher range of the IR09-2. (a) : Distribution of equivalent doses (De) in histograms. N represents the totalaliquots number. (b) Radial plots of the measured doses following Galbraith et al., 1999.
M. Rizza et al. / Quaternary Geochronology 6 (2011) 390e406398
an assumption that the larger quartz grains were more uniformlybleached before deposition. To calculate the equivalent dose, 14aliquots were used from the total of 15 aliquots as only a sparseamount of quartz was available for analyses. The unweighted meanvalue for theDe is31.4�3.5Gy, theweightedmeanDe is30.5�0.6Gy,the CAM estimates a De of 29.6 � 2.8 Gy with an over-dispersion of34.1 � 6.8%, and the MAM provides an estimate of 21.1 �7.1 Gy.
For IR08-4, the radial plot (Fig. 9) shows a larger dispersion of theDe’s (w35 percent), which, again, was not seen in the coarser grainsize. We accept that this dispersion could be an artifact related to thepaucity of data for the finer sizes as only nine aliquots were usedhere. For this fraction the unweighted mean De is 39.7 � 4.4 Gy, theweighted mean De is 39.9 � 1.1 Gy and the CAM estimates a De of
Fig. 9. Results of the OSL dating on the 150-90 mm quartz grains. (a) : Distribution of equivathe measured doses following Galbraith et al., 1999.
37.9 � 4.5 Gy with an over-dispersion of 34.0 � 8.9%. We thenestimate a De of 28.7 � 14.7 Gy using MAM (three parameters).
These limited results show that within the finer grain sizefraction, the over-dispersion in the equivalent dose values is greaterthan that in the coarse grain size fraction and this generallysupports our assumption that the coarser grain sizes were moreuniformly bleached, and thus more suitable for OSL analyses.
4.2. Polymineral analyses
In an attempt to identify and validate the best method forcalculating the De of the quartz equivalent doses, we decided to runIRSL on the silt fraction of the samples (Table 3). This should give us
lent doses (De) in histograms. N represents the total aliquots number. (b) Radial plots of
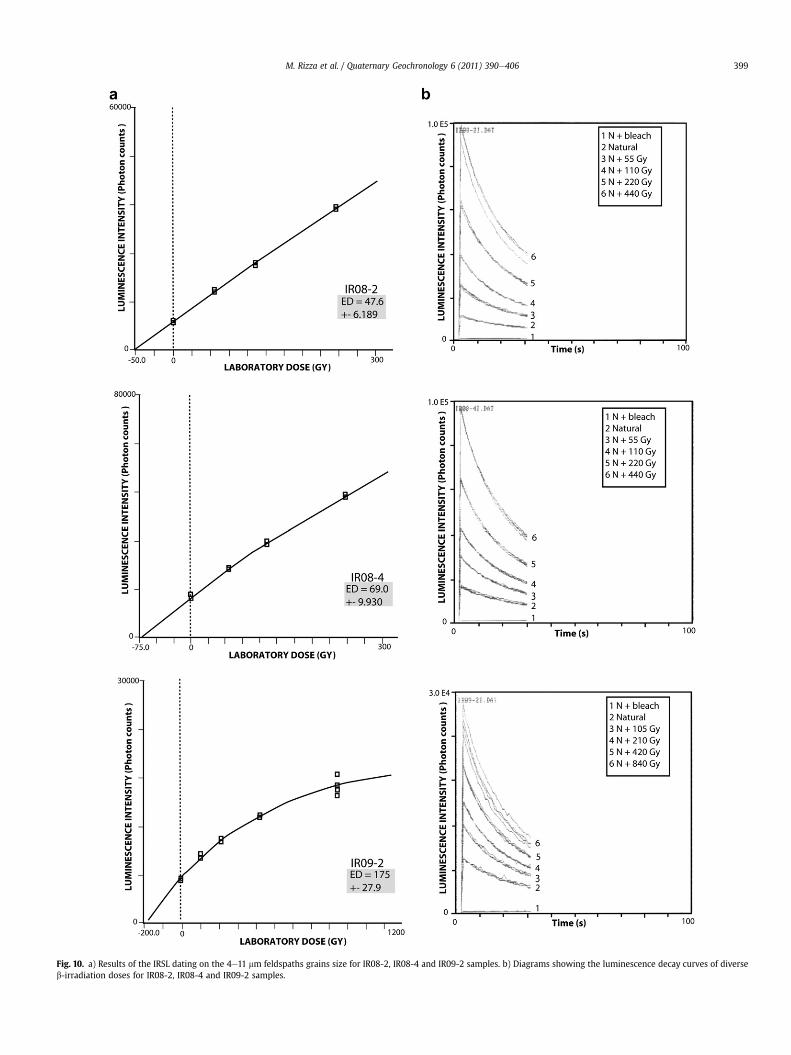
Fig. 10. a) Results of the IRSL dating on the 4e11 mm feldspaths grains size for IR08-2, IR08-4 and IR09-2 samples. b) Diagrams showing the luminescence decay curves of diverseb-irradiation doses for IR08-2, IR08-4 and IR09-2 samples.
M. Rizza et al. / Quaternary Geochronology 6 (2011) 390e406 399
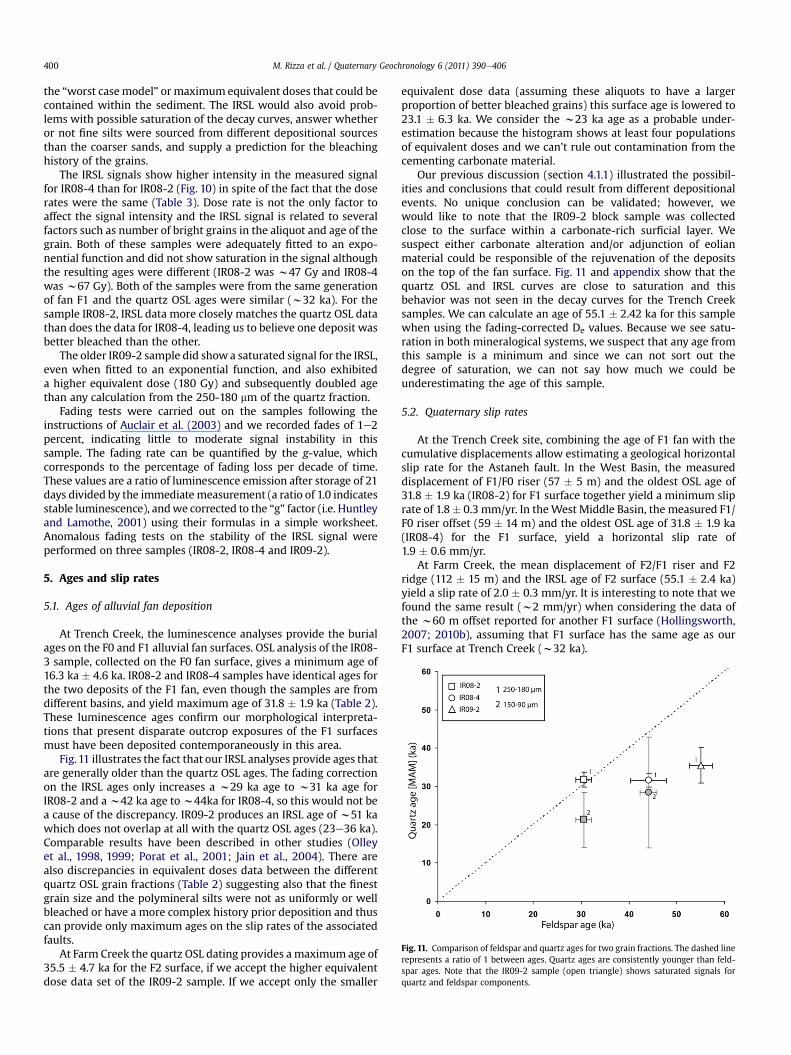
Fig. 11. Comparison of feldspar and quartz ages for two grain fractions. The dashed linerepresents a ratio of 1 between ages. Quartz ages are consistently younger than feld-spar ages. Note that the IR09-2 sample (open triangle) shows saturated signals forquartz and feldspar components.
M. Rizza et al. / Quaternary Geochronology 6 (2011) 390e406400
the “worst case model” or maximum equivalent doses that could becontained within the sediment. The IRSL would also avoid prob-lems with possible saturation of the decay curves, answer whetheror not fine silts were sourced from different depositional sourcesthan the coarser sands, and supply a prediction for the bleachinghistory of the grains.
The IRSL signals show higher intensity in the measured signalfor IR08-4 than for IR08-2 (Fig. 10) in spite of the fact that the doserates were the same (Table 3). Dose rate is not the only factor toaffect the signal intensity and the IRSL signal is related to severalfactors such as number of bright grains in the aliquot and age of thegrain. Both of these samples were adequately fitted to an expo-nential function and did not show saturation in the signal althoughthe resulting ages were different (IR08-2 was w47 Gy and IR08-4was w67 Gy). Both of the samples were from the same generationof fan F1 and the quartz OSL ages were similar (w32 ka). For thesample IR08-2, IRSL data more closely matches the quartz OSL datathan does the data for IR08-4, leading us to believe one deposit wasbetter bleached than the other.
The older IR09-2 sample did showa saturated signal for the IRSL,even when fitted to an exponential function, and also exhibiteda higher equivalent dose (180 Gy) and subsequently doubled agethan any calculation from the 250-180 mm of the quartz fraction.
Fading tests were carried out on the samples following theinstructions of Auclair et al. (2003) and we recorded fades of 1e2percent, indicating little to moderate signal instability in thissample. The fading rate can be quantified by the g-value, whichcorresponds to the percentage of fading loss per decade of time.These values are a ratio of luminescence emission after storage of 21days divided by the immediate measurement (a ratio of 1.0 indicatesstable luminescence), andwe corrected to the “g” factor (i.e. Huntleyand Lamothe, 2001) using their formulas in a simple worksheet.Anomalous fading tests on the stability of the IRSL signal wereperformed on three samples (IR08-2, IR08-4 and IR09-2).
5. Ages and slip rates
5.1. Ages of alluvial fan deposition
At Trench Creek, the luminescence analyses provide the burialages on the F0 and F1 alluvial fan surfaces. OSL analysis of the IR08-3 sample, collected on the F0 fan surface, gives a minimum age of16.3 ka � 4.6 ka. IR08-2 and IR08-4 samples have identical ages forthe two deposits of the F1 fan, even though the samples are fromdifferent basins, and yield maximum age of 31.8 � 1.9 ka (Table 2).These luminescence ages confirm our morphological interpreta-tions that present disparate outcrop exposures of the F1 surfacesmust have been deposited contemporaneously in this area.
Fig.11 illustrates the fact that our IRSL analyses provide ages thatare generally older than the quartz OSL ages. The fading correctionon the IRSL ages only increases a w29 ka age to w31 ka age forIR08-2 and aw42 ka age tow44ka for IR08-4, so this would not bea cause of the discrepancy. IR09-2 produces an IRSL age of w51 kawhich does not overlap at all with the quartz OSL ages (23e36 ka).Comparable results have been described in other studies (Olleyet al., 1998, 1999; Porat et al., 2001; Jain et al., 2004). There arealso discrepancies in equivalent doses data between the differentquartz OSL grain fractions (Table 2) suggesting also that the finestgrain size and the polymineral silts were not as uniformly or wellbleached or have a more complex history prior deposition and thuscan provide only maximum ages on the slip rates of the associatedfaults.
At Farm Creek the quartz OSL dating provides a maximum age of35.5 � 4.7 ka for the F2 surface, if we accept the higher equivalentdose data set of the IR09-2 sample. If we accept only the smaller
equivalent dose data (assuming these aliquots to have a largerproportion of better bleached grains) this surface age is lowered to23.1 � 6.3 ka. We consider the w23 ka age as a probable under-estimation because the histogram shows at least four populationsof equivalent doses and we can’t rule out contamination from thecementing carbonate material.
Our previous discussion (section 4.1.1) illustrated the possibil-ities and conclusions that could result from different depositionalevents. No unique conclusion can be validated; however, wewould like to note that the IR09-2 block sample was collectedclose to the surface within a carbonate-rich surficial layer. Wesuspect either carbonate alteration and/or adjunction of eolianmaterial could be responsible of the rejuvenation of the depositson the top of the fan surface. Fig. 11 and appendix show that thequartz OSL and IRSL curves are close to saturation and thisbehavior was not seen in the decay curves for the Trench Creeksamples. We can calculate an age of 55.1 � 2.42 ka for this samplewhen using the fading-corrected De values. Because we see satu-ration in both mineralogical systems, we suspect that any age fromthis sample is a minimum and since we can not sort out thedegree of saturation, we can not say how much we could beunderestimating the age of this sample.
5.2. Quaternary slip rates
At the Trench Creek site, combining the age of F1 fan with thecumulative displacements allow estimating a geological horizontalslip rate for the Astaneh fault. In the West Basin, the measureddisplacement of F1/F0 riser (57 � 5 m) and the oldest OSL age of31.8 � 1.9 ka (IR08-2) for F1 surface together yield a minimum sliprate of 1.8� 0.3 mm/yr. In theWest Middle Basin, the measured F1/F0 riser offset (59 � 14 m) and the oldest OSL age of 31.8 � 1.9 ka(IR08-4) for the F1 surface, yield a horizontal slip rate of1.9 � 0.6 mm/yr.
At Farm Creek, the mean displacement of F2/F1 riser and F2ridge (112 � 15 m) and the IRSL age of F2 surface (55.1 � 2.4 ka)yield a slip rate of 2.0 � 0.3 mm/yr. It is interesting to note that wefound the same result (w2 mm/yr) when considering the data ofthe w60 m offset reported for another F1 surface (Hollingsworth,2007; 2010b), assuming that F1 surface has the same age as ourF1 surface at Trench Creek (w32 ka).
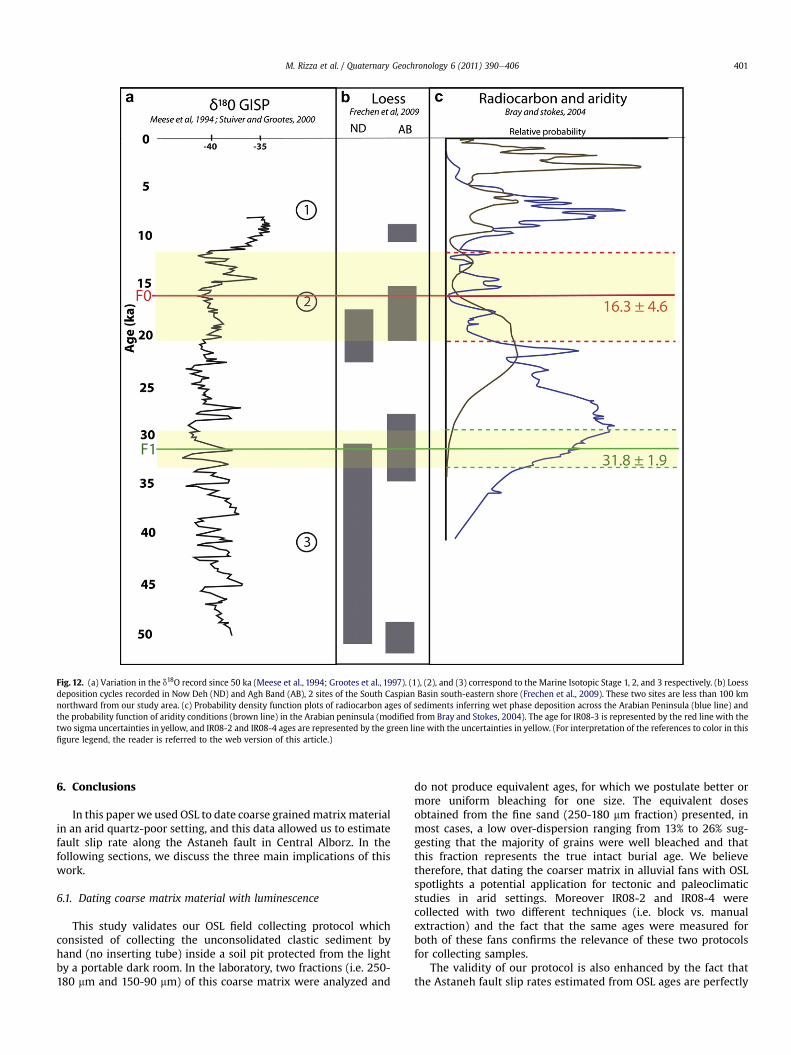
Fig. 12. (a) Variation in the d18O record since 50 ka (Meese et al., 1994; Grootes et al., 1997). (1), (2), and (3) correspond to the Marine Isotopic Stage 1, 2, and 3 respectively. (b) Loessdeposition cycles recorded in Now Deh (ND) and Agh Band (AB), 2 sites of the South Caspian Basin south-eastern shore (Frechen et al., 2009). These two sites are less than 100 kmnorthward from our study area. (c) Probability density function plots of radiocarbon ages of sediments inferring wet phase deposition across the Arabian Peninsula (blue line) andthe probability function of aridity conditions (brown line) in the Arabian peninsula (modified from Bray and Stokes, 2004). The age for IR08-3 is represented by the red line with thetwo sigma uncertainties in yellow, and IR08-2 and IR08-4 ages are represented by the green line with the uncertainties in yellow. (For interpretation of the references to color in thisfigure legend, the reader is referred to the web version of this article.)
M. Rizza et al. / Quaternary Geochronology 6 (2011) 390e406 401
6. Conclusions
In this paper we used OSL to date coarse grainedmatrix materialin an arid quartz-poor setting, and this data allowed us to estimatefault slip rate along the Astaneh fault in Central Alborz. In thefollowing sections, we discuss the three main implications of thiswork.
6.1. Dating coarse matrix material with luminescence
This study validates our OSL field collecting protocol whichconsisted of collecting the unconsolidated clastic sediment byhand (no inserting tube) inside a soil pit protected from the lightby a portable dark room. In the laboratory, two fractions (i.e. 250-180 mm and 150-90 mm) of this coarse matrix were analyzed and
do not produce equivalent ages, for which we postulate better ormore uniform bleaching for one size. The equivalent dosesobtained from the fine sand (250-180 mm fraction) presented, inmost cases, a low over-dispersion ranging from 13% to 26% sug-gesting that the majority of grains were well bleached and thatthis fraction represents the true intact burial age. We believetherefore, that dating the coarser matrix in alluvial fans with OSLspotlights a potential application for tectonic and paleoclimaticstudies in arid settings. Moreover IR08-2 and IR08-4 werecollected with two different techniques (i.e. block vs. manualextraction) and the fact that the same ages were measured forboth of these fans confirms the relevance of these two protocolsfor collecting samples.
The validity of our protocol is also enhanced by the fact thatthe Astaneh fault slip rates estimated from OSL ages are perfectly
M. Rizza et al. / Quaternary Geochronology 6 (2011) 390e406402
consistent with the GPS data showing that the deformation isaccommodating mainly by left-lateral strike-slip faults witha rate of 2 mm/yr, in the eastern part of Iran (Djamour et al.,2010).
6.2. Alluvial fan deposits and climate relations
Our OSL ages of alluvial surfaces in the Astaneh valley in CentralAlborz show that three periods of deposition occurred at w16 ka,w32 ka andw55 ka. Fig.12 shows that the three ages correlatewithloess deposition cycles that occurred during the last glacial periodin the South Caspian basin (Frechen et al., 2009; Karimi et al., 2009,2011). These ages correlate also with wet periods recorded duringthe upper Pleistocene paleoclimate in the Arabian-Iran region(Glennie and Singhvi, 2002; Bray and Stokes, 2004; Kehl et al.,2005; Kehl, 2009). The emplacement of alluvial fan surfaces F1(w32 ka) at Trench Creek match with a long wet period, recordedbetween 35 ka and 25 ka (Bray and Stokes, 2004). The same age(w30 ka) was also found at the base of an alluvial fan dated withOSL in Zabzevar region (Fattahi et al., 2006). The alluvial fan surfaceF0 at Trench creek (w16 ka) matches with a globally drier andcooler period during the Last Glacial Maximum (LGM or stage 2)(Shackleton, 1987; Grootes et al., 1997; Mangerud et al., 2001; Brayand Stokes, 2004; Clark et al., 2009).
The fan deposition could also be correlative to a cosmogenic ageof an abandoned alluvial fan (w20 ka) in the Minab area insouthern Iran (Regard et al., 2006). The above-mentioned paleo-climate studies show that the last wet period occurred between 12and 6 ka, and abandoned alluvial surfaces match with this period inseveral places in Iran (Antoine et al., 2006; Fattahi et al., 2006,2007; LeDortz et al., 2009; Walker et al., 2009). We do not havedata showing that this wet period occurred also in the AstanehValley. However, this wet period could correspond to the Fa fansurface that incises the F0 surface at Trench Creek, mentioned inour geomorphologic analyses. These results suggest that theemplacement of fan surfaces in the Astaneh Valley, occurred duringwet, but cooler interstages, rather than during the present inter-glacial stage as has been observed elsewhere in the similarmountainous and arid settings (Kocurek and Lancaster, 1999;Reheis et al., 2005).
6.3. Slip rates
Our luminescence dating of offset alluvial fan surfaces along theAstaneh fault allowed us to determine a left-lateral horizontal sliprate of w2 mm/yr. This slip rate can be estimated using twodifferent ages (w32 ka and w55 ka) and still show no significantvariations (1.9 � 0.6 mm/yr and 2.0 � 0.3 mm/yr, respectively).
This result is in agreement with another w2 mm/yr slip ratedetermined along the Mosha and Firouzkuh faults (Ritz et al., 2003,2006; Nazari et al., submitted to Tectonophysics) and the w1 mm/yr slip rate determined along the Taleghan fault (Nazari et al.,2009). These three faults correspond to a westward extension ofthe Astaneh fault. In addition, our slip rate estimate is consistentwith the GPS data in central eastern Alborz, concluding in a presentleft-lateral interseismic loading of 2.5 � 1.5 mm/yr along theAstaneh fault (Djamour, 2004; Vernant et al., 2004; Djamour et al.,2010).
Acknowledgments
We thank the Geological Survey of Iran for organizing thefieldworks of 2008 and 2009 and we especially thank the tech-nical Iranian staff, notably Mohammad Foroutan, for help in thefield. The MAM estimates were performed using an excel
spreadsheet provided by Sébastien Huot and the first authorwould like to acknowledge him for his patience and his tutorial forusing the MAM files. We also would like to thank S. Forman, M.Fattahi and also R.B. Roberts for their constructive suggestions andtheir helpful to improve the manuscript and clarify the data. Wealso would like to acknowledge James Jackson and PhilippeVernant for fruitful discussions about the Quaternary geology ofthe Astaneh fault. This work has been supported by the INSU/3FFrench program.
Appendices
Appendix A
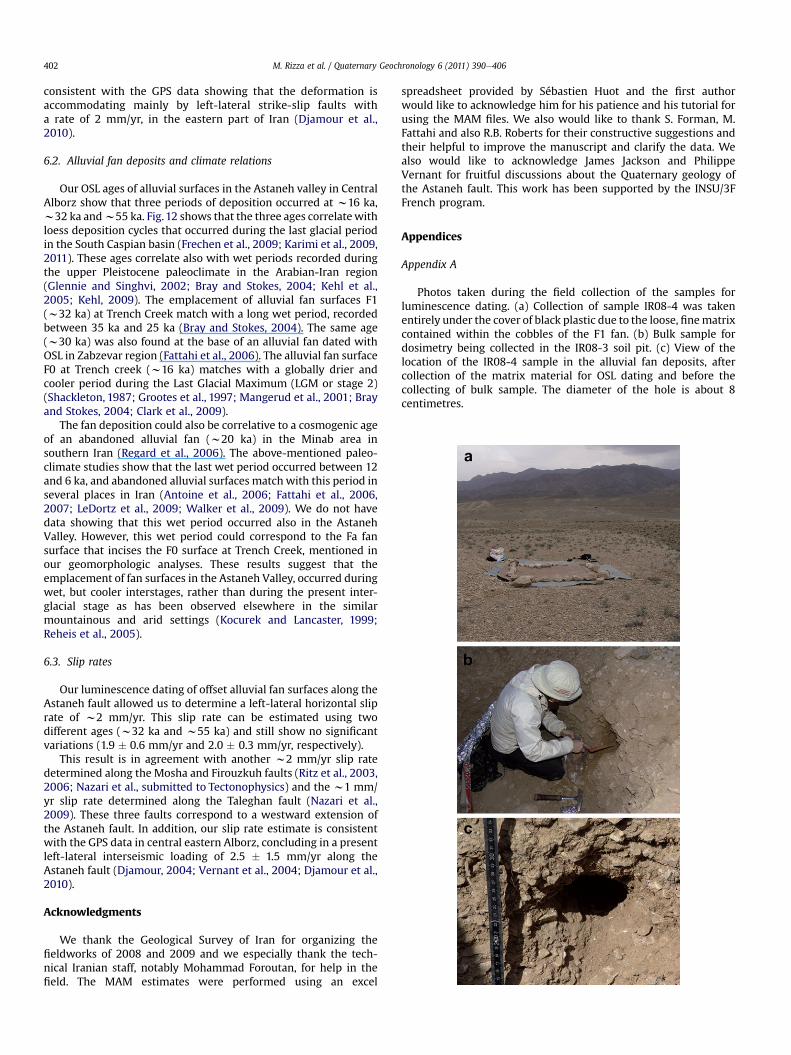
Photos taken during the field collection of the samples forluminescence dating. (a) Collection of sample IR08-4 was takenentirely under the cover of black plastic due to the loose, finematrixcontained within the cobbles of the F1 fan. (b) Bulk sample fordosimetry being collected in the IR08-3 soil pit. (c) View of thelocation of the IR08-4 sample in the alluvial fan deposits, aftercollection of the matrix material for OSL dating and before thecollecting of bulk sample. The diameter of the hole is about 8centimetres.
M. Rizza et al. / Quaternary Geochronology 6 (2011) 390e406 403
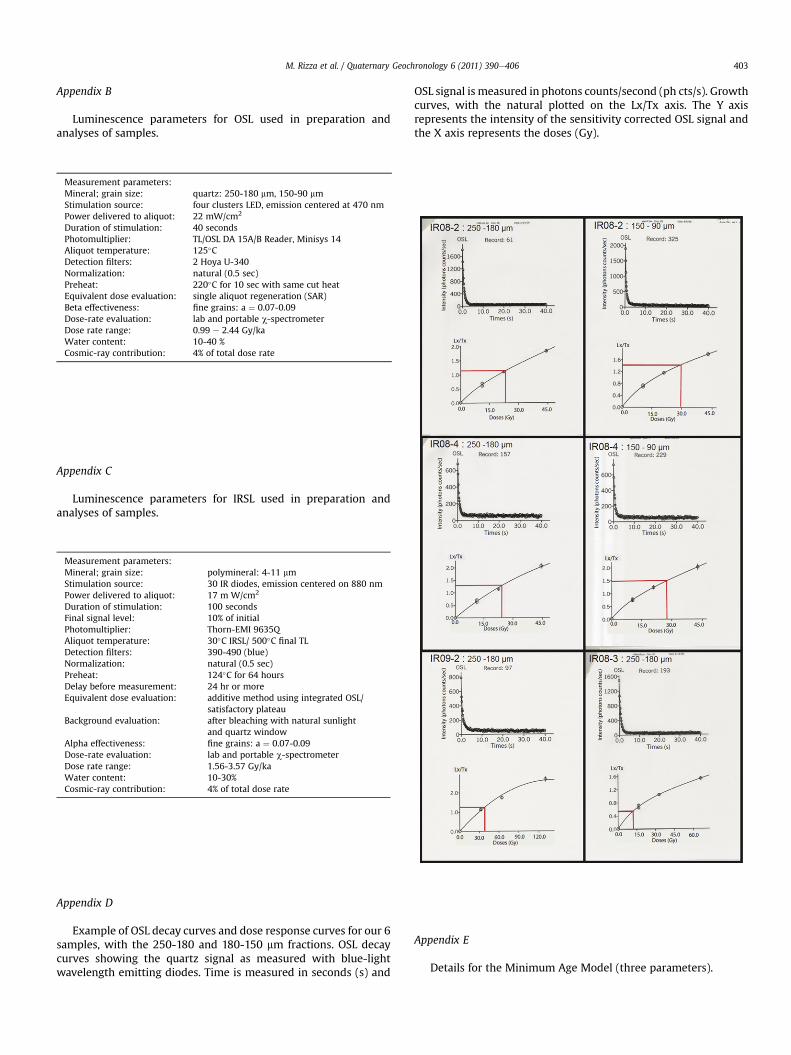
Appendix B
Luminescence parameters for OSL used in preparation andanalyses of samples.
Measurement parameters:Mineral; grain size: quartz: 250-180 mm, 150-90 mmStimulation source: four clusters LED, emission centered at 470 nmPower delivered to aliquot: 22 mW/cm2
Duration of stimulation: 40 secondsPhotomultiplier: TL/OSL DA 15A/B Reader, Minisys 14Aliquot temperature: 125�CDetection filters: 2 Hoya U-340Normalization: natural (0.5 sec)Preheat: 220�C for 10 sec with same cut heatEquivalent dose evaluation: single aliquot regeneration (SAR)Beta effectiveness: fine grains: a ¼ 0.07-0.09Dose-rate evaluation: lab and portable c-spectrometerDose rate range: 0.99 e 2.44 Gy/kaWater content: 10-40 %Cosmic-ray contribution: 4% of total dose rate
Appendix C
Luminescence parameters for IRSL used in preparation andanalyses of samples.
Measurement parameters:Mineral; grain size: polymineral: 4-11 mmStimulation source: 30 IR diodes, emission centered on 880 nmPower delivered to aliquot: 17 m W/cm2
Duration of stimulation: 100 secondsFinal signal level: 10% of initialPhotomultiplier: Thorn-EMI 9635QAliquot temperature: 30�C IRSL/ 500�C final TLDetection filters: 390-490 (blue)Normalization: natural (0.5 sec)Preheat: 124�C for 64 hoursDelay before measurement: 24 hr or moreEquivalent dose evaluation: additive method using integrated OSL/
satisfactory plateauBackground evaluation: after bleaching with natural sunlight
and quartz windowAlpha effectiveness: fine grains: a ¼ 0.07-0.09Dose-rate evaluation: lab and portable c-spectrometerDose rate range: 1.56-3.57 Gy/kaWater content: 10-30%Cosmic-ray contribution: 4% of total dose rate
Appendix D
Example of OSL decay curves and dose response curves for our 6samples, with the 250-180 and 180-150 mm fractions. OSL decaycurves showing the quartz signal as measured with blue-lightwavelength emitting diodes. Time is measured in seconds (s) and
OSL signal is measured in photons counts/second (ph cts/s). Growthcurves, with the natural plotted on the Lx/Tx axis. The Y axisrepresents the intensity of the sensitivity corrected OSL signal andthe X axis represents the doses (Gy).
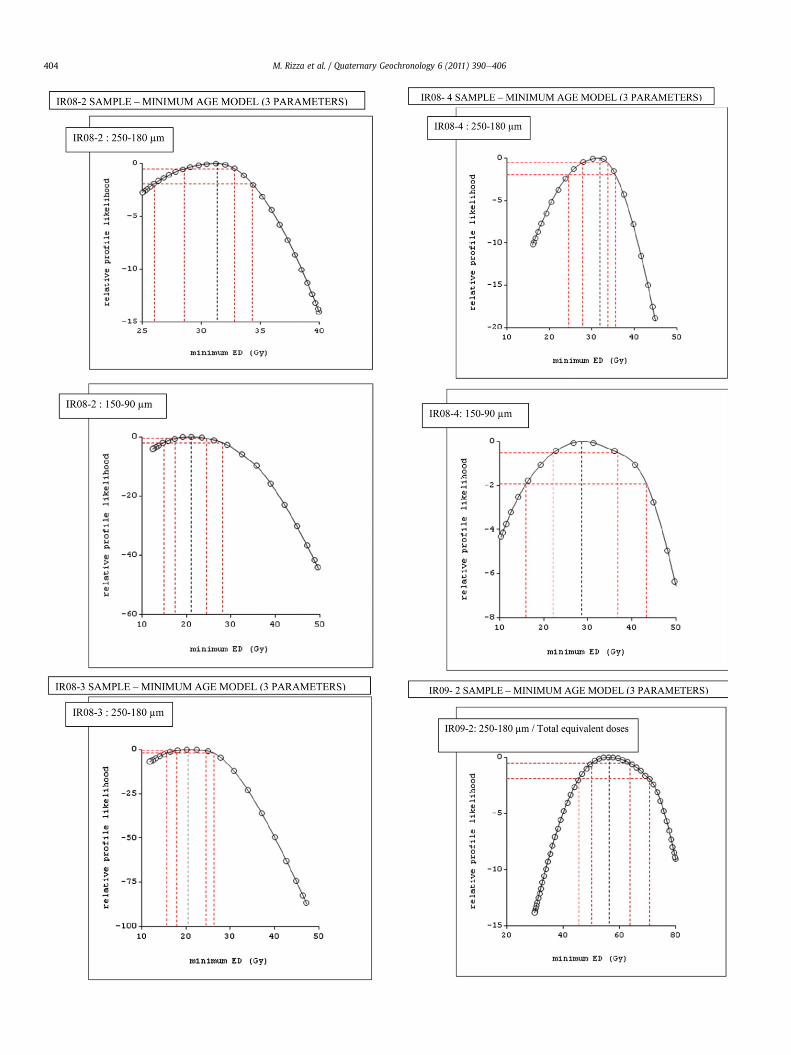
Appendix E
Details for the Minimum Age Model (three parameters).
M. Rizza et al. / Quaternary Geochronology 6 (2011) 390e406404

M. Rizza et al. / Quaternary Geochronology 6 (2011) 390e406 405
References
Aitken, M.J., 1985. Thermoluminescence Dating. Academic Press, London.Aitken, M.J., 1998. An Introduction to Optical Dating: The dating of Quaternary
sediments by the use of photon-stimulated luminescence. Oxford UniversityPress, New York, 267 pp.
Alavi, M., 1996. Tectonostratigraphic synthesis and structural style of the Alborzmountain system in northern Iran. Journal of Geodynamics 21, 1e33.
Allen, M.B., Vincent, S.J., Alsop, G.I., Ismail-Zadeh, A., Flecker, R., 2003. Late Cenozoicdeformation in the South Caspian region; effects of a rigid basement blockwithin a collision zone. Tectonophysics 366, 223e239.
Ambraseys, N.N., Melville, C.P., 1982. A History of Persian Earthquakes.Antoine, P., Bahain, J.-J., Berillon, G., Khaneghah, A., Limondin-Lozouet, N., 2006. Tuf
calcaire et sequence alluviale en contexte tectonique actif; la formation deBaliran (Province du Mazandaran, Iran). Calcareous tufa and alluvial sequencein an active tectonic context; the Baliran Formation (Mazandaran Province,Iran). Quaternaire (Paris) 17, 321e331.
Auclair, M., Lamothe, M., Huot, S., 2003. Measurement of anomalous fading forfeldspar IRSL using SAR. Radiation Measurements 37, 487e492.
Bailey, R.M., Arnold, L.J., 2006. Statistical modelling of single grain quatz De dis-tibutions and an assesment of procedures for estimating burial dose. Quater-nary Science Reviews 25, 2475e2502.
Bray, H.E., Stokes, S., 2004. Temporal patterns of arid-humid transitions in the south-eastern Arabian Peninsula based on optical dating. Geomorphology 59, 271e280.
Clark, P.U., Dyke, A.S., Shakun, J.D., Carlson, A.E., Clark, J., Wohlfarth, B.,Mitrovica, J.X., Hostetler, S.W., McCabe, A.M., 2009. The last glacial maximum.Science 325, 710e714.
Colls, A.E., Stokes, S., Blum, M.D., Straffin, E., 2001. Age limits on the late Quaternaryevolution of the upper Loire River. Quaternary Science Reviews 20, 743e750.
Djamour, Y. (2004). Contribution de la Géodésie (GPS et nivellement) à l’étude de ladéformation tectonique et de l’aléa sismique sur la région de Téhéran (Mon-tagne de l’Alborz, Iran). Ph.D Thesis.
Djamour, Y., Vernant, P., Bayer, R., Nankali, H., Ritz, J.F., Hinderer, J., Hatam, Y.,Luck, B., Le Moigne, N., Sedighi, M., Khorrami, F., 2010. GPS and gravityconstraints on continental deformation in the Alborz mountain range, Iran.Geophysical Journal International 183, 1287e1301.
Fattahi, M., Walker, R., Hollingsworth, J., Bahroudi, A., Nazari, H., Talebian, M.,Armitage, S.J., Stokes, S., 2006. Holocene slip-rate on the Sabzevar thrust fault,NE Iran, determined using optically stimulated luminescence (OSL). Earth andPlanetary Science Letters 245, 673e684.
Fattahi, M., Walker, R.T., 2007. Luminescence dating of the last earthquake of theSabzevar thrust fault, NE Iran. Quaternary Geochronology 2, 284e289.
Fattahi, M., Walker, R.T., Khatib, M.M., Dolati, A., Bahroudi, A., 2007. Slip-rate esti-mate and past earthquakes on the Doruneh Fault, eastern Iran. GeophysicalJournal International 168, 691e709.
Fattahi, M., Nazari, H., Bateman, M.D., Meyer, B., Sebrier, M., Talebian, M.,LeDortz, K., Foroutan, M., Ahmadi Givi, F., Gorashi, M., 2010. Refining the OSLage of the last earthquake on the Deshir fault, Central Iran. QuaternaryGeochronology 5, 286e292.
Forman, S.L., Pierson, J., 2002. Late Pleistocene luminescence chronology of loessdeposition in the Missouri and Mississippi river valleys, United States. Palae-ogeography Palaeoclimatology Palaeoecology 186, 25e46.
Frechen, M., Kehl, M., Rolf, C., Sarvati, R., Skowronek, A., 2009. Loess chronology ofthe Caspian lowland in northern Iran. Quaternary International 198, 220e233.
Galbraith, R.F., Roberts, R.G., Laslett, G.M., Yoshida, H., Olley, J.M., 1999. Opticaldating of single and multiple grains of quatz from Jinmium rock shelter,Northern Australia. Part 1: experimental design and statistical models.Archaeometry 41, 339e364.
Glennie, K.W., Singhvi, A.K., 2002. Event stratigraphy, paleoenvironment andchronology of SE Arabian deserts. Quaternary Science Reviews 21, 853e869.
Grootes, P.M., Stuiver, M., Hammer, C.U., Mayewski, P.A., Peel, D., 1997. Oxygen 18/16variability in Greenland snow and ice with 10 (super -3) -to 10 (super 5) -yeartime resolution. Journal of Geophysical Research 102, 26,455e26,470.
Hollingsworth, J. (2007). The Active Tectonics of the NE Iran. Ph.D. thesis, Universityof Cambridge.
Hollingsworth, J., Walker, R., Jackson, J., Bolourchi, M., Eshraghi, A., Yardley, B.W.D.,Taylor, G., Whitham, A., Smith, M., Griffiths, J., Rivett, M., Arthur, J., Kendall, M.,Leat, P., Thomas, L., Peacock, S., Catt, J., Robinson, R., 2007. Left-lateral Strike-slipFaulting in the East Alborz, NE Iran. Geological Society of London, London,United Kingdom (GBR).
Hollingsworth, J., Jackson, J., Walker, R., Nazari, H., 2008. Extrusion tectonics andsubduction in the eastern south Caspian region since 10 Ma. Geology (Boulder)36, 763e766.
Hollingsworth, J., Fattahi, M., Walker, R., Talebian, M., Bahroudi, A., Bolourchi, M.J.,Jackson, J., Copley, A., 2010a. Oroclinal bending, distributed thrust and strike-slip faulting, and the accommodation of Arabia-Eurasia convergence in NE Iransince the Oligocene. Geophysical Journal International 181, 1214e1246.
Hollingsworth, J., Nazari, H., Ritz, J.F., Salamati, R., Talebian, M., Bahroudi, A.,Walker, R., Rizza, M., Jackson, J., 2010b. Active tectonics of the East Alborzmountains, NE Iran; rupture of the left-lateral Astaneh fault system during thegreat 856 AD Qumus earthquake. Journal of Geophysical Research 115, B12313.
Huntley, D.J., Lamothe, M., 2001. Ubiquity of anomalous fading in K-feldspars andthe measurement and correction for it in optical dating. Canadian Journal ofEarth Sciences 38, 1093e1106.
Jackson, J., Haines, J., Holt, W., 1995. The accommodation of Arabia-Eurasia plateconvergence in Iran. Journal of Geophysical Research 100, 15205e15219.
Jackson, J., Priestley, K., Allen, M., Berberian, M., 2002. Active tectonics of the southCaspian basin. Geophysical Journal International 148, 214e245.
Jain, M., Murray, A.S., Botter-Jensen, L., 2004. Optically stimulated luminescencedating; how significant is incomplete light exposure in fluvial environments?Quaternaire (Paris) 15, 143e157.
Karakhanian, A.S., Trifonov, V.G., Philip, H., Avagyan, A., Hessami, K., Jamali, F., SalihBayraktutan, M., Bagdassarian, H., Arakelian, S., Davtian, V., Adilkhanyan, A.,2004. Active faulting and natural hazards in Armenia, eastern Turkey andnorthwestern Iran. Tectonophysics 380, 189e219.
Karimi, A., Khademi, H., Kehl, M., Jalalian, A., 2009. Distribution, lithology andprovenance of peridesert loess deposits in northeastern Iran. Geoderma 148,241e250.
Karimi, M., Frechen, H., Khademi, M., Kehl, Jalalian, A., 2011. Chronostratigraphy ofloess deposits in northeast Iran. Quaternary International 234, 124e132.
Kehl, M., 2009. Quaternary climate change in Iran - The state of knowledge. Erd-kunde 63, 1e17.
Kehl, M., Frechen, M., Skowronek, A., 2005. Paleosols derived from loess and loess-like sediments in the Basin of Persepolis, southern Iran. Quaternary Interna-tional 140-141, 135e149.
Kocurek, G., Lancaster, N., 1999. Aeolian system sediment state; theory and MojaveDesert Kelso dune field example. Sedimentology 46, 505e515.
Lang, A., 1994. Infrared stimulated luminescence dating of Holocene reworked siltysediments. Quaternary Science Reviews 13, 525e528.
LeDortz, K., Meyer, B., Sébrier, M., Nazari, H., Braucher, R., Fattahi, M., Benedetti, L.,Foroutan, M., Siame, L., Bourlès, D., Talebian, M., Bateman, M.D., Ghoraishi, M.,2009. Holocene right-slip rate determined by cosmogenic and OSL dating onthe Anar fault, Central Iran. Geophysical Journal International 179, 700e710.
Madsen, A.T., Murray, A.S., 2009. Optically stimulated luminescence dating of youngsediments; a review. Geomorphology 109, 3e16.
Mangerud, J., Astakhov, V., Jakobsson, M., Svendsen, J.I., 2001. Huge ice-age lakes inRussia. JQS Journal of Quaternary Science 16, 773e777.
Meese, D.A., Gow, A.J., Grootes, P., Mayewski, P.A., Ram, M., Stuiver, M., Taylor, K.C.,Waddington, E.D., Zielinski, G.A., 1994. The accumulation record from the GISP2core as an indicator of climate change throughout the Holocene. Science 266,1680e1682.
Murray, A.S., Marten, R., Johnson, A., Martin, P., 1987. Analysis for naturally occur-ring radionuclides at environmental concentrations by gamma spectrometry.Journal of Radioanalytical and Nuclear Chemistry Articles 115, 263e288.
Murray, A.S., Olley, J.M., Caitcheon, G.G., 1995. Measurement of equivalent doses inquartz from contemporary water-lain sediments using optically stimulatedluminescence. Quaternary Science Reviews 14, 365e371.
Murray, A.S., Wintle, A.G., 2000. Luminescence dating of quartz using an improvedsingle-aliquot regenerative-dose protocol. Radiation Measurements 32,57e73.
Nazari, H., Ritz, J.F., Salamati, R., Shafei, A., Ghassemi, A., Michelot, J.L., Massault, M.,Ghorashi, M., 2009. Morphological and palaeoseismological analysis along theTaleghan fault (central alborz, Iran). Geophysical Journal International 178,1028e1041.
Nazari, H., Ritz, J. F., Walker, R., Alimohammadian, H., Patnaik, R., and Jalali, A.(submitted to Tectonophysics). Palaeoseismic evidence for a medieval earth-quake of magnitude w 7 in the Firouzkuh (Central Alborz) region of Iran.
Nilforoushan, F., Masson, F., Vernant, P., Vigny, C., Martinod, J., Abbassi, M.,Nankali, H., Hatzfeld, D., Bayer, R., Tavakoli, F., Ashtiani, A., Doerflinger, E.,
M. Rizza et al. / Quaternary Geochronology 6 (2011) 390e406406
Daignieres, M., Collard, P., Chery, J., 2003. GPS network monitors the Arabia-Eurasia collision deformation in Iran. Journal of Geodesy 77, 411e422.
Olley, J., Caitcheon, G., Murray, A., 1998. The distribution of apparent dose asdetermined by optically stimulated luminescence in small aliquots of fluvialquartz; implications for dating young sediments. Quaternary Science Reviews17, 1033e1040.
Olley, J.M., Caitcheon, G.G., Roberts, R.G., 1999. The origin of dose distributions influvial sediments, and the prospect of dating single grains from fluvial depositsusing optically stimulated luminescence. Radiation Measurements 30, 207e217.
Olley, J.M., De Deckker, P., Roberts, R.G., Fifield, L.K., Yoshida, H., Hancock, G., 2004.Optical dating of deep-sea sediments using single grains of quartz; a compar-ison with radiocarbon. Sedimentary Geology 169, 175e189.
Porat, N., Zilberman, E., Amit, R., Enzel, Y., 2001. Residual ages of modern sedimentsin an hyperarid region, Israel. Quaternary Science Reviews 20, 795e798.
Prescott, J.R., Hutton, J.T., 1994. Cosmic-ray contributions to dose-rates for lumi-nescence and ESR dating-large depths and long-term time variations. RadiationMeasurements 23, 497e500.
Regard, V., Bellier, O., Braucher, R., Gasse, F., Bourles, D., Mercier, J., Thomas, J.C.,Abbassi, M.R., Shabanian, E., Soleymani, S., 2006. (super 10) Be dating of alluvialdeposits from southeastern Iran (the Hormoz Strait area). Palaeogeography,Palaeoclimatology, Palaeoecology 242, 36e53.
Reheis, M.C., Reynolds, R.L., Goldstein, H., Roberts, H.M., Yount, J.C., Axford, Y.,Cummings, L.S., Shearin, N., 2005. Late Quaternary eolian and alluvial responseto paleoclimate, Canyonlands, southeastern Utah. Geological Society of AmericaBulletin 117, 1051e1069.
Richardson, C.A., McDonald, E.V., Busacca, A.J., 1997. Luminescence dating of loessfrom the northwest United States. Quaternary Science Reviews 16, 403e415.
Ritz, J.F., Balescu, S., Soleymani, S., Abbassi, M., Nazari, H., Feghhi, K., Shabanian, E.,Tabassi, H.Y.F., Lamothe, M., Michelot, J.L., Massault, M., Chéry, J., Vernant, P.,2003. Geometry, kinematics and slip-rate along the Mosha active fault, centralalborz. EGU-AGU-EUG Joint Assembly.
Ritz, J.F., Nazari, H., Ghassemi, A., Salamati, R., Shafei, A., Solaymani, S., Vernant, P.,2006. Active transtension inside central Alborz; a new insight into northernIran-southern Caspian geodynamics. Geology (Boulder) 34, 477e480.
Seyed-Emami, K., Fursich, F.T., Wilmsen, M., Cecca, F., Majidifard, M.R., Schairer, G.,Shekarifard, A., 2006. Stratigraphy and ammonite fauna of the upper Shemshakformation (Toarcian-Aalenian) at Tazareh, eastern alborz, Iran. Journal of AsianEarth Sciences 28, 259e275.
Shackleton, N.J., 1987. Oxygen isotopes, ice volume and sea level. QuaternaryScience Reviews 6, 183e190.
Singhvi, A.K., Sharma, Y.P., Agrawal, D.P., 1982. Thermo-Luminescence dating ofsand Dunes in Rajasthan, India. Nature 295, 313e315.
Tatar, M., Jackson, J., Hatzfeld, D., Bergman, E., 2007. The 2004 May 28 Baladehearthquake (M (sub w) 6.2) in the Alborz, Iran; overthrusting the South CaspianBasin margin, partitioning of oblique convergence and the seismic hazard ofTehran. Geophysical Journal International 170, 249e261.
Thomas, D.S.G., Bateman, M.D., Mehrshahi, D., O’Hara, S.L., 1997. Development andenvironmental significance of an eolian sand ramp of last-glacial age, centralIran. Quaternary Research 48, 155e161.
Vernant, P., Nilforoushan, F., Chery, J., Bayer, R., Djamour, Y., Masson, F., Nankali, H.,Ritz, J.F., Sedighi, M., Tavakoli, F., 2004. Deciphering oblique shortening ofcentral Alborz in Iran using geodetic data. Earth and Planetary Science Letters223, 177e185.
Walker, R., Fattahi, M., Talebian, M., 2009. Late Quaternary faulting and envi-ronmental change in Iran inferred from dating of alluvial fans, river terraces,and lakebeds. Geological Society of America, Abstracts with Programs41, 228.
Wallinga, J., 2002. Optically stimulated luminescence dating: a review. Boreas 31,303e322.
Wintle, A.G., Murray, A.S., 2006. A review of quartz optically stimulated lumines-cence characteristics and their relevance in single-aliquot regeneration datingprotocols. Radiation Measurements 41, 369e391.