Sleep Loss and the Inflammatory Response in Mice Under Chronic Environmental Circadian Disruption
8
Sleep Loss and the Inflammatory Response in Mice Under Chronic Environmental Circadian Disruption Allison J. Brager . , J. Christopher Ehlen . , Oscar Castanon-Cervantes, Divya Natarajan, Patrick Delisser, Alec J. Davidson, Ketema N. Paul* Department of Neurobiology, Morehouse School of Medicine, Atlanta, Georgia, United States of America Abstract Shift work and trans-time zone travel lead to insufficient sleep and numerous pathologies. Here, we examined sleep/wake dynamics during chronic exposure to environmental circadian disruption (ECD), and if chronic partial sleep loss associated with ECD influences the induction of shift-related inflammatory disorder. Sleep and wakefulness were telemetrically recorded across three months of ECD, in which the dark-phase of a light-dark cycle was advanced weekly by 6 h. A three month regimen of ECD caused a temporary reorganization of sleep (NREM and REM) and wake processes across each week, resulting in an approximately 10% net loss of sleep each week relative to baseline levels. A separate group of mice were subjected to ECD or a regimen of imposed wakefulness (IW) aimed to mimic sleep amounts under ECD for one month. Fos- immunoreactivity (IR) was quantified in sleep-wake regulatory areas: the nucleus accumbens (NAc), basal forebrain (BF), and medial preoptic area (MnPO). To assess the inflammatory response, trunk blood was treated with lipopolysaccharide (LPS) and subsequent release of IL-6 was measured. Fos-IR was greatest in the NAc, BF, and MnPO of mice subjected to IW. The inflammatory response to LPS was elevated in mice subjected to ECD, but not mice subjected to IW. Thus, the net sleep loss that occurs under ECD is not associated with a pathological immune response. Citation: Brager AJ, Ehlen JC, Castanon-Cervantes O, Natarajan D, Delisser P, et al. (2013) Sleep Loss and the Inflammatory Response in Mice Under Chronic Environmental Circadian Disruption. PLoS ONE 8(5): e63752. doi:10.1371/journal.pone.0063752 Editor: Ralph E. Mistlberger, Simon Fraser University, Canada Received February 26, 2013; Accepted April 4, 2013; Published May 17, 2013 Copyright: ß 2013 Brager et al. This is an open-access article distributed under the terms of the Creative Commons Attribution License, which permits unrestricted use, distribution, and reproduction in any medium, provided the original author and source are credited. Funding: The authors received funding from NS060659 and NS078410. The funders had no role in study design, data collection and analysis, decision to publish, or preparation of the manuscript. Competing Interests: The authors have declared that no competing interests exist. * E-mail: [email protected] . These authors contributed equally to this work. Introduction Shift work, travel across time zones, and nontraditional lighting schedules are associated with chronic misalignment of sleep schedules with internal time-keeping systems [1,2]. These maladaptive work-sleep schedules have escalated across the past decade [3,4], and have been linked to elevated risks for insomnia and circadian rhythm disorders [5]. Human studies have characterized objective changes in sleep and wakefulness using polysomnography under shorter (,24 h) and longer (.24 h) light- dark (LD) cycles [6,7], however, few studies have examined sleep during re-entrainment to a shifted LD cycle. In rodents, there exists compelling evidence for the ability of circadian misalignment to alter sleep processes; for example, shorter LD cycles alter the period and amplitude of circadian rhythms, as well as amounts of wake, NREM, and REM sleep [8,9]. Furthermore, phase shifts of the LD cycle have been shown to split locomotor activity rhythms [10], cause a loss of nocturnality [11], and enhance REM sleep [12]. However, few studies in rodents have explored changes in sleep and wakefulness during exposure to ECD paradigms lasting for more than one month, which are most relevant to long-term night and rotating shift work [5]. The immune system appears to be a target of circadian misalignment and insufficient sleep in both humans [13,14,15] and rodents [16,17,18]. In a recent study, we reported that circadian disruption in healthy adult mice lasting for one month caused pathological changes in the innate immune response to the bacterial product lipopolysaccharide (LPS; [12]), a condition termed Shift related Inflammatory Disorder (SRID). ECD models the periodic exposure to circadian misalignment experienced by night and rotating shift workers. While we failed to observe sleep loss in a limited polysomnographic study of mice under that regimen of ECD, it is still unknown whether SRID is a consequence of circadian misalignment, sleep loss, or both. Thus, the current study has two aims; first, we report a detailed analysis of sleep/wake dynamics, including changes in amounts, temporal distributions, and rates of re-entrainment of sleep and wake processes, across three months of ECD. Second, we demonstrate that the substantial chronic partial sleep loss associated with this regimen of ECD does not account for the induction of SRID. Materials and Methods Animals Adult (4–8 mo of age) Per2 Luc knock-in mice bred on a C57BL/ 6J background (for 12 weeks under ECD) and C57BL/6J mice (for 4 weeks under ECD or imposed wakefulness [IW]) were singly housed in polycarbonate cages at Morehouse School of Medicine. Mice were maintained on a 12 h light:12 h dark (LD) photoperiod at a light intensity of 270 lux from birth in a temperature- controlled vivarium (23uC) with food and water provided ad libitum. The experiments complied with National Institutes of Health PLOS ONE | www.plosone.org 1 May 2013 | Volume 8 | Issue 5 | e63752
-
Upload
walterreedarmyresearch -
Category
Documents
-
view
2 -
download
0
Transcript of Sleep Loss and the Inflammatory Response in Mice Under Chronic Environmental Circadian Disruption
Sleep Loss and the Inflammatory Response in MiceUnder Chronic Environmental Circadian DisruptionAllison J. Brager., J. Christopher Ehlen., Oscar Castanon-Cervantes, Divya Natarajan, Patrick Delisser,
Alec J. Davidson, Ketema N. Paul*
Department of Neurobiology, Morehouse School of Medicine, Atlanta, Georgia, United States of America
Abstract
Shift work and trans-time zone travel lead to insufficient sleep and numerous pathologies. Here, we examined sleep/wakedynamics during chronic exposure to environmental circadian disruption (ECD), and if chronic partial sleep loss associatedwith ECD influences the induction of shift-related inflammatory disorder. Sleep and wakefulness were telemetricallyrecorded across three months of ECD, in which the dark-phase of a light-dark cycle was advanced weekly by 6 h. A threemonth regimen of ECD caused a temporary reorganization of sleep (NREM and REM) and wake processes across each week,resulting in an approximately 10% net loss of sleep each week relative to baseline levels. A separate group of mice weresubjected to ECD or a regimen of imposed wakefulness (IW) aimed to mimic sleep amounts under ECD for one month. Fos-immunoreactivity (IR) was quantified in sleep-wake regulatory areas: the nucleus accumbens (NAc), basal forebrain (BF), andmedial preoptic area (MnPO). To assess the inflammatory response, trunk blood was treated with lipopolysaccharide (LPS)and subsequent release of IL-6 was measured. Fos-IR was greatest in the NAc, BF, and MnPO of mice subjected to IW. Theinflammatory response to LPS was elevated in mice subjected to ECD, but not mice subjected to IW. Thus, the net sleep lossthat occurs under ECD is not associated with a pathological immune response.
Citation: Brager AJ, Ehlen JC, Castanon-Cervantes O, Natarajan D, Delisser P, et al. (2013) Sleep Loss and the Inflammatory Response in Mice Under ChronicEnvironmental Circadian Disruption. PLoS ONE 8(5): e63752. doi:10.1371/journal.pone.0063752
Editor: Ralph E. Mistlberger, Simon Fraser University, Canada
Received February 26, 2013; Accepted April 4, 2013; Published May 17, 2013
Copyright: � 2013 Brager et al. This is an open-access article distributed under the terms of the Creative Commons Attribution License, which permitsunrestricted use, distribution, and reproduction in any medium, provided the original author and source are credited.
Funding: The authors received funding from NS060659 and NS078410. The funders had no role in study design, data collection and analysis, decision to publish,or preparation of the manuscript.
Competing Interests: The authors have declared that no competing interests exist.
* E-mail: [email protected]
. These authors contributed equally to this work.
Introduction
Shift work, travel across time zones, and nontraditional lighting
schedules are associated with chronic misalignment of sleep
schedules with internal time-keeping systems [1,2]. These
maladaptive work-sleep schedules have escalated across the past
decade [3,4], and have been linked to elevated risks for insomnia
and circadian rhythm disorders [5]. Human studies have
characterized objective changes in sleep and wakefulness using
polysomnography under shorter (,24 h) and longer (.24 h) light-
dark (LD) cycles [6,7], however, few studies have examined sleep
during re-entrainment to a shifted LD cycle. In rodents, there
exists compelling evidence for the ability of circadian misalignment
to alter sleep processes; for example, shorter LD cycles alter the
period and amplitude of circadian rhythms, as well as amounts of
wake, NREM, and REM sleep [8,9]. Furthermore, phase shifts of
the LD cycle have been shown to split locomotor activity rhythms
[10], cause a loss of nocturnality [11], and enhance REM sleep
[12]. However, few studies in rodents have explored changes in
sleep and wakefulness during exposure to ECD paradigms lasting
for more than one month, which are most relevant to long-term
night and rotating shift work [5].
The immune system appears to be a target of circadian
misalignment and insufficient sleep in both humans [13,14,15] and
rodents [16,17,18]. In a recent study, we reported that circadian
disruption in healthy adult mice lasting for one month caused
pathological changes in the innate immune response to the
bacterial product lipopolysaccharide (LPS; [12]), a condition
termed Shift related Inflammatory Disorder (SRID). ECD models
the periodic exposure to circadian misalignment experienced by
night and rotating shift workers. While we failed to observe sleep
loss in a limited polysomnographic study of mice under that
regimen of ECD, it is still unknown whether SRID is a
consequence of circadian misalignment, sleep loss, or both. Thus,
the current study has two aims; first, we report a detailed analysis
of sleep/wake dynamics, including changes in amounts, temporal
distributions, and rates of re-entrainment of sleep and wake
processes, across three months of ECD. Second, we demonstrate
that the substantial chronic partial sleep loss associated with this
regimen of ECD does not account for the induction of SRID.
Materials and Methods
AnimalsAdult (4–8 mo of age) Per2Luc knock-in mice bred on a C57BL/
6J background (for 12 weeks under ECD) and C57BL/6J mice (for
4 weeks under ECD or imposed wakefulness [IW]) were singly
housed in polycarbonate cages at Morehouse School of Medicine.
Mice were maintained on a 12 h light:12 h dark (LD) photoperiod
at a light intensity of 270 lux from birth in a temperature-
controlled vivarium (23uC) with food and water provided ad
libitum. The experiments complied with National Institutes of Health
PLOS ONE | www.plosone.org 1 May 2013 | Volume 8 | Issue 5 | e63752
Guidelines for the Care and Use of Laboratory Animals and were approved
by the Morehouse School of Medicine Institutional Animal Care
and Use Committee.
Environmental Circadian DisruptionThis protocol is described in [12] and represented in Fig. 1A.
Briefly, the LD cycle was advanced by 6 h every week for 12 weeks
(only the 1st 4 weeks are shown in Fig. 1A). Each weekly shift was
accomplished by advancing lights-on 6 h during the dark-phase of
LD–resulting in one short (6 h) night per week. A separate group
of control mice were maintained on a constant LD cycle across 12
weeks to control for any effect of aging [19,20]. After week 12, all
mice were released to constant darkness to characterize sleep/
wake dynamics in the absence of photic entrainment across three
days.
Recording and Data Analyses of Sleep and WakefulnessUnder ECDTo measure daily changes in sleep and wakefulness across a
regimen of ECD, mice received electroencephalograph (EEG) and
electromyograph (EMG) electrode implants which were telemet-
rically interfaced to a data acquisition system (n= 6/treatment
group; Dataquest; Data Sciences International; St. Paul, MN).
Mice were anesthetized with isoflurane (induced at 2–3%,
maintained at 1–2% across surgery). Through a midline incision,
two epidural stainless-steel recording screws (SmallParts, Miami
Lakes, FL) were positioned contralaterally on the skull (1) 1.0 mm
anterior to bregma and 0.5 mm to the right of the central suture;
and (2) 0.5 mm posterior to lambda and 1.0 mm to the left of the
central suture. A PhysioTel telemeter (model F20-EET; Data
Sciences International, St. Paul, MN) was placed in a subcutane-
ous pocket created caudally along the dorsal surface of the thorax
using the existing incision. EMG telemeter leads were bilaterally
placed in the nuchal muscle with a 22-gauge needle acting as a
trochar, and were sutured to the muscle tissue near the point of
entry with 6-0 braided silk. Screw electrodes were then covered
with dental acrylic before closing the incision. Post-surgical
recovery was 3 weeks during which time the animals received
i.p. meloxicam [0.1 ml; 0.5 mg/1.0 ml] injections to manage pain
and inflammation. All telemeters were still functional during the
8th week of the study. However, by the beginning of the 12th
weekly phase-advance, 3 of the shifted and 4 of the control mice
had telemeters with battery power. Therefore, comparisons across
shift 12 were conducted separately from those of shifts 4 and 8 (see
Text S1).
Polysomnographic waveforms were manually scored in 10-sec
epochs using NeuroScore software (Data Sciences International;
St. Paul, MN), and were classified as (1) wake (low-amplitude,
mixed-frequency EEG; high-amplitude EMG); (2) NREM sleep
(high-amplitude, low-frequency EEG; low-amplitude EMG); (3) or
REM sleep (low-amplitude EEG with predominant theta activity
[6.0–10.0 Hz]; very low-amplitude EMG). Raw waveforms were
subjected to Fast Fourier Transform (FFT) to examine EEG power
in the delta (0.5–4.0 Hz) range. To determine rates of re-
entrainment of sleep and wakefulness across a regimen of ECD,
30 min bins of wake, NREM sleep, and REM sleep across 24 h
represented in Fig. 2 were fitted to sine curves using OriginPro8
(Northhampton, MA; see Text S1). Time points were excluded
when the fitted sine curve did not sufficiently match the daily
rhythm of sleep and wake (12 time points for shift 4, 13 time points
for shift 8).
Reproduction of Daily Sleep Loss Under ECDData from the 12 weeks under ECD were used for a two-phase
paradigm of imposed wakefulness (IW) that aimed to mimic
amounts of daily sleep loss occurring under 4 weeks of ECD. In
order to accurately re-create the amounts of daily sleep loss that
Figure 1. Regimens of environmental circadian disruption (ECD) and imposed wakefulness (IW) were used to examine sleep/wakedynamics during re-entrainment to a phase-advance in the 12 h: 12 h light:dark (LD) cycle and to determine the influences ofcircadian misalignment and sleep loss on inflammatory markers. [Left panel; A] Under ECD, the dark phase (grey area) of LD was phase-advanced by 6 h on the first day of each week for 4 weeks. [Right panel; B] The target wake amount under IW was determined from the measurementof wakefulness across 12 weeks of ECD. A two-phase experimental approach that accounted for recovery sleep following long-term periods ofimposed wakefulness was undertaken to accurately re-create the amount of sleep loss that occurred under ECD (n= 4). Means6SE of hours ofincreased wake across each day under IW and ECD.doi:10.1371/journal.pone.0063752.g001
Photic Regulation of Sleep and Inflammation
PLOS ONE | www.plosone.org 2 May 2013 | Volume 8 | Issue 5 | e63752
occurs under ECD, this paradigm accounted for recovery sleep
that follows longer periods of IW.
Phase 1. Dose-Response Curve of Daily Sleep Loss. Mice
received EEG and EMG implants tethered to a data acquisition
system (Pinnacle Technology, Lawrence, KS; n= 4). Sleep and
wake were continuously recorded for one week to determine daily
time awake during baseline (undisturbed) and during three
durations of sleep deprivation induced by a gentle handling
procedure (introduction of novel objects into the cage, tapping on
the cage and when necessary, delicate touching). This induced
sleep deprivation began at lights-on and lasted for 3 h on day 2,
6 h on day 4, and 9 h on day 6. Polysomnographic recordings
were manually scored in 10-sec epochs with Sirenia Software
(Pinnacle Technology, Lawrence, KS) using criteria described
above. The resulting data was used to predict daily amounts of
sleep loss that would mirror ECD-induced sleep loss (see Fig. 1B).Phase 2. Verification of Predicted Daily Sleep Loss. Mice
underwent a four day regimen of imposed wakefulness (IW),
accomplished by gentle handling for 1.6 h on day 1, 5.1 h on day
2, 4.2 h on day 3, and 4.3 h on day 4. Total daily sleep loss
achieved by the four-day regimen was within 0.860.3 h of daily
sleep loss on each of the corresponding days of ECD (Fig. 1B).
Post-mortem Validation of Sleep LossFos-immunoreactivity was measured in several sleep-wake
regulatory areas of the forebrain (see [23,24,25,26]). Mice were
sacrificed on the 7th day (Zeitgeber Time [ZT] 3–4 with ZT 12
representing lights-off) of the 4th week under ECD or IW (n= 8/
treatment group). Brains were extracted and immersion-fixed in
4% paraformaldehyde for 24 h followed by immersion in 30%
sucrose for 24 h at 4uC. Cryostat sections (40 mm-thick) were
incubated with a rabbit polyclonal IgG antibody (c-fos (4); Santa
Cruz Biotechnology; Santa Cruz, CA), and Fos expression was
visualized using Vectastain Elite ABC kit with 3,3-diaminobenzi-
dine tetrahydrochloride as chromagen (Vector Labs, Burlingame,
CA). Sections were mounted with permount, and Fos expression
was quantified using ImageJ (National Institutes of Health,
Bethesda, MD). Counts of immunostained nuclei were undertaken
in the mid-posterior region of the nucleus accumbens (NAc;
AP=+1.18 to 0.86), anterior-mid region of the basal forebrain
(BF; AP= +0.38 to 0.02), and anterior region of the medial
preoptic area (MnPO; AP=+0.38 to 0.26; adapted from [27]).
Immune Challenge and Cytokine MeasurementsIn addition to the 12 week ECD schedule, a separate group of
mice underwent 4 weeks of ECD. After the 4th shift, these mice
were allowed 6 days to re-synchronize their behavioral activity (not
shown) to the light-dark cycle. Mice were sacrificed on the 7th day
and blood was collected from the trunk under 100% CO2
anesthesia. Using this method, between 500 and 700 ml of bloodcan be collected from each mouse. At the same time of day
(Zeitgeber Time [ZT] 3–4 with ZT 12 representing lights-off), a
group of mice that underwent the IW protocol and an
unperturbed group of control mice were also sacrificed for blood
collection (n= 8/treatment group). Blood was collected in EDTA
coated micro tubes. After collection, blood free of clots was diluted
five-fold in 1.5 ml micro tubes with RPMI 1640 culture media
containing lipopolysaccharide (LPS) to a final concentration of
50 mg/mL. Tubes were tightly closed and were incubated for 3, 6,
or 24 h inside a culture incubator kept at 37uC under a 5% CO2
atmosphere. After each incubation time, tubes were removed from
the incubator, centrifuged at 1500 g for 10 min, and supernatants
were transferred to individual centrifugal filter units (Millipore
Corp, Billerica, MA) for concentration according to the manufac-
Figure 2. Diurnal distribution of sleep and wake processes across a week under ECD. Mean minutes spent in wake (top), NREM (middle),and REM (bottom) sleep in 30 min blocks across a 24 h recording period at baseline versus the beginning (day 1), middle (day 3), and end (day 6) ofweek 4 under ECD (n= 6). White-dark bars represent the 12 h light-12 h dark periods of a photocycle with zeitgeber time 12 referring to the light-dark transition.doi:10.1371/journal.pone.0063752.g002
Photic Regulation of Sleep and Inflammation
PLOS ONE | www.plosone.org 3 May 2013 | Volume 8 | Issue 5 | e63752
turer instructions. Once concentrated, samples were frozen and
stored until assayed for interleukin (IL)-6 content using a BD
OptIEA ELISA kit (BD, San Diego, CA). For the ELISA assay, all
24 time zero samples were ran on one plate, while the remaining
72 samples (times 3, 6, and 24) were run on a second plate. Both
plates were run the same day, using the same freshly prepared
standards.
Statistical AnalysesRepeated measures ANOVAs were used for between- and
within-group comparisons of sleep/wake and cytokine parameters.
Levels of significance were set at p,0.05. Post-hoc paired t-tests,
with Dunn-Sidak correction for multiple comparisons, were used
to compare changes in sleep/wake parameters across each day of
ECD from baseline levels. Univariate ANOVAs and subsequent
Student-Keuls post-hoc tests were used where indicated.
Results
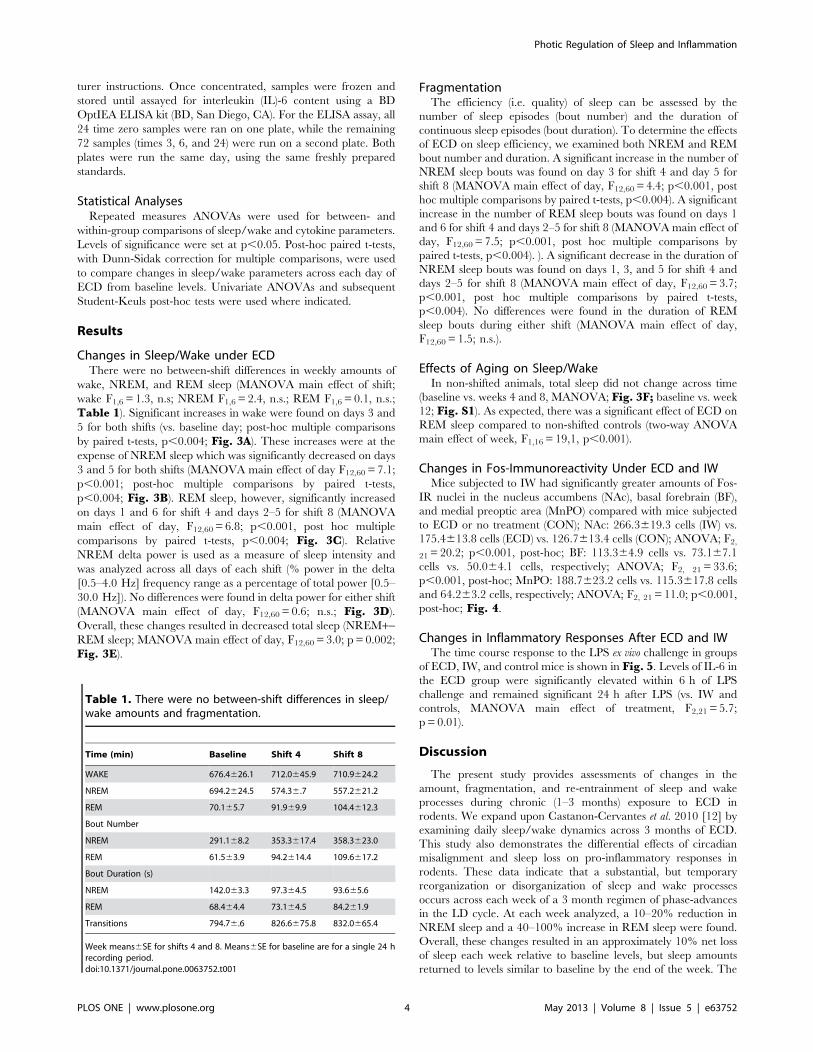
Changes in Sleep/Wake under ECDThere were no between-shift differences in weekly amounts of
wake, NREM, and REM sleep (MANOVA main effect of shift;
wake F1,6 = 1.3, n.s; NREM F1,6 = 2.4, n.s.; REM F1,6 = 0.1, n.s.;
Table 1). Significant increases in wake were found on days 3 and
5 for both shifts (vs. baseline day; post-hoc multiple comparisons
by paired t-tests, p,0.004; Fig. 3A). These increases were at the
expense of NREM sleep which was significantly decreased on days
3 and 5 for both shifts (MANOVA main effect of day F12,60 = 7.1;
p,0.001; post-hoc multiple comparisons by paired t-tests,
p,0.004; Fig. 3B). REM sleep, however, significantly increased
on days 1 and 6 for shift 4 and days 2–5 for shift 8 (MANOVA
main effect of day, F12,60 = 6.8; p,0.001, post hoc multiple
comparisons by paired t-tests, p,0.004; Fig. 3C). Relative
NREM delta power is used as a measure of sleep intensity and
was analyzed across all days of each shift (% power in the delta
[0.5–4.0 Hz] frequency range as a percentage of total power [0.5–
30.0 Hz]). No differences were found in delta power for either shift
(MANOVA main effect of day, F12,60 = 0.6; n.s.; Fig. 3D).
Overall, these changes resulted in decreased total sleep (NREM+-REM sleep; MANOVA main effect of day, F12,60 = 3.0; p = 0.002;
Fig. 3E).
FragmentationThe efficiency (i.e. quality) of sleep can be assessed by the
number of sleep episodes (bout number) and the duration of
continuous sleep episodes (bout duration). To determine the effects
of ECD on sleep efficiency, we examined both NREM and REM
bout number and duration. A significant increase in the number of
NREM sleep bouts was found on day 3 for shift 4 and day 5 for
shift 8 (MANOVA main effect of day, F12,60 = 4.4; p,0.001, post
hoc multiple comparisons by paired t-tests, p,0.004). A significant
increase in the number of REM sleep bouts was found on days 1
and 6 for shift 4 and days 2–5 for shift 8 (MANOVA main effect of
day, F12,60 = 7.5; p,0.001, post hoc multiple comparisons by
paired t-tests, p,0.004). ). A significant decrease in the duration of
NREM sleep bouts was found on days 1, 3, and 5 for shift 4 and
days 2–5 for shift 8 (MANOVA main effect of day, F12,60 = 3.7;
p,0.001, post hoc multiple comparisons by paired t-tests,
p,0.004). No differences were found in the duration of REM
sleep bouts during either shift (MANOVA main effect of day,
F12,60 = 1.5; n.s.).
Effects of Aging on Sleep/WakeIn non-shifted animals, total sleep did not change across time
(baseline vs. weeks 4 and 8, MANOVA; Fig. 3F; baseline vs. week12; Fig. S1). As expected, there was a significant effect of ECD on
REM sleep compared to non-shifted controls (two-way ANOVA
main effect of week, F1,16 = 19,1, p,0.001).
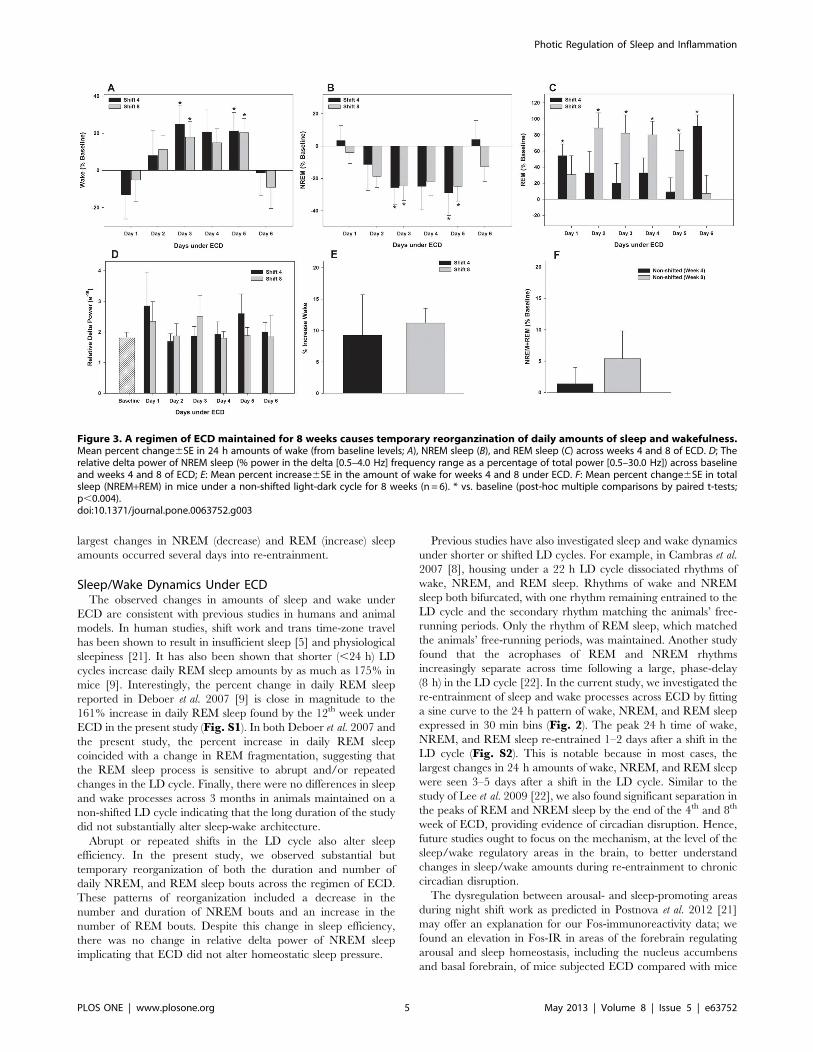
Changes in Fos-Immunoreactivity Under ECD and IWMice subjected to IW had significantly greater amounts of Fos-
IR nuclei in the nucleus accumbens (NAc), basal forebrain (BF),
and medial preoptic area (MnPO) compared with mice subjected
to ECD or no treatment (CON); NAc: 266.3619.3 cells (IW) vs.
175.4613.8 cells (ECD) vs. 126.7613.4 cells (CON); ANOVA; F2,
21 = 20.2; p,0.001, post-hoc; BF: 113.364.9 cells vs. 73.167.1
cells vs. 50.064.1 cells, respectively; ANOVA; F2, 21 = 33.6;
p,0.001, post-hoc; MnPO: 188.7623.2 cells vs. 115.3617.8 cells
and 64.263.2 cells, respectively; ANOVA; F2, 21 = 11.0; p,0.001,
post-hoc; Fig. 4.
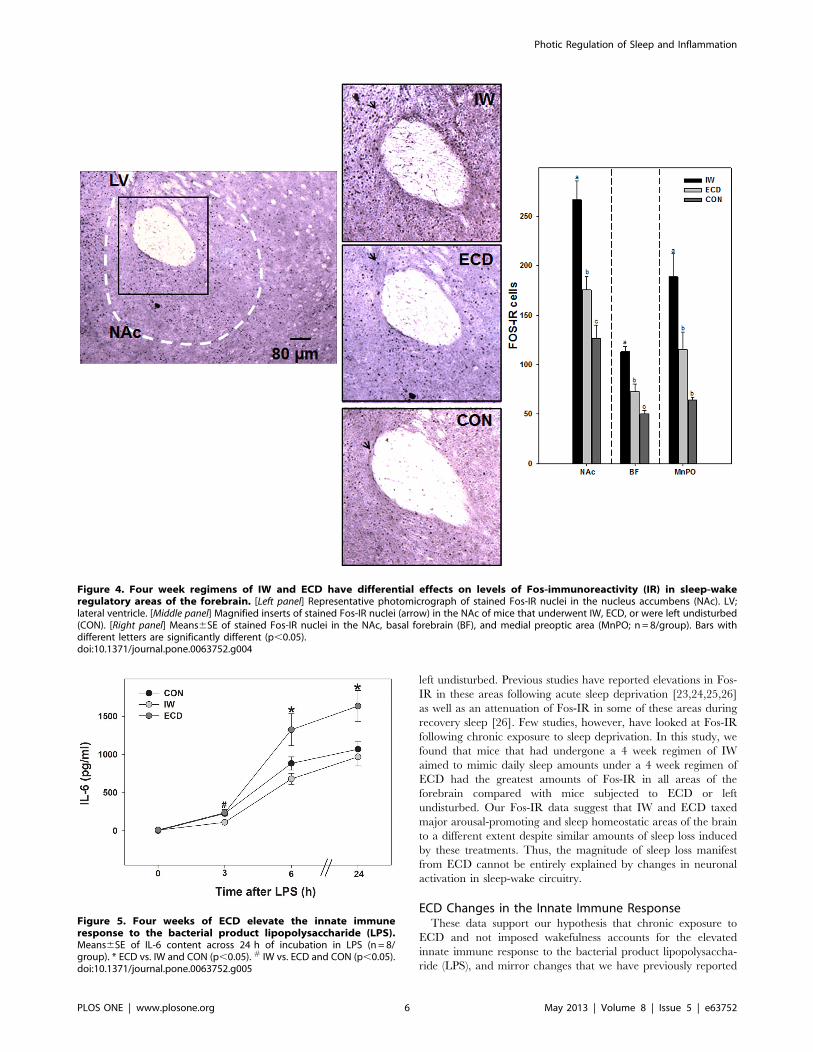
Changes in Inflammatory Responses After ECD and IWThe time course response to the LPS ex vivo challenge in groups
of ECD, IW, and control mice is shown in Fig. 5. Levels of IL-6 inthe ECD group were significantly elevated within 6 h of LPS
challenge and remained significant 24 h after LPS (vs. IW and
controls, MANOVA main effect of treatment, F2,21 = 5.7;
p = 0.01).
Discussion
The present study provides assessments of changes in the
amount, fragmentation, and re-entrainment of sleep and wake
processes during chronic (1–3 months) exposure to ECD in
rodents. We expand upon Castanon-Cervantes et al. 2010 [12] by
examining daily sleep/wake dynamics across 3 months of ECD.
This study also demonstrates the differential effects of circadian
misalignment and sleep loss on pro-inflammatory responses in
rodents. These data indicate that a substantial, but temporary
reorganization or disorganization of sleep and wake processes
occurs across each week of a 3 month regimen of phase-advances
in the LD cycle. At each week analyzed, a 10–20% reduction in
NREM sleep and a 40–100% increase in REM sleep were found.
Overall, these changes resulted in an approximately 10% net loss
of sleep each week relative to baseline levels, but sleep amounts
returned to levels similar to baseline by the end of the week. The
Table 1. There were no between-shift differences in sleep/wake amounts and fragmentation.
Time (min) Baseline Shift 4 Shift 8
WAKE 676.4626.1 712.0645.9 710.9624.2
NREM 694.2624.5 574.36.7 557.2621.2
REM 70.165.7 91.969.9 104.4612.3
Bout Number
NREM 291.168.2 353.3617.4 358.3623.0
REM 61.563.9 94.2614.4 109.6617.2
Bout Duration (s)
NREM 142.063.3 97.364.5 93.665.6
REM 68.464.4 73.164.5 84.261.9
Transitions 794.76.6 826.6675.8 832.0665.4
Week means6SE for shifts 4 and 8. Means6SE for baseline are for a single 24 hrecording period.doi:10.1371/journal.pone.0063752.t001
Photic Regulation of Sleep and Inflammation
PLOS ONE | www.plosone.org 4 May 2013 | Volume 8 | Issue 5 | e63752
largest changes in NREM (decrease) and REM (increase) sleep
amounts occurred several days into re-entrainment.
Sleep/Wake Dynamics Under ECDThe observed changes in amounts of sleep and wake under
ECD are consistent with previous studies in humans and animal
models. In human studies, shift work and trans time-zone travel
has been shown to result in insufficient sleep [5] and physiological
sleepiness [21]. It has also been shown that shorter (,24 h) LD
cycles increase daily REM sleep amounts by as much as 175% in
mice [9]. Interestingly, the percent change in daily REM sleep
reported in Deboer et al. 2007 [9] is close in magnitude to the
161% increase in daily REM sleep found by the 12th week under
ECD in the present study (Fig. S1). In both Deboer et al. 2007 and
the present study, the percent increase in daily REM sleep
coincided with a change in REM fragmentation, suggesting that
the REM sleep process is sensitive to abrupt and/or repeated
changes in the LD cycle. Finally, there were no differences in sleep
and wake processes across 3 months in animals maintained on a
non-shifted LD cycle indicating that the long duration of the study
did not substantially alter sleep-wake architecture.
Abrupt or repeated shifts in the LD cycle also alter sleep
efficiency. In the present study, we observed substantial but
temporary reorganization of both the duration and number of
daily NREM, and REM sleep bouts across the regimen of ECD.
These patterns of reorganization included a decrease in the
number and duration of NREM bouts and an increase in the
number of REM bouts. Despite this change in sleep efficiency,
there was no change in relative delta power of NREM sleep
implicating that ECD did not alter homeostatic sleep pressure.
Previous studies have also investigated sleep and wake dynamics
under shorter or shifted LD cycles. For example, in Cambras et al.
2007 [8], housing under a 22 h LD cycle dissociated rhythms of
wake, NREM, and REM sleep. Rhythms of wake and NREM
sleep both bifurcated, with one rhythm remaining entrained to the
LD cycle and the secondary rhythm matching the animals’ free-
running periods. Only the rhythm of REM sleep, which matched
the animals’ free-running periods, was maintained. Another study
found that the acrophases of REM and NREM rhythms
increasingly separate across time following a large, phase-delay
(8 h) in the LD cycle [22]. In the current study, we investigated the
re-entrainment of sleep and wake processes across ECD by fitting
a sine curve to the 24 h pattern of wake, NREM, and REM sleep
expressed in 30 min bins (Fig. 2). The peak 24 h time of wake,
NREM, and REM sleep re-entrained 1–2 days after a shift in the
LD cycle (Fig. S2). This is notable because in most cases, the
largest changes in 24 h amounts of wake, NREM, and REM sleep
were seen 3–5 days after a shift in the LD cycle. Similar to the
study of Lee et al. 2009 [22], we also found significant separation in
the peaks of REM and NREM sleep by the end of the 4th and 8th
week of ECD, providing evidence of circadian disruption. Hence,
future studies ought to focus on the mechanism, at the level of the
sleep/wake regulatory areas in the brain, to better understand
changes in sleep/wake amounts during re-entrainment to chronic
circadian disruption.
The dysregulation between arousal- and sleep-promoting areas
during night shift work as predicted in Postnova et al. 2012 [21]
may offer an explanation for our Fos-immunoreactivity data; we
found an elevation in Fos-IR in areas of the forebrain regulating
arousal and sleep homeostasis, including the nucleus accumbens
and basal forebrain, of mice subjected ECD compared with mice
Figure 3. A regimen of ECD maintained for 8 weeks causes temporary reorganzination of daily amounts of sleep and wakefulness.Mean percent change6SE in 24 h amounts of wake (from baseline levels; A), NREM sleep (B), and REM sleep (C) across weeks 4 and 8 of ECD. D; Therelative delta power of NREM sleep (% power in the delta [0.5–4.0 Hz] frequency range as a percentage of total power [0.5–30.0 Hz]) across baselineand weeks 4 and 8 of ECD; E: Mean percent increase6SE in the amount of wake for weeks 4 and 8 under ECD. F: Mean percent change6SE in totalsleep (NREM+REM) in mice under a non-shifted light-dark cycle for 8 weeks (n = 6). * vs. baseline (post-hoc multiple comparisons by paired t-tests;p,0.004).doi:10.1371/journal.pone.0063752.g003
Photic Regulation of Sleep and Inflammation
PLOS ONE | www.plosone.org 5 May 2013 | Volume 8 | Issue 5 | e63752
left undisturbed. Previous studies have reported elevations in Fos-
IR in these areas following acute sleep deprivation [23,24,25,26]
as well as an attenuation of Fos-IR in some of these areas during
recovery sleep [26]. Few studies, however, have looked at Fos-IR
following chronic exposure to sleep deprivation. In this study, we
found that mice that had undergone a 4 week regimen of IW
aimed to mimic daily sleep amounts under a 4 week regimen of
ECD had the greatest amounts of Fos-IR in all areas of the
forebrain compared with mice subjected to ECD or left
undisturbed. Our Fos-IR data suggest that IW and ECD taxed
major arousal-promoting and sleep homeostatic areas of the brain
to a different extent despite similar amounts of sleep loss induced
by these treatments. Thus, the magnitude of sleep loss manifest
from ECD cannot be entirely explained by changes in neuronal
activation in sleep-wake circuitry.
ECD Changes in the Innate Immune ResponseThese data support our hypothesis that chronic exposure to
ECD and not imposed wakefulness accounts for the elevated
innate immune response to the bacterial product lipopolysaccha-
ride (LPS), and mirror changes that we have previously reported
Figure 4. Four week regimens of IW and ECD have differential effects on levels of Fos-immunoreactivity (IR) in sleep-wakeregulatory areas of the forebrain. [Left panel] Representative photomicrograph of stained Fos-IR nuclei in the nucleus accumbens (NAc). LV;lateral ventricle. [Middle panel] Magnified inserts of stained Fos-IR nuclei (arrow) in the NAc of mice that underwent IW, ECD, or were left undisturbed(CON). [Right panel] Means6SE of stained Fos-IR nuclei in the NAc, basal forebrain (BF), and medial preoptic area (MnPO; n= 8/group). Bars withdifferent letters are significantly different (p,0.05).doi:10.1371/journal.pone.0063752.g004
Figure 5. Four weeks of ECD elevate the innate immuneresponse to the bacterial product lipopolysaccharide (LPS).Means6SE of IL-6 content across 24 h of incubation in LPS (n = 8/group). * ECD vs. IW and CON (p,0.05). # IW vs. ECD and CON (p,0.05).doi:10.1371/journal.pone.0063752.g005
Photic Regulation of Sleep and Inflammation
PLOS ONE | www.plosone.org 6 May 2013 | Volume 8 | Issue 5 | e63752
for an in vivo LPS challenge and in vitro LPS challenge of
macrophages [12]. The results are notable since sleep amounts
have been shown to modulate immune responses. For example,
sleep disruption has been linked to changes in blood concentra-
tions of immune components such as IL-1b, IL-6, and IFN-c [28].
However, paradigms used to investigate sleep modulation of the
immune response have differed in deprivation methods [28].
Further, chronic sleep disruption concurrent with insufficient
recovery is also possible during chronic circadian misalignment as
indicated by significant changes in daily sleep/wake amounts
across 3 months of ECD in the present study; However, we found
that imposed wakefulness in the absence of ECD did not
reproduce SRID, suggesting that a history of ECD is necessary
for changes in the inflammatory response to LPS response. Future
studies should investigate if ECD in the absence of sleep loss or if
more subtle sleep alterations associated with ECD contribute to
the enhanced immune response to LPS.
SignificanceThe present study provides the first assessment of changes in the
amount, fragmentation, and re-entrainment of sleep and wake
processes during environmental circadian disruption relevant to
long-term shift work. This study also recapitulates our previous
work showing that sleep loss during exposure to environmental
circadian disruption does not account for pathological changes in
the innate immune response to the bacterial product lipopolysac-
charide (LPS) with circadian misalignment. From a translational
perspective, this study demonstrates the vast consequences of shift
work or travel across time zones on sleep and inflammatory
processes at central and peripheral levels of study.
Supporting Information
Figure S1 Significant changes in NREM and REM sleepduring the 12th week under environmental circadiandisruption (ECD). Graph shows daily 24 h means6SEM of
NREM, and REM sleep across the 12th week under ECD. [Insert]
Table shows weekly 24 h means6SEM of NREM and REM sleep
in shifted (ECD) versus control (non-shifted) animals. a shifted vs.
control (one-way ANOVA; p,0.05).
(TIF)
Figure S2 Differential misalignment of sleep/wakeprocesses under environmental circadian disruption(ECD). [Left Panel] Peak 24 h times of wake, NREM, and
REM sleep across each day of the 4th and 8th week under ECD. *
vs. baseline (paired t-tests; p,0.05). [Right panel] Peak 24 h time
of REM sleep plotted against peak 24 h time of NREM sleep
across each day of the 4th week (top) and 8th week (bottom) under
ECD. Zeitgeber time 12 refers to the light-dark phase transition in
the photocycle. * REM vs. NREM (one-way ANOVA; p,0.05).
(TIF)
Text S1
(DOCX)
Acknowledgments
The authors would like to thank Lennisha Pinckney for technical
assistance.
Author Contributions
Conceived and designed the experiments: AJB JCE AJD KNP. Performed
the experiments: AJB JCE OCC DN PD. Analyzed the data: AJB JCE
OCC. Contributed reagents/materials/analysis tools: AJD KNP. Wrote
the paper: AJB JCE AJD KNP.
References
1. Chapdelaine S, Paquet J, Dumont M (2012) Effects of partial circadian
adjustments on sleep and vigilance quality during simulated shift work. J Sleep
Res 21: 380–9.
2. Gumenyuk V, Roth T, Drake CL (2012) Circadian phase, sleepiness, and light
exposure assessment in night workers with and without shift work disorder.
Chronobiol Int 29: 928–36.
3. Rajaratnam SM, Arendt J (2001) Health in a 24-h society. Lancet 358: 999–
1005.
4. Costa,G (2003) Shift work and occupational medicine: an overview. Occup Med
53: 83–88.
5. Sack RL, Auckley D, Auger RR, Carskadon MA, Wright KP, et al. (2007)
Circadian rhythm sleep disorders: part 11, advanced sleep phase disorder,
delayed sleep phase disorder, free-running disorder, and irregular sleep-wake
rhythm. An American Academy of Sleep Medicine review. Sleep 30: 1484–501.
6. Wyatt JK, Ritz-De Cecco A, Czeisler CA, Dijk DJ (1999) Circadian temperature
and melatonin rhythms, sleep, and neurobehavioral functions in humans living
on a 20-h day. Am J Physiol 277: R1152–63.
7. Dijk DJ, Duffy JF, Riel E, Shanahan TL, Czeisler CA (1999) Ageing and the
circadian and homeostatic regulation of human sleep during forced desynchrony
of rest, melatonin and temperature rhythms. J Physiol 516: 611–27.
8. Cambras T, Weller JR, Angles-Pujoras M, Lee ML, Christopher A, et al. (2007)
Circadian desynchronization of core body temperature and sleep stages in the
rat. Proc Natl Acad Sci USA 104: 7634–9.
9. Deboer T, Ruijgrok G, Meijer JH (2007) Short light-dark cycles affect sleep in
mice. Eur J Neurosci 26: 2518–23.
10. Casiraghi LP, Oda GA, Chisea JJ, Friesen WO, Golombek DA (2012) Forced
desynchronization of activity rhythms in a model of chronic jet lag in mice. J Biol
Rhythms 27: 59–69.
11. Yan L (2011) Structural and functional changes in the suprachiasmatic nucleus
following chronic circadian rhythm perturbation. Neuroscience 183: 99–107.
12. Castanon-Cervantes O, Wu M, Ehlen JC, Paul K, Gamble KL, et al. (2010)
Dysregulation of inflammatory responses by chronic circadian disruption.
J Immunol 185: 5796–805.
13. Ackermann K, Revell VL, Lao O, Rombouts EJ, Skene DJ, et al. (2012) Diurnal
rhythms in blood cell populations and the effect of acute sleep deprivation in
healthy young men. Sleep 35: 399–40.
14. Faraut B, Boudjeltia KZ, Vanhamme L, Kerkhofs M (2012) Immune,
inflammatory and cardiovascular consequences of sleep restriction and recovery.
Sleep Med Rev 16(2): 137–49.
15. Dinges DF, Douglas SD, Zaugg L, Campbell DE, McMann JM, et al. (1994)
Leukocytosis and natural killer cell function parallel neurobehavioral fatigue
induced by 64 hours of sleep deprivation. J Clin Invest 93: 1930–9.
16. Logan RW, Zhang C, Murugan S, O’Connell S, Levitt D, et al. (2012) Chronic
shift-lag alters the circadian clock of NK cells and promotes lung cancer growth
in rats. J Immunol 188: 2583–91.
17. Wisor JP, Schmidt MA, Clegern WC (2011a) Evidence for neuroinflammatory
and microglial changes in the cerebral response to sleep loss. Sleep 34: 261–72.
18. Wisor JP, Clegern WC, Schmidt MA (2011b) Toll-like receptor 4 is a regulator
of monocyte and electroencephalographic responses to sleep loss. Sleep 34:
1335–45.
19. Sellix MT, Evans JA, Leise TL, Castanon-Cervantes O, Hill DD, et al. (2012)
Aging differentially affects the re-entrainment response of central and peripheral
circadian oscillators. J Neurosci 32: 16193–202.
20. Hasan S, Dauvilliers Y, Mongrain V, Franken P, Tafti M (2012) Age-related
changes in sleep in inbred mice are genotype dependent. Neurobiol Aging 33:
195.e13–26.
21. Postnova S, Layden A, Robinson PA, Phillips AJ, Abeysuriya RG (2012)
Exploring sleepiness and entrainment on permanent shift schedules in a
physiologically based model. J Biol Rhythms 27: 91–102.
22. Lee ML, Swanson BE, de la Iglesia HO (2009) Circadian timing of REM sleep is
coupled to an oscillator within the dorsomedial suprachiasmatic nucleus. Curr
Biol 19: 848–52.
23. Cirelli C, Pompeiano M, Tononi G (1995) Sleep deprivation and c-fos
expression in the rat brain. J Sleep Res 4: 92–106.
24. Semba K, Pastorius J, Wilkinson M, Rusak B (2001) Sleep deprivation-induced
c-fos and junB expression in the rat brain: effects of duration and timing. Behav
Brain Res 120: 75–86.
25. Greco MA, Lu J, Wagner D, Shiromani PJ (2000) c-Fos expression in the
cholinergic basal forebrain after enforced wakefulness and recovery sleep.
Neuroreport 11: 437–40.
26. Gvilia I, Xu F, McGinty D, Szymusiak R (2006) Homeostatic regulation of sleep:
a role for preoptic area neurons. J Neurosci 26: 9426–33.
Photic Regulation of Sleep and Inflammation
PLOS ONE | www.plosone.org 7 May 2013 | Volume 8 | Issue 5 | e63752
27. Paxinos G, Franklin KBJ (2008) The mouse brain in stereotaxic coordinates.
New York: Academic.
28. Majde JA, Krueger JM (2005) Links between the innate immune system and
sleep. J Allergy Clin Immunol 116: 1188–98.
Photic Regulation of Sleep and Inflammation
PLOS ONE | www.plosone.org 8 May 2013 | Volume 8 | Issue 5 | e63752