Sleep evoked delta frequency responses show a linear decline in amplitude across the adult lifespan
19
SLEEP EVOKED DELTA FREQUENCY RESPONSES SHOW A LINEAR DECLINE IN AMPLITUDE ACROSS THE ADULT LIFESPAN Ian M. Colrain 1,2 , Kate E. Crowley 3 , Christian L. Nicholas 2 , Lamia Afifi 4 , Fiona C. Baker 1,5 , Mayra Padilla 1 , Sharon R. Turlington 1 , and John Trinder 2 1 Center for Health Sciences, SRI International, Menlo Park, CA, USA 2 Department of Psychology, The University of Melbourne, Parkville, Vic., Australia 3 Sleep Diagnostics Pty. Ltd., Richmond, Vic., Australia 4 Department of Neurology, Cairo University, Cairo, Egypt 5 Brain Function Research Unit, School of Physiology, University of the Witwatersrand, Johannesburg, South Africa Abstract Aging is associated with many changes in sleep, with one of the most prominent being a reduction in slow wave sleep. Traditional measures of this phenomenon rely on spontaneous activity and typically confound the incidence and amplitude of delta waves. The measurement of evoked K- complexes during sleep, enable separate assessment of incidence and amplitude taken from the averaged K-complex waveform. The present study describes data from 70 normal healthy men and women aged between 19 and 78 years. K-complexes were evoked using short auditory tones and recorded from a midline array of scalp sites. Significant reductions with age were seen in the amplitude of the N550 component of the averaged waveform, which represents the amplitude of the K-complex, with linear regression analysis indicating approximately 50% of the variance was due to age. Smaller, yet still significant reductions were seen in the ability to elicit K-complexes. The data highlight the utility of evoked K-complexes as a sensitive marker of brain aging in men and women. 1. Introduction Sleep is a ubiquitous behavior in humans that is associated with a characteristic pattern of changes in brain electrical activity across the night. Two different sleep states are definable using EEG and other physiological measures: Rapid eye movement (REM) sleep with wake- like EEG activity, but muscle paralysis and non-rapid eye movement (NREM) sleep with theta (4–7 Hz) and delta (0–4Hz) frequency EEG and unique EEG features such as sleep spindles and K-complexes (KCs). NREM sleep can be further subdivided based on EEG features into stage 1, with the onset of theta activity; stage 2, with theta, spindles and KCs; Correspondence to: Ian M. Colrain PhD, SRI International, 333 Ravenswood Ave, Menlo Park, CA, 94025, Telephone: (650) 8593915, Facsimile: (650) 8592743, [email protected]. 6.1 Disclosure statement: None of the authors have any potential or actual conflicts of interest. Publisher's Disclaimer: This is a PDF file of an unedited manuscript that has been accepted for publication. As a service to our customers we are providing this early version of the manuscript. The manuscript will undergo copyediting, typesetting, and review of the resulting proof before it is published in its final citable form. Please note that during the production process errors may be discovered which could affect the content, and all legal disclaimers that apply to the journal pertain. NIH Public Access Author Manuscript Neurobiol Aging. Author manuscript; available in PMC 2013 March 25. Published in final edited form as: Neurobiol Aging. 2010 May ; 31(5): 874–883. doi:10.1016/j.neurobiolaging.2008.06.003. NIH-PA Author Manuscript NIH-PA Author Manuscript NIH-PA Author Manuscript
-
Upload
independent -
Category
Documents
-
view
3 -
download
0
Transcript of Sleep evoked delta frequency responses show a linear decline in amplitude across the adult lifespan

SLEEP EVOKED DELTA FREQUENCY RESPONSES SHOW ALINEAR DECLINE IN AMPLITUDE ACROSS THE ADULTLIFESPAN
Ian M. Colrain1,2, Kate E. Crowley3, Christian L. Nicholas2, Lamia Afifi4, Fiona C. Baker1,5,Mayra Padilla1, Sharon R. Turlington1, and John Trinder2
1 Center for Health Sciences, SRI International, Menlo Park, CA, USA2 Department of Psychology, The University of Melbourne, Parkville, Vic., Australia3 Sleep Diagnostics Pty. Ltd., Richmond, Vic., Australia4 Department of Neurology, Cairo University, Cairo, Egypt5 Brain Function Research Unit, School of Physiology, University of the Witwatersrand,Johannesburg, South Africa
AbstractAging is associated with many changes in sleep, with one of the most prominent being a reductionin slow wave sleep. Traditional measures of this phenomenon rely on spontaneous activity andtypically confound the incidence and amplitude of delta waves. The measurement of evoked K-complexes during sleep, enable separate assessment of incidence and amplitude taken from theaveraged K-complex waveform. The present study describes data from 70 normal healthy men andwomen aged between 19 and 78 years. K-complexes were evoked using short auditory tones andrecorded from a midline array of scalp sites. Significant reductions with age were seen in theamplitude of the N550 component of the averaged waveform, which represents the amplitude ofthe K-complex, with linear regression analysis indicating approximately 50% of the variance wasdue to age. Smaller, yet still significant reductions were seen in the ability to elicit K-complexes.The data highlight the utility of evoked K-complexes as a sensitive marker of brain aging in menand women.
1. IntroductionSleep is a ubiquitous behavior in humans that is associated with a characteristic pattern ofchanges in brain electrical activity across the night. Two different sleep states are definableusing EEG and other physiological measures: Rapid eye movement (REM) sleep with wake-like EEG activity, but muscle paralysis and non-rapid eye movement (NREM) sleep withtheta (4–7 Hz) and delta (0–4Hz) frequency EEG and unique EEG features such as sleepspindles and K-complexes (KCs). NREM sleep can be further subdivided based on EEGfeatures into stage 1, with the onset of theta activity; stage 2, with theta, spindles and KCs;
Correspondence to: Ian M. Colrain PhD, SRI International, 333 Ravenswood Ave, Menlo Park, CA, 94025, Telephone: (650)8593915, Facsimile: (650) 8592743, [email protected].
6.1 Disclosure statement: None of the authors have any potential or actual conflicts of interest.
Publisher's Disclaimer: This is a PDF file of an unedited manuscript that has been accepted for publication. As a service to ourcustomers we are providing this early version of the manuscript. The manuscript will undergo copyediting, typesetting, and review ofthe resulting proof before it is published in its final citable form. Please note that during the production process errors may bediscovered which could affect the content, and all legal disclaimers that apply to the journal pertain.
NIH Public AccessAuthor ManuscriptNeurobiol Aging. Author manuscript; available in PMC 2013 March 25.
Published in final edited form as:Neurobiol Aging. 2010 May ; 31(5): 874–883. doi:10.1016/j.neurobiolaging.2008.06.003.
NIH
-PA Author Manuscript
NIH
-PA Author Manuscript
NIH
-PA Author Manuscript

and slow wave sleep (SWS) with at least 20% delta activity (Rechtschaffen and Kales,1968).
KCs were first described by Loomis et al. (Loomis et al., 1938) and represent an unusualclass of EEG features in that they can occur spontaneously or be evoked by a variety ofexternal stimuli (Colrain, 2005). Their spontaneous occurrence can define the onset of stage2 NREM sleep (Rechtschaffen and Kales, 1968). The accepted definition for KCs is “EEGwaveforms having a well delineated negative sharp wave which is immediately followed bya positive component. The total duration of the complex should exceed 0.5 sec.”(Rechtschaffen and Kales, 1968). They are thus by definition, delta frequency waveforms, asa period of greater than 0.5 seconds corresponds to a frequency of less than 2Hz.Spontaneous and evoked KCs have an extremely variable morphology (Paiva and Rosa,1991) due to them being embedded in the ongoing EEG, and their summation withbackground EEG activity. It is for this reason that Bastien and Campbell (1992) proposedthe use of averaging to extract the signal (pure KC) from the noise of the unrelated randomEEG. Such averaging of KCs in NREM sleep produces an averaged evoked delta frequencywaveform with a characteristic pattern of peaks starting and ending with positivecomponents (P2 and P900). The large negative N550 component in between these positivepeaks represents the averaged amplitude of the “pure” KC.
KCs share a common generation mechanism with the continuous delta activity seen in SWS.Delta EEG reflects EEG synchronization produced either by thalamocortical cells operatingin a burst-firing pattern following hyperpolarization (Steriade et al., 1991) or by corticalcells operating in this manner independent of the thalamus (Steriade et al., 1993a). Aginghas been shown to impact delta generation during sleep with a decrease in the incidence ofspontaneous KCs (Crowley et al., 2002a; Kubicki et al., 1989) and incidence and amplitude(N550) of evoked KCs (Crowley et al., 2002b; Crowley et al., 2004). However, these studiesonly tested groups of young (mean age of around 23 years in both studies) and old (meanage of 66 years in one study and 76 in the other) adults. The progression of change in theKC across the adult lifespan is, therefore, unknown.
Aging also reliably leads to a decrease in the amount of SWS (Bliwise, 1993; Blois et al.,1983; Ehlers and Kupfer, 1989; Feinberg et al., 1967; Larsen et al., 1995; Smith et al.,1977). However as highlighted in a recent meta analysis of studies about sleep across thelifespan (Ohayon et al., 2004) many of the studies did not contain middle aged subjects. Ofthe 47 studies used to describe the impact of age on adult sleep only seven compared thesleep of young, middle aged and elderly adults whereas seventeen studies compared youngand elderly subjects directly. A recent study (Bonnet and Arand, 2007) addressed thislimitation by studying the sleep of 76 subjects aged 18 to 70 years and reported that SWSdeclined with age with an overall correlation of r = −0.62 (p <.01).
The reduction in SWS with aging is thought to primarily reflect a decrease in the amplitudeof delta activity, rather than an absence of slow frequency activity (Bliwise, 1993), as thescoring of SWS requires not only the presence of at least 20% delta activity per epoch, butthat the delta activity have an amplitude of at least 75 μV (Rechtschaffen and Kales, 1968).However, aging has also been reliably associated with decreases in NREM sleep delta powerwhich reflects both amplitude and incidence of delta waves (Blois et al., 1983; Ehlers andKupfer, 1989; Feinberg and Campbell, 2003; Feinberg et al., 1981; Landolt et al., 1996;Mourtazaev et al., 1995). The use of evoked KCs as an index of delta production enables theseparation of incidence and amplitude variables that are confounded in more traditionalSWS and delta power measures.
Colrain et al. Page 2
Neurobiol Aging. Author manuscript; available in PMC 2013 March 25.
NIH
-PA Author Manuscript
NIH
-PA Author Manuscript
NIH
-PA Author Manuscript

The aim of the present experiment was to test the hypothesis that evoked delta frequencyresponses, as indexed by the amplitude of the N550 evoked potential component, wouldshow a linear decline with increasing age over the adult lifespan. Confirmation of thehypothesis would indicate that evoked delta responses might provide a functional index ofage-related brain macrostructural and microstructural changes.
2. Methods2.1 Subjects
Data were collected from 70 normal healthy adults (34 women) ranging in age from 19 to 78years. The age distributions for each sex are presented in Figure 1. The men had a mean (±SD) age of 50.6 ± 17.3 years, which did not differ significantly from that of the women(46.7 ± 16.8 years) (t(68)=0.94, p=0.4).
Data were drawn from a number of studies from our laboratory, all using the sameequipment, with identical stimulus and similar recording parameters. Eight control subjectswere drawn from each of the Nicholas et al. (2002) and Afifi et al. (2003) studies, seventeensubjects from the Crowley et al. (2002b) study and thirty seven subjects from ongoingstudies of normal aging and alcoholism. All subjects were in general good health and freefrom sleep disorders. All subjects reported normal hearing with no need for hearing aids. Forthe subjects over the age of 65 years hearing was verified using an audiometer to be within15dB ISO at 1000Hz. Bastien and Campbell(1992) have reported that a 20 dB decrease instimulus intensity had no impact on N550 amplitude. All subjects were tested duringwakefulness to ensure that they could hear the tones that would be presented to them duringsleep.
2.2 StimuliAuditory stimuli consisted of 1000Hz pure tones presented for 50ms (2ms rise time) at 80dB(A). These stimuli have previously been shown to be optimal for KC elicitation (Bastienand Campbell, 1992). The tones were presented binaurally via E-A-RTONE 3A insertearphones, with a random inter stimulus interval of between 15 and 30 seconds. A minimumof 200 stimuli were presented in stable stage 2 sleep during each night. When subjectsentered SWS or REM sleep or the EEG showed signs of arousal or motor artifact, stimuluspresentation was halted, until stage 2 sleep had been re-entered. Data were not collectedduring REM due to the absence of K-complexes form this sleep stage. SWS was avoideddue to the potential for the age-related decline in SWS to confound the results.
2.3 EEG data collectionEEG and evoked potential data were recorded from 5 midline scalp sites adapted from theinternational 10/20 system (Fz, FCz, Cz, CPz, Pz), using Grass gold-plated 10mm electrodes(with the exception of the subjects from (Afifi et al., 2003) where the data were collectedusing a Neuroscan Quick Cap electrode array). Two channels of electro-oculogram (EOG)and a submental electromyogram (EMG) were also recorded. All EEG channels werereferenced to linked earlobes. Raw data were acquired using Neuroscan Synamps®amplifiers and stored for offline analysis using Neuroscan Scan™ software. Signals werecontinuously displayed in real time and filtered optimally for visual recognition of sleepstages (Rechtschaffen and Kales, 1968) (30sec per page, EEG & EOG: band pass filter, 0.3– 30Hz; EMG: band pass filter, 10 – 100Hz.). For analysis: raw EEG data were epochedtime-locked to tone stimuli, and were filtered (“zero phase shift” - 0.3 to 30Hz) offline.Individual epochs were corrected for baseline differences across the pre-stimulus period.
Colrain et al. Page 3
Neurobiol Aging. Author manuscript; available in PMC 2013 March 25.
NIH
-PA Author Manuscript
NIH
-PA Author Manuscript
NIH
-PA Author Manuscript
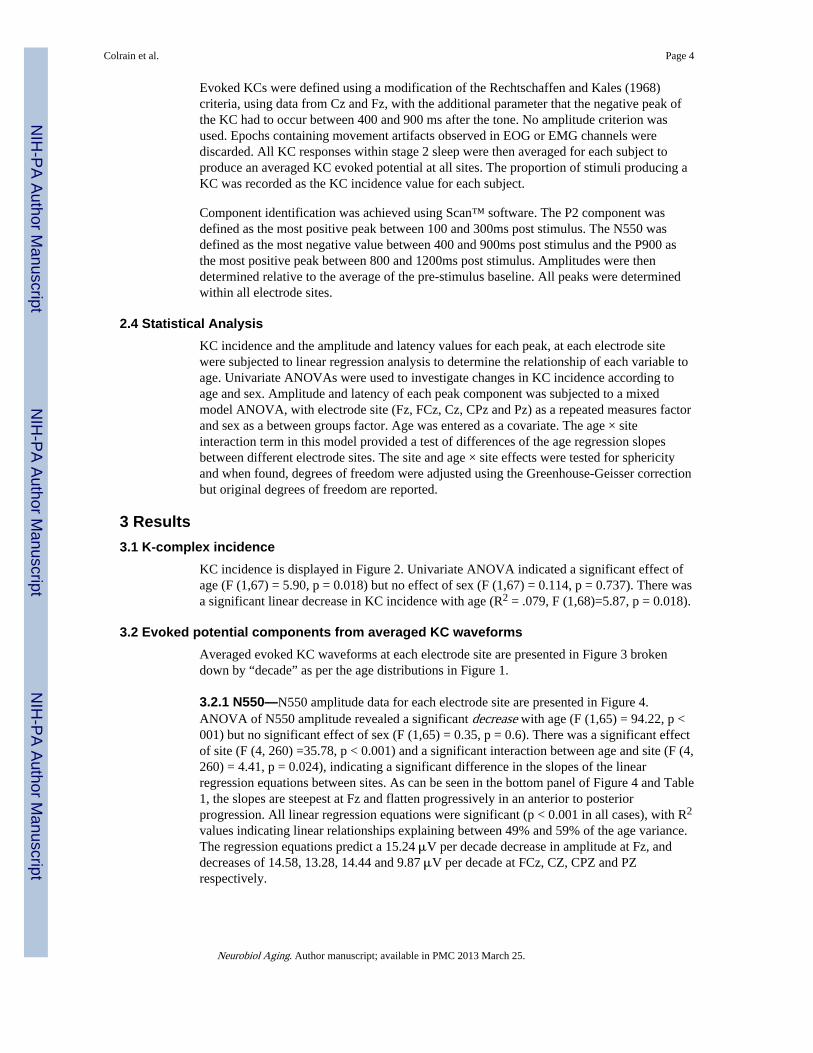
Evoked KCs were defined using a modification of the Rechtschaffen and Kales (1968)criteria, using data from Cz and Fz, with the additional parameter that the negative peak ofthe KC had to occur between 400 and 900 ms after the tone. No amplitude criterion wasused. Epochs containing movement artifacts observed in EOG or EMG channels werediscarded. All KC responses within stage 2 sleep were then averaged for each subject toproduce an averaged KC evoked potential at all sites. The proportion of stimuli producing aKC was recorded as the KC incidence value for each subject.
Component identification was achieved using Scan™ software. The P2 component wasdefined as the most positive peak between 100 and 300ms post stimulus. The N550 wasdefined as the most negative value between 400 and 900ms post stimulus and the P900 asthe most positive peak between 800 and 1200ms post stimulus. Amplitudes were thendetermined relative to the average of the pre-stimulus baseline. All peaks were determinedwithin all electrode sites.
2.4 Statistical AnalysisKC incidence and the amplitude and latency values for each peak, at each electrode sitewere subjected to linear regression analysis to determine the relationship of each variable toage. Univariate ANOVAs were used to investigate changes in KC incidence according toage and sex. Amplitude and latency of each peak component was subjected to a mixedmodel ANOVA, with electrode site (Fz, FCz, Cz, CPz and Pz) as a repeated measures factorand sex as a between groups factor. Age was entered as a covariate. The age × siteinteraction term in this model provided a test of differences of the age regression slopesbetween different electrode sites. The site and age × site effects were tested for sphericityand when found, degrees of freedom were adjusted using the Greenhouse-Geisser correctionbut original degrees of freedom are reported.
3 Results3.1 K-complex incidence
KC incidence is displayed in Figure 2. Univariate ANOVA indicated a significant effect ofage (F (1,67) = 5.90, p = 0.018) but no effect of sex (F (1,67) = 0.114, p = 0.737). There wasa significant linear decrease in KC incidence with age (R2 = .079, F (1,68)=5.87, p = 0.018).
3.2 Evoked potential components from averaged KC waveformsAveraged evoked KC waveforms at each electrode site are presented in Figure 3 brokendown by “decade” as per the age distributions in Figure 1.
3.2.1 N550—N550 amplitude data for each electrode site are presented in Figure 4.ANOVA of N550 amplitude revealed a significant decrease with age (F (1,65) = 94.22, p <001) but no significant effect of sex (F (1,65) = 0.35, p = 0.6). There was a significant effectof site (F (4, 260) =35.78, p < 0.001) and a significant interaction between age and site (F (4,260) = 4.41, p = 0.024), indicating a significant difference in the slopes of the linearregression equations between sites. As can be seen in the bottom panel of Figure 4 and Table1, the slopes are steepest at Fz and flatten progressively in an anterior to posteriorprogression. All linear regression equations were significant (p < 0.001 in all cases), with R2
values indicating linear relationships explaining between 49% and 59% of the age variance.The regression equations predict a 15.24 μV per decade decrease in amplitude at Fz, anddecreases of 14.58, 13.28, 14.44 and 9.87 μV per decade at FCz, CZ, CPZ and PZrespectively.
Colrain et al. Page 4
Neurobiol Aging. Author manuscript; available in PMC 2013 March 25.
NIH
-PA Author Manuscript
NIH
-PA Author Manuscript
NIH
-PA Author Manuscript

ANOVA of N550 latency revealed a modest increase with age (F (1,65) = 4.22, p = 0.044).There was no significant effect of site (F (1,65) = 1.65, p = 0.2), no significant effect of sex(F (1,65) = 0.17, p = 0.7), and no significant interaction between age and site (F (4,260) =1.42, p = 0.2). As indicated in Table 1, linear regression equations were significant at Fz (p= 0.029) and Cz (p = 0.042) only, with R2 values indicating that only 6% to 7% of the agevariance was explained at these sites.
3.2.2 P2—P2 amplitude data for each electrode site are presented in Figure 5. ANOVA ofP2 amplitude revealed a significant increase with age (F (1,65) = 6.82, p = 0.011), but nosignificant effect of site (F (4,260) =1.43, p = 0.243), and no significant effect of sex (F(1,65) = 0.001, p = 0.970). There was a significant interaction between age and site (F(4,260) = 3.62, p = 0.032), indicating a significant difference in the slopes of the linearregression equations between sites. As can be seen in the bottom panel of Figure 5 and inTable 1, the slopes at FCz, Cz and Fz were steeper than those at the more posterior sites andthe linear regression equations for these sites were all significant, whereas those for CPz andPz were not. The R2 values indicate that the strongest relationship, at FCz, explained onlyabout 13% of the variance of of P2 amplitude with age.
P2 latency data for each electrode site are presented in Figure 6. ANOVA of P2 latency alsorevealed a significant increase with age (F (1,65) = 20.72, p < 0.001), but no significanteffect of site (F (4,260) = 1.45, p = 0.236), no significant effect of sex (F (1,65) = 0.21, p =0.652), and no significant interaction between age and site (F (4,260) = 0.59, p = 0.594) (seebottom panel of Figure 6). As indicated in Table 1, linear regression equations weresignificant for all sites, with the R2 values indicating that this variable accounts for between22 and 28% of the age variance.
3.2.3 P900—ANOVA of P900 amplitude revealed no significant effect of age (F (1,66) =2.68, p = 0.106), and no significant effect of site (F (4,264) =0.5, p = 0.479). There was asignificant effect of sex (F (1,66) = 4.81, p = 0.032), and a significant interaction betweenage and site (F (4,264) = 4.67, p = 0.022), indicating a significant difference in the slopes ofthe linear regression equations between sites. As can be seen in Table 1, the linear regressionequations were significant only at FCz and Cz. However, the R2 values indicate that theserelationships explain only approximately 6% of the variance of age.
ANOVA of P900 latency revealed no significant effects of age (F (1,66)=0.4, p = 0.5), sex(F (1,66)=0.158, p = 0.7), or site (F (4,264)=0.27, p = 0.9) and no interaction between ageand site (F (4,264)=0.30, p = 0.9). The linear regression relationships with age were non-significant at all sites (see Table 1).
4. DiscussionThe hypothesis of a linear decline in N550 amplitude was supported by the data, with R2
values indicating that greater than 50% of the variance in the measure is attributable toaging. While the age relationship was significant at all measured electrode sites, the slope ofthe age related decline was steepest at Fz and showed a progressive anterior-posteriorflattening. Significant increases in P2 amplitude with age were also seen at anterior sites,and there was an overall increase in P2 latency. Evoked KC incidence decreasedsignificantly in a linear fashion with increasing age, however the R2 values were modest,indicating that less than 10% of the variance in the measure is attributable to age.
KCs are single instances of delta frequency EEG waveforms. Delta EEG during sleep can begenerated in two ways: within cortical cells operating in a burst-firing pattern followinghyperpolarization and activation of low threshold calcium channels (Steriade et al., 1993b);
Colrain et al. Page 5
Neurobiol Aging. Author manuscript; available in PMC 2013 March 25.
NIH
-PA Author Manuscript
NIH
-PA Author Manuscript
NIH
-PA Author Manuscript

or by thalamocortical cells (Steriade et al., 1991) operating in a similar manner. As sleepstate becomes deeper, and GABAergic cells in the thalamic reticular nucleus are lessimpacted by ascending brainstem input, thalamocortical cells are able to generate eitherdelta or transmit spindle activity, depending on their level of hyperpolarization. As thishyperpolarization becomes greater and the spindles give way to delta activity
There is now converging evidence from multiple sources that KCs are a purely cortical formof delta EEG rather than a thalamocortical phenomenon. Amzica and Steriade (Amzica andSteriade, 1997, 1998b) have argued that the spontaneous KC generation is due to the activityof a cortically generated slow (<1Hz) oscillation, that has been recorded from corticalneurons in anesthetized animals (Steriade et al., 1993b) during natural slow wave sleep incats (Steriade et al., 1996) and naturally sleeping humans (Achermann and Borbely, 1997;Amzica and Steriade, 1997). The cortical nature of the slow oscillation was demonstrated byits survival in athalamic preparations (Steriade et al., 1993a), its absence in the thalamus ofdecorticated cats (Timofeev and Steriade, 1996), and the disruption of its long-rangesynchronization after disconnection of intracortical synaptic linkages (Amzica and Steriade,1995). Multi-site depth recordings in both animals (Amzica and Steriade, 1998a) andhumans (Wennberg and Lozano, 2003) show polarity inversion which necessitates a supra-thalamic, i.e. cortical generator. Rossetti et al. (2005) recently reported a case study of apatient with thalamic vasogenic edema. During the period of the edema, spindles wereabsent from the sleep EEG, but spontaneous KCs were unaffected. Consistent with thesefinding, neither KC incidence nor KC N550 amplitude are different in responses to stimulipresented during a sleep spindle compared to those presented in the absence of a spindle(Crowley et al., 2004), and the scalp distribution of evoked KCs is the same for auditory andrespiratory stimuli (Colrain et al., 1999) despite the thalamocortical relay projecting to verydifferent areas of cortex. Finally, Marini et al. were able to show normal spontaneous KCactivity in the rat (Marini et al., 2004), and that these were unaffected by destruction of thethalamic reticular nucleus with ibotenic acid (Marini, 2008). All of the above data wouldseem to indicate that the processes for generating spindles and KCs are independent, withsleep spindles produced within the thalamus (Steriade et al., 1987) and KCs reflectingcortical delta generation. However, spindles are also altered by aging (Crowley et al.,2002b), and it remains possible that some characteristics of spindles (e.g., duration,frequency, density or amplitude) and KC amplitude may well be correlated in terms of howthey change across the lifespan.
The formal definition of K-complexes erroneously states that it “… is generally maximalover vertex regions” (Rechtschaffen and Kales, 1968). There is now a substantial literatureindicating that the N550 measured in KC averages in adults, has a topographic distributionindicating frontal or fronto-central maxima, bilateral symmetry, and a gradual fall off involtage from the midline frontal/fronto-central area to the posterior and lateral scalp regions(Colrain et al., 1999; Cote et al., 1999; Niiyama et al., 1995). In adult humans, KCs thusrepresent a highly synchronized cortical phenomenon that has a substantial frontalpredominance. The present data support these earlier studies showing that the amplitude ofthe N550 peak is maximal at frontal electrode sites. In addition, they show for the first timethat the frontal dominance of the N550 persists across the adult lifespan.
Changes in amplitude presumably reflect changes in the “capacity” to generate highamplitude delta waveforms, once triggered. The frontal scalp distribution and probableextrathalamic generation of the KC indicate that it may be indexing a similar regionalprocess to that reported by Dang-Vu and colleagues (Dang-Vu et al., 2005). H2
15O PET wasmeasured during sleep as determined by concurrent C3-A2 and C4-A1 EEG recordings.Delta power across stage2 and SWS was negatively correlated with regional cerebral bloodflow (rCBF) in regions previously grouped together by Damasio (1994) as ventromedial
Colrain et al. Page 6
Neurobiol Aging. Author manuscript; available in PMC 2013 March 25.
NIH
-PA Author Manuscript
NIH
-PA Author Manuscript
NIH
-PA Author Manuscript

prefrontal cortex (VMPFC). Specifically, negative correlations were found with rCBF inmedial frontal cortex, orbitofrontal cortex, anterior cingulate gyrus, basal forebrain, anteriorhypothalamus, putamen, anterior part of the insula and the precuneus. Importantly, there wasno correlation with activation in the thalamus. The authors interpreted their data as relatingto the generation of an extra-thalamic delta activity as distinct from the clock-like deltaproduced by thalamo-cortical loops. If N550 amplitude in evoked KCs is indeed indexingthe same process, the present data would indicate its potential utility as a functional measureof the impact of aging on VMPFC.
The N550 amplitude data from the present study extend the literature showing decreaseddelta amplitudes with aging. Most studies have concentrated on comparing groups of youngand older subjects whereas a strength of this study is the investigation of changes in anevoked delta waveform across the adult lifespan. It has been known for over thirty years thatthe greatest change in slow wave sleep delta activity occurs in adolescence and earlyadulthood (Feinberg, 1974) and it can be argued that in some of the studies reporting adecrease in delta power with increasing age, a substantial proportion of the impact occursearly in adult aging. For example, Ehlers and Kupfer (1989) reported that 31–40 year oldmen had less power in 0.5–2Hz and 1–2Hz activity than 21–30 year old men, but that therewas no further decrease seen in 51–70 year olds. Mourtazaev et al. (1995) reported that theirfinding of decreased slow wave power with aging was mainly based on the differencebetween the youngest group (26–35 years) and the other age groups (61–60, 66–75 and 85–101 years), with less difference being observed between the older groups. The presentfinding of a linear decrease in delta amplitude is more consistent with the linear reduction inSWS reported in the recent Bonnet and Arand (2007) study, although with a more of the agevariance explained (R2 of 0.50 vs. 0.380). It is also consistent with the brain changes seenwith aging, for example Pfefferbaum et al. (1994) and highlights the sensitivity of theaveraged KC as a measure of delta production. Other measures, such as SWS and deltapower that show a reduced rate of change in older subjects, have features that may mask thelinear decline revealed in theN550 measure. Thus SWS, is confounded by scoring rules thatrequire delta frequency EEG, be at least 75 μV in amplitude (Rechtschaffen and Kales,1968), and delta power is a composite measure of amplitude and incidence of waveforms.N550 amplitude is a “pure” delta amplitude measure.
In the present study the slope of the linear relationship between KC N550 amplitude and ageis steepest at frontal sites and then becomes progressively flatter with more caudal electrodesites. Steeper rates of decline in frontal delta are consistent with the data presented byMünch et al. (2004) where older subjects (57–74 years) displayed a substantially reducedincrease in delta power at frontal sites following sleep deprivation when compared with theyounger subjects.
The present data show significant decreases in amplitude and incidence of evoked deltawaveforms with aging, but indicate that the incidence measure is less impacted by age thanis amplitude. The oldest subject was still able to produce KCs to 33.3% of the stimuli andthe average KC incidence rate for the 71–78 year-olds was 0.48 ± 0.13, representing a 27%decrease from the 0.65 ± 0.18 seen in the 19–30 year-olds. In comparison, the incidence ofspontaneous KCs has previously been reported as reduced by about 20% in older comparedto younger subjects (Crowley et al., 2002a). By way of comparison the N550 amplitude atFz of the oldest subjects showed an 80.3% decrease when compared to the 19–30 year-olds.The finding of a relatively conserved ability to produce KCs in normal elderly is consistentwith our previous report comparing delta production in normal elderly to that in Alzheimer’sDisease (AD) patients (Crowley et al., 2005).
Colrain et al. Page 7
Neurobiol Aging. Author manuscript; available in PMC 2013 March 25.
NIH
-PA Author Manuscript
NIH
-PA Author Manuscript
NIH
-PA Author Manuscript

The present data are also consistent with other studies showing that delta incidence is lessimpacted by aging than delta amplitude. For example, Feinberg (1974) used a 50 μVcriterion for SWS in a study of 105 normal subjects from ages 4 to 96 years. There weredramatic reductions in total SWS when comparing the adult groups to young children (4–10year olds) and adolescents (11–16 year olds), however, the only SWS effect seen among theadults subjects was that the 17–23 year-olds had more stage 4 than the 67–96 year olds. Thereduced amplitude is unlikely to have negatively affected SWS scoring given that SWS hasbeen shown to be scored reliably with no amplitude criterion (Webb and Dreblow, 1982).Indeed, Smith Karacan & Yang (1977) found no age related changes in incidence when allwaves greater than 5 μV were assessed.
The decrease in KC incidence presumably indicates that the cortex is less often in thehyperpolarized state conducive to KC production. The underlying cause of this change is notknown, but may relate to altered cortical dynamics with a disruption of the slow frequencyoscillation. Recent work has highlighted the role of glial cells in producing the slowfrequency oscillation thought to be necessary for K-complex and delta generation (Amzicaand Massimini, 2002). Age related changes in glial function may thus be partly responsiblefor the finding.
In vivo studies (Manns et al., 2000, 2003) have demonstrated that the cholinergic neurons ofthe nucleus basalis of Meynert (NB) discharge in a rhythmic bursting mode, which issubtended by calcium conductances when cells are hyperpolarized (Alonso et al., 1996;Khateb et al., 1992). The dramatic reduction of KC incidence (as low as 5%), in AD patientsin the Crowley et al. (2005) study, were thus interpreted as potentially due to the pathologyof the NB seen in AD patients. The less dramatic change in KC incidence seen with normalaging in the present data set could nonetheless reflect a more subtle change in thismechanism.
The finding of an increase in P2 amplitude with age highlights the fact that the reduction inN550 is not merely due to physical changes in the body with age that might produce anoverall damping of EEG amplitude. As with KC incidence, regression equations for P2amplitude and latency explained substantially less of the age variance than was the case forN550 amplitude. P2 is a difficult component to interpret (Crowley and Colrain, 2004), butpresumably is some reflection of the state of the cortex at the start of the KC, and thus thepresent data highlight altered cortical dynamics with aging. Pfefferbaum et al. (1980) havepreviously P2 amplitude as increasing with aging in evoked potential recorded duringwakefulness, despite most “awake” auditory evoked potential components showing reducedamplitudes with increased age (Kok, 2000). Data collection during other sleep stages (REMand SWS) might further inform the understanding of P2 and indeed other components, butthis will require an additional study given that only stage 2 data are available for analysis inthe present experiment.
The present data do not show a significant main effect of sex for any variable other thanP900 amplitude which was larger in women than men. The lack of a sex difference in eitherKC incidence or KC N550 amplitude is interesting in the context of other studies previouslyreporting sex differences in other delta EEG measures. Studies have typically reported thatwomen have increased SWS or delta power relative to men, with the difference persistinginto old age (Carrier et al., 2001; Mourtazaev et al., 1995). However, the incidence ofspontaneous KCs is not higher in young or old women relative to age-matched men(Crowley et al., 2002a). Studies which have evaluated aging effects on delta activity havetypically not reported significant age × sex interactions (Carrier et al., 2001; Mourtazaev etal., 1995), concluding that the process of aging has similar impacts on delta EEG in men andwomen, as is the case in the present data.
Colrain et al. Page 8
Neurobiol Aging. Author manuscript; available in PMC 2013 March 25.
NIH
-PA Author Manuscript
NIH
-PA Author Manuscript
NIH
-PA Author Manuscript

5. ConclusionsThe present data point to N550 amplitude in the average of evoked KCs as being a highlysensitive marker of aging in both men and women. Evoked KCs appear to reflect afunctional measure of the ability of the aging brain to produce large amplitude synchronizedwaveforms, and thus act as an indirect measure of how aging impacts the functional integrityof brain networks, particularly those in frontal regions. Given that these measures arederived from sleep EEG, they arguably provide measures that are free from potentiallyconfounding factors present in recordings made during wakefulness in older subjects, suchas the ability to understand, follow or remember instructions. Sleep can be viewed as anoptimal baseline state in which to assess functional properties of the CNS. Given recentexperimental and theoretical developments relating to the role of delta EEG in reflecting acompensatory state for synaptic potentiation during wakefulness (Tononi and Cirelli, 2003),and the role of delta sleep in supporting daytime learning and memory (Goder et al., 2006)and neuropsychological function (Anderson and Horne, 2003), the ability to measure deltaproduction in a way that sensitively indexes normal aging may prove important in aiding theunderstanding of how changes in sleep EEG support changes in brain function in olderadults.
AcknowledgmentsThe work was funded by NIH (NIAAA) grant AA14211.
ReferencesAchermann P, Borbely AA. Low-frequency (< 1 Hz) oscillations in the human sleep
electroencephalogram. Neuroscience. 1997; 81(1):213–222. [PubMed: 9300413]
Afifi L, Guilleminault C, Colrain IM. Sleep and respiratory stimulus specific dampening of corticalresponsiveness in OSAS. Respir Physiol Neurobiol. 2003; 136(2–3):221–234. [PubMed: 12853013]
Alonso A, Khateb A, Fort P, Jones BE, Muhlethaler M. Differential oscillatory properties ofcholinergic and noncholinergic nucleus basalis neurons in guinea pig brain slice. Eur J Neurosci.1996; 8(1):169–182. [PubMed: 8713461]
Amzica F, Massimini M. Glial and neuronal interactions during slow wave and paroxysmal activitiesin the neocortex. Cereb Cortex. 2002; 12(10):1101–1113. [PubMed: 12217974]
Amzica F, Steriade M. Disconnection of intracortical synaptic linkages disrupts synchronization of aslow oscillation. Journal of Neuroscience. 1995; 15(6):4658–4677. [PubMed: 7790931]
Amzica F, Steriade M. The K-complex: its slow (<1-Hz) rhythmicity and relation to delta waves.Neurology. 1997; 49(4):952–959. [PubMed: 9339673]
Amzica F, Steriade M. Cellular substrates and laminar profile of sleep K-complex. Neuroscience.1998a; 82(3):671–686. [PubMed: 9483527]
Amzica F, Steriade M. Electrophysiological correlates of sleep delta waves. Electroencephalogr ClinNeurophysiol. 1998b; 107(2):69–83. [PubMed: 9751278]
Anderson C, Horne JA. Prefrontal cortex: links between low frequency delta EEG in sleep andneuropsychological performance in healthy, older people. Psychophysiology. 2003; 40(3):349–357.[PubMed: 12946109]
Bastien C, Campbell K. The evoked K-complex: All-or-none phenomenon? Sleep. 1992; 15(3):236–245. [PubMed: 1621024]
Bliwise DL. Sleep in normal aging and dementia. Sleep. 1993; 16(1):40–81. [PubMed: 8456235]
Blois R, Feinberg I, Gaillard JM, Kupfer DJ, Webb WB. Sleep in normal and pathological aging.Experientia. 1983; 39(6):551–558. [PubMed: 6343111]
Bonnet MH, Arand DL. EEG arousal norms by age. J Clin Sleep Med. 2007; 3(3):271–274. [PubMed:17561594]
Colrain et al. Page 9
Neurobiol Aging. Author manuscript; available in PMC 2013 March 25.
NIH
-PA Author Manuscript
NIH
-PA Author Manuscript
NIH
-PA Author Manuscript

Carrier J, Land S, Buysse DJ, Kupfer DJ, Monk TH. The effects of age and gender on sleep EEGpower spectral density in the middle years of life (ages 20–60 years old). Psychophysiology. 2001;38(2):232–242. [PubMed: 11347869]
Colrain IM. The K-complex: A seven-decade history. Sleep. 2005; 28(2):255–273. [PubMed:16171251]
Colrain IM, Webster KE, Hirst G. The N550 component of the evoked K-complex: a modality non-specific response? J Sleep Res. 1999; 8(4):273–280. [PubMed: 10646167]
Cote KA, de Lugt DR, Langley SD, Campbell KB. Scalp topography of the auditory evoked K-complex in stage 2 and slow wave sleep. J Sleep Res. 1999; 8(4):263–272. [PubMed: 10646166]
Crowley K, Sullivan EV, Adalsteinsson E, Pfefferbaum A, Colrain IM. Differentiating pathologicdelta from healthy physiologic delta in patients with Alzheimer disease. Sleep. 2005; 28(7):865–870. [PubMed: 16124667]
Crowley K, Trinder J, Kim Y, Carrington M, Colrain IM. The effects of normal aging on sleep spindleand K-complex production. Clin Neurophysiol. 2002a; 113(10):1615–1622. [PubMed: 12350438]
Crowley KE, Colrain IM. A review of the evidence for P2 being an independent component process:age, sleep and modality. Clin Neurophysiol. 2004; 115(4):732–744. [PubMed: 15003751]
Crowley KE, Trinder J, Colrain IM. An examination of evoked K-complex amplitude and frequency ofoccurrence in the elderly. J Sleep Res. 2002b; 11(2):129–140. [PubMed: 12028478]
Crowley KE, Trinder J, Colrain IM. Evoked K-Complex Generation: The Impact of Sleep Spindlesand Age. Clinical Neurophysiology. 2004; 115(2):471–476. [PubMed: 14744590]
Damasio, A. Emotion Reason and the Human Brain. Grosset/Putnam; New York: 1994. Descartes’sError.
Dang-Vu TT, Desseilles M, Laureys S, Degueldre C, Perrin F, Phillips C, Maquet P, Peigneux P.Cerebral correlates of delta waves during non-REM sleep revisited. Neuroimage. 2005; 28(1):14–21. [PubMed: 15979343]
Ehlers C, Kupfer D. Effects of age on delta and REM sleep parameters. Electroencephalography andClinical Neurophysiology. 1989; 72:118–125. [PubMed: 2464482]
Feinberg I. Changes in sleep cycle patterns with age. J Psychiatr Res. 1974; 10(3–4):283–306.[PubMed: 4376564]
Feinberg I, Campbell IG. Kinetics of non-rapid eye movement delta production across sleep andwaking in young and elderly normal subjects: theoretical implications. Sleep. 2003; 26(2):192–200. [PubMed: 12683479]
Feinberg, I.; Fein, G.; Floyd, TC.; Aminoff, M. Sleep EEG waveform profiles in young and elderlynormal subjects. In: Perris, C.; Struwe, G.; Jansson, B., editors. Biological Psychiatry. Elsevier/North Holland Biomedical Press; Amsterdam: 1981. p. 294-297.
Feinberg I, Koresko RL, Heller N. EEG sleep patterns as a function of normal and pathological agingin man. J Psychiatr Res. 1967; 5(2):107–144. [PubMed: 6056816]
Goder R, Aldenhoff JB, Boigs M, Braun S, Koch J, Fritzer G. Delta power in sleep in relation toneuropsychological performance in healthy subjects and schizophrenia patients. J NeuropsychiatryClin Neurosci. 2006; 18(4):529–535. [PubMed: 17135379]
Khateb A, Muhlethaler M, Alonso A, Serafin M, Mainville L, Jones BE. Cholinergic nucleus basalisneurons display the capacity for rhythmic bursting activity mediated by low-threshold calciumspikes. Neuroscience. 1992; 51(3):489–494. [PubMed: 1488109]
Kok A. Age-related changes in involuntary and voluntary attention as reflected in components of theevent-related potential (ERP). Biol Psychol. 2000; 54(1–3):107–143. [PubMed: 11035221]
Kubicki S, Scheuler W, Jobert M, Pastelak-Price C. The effect of age on sleep spindle and K complexdensity. EEG EMG Z Elektroenzephalogr Elektromyogr Verwandte Geb. 1989; 20(1):59–63.[PubMed: 2495925]
Landolt HP, Dijk DJ, Achermann P, Borbely AA. Effect of age on the sleep EEG: slow-wave activityand spindle frequency activity in young and middle-aged men. Brain Res. 1996; 738(2):205–212.[PubMed: 8955514]
Larsen LH, Moe KE, Vitiello MV, Prinz PN. Age trends in the sleep EEG of healthy older men andwomen. J Sleep Res. 1995; 4(3):160–172. [PubMed: 10607155]
Colrain et al. Page 10
Neurobiol Aging. Author manuscript; available in PMC 2013 March 25.
NIH
-PA Author Manuscript
NIH
-PA Author Manuscript
NIH
-PA Author Manuscript

Loomis A, Harvey E, Hobart G. Distribution of disturbance-patterns in the humanelectroencephalogram, with special reference to sleep. Journal of Neurophysiology. 1938; 1:413–430.
Manns ID, Alonso A, Jones BE. Discharge properties of juxtacellularly labeled andimmunohistochemically identified cholinergic basal forebrain neurons recorded in association withthe electroencephalogram in anesthetized rats. J Neurosci. 2000; 20(4):1505–1518. [PubMed:10662840]
Manns ID, Alonso A, Jones BE. Rhythmically discharging basal forebrain units comprise cholinergic,GABAergic, and putative glutamatergic cells. J Neurophysiol. 2003; 89(2):1057–1066. [PubMed:12574480]
Marini, G. Personal Communication. 2008.
Marini G, Ceccarelli P, Mancia M. Spontaneous K-complexes in behaving rats. Arch Ital Biol. 2004;142(1):59–67. [PubMed: 15143624]
Mourtazaev MS, Kemp B, Zwinderman AH, Kamphuisen HA. Age and gender affect differentcharacteristics of slow waves in the sleep EEG. Sleep. 1995; 18(7):557–564. [PubMed: 8552926]
Münch M, Knoblauch V, Blatter K, Schroder C, Schnitzler C, Krauchi K, Wirz-Justice A, Cajochen C.The frontal predominance in human EEG delta activity after sleep loss decreases with age. Eur JNeurosci. 2004; 20(5):1402–1410. [PubMed: 15341612]
Nicholas CL, Sullivan EV, Pfefferbaum A, Trinder J, Colrain IM. The effects of alcoholism onauditory evoked potentials during sleep. J Sleep Res. 2002; 11(3):247–253. [PubMed: 12220321]
Niiyama Y, Fushimi M, Sekine A, Hishikawa Y. K-complex evoked in NREM sleep is accompaniedby a slow negative potential related to cognitive process. Electroencephalogr Clin Neurophysiol.1995; 95(1):27–33. [PubMed: 7621767]
Ohayon MM, Carskadon MA, Guilleminault C, Vitiello MV. Meta-analysis of quantitative sleepparameters from childhood to old age in healthy individuals: developing normative sleep valuesacross the human lifespan. Sleep. 2004; 27(7):1255–1273. [PubMed: 15586779]
Paiva, T.; Rosa, A. The K-Complex variability in normal subjects. In: Terzano, MG.; Halasz, P.;Declerck, AC., editors. Phasic Events and Dynamic Organization of Sleep. Raven; New York:1991. p. 167-184.
Pfefferbaum A, Ford JM, Roth WT, Kopell BS. Age-related changes in auditory event-relatedpotentials. Electroencephalogr Clin Neurophysiol. 1980; 49(3–4):266–276. [PubMed: 6158403]
Pfefferbaum A, Mathalon DH, Sullivan EV, Rawles JM, Zipursky RB, Lim KO. A quantitativemagnetic resonance imaging study of changes in brain morphology from infancy to late adulthood.Arch Neurol. 1994; 51(9):874–887. [PubMed: 8080387]
Rechtschaffen, A.; Kales, A. A Manual of Standardised Terminology, Techniques and ScoringSystems for Sleep Stages of Human Subjects. U.S. Government Printing Office; Washington D.C:1968.
Rossetti AO, Maeder-Ingvar M, Reichhart MD, Despland PA, Bogousslavsky J. Transitory sleepspindles impairment in deep cerebral venous thrombosis. Neurophysiol Clin. 2005; 35(1):19–23.[PubMed: 15808964]
Smith JR, Karacan I, Yang M. Ontogeny of delta activity during human sleep. Electroencephalogr ClinNeurophysiol. 1977; 43(2):229–237. [PubMed: 69533]
Steriade M, Amzica F, Contreras D. Synchronization of fast (30–40Hz) spontaneous cortical rhythmsduring brain activation. Journal of Neuroscience. 1996; 16(1):392–417. [PubMed: 8613806]
Steriade M, Domich L, Oakson G, Deschenes M. The deafferented reticular thalamic nucleusgenerates spindle rhythmicity. J Neurophysiol. 1987; 57(1):260–273. [PubMed: 3559675]
Steriade M, Dossi RC, Nunez A. Network modulation of a slow intrinsic oscillation of catthalamocortical neurons implicated in sleep delta waves: cortically induced synchronization andbrainstem cholinergic suppression. J Neurosci. 1991; 11(10):3200–3217. [PubMed: 1941080]
Steriade M, Nunez A, Amzica F. Intracellular analysis of relations between the slow (< 1 Hz)neocortical oscillation and other sleep rhythms of the electroencephalogram. J Neurosci. 1993a;13(8):3266–3283. [PubMed: 8340807]
Steriade M, Nunez A, Amzica F. A novel slow (1 Hz) oscillation of neocortical neurons in vivo:depolarizing and hyperpolarizing components. Journal of Neuroscience. 1993b; 13(8):3852–3865.
Colrain et al. Page 11
Neurobiol Aging. Author manuscript; available in PMC 2013 March 25.
NIH
-PA Author Manuscript
NIH
-PA Author Manuscript
NIH
-PA Author Manuscript

Timofeev I, Steriade M. Low-frequency rhythms in the thalamus of intact-cortex and decorticated cats.Journal of Neurophysiology. 1996; 76(6):4152–4168. [PubMed: 8985908]
Tononi G, Cirelli C. Sleep and synaptic homeostasis: a hypothesis. Brain Res Bull. 2003; 62(2):143–150. [PubMed: 14638388]
Webb WB, Dreblow LM. A modified method for scoring slow wave sleep of older subjects. Sleep.1982; 5(2):195–199. [PubMed: 7100748]
Wennberg RA, Lozano AM. Intracranial volume conduction of cortical spikes and sleep potentialsrecorded with deep brain stimulating electrodes. Clin Neurophysiol. 2003; 114(8):1403–1418.[PubMed: 12888022]
Colrain et al. Page 12
Neurobiol Aging. Author manuscript; available in PMC 2013 March 25.
NIH
-PA Author Manuscript
NIH
-PA Author Manuscript
NIH
-PA Author Manuscript

Figure 1.Age distribution of the sample. Histograms reflect the number of men (black) and women(gray) in each decade, with the count displayed on the left Y axis. The unfilled trianglesreflect the mean age per decade of men and unfilled squares the mean age per decade ofwomen, with the age values plotted on the right hand Y axis.
Colrain et al. Page 13
Neurobiol Aging. Author manuscript; available in PMC 2013 March 25.
NIH
-PA Author Manuscript
NIH
-PA Author Manuscript
NIH
-PA Author Manuscript

Figure 2.KC incidence (proportion of stimuli producing a K-complex) as a function of age. Datarepresent one point per subject, with the solid line indicating the linear regression functionfitted to the data.
Colrain et al. Page 14
Neurobiol Aging. Author manuscript; available in PMC 2013 March 25.
NIH
-PA Author Manuscript
NIH
-PA Author Manuscript
NIH
-PA Author Manuscript

Figure 3.Grand mean waveforms for each decade. In each set of waveforms data are plotted withnegative voltages up the Y axis.
Colrain et al. Page 15
Neurobiol Aging. Author manuscript; available in PMC 2013 March 25.
NIH
-PA Author Manuscript
NIH
-PA Author Manuscript
NIH
-PA Author Manuscript

Figure 4.N550 amplitude as a function of age at each electrode site. Data represent one point persubject, with the solid line indicating the linear regression function fitted to the data.
Colrain et al. Page 16
Neurobiol Aging. Author manuscript; available in PMC 2013 March 25.
NIH
-PA Author Manuscript
NIH
-PA Author Manuscript
NIH
-PA Author Manuscript

Figure 5.P2 amplitude as a function of age at each electrode site. Data represent one point per subject,with the solid line indicating the linear regression function fitted to the data.
Colrain et al. Page 17
Neurobiol Aging. Author manuscript; available in PMC 2013 March 25.
NIH
-PA Author Manuscript
NIH
-PA Author Manuscript
NIH
-PA Author Manuscript

Figure 6.P2 latency as a function of age at each electrode site. Data represent one point per subject,with the solid line indicating the linear regression function fitted to the data.
Colrain et al. Page 18
Neurobiol Aging. Author manuscript; available in PMC 2013 March 25.
NIH
-PA Author Manuscript
NIH
-PA Author Manuscript
NIH
-PA Author Manuscript

NIH
-PA Author Manuscript
NIH
-PA Author Manuscript
NIH
-PA Author Manuscript
Colrain et al. Page 19
Tabl
e 1
Lin
ear
regr
essi
on a
naly
sis
for
age
with
N55
0, P
2, a
nd P
900
ampl
itude
and
late
ncy
at e
ach
elec
trod
e si
te.
N55
0P
2P
900
R2
Slop
eR
2Sl
ope
R2
Slop
e
Am
plitu
deFz
0.49
0***
1.52
40.
115*
*0.
172
0.05
00.
307
FCz
0.57
3***
1.45
80.
133*
*0.
208
0.06
2*0.
294
Cz
0.58
7***
1.32
80.
089*
0.19
00.
066*
0.25
9
CPz
0.51
9***
1.44
40.
027
0.09
00.
053
0.05
5
Pz0.
485*
**0.
987
0.01
00.
050
0.00
4−
0.07
2
Lat
ency
Fz0.
068*
1.04
90.
262*
**1.
196
0.00
1−
0.24
6
FCz
0.04
80.
978
0.28
2***
1.30
20.
006
−0.
633
Cz
0.06
0*0.
1.15
00.
263*
**1.
305
0.00
3−
0.63
3
CPz
0.04
61.
076
0.26
3***
1.30
50.
008
−0.
633
Pz0.
012
0.63
90.
218*
**1.
243
0.00
4−
0.68
2
* p <
0.05
,
**p
<0.
01,
*** p
<0.
001.
Neurobiol Aging. Author manuscript; available in PMC 2013 March 25.