
Sizing first flush pollutant loading of stormwater runoff in tropical urban catchments
14
1 23 Environmental Earth Sciences ISSN 1866-6280 Volume 72 Number 10 Environ Earth Sci (2014) 72:4047-4058 DOI 10.1007/s12665-014-3294-6 Sizing first flush pollutant loading of stormwater runoff in tropical urban catchments Ming Fai Chow & Zulkifli Yusop
Transcript of Sizing first flush pollutant loading of stormwater runoff in tropical urban catchments

1 23
Environmental Earth Sciences ISSN 1866-6280Volume 72Number 10 Environ Earth Sci (2014) 72:4047-4058DOI 10.1007/s12665-014-3294-6
Sizing first flush pollutant loading ofstormwater runoff in tropical urbancatchments
Ming Fai Chow & Zulkifli Yusop

1 23
Your article is protected by copyright and
all rights are held exclusively by Springer-
Verlag Berlin Heidelberg. This e-offprint is
for personal use only and shall not be self-
archived in electronic repositories. If you wish
to self-archive your article, please use the
accepted manuscript version for posting on
your own website. You may further deposit
the accepted manuscript version in any
repository, provided it is only made publicly
available 12 months after official publication
or later and provided acknowledgement is
given to the original source of publication
and a link is inserted to the published article
on Springer's website. The link must be
accompanied by the following text: "The final
publication is available at link.springer.com”.

ORIGINAL ARTICLE
Sizing first flush pollutant loading of stormwater runoff in tropicalurban catchments
Ming Fai Chow • Zulkifli Yusop
Received: 9 May 2013 / Accepted: 16 April 2014 / Published online: 5 May 2014
� Springer-Verlag Berlin Heidelberg 2014
Abstract This study aimed at investigating the first flush
phenomenon from residential, commercial and industrial
catchments. Stormwater was grab sampled and the flow
rate was measured during 52 storm events. The dimen-
sionless cumulative pollutant mass and runoff volume were
used to determine the runoff volume needed to transport 50
and 80 % of total pollutant mass. Almost all the constitu-
ents did not satisfy this first flush definition except for total
suspended solids (TSS) in the commercial catchment. The
averages first runoff volume required to remove 50 and
80 % of the total pollutant mass were 37 and 67, 35 and 65,
and 36 and 64 % for the residential, commercial and
industrial catchments, respectively. It seemed that less
runoff is required to transport the same amount of pollutant
loadings in tropical urban catchments than in temperate
regions. BOD, COD, NH3-N, SRP and TP consistently
showed strong first flush effects in all catchments. The first
flush strengths of TSS, BOD, COD, NH3-N and TP in the
commercial catchment were strongly correlated with total
rainfall, rainfall duration, max 5 min intensity, runoff
volume and peak flow, but not with antecedent dry days.
Management of the first 10 mm runoff depth would be able
to capture about half of the total pollutant mass in storm-
water runoff that would otherwise goes to drains.
Keywords First flush � Pollutant loading � Stormwater �Mass-based first flush
Introduction
First flush is defined as a disproportionately high delivery
of either concentration or mass of a stormwater pollutant
during the early part of a storm runoff event (Sansalone and
Cristina 2004). First flush of various stormwater pollutants
has been studied in several countries, for example in Italy
(Gnecco et al. 2006), Korea (Kim et al. 2007), Los
Angeles, USA (Kang et al. 2008), Japan (Lee et al. 2005)
and Australia (McCarthy 2009). In most studies, the first
flush effect of stormwater pollutant was assessed qualita-
tively by using the dimensionless cumulative pollutant load
vs. cumulative runoff volume curves (e.g., Deletic and
Maksimovic 1998; Lee and Bang 2000; Sansalone and
Cristina 2004; McCarthy 2009; Chow et al. 2011). How-
ever, the terms ‘‘disproportionately high delivery’’ and
‘‘early part of a storm’’ are not defined precisely. There-
fore, a more quantitative definition of first flush effect has
been proposed based on a threshold ratio of percentage of
cumulative pollutant mass over percentage of cumulative
runoff volume (%M/%V). For example, 40–60/25 (Vorre-
iter and Hickey 1994), 40/20 (Deletic 1998), 50/25
(Wanielista and Yousef 1993), 80/30 (Bertrand-Krajewski
et al. 1998) and 80/20 (Stahre and Urbonas 1990) of
M/V ratios were applied. However, the first flush definitions
were proposed based on studies in temperate climate. On
the other hand, first flush phenomenon is complex and site
M. F. Chow
Center for Sustainable Technology and Environment,
College of Engineering, Universiti Tenaga Nasional (UNITEN),
Jalan IKRAM-UNITEN, 43000 Kajang, Selangor, Malaysia
M. F. Chow (&)
Research Center for Environmental Changes (RCEC),
Academia Sinica, 128 Academia Road, Section 2,
Nankang, Taipei 115, Taiwan
e-mail: [email protected]
Z. Yusop
Institute of Environmental and Water Resources Management,
Universiti Teknologi Malaysia (UTM), 81310 Skudai,
Johor Darul Ta’zim, Malaysia
123
Environ Earth Sci (2014) 72:4047–4058
DOI 10.1007/s12665-014-3294-6
Author's personal copy
specific (Taebi and Droste 2004; Kim et al. 2005; Deng
et al. 2005), thus could not be precisely defined by using a
universal set of climate, rainfall and runoff characteristics,
or universal types of regression curves (Bertrand-Krajew-
ski et al. 1998).
Various combinations of factors may be responsible for
the occurrence of first flush events. A strong first flush
phenomenon is usually more prevalent in small catchments
with high imperviousness (Lee and Bang 2000; Ma et al.
2002; Lee et al. 2002; Sansalone and Cristina 2004; Li
et al. 2007). Other factors that govern first flush are max-
imum rainfall intensity (Gupta and Saul 1996; Deletic
1998; Taebi and Droste 2004; Huang et al. 2007; Li et al.
2007), antecedent dry day (Gupta and Saul 1996; Deletic
and Maksimovic 1998; Soller et al. 2005; Li et al. 2007;
Huang et al. 2007), and rainfall duration (Gupta and Saul
1996; Taebi and Droste 2004). However, some studies
found no or weak correlation between first flush against
mean rainfall intensity and antecedent dry days (Saget et al.
1996; Deletic 1998; Lee et al. 2002; Han et al. 2006),
rainfall depth and duration (Deletic 1998) and catchment
characteristics like area, time of concentration, and average
slope (Saget et al. 1996; Lee et al. 2002). There are some
reasons for inconsistency of first flush, which include
insufficient stormwater sample, especially on the rising
limb of the hydrograph. Besides rapid rise in water level,
large variations in the concentration of constituents further
complicate the sampling exercise. Insufficient number of
sample is also common in the latter half of a storm event
because the recession time is much longer especially for a
large catchment. Consequently, many stormwater studies
failed to establish full assessment of first flush effect
because the pollutant’s peak concentration was missed
(Deletic 1998). Another reason for inconsistency in
reporting first flush phenomenon is due to differences in the
sampling protocol. As highlighted by Sansalone and Cri-
stina (2004), a widely spaced time interval of sample col-
lection across the hydrograph will not give an accurate
mass transport during the event. Unaccounted first flush
samples would usually lead to an underestimation of pol-
lutant loading rate.
Rainfall characteristic and land use could significantly
influence the stormwater quality and transport patterns of
constituents in urban catchment (Gan et al. 2008;
Munksgaard and Lottermoser 2010; Bian et al. 2011; Beck
and Birch 2012; Wang et al. 2013). Most of the related
studies have been carried out in developed countries under
temperate climate and there is still a lack of information for
urban catchments in tropical countries. This issue is
important because the rainfall pattern and distribution in
the tropics are different from those in the temperate. Short
and intense storms which are common in the tropics tend to
produce highly polluted runoff at the beginning of a storm
event. The site-specific characteristics of first flush suggest
that it is essential to have local data for assessing first flush
phenomenon. Therefore, the objectives of this study were:
(1) to determine the influence of first flush on the behavior
of stormwater constituents; (2) to determine the critical
amount of runoff volume for first flush; and (3) to deter-
mine the relationships between first flush strength and
storm characteristics. Quantitative characterization of first
flush at different land uses could provide necessary data to
evaluate the first flush phenomenon, relate impacts to best
management practices design and performance, and assess
impacts on water quality.
Methodology
Study sites and climate
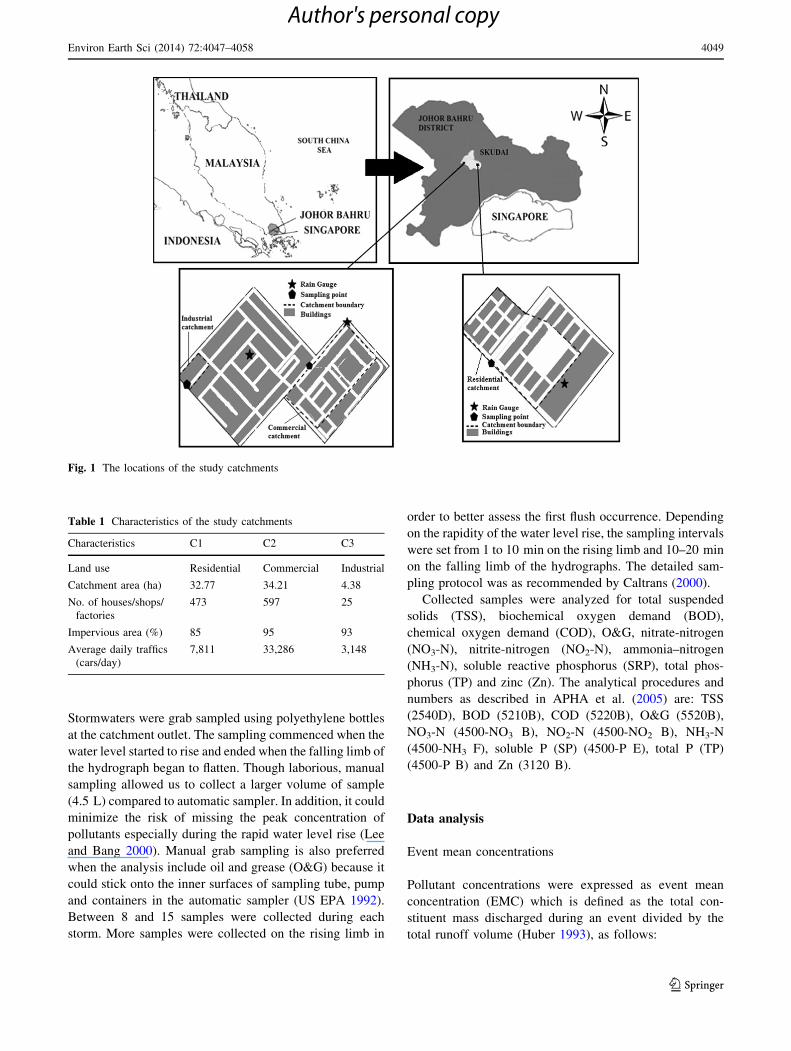
Stormwaters were sampled at three different land uses,
namely residential, commercial and industrial catchments
in Johor, Malaysia (Fig. 1). Based on 62 years data from a
nearby (about 18 km) rainfall station, the mean annual
rainfall in this region was 2,417 mm, mean intensity was
2.7 mm/h and mean number of rainy days was 175 per
year. The median and mean dry days were 2 and 2.65,
respectively. On a yearly basis, the mean maximum con-
tinuous dry day was 15.56 and the median was 14 days.
All the study catchments are located within 3 km from
Universiti Teknologi Malaysia (UTM). This proximity has
provided enough time for our sampling teams to standby at
the study sites when a storm was expected to occur. The
residential catchment (C1) has an underground stormwater
drainage system, whereas the commercial (C2) and
industrial (C3) catchments have open channel system.
Inflow of groundwater into the drain is possible but this
was not quantified. None of these catchments have waste-
water treatment plant within it, thus the effect of land use
could be easily singled out. The detailed characteristics of
the catchments are summarized in Table 1.
Storm flow sampling
Rainfall in each catchment was measured by a HOBO tip-
ping bucket rain gauge (Model RG3) with resolution of
0.2 mm per tip. The rain gauges were maintained and ser-
viced weekly, during which data were retrieved using
‘‘BoxCar’’ software. During sampling of the first three
storm events, streamflow was measured using a current
meter (Model SWOFFER 2100). A staff gauge was also
installed to manually record the water level during sam-
pling. A stage-discharge rating curve was then developed
for each catchment to facilitate the conversion of water
level readings into flow rate for the subsequent samplings.
4048 Environ Earth Sci (2014) 72:4047–4058
123
Author's personal copy
Stormwaters were grab sampled using polyethylene bottles
at the catchment outlet. The sampling commenced when the
water level started to rise and ended when the falling limb of
the hydrograph began to flatten. Though laborious, manual
sampling allowed us to collect a larger volume of sample
(4.5 L) compared to automatic sampler. In addition, it could
minimize the risk of missing the peak concentration of
pollutants especially during the rapid water level rise (Lee
and Bang 2000). Manual grab sampling is also preferred
when the analysis include oil and grease (O&G) because it
could stick onto the inner surfaces of sampling tube, pump
and containers in the automatic sampler (US EPA 1992).
Between 8 and 15 samples were collected during each
storm. More samples were collected on the rising limb in
order to better assess the first flush occurrence. Depending
on the rapidity of the water level rise, the sampling intervals
were set from 1 to 10 min on the rising limb and 10–20 min
on the falling limb of the hydrographs. The detailed sam-
pling protocol was as recommended by Caltrans (2000).
Collected samples were analyzed for total suspended
solids (TSS), biochemical oxygen demand (BOD),
chemical oxygen demand (COD), O&G, nitrate-nitrogen
(NO3-N), nitrite-nitrogen (NO2-N), ammonia–nitrogen
(NH3-N), soluble reactive phosphorus (SRP), total phos-
phorus (TP) and zinc (Zn). The analytical procedures and
numbers as described in APHA et al. (2005) are: TSS
(2540D), BOD (5210B), COD (5220B), O&G (5520B),
NO3-N (4500-NO3 B), NO2-N (4500-NO2 B), NH3-N
(4500-NH3 F), soluble P (SP) (4500-P E), total P (TP)
(4500-P B) and Zn (3120 B).
Data analysis
Event mean concentrations
Pollutant concentrations were expressed as event mean
concentration (EMC) which is defined as the total con-
stituent mass discharged during an event divided by the
total runoff volume (Huber 1993), as follows:
Fig. 1 The locations of the study catchments
Table 1 Characteristics of the study catchments
Characteristics C1 C2 C3
Land use Residential Commercial Industrial
Catchment area (ha) 32.77 34.21 4.38
No. of houses/shops/
factories
473 597 25
Impervious area (%) 85 95 93
Average daily traffics
(cars/day)
7,811 33,286 3,148
Environ Earth Sci (2014) 72:4047–4058 4049
123
Author's personal copy

EMC =M
V¼R T
0QðtÞCðtÞdtR T
0QðtÞdt
ð1Þ
where, M is total pollutant mass (g), V is total runoff volume
(m3), Q(t) is time varying flow rate (m3/s), C(t) is time varying
pollutant concentration (g/m3), T is total duration of runoff (s).
Mass-based first flush (MBFF)
Mass-based first flush (MBFF) is a ratio of cumulative
mass to the cumulative flow volume (dimensionless) as
described by Ma et al. (2002). MBFF ratio for stormwater
constituent can be calculated by Eq. (2).
MBFFn ¼
R t
0CðtÞQðtÞdt
MR t
0QðtÞdt
V
ð2Þ
where t is lapsed flow time (min) corresponding to n %
total flow volume, C(t) is concentration of pollutant at time
t (mg/L), Q(t) is runoff flow rate at time t, M is total pol-
lutant mass (kg), V is total flow volume (m3). First flush
phenomenon occurs if MBFF is [1.0 (Ma et al. 2002).
First flush strength
The first flush strength was quantified by relating the
cumulative pollutant mass to cumulative runoff volume
using a power function as follows:
m tð Þ ¼ v tð Þ½ �b ð3Þ
where m(t) is normalized dimensionless cumulative mass;
v(t) is normalized dimensionless cumulative runoff volume,
and b is a power function. The power function was log
transformed to yield a linear regression as shown in Eq. (4):
ln m tð Þ ¼ b lnv tð Þ ð4Þ
where the b coefficient becomes the slope term from the
linear regression model. The y-intercept was fixed to zero
to ensure that 100 % of the pollutant load equals 100 % of
the runoff volume. A value of 1 corresponds to the 45�bisector line which represents uniform pollutant loading
throughout the event. A lower slope (smaller b value)
represents a stronger first flush effect, while a steeper slope
(larger b value) represents a weaker first flush effect. Slope
values above 1 indicate a dilution effect (Saget et al. 1996;
Bertrand-Krajewski et al. 1998).
Results and discussion
Storm characteristics
A total of 18 storm/rainfall events were sampled at the
residential catchment, and 17 events each at the
commercial and industrial catchments from March 2008 to
June 2009. The statistical summary of rainfall variables,
namely rainfall depth (Rd), duration (Rdur), hourly mean
intensity (I), max 5 min intensity (Imax5) and antecedent
dry days (ADD) are given in Table 2. These events rep-
resent frequent or common storms in the study area, having
return periods of \1 year and mostly fall within the
3 month intensity duration frequency (IDF) curve with
intensity of 33 mm/h (DID 2000). The stormflow durations
range from 0.18 to 2.5 h for the residential catchment,
0.23–4.85 h for the commercial catchment and 0.37–2.16 h
for the industrial catchment.
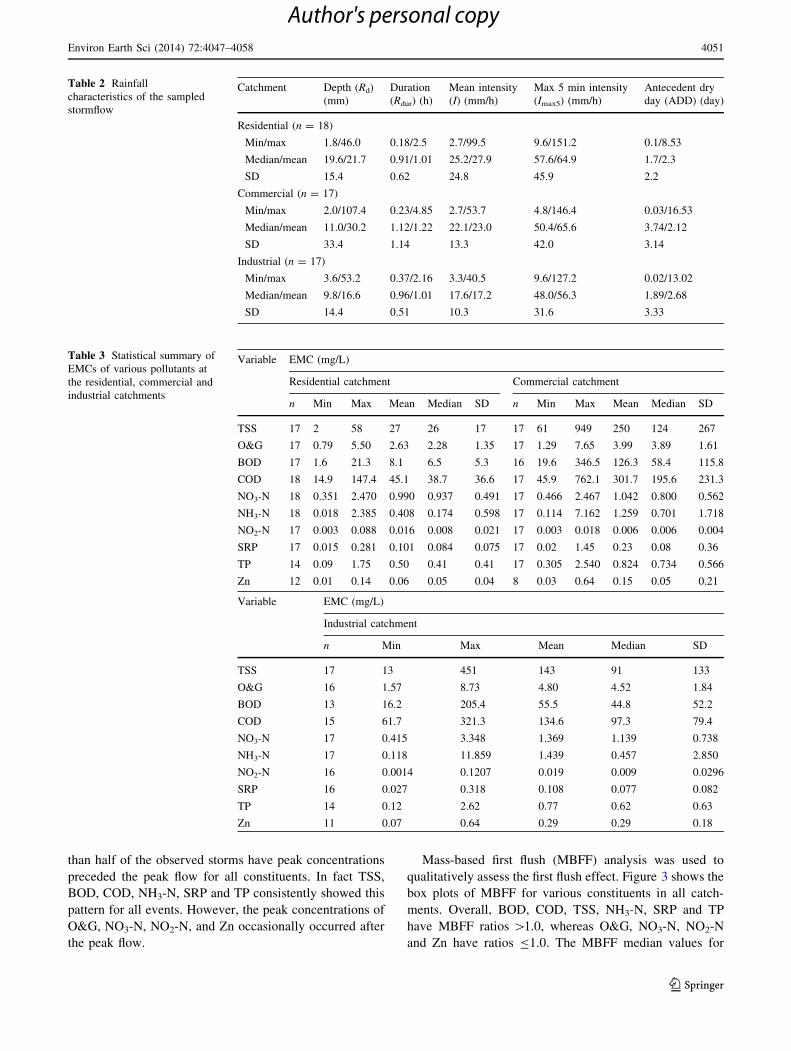
Event mean concentration (EMC)
The statistical summary of EMCs from 52 storm events is
presented in Table 3. The commercial catchment recorded
the highest means EMC for BOD, COD, TSS, SRP and TP.
The sources of high concentrations of BOD and COD in
the commercial catchment were most likely from wash-off
of food waste and sullage from restaurants. In total, there
are 54 restaurants operating in the commercial catchment.
According to Bannerman et al. (1993), streets are critical
source areas of stormwater pollutant in almost any land
use. On the other hand, parking lots are probably critical
source of solids in the commercial and industrial areas. The
commercial catchment has the highest traffic volume and
parking lots compared to the other two catchments.
Therefore, the high EMC value of TSS for the commercial
catchment is rather expected. Brezonik and Stadelmann
(2002) in Minnesota, USA, also found higher EMCs of
TSS and COD for commercial/industrial catchments than a
residential catchment. As for the industrial catchment, the
highest means EMC were observed for O&G, NO3-N,
NH3-N, NO2-N and Zn. Chang et al. (2004) in Texas found
a significant source of Zn from roof. Most factories in the
industrial catchment use galvanized iron roofs. The
industrial catchment also exhibits the highest EMC for
O&G compared to the other two catchments. The possible
sources of O&G were mainly from lubricant, used for
industrial machines and vehicles. In central Taiwan, Chong
et al. (2012) stated that pollutants from individual pre-
treatment plants could accumulate in storm drains before
being flushed by the subsequent storm.
First flush analysis
Hydrographs and pollutographs for each storm event were
plotted in order to assess first flush effect. Figure 2 shows
examples of pollutographs for NH3-N, TSS and O&G on
15 May 2009 at the residential catchment. The peak con-
centrations of TSS and NH3-N occurred before the peak
flow while for O&G, it coincided with the peak flow. More
4050 Environ Earth Sci (2014) 72:4047–4058
123
Author's personal copy
than half of the observed storms have peak concentrations
preceded the peak flow for all constituents. In fact TSS,
BOD, COD, NH3-N, SRP and TP consistently showed this
pattern for all events. However, the peak concentrations of
O&G, NO3-N, NO2-N, and Zn occasionally occurred after
the peak flow.
Mass-based first flush (MBFF) analysis was used to
qualitatively assess the first flush effect. Figure 3 shows the
box plots of MBFF for various constituents in all catch-
ments. Overall, BOD, COD, TSS, NH3-N, SRP and TP
have MBFF ratios [1.0, whereas O&G, NO3-N, NO2-N
and Zn have ratios B1.0. The MBFF median values for
Table 2 Rainfall
characteristics of the sampled
stormflow
Catchment Depth (Rd)
(mm)
Duration
(Rdur) (h)
Mean intensity
(I) (mm/h)
Max 5 min intensity
(Imax5) (mm/h)
Antecedent dry
day (ADD) (day)
Residential (n = 18)
Min/max 1.8/46.0 0.18/2.5 2.7/99.5 9.6/151.2 0.1/8.53
Median/mean 19.6/21.7 0.91/1.01 25.2/27.9 57.6/64.9 1.7/2.3
SD 15.4 0.62 24.8 45.9 2.2
Commercial (n = 17)
Min/max 2.0/107.4 0.23/4.85 2.7/53.7 4.8/146.4 0.03/16.53
Median/mean 11.0/30.2 1.12/1.22 22.1/23.0 50.4/65.6 3.74/2.12
SD 33.4 1.14 13.3 42.0 3.14
Industrial (n = 17)
Min/max 3.6/53.2 0.37/2.16 3.3/40.5 9.6/127.2 0.02/13.02
Median/mean 9.8/16.6 0.96/1.01 17.6/17.2 48.0/56.3 1.89/2.68
SD 14.4 0.51 10.3 31.6 3.33
Table 3 Statistical summary of
EMCs of various pollutants at
the residential, commercial and
industrial catchments
Variable EMC (mg/L)
Residential catchment Commercial catchment
n Min Max Mean Median SD n Min Max Mean Median SD
TSS 17 2 58 27 26 17 17 61 949 250 124 267
O&G 17 0.79 5.50 2.63 2.28 1.35 17 1.29 7.65 3.99 3.89 1.61
BOD 17 1.6 21.3 8.1 6.5 5.3 16 19.6 346.5 126.3 58.4 115.8
COD 18 14.9 147.4 45.1 38.7 36.6 17 45.9 762.1 301.7 195.6 231.3
NO3-N 18 0.351 2.470 0.990 0.937 0.491 17 0.466 2.467 1.042 0.800 0.562
NH3-N 18 0.018 2.385 0.408 0.174 0.598 17 0.114 7.162 1.259 0.701 1.718
NO2-N 17 0.003 0.088 0.016 0.008 0.021 17 0.003 0.018 0.006 0.006 0.004
SRP 17 0.015 0.281 0.101 0.084 0.075 17 0.02 1.45 0.23 0.08 0.36
TP 14 0.09 1.75 0.50 0.41 0.41 17 0.305 2.540 0.824 0.734 0.566
Zn 12 0.01 0.14 0.06 0.05 0.04 8 0.03 0.64 0.15 0.05 0.21
Variable EMC (mg/L)
Industrial catchment
n Min Max Mean Median SD
TSS 17 13 451 143 91 133
O&G 16 1.57 8.73 4.80 4.52 1.84
BOD 13 16.2 205.4 55.5 44.8 52.2
COD 15 61.7 321.3 134.6 97.3 79.4
NO3-N 17 0.415 3.348 1.369 1.139 0.738
NH3-N 17 0.118 11.859 1.439 0.457 2.850
NO2-N 16 0.0014 0.1207 0.019 0.009 0.0296
SRP 16 0.027 0.318 0.108 0.077 0.082
TP 14 0.12 2.62 0.77 0.62 0.63
Zn 11 0.07 0.64 0.29 0.29 0.18
Environ Earth Sci (2014) 72:4047–4058 4051
123
Author's personal copy

TSS and NH3-N showed obvious decreases as the storms
progress, while O&G, NO3-N, NO2-N and Zn were rela-
tively constant throughout the storm episode. A decreasing
trend in MBBF with cumulative runoff suggests dilution of
pollutant concentration over time. The pollution load
transported by the first 30 % of runoff volume (MBFF30)
was used as a benchmark to evaluate the magnitude of first
flush (Li et al. 2007; Nazahiyah et al. 2007). The MBFF30
median values for TSS were 1.5, 2.1 and 2.0 at the resi-
dential, commercial and industrial catchments, respec-
tively. These correspond to removals of 45, 63 and 60 % of
the total loadings by the first 30 % of the runoff volume.
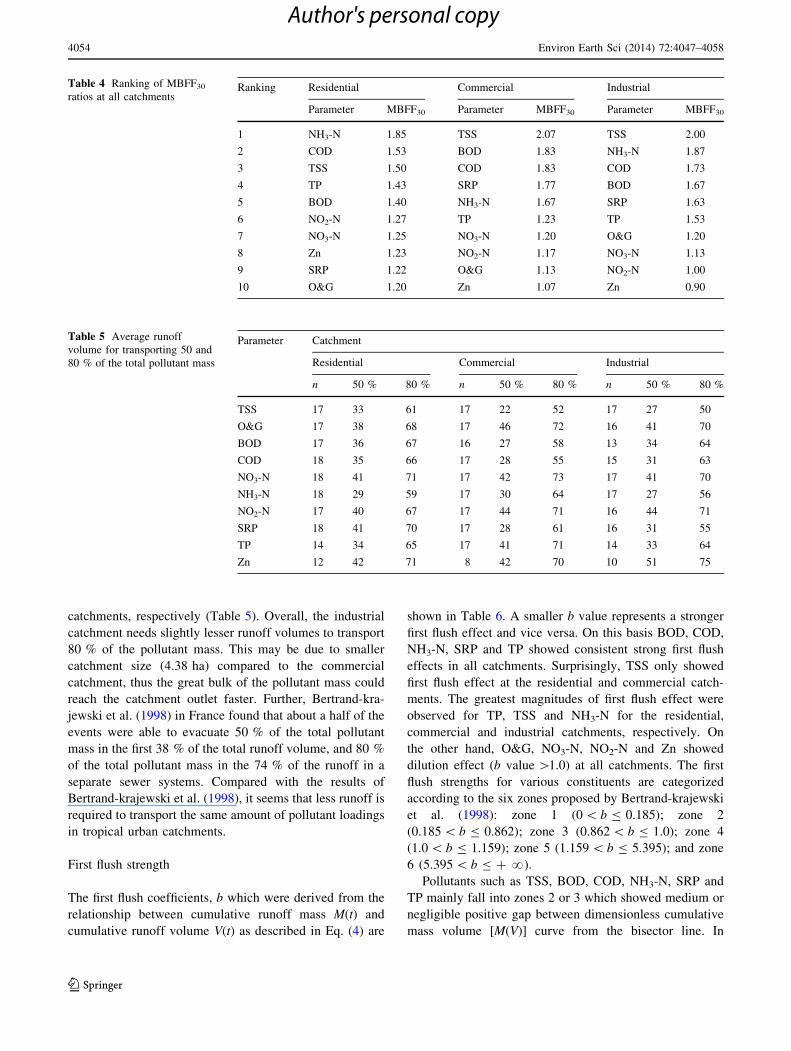
The MBFF30 ratios for various pollutants were ranked by
their median values as shown in Table 4. Higher loadings
of NH3-N were observed in the first 30 % of runoff volume
at the residential site. The high variation among the
MBFF30 values indicates that the pollutant wash-off
mechanism was influenced by other factors besides rainfall.
The means MBFF30 for BOD, COD, TSS, O&G, NH3-N
and TP were 44, 45, 46, 40, 52 and 44 %, respectively.
These values are lower compared to those reported by Li
et al. (2007) in a catchment with a combined sewer net-
work in Wuhan City, China, who found means MBFF30 of
62.4 % for TSS and 59.4 % for COD.
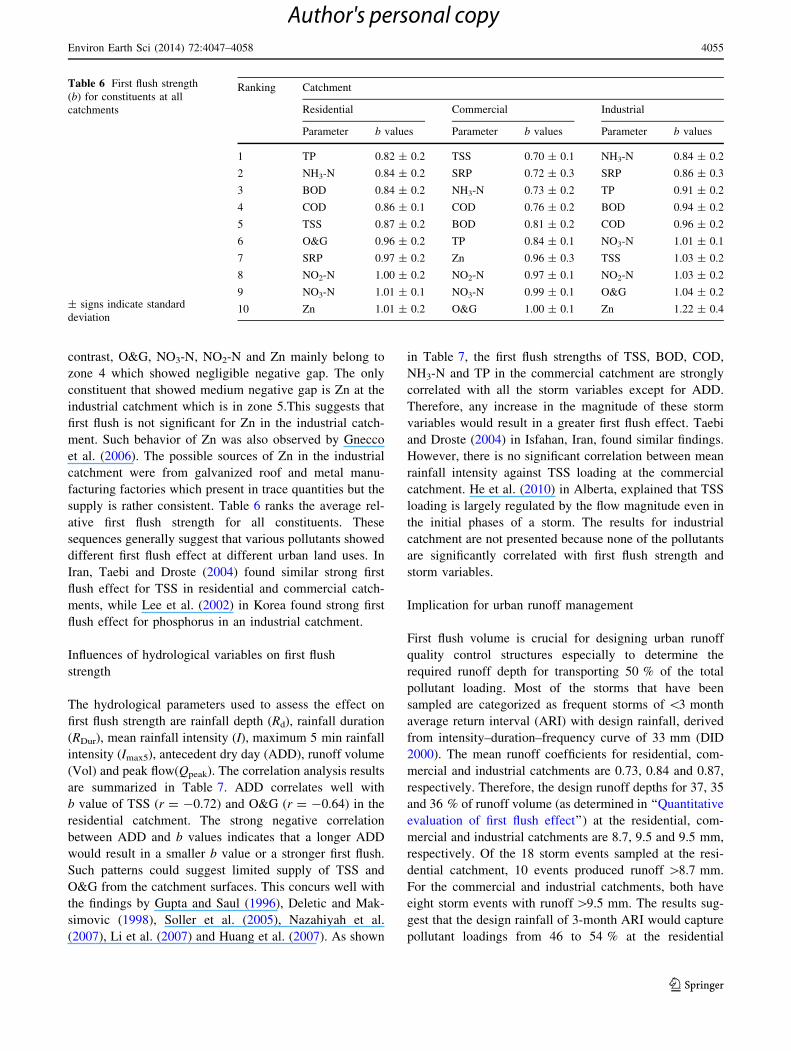
Quantitative evaluation of first flush effect
The criterion of 50 % total mass transported by the first
25 % of total runoff as described by Wanielista and Yousef
(1993) was used to assess the occurrence of first flush
phenomenon. Only TSS at the commercial catchment has
met this criterion which requires about 22 % of the first
runoff volume (Table 5). First flush occurrence was most
prevalent for TSS, comprises 71 % of the storm events,
followed by SRP (53 %) and the least for O&G, NO2-N
and TP (about 6 % each). On the other hand, NO3-N did
not show any first flush and this is consistent with finding
by Wanielista and Yousef (1993). The frequency of first
flush in this study is quite different from a highway in
Mount Rainier, MD, USA (Flint and Davis 2007). As
shown in Table 5, the average runoff for transporting 50 %
of the pollutant masses ranged from 22 to 51 %. For the
commercial catchment, O&G, NO3-N, NO2-N, TP and Zn
required about 43 % of the total runoff, whereas BOD,
COD, TSS, NH3-N, and SRP required\30 % of the runoff.
Based on this criterion, TSS showed the strongest first flush
while TP the least. Similarly, Batroney et al. (2010) found
a strong first flush of TSS from a parking area but not for
TP. For the residential catchment, 33 % of the first runoff
volume was needed to remove 50 % of the total TSS
loading and the highest, 41 % was observed for NO3-N
(Table 5). Earlier, in a nearby residential catchment, Na-
zahiyah et al. (2007) found that the first 20–30 % of runoff
volume was able to transport from 15 to 78 % of the TSS
loading, 20–59 % for BOD, 15–69 % for COD, 14–49 %
for NO3-N, 23–53 % for NH3-N, 14–19 % for NO2-N, and
23–43 % for TP. Nazahiyah et al. (2007) also observed a
higher TSS loading in the first flush volume which could be
attributed to sediment sources from less pervious surfaces
near the catchment outlet. Using this definition, the per-
centages of first flush occurrence in the residential catch-
ment were 50 % for NH3-N, 17 % for TSS, 14 % for TP,
between 11 and 12 % for O&G, BOD, COD, NO2-N, and
SRP, and 8 % for Zn. For NH3-N, the first flush effect was
only prevalent in the residential catchment.
As for the industrial catchment, more than 50 % of the
storm events have met the first flush criterion for TSS. On
the other hand, O&G, NO3-N, NO2-N and Zn required
about 44 % of the total runoff volume whereas BOD, COD,
TSS, NH3-N, SRP and TP required about 30 % to transport
50 % of their pollutant masses. On averages, the first runoff
volumes required to remove 50 % of the pollutant mass
were 37, 35 and 36 % for the residential, commercial and
industrial catchments, respectively.
A more stringent first flush definition (80/30) as pro-
posed by Bertrand-Krajewski et al. (1998) was also eval-
uated in this study. However, only two storm events for
TSS and one event for NH3-N at the industrial catchment,
and one event each for TSS and NH3-N at the residential
catchment have met this criterion. On average, the runoff
required to transport 80 % of the pollutant mass were 67,
65 and 64 % for the residential, commercial and industrial
Fig. 2 Hydrograph and
pollutographs of NH3-N, TSS
and O&G on 15 May 2009 at
the residential catchment
4052 Environ Earth Sci (2014) 72:4047–4058
123
Author's personal copy
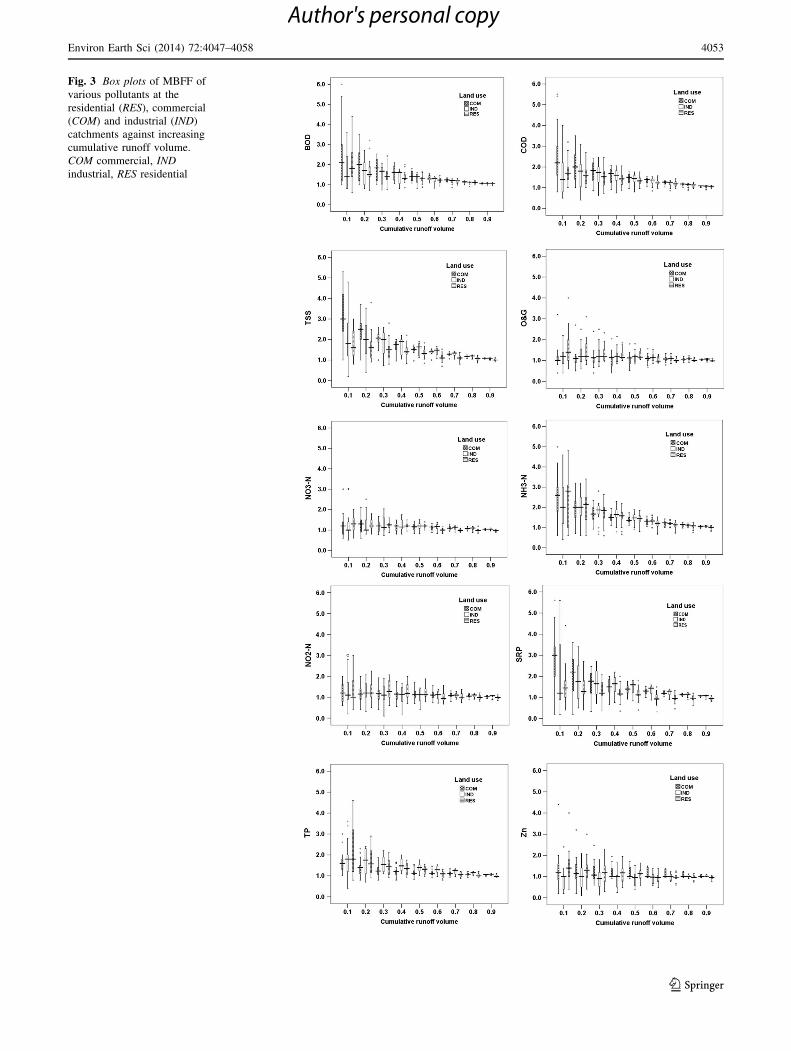
Fig. 3 Box plots of MBFF of
various pollutants at the
residential (RES), commercial
(COM) and industrial (IND)
catchments against increasing
cumulative runoff volume.
COM commercial, IND
industrial, RES residential
Environ Earth Sci (2014) 72:4047–4058 4053
123
Author's personal copy
catchments, respectively (Table 5). Overall, the industrial
catchment needs slightly lesser runoff volumes to transport
80 % of the pollutant mass. This may be due to smaller
catchment size (4.38 ha) compared to the commercial
catchment, thus the great bulk of the pollutant mass could
reach the catchment outlet faster. Further, Bertrand-kra-
jewski et al. (1998) in France found that about a half of the
events were able to evacuate 50 % of the total pollutant
mass in the first 38 % of the total runoff volume, and 80 %
of the total pollutant mass in the 74 % of the runoff in a
separate sewer systems. Compared with the results of
Bertrand-krajewski et al. (1998), it seems that less runoff is
required to transport the same amount of pollutant loadings
in tropical urban catchments.
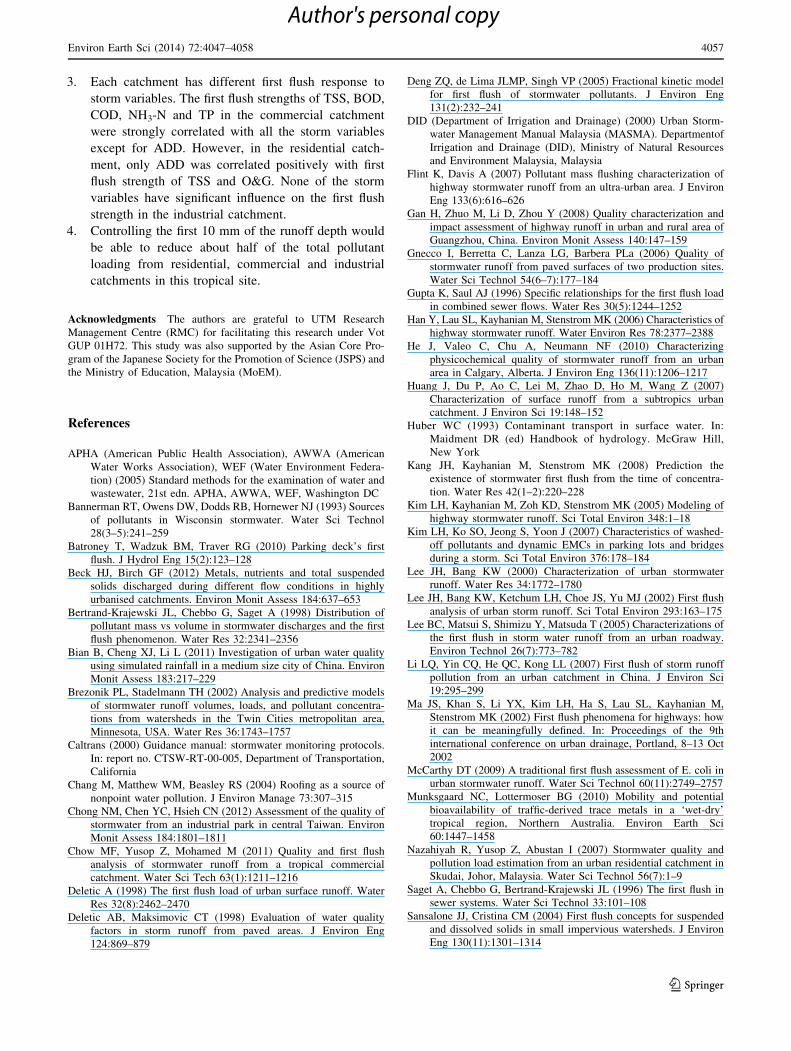
First flush strength
The first flush coefficients, b which were derived from the
relationship between cumulative runoff mass M(t) and
cumulative runoff volume V(t) as described in Eq. (4) are
shown in Table 6. A smaller b value represents a stronger
first flush effect and vice versa. On this basis BOD, COD,
NH3-N, SRP and TP showed consistent strong first flush
effects in all catchments. Surprisingly, TSS only showed
first flush effect at the residential and commercial catch-
ments. The greatest magnitudes of first flush effect were
observed for TP, TSS and NH3-N for the residential,
commercial and industrial catchments, respectively. On
the other hand, O&G, NO3-N, NO2-N and Zn showed
dilution effect (b value [1.0) at all catchments. The first
flush strengths for various constituents are categorized
according to the six zones proposed by Bertrand-krajewski
et al. (1998): zone 1 (0 \ b B 0.185); zone 2
(0.185 \ b B 0.862); zone 3 (0.862 \ b B 1.0); zone 4
(1.0 \ b B 1.159); zone 5 (1.159 \ b B 5.395); and zone
6 (5.395 \ b B ? ?).
Pollutants such as TSS, BOD, COD, NH3-N, SRP and
TP mainly fall into zones 2 or 3 which showed medium or
negligible positive gap between dimensionless cumulative
mass volume [M(V)] curve from the bisector line. In
Table 4 Ranking of MBFF30
ratios at all catchmentsRanking Residential Commercial Industrial
Parameter MBFF30 Parameter MBFF30 Parameter MBFF30
1 NH3-N 1.85 TSS 2.07 TSS 2.00
2 COD 1.53 BOD 1.83 NH3-N 1.87
3 TSS 1.50 COD 1.83 COD 1.73
4 TP 1.43 SRP 1.77 BOD 1.67
5 BOD 1.40 NH3-N 1.67 SRP 1.63
6 NO2-N 1.27 TP 1.23 TP 1.53
7 NO3-N 1.25 NO3-N 1.20 O&G 1.20
8 Zn 1.23 NO2-N 1.17 NO3-N 1.13
9 SRP 1.22 O&G 1.13 NO2-N 1.00
10 O&G 1.20 Zn 1.07 Zn 0.90
Table 5 Average runoff
volume for transporting 50 and
80 % of the total pollutant mass
Parameter Catchment
Residential Commercial Industrial
n 50 % 80 % n 50 % 80 % n 50 % 80 %
TSS 17 33 61 17 22 52 17 27 50
O&G 17 38 68 17 46 72 16 41 70
BOD 17 36 67 16 27 58 13 34 64
COD 18 35 66 17 28 55 15 31 63
NO3-N 18 41 71 17 42 73 17 41 70
NH3-N 18 29 59 17 30 64 17 27 56
NO2-N 17 40 67 17 44 71 16 44 71
SRP 18 41 70 17 28 61 16 31 55
TP 14 34 65 17 41 71 14 33 64
Zn 12 42 71 8 42 70 10 51 75
4054 Environ Earth Sci (2014) 72:4047–4058
123
Author's personal copy
contrast, O&G, NO3-N, NO2-N and Zn mainly belong to
zone 4 which showed negligible negative gap. The only
constituent that showed medium negative gap is Zn at the
industrial catchment which is in zone 5.This suggests that
first flush is not significant for Zn in the industrial catch-
ment. Such behavior of Zn was also observed by Gnecco
et al. (2006). The possible sources of Zn in the industrial
catchment were from galvanized roof and metal manu-
facturing factories which present in trace quantities but the
supply is rather consistent. Table 6 ranks the average rel-
ative first flush strength for all constituents. These
sequences generally suggest that various pollutants showed
different first flush effect at different urban land uses. In
Iran, Taebi and Droste (2004) found similar strong first
flush effect for TSS in residential and commercial catch-
ments, while Lee et al. (2002) in Korea found strong first
flush effect for phosphorus in an industrial catchment.
Influences of hydrological variables on first flush
strength
The hydrological parameters used to assess the effect on
first flush strength are rainfall depth (Rd), rainfall duration
(RDur), mean rainfall intensity (I), maximum 5 min rainfall
intensity (Imax5), antecedent dry day (ADD), runoff volume
(Vol) and peak flow(Qpeak). The correlation analysis results
are summarized in Table 7. ADD correlates well with
b value of TSS (r = -0.72) and O&G (r = -0.64) in the
residential catchment. The strong negative correlation
between ADD and b values indicates that a longer ADD
would result in a smaller b value or a stronger first flush.
Such patterns could suggest limited supply of TSS and
O&G from the catchment surfaces. This concurs well with
the findings by Gupta and Saul (1996), Deletic and Mak-
simovic (1998), Soller et al. (2005), Nazahiyah et al.
(2007), Li et al. (2007) and Huang et al. (2007). As shown
in Table 7, the first flush strengths of TSS, BOD, COD,
NH3-N and TP in the commercial catchment are strongly
correlated with all the storm variables except for ADD.
Therefore, any increase in the magnitude of these storm
variables would result in a greater first flush effect. Taebi
and Droste (2004) in Isfahan, Iran, found similar findings.
However, there is no significant correlation between mean
rainfall intensity against TSS loading at the commercial
catchment. He et al. (2010) in Alberta, explained that TSS
loading is largely regulated by the flow magnitude even in
the initial phases of a storm. The results for industrial
catchment are not presented because none of the pollutants
are significantly correlated with first flush strength and
storm variables.
Implication for urban runoff management
First flush volume is crucial for designing urban runoff
quality control structures especially to determine the
required runoff depth for transporting 50 % of the total
pollutant loading. Most of the storms that have been
sampled are categorized as frequent storms of \3 month
average return interval (ARI) with design rainfall, derived
from intensity–duration–frequency curve of 33 mm (DID
2000). The mean runoff coefficients for residential, com-
mercial and industrial catchments are 0.73, 0.84 and 0.87,
respectively. Therefore, the design runoff depths for 37, 35
and 36 % of runoff volume (as determined in ‘‘Quantitative
evaluation of first flush effect’’) at the residential, com-
mercial and industrial catchments are 8.7, 9.5 and 9.5 mm,
respectively. Of the 18 storm events sampled at the resi-
dential catchment, 10 events produced runoff [8.7 mm.
For the commercial and industrial catchments, both have
eight storm events with runoff [9.5 mm. The results sug-
gest that the design rainfall of 3-month ARI would capture
pollutant loadings from 46 to 54 % at the residential
Table 6 First flush strength
(b) for constituents at all
catchments
± signs indicate standard
deviation
Ranking Catchment
Residential Commercial Industrial
Parameter b values Parameter b values Parameter b values
1 TP 0.82 ± 0.2 TSS 0.70 ± 0.1 NH3-N 0.84 ± 0.2
2 NH3-N 0.84 ± 0.2 SRP 0.72 ± 0.3 SRP 0.86 ± 0.3
3 BOD 0.84 ± 0.2 NH3-N 0.73 ± 0.2 TP 0.91 ± 0.2
4 COD 0.86 ± 0.1 COD 0.76 ± 0.2 BOD 0.94 ± 0.2
5 TSS 0.87 ± 0.2 BOD 0.81 ± 0.2 COD 0.96 ± 0.2
6 O&G 0.96 ± 0.2 TP 0.84 ± 0.1 NO3-N 1.01 ± 0.1
7 SRP 0.97 ± 0.2 Zn 0.96 ± 0.3 TSS 1.03 ± 0.2
8 NO2-N 1.00 ± 0.2 NO2-N 0.97 ± 0.1 NO2-N 1.03 ± 0.2
9 NO3-N 1.01 ± 0.1 NO3-N 0.99 ± 0.1 O&G 1.04 ± 0.2
10 Zn 1.01 ± 0.2 O&G 1.00 ± 0.1 Zn 1.22 ± 0.4
Environ Earth Sci (2014) 72:4047–4058 4055
123
Author's personal copy

catchment, 28–62 % at the commercial catchment, and
43–72 % at the industrial catchment (Table 8). This ana-
lysis demonstrates that controlling the first 10 mm of the
runoff depth would capture about half of the total pollutant
loading that would otherwise enter the streams.
Conclusions
This study characterized first flush phenomenon in tropical
urban catchments and provides basis for designing runoff
quality control facilities. The important findings are con-
cluded as follows:
1. Strong first flush effects (MBFF [ 1.0) were observed
for BOD, COD, NH3-N, SRP and TP at all catchments.
TSS showed strong first flush effect only at the
residential and commercial catchments. On the other
hand, O&G, NO3-N, NO2-N and Zn showed weak or
no first flush effect at all catchments. Based on
MBFF30 analysis, the degree of first flush, at the
residential catchment was in the order NH3-N [ COD
[ TSS[TP[ BOD[NO2-N [NO3-N[ Zn [SRP
[O&G; commercial catchment—TSS [BOD &COD [ SRP [ NH3-N [ TP [ NO3-N [ NO2-N [O&G; and industrial catchment—TSS [ NH3-N
[ COD [ BOD [ SRP [ TP [ O&G [ NO3-N [NO2-N [ Zn.
2. On average, in order to transport 50 and 80 % of the
total pollutant mass, the corresponding runoff vol-
umes required are 37 and 67 % for the residential
catchment, 35–65 % for the commercial catchment
and 36–64 % for the industrial catchment. Appar-
ently, for the same amount of loadings, tropical
urban catchments need less runoff volume to trans-
port the pollutant compared to in the temperate
regions.
Table 7 Correlation
coefficients between first flush
strength (b value) and storm
characteristics for various
pollutants
* Correlation is significant at
P \ 0.05
** Correlation is significant at
P \ 0.01
Parameters Storm variable
Rd RDur I Imax5 ADD Vol Qpeak
Residential catchment
TSS -0.72**
O&G -0.64**
Commercial catchment
TSS -0.61** -0.70** -0.60* -0.60* -0.64**
BOD -0.76** -0.75** -0.77** -0.77** -0.81**
COD -0.64** -0.57* -0.74** -0.62** -0.76**
NH3-N -0.66** -0.54* -0.57* -0.65** -0.66**
SRP -0.51* -0.50* -0.55*
TP -0.57* -0.59* -0.65** -0.57* -0.69**
Table 8 Estimates of pollutant
loading (%) transported by
3 month design runoff volume
n number of sampled storm with
runoff greater than the design
runoff, cv coefficient of
variation, NA not applicable due
to small sample size
Catchment BOD COD TSS O&G NO3-N NH3-N NO2-N SRP TP
Residential
n 9 10 10 10 10 10 9 10 7
Mean 46 52 50 47 47 54 47 49 54
SD 11 20 21 17 16 23 13 18 21
cv 25 39 42 36 34 43 26 36 39
Commercial
n 8 8 8 8 8 8 8 8 8
Mean 60 59 62 28 32 52 30 54 36
SD 19 22 20 20 26 20 28 25 22
cv 31 38 32 73 80 38 94 46 62
Industrial
n NA 8 8 7 8 8 8 7 NA
Mean NA 62 71 51 57 65 55 61 NA
SD NA 16 15 19 16 14 24 24 NA
cv NA 27 21 36 27 21 43 40 NA
4056 Environ Earth Sci (2014) 72:4047–4058
123
Author's personal copy
3. Each catchment has different first flush response to
storm variables. The first flush strengths of TSS, BOD,
COD, NH3-N and TP in the commercial catchment
were strongly correlated with all the storm variables
except for ADD. However, in the residential catch-
ment, only ADD was correlated positively with first
flush strength of TSS and O&G. None of the storm
variables have significant influence on the first flush
strength in the industrial catchment.
4. Controlling the first 10 mm of the runoff depth would
be able to reduce about half of the total pollutant
loading from residential, commercial and industrial
catchments in this tropical site.
Acknowledgments The authors are grateful to UTM Research
Management Centre (RMC) for facilitating this research under Vot
GUP 01H72. This study was also supported by the Asian Core Pro-
gram of the Japanese Society for the Promotion of Science (JSPS) and
the Ministry of Education, Malaysia (MoEM).
References
APHA (American Public Health Association), AWWA (American
Water Works Association), WEF (Water Environment Federa-
tion) (2005) Standard methods for the examination of water and
wastewater, 21st edn. APHA, AWWA, WEF, Washington DC
Bannerman RT, Owens DW, Dodds RB, Hornewer NJ (1993) Sources
of pollutants in Wisconsin stormwater. Water Sci Technol
28(3–5):241–259
Batroney T, Wadzuk BM, Traver RG (2010) Parking deck’s first
flush. J Hydrol Eng 15(2):123–128
Beck HJ, Birch GF (2012) Metals, nutrients and total suspended
solids discharged during different flow conditions in highly
urbanised catchments. Environ Monit Assess 184:637–653
Bertrand-Krajewski JL, Chebbo G, Saget A (1998) Distribution of
pollutant mass vs volume in stormwater discharges and the first
flush phenomenon. Water Res 32:2341–2356
Bian B, Cheng XJ, Li L (2011) Investigation of urban water quality
using simulated rainfall in a medium size city of China. Environ
Monit Assess 183:217–229
Brezonik PL, Stadelmann TH (2002) Analysis and predictive models
of stormwater runoff volumes, loads, and pollutant concentra-
tions from watersheds in the Twin Cities metropolitan area,
Minnesota, USA. Water Res 36:1743–1757
Caltrans (2000) Guidance manual: stormwater monitoring protocols.
In: report no. CTSW-RT-00-005, Department of Transportation,
California
Chang M, Matthew WM, Beasley RS (2004) Roofing as a source of
nonpoint water pollution. J Environ Manage 73:307–315
Chong NM, Chen YC, Hsieh CN (2012) Assessment of the quality of
stormwater from an industrial park in central Taiwan. Environ
Monit Assess 184:1801–1811
Chow MF, Yusop Z, Mohamed M (2011) Quality and first flush
analysis of stormwater runoff from a tropical commercial
catchment. Water Sci Tech 63(1):1211–1216
Deletic A (1998) The first flush load of urban surface runoff. Water
Res 32(8):2462–2470
Deletic AB, Maksimovic CT (1998) Evaluation of water quality
factors in storm runoff from paved areas. J Environ Eng
124:869–879
Deng ZQ, de Lima JLMP, Singh VP (2005) Fractional kinetic model
for first flush of stormwater pollutants. J Environ Eng
131(2):232–241
DID (Department of Irrigation and Drainage) (2000) Urban Storm-
water Management Manual Malaysia (MASMA). Departmentof
Irrigation and Drainage (DID), Ministry of Natural Resources
and Environment Malaysia, Malaysia
Flint K, Davis A (2007) Pollutant mass flushing characterization of
highway stormwater runoff from an ultra-urban area. J Environ
Eng 133(6):616–626
Gan H, Zhuo M, Li D, Zhou Y (2008) Quality characterization and
impact assessment of highway runoff in urban and rural area of
Guangzhou, China. Environ Monit Assess 140:147–159
Gnecco I, Berretta C, Lanza LG, Barbera PLa (2006) Quality of
stormwater runoff from paved surfaces of two production sites.
Water Sci Technol 54(6–7):177–184
Gupta K, Saul AJ (1996) Specific relationships for the first flush load
in combined sewer flows. Water Res 30(5):1244–1252
Han Y, Lau SL, Kayhanian M, Stenstrom MK (2006) Characteristics of
highway stormwater runoff. Water Environ Res 78:2377–2388
He J, Valeo C, Chu A, Neumann NF (2010) Characterizing
physicochemical quality of stormwater runoff from an urban
area in Calgary, Alberta. J Environ Eng 136(11):1206–1217
Huang J, Du P, Ao C, Lei M, Zhao D, Ho M, Wang Z (2007)
Characterization of surface runoff from a subtropics urban
catchment. J Environ Sci 19:148–152
Huber WC (1993) Contaminant transport in surface water. In:
Maidment DR (ed) Handbook of hydrology. McGraw Hill,
New York
Kang JH, Kayhanian M, Stenstrom MK (2008) Prediction the
existence of stormwater first flush from the time of concentra-
tion. Water Res 42(1–2):220–228
Kim LH, Kayhanian M, Zoh KD, Stenstrom MK (2005) Modeling of
highway stormwater runoff. Sci Total Environ 348:1–18
Kim LH, Ko SO, Jeong S, Yoon J (2007) Characteristics of washed-
off pollutants and dynamic EMCs in parking lots and bridges
during a storm. Sci Total Environ 376:178–184
Lee JH, Bang KW (2000) Characterization of urban stormwater
runoff. Water Res 34:1772–1780
Lee JH, Bang KW, Ketchum LH, Choe JS, Yu MJ (2002) First flush
analysis of urban storm runoff. Sci Total Environ 293:163–175
Lee BC, Matsui S, Shimizu Y, Matsuda T (2005) Characterizations of
the first flush in storm water runoff from an urban roadway.
Environ Technol 26(7):773–782
Li LQ, Yin CQ, He QC, Kong LL (2007) First flush of storm runoff
pollution from an urban catchment in China. J Environ Sci
19:295–299
Ma JS, Khan S, Li YX, Kim LH, Ha S, Lau SL, Kayhanian M,
Stenstrom MK (2002) First flush phenomena for highways: how
it can be meaningfully defined. In: Proceedings of the 9th
international conference on urban drainage, Portland, 8–13 Oct
2002
McCarthy DT (2009) A traditional first flush assessment of E. coli in
urban stormwater runoff. Water Sci Technol 60(11):2749–2757
Munksgaard NC, Lottermoser BG (2010) Mobility and potential
bioavailability of traffic-derived trace metals in a ‘wet-dry’
tropical region, Northern Australia. Environ Earth Sci
60:1447–1458
Nazahiyah R, Yusop Z, Abustan I (2007) Stormwater quality and
pollution load estimation from an urban residential catchment in
Skudai, Johor, Malaysia. Water Sci Technol 56(7):1–9
Saget A, Chebbo G, Bertrand-Krajewski JL (1996) The first flush in
sewer systems. Water Sci Technol 33:101–108
Sansalone JJ, Cristina CM (2004) First flush concepts for suspended
and dissolved solids in small impervious watersheds. J Environ
Eng 130(11):1301–1314
Environ Earth Sci (2014) 72:4047–4058 4057
123
Author's personal copy

Soller J, Stephenson J, Olivieri K, Downing J, Olivieri AW (2005)
Evaluation of seasonal scale first flush pollutant loading and
implications for urban runoff management. J Environ Manage
76(4):309–318
Stahre P, Urbonas B (1990) Stormwater detention for drainage, water
quality and CSO management. Prentice-Hall, Englewood Cliffs
Taebi A, Droste RL (2004) Pollution loads in urban runoff and
sanitary sewer. Sci Total Environ 327:175–184
US EPA (1992) National Pollution Discharge Elimination System
(NPDES) sampling guidance document. EPA 833-8-92-001.
Office of Water Enforcement and Compliance, US EPA,
Washington DC
Vorreiter L, Hickey C (1994) Incidence of the first flush phenomenon
in catchments of the Sydney region. In: Proceedings of the
National Conference Publication—Institution of Engineers
3:359–364
Wang L, Liang T, Zhang Q (2013) Laboratory experiments of
phosphorus loss with surface runoff during simulated runoff.
Environ Earth Sci. doi:10.1007/s12665-013-2344-9
Wanielista M, Yousef YA (1993) Stormwater Management. John
Wiley & Sons, New York
4058 Environ Earth Sci (2014) 72:4047–4058
123
Author's personal copy