Welfare and Distributional Implications of Shale Gas - Brookings
Upload
independentCategory
view
1download
0
Single- Versus Dual-Process Models of Lexical Decision Performance:Insights From Response Time Distributional Analysis
Melvin J. Yap and David A. BalotaWashington University
Michael J. CorteseCollege of Charleston
Jason M. WatsonUniversity of Utah
This article evaluates 2 competing models that address the decision-making processes mediating wordrecognition and lexical decision performance: a hybrid 2-stage model of lexical decision performance anda random-walk model. In 2 experiments, nonword type and word frequency were manipulated across 2contrasts (pseudohomophone–legal nonword and legal–illegal nonword). When nonwords became morewordlike (i.e., BRNTA vs. BRANT vs. BRANE), response latencies to nonwords were slowed and the wordfrequency effect increased. More important, distributional analyses revealed that the Nonword Type �Word Frequency interaction was modulated by different components of the response time distribution,depending on the specific nonword contrast. A single-process random-walk model was able to accountfor this particular set of findings more successfully than the hybrid 2-stage model.
Keywords: lexical decision, nonword type, word frequency, visual word recognition
The study of the processes underlying isolated visual wordrecognition is a major endeavor in experimental psychology andhas provided insights in domains as diverse as psycholinguistics,pattern recognition, computational modeling, attention, and neu-roscience. Although many procedures have been developed forstudying word recognition, the speeded lexical decision task (LDT;Rubenstein, Garfield, & Millikan, 1970) remains one of the mostwidely used tasks (e.g., Murray & Forster, 2004; Ratcliff, Gomez,& McKoon, 2004). In this task, participants are presented with aletter string and are required to decide as quickly as possiblewhether the string forms a word or nonword, most typically witha keypress response. Findings obtained in the LDT have been very
influential in informing models of word recognition (e.g., Colt-heart, Rastle, Perry, Langdon, & Ziegler, 2001).
A number of models have been proposed to accommodatelexical decision performance (see Ratcliff et al., 2004, for a recentreview). For example, the classic logogen model (Morton, 1969)posits word detectors (logogens) for every lexical entry. When aword (e.g., DOG) is presented, the logogen for DOG accumulatesevidence until some threshold is reached and word identificationtakes place. The original logogen model could not handle non-words, but more recent extensions to the model can carry out alexical decision. For example, Grainger and Jacob’s (1996) mul-tiple read-out model (MROM) implements three processes thatdrive a lexical decision response. Word responses are producedwhen either the activation level of a single lexical representation(local activity) or the summed activation levels of all lexicalrepresentations (global activity) exceed their respective thresholds.Nonword responses are produced when lexical activity does notreach threshold after some (variable) time deadline. The dual-routecascaded (DRC) model (Coltheart et al., 2001) adopts essentiallythe same principles to accommodate performance in the LDT. It isimportant to note, for these two examples, that the speed andaccuracy of lexical decision responses are yoked to the activity ofthe word representations contained in the models’ lexicons. Lex-ical decisions have also been instantiated in parallel distributedprocessing (PDP) reading models, which contain distributed or-thographic and semantic representations (Plaut, 1997). In the latterframework, words or nonwords that are presented to the modelgenerate varying degrees of stress values, which reflect how se-mantically familiar they are. A decision criterion can then beadopted that allows the model to discriminate between words(stress values higher than criterion) and nonwords (stress valueslower than criterion). This approach assumes that lexical decision
Melvin J. Yap and David A. Balota, Department of Psychology, Wash-ington University; Michael J. Cortese, Department of Psychology, Collegeof Charleston; Jason M. Watson, Department of Psychology, University ofUtah.
Michael J. Cortese is now at the Psychology Department, University ofNebraska at Omaha.
Melvin J. Yap and David A. Balota contributed equally to this projectand share lead authorship. Portions of this research were presented at the45th Annual Meeting of the Psychonomic Society, November 2004, Min-neapolis, Minnesota. This research was supported by National Institute ofAging Grant AG03991 and National Science Foundation Grant BCS0001801 to David A. Balota.
We thank Max Coltheart and Kathleen Rastle for their helpful commentson earlier versions of this article. We are also grateful to Roger Ratcliff andJeff Rouder for assistance in various stages of this project. Finally, we alsoextend thanks to Tassy Hayden, Justin Horn, Anuj Shah, and Stephanie Tofor their help with data collection.
Correspondence concerning this article should be addressed to David A.Balota, Department of Psychology, Washington University, St. Louis, MO63130. E-mail: [email protected]
Journal of Experimental Psychology: Copyright 2006 by the American Psychological AssociationHuman Perception and Performance2006, Vol. 32, No. 6, 1324–1344
0096-1523/06/$12.00 DOI: 10.1037/0096-1523.32.6.1324
1324

performance is driven by the activity of (distributed)representations.
In this article, we focus on two different approaches to lexicaldecision that emphasize the decision processes tied to lexicaldecision. Two models that specifically address the decision-making processes that mediate word identification and behavioralresponses are the two-stage model of lexical decision performance(Balota & Chumbley, 1984; Balota & Spieler, 1999) and thediffusion model (Ratcliff et al., 2004). It is important to note thatboth frameworks have been used extensively in accommodatingdata in binary decision tasks, ranging from memory scanning(Atkinson & Juola, 1974) to episodic memory retrieval (Ratcliff,1978). Moreover, both the two-stage model and the diffusionmodel have been shown to successfully accommodate basic lexicaldecision phenomena. It is interesting to note, though, that thesetwo models are built on very different premises. The diffusionmodel assumes that a single process can drive lexical decision,whereas the two-stage model suggests that there are two qualita-tively distinct processes. Whether lexical decision is better accom-modated by a single- or a dual-process model is another instanceof a broader distinction across a wide variety of domains (see, e.g.,Yonelinas, 2002). Just as the debate between proponents of thesetwo theoretical approaches has ramifications beyond psycholin-guistics, the answer to the proposed question gives greater leveragein understanding how binary decisions are carried out in general.In this article, we explore this issue systematically. We begin byexamining some interesting constraints in lexical decision perfor-mance, then describe the two classes of models, and finally quan-titatively evaluate which approach accommodates the results fromtwo experiments more successfully.
Interaction Between Nonword Type and Word Frequency
A critical variable that has been investigated in lexical decisionperformance is the similarity of the nonwords to real words.Nonwords can be pronounceable and orthographically legal (e.g.,FLIRP), unpronounceable and orthographically illegal (e.g., RPFLI),or homophonous with real words (e.g., BRANE). As one mightexpect, nonword type powerfully modulates lexical decision laten-cies for word trials and also produces interactive effects with othervariables that influence lexical decision performance. For exam-ple, the word-frequency effect (faster lexical decision latencies forfrequently encountered words) is strongly modulated by the typeof nonword context.
Stone and Van Orden (1993) systematically manipulated non-word type and word frequency in lexical decision and observed thepattern presented in Table 1. As nonwords become more similar towords, two trends are apparent. Lexical decision word latenciesbecome slower, and, more intriguingly, the word-frequency effectbecomes larger. Stone and Van Orden interpreted these results asconsistent with both a pathway selection framework and a random-walk framework. The pathway selection framework proposes thatthe lexical processing system consists of independent processingmodules that are interconnected by pathways. Manipulating thenature of the nonwords alters the task context, and the systemstrategically selects the pathways that optimize task performance.More relevantly for this article, the results were also accommo-dated within a random-walk framework. The random-walk modelhas been useful for describing various aspects of binary decisions
(Ratcliff & Rouder, 1998) and is a member of a more general classof sequential sampling models. The random-walk perspective con-ceptualizes lexical decision as an evidence-accumulating process.When a stimulus is presented, noisy information is accumulatedover time toward one of two possible decision boundaries, word ornonword in the case of LDT (see Figure 1). A word response isproduced when the accumulation process reaches the word bound-ary; a nonword response is produced when the accumulationprocess reaches the nonword boundary. For the simplest random-walk model, two parameters are of interest: the signal strength andthe response criterion. Signal strength refers to the rate of evidenceaccumulation and is greater for stimuli that are processed moreefficiently (e.g., high-frequency words). The response criterionrefers to the distance of the boundaries from the start point;increasing the response boundaries reflects more conservative re-sponse criteria.
Using this simple random-walk model, Stone and Van Orden(1993) argued that there is a linearly decreasing concave functionbetween signal strength and the amount of time needed to reachcriterion (see Figure 2), that is, the same change in signal strengthhas a greater impact on response times (RTs) when signal strengthis lower compared with when signal strength is higher. The inter-action between nonword type and word frequency is predicted bythis function. Low-frequency words have lower signal strengthsthan high-frequency words. When nonwords become more word-like (e.g., from BRONE to BRANE), word–nonword discriminationbecomes more difficult. The signal strengths of both low- andhigh-frequency words decrease, leading to longer decision times. Itis important to note that because of the concave function, word-frequency effects are larger in the pseudohomophone conditionthan in the legal nonword condition, mimicking the pattern pre-sented in Table 1. Putatively, this account also explains whyword-frequency effects are larger in the legal nonword conditionthan in the illegal nonword condition. It is important to note,though, that Stone and Van Orden’s data were examined at thelevel of the mean and there was no explicit implementation of thismodel. Hence, it was a descriptive account of the pattern observedin the means. As shown below, analyzing the same data at the levelof distributional characteristics may yield further insights that areneither apparent nor intuitive.
An alternative account of the Nonword Type � Word Fre-quency interaction is provided by Balota and Chumbley’s (1984)two-process model, which is based on Atkinson and Juola’s (1974)
Table 1Means of Participants’ Mean Lexical Decision Response Times(in Milliseconds) as a Function of Word Frequency andNonword Type
Wordfrequency
Illegal nonwords(RPFLI)
Legal nonwords(FLIRP)
Pseudohomophones(BRANE)
Low 578 697 867High 542 621 707Effect 36 76 160
Note. Data reproduced from “Strategic Control of Processing in WordRecognition,” by G. O. Stone and G. C. Van Orden, 1993, Journal ofExperimental Psychology: Human Perception and Performance, 19, p.753. Copyright 1993 by the American Psychological Association.
1325SINGLE- VERSUS DUAL-PROCESS MODELS

two-stage model of memory search. The application of this frame-work to lexical decision performance is displayed in Figure 3. Thismodel was originally advanced as an account of task-specificeffects in lexical decision (Balota & Chumbley, 1984) and was
motivated by the observation that frequency effects are different insize across lexical decision, naming, and category classification,three tasks that presumably tap the same word identification pro-cess. Balota and Chumbley found that frequency effects werelargest in lexical decision and argued that this pattern was likelydue to the fact that the frequency effect reflects both word iden-tification processes and the word–nonword discrimination processthat is specific to that task.
Balota and Chumbley (1984) suggested that words and non-words could be conceived as reflecting two underlying distribu-tions that vary along a familiarity–meaningfulness (FM) dimen-sion. Participants can use two types of information to make lexicaldecisions. The first is a relatively fast-acting familiarity-basedsignal and the second is a slower, more attention-demandingsignal, which may involve explicitly checking the spelling of thestimulus. Low-frequency words are particularly sensitive to vari-ables that modulate the checking process because low-frequencywords are more likely to overlap with the nonwords on the FMdimension. Hence, as one increases the overlap between the twodistributions by making the nonwords more similar to the words,this further increases the checking process for the low-frequencywords, thereby slowing these items. Therefore, greater checkingwill occur for low-frequency words when these items are embed-ded in lists with pseudohomophones, compared with legal non-words. Moreover, the smallest amount of checking will occur forlow-frequency words when these items are embedded in lists withillegal nonwords because the nonword distribution will overlapvery little with the word distribution. Hence, the two-stage modelalso accommodates Stone and Van Orden’s (1993) NonwordType � Word Frequency interaction by assuming two distinctprocesses instead of a single random-walk process. In addition, theframework was able to qualitatively account for other lexical
Figure 1. Illustration of the diffusion model. The different slopes reflecta diffusion process, which is the continuous version of the random-walkmodel. Z refers to the starting point, and the point at which the slopeintersects with the word or nonword boundary is the time taken for adecision (word or nonword) to be made. T � the point at which processingterminates. From “Modeling Response Times for Two-Choice Decisions,”by R. Ratcliff and J. F. Rouder, 1998, Psychological Science, 9, p. 348.Copyright 1998 by the American Psychological Society. Adapted withpermission.
Figure 2. The concave function between signal strength and finishingtimes in the random-walk model. LF � low frequency; HF � highfrequency. From “Strategic Control of Processing in Word Recognition,”by G. O. Stone and G. C. Van Orden, 1993, Journal of ExperimentalPsychology: Human Perception and Performance, 19, p. 765. Copyright1993 by the American Psychological Association. Adapted with permis-sion.
Figure 3. The two-stage model of lexical decision performance. FM �familiarity–meaningfulness. From “Are Lexical Decisions a Good Measureof Lexical Access? The Role of Word Frequency in the Neglected DecisionStage,” by D. A. Balota and J. I. Chumbley, 1984, Journal of ExperimentalPsychology: Human Perception and Performance, 10, p. 352. Copyright1984 by the American Psychological Association. Reprinted with permis-sion.
1326 YAP, BALOTA, CORTESE, AND WATSON
decision effects (e.g., blocking effects and repetition effects) thatwere troublesome for certain extant word recognition models.
Beyond Measures of Central Tendency
In standard chronometric studies, a set of RTs for a particularexperimental condition is collected for each participant. Typically,the mean of those response times (MRT) is then computed, withMRT providing an estimate of the central tendency for that condi-tion. Of course, it is possible that variables do not simply shift theRT distribution, as implicitly assumed by analyses based onmeans; variables may also change the shape of the distribution.Hence, when possible, it is also useful to investigate the influenceof a variable on the shape (e.g., variance, skew) of a distribution(Andrews & Heathcote, 2001; Heathcote, Popiel, & Mewhort,1991; Yap & Balota, in press). For example, fitting the ex-Gaussian function to data (Hohle, 1965; Luce, 1986; Ratcliff,1979) allows researchers to estimate how different variables shift,skew, or shift and skew RT distributions. An ex-Gaussian analysischaracterizes an RT distribution by assuming an explicit model forthe shape of the distribution. This model is a convolution of thenormal (Gaussian) and exponential distributions and has threeparameters: �, the mean of the normal distribution; �2, the vari-ance of the normal distribution; and �, a reflection of the mean andstandard deviation of the exponential distribution. In addition toproviding unusually good fits to positively skewed empirical RTdistributions (Luce, 1986, p. 439), one useful consequence ofex-Gaussian analysis is that the algebraic sum of � and � isapproximately equivalent to the mean when one estimates param-eters from empirical data (� and � are exactly equal to the mean inthe theoretical ex-Gaussian model). Briefly, this property allowsdifferences in means to be conveniently partitioned into two com-ponents: a component that is associated with distributional shifting(�) and a component that is associated with distributional skewing(�). There are at least two other reasons why such a distributionalanalysis might be valuable.
First, Heathcote et al. (1991) pointed out that analyzing meanRTs can often be inadequate and misleading because such ananalysis does not consider the shape of the RT distributions. Forexample, they examined Stroop color-naming performance withboth traditional and ex-Gaussian analyses. On the basis of meanresponse latencies, there was no difference between the congruent(RED displayed in red) and baseline (XXX displayed in red)conditions. This suggests that congruency has no effect on colornaming, relative to the baseline. However, ex-Gaussian analysesrevealed that naming RTs in the congruent condition were facili-tated (faster than baseline) in � but inhibited (slower than baseline)in �. In this instance, congruency shifted the RT distributionleftward while increasing its skew. These two effects cancelledeach other out, spuriously producing null effects of congruency(see Spieler, Balota, & Faust, 1996, for a replication of thistrade-off).
Second, by exploiting more of the information available in a RTdistribution, one can make increasingly sophisticated predictionsabout how a variable might modulate the shape of a distribution,rather than just asking whether a variable has an effect in meanRTs. This is useful when one is trying to adjudicate between twomodels. Models may be indistinguishable at the level of the mean
but make different predictions at the level of the RT distribution(see Hockley, 1984; Mewhort, Braun, & Heathcote, 1992).
The two experiments reported in this article represent an exten-sion of Stone and Van Orden’s (1993) Experiment 1, with non-word type (legal nonwords, illegal nonwords, and pseudohomo-phones) and word frequency (high and low) factoriallymanipulated in a lexical decision task. To obtain a sufficientnumber of observations to provide adequate estimates of RTdistributional characteristics, we collected 100 observations foreach of the cells for each participant. Experiment 1 examined thecontrast between legal nonwords (e.g., FLIRP) and pseudohomo-phones (e.g., BRANE), whereas Experiment 2 examined the con-trast between illegal nonwords (e.g., RPFLI) and legal nonwords.It is important to note that we examine the joint effects of the twovariables on RT distributional properties, using both ex-Gaussiananalysis and a nonparametric technique called vincentizing, de-scribed in the Results section of Experiment 1. Following theempirical section, we describe and implement the two modelingframeworks and then test which framework better accommodatesthe observed effects, both at the level of the mean and at the levelof distributional characteristics.
Experiment 1
Method
Participants. A total of 75 young adults (mean age � 19.2 years, SD �1.65) participated in this experiment for course credit. All participants hadnormal or corrected-to-normal vision and were recruited from the under-graduate student population of Washington University. The participantshad an average of 13.7 years of education (SD � 1.17) and a meanvocabulary age of 18.2 years (SD � 0.88) on the Shipley Vocabularysubtest (Shipley, 1940).
Data from 7 of the 75 participants were discarded because of excessivelyhigh error rates and/or slow latencies via the following procedure. Toidentify outlier participants,1 we combined each participant’s responselatencies and error rates into a vector of four scores (mean RTs for high-and low-frequency words; error rate for high- and low-frequency words),and then computed the Mahalanobis D2 metric (Lattin, Carroll, & Green,2003) for each participant’s vector. The Mahalanobis D2 reflects a multi-variate Z-score and indicates how discrepant a vector is from the centroid(multidimensional equivalent of the mean). Participants who had D2 scoreswith unusually low probability values (i.e., ps � .05) were discarded. Thisapproach is advantageous in that it identifies multivariate outliers and doesnot rely on arbitrary criteria defined with respect to a single variable. Intotal, there were 35 participants in the legal nonword condition and 33participants in the pseudohomophone (PsH) condition.
Apparatus. An IBM-compatible computer controlled stimulus presen-tation and collected response latencies, via the keyboard, to the nearestmillisecond. The stimuli were displayed on a 17-in. (43.18-cm) Super VGAmonitor.
Stimuli. The stimuli consisted of 200 words, 200 length-matched pro-nounceable nonwords, and 200 length-matched PsHs. Using the HAL(hyperspace analogue to language) frequency norms (Lund & Burgess,1996), 100 words were designated high frequency (median log counts per131 million � 11.09) and 100 words were designated low frequency
1 To determine whether participant and RT screening procedures wereinfluencing the results, we reanalyzed the data using all participants andless conservative screening criteria, that is, removing only latencies fasterthan 200 ms and slower than 3,000 ms. The pattern of results did notchange.
1327SINGLE- VERSUS DUAL-PROCESS MODELS

(median log counts per 131 million � 7.76). Nonwords were constructedby changing one to three letters of the word items. Words and nonwordsranged from three to seven letters in length. For high-frequency words, themean orthographic neighborhood size (Coltheart, Davelaar, Jonasson, &Besner, 1977) was 4.77, and the mean summed bigram frequency was6,369.86. For low-frequency words, the mean orthographic neighborhoodsize was 4.82, and the mean summed bigram frequency was 6,149.13.There was no significant difference between high- and low-frequencywords with respect to both orthographic neighborhood, t(198) � �0.08,p � .94, and summed bigram frequency, t(198) � 0.42, p � .67. For thenonwords, the mean orthographic neighborhood size was higher for PsHs(mean N � 4.41) than for legal nonwords (mean N � 3.38; p � .02).2 Themean summed bigram frequency was higher for PsHs (6,663.5) than forlegal nonwords (5,984.7).
Procedure. Participants were tested individually in sound-attenuatedcubicles. They were seated about 60 cm from the computer screen. Beforethe experimental trials began, participants completed a computer-administered Shipley Vocabulary subtest (Shipley, 1940).
For the LDT, participants were told that letter strings would be presentedin the center of the screen and that their task was to indicate as quickly andas accurately as possible via a buttonpress on the keyboard whether theletter string was a word or nonword. Participants then received 20 practicetrials and four experimental blocks of 100 trials, with mandatory breaksoccurring between blocks. The order in which stimuli were presented wasrandomized anew for each participant. Each trial consisted of the followingorder of events: (a) a fixation point (�) at the center of the monitor for2,000 ms, (b) a blank screen for 250 ms, and (c) a letter string centered atthe fixation point’s location. The letter string remained on the screen untila response was made. Participants pressed the slash key for words and theZ key for nonwords. Responses were followed by a 1,500-ms delay. If theresponse was incorrect, 750 ms of that 1,500 ms was consumed by a200-Hz tone and an Incorrect Response message was displayed.
Design. A 2 � 2 factorial design was used: Nonword type (PsH orlegal) was manipulated between participants, whereas word frequency(high or low) was manipulated within participant.
Results
Errors (5.9% across both conditions) and response latenciesfaster than 200 ms or slower than 3,000 ms were first excluded
from the analyses. On the basis of the remaining observations, theoverall mean and standard deviation of each participant’s word andnonword latencies were computed. Response latencies 2.5 stan-dard deviations above or below each participant’s respective meanlatency were removed. These criteria eliminated a further 5.0% ofthe lexical decision responses. Analyses of variance (ANOVAs)were then carried out on the mean response latencies and accura-cies (both by participants and items) and also the ex-Gaussianparameters of the word and nonword RT data (see Table 2).
Word response latencies. For mean response latencies, themain effect of nonword type, Fp(1, 66) � 10.42, p � .002, MSE �16,467.33, 2 � .14; Fi(1, 198) � 162.27, p � .001, MSE �3,641.59, 2 � .45, was significant, as was the main effect of wordfrequency, Fp(1, 66) � 433.09, p � .001, MSE � 594.80, 2 �.87; Fi(1, 198) � 248.05, p � .001, MSE � 3,525.47, 2 � .56.More important, the Nonword Type � Word Frequency interac-tion was also significant, Fp(1, 66) � 13.91, p � .001, MSE �594.80, 2 � .17; Fi(1, 198) � 11.93, p � .001, MSE � 3,641.59,2 � .06. As shown in Table 2, there were larger frequency effectsin the presence of PsHs compared with legal nonwords.
Percentage correct. Turning to the accuracy data, the maineffect of nonword type, Fp(1, 66) � 8.51, p � .005, MSE �0.0014, 2 � .11; Fi(1, 198) � 3.35, p � .07, MSE � 0.0079,2 � .017, was significant, as was the main effect of wordfrequency, Fp(1, 66) � 184.08, p � .001, MSE � 0.0009, 2 �.74; Fi(1, 198) � 112.06, p � .001, MSE � 0.0061, 2 � .36. TheNonword Type � Word Frequency interaction was significant,Fp(1, 66) � 8.99, p � .004, MSE � 0.0009, 2 � .12; Fi(1, 198) �3.43, p � .07, MSE � 0.0079, 2 � .017, with larger frequencyeffects observed in the PsH condition than in the legal nonwordcondition.
Ex-Gaussian analyses. Ex-Gaussian parameters (�, �, �) wereobtained for each participant using continuous maximum likeli-hood estimation in R (R Development Core Team, 2004). Contin-uous maximum likelihood estimation provides relatively efficientand unbiased parameter estimates (Van Zandt, 2000) and uses allof the available raw data (see Heathcote, Brown, & Mewhort,2002, for an alternative approach). Using Nelder and Mead’s(1965) simplex algorithm, negative log likelihood functions wereminimized in the R statistics package (cf. Speckman & Rouder,2004), with all fits successfully converging within 500 iterations.
For �, the main effect of nonword type approached significance,F(1, 66) � 3.46, p � .07, MSE � 5,061.67, 2 � .05, whereas theword-frequency effect was significant, F(1, 66) � 180.59, p �.001, MSE � 356.62, 2 � .73. The Nonword Type � WordFrequency interaction was not significant (F � 1). Turning to �,the main effect of word frequency was significant, F(1, 66) �
2 The fact that the PsHs and legal nonwords were not matched onorthographic neighborhood size suggests that any observed nonword typeeffects cannot be unambiguously attributed to pseudohomophony; it isquite possible that orthographic neighborhood is also making a contribu-tion. However, in Experiment 1, we are not claiming (and do not plan toclaim) that pseudohomophony per se is responsible for the observedeffects. Rather, we are primarily interested in manipulating the familiarityof the nonword context and examining how foils that are more similar totargets (i.e., PsHs) influence the responses to words. Clearly, familiarity inthis instance is a multidimensional quantity that could encompasspseudohomophony and/or orthographic neighborhood size.
Table 2Means of Participants’ Mean Lexical Decision Response Times(in Milliseconds), Accuracy, and Ex-Gaussian ParameterEstimates as a Function of Word Frequency and Nonword Type(BRONE vs. BRANE) in Experiment 1
Nonword type and word frequency M % error � � �
WordsLegal
High frequency 564 1.7 459 40 105Low frequency 635 7.0 504 58 131Frequency effect 71 5.3 45 18 26
PseudohomophoneHigh frequency 619 2.1 483 45 136Low frequency 722 10.4 525 61 197Frequency effect 102 8.3 42 16 61
Difference of difference (interaction) 31 3.0 �3 �2 35
NonwordsLegal 679 4.4 551 59 127Pseudohomophone 783 8.5 588 65 195Nonword type effect 104 4.1 37 6 68
1328 YAP, BALOTA, CORTESE, AND WATSON

47.61, p � .001, MSE � 207.26, 2 � .42. Neither the main effectof nonword type nor the interaction was significant (Fs � 1). For�, the main effects of nonword type, F(1, 66) � 11.72, p � .001,MSE � 6,776.14, 2 � .15, and word frequency, F(1, 66) � 86.66,p � .001, MSE � 743.06, 2 � .57, were significant. The Non-word Type � Word Frequency interaction was highly significant,F(1, 66) � 13.90, p � .001, MSE � 743.06, 2 � .17, with largerfrequency effects in the PsH condition. Thus, the NonwordType � Word Frequency interaction was localized in the �parameter.
Vincentile analysis. A converging procedure for investigatingthe effects of variables on response latencies is to plot the meanvincentiles for the data. Vincentizing is used to average RT dis-tributions across a number of participants (Andrews & Heathcote,2001; Ratcliff, 1979; Rouder & Speckman, 2004; Vincent, 1912;Yap & Balota, in press) to produce the RT distribution for a typicalparticipant (see Figure 4 for an example). This approach does notrely on any prior distributional assumptions and examines the rawdata directly. To carry out vincentizing, one first computes apredefined number of vincentiles for each participant, where avincentile is defined as the mean of observations between neigh-boring percentiles. For example, to obtain 10 vincentiles, the RTdata for a participant is first sorted (from fastest to slowest re-sponses), and the first 10% of the data are then averaged, followedby the second 10%, and so on. Individual vincentiles are thenaveraged across participants and plotted. Plots of mean vincentilesare useful for investigating how different variables influence dif-ferent regions of the RT distribution and provide a graphical,complementary perspective to ex-Gaussian analysis. For example,� effects are reflected in additive changes in the vincentiles alongthe y-axis, whereas � effects are reflected in the slowest (rightmost)vincentiles.
The mean vincentiles for the different experimental conditionsare plotted in Figure 4. As shown here, the frequency effectincreased systematically across vincentiles for both nonword typeconditions. However, if we consider the later, slower vincentiles,the frequency effect for the PsH nonword condition was markedlylarger than for the legal nonword condition.
Nonword response latencies. For mean response latencies, themain effect of nonword type was significant, Fp(1, 66) � 12.39,p � .001, MSE � 14,803.50, 2 � .16; Fi(1, 199) � 327.44, p �.001, MSE � 3,619.12, 2 � .62, with slower nonword responsesto PsHs than to legal nonwords. For accuracy, the main effect ofnonword type was also significant, Fp(1, 66) � 11.81, p � .001,MSE � 0.0023, 2 � .15; Fi(1, 199) � 13.17, p � .001, MSE �0.0083, 2 � .062, with higher error rates for PsHs than for legalnonwords.
Turning to the ex-Gaussian parameters, for �, the main effect ofnonword type approached significance, F(1, 66) � 3.67, p � .060,MSE � 6,187.09, 2 � .053; � was larger in the PsH condition.For �, the main effect of nonword type was not significant.Turning to �, the main effect of nonword type was significant, F(1,66) � 14.56, p � .001, MSE � 5,293.59, 2 � .18; � was largerin the PsH condition than in the legal nonword condition. Themean vincentiles for nonwords in the different experimental con-ditions are plotted in Figure 5. An effect of nonword type (i.e.,faster latencies for legal nonwords compared with PsHs) is appar-ent across the vincentiles, although the difference between legalnonwords and PsHs becomes especially pronounced at the slowestvincentiles.
Discussion
Experiment 1 replicated and extended Stone and Van Orden’s(1993) Nonword Type � Word Frequency interaction; largerword-frequency effects are observed when PsHs are used. Moreintriguingly, the ex-Gaussian analyses and vincentile plots indi-cated that this interaction was localized in the exponential com-ponent (�) of the distribution (see Table 2), suggesting that distri-butional skewing was responsible for producing the WordFrequency � Nonword Type interaction in Experiment 1. Fornonwords, the nonword type effect was mediated by both � (to alesser extent) and � (to a greater extent), suggesting that bothdistributional shifting and, to a greater extent, skewing underlie theslower nonword responses to PsHs.
Figure 4. Vincentile means of the participants’ word lexical decision response times (RTs; in milliseconds) asa function of nonword type (legal nonword vs. PsH) and word frequency. PsH � pseudohomophone; HF � highfrequency; LF � low frequency.
1329SINGLE- VERSUS DUAL-PROCESS MODELS

Experiment 2
In the following experiment, we explored a different nonwordcontrast. In particular, we compared the word-frequency effect inthe context of illegal nonwords versus the context of legalnonwords.
Method
Participants. A total of 77 young adults (mean age � 19.1 years, SD �1.20) participated in this experiment for course credit. All participants hadnormal or corrected-to-normal vision and were recruited from the under-graduate student population of Washington University. The participantshad an average of 12.9 years of education (SD � 0.96) and a meanvocabulary age of 18.5 years (SD � 0.90) on the Shipley Vocabularysubtest. Data from 3 of the 77 participants were discarded using the samemultivariate outlier procedure described in Experiment 1. In total, therewere 37 participants in the legal nonword condition and 37 participants inthe illegal nonword condition.
Apparatus. An IBM-compatible computer running E-prime software(Schneider, Eschman, & Zuccolotto, 2001) was used to control stimuluspresentation and to collect data. The stimuli were displayed on a 17-in.(43.18-cm) Super VGA monitor, and participants’ responses were made ona computer keyboard.
Stimuli. The stimuli for the LDT consisted of the 200 words and 200length-matched pronounceable nonwords used in Experiment 1, as well asanother 200 orthographically illegal nonwords created by permuting theletters in the pronounceable nonwords. The mean orthographic neighbor-hood size was higher for legal nonwords (mean N � 3.38) than for illegalnonwords (mean N � 0.15; p � .001).3 The mean summed bigramfrequency was higher for legal nonwords (5,984.7) than for illegal non-words (3,346.8).
Procedure. The testing conditions were substantially the same as inExperiment 1. Participants were presented with 20 practice trials, followedby five experimental blocks of 80 trials, with mandatory breaks occurringbetween blocks. The order in which stimuli were presented was random-ized for each participant. Stimuli were presented in 14-point Courier font.Each trial consisted of the following order of events: (a) a fixation point(�) at the center of the monitor for 400 ms, (b) a blank screen for 200 ms,and (c) a stimulus centered at the fixation point’s location. The stimulusremained on screen until a keyboard response was made. Participantspressed the apostrophe key for words and the A key for nonwords.
Responses were followed by a 1,600-ms delay. If the response was incor-rect, 450 ms of that 1,600 ms was consumed by a 170-ms tone that waspresented simultaneously with the word Incorrect displayed slightly belowthe fixation point.
Design. A 2 � 2 factorial design was used: Nonword type (legal orillegal) was manipulated between participants, whereas word frequency(high or low) was manipulated within participant.
Results
Errors (3.5% across both conditions) and response latenciesfaster than 200 ms or slower than 3,000 ms were first excludedfrom the analyses, and the overall mean and standard deviation ofeach participant’s word and nonword latencies were then com-puted. Response latencies 2.5 standard deviations above or beloweach participant’s respective mean latency were removed. Thesecriteria eliminated a further 2.5% of the lexical decision responses.ANOVAs were then carried out on the mean, accuracy, andex-Gaussian parameters of the word and nonword response timedata (see Table 3).
Response latencies. For the mean response latency data, themain effect of nonword type, Fp(1, 72) � 21.28, p � .001, MSE �13,013.35, 2 � .23; Fi(1, 198) � 963.37, p � .001, MSE �805.35, 2 � .83, was significant, as was the main effect of wordfrequency, Fp(1, 72) � 115.62, p � .001, MSE � 364.40, 2 �.62; Fi(1, 198) � 75.66, p � .001, MSE � 1,845.56, 2 � .28.More important, the Nonword Type � Word Frequency interac-tion was also significant, Fp(1, 72) � 26.02, p � .001, MSE �364.40, 2 � .27; Fi(1, 198) � 38.07, p � .001, MSE � 805.35,2 � .16, with smaller frequency effects in the presence of illegalnonwords compared with legal nonwords.
Percentage correct. Turning to the analysis of the accuracydata, the main effect of nonword type, Fp(1, 72) � 18.20, p �.001, MSE � 0.0017, 2 � .20; Fi(1, 198) � 27.51, p � .001,MSE � 0.0028, 2 � .12, was significant, as was the main effectof word frequency, Fp(1, 72) � 59.99, p � .001, MSE � 0.0009,2 � .45; Fi(1, 198) � 48.35, p � .001, MSE � 0.0055, 2 � .20.The Nonword Type � Word Frequency interaction was alsosignificant, Fp(1, 72) � 14.67, p � .001, MSE � 0.0009, 2 � .17;Fi(1, 198) � 13.82, p � .001, MSE � 0.0028, 2 � .065, with asmaller frequency effect observed in the illegal nonword conditioncompared with the legal nonword condition.
Ex-Gaussian analyses. The analysis for � yielded main effectsof nonword type, F(1, 72) � 18.26, p � .001, MSE � 4,240.16,2 � .20, and word frequency, F(1, 72) � 111.83, p � .001,MSE � 216.47, 2 � .61. In contrast to Experiment 1, theNonword Type � Word Frequency interaction was significant for�, F(1, 72) � 22.47, p � .001, MSE � 216.47, 2 � .24, withsmaller frequency effects in the illegal nonword condition. Turningto �, the main effect of word frequency was significant, F(1, 72) �29.71, p � .001, MSE � 108.82, 2 � .29. Neither the main effect
3 In not matching legal and illegal nonwords on orthographic neighbor-hood, nonword type effects may be driven by both orthographic legality aswell as orthographic neighborhood. Again, we do not intend to claim thatthe observed effects are driven solely by orthographic legality. Our variableof primary interest is the familiarity of the nonword context, and we thinkit is plausible that illegal nonwords are unfamiliar because they are bothorthographically illegal and have few or no neighbors.
Figure 5. Vincentile means of the participants’ nonword lexical decisionresponse times (RTs; in milliseconds) as a function of nonword type (legalNW vs. PsH). PsH � pseudohomophone; NW � nonword.
1330 YAP, BALOTA, CORTESE, AND WATSON
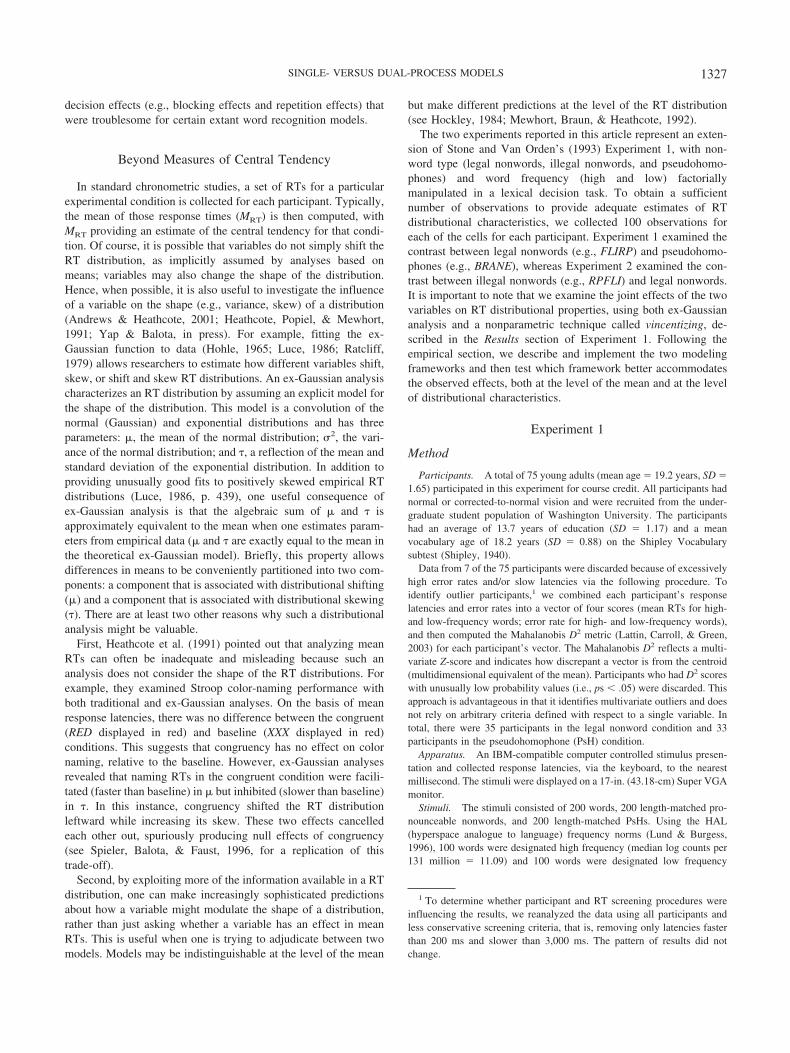
of nonword type nor the interaction was significant (Fs � 1). For�, the main effects of nonword type, F(1, 72) � 12.41, p � .001,MSE � 4,968.36, 2 � .15, and word frequency, F(1, 72) � 5.42,p � .023, MSE � 449.68, 2 � .07, were significant. In contrastto Experiment 1, the Nonword Type � Word Frequency interac-tion was not significant ( p � .19) in �.
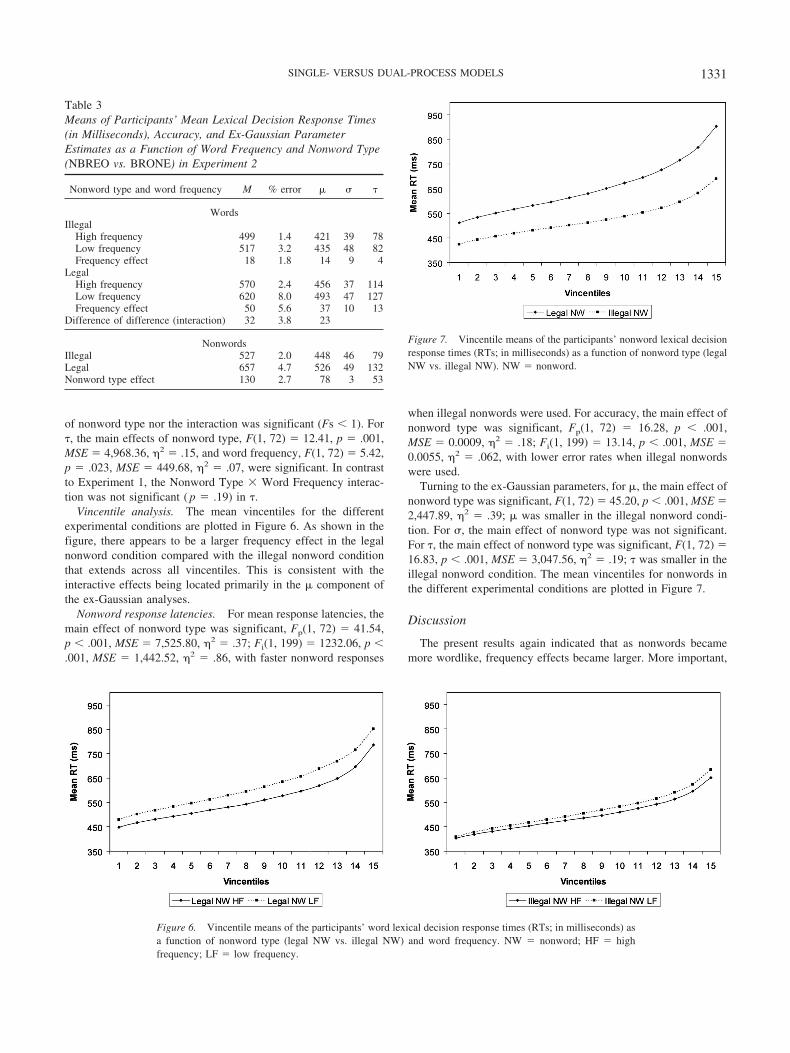
Vincentile analysis. The mean vincentiles for the differentexperimental conditions are plotted in Figure 6. As shown in thefigure, there appears to be a larger frequency effect in the legalnonword condition compared with the illegal nonword conditionthat extends across all vincentiles. This is consistent with theinteractive effects being located primarily in the � component ofthe ex-Gaussian analyses.
Nonword response latencies. For mean response latencies, themain effect of nonword type was significant, Fp(1, 72) � 41.54,p � .001, MSE � 7,525.80, 2 � .37; Fi(1, 199) � 1232.06, p �.001, MSE � 1,442.52, 2 � .86, with faster nonword responses
when illegal nonwords were used. For accuracy, the main effect ofnonword type was significant, Fp(1, 72) � 16.28, p � .001,MSE � 0.0009, 2 � .18; Fi(1, 199) � 13.14, p � .001, MSE �0.0055, 2 � .062, with lower error rates when illegal nonwordswere used.
Turning to the ex-Gaussian parameters, for �, the main effect ofnonword type was significant, F(1, 72) � 45.20, p � .001, MSE �2,447.89, 2 � .39; � was smaller in the illegal nonword condi-tion. For �, the main effect of nonword type was not significant.For �, the main effect of nonword type was significant, F(1, 72) �16.83, p � .001, MSE � 3,047.56, 2 � .19; � was smaller in theillegal nonword condition. The mean vincentiles for nonwords inthe different experimental conditions are plotted in Figure 7.
Discussion
The present results again indicated that as nonwords becamemore wordlike, frequency effects became larger. More important,
Figure 6. Vincentile means of the participants’ word lexical decision response times (RTs; in milliseconds) asa function of nonword type (legal NW vs. illegal NW) and word frequency. NW � nonword; HF � highfrequency; LF � low frequency.
Figure 7. Vincentile means of the participants’ nonword lexical decisionresponse times (RTs; in milliseconds) as a function of nonword type (legalNW vs. illegal NW). NW � nonword.
Table 3Means of Participants’ Mean Lexical Decision Response Times(in Milliseconds), Accuracy, and Ex-Gaussian ParameterEstimates as a Function of Word Frequency and Nonword Type(NBREO vs. BRONE) in Experiment 2
Nonword type and word frequency M % error � � �
WordsIllegal
High frequency 499 1.4 421 39 78Low frequency 517 3.2 435 48 82Frequency effect 18 1.8 14 9 4
LegalHigh frequency 570 2.4 456 37 114Low frequency 620 8.0 493 47 127Frequency effect 50 5.6 37 10 13
Difference of difference (interaction) 32 3.8 23
NonwordsIllegal 527 2.0 448 46 79Legal 657 4.7 526 49 132Nonword type effect 130 2.7 78 3 53
1331SINGLE- VERSUS DUAL-PROCESS MODELS

the distributional analyses yielded the counterintuitive finding thatthe distributional characteristics of the Nonword Type � WordFrequency interaction were modulated by a different component inthis experiment compared with Experiment 1. In Experiment 1,word-frequency effects were larger in the presence of PsHs com-pared with legal nonwords, and this interaction was mediated bythe � component. For the nonword foils, nonword type effects(slower latencies for PsHs) were also mediated more strongly bythe � component (see Table 2). In Experiment 2, word-frequencyeffects were larger for the legal nonwords compared with theillegal nonwords, and the interaction in this case was mediatedprimarily by � and, to a lesser extent, by �. For the nonword foils,nonword type effects (slower latencies for legal nonwords) weremediated more strongly by the � component (see Table 3). Thisintriguing pattern in the underlying distributional characteristicshas never been reported and, as described below, provides a usefulconstraint for discriminating between single- and two-stage mod-els of lexical decision performance. The current modeling en-deavor is based on correct RTs and does not address error rates orerror latencies. In any case, modeling errors is complicated by twofactors: low error rates and the multiple factors that contribute tosuch errors (Balota & Spieler, 1999).
Two-Stage Hybrid Model of Lexical DecisionPerformance
Recently, Balota and Spieler (1999) extended the two-stagemodel, described earlier, to accommodate the effects of variableson the shape of RT distributions. So as to understand how themodel captures characteristics of the response latency distribu-tions, we briefly describe the results of Balota and Spieler’s study,which manipulated frequency, lexicality, and repetition (repeatedor nonrepeated). Using Figure 2, the predictions for the followingeffects are considered in turn: the main effect of frequency, theFrequency � Repetition interaction, and the Lexicality � Repeti-tion interaction.
First, consider the main effect of frequency. Low-frequencywords are more likely than high-frequency words to fall under theregion requiring further analysis and hence are more likely toengage the second slow and attention-demanding process, result-ing in an RT distribution that is more positively skewed. Inex-Gaussian terms, this increased skewing is indexed by a largerexponential component (�). Second, turning to the Frequency �Repetition interaction, repeating low-frequency words should in-crease their familiarity and push these items above the high crite-rion, making these items less likely to undergo the analytic checkprocess. The distribution of repeated low-frequency words shouldtherefore produce a smaller � than nonrepeated low-frequencywords. Repeating high-frequency words should modulate � lessbecause more high-frequency words are already above the highcriterion. Finally, regarding the Lexicality � Repetition interac-tion, repeated words should produce a decrease in � because theseitems are pushed above the high criterion and hence increase thelikelihood of the check process. In contrast, repeated nonwordsshould produce an increase in � because these items are pushedabove the lower criterion, subjecting them to more analyticchecking.
The data supported the qualitative predictions made by thedescriptive two-stage model. Balota and Spieler (1999) attempted
to implement a quantitative version of the model. After a fewiterations, they settled on the hybrid model. This model assumesthat Stage 1 (familiarity) item responses are Gaussian in shape,whereas Stage 1 � Stage 2 (familiarity � check) item responsesare ex-Gaussian in shape. In Stage 1, the familiarity of itemsmodulates the time to respond in a Gaussian fashion. Items ofintermediate familiarity enter the Stage 2 check process and gen-erate response times from an ex-Gaussian distribution. In thisarticle, we test a two-stage model that is identical to the hybridmodel described by Balota and Spieler to account for the Fre-quency � Repetition and Lexicality � Repetition interactions.
Random-Walk Model of Lexical Decision Performance
As discussed in the introduction, the random-walk model con-ceptualizes lexical decision as an evidence-accumulating process.At each time point, a unit of evidence is sampled, and this evidenceis consistent with either a word or nonword response. Over time,evidence incrementally accrues for both responses but at a greaterrate for the more probable response. When a criterion is reached,a word or nonword response is emitted. Random-walk finishingtimes plus some residual time for encoding and response areassumed to correspond to behavioral lexical decision times. Therandom-walk model instantiated in this article is conceptuallysimilar to Stone and Van Orden’s (1993) canonical model (see alsoGordon’s, 1983, resonance model) and is in fact identical to the modelexplored by Spieler, Balota, and Faust (2000) to accommodate atten-tional selection performance. The random-walk model is superficiallysimilar to the counter model (Pike, 1973), which also tallies evidencefor two different responses in separate counters, making a responsewhen either tally exceeds an absolute criterion (Vickers, 1979). How-ever, the random-walk model can be distinguished by its adoption ofa relative rather than an absolute response criterion. A response isemitted only when the evidence for a response exceeds evidence forthe other response by some criterion.
The model contains three parameters. The signal strength is theprobability that the stimulus being processed is consistent with theresponse it maps on to, that is, in this case word or nonword. Thisparameter reflects the rate of evidence accumulation and is anal-ogous to the diffusion model’s drift rate. The relative responsecriterion is the amount of evidence a particular response mustpossess over its competitor before a response can be emitted; thisis analogous to the diffusion model’s boundary separation param-eter. Finally, the residual time represents the nondecision compo-nents (i.e., encoding and output) of the response, similar to thediffusion model’s Ter parameter.
We now turn to which of the two models more adequatelyaccounts for the novel distributional effects observed in the Ex-periments 1 and 2.4 To reiterate, the results from Experiment 1indicated that word-frequency effects were larger for PsHs than forlegal nonwords, and this interaction was mediated almost entirelyby the � component. Nonword type effects for nonwords weremore strongly mediated by �. In Experiment 2, word-frequencyeffects were larger for legal than for illegal nonwords, and this
4 For the simulations, we are assuming that the legal nonword conditionis invariant for the two contrasts. Empirically, of course, the legal nonwordconditions in Experiments 1 and 2 yield similar but not identical results.
1332 YAP, BALOTA, CORTESE, AND WATSON
interaction was mediated primarily by � and, to a smaller extent,by �. Nonword type effects for nonwords were more stronglymediated by �. Of course, in addition to capturing the effects ofthe variables on mean RTs, it is also important that the modelsaccommodate how variables influence RT distributional shape, asreflected by the �, �, and � parameters.
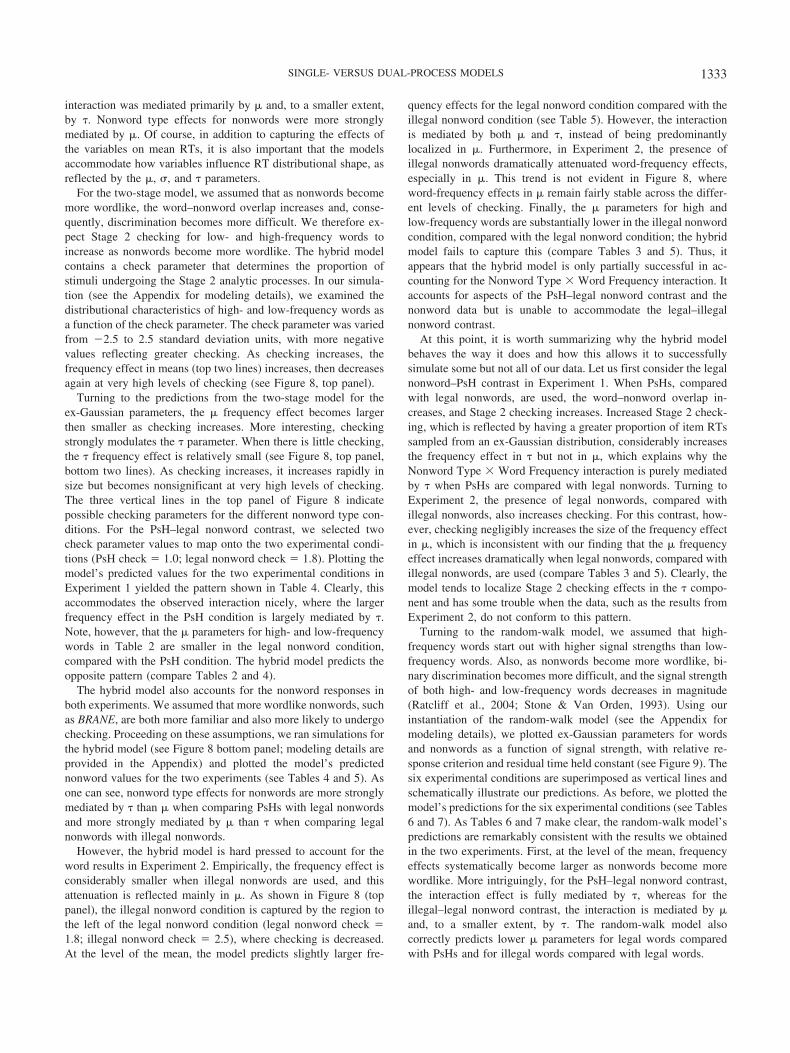
For the two-stage model, we assumed that as nonwords becomemore wordlike, the word–nonword overlap increases and, conse-quently, discrimination becomes more difficult. We therefore ex-pect Stage 2 checking for low- and high-frequency words toincrease as nonwords become more wordlike. The hybrid modelcontains a check parameter that determines the proportion ofstimuli undergoing the Stage 2 analytic processes. In our simula-tion (see the Appendix for modeling details), we examined thedistributional characteristics of high- and low-frequency words asa function of the check parameter. The check parameter was variedfrom �2.5 to 2.5 standard deviation units, with more negativevalues reflecting greater checking. As checking increases, thefrequency effect in means (top two lines) increases, then decreasesagain at very high levels of checking (see Figure 8, top panel).
Turning to the predictions from the two-stage model for theex-Gaussian parameters, the � frequency effect becomes largerthen smaller as checking increases. More interesting, checkingstrongly modulates the � parameter. When there is little checking,the � frequency effect is relatively small (see Figure 8, top panel,bottom two lines). As checking increases, it increases rapidly insize but becomes nonsignificant at very high levels of checking.The three vertical lines in the top panel of Figure 8 indicatepossible checking parameters for the different nonword type con-ditions. For the PsH–legal nonword contrast, we selected twocheck parameter values to map onto the two experimental condi-tions (PsH check � 1.0; legal nonword check � 1.8). Plotting themodel’s predicted values for the two experimental conditions inExperiment 1 yielded the pattern shown in Table 4. Clearly, thisaccommodates the observed interaction nicely, where the largerfrequency effect in the PsH condition is largely mediated by �.Note, however, that the � parameters for high- and low-frequencywords in Table 2 are smaller in the legal nonword condition,compared with the PsH condition. The hybrid model predicts theopposite pattern (compare Tables 2 and 4).
The hybrid model also accounts for the nonword responses inboth experiments. We assumed that more wordlike nonwords, suchas BRANE, are both more familiar and also more likely to undergochecking. Proceeding on these assumptions, we ran simulations forthe hybrid model (see Figure 8 bottom panel; modeling details areprovided in the Appendix) and plotted the model’s predictednonword values for the two experiments (see Tables 4 and 5). Asone can see, nonword type effects for nonwords are more stronglymediated by � than � when comparing PsHs with legal nonwordsand more strongly mediated by � than � when comparing legalnonwords with illegal nonwords.
However, the hybrid model is hard pressed to account for theword results in Experiment 2. Empirically, the frequency effect isconsiderably smaller when illegal nonwords are used, and thisattenuation is reflected mainly in �. As shown in Figure 8 (toppanel), the illegal nonword condition is captured by the region tothe left of the legal nonword condition (legal nonword check �1.8; illegal nonword check � 2.5), where checking is decreased.At the level of the mean, the model predicts slightly larger fre-
quency effects for the legal nonword condition compared with theillegal nonword condition (see Table 5). However, the interactionis mediated by both � and �, instead of being predominantlylocalized in �. Furthermore, in Experiment 2, the presence ofillegal nonwords dramatically attenuated word-frequency effects,especially in �. This trend is not evident in Figure 8, whereword-frequency effects in � remain fairly stable across the differ-ent levels of checking. Finally, the � parameters for high andlow-frequency words are substantially lower in the illegal nonwordcondition, compared with the legal nonword condition; the hybridmodel fails to capture this (compare Tables 3 and 5). Thus, itappears that the hybrid model is only partially successful in ac-counting for the Nonword Type � Word Frequency interaction. Itaccounts for aspects of the PsH–legal nonword contrast and thenonword data but is unable to accommodate the legal–illegalnonword contrast.
At this point, it is worth summarizing why the hybrid modelbehaves the way it does and how this allows it to successfullysimulate some but not all of our data. Let us first consider the legalnonword–PsH contrast in Experiment 1. When PsHs, comparedwith legal nonwords, are used, the word–nonword overlap in-creases, and Stage 2 checking increases. Increased Stage 2 check-ing, which is reflected by having a greater proportion of item RTssampled from an ex-Gaussian distribution, considerably increasesthe frequency effect in � but not in �, which explains why theNonword Type � Word Frequency interaction is purely mediatedby � when PsHs are compared with legal nonwords. Turning toExperiment 2, the presence of legal nonwords, compared withillegal nonwords, also increases checking. For this contrast, how-ever, checking negligibly increases the size of the frequency effectin �, which is inconsistent with our finding that the � frequencyeffect increases dramatically when legal nonwords, compared withillegal nonwords, are used (compare Tables 3 and 5). Clearly, themodel tends to localize Stage 2 checking effects in the � compo-nent and has some trouble when the data, such as the results fromExperiment 2, do not conform to this pattern.
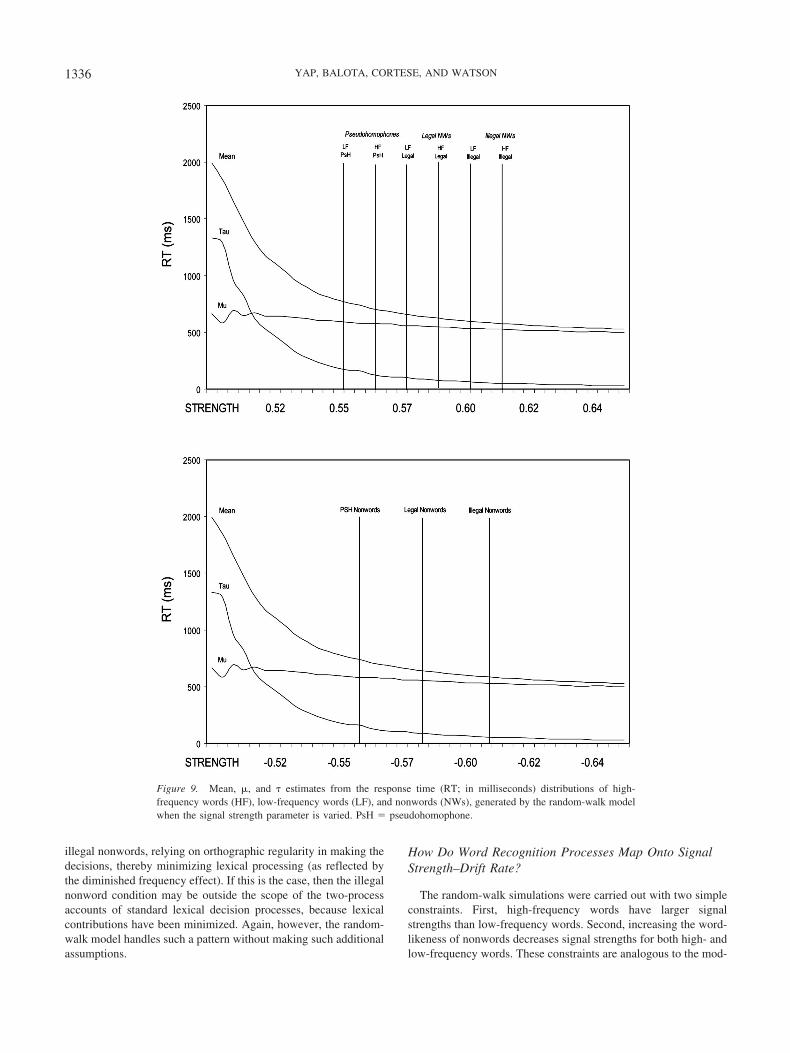
Turning to the random-walk model, we assumed that high-frequency words start out with higher signal strengths than low-frequency words. Also, as nonwords become more wordlike, bi-nary discrimination becomes more difficult, and the signal strengthof both high- and low-frequency words decreases in magnitude(Ratcliff et al., 2004; Stone & Van Orden, 1993). Using ourinstantiation of the random-walk model (see the Appendix formodeling details), we plotted ex-Gaussian parameters for wordsand nonwords as a function of signal strength, with relative re-sponse criterion and residual time held constant (see Figure 9). Thesix experimental conditions are superimposed as vertical lines andschematically illustrate our predictions. As before, we plotted themodel’s predictions for the six experimental conditions (see Tables6 and 7). As Tables 6 and 7 make clear, the random-walk model’spredictions are remarkably consistent with the results we obtainedin the two experiments. First, at the level of the mean, frequencyeffects systematically become larger as nonwords become morewordlike. More intriguingly, for the PsH–legal nonword contrast,the interaction effect is fully mediated by �, whereas for theillegal–legal nonword contrast, the interaction is mediated by �and, to a smaller extent, by �. The random-walk model alsocorrectly predicts lower � parameters for legal words comparedwith PsHs and for illegal words compared with legal words.
1333SINGLE- VERSUS DUAL-PROCESS MODELS

Figure 8. Mean, �, and � estimates from the response time (RT; in milliseconds) distributions of high-frequency words (HF), low-frequency words (LF), and nonwords (NWs), generated by the hybrid model whenthe check parameter is varied. PsH � pseudohomophone.
1334 YAP, BALOTA, CORTESE, AND WATSON

The model was slightly less successful in accommodating non-word responses. Using the diffusion model parameters in Ratcliffet al. (2004) as a starting point, we made the simplifying assump-tion that the nonwords in a particular condition had negative signalstrengths that were of similar magnitude to the low-frequencywords in that condition (see Figure 9, bottom panel). Using theseassumptions, we plotted the model’s predicted nonword values forthe two experiments (see Tables 6 and 7). As one can see, nonwordtype effects for nonwords are much more strongly mediated by �than � when comparing PsHs with legal nonwords. However,nonword type effects are only slightly mediated more by � than �when comparing legal nonwords with illegal nonwords. Althoughthe random-walk model’s prediction in this instance is qualita-tively correct, it would have mimicked the empirical data moreclosely (see Table 3) if the difference between � and � were morepronounced.
Although the nonword simulations reveal some brittleness inour simple model, the random-walk model generally makes pre-dictions that are consistent with the counterintuitive empiricalfindings, providing evidence that a simple random-walk frame-work in which only a single parameter is modulated can accountfor the effects observed in the two experiments. When we decom-pose the concave function of the random-walk model into � and �(see Figure 9), it is clear that as signal strength increases, �decreases rapidly and curvilinearly whereas � decreases gentlyand linearly. In particular, notice how skewed distributions arewhen signal strength is low, reflecting long random-walk finishingtimes when target–distractor discrimination is difficult. It is inter-esting to note that for low signal strengths, there is a markeddifference in the slopes for the � and � parameters, with muchsteeper gradients for �. As signal strength goes up, the slopes forthe two parameters become increasingly parallel. These trendssuggest that effects that reflect low signal strength processes (e.g.,PsH vs. legal nonword) show more � involvement than high signalstrength processes, a view that is consistent with our findings.
General Discussion
The present studies generated a number of noteworthy findings.In two experiments, we replicated the classic Nonword Type �Word Frequency interaction across two contrasts, showing thatmore wordlike nonword contexts produced slower word latenciesand larger word-frequency effects. More important, the use ofdistributional analyses afforded evidence that the interactive ef-fects of nonword context and word frequency were modulated bydifferent components of the RT distribution. Specifically, whencomparing PsHs and legal nonwords, the Nonword Type � WordFrequency interaction was mediated totally by the � (exponential)component. However, when comparing legal and illegal nonwords,the same interaction was mediated mainly by the � (Gaussian)component. Qualitatively similar trends were observed with thenonword data. This pattern of results converged nicely with thevincentile plots and underscores how distributional analyses canserve to complement and extend traditional analyses of means.Differences that were not apparent at the level of the meanemerged at the level of the distributional analyses, thereby provid-ing greater leverage in model adjudication.
It is interesting to note that the single-process random-walkmodel was able to account for these findings more naturally thanthe dual-process hybrid model. Although our simulations did notsupport the current instantiation of the hybrid model, they do notnecessarily eliminate two-process models in general. However, iflexical decisions are indeed mediated by a familiarity-check pro-cess, then the specific assumptions underlying the current hybridmodel have to be revised to accommodate the present results. Oneintriguing possibility is that the two stages map onto two separateaccumulation processes (Diederich, 1997). A familiarity-basedsequential sampling process may begin first, switching subse-quently to a more strategic–analytic check process. The surprisingfinding is that a simple random-walk model can indeed account forthe intriguing distributional changes without making such addi-tional assumptions. A second possibility is that participants rely ona qualitatively different type of process when confronted with
Table 5Means of Hybrid Model’s Mean Lexical Decision ResponseTimes (in Milliseconds) and Ex-Gaussian Parameter Estimatesas a Function of Word Frequency and Nonword Type (NBREOvs. BRONE)
Nonword type and word frequency M � � �
WordsIllegal (check � 2.5)
High frequency 500 482 58 18Low frequency 553 514 53 39Frequency effect 53 32 �5 21
Legal (check � 1.8)High frequency 503 464 51 38Low frequency 564 500 48 64Frequency effect 61 36 �3 26
Difference of difference (interaction) 8 4 2 5
NonwordsIllegal (check � �1.5) 464 394 44 70Legal (check � �0.6) 618 478 41 140Nonword type effect 154 84 �3 70
Table 4Means of Hybrid Model’s Mean Lexical Decision ResponseTimes (in Milliseconds) and Ex-Gaussian Parameter Estimatesas a Function of Word Frequency and Nonword Type (BRONEvs. BRANE)
Nonword type and word frequency M � � �
WordsLegal (check � 1.8)
High frequency 503 464 51 38Low frequency 564 500 48 64Frequency effect 61 36 �3 26
Pseudohomophone (check � 1.0)High frequency 513 453 48 60Low frequency 595 493 45 102Frequency effect 82 40 �3 42
Difference of difference (interaction) 21 4 0 16
NonwordsLegal (check � �0.6) 618 478 41 140Pseudohomophone (check � 0.2) 748 533 40 215Nonword type effect 130 55 �1 75
1335SINGLE- VERSUS DUAL-PROCESS MODELS
illegal nonwords, relying on orthographic regularity in making thedecisions, thereby minimizing lexical processing (as reflected bythe diminished frequency effect). If this is the case, then the illegalnonword condition may be outside the scope of the two-processaccounts of standard lexical decision processes, because lexicalcontributions have been minimized. Again, however, the random-walk model handles such a pattern without making such additionalassumptions.
How Do Word Recognition Processes Map Onto SignalStrength–Drift Rate?
The random-walk simulations were carried out with two simpleconstraints. First, high-frequency words have larger signalstrengths than low-frequency words. Second, increasing the word-likeness of nonwords decreases signal strengths for both high- andlow-frequency words. These constraints are analogous to the mod-
Figure 9. Mean, �, and � estimates from the response time (RT; in milliseconds) distributions of high-frequency words (HF), low-frequency words (LF), and nonwords (NWs), generated by the random-walk modelwhen the signal strength parameter is varied. PsH � pseudohomophone.
1336 YAP, BALOTA, CORTESE, AND WATSON

eling assumptions made by Ratcliff et al. (2004) in their diffusionmodel. It is interesting to note that modulating just signal strength,while holding other parameters constant, was sufficient for mim-icking the complex pattern of observed distributional effects in thepresent experiments. As discussed earlier, signal strength is theprobability that a stimulus is consistent with a particular responseand reflects how rapidly evidence is accumulated. Ratcliff et al. alsoreported that variations in drift rate (the analogue of signal strength)could account for the effects of word frequency and nonword type,but they only modeled the frequency by legal–illegal nonword inter-action, which produces effects mainly in �. The present data indicatethat the frequency by legal–PsH interaction is completely modulatedby changes in �. This pattern was also nicely handled by changes insignal strength in the random-walk model.
If we consider the classic models of word recognition, it is notobvious why high-frequency words might have higher signalstrengths than low-frequency words. For example, in the classiclogogen model (Morton, 1969), frequency has no influence on therate of accumulation of evidence. In this model, a word detector(logogen) exists for every word in the reader’s lexicon. Eachlogogen possesses a preset resting level of activation, and when aword is presented, the logogen for that word accumulates evidenceuntil some threshold is exceeded, at which point word recognitiontakes place. Notice that word frequency modulates the recognitionthreshold of logogens. Because high-frequency words have logo-gens with lower thresholds, less evidence is required for recogni-tion. Although the logogen model also assumes that evidence isaccumulated over time, the critical point is that frequency does notmodulate how rapidly that evidence is accumulating.
The classic interactive activation and competition (IAC) model(McClelland & Rumelhart, 1981) is also built on similar princi-ples. The model has three processing levels (feature, letter, word)that are connected to each other by excitatory and inhibitorypathways, with every relevant unit represented by a node. A visualinput first activates feature-level nodes, sending activation toletter-level nodes, and then on to word-level nodes, which in turnsends activation back to letter-level nodes. High-frequency words
start with higher resting levels of activation than low-frequencywords, allowing them to inhibit competitors more rapidly. It isimportant to note that the rate of activation increase is determinedmainly by the net input, which is defined as the summed excitatoryand inhibitory influences of neighbors on a node. Despite differ-ences (e.g., the logogen model is thresholded, the newer modelsare not), there is clearly a striking resemblance between the IACmodel and the logogen model; the IAC model has indeed beendescribed as a “hierarchical, nonlinear, logogen model” (McClel-land & Rumelhart, 1981, p. 388) with interactivity and dynamicalassumptions built in.
Clearly, the question of how signal strength or drift rate mapsonto word recognition processes is an important one. The work byRatcliff et al. (2004) and the findings described in this articlesuggest that frequency effects can be explained by variations insignal strength–drift rate. As the earlier discussion demonstrates, itis unclear how signal strength–drift rate maps onto the evidenceaccumulation processes in the logogen model or the IAC model,because the former assumes that there are differences in the rate ofstimulus driven activation needed to surpass threshold for high-and low-frequency words and the latter assumes that high- andlow-frequency words begin with different levels of resting activa-tion. Obviously, these issues are also relevant to the DRC andMROM models, which, to a large extent, are built on the IACframework. One possibility, suggested by Ratcliff et al., is thatthese models generate “wordness” values for incoming stimuli,and items with stronger lexical representations (i.e., high-frequency words) enter the lexical decision process with a highersignal strength–drift rate. Although this account works, it seemssimplistic and assigns an unnecessarily marginal role to wordrecognition models.
We believe it is particularly important to consider howdiffusion-type processes can be incorporated within the architec-ture of extant word recognition models. For example, although thelatest instantiation of the DRC model (Coltheart et al., 2001)implements the lexical pathway using the IAC model, the activa-tion dynamics are no longer identical to the IAC assumptions
Table 7Means of Random-Walk Model’s Mean Lexical DecisionResponse Times (in Milliseconds) and Ex-Gaussian ParameterEstimates as a Function of Word Frequency and Nonword Type(NBREO vs. BRONE)
Nonword type and word frequency M � � �
WordsIllegal
High frequency 593 534 32 60Low frequency 611 541 35 70Frequency effect 18 7 3 10
LegalHigh frequency 650 559 43 91Low frequency 680 576 52 104Frequency effect 30 17 9 13
Difference of difference (interaction) 12 10 6 3
NonwordsIllegal 611 541 35 70Legal 680 576 52 104Nonword type effect 69 36 18 34
Table 6Means of Random-Walk Model’s Mean Lexical DecisionResponse Times (in Milliseconds) and Ex-Gaussian ParameterEstimates as a Function of Word Frequency and Nonword Type(BRONE vs. BRANE)
Nonword type and word frequency M � � �
WordsLegal
High frequency 650 559 43 91Low frequency 680 576 52 104Frequency effect 30 17 9 13
PseudohomophoneHigh frequency 755 590 57 165Low frequency 810 605 63 205Frequency effect 55 15 6 40
Difference of difference (interaction) 25 �2 �3 27
NonwordsLegal 680 576 52 104Pseudohomophone 605 63 205 810Nonword type effect 130 29 11 102
1337SINGLE- VERSUS DUAL-PROCESS MODELS

originally made by McClelland and Rumelhart (1981). Recall thatin the original IAC model, word frequency is implemented byassigning higher baseline activation levels to nodes for high-frequency words. In the DRC model, word frequency has beenmoved to the equation that governs net input. Because net inputeffectively determines how rapidly activation is rising for a lexicalentry, this implies that the activation for high-frequency wordsshould therefore rise more rapidly than for low-frequency words,all other factors being equal (Coltheart et al., 2001). This suggeststhat there may be a mapping between the activation levels ofentries in the orthographic lexicon and the signal strength–driftrate of the decision-making mechanism. Here, we describe onepossible account of this mapping.
Specifically, we propose that the decision-making mechanism iscontinuously monitoring the activation of representations in thelexical system. There are actually two indexes within the DRCframework that could feed the decision-making mechanism. Localactivation refers to the activation of individual lexical representa-tions, whereas global activation refers to the sum of activationsacross lexical representations. Because we are arguing that thedecision-making mechanism is constantly being updated acrosstime, we believe that global activation is the more likely signaldriving the decision-making mechanism. If local activation werebeing used as the stimulus unfolds across time, then the systemwould need to monitor each of the activated lexical representationsand track the changes in activation across cycles. Although this ispossible, this may be unnecessarily cumbersome, especially earlyin stimulus processing when many lexical candidates are receivingsome activation. Hence, for simplicity, we consider how globalprocessing could be used by the decision-making mechanism. It isalso important to note here that although global activation includes allactivated representations (e.g., orthographic neighbors) on a givencycle, it is clearly most influenced by the correct lexical candidate.
How might global activation be directly tied to the random-walkprocess to accommodate the present results? As activation ismonitored over successive cycles, evidence is accumulated for theword response (i.e., value added to the word counter) on each cycleif the global activation index on the current cycle exceeds theglobal activation of the preceding cycle by some minimal amount.In contrast, if there is little change in global activation from CycleN to Cycle N � 1, then evidence is accumulated for a nonwordresponse (i.e., value added to the nonword counter).5 A wordresponse is produced when the evidence accumulated in the wordcounter exceeds the evidence for the nonword counter by somethreshold. Conversely, a nonword response is produced when theevidence accumulated for the nonword counter exceeds the evi-dence for the word counter by some threshold. This accountpredicts frequency effects in lexical decision because high-frequencywords possess lexical entries with steeper rates of local activation(thereby also producing more global activation), which produce evi-dence for a word response at a more rapid rate across cycles.
It should also be noted that because frequency is represented inthe strength of the connections between nodes within the PDParchitecture of Seidenberg and McClelland’s (1989) and Plaut,McClelland, Seidenberg, and Patterson’s (1996) models, activa-tion accumulates at different rates for high-frequency and low-frequency words, and so this could also be mapped onto drift rate.Hence, it appears quite reasonable that the more recently devel-oped computational models of word recognition have parameters
that could accommodate the differences in drift rate for high- andlow-frequency words.
Why Should Nonword Type Influence Drift Rate asOpposed to Response Criterion?
A conundrum produced by the present results is why changes instrength–drift rate across nonword contexts capture the distribu-tional characteristics in the data instead of simple changes incriteria due to difficulty of the word–nonword discrimination. Apriori, most extant models of word recognition assume that non-word type influences the response criterion that participants use tomake a word response. Specifically, one would expect participantsto become more conservative (i.e., set a higher criterion before aresponse is made) as the nonwords become more similar to words.In fact, this is precisely the account that Stone and Van Orden(1993) provided in their original explanation of the NonwordType � Word Frequency interaction. As nonwords become morewordlike (e.g., BRANE vs. BRONE), participants rely on a moreconservative response criterion to make their decisions (see Figure2). Note that this is conceptually similar to the lexical decisionmechanisms adopted by the DRC and MROM models. As non-word foils become more wordlike, the summed activation of theorthographic lexicon is higher on nonword trials, and hence, thesystem adopts longer deadlines to avoid premature misses (Colt-heart et al., 2001). The signal detection framework proposed bySeidenberg (1990; see also Plaut, 1997) provides complementaryaccounts. Because lexical decision involves speeded word–nonword discrimination, optimal decision criteria have to be es-tablished that permit fast responses while minimizing error rates.These criteria may shift depending on the nonword stimuli used inthe task, allowing additional information (e.g., phonological andsemantic) to play a role in the discrimination.
Of course, it is possible that by changing the response criteriawithin our random-walk model one could also capture the presentresults. We tested this idea with a series of random-walk simula-tions in which we kept signal strength constant while varying theresponse criterion. The results were unambiguous. Altering theresponse criterion only influences the � component and has vir-tually no effect on �, a pattern that was also reported by Spieler etal. (2000). In general, this is consistent with predictions fromrandom-walk and diffusion-type models, that is, that shifts in
5 We have conducted DRC simulations with a subset of our stimuli thatconfirm that global lexical activity can be used to discriminate between thewords and nonwords used in our experiments. However, it is plausible thata lexical decision system relying only on global lexical activity may haveproblems when it encounters words with few orthographic neighbors andnonword foils with many orthographic neighbors (M. Coltheart, personalcommunication, February 10, 2005). Because global lexical activity issensitive to the orthographic neighborhood size of items, it may turn outthat global activations in this situation may be higher for the nonwords thanfor the words. We would argue that, under these circumstances, where theexperimenter directly manipulates a variable to work against global acti-vation, other sources of information (e.g., local lexical activation or evi-dence from phonology and/or semantics) may play a more prominent role.It would also be useful to examine the distributional characteristics whenglobal activation is truly equated across words and nonwords to determinewhether an additional component is evidenced in these distributions.
1338 YAP, BALOTA, CORTESE, AND WATSON

criterion primarily shift the RT distribution instead of changing itsshape and hence are primarily reflected in changes in �. However,this is inconsistent with our data, where we clearly demonstratethat nonword type influences both � and �, depending on thedifficulty of the discrimination.
In this light, one of the most intriguing questions of the presentresults is why nonword type manipulations should modulate thesignal strength of words. After all, participants are responding tothe same set of word stimuli across the different nonword contexts.Why would evidence accumulate more rapidly for DOG when it ispaired with NBREO than when it is paired with BRANE? It doesnot seem reasonable to assume that the rate at which activationaccumulates within a word recognition system built on a lifetime ofexperience should be so easily modified by the local nonword context.
One possible way to envisage the influence of nonword type isto consider the utility of the rate at which activation is accumu-lating within the word–nonword response systems. In the contextof a difficult discrimination (e.g., in the context of PsHs), a singleunit of information supportive of the word response (i.e., anincrement in global activation between Cycle N and Cycle N � 1)is less informative than in the context of an easy discrimination(e.g., in the context of illegal nonwords). Hence, participants mayuse the difficulty of the discrimination to differentially weight therate of activation within the lexicon. That is, the mapping betweenactivation rate and signal strength–drift rate is not invariant butcan be modulated by the difficulty of the discrimination process.When discrimination is easy (e.g., illegal foils), the mappingbetween activation and drift rate is weighted more heavily. Whendiscrimination is difficult (e.g., PsH foils), the mapping betweenactivation and drift rate is weighted less heavily. How does thesystem know whether discrimination is difficult or easy? Anobvious source of information is the global (i.e., summed) lexicalactivity produced by nonwords across trials. More wordlike non-words (e.g., BRANE) produce more global activity. Hence, theaverage global lexical activity for nonwords will be higher asdiscrimination difficulty increases. This information can then beused to adjust the weight between local lexical activity and signalstrength–drift rate. It is important to note that because the systemhas to apply the same weight to both word and nonword trials, thisexplains why illegal nonwords (which should produce a strongerweight) possess a steeper signal strength–drift rate than PsHs(which should produce a weaker weight).
All extant models have mechanisms that accommodate discrim-ination difficulty, and typically these models adjust criteria arbi-trarily on the basis of such difficulty. Our proposal is that discrim-ination difficulty, which is influenced by the global activation fornonwords, modulates the utility of activation rate; this activationrate is directly available from the output of word recognitionmodels. To recapitulate, we believe that a plausible account of thepresent results is that word–nonword overlap modulates the utilityof the global activation rate for high- and low-frequency words,and this is reflected in the signal strength parameter within ourrandom-walk model of the decision process. Very simply, if thedifficulty of the word–nonword discrimination is relatively easy,then the participant can rely heavily on activation building up inthe lexicon to drive a decision, whereas, in a difficult discrimina-tion, the activation building up will be relatively less informativebecause on some difficult nonword trials (e.g., for PsHs), activa-tion will be building up at a relatively high rate even though the
stimulus is a nonword. This perspective has clear similarity toRatcliff et al.’s (2004) account of lexical decision performance butmore specifically indicates how this might be incorporated withinavailable word recognition models.
To make our foregoing discussion more concrete, Figure 10schematically illustrates how signal strength or drift rate vary as afunction of word frequency and nonword context. As one can see,the rate of evidence accumulation for both words and nonwordsbecomes less steep as discrimination difficulty increases. Signalstrength or drift rate also increases for higher frequency words.The response criteria in this figure represent the relative differencebetween the word and nonword accumulators. As noted above, wewould argue that a simple way of connecting this framework to theDRC–MROM model is to argue that the slope of the drift rates ismodulated by the global activation that accrues across the nonwordtrials, which in turn reflects the difficulty of the word–nonworddiscrimination. It is clear from Figure 10 that such changes in therates modulate the word-frequency effect (as a function of non-word type) in the predicted fashion.
It is again important to emphasize that there are alternative waysto accommodate nonword type effects. For example, PDP-classmodels use signal detection to carry out lexical decisions, and thesignal can either be orthographic (Seidenberg & McClelland,1989) or semantic (Plaut, 1997) in nature. Nonword type effectsarise because the model may consult different kinds of informationacross different nonword type contexts to optimize performance(Seidenberg, 1990). For example, consider how words and non-words differ along several dimensions, any of which can be usedto make a lexical decision. Words tend to have more familiarorthographic, phonological, and semantic patterns than nonwords.When orthographically illegal nonwords (e.g., NBREO) are used asfoils, discrimination can be made on the basis of orthographicinformation alone. When orthographically legal nonwords (e.g.,BRONE) are used, either phonology or semantics can reliably beused to carry out the discrimination because nonwords are nothomophonous with real words. One major limitation of the PDPapproach is that, unlike the DRC and MROM models, PDP modelsdo not simulate lexical decision response latencies. For example,both Plaut (1997) and Harm and Seidenberg (2004) simulatedasymptotic lexical decision accuracy rather than RTs (see Rastle &Coltheart, in press). To properly evaluate PDP models against ourdata, it is necessary to address the following two issues. First, howdoes nonword type context modulate the type of information(orthographic, phonological, semantic) that is being recruited toperform the lexical decision? Second, current PDP models gener-ate either orthographic or semantic stress as their primary depen-dent variable. It is as yet unclear how stress values map onto RTsto produce the observed RT distributions, although Plaut (1997)has suggested that lexical decision latencies can be modeled byyoking the signal detection procedure to a diffusion process, withthe assumption that stimuli with stronger signals produce steeperdrift rates. To our knowledge, this has not yet been implemented.
In the foregoing discussion, we have attempted to make contactwith the available models, through consideration of the decisionmechanisms used in binary tasks, and have attempted to tie this toa general model of the binary decision process. It is still quitepossible that the current effects of nonword type may be accom-modated by changing response criteria mechanisms, or othermechanisms, within the available models. In this light, we look
1339SINGLE- VERSUS DUAL-PROCESS MODELS

forward to specific implementations of existing word recognitionmodels at the level of RT distributions.
Lexical Decision, Nonword Type, and the Effect ofDistinct Codes
As discussed earlier, words and nonwords differ along severaldistinct dimensions, any of which can be used to make a lexicaldecision. In this light, it is at least plausible that different sourcesof information (e.g., orthographic, phonological, and semantic)contribute to a unidimensional quantity (wordness) that maps ontosignal–drift rate (Ratcliff et al., 2004). Furthermore, it is notewor-thy that there is evidence that distinct types of information appearto come online as a function of the word–nonword discriminationdifficulty. For example, James (1975) obtained concreteness ef-fects when legal nonwords were used but not when illegal non-words were used. Joordens and Becker (1997) also observed thestrongest semantic priming effects when PsH foils were used,compared with legal nonwords or illegal nonwords. Similarly,Waters and Seidenberg (1985) found stronger regularity effects inlexical decision when orthographically strange words (e.g., AISLE)were included. These findings reinforce the notion that semantics
or phonology are emphasized when the orthographic code be-comes less useful for discrimination. Ultimately, such qualitativelydistinct effects as a function of the word–nonword discriminationare also consistent with the notion that lexical decision latenciesare modulated by a flexible lexical processor (Balota, Paul, &Spieler, 1999; Balota & Yap, in press), in which local task de-mands and contexts determine the extent to which attention isdirected toward various lexical processing pathways. Within theDRM–MROM framework described earlier, such local task de-mands and contexts could also determine the extent to which localand global activation contribute toward the random-walk process.
It is indeed intriguing that nonword context modulates bothsignal strength and the salience of different stimulus dimensions.Clearly, signal strength–drift rate are able to provide only a partialaccount of lexical decision phenomena. Although it accounts forbehavior (i.e., RT distributions and accuracy) remarkably well, itmakes no predictions about the specific lexical information–processes that are contributing to the random-walk–diffusion pro-cess. If indeed a sequential sampling process is the best descriptionof lexical decision performance, then we believe it is important,from a psycholinguistic perspective, to develop unified frame-
Figure 10. Signal strength–drift rate as a function of word frequency and nonword type. HF � high-frequencywords; ILL � illegal; nwds � nonwords; LF � low-frequency words; LEG � legal; PsHs � pseudohomo-phones.
1340 YAP, BALOTA, CORTESE, AND WATSON

works that explicitly consider the lexical processing pathways thatare brought online and how these pathways drive drift rate.
Revisiting Single Versus Multiprocess Distinctionsin Models
The present results suggest that the Nonword Type � WordFrequency interaction is better accommodated by a single-processmodel than the complex two-stage hybrid model. Of course, onemust be cautious because we have only tested a single instantiationof the hybrid model. Moreover, some additional challenges need tobe overcome before a more definitive answer is available. Forexample, one could argue that even RT data at the distributionallevel may be somewhat limited. Attempting to discriminate be-tween a single-process and a multiprocess model may well be akinto discriminating between gradual and all-or-none learning inquantitative models of learning in the 1960s and 1970s. Specifi-cally, researchers were interested in whether the rate of learningwas better reflected by a negatively accelerated curve (i.e., learn-ing is gradual and continuous) or a step function (i.e., learning isall-or-none). Crowder (1976) elegantly demonstrated how averag-ing data across participants creates an incremental learning curve(see Figure 11), regardless of the actual learning function at thelevel of the individual participant.
It is at least plausible that the present techniques of averagingover many trials and participants may indeed smooth potentiallydiscrete changes in lexical processing. Using only group RT dis-tributions across many trials, it may not be possible to conclusivelytell whether decision performance is driven by one or two or moreprocesses. As Estes (2002) argued, more definitive convergingevidence may be uncovered by cognitive neuroscience methods.For example, it is possible that event-related potential experimentsmay reveal dissociations between variables that, in principle,
should selectively influence different stages. Specifically, theremay be spatially and temporally distinct event-related potentialsignals that are associated with qualitatively different processingstages.
Conclusions
In the present article, we used RT distributional analysis toevaluate two general frameworks for interpreting binary decisionprocesses, that is, the two-process hybrid model and a simplerandom-walk model. The targeted behavioral phenomenon was theNonword Type � Word Frequency interaction in lexical decisionperformance. We demonstrated that the random-walk model pro-vided a better account of the observed effects via simple changesin signal strength. Prima facie, this is consistent with Ratcliff etal.’s (2004) recent argument that the burden of word recognitionmodels is to generate drift rates for different experimental condi-tions and to feed this information into a decision process. Ofcourse, a model of the decision process is only one target for wordrecognition researchers. Ultimately, it is critical to have an under-standing of the representations and processes that feed into thedrift rates and to consider the interplay among lexical structures,processes, and decision making.
References
Andrews, S., & Heathcote, A. (2001). Distinguishing common and task-specific processes in word identification: A matter of some moment.Journal of Experimental Psychology: Learning, Memory, and Cogni-tion, 27, 514–544.
Atkinson, R. C., & Juola, J. F. (1974). Search and decision processes inrecognition memory. In D. H. Krantz, R. C. Atkinson, R. D. Luce, & P.Suppes (Eds.), Contemporary developments in mathematical psychol-
Figure 11. Illustration of how data averaging across participants creates an incremental learning curve,regardless of the actual learning function at the level of the individual participant. From Principles of Learningand Memory (p. 267), by R. G. Crowder, 1976, Hillsdale, NJ: Erlbaum. Copyright 1976 by Lawrence ErlbaumAssociates. Reprinted with permission.
1341SINGLE- VERSUS DUAL-PROCESS MODELS
ogy: Learning, memory, and thinking (Vol. 1, pp. 242–293). San Fran-cisco: Freeman.
Balota, D. A., & Chumbley, J. I. (1984). Are lexical decisions a goodmeasure of lexical access? The role of word frequency in the neglecteddecision stage. Journal of Experimental Psychology: Human Perceptionand Performance, 10, 340–357.
Balota, D. A., Paul, S., & Spieler, D. H. (1999). Attentional control oflexical processing pathways during word recognition and reading. In S.Garrod & M. Pickering (Eds.), Language processing (pp. 15–57). EastSussex, England: Psychology Press.
Balota, D. A., & Spieler, D. H. (1999). Word frequency, repetition, andlexicality effects in word recognition tasks: Beyond measures of centraltendency. Journal of Experimental Psychology: General, 128, 32–55.
Balota, D. A., & Yap, M. J. (in press). Attentional control and flexiblelexical processing: Explorations of the magic moment of word recogni-tion. In S. Andrews (Ed.), From inkmarks to ideas: Current issues inlexical processing. Hove, England: Psychology Press.
Coltheart, M., Davelaar, E., Jonasson, J., & Besner, D. (1977). Access tothe internal lexicon. In S. Dornic (Ed.), Attention and performance VI(pp. 535–555). Hillsdale, NJ: Erlbaum.
Coltheart, M., Rastle, K., Perry, C., Langdon, R., & Ziegler, J. (2001).DRC: A dual route cascaded model of visual word recognition andreading aloud. Psychological Review, 108, 204–256.
Crowder, R. G. (1976). Principles of learning and memory. Hillsdale, NJ:Erlbaum.
Diederich, A. (1997). Dynamic stochastic models for decision making withtime constraints. Journal of Mathematical Psychology, 41, 260–274.
Estes, W. K. (2002). Traps in the route to models of memory and decision.Psychonomic Bulletin & Review, 9, 3–25.
Gordon, B. (1983). Lexical access and lexical decision: Mechanisms offrequency sensitivity. Journal of Verbal Learning and Verbal Behavior,22, 24–44.
Grainger, J., & Jacobs, A. M. (1996). Orthographic processing in visualword recognition: A multiple read-out model. Psychological Review,103, 518–565.
Harm, M. W., & Seidenberg, M. S. (2004). Computing the meanings ofwords in reading: Cooperative division of labor between visual andphonological processes. Psychological Review, 111, 662–720.
Heathcote, A., Brown, S., & Mewhort, D. J. K. (2002). Quantile maximumlikelihood estimation of response time distributions. Psychonomic Bul-letin & Review, 9, 394–401.
Heathcote, A., Popiel, S. J., & Mewhort, D. J. K. (1991). Analysis ofresponse time distributions: An example using the Stroop task. Psycho-logical Bulletin, 109, 340–347.
Hockley, W. E. (1984). Analysis of response time distributions in the studyof cognitive processes. Journal of Experimental Psychology: Learning,Memory, and Cognition, 10, 598–615.
Hohle, R. H. (1965). Inferred components of reaction times as functions offoreperiod duration. Journal of Experimental Psychology, 69, 382–386.
James, C. T. (1975). The role of semantic information in lexical decisions.Journal of Experimental Psychology: Human Perception and Perfor-mance, 1, 130–136.
Joordens, S., & Becker, S. (1997). The long and short of semantic primingeffects in lexical decision. Journal of Experimental Psychology: Learn-ing, Memory, and Cognition, 23, 1083–1105.
Lattin, J. M., Carroll, J. D., & Green, P. E. (2003). Analyzing multivariatedata. Pacific Grove, CA: Brooks/Cole.
Luce, R. D. (1986). Response times: Their role in inferring elementarymental organization. New York: Oxford University Press.
Lund, K., & Burgess, C. (1996). Producing high-dimensional semanticspaces from lexical co-occurrence. Behavior Research Methods, Instru-ments & Computers, 28, 203–208.
McClelland, J. L., & Rumelhart, D. E. (1981). An interactive activation
model of context effects in letter perception: Pt. 1. An account of basicfindings. Psychological Review, 88, 375–407.
Mewhort, D. J. K., Braun, J. G., & Heathcote, A. (1992). Response-timedistributions and the Stroop task: A test of Cohen, Dunbar, and McClel-land’s (1990) parallel distributed processing model. Journal of Experi-mental Psychology: Human Perception and Performance, 18, 872–882.
Morton, J. (1969). The interaction of information in word recognition.Psychological Review, 76, 165–178.
Murray, W. S., & Forster, K. I. (2004). Serial mechanisms in lexicalaccess: The rank hypothesis. Psychological Review, 111, 721–756.
Nelder, J. A., & Mead, R. (1965). A simplex algorithm for functionminimization. Computer Journal, 7, 308–313.
Pike, A. R. (1973). Response latency models for signal detection. Psycho-logical Review, 80, 53–68.
Plaut, D. C. (1997). Structure and function in the lexical system: Insightsfrom distributed models of word reading and lexical decision. Languageand Cognitive Processes, 12, 765–805.
Plaut, D. C., McClelland, J. L., Seidenberg, M. S., & Patterson, K. (1996).Understanding normal and impaired word reading: Computational prin-ciples in quasi-regular domains. Psychological Review, 103, 56–115.
R Development Core Team. (2004). R: A language and environment forstatistical computing. Vienna, Austria: R Foundation for StatisticalComputing.
Rastle, K., & Coltheart, M. (in press). Is there serial processing in thereading system and are there local representations? In S. Andrew (Ed.),From inkmarks to ideas: Current issues in lexical processing. Hove,England: Psychology Press.
Ratcliff, R. (1978). A theory of memory retrieval. Psychological Review,85, 59–108.
Ratcliff, R. (1979). Group reaction time distributions and an analysis ofdistribution statistics. Psychological Review, 86, 446–461.
Ratcliff, R., Gomez, P., & McKoon, G. (2004). A diffusion model accountof the lexical decision task. Psychological Review, 111, 159–182.
Ratcliff, R., & Rouder, J. F. (1998). Modeling response times for two-choice decisions. Psychological Science, 9, 347–356.
Rouder, J. N., & Speckman, P. L. (2004). An evaluation of the vincentizingmethod of forming group-level response time distributions. Psy-chonomic Bulletin & Review, 11, 419–427.
Rubenstein, H., Garfield, L., & Millikan, J. A. (1970). Homographicentries in the internal lexicon. Journal of Verbal Learning and VerbalBehavior, 9, 487–494.
Schneider, W., Eschman, A., & Zuccolotto, A. (2001). E-Prime user’sguide. Pittsburgh, PA: Psychology Software Tools.
Seidenberg, M. S. (1990). Lexical access: Another theoretical soupstone?In D. A. Balota, G. B. Flores d’Arcais, & K. Rayner (Eds.), Compre-hension processes in reading (pp. 33–71). Hillsdale, NJ: Erlbaum.
Seidenberg, M. S., & McClelland, J. L. (1989). A distributed developmen-tal model of word recognition and naming. Psychological Review, 96,523–568.
Shipley, W. C. (1940). A self-administering scale for measuring intellec-tual impairment and deterioration. Journal of Psychology, 9, 371–377.
Speckman, P. L., & Rouder, J. N. (2004). A comment on Heathcote,Brown, and Mewhort’s QMLE method for response time distributions.Psychonomic Bulletin & Review, 11, 574–576.
Spieler, D. H., Balota, D. A., & Faust, M. E. (1996). Stroop performancein normal older adults and individuals with senile dementia of theAlzheimer’s type. Journal of Experimental Psychology: Human Percep-tion and Performance, 22, 461–479.
Spieler, D. H., Balota, D. A., & Faust, M. E. (2000). Levels of selectiveattention revealed through analyses of response time distributions. Jour-nal of Experimental Psychology: Human Perception and Performance,26, 506–526.
Stone, G. O., & Van Orden, G. C. (1993). Strategic control of processing
1342 YAP, BALOTA, CORTESE, AND WATSON
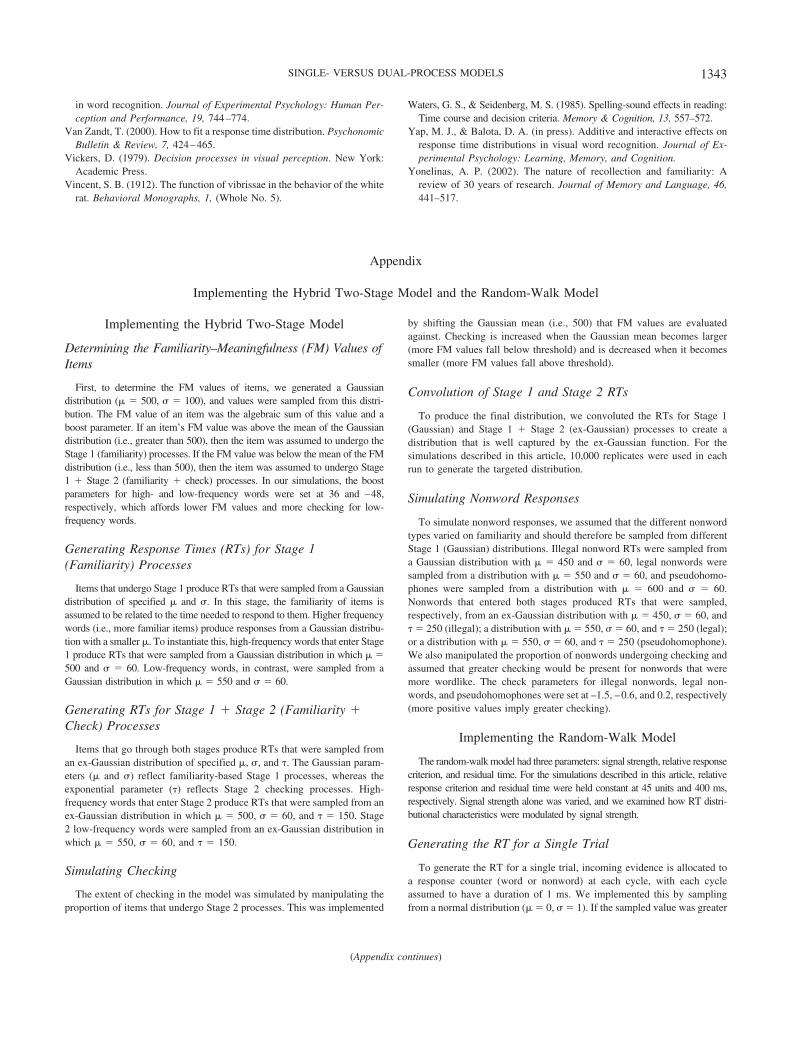
in word recognition. Journal of Experimental Psychology: Human Per-ception and Performance, 19, 744–774.
Van Zandt, T. (2000). How to fit a response time distribution. PsychonomicBulletin & Review, 7, 424–465.
Vickers, D. (1979). Decision processes in visual perception. New York:Academic Press.
Vincent, S. B. (1912). The function of vibrissae in the behavior of the whiterat. Behavioral Monographs, 1, (Whole No. 5).
Waters, G. S., & Seidenberg, M. S. (1985). Spelling-sound effects in reading:Time course and decision criteria. Memory & Cognition, 13, 557–572.
Yap, M. J., & Balota, D. A. (in press). Additive and interactive effects onresponse time distributions in visual word recognition. Journal of Ex-perimental Psychology: Learning, Memory, and Cognition.
Yonelinas, A. P. (2002). The nature of recollection and familiarity: Areview of 30 years of research. Journal of Memory and Language, 46,441–517.
Appendix
Implementing the Hybrid Two-Stage Model and the Random-Walk Model
Implementing the Hybrid Two-Stage Model
Determining the Familiarity–Meaningfulness (FM) Values ofItems
First, to determine the FM values of items, we generated a Gaussiandistribution (� � 500, � � 100), and values were sampled from this distri-bution. The FM value of an item was the algebraic sum of this value and aboost parameter. If an item’s FM value was above the mean of the Gaussiandistribution (i.e., greater than 500), then the item was assumed to undergo theStage 1 (familiarity) processes. If the FM value was below the mean of the FMdistribution (i.e., less than 500), then the item was assumed to undergo Stage1 � Stage 2 (familiarity � check) processes. In our simulations, the boostparameters for high- and low-frequency words were set at 36 and –48,respectively, which affords lower FM values and more checking for low-frequency words.
Generating Response Times (RTs) for Stage 1(Familiarity) Processes
Items that undergo Stage 1 produce RTs that were sampled from a Gaussiandistribution of specified � and �. In this stage, the familiarity of items isassumed to be related to the time needed to respond to them. Higher frequencywords (i.e., more familiar items) produce responses from a Gaussian distribu-tion with a smaller �. To instantiate this, high-frequency words that enter Stage1 produce RTs that were sampled from a Gaussian distribution in which � �500 and � � 60. Low-frequency words, in contrast, were sampled from aGaussian distribution in which � � 550 and � � 60.
Generating RTs for Stage 1 � Stage 2 (Familiarity �Check) Processes
Items that go through both stages produce RTs that were sampled froman ex-Gaussian distribution of specified �, �, and �. The Gaussian param-eters (� and �) reflect familiarity-based Stage 1 processes, whereas theexponential parameter (�) reflects Stage 2 checking processes. High-frequency words that enter Stage 2 produce RTs that were sampled from anex-Gaussian distribution in which � � 500, � � 60, and � � 150. Stage2 low-frequency words were sampled from an ex-Gaussian distribution inwhich � � 550, � � 60, and � � 150.
Simulating Checking
The extent of checking in the model was simulated by manipulating theproportion of items that undergo Stage 2 processes. This was implemented
by shifting the Gaussian mean (i.e., 500) that FM values are evaluatedagainst. Checking is increased when the Gaussian mean becomes larger(more FM values fall below threshold) and is decreased when it becomessmaller (more FM values fall above threshold).
Convolution of Stage 1 and Stage 2 RTs
To produce the final distribution, we convoluted the RTs for Stage 1(Gaussian) and Stage 1 � Stage 2 (ex-Gaussian) processes to create adistribution that is well captured by the ex-Gaussian function. For thesimulations described in this article, 10,000 replicates were used in eachrun to generate the targeted distribution.
Simulating Nonword Responses
To simulate nonword responses, we assumed that the different nonwordtypes varied on familiarity and should therefore be sampled from differentStage 1 (Gaussian) distributions. Illegal nonword RTs were sampled froma Gaussian distribution with � � 450 and � � 60, legal nonwords weresampled from a distribution with � � 550 and � � 60, and pseudohomo-phones were sampled from a distribution with � � 600 and � � 60.Nonwords that entered both stages produced RTs that were sampled,respectively, from an ex-Gaussian distribution with � � 450, � � 60, and� � 250 (illegal); a distribution with � � 550, � � 60, and � � 250 (legal);or a distribution with � � 550, � � 60, and � � 250 (pseudohomophone).We also manipulated the proportion of nonwords undergoing checking andassumed that greater checking would be present for nonwords that weremore wordlike. The check parameters for illegal nonwords, legal non-words, and pseudohomophones were set at –1.5, –0.6, and 0.2, respectively(more positive values imply greater checking).
Implementing the Random-Walk Model
The random-walk model had three parameters: signal strength, relative responsecriterion, and residual time. For the simulations described in this article, relativeresponse criterion and residual time were held constant at 45 units and 400 ms,respectively. Signal strength alone was varied, and we examined how RT distri-butional characteristics were modulated by signal strength.
Generating the RT for a Single Trial
To generate the RT for a single trial, incoming evidence is allocated toa response counter (word or nonword) at each cycle, with each cycleassumed to have a duration of 1 ms. We implemented this by samplingfrom a normal distribution (� � 0, � � 1). If the sampled value was greater
(Appendix continues)
1343SINGLE- VERSUS DUAL-PROCESS MODELS

than some specified criterion from this normal distribution, then a unit ofevidence was allocated to the word response; otherwise, it was allocated tothe nonword response. Signal strength is reflected by the criterion from thenormal distribution that defines whether a randomly selected unit is addedto the word or nonword counter. Greater signal strengths lower the crite-rion, making it more probable that evidence is allocated to the wordresponse counter. This process was repeated until the evidence for aresponse exceeded its competitor by some specified amount. In our sim-ulations, the random-walk process terminated when the difference betweenthe word and nonword response counters exceeded 45 units. The numberof cycles taken to achieve this difference is the decision latency, which wasadded to the residual time to produce the overall RT for that trial.
Generating RT Distributions
The description above only produces a single RT. To simulate RT distri-butions, it is necessary to repeat the process to generate multiple RTs. For oursimulations, we generated 3,000 RTs for each run and fitted the resulting RT
distributions to an ex-Gaussian function. Just as Spieler et al. (2000) observed,these distributions were well fit by the ex-Gaussian function.
Simulating Nonword Responses
To simulate nonword responses, we assumed that the nonwords in thethree nonword type conditions had negative signal strengths that were ofsimilar magnitude to the low-frequency words in the respective conditions(on the basis of diffusion-model parameters in Ratcliff et al., 2004). Forexample, in the pseudohomophone condition, if the signal strength oflow-frequency words was 0.548, then we assumed that pseudohomophonestherefore had a signal strength of –0.548. Obviously, this is merely a verycrude first approximation.
Received July 12, 2005Revision received February 17, 2006
Accepted February 19, 2006 �
Members of Underrepresented Groups:Reviewers for Journal Manuscripts Wanted
If you are interested in reviewing manuscripts for APA journals, the APA Publications andCommunications Board would like to invite your participation. Manuscript reviewers are vital to thepublications process. As a reviewer, you would gain valuable experience in publishing. The P&CBoard is particularly interested in encouraging members of underrepresented groups to participatemore in this process.
If you are interested in reviewing manuscripts, please write to the address below. Please note thefollowing important points:
• To be selected as a reviewer, you must have published articles in peer-reviewed journals. Theexperience of publishing provides a reviewer with the basis for preparing a thorough, objectivereview.
• To be selected, it is critical to be a regular reader of the five to six empirical journals that are mostcentral to the area or journal for which you would like to review. Current knowledge of recentlypublished research provides a reviewer with the knowledge base to evaluate a new submissionwithin the context of existing research.
• To select the appropriate reviewers for each manuscript, the editor needs detailed information.Please include with your letter your vita. In the letter, please identify which APA journal(s) youare interested in, and describe your area of expertise. Be as specific as possible. For example,“social psychology” is not sufficient—you would need to specify “social cognition” or “attitudechange” as well.
• Reviewing a manuscript takes time (1–4 hours per manuscript reviewed). If you are selected toreview a manuscript, be prepared to invest the necessary time to evaluate the manuscriptthoroughly.
Write to Journals Office, American Psychological Association, 750 First Street, NE, Washington,DC 20002-4242.
1344 YAP, BALOTA, CORTESE, AND WATSON
Copyright © 2022 FDOKUMEN