Single layers of a multifunctional laminar Cu(i,ii) coordination polymer
10
1 Single layers of a multifunctional laminar Cu(I,II) coordination polymer Pilar Amo-Ochoa, Lorena Welte, Rodrigo González-Prieto, Pablo J. Sanz Miguel, Carlos J. Gómez-García, Eva Mateo-Martí, Salome Delgado, Julio Gómez-Herrero, and Félix Zamora* Supporting Information Supplementary Material (ESI) for Chemical Communications This journal is (c) The Royal Society of Chemistry 2010
-
Upload
independent -
Category
Documents
-
view
0 -
download
0
Transcript of Single layers of a multifunctional laminar Cu(i,ii) coordination polymer

1
Single layers of a multifunctional laminar
Cu(I,II) coordination polymer
Pilar Amo-Ochoa, Lorena Welte, Rodrigo González-Prieto, Pablo J. Sanz Miguel, Carlos
J. Gómez-García, Eva Mateo-Martí, Salome Delgado, Julio Gómez-Herrero, and Félix
Zamora*
Supporting Information
Supplementary Material (ESI) for Chemical CommunicationsThis journal is (c) The Royal Society of Chemistry 2010
2
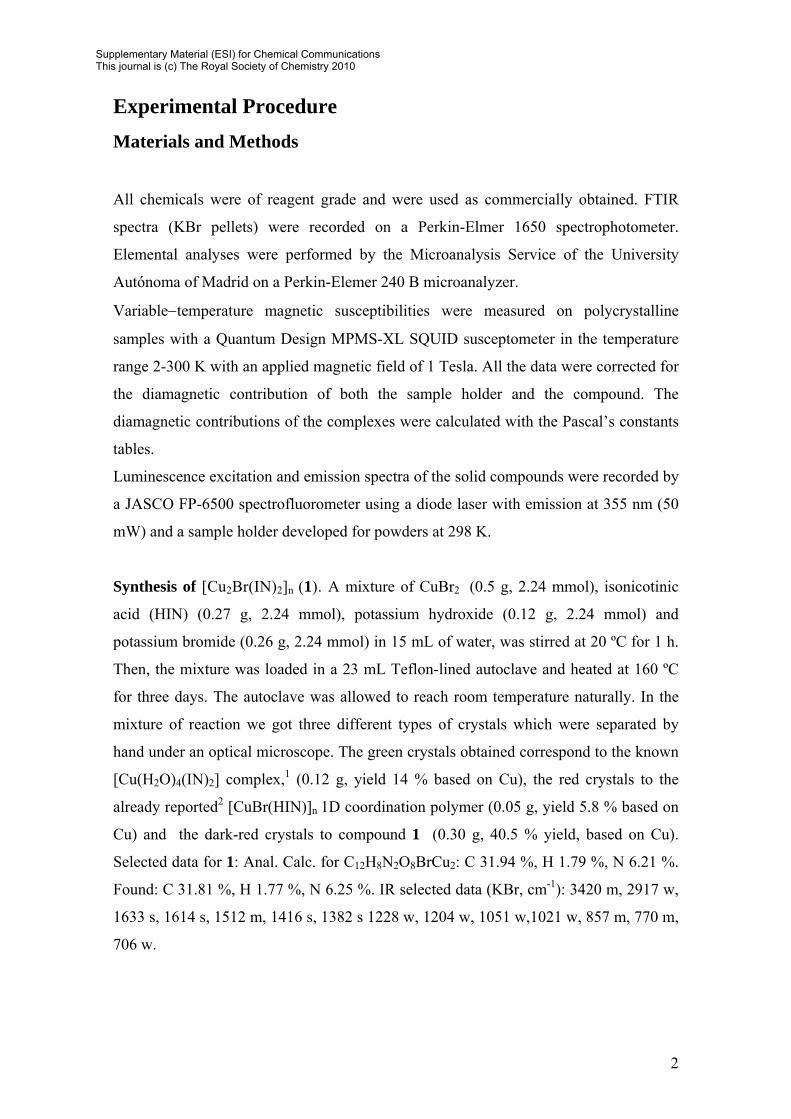
Experimental Procedure Materials and Methods
All chemicals were of reagent grade and were used as commercially obtained. FTIR
spectra (KBr pellets) were recorded on a Perkin-Elmer 1650 spectrophotometer.
Elemental analyses were performed by the Microanalysis Service of the University
Autónoma of Madrid on a Perkin-Elemer 240 B microanalyzer.
Variable−temperature magnetic susceptibilities were measured on polycrystalline
samples with a Quantum Design MPMS-XL SQUID susceptometer in the temperature
range 2-300 K with an applied magnetic field of 1 Tesla. All the data were corrected for
the diamagnetic contribution of both the sample holder and the compound. The
diamagnetic contributions of the complexes were calculated with the Pascal’s constants
tables.
Luminescence excitation and emission spectra of the solid compounds were recorded by
a JASCO FP-6500 spectrofluorometer using a diode laser with emission at 355 nm (50
mW) and a sample holder developed for powders at 298 K.
Synthesis of [Cu2Br(IN)2]n (1). A mixture of CuBr2 (0.5 g, 2.24 mmol), isonicotinic
acid (HIN) (0.27 g, 2.24 mmol), potassium hydroxide (0.12 g, 2.24 mmol) and
potassium bromide (0.26 g, 2.24 mmol) in 15 mL of water, was stirred at 20 ºC for 1 h.
Then, the mixture was loaded in a 23 mL Teflon-lined autoclave and heated at 160 ºC
for three days. The autoclave was allowed to reach room temperature naturally. In the
mixture of reaction we got three different types of crystals which were separated by
hand under an optical microscope. The green crystals obtained correspond to the known
[Cu(H2O)4(IN)2] complex,1 (0.12 g, yield 14 % based on Cu), the red crystals to the
already reported2 [CuBr(HIN)]n 1D coordination polymer (0.05 g, yield 5.8 % based on
Cu) and the dark-red crystals to compound 1 (0.30 g, 40.5 % yield, based on Cu).
Selected data for 1: Anal. Calc. for C12H8N2O8BrCu2: C 31.94 %, H 1.79 %, N 6.21 %.
Found: C 31.81 %, H 1.77 %, N 6.25 %. IR selected data (KBr, cm-1): 3420 m, 2917 w,
1633 s, 1614 s, 1512 m, 1416 s, 1382 s 1228 w, 1204 w, 1051 w,1021 w, 857 m, 770 m,
706 w.
Supplementary Material (ESI) for Chemical CommunicationsThis journal is (c) The Royal Society of Chemistry 2010
3
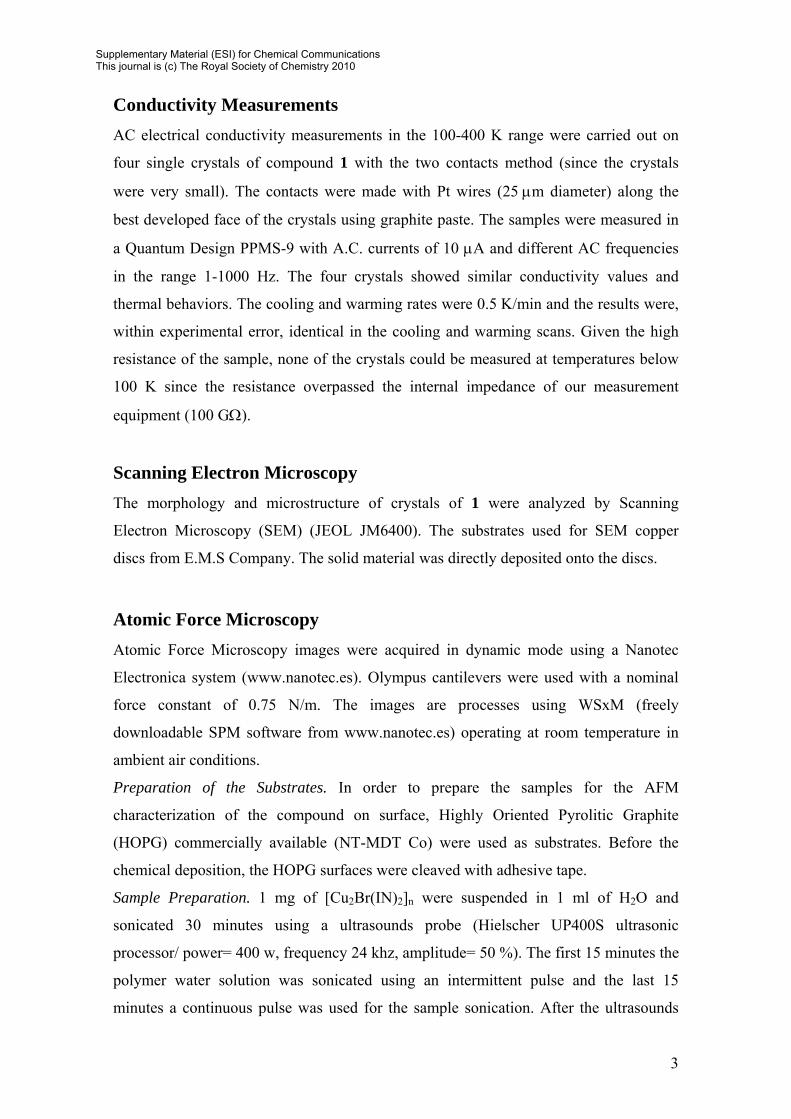
Conductivity Measurements AC electrical conductivity measurements in the 100-400 K range were carried out on
four single crystals of compound 1 with the two contacts method (since the crystals
were very small). The contacts were made with Pt wires (25 μm diameter) along the
best developed face of the crystals using graphite paste. The samples were measured in
a Quantum Design PPMS-9 with A.C. currents of 10 μA and different AC frequencies
in the range 1-1000 Hz. The four crystals showed similar conductivity values and
thermal behaviors. The cooling and warming rates were 0.5 K/min and the results were,
within experimental error, identical in the cooling and warming scans. Given the high
resistance of the sample, none of the crystals could be measured at temperatures below
100 K since the resistance overpassed the internal impedance of our measurement
equipment (100 GΩ).
Scanning Electron Microscopy The morphology and microstructure of crystals of 1 were analyzed by Scanning
Electron Microscopy (SEM) (JEOL JM6400). The substrates used for SEM copper
discs from E.M.S Company. The solid material was directly deposited onto the discs.
Atomic Force Microscopy Atomic Force Microscopy images were acquired in dynamic mode using a Nanotec
Electronica system (www.nanotec.es). Olympus cantilevers were used with a nominal
force constant of 0.75 N/m. The images are processes using WSxM (freely
downloadable SPM software from www.nanotec.es) operating at room temperature in
ambient air conditions.
Preparation of the Substrates. In order to prepare the samples for the AFM
characterization of the compound on surface, Highly Oriented Pyrolitic Graphite
(HOPG) commercially available (NT-MDT Co) were used as substrates. Before the
chemical deposition, the HOPG surfaces were cleaved with adhesive tape.
Sample Preparation. 1 mg of [Cu2Br(IN)2]n were suspended in 1 ml of H2O and
sonicated 30 minutes using a ultrasounds probe (Hielscher UP400S ultrasonic
processor/ power= 400 w, frequency 24 khz, amplitude= 50 %). The first 15 minutes the
polymer water solution was sonicated using an intermittent pulse and the last 15
minutes a continuous pulse was used for the sample sonication. After the ultrasounds
Supplementary Material (ESI) for Chemical CommunicationsThis journal is (c) The Royal Society of Chemistry 2010
4
treatment a dispersion of 1 in water was obtained and diluted to a concentration of 10-6
mg/mL and 10-10 mg/mL. 40 μl of the diluted solutions were deposited on HOPG. Upon
standing 5 min. on the HOPG at 20 ºC, the substrates were washed with water and then
dried under an argon flow.
X-ray Crystallography X-ray crystal data for 1 were recorded at 150 K with an Xcalibur diffractometer
equipped with an area detector and graphite monochromated Mo Kα radiation (0.71073
Å). Data reduction was done with the CrysAlisPro software.3 The structure was solved
by direct methods and refined by full-matrix least-squares methods based on F2 using
SHELXL-97.4 All non-hydrogen atoms were refined anisotropically. All hydrogen
atoms were positioned geometrically and refined with isotropic displacement
parameters according to the riding model. All calculations were performed using the
SHELXL-97 and WinGX programs.4,5
References
1. N. Okabe, T. Nakamura and H. Fukuda, Acta Cryst. Sect. C-Cryst. Struct. Commun.,
1993, 49, 1761-1762.
2. J. H. Yu, J. Q. Xu, L. Ye, H. Ding, W. J. Jing, T. G. Wang, J. N. Xu, H. B. Jia, Z. C.
Mu and G. D. Yang, Inorg. Chem. Commun., 2002, 5, 572-576.
3. CrysAlisPro, Oxford Diffraction (Poland), 2009.
4. G. M. Sheldrick, SHELXS97 and SHELXL97; University of Göttingen (Germany),
1997.
5. L. J. Farrugia, WinGX; University of Glasgow (Great Britain), 1998.
Supplementary Material (ESI) for Chemical CommunicationsThis journal is (c) The Royal Society of Chemistry 2010
5
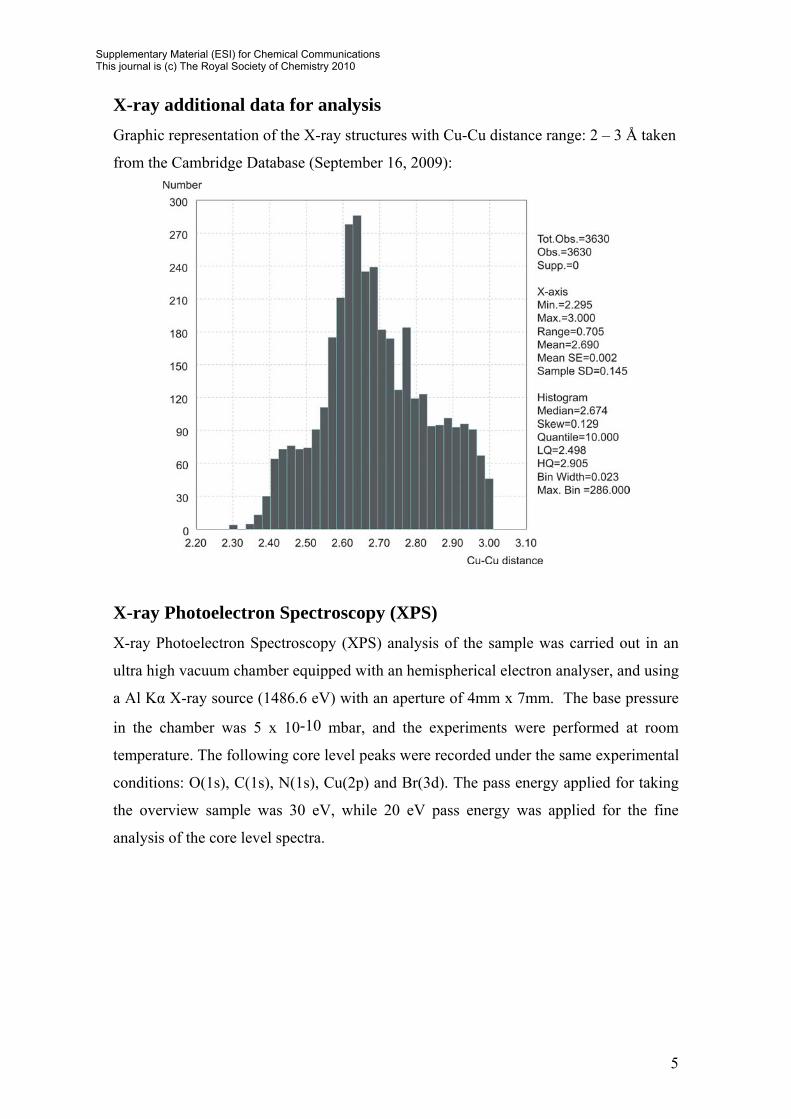
X-ray additional data for analysis Graphic representation of the X-ray structures with Cu-Cu distance range: 2 – 3 Å taken
from the Cambridge Database (September 16, 2009):
X-ray Photoelectron Spectroscopy (XPS) X-ray Photoelectron Spectroscopy (XPS) analysis of the sample was carried out in an
ultra high vacuum chamber equipped with an hemispherical electron analyser, and using
a Al Kα X-ray source (1486.6 eV) with an aperture of 4mm x 7mm. The base pressure
in the chamber was 5 x 10⁻¹⁰ mbar, and the experiments were performed at room
temperature. The following core level peaks were recorded under the same experimental
conditions: O(1s), C(1s), N(1s), Cu(2p) and Br(3d). The pass energy applied for taking
the overview sample was 30 eV, while 20 eV pass energy was applied for the fine
analysis of the core level spectra.
Supplementary Material (ESI) for Chemical CommunicationsThis journal is (c) The Royal Society of Chemistry 2010
6
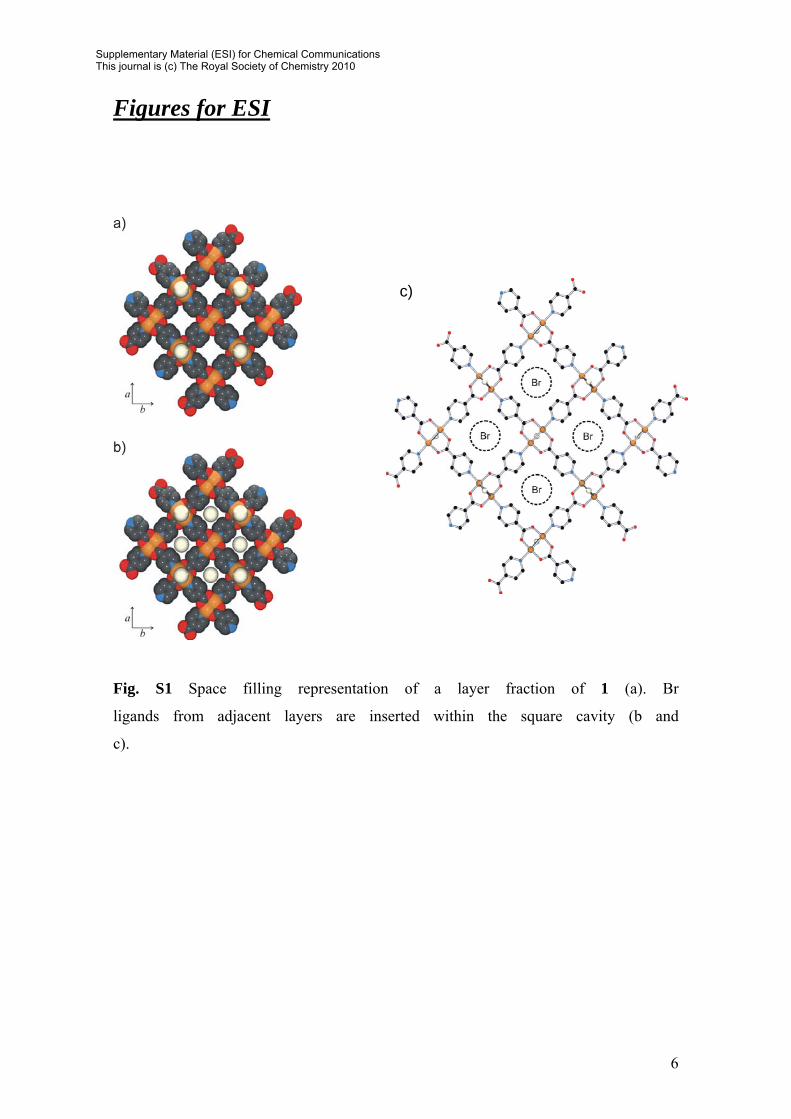
Figures for ESI
c)c)
Fig. S1 Space filling representation of a layer fraction of 1 (a). Br
ligands from adjacent layers are inserted within the square cavity (b and
c).
Supplementary Material (ESI) for Chemical CommunicationsThis journal is (c) The Royal Society of Chemistry 2010
7
0.00
0.05
0.10
0.15
0.20
0.0
0.1
0.2
0.3
0.4
0.5
0.6
0 50 100 150 200 250 300
χ m (e
mu.
mol
-1)
χ mT
(em
u.K
.mol
-1)
T (K)
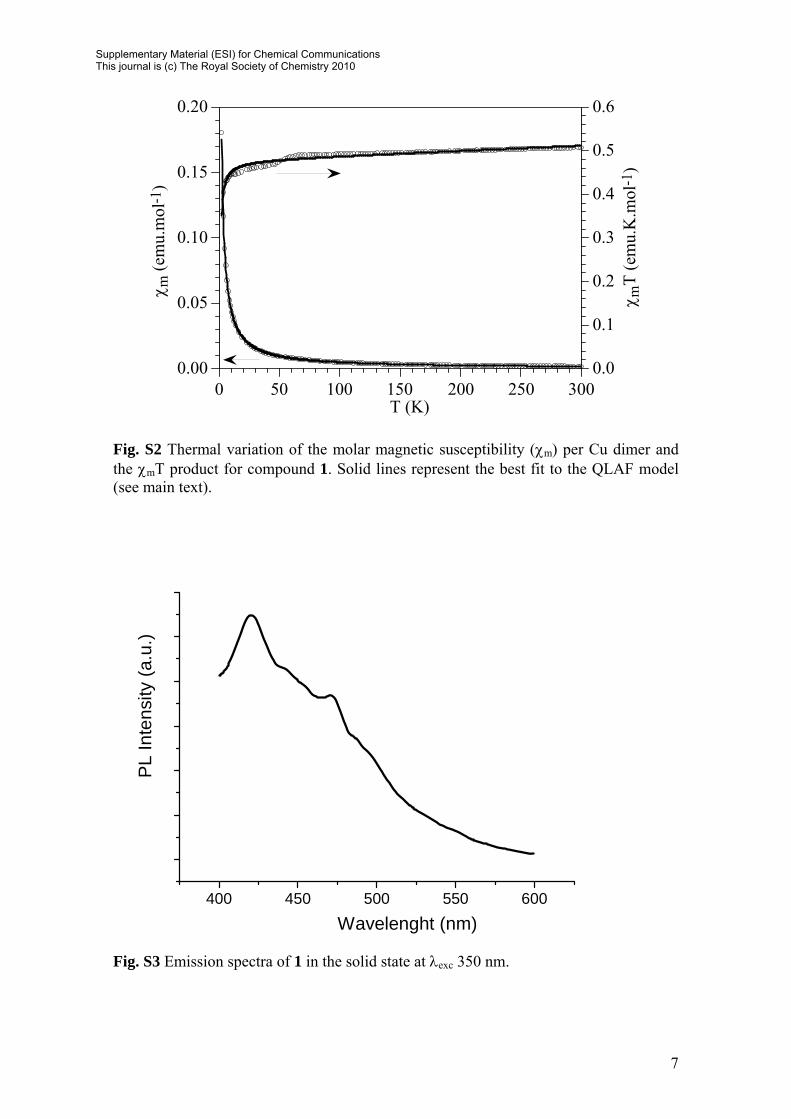
Fig. S2 Thermal variation of the molar magnetic susceptibility (χm) per Cu dimer and the χmT product for compound 1. Solid lines represent the best fit to the QLAF model (see main text).
400 450 500 550 600
PL
Inte
nsity
(a.u
.)
Wavelenght (nm)
Fig. S3 Emission spectra of 1 in the solid state at λexc 350 nm.
Supplementary Material (ESI) for Chemical CommunicationsThis journal is (c) The Royal Society of Chemistry 2010
8
600nm
(c)
600nm3500
5
0X [nm]
Z[Å
](b)
600nm600nm
(a)
3500
5
0X [nm]
Z[Å
]
(c)
(b)
600nm
(c)
600nm3500
5
0X [nm]
Z[Å
](b)
600nm600nm
(a)
3500
5
0X [nm]
Z[Å
]
(c)
(b)
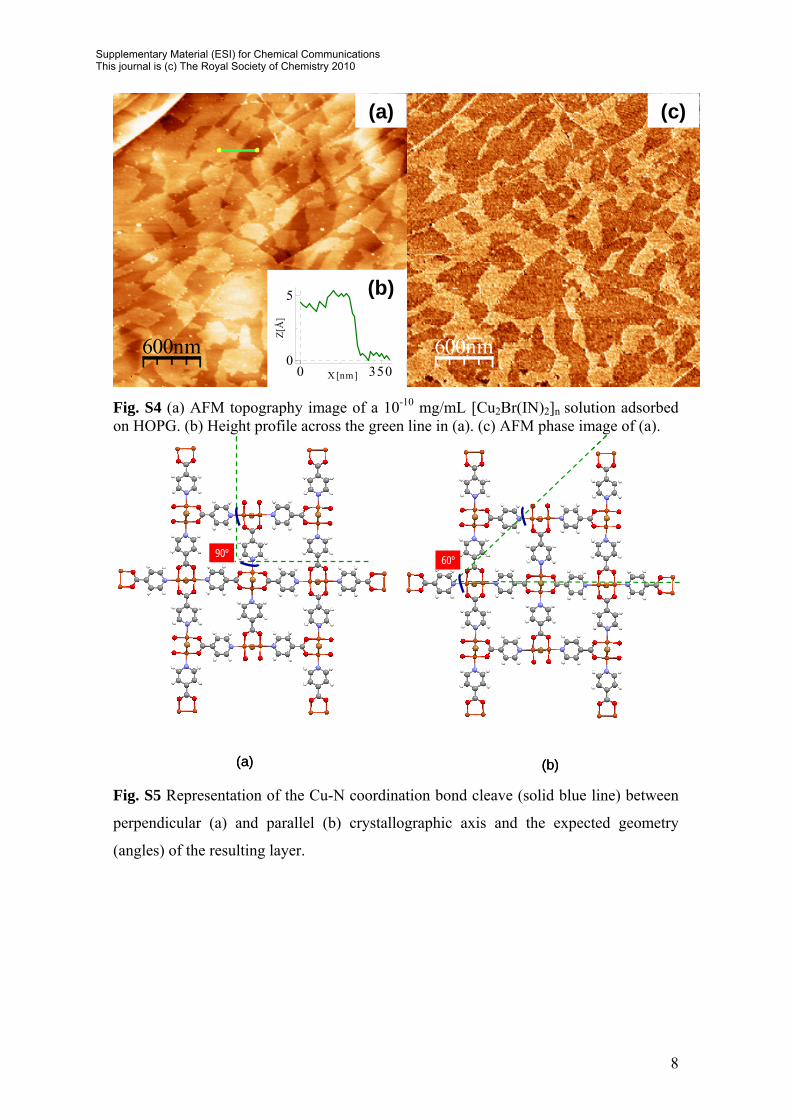
Fig. S4 (a) AFM topography image of a 10-10 mg/mL [Cu2Br(IN)2]n solution adsorbed on HOPG. (b) Height profile across the green line in (a). (c) AFM phase image of (a).
(a) (b)
90º 60º
(a) (b)
90º 60º
Fig. S5 Representation of the Cu-N coordination bond cleave (solid blue line) between
perpendicular (a) and parallel (b) crystallographic axis and the expected geometry
(angles) of the resulting layer.
Supplementary Material (ESI) for Chemical CommunicationsThis journal is (c) The Royal Society of Chemistry 2010

9
(b)
400nm
(a) (b)
400nm400nm400nm
(a)
Fig. S6 (a) AFM topography image of a 10-6 mg/mL [Cu2Br(IN)2]n solution adsorbed on HOPG. (b) 3D detail of (a) in which is possible to see the layered structure of the compound.
200 μm 50 μm
3 μm10 μm
200 μm 50 μm
3 μm10 μm
Fig. S7 Selected scanning electron micrographs showing the lamellar structure of 1.
Supplementary Material (ESI) for Chemical CommunicationsThis journal is (c) The Royal Society of Chemistry 2010
10
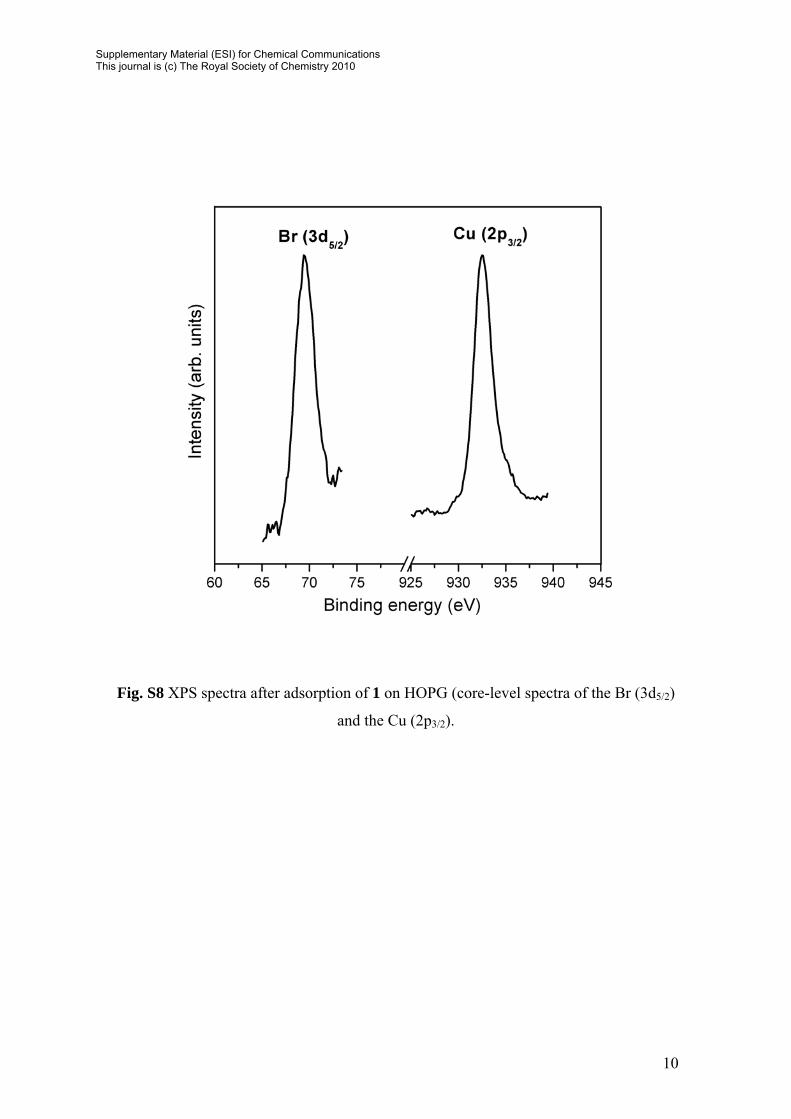
Fig. S8 XPS spectra after adsorption of 1 on HOPG (core-level spectra of the Br (3d5/2)
and the Cu (2p3/2).
Supplementary Material (ESI) for Chemical CommunicationsThis journal is (c) The Royal Society of Chemistry 2010