Simultaneous RP-LC Analysis of Diltiazem and Non-Steroidal Anti-Inflammatory Drugs in Pharmaceutical...
7
Simultaneous RP-LC Analysis of Diltiazem and Non-Steroidal Anti-Inflammatory Drugs in Pharmaceutical Formulations and Human Serum Najma Sultana 1,& , M. Saeed Arayne 2 , Nighat Shafi 1 , Farhan A. Siddiqui 2 1 Research Institute of Pharmaceutical Sciences, Faculty of Pharmacy, University of Karachi, Karachi 75270, Pakistan; E-Mail: [email protected] 2 Department of Chemistry, University of Karachi, Karachi 75270, Pakistan Received: 20 February 2009 / Revised: 25 August 2009 / Accepted: 8 October 2009 Online publication: 4 December 2009 Abstract A simple, precise, accurate, selective, and sensitive reversed-phase LC–UV method has been developed for simultaneous analysis of diltiazem and non-steroidal anti-inflammatory drugs (NSAIDs) in the bulk drug, tablet dosage forms, and human serum. Chromatographic sep- aration of the drugs was performed at ambient temperature on a C 18 stationary phase with 80:20 (v/v) methanol–water, pH 3.1 ± 0.02, as isocratic mobile phase. The mobile phase flow rate was initially 0.5 mL min -1 then increased to 1 mL min -1 . All the NSAIDs were well separated from each other and from diltiazem. Total run time was 10 min. The assay was successfully applied to pharmaceutical formulations and serum and there was no chro- matographic interference from tablet excipients. The method was linear in the range 1.25–50 lg mL -1 both for diltiazem and the NSAIDs. The suitability of this HPLC method for quantitative analysis of the drugs was proved by validation in accordance with International Conference on Harmonization (ICH) guidelines. The validation results, and results from statistical analysis of the data, demonstrated the method was reliable. Keywords Column liquid chromatography Diltiazem Non-steroidal anti-inflammatory drugs (NSAIDs) Method validation Introduction Diltiazem hydrochloride is a calcium- channel antagonist which inhibits influx of calcium (Ca 2+ ) ions. It has peripheral and coronary vasodilator properties and, because it reduces blood pressure and has some effect on cardiac conduction, has gained widespread acceptance as an anti- anginal and antihypertensive agent [1, 2]. Non-steroidal anti-inflammatory drugs (NSAIDs), which are readily available over the counter or on prescription, have antipyretic, anti-inflammatory, and analgesic effects [3]; their common side effects include gastrointestinal hemor- rhage and ulceration [4]. Because hypertension and musculo- skeletal problems are two common conditions which frequently occur simultaneously, antihypertensive drugs (e.g. diltiazem) and analgesic drugs (e.g. NSAIDs) are commonly prescribed in combination [5–8]. NSAIDs can increase blood pressure, however, particularly in hypertensive subjects [6, 9, 10], and can, therefore, partially or completely antagonize the effects of many antihypertensive drugs [11], reducing their efficacy and thus compli- cating the management of hypertension [12]. Several probable mechanisms of elevation of blood pressure by NSAIDs have been demonstrated [13–19]. Because diltiazem and NSAIDs are commonly prescribed in combination, the objective of this study was to estab- lish an efficient, reliable, accurate and sensitive method for their simultaneous separation and quantification. Several methods, including spectrophotometry [20, 21] and LC [22–24], have been reported for analysis of diltiazem in the bulk drug and in pharmaceutical 2010, 71, 71–77 DOI: 10.1365/s10337-009-1425-0 0009-5893/10/01 Ó 2009 Vieweg+Teubner | GWV Fachverlage GmbH Original Chromatographia 2010, 71, January (No. 1/2) 71
-
Upload
independent -
Category
Documents
-
view
1 -
download
0
Transcript of Simultaneous RP-LC Analysis of Diltiazem and Non-Steroidal Anti-Inflammatory Drugs in Pharmaceutical...
Simultaneous RP-LC Analysis of Diltiazemand Non-Steroidal Anti-InflammatoryDrugs in Pharmaceutical Formulationsand Human Serum
Najma Sultana1,&, M. Saeed Arayne2, Nighat Shafi1, Farhan A. Siddiqui2
1 Research Institute of Pharmaceutical Sciences, Faculty of Pharmacy, University of Karachi, Karachi 75270, Pakistan;E-Mail: [email protected]
2 Department of Chemistry, University of Karachi, Karachi 75270, Pakistan
Received: 20 February 2009 / Revised: 25 August 2009 / Accepted: 8 October 2009Online publication: 4 December 2009
Abstract
A simple, precise, accurate, selective, and sensitive reversed-phase LC–UV method has beendeveloped for simultaneous analysis of diltiazem and non-steroidal anti-inflammatory drugs(NSAIDs) in the bulk drug, tablet dosage forms, and human serum. Chromatographic sep-aration of the drugs was performed at ambient temperature on a C18 stationary phase with80:20 (v/v) methanol–water, pH 3.1 ± 0.02, as isocratic mobile phase. The mobile phaseflow rate was initially 0.5 mL min-1 then increased to 1 mL min-1. All the NSAIDs were wellseparated from each other and from diltiazem. Total run time was 10 min. The assay wassuccessfully applied to pharmaceutical formulations and serum and there was no chro-matographic interference from tablet excipients. The method was linear in the range1.25–50 lg mL-1 both for diltiazem and the NSAIDs. The suitability of this HPLC method forquantitative analysis of the drugs was proved by validation in accordance with InternationalConference on Harmonization (ICH) guidelines. The validation results, and results fromstatistical analysis of the data, demonstrated the method was reliable.
Keywords
Column liquid chromatographyDiltiazemNon-steroidal anti-inflammatory drugs (NSAIDs)Method validation
Introduction
Diltiazem hydrochloride is a calcium-
channel antagonist which inhibits influx
of calcium (Ca2+) ions. It has peripheral
and coronary vasodilator properties and,
because it reduces blood pressure and has
some effect on cardiac conduction, has
gained widespread acceptance as an anti-
anginal and antihypertensive agent [1, 2].
Non-steroidal anti-inflammatory drugs
(NSAIDs), which are readily available
over the counter or on prescription,
have antipyretic, anti-inflammatory, and
analgesic effects [3]; their common side
effects include gastrointestinal hemor-
rhage and ulceration [4].
Because hypertension and musculo-
skeletal problems are two common
conditions which frequently occur
simultaneously, antihypertensive drugs
(e.g. diltiazem) and analgesic drugs
(e.g. NSAIDs) are commonly prescribed
in combination [5–8]. NSAIDs can
increase blood pressure, however,
particularly in hypertensive subjects
[6, 9, 10], and can, therefore, partially or
completely antagonize the effects of
many antihypertensive drugs [11],
reducing their efficacy and thus compli-
cating the management of hypertension
[12]. Several probable mechanisms of
elevation of blood pressure by NSAIDs
have been demonstrated [13–19].
Because diltiazem and NSAIDs are
commonly prescribed in combination,
the objective of this study was to estab-
lish an efficient, reliable, accurate and
sensitive method for their simultaneous
separation and quantification. Several
methods, including spectrophotometry
[20, 21] and LC [22–24], have been
reported for analysis of diltiazem in
the bulk drug and in pharmaceutical
2010, 71, 71–77
DOI: 10.1365/s10337-009-1425-00009-5893/10/01 � 2009 Vieweg+Teubner | GWV Fachverlage GmbH
Original Chromatographia 2010, 71, January (No. 1/2) 71
formulations. Methods have also been
reported for analysis of diltiazem in
plasma or serum [25–27] and for LC
separation of the enantiomers, metabo-
lites, possible degradation products, and
analogs of diltiazem [28–30]. Several
methods have also been developed for
investigation of individual NSAIDs, for
example mefenamic acid [31], meloxicam
[32], diclofenac sodium [33] and flurbi-
profen [34], in biological samples (plasma
and serum). A variety of techniques have
been reported for simultaneous analysis
of NSAIDs, including liquid chroma-
tography–electrospray ionization tandem
mass spectrometry [35], LC–APCI–MS
[36], high-performance liquid chromato-
graphy [37–42], capillary zone electro-
phoresis [43], and GC–MS [44, 45].
Koichi et al. [46] developed a sophisti-
cated LC–MS method with solid-phase
extraction for simultaneous analysis
of 16 NSAIDs in human plasma. No
LC method has yet been reported for
separation and simultaneous analysis of
diltiazem and NSAIDs, however, so we
have developed a simple and rapid
method suitable for the simultaneous
analysis of diltiazem and NSAIDs.
Experimental
Chemicals, Reagents, andSolutions
Diltiazem was a kind gift from Hilton
Pharma (Karachi, Pakistan). Diclofenac
sodium (Voren 25 mg), flurbiprofen
(Froben 50 mg), meloxicam (Melfax
15 mg), and mefenamic acid (Ponstan
250 mg) were from Yung Shin Pharma-
ceuticals (Karachi, Pakistan), Abbott
Laboratories (Karachi, Pakistan), Ali
Gohar Pharmaceuticals (Karachi,
Pakistan), and Parke–Davis (Karachi,
Pakistan), respectively, and were obtained
commercially.
Reference standards of all the NSA-
IDs were supplied by Lab-9 of the
Department of Chemistry, University of
Karachi. Each product was labeled and
had an expiry date of not less than
365 days at the time of study.
All reagents were of HPLC grade.
Methanol and phosphoric acid (85%)
(Merck, Germany) and HPLC-grade
deionized filtered water were used to
prepare the mobile phase (80:20 (v/v)
methanol–water).
Stock standard solutions (100 lgmL-1) of diltiazem and each NSAID
were prepared by dissolving appropriate
amounts of the drugs in the mobile
phase. Six calibration standard solutions
of each drug were prepared by serial
dilution of the stock solutions. Fresh
working solutions were prepared daily.
Before use, all solutions were filtered
(0.45 lm) and degassed by sonication.
Sample Preparation
Tablets
For assay, 20 tablets were powdered and
an amount of the powder equivalent to a
suitable amount of drug (according to
the label claim) was weighed and trans-
ferred to a 50-mL volumetric flask. The
drug was fully dissolved in mobile phase
and then diluted to volume with the
same solvent. Six dilutions of each drug
were prepared, filtered through a dis-
posable 0.45-lm filter, and then injected
for LC analysis.
Serum
Blood samples were collected from
healthy volunteers and immediately
centrifuged at 3,000 rpm for 10 min.
The supernatant obtained was stored at
-20 �C. After thawing, serum was
deproteinated by addition of acetonitrile
and spiked daily with working solutions
to furnish the desired concentrations of
diltiazem and the NSAIDs. Samples
(20 lL) were then injected for HPLC
analysis.
Chromatography
HPLC was performed with a Shimadzu
(Tokyo, Japan) system equipped with an
LC-10 AT VP pump, DGU-14 AM
on-line degasser, and an SPD-10 A VP
UV–visible detector. The system was
integrated via a Shimadzu model CBM-
102 to a P-IV computer loaded with
Shimadzu Class-VP software (Version
5.03) for data acquisition and mathe-
matical calculations. Samples were
injected with a Rheodyne manual injec-
tor, fitted with a 20-lL loop, and sepa-
rated, at ambient temperature, on a
Hiber RT 250-4.6 Purospher Star RP-18
column with 80:20 (v/v) methanol–water,
pH adjusted to 3.1 with phosphoric acid
(85%), as isocratic mobile phase. The
pump was initially set at a flow rate of
0.5 mL min-1 and then switched into
1 mL min-1. All samples (20 lL) were
injected in triplicate and the eluent was
monitored at 240 nm.
Method Validation
System suitability was appraised by
sixfold replicate analysis of the drug at a
concentration of 100 lg mL-1. Speci-
ficity and selectivity were assessed by
separate chromatographic analysis of a
mixture of excipients. To assess linearity
six-point calibration plots were created
for diltiazem and the NSAIDs by plot-
ting peak area against concentration.
The limits of detection (LOD) and
quantification (LOQ) of the method
were defined as the amounts for which
signal-to-noise ratios were 3:1 and 10:1,
respectively. The accuracy of the meth-
od was assessed by measurement of
recovery. Formulations of known con-
tent were spiked, in triplicate, with
known amounts of drugs at three levels
(80, 100, and 120% of the label claim)
within the working range and analysis
was performed to determine the total
amount present. Recovery from spiked
blank serum was also measured. The
intra-day and inter-day precision of the
method were assessed by measurement
of relative standard deviation (RSD, %)
of results throughout the linear range. A
method is rugged if different analysts
using different instruments in different
laboratories on different days obtain
similar results [47, 48], so the method
was tested in this way. The robustness of
the method was tested by deliberately
changing mobile phase composition,
flow rate, and pH by small amounts and
studying the effect of the changes on the
results obtained by use of the method
[47, 48].
72 Chromatographia 2010, 71, January (No. 1/2) Original
Results and Discussion
Trouble-free yet sensitive methods are
required for bioanalysis, for example
drug analysis enabling assessment of
physicochemical and therapeutic activ-
ity, pharmacokinetic characteristics, and
study of the bioequivalence of generic
formulations. High-performance liquid
chromatography is the most widely used
technique for this purpose.
Optimization of theChromatographic Conditions
The objective of this study was to
develop a simple, rapid, and effective LC
method with UV detection for simulta-
neous quantitative analysis of diltiazem
and NSAIDs in bulk drugs, pharma-
ceutical formulations, and human
serum. Chromatographic elution was
performed isocratically because this does
not involve re-equilibration of column,
unlike gradient elution [46]. Separation
on different C18 stationary phases was
tested at ambient temperature. Initially a
150 m 9 4.6 mm, 5-lm particle, Hyper-
sil ODS column was evaluated but re-
sults were not acceptable. Because of
peak tailing the analyte peaks were not
well resolved and placebo components
interfered with the analysis. Adequate
resolution was achieved on a Hiber,
RT 250-4.6 Purospher Star RP-18
endcapped (5 lm) column.
To select the absorption wavelength
for detection, UV spectra of diltiazem
and all the NSAIDs were acquired and
overlaid. It was found that the best
response for all the drugs was obtained
at 240 nm.
Mobile phase organic modifier
(methanol) content and pH were opti-
mized. The methanol content was varied
between 65 and 80%. It was found that
amounts between 65 and 78% resulted in
good resolution of the NSAIDs from
diltiazem but not from each other. All of
the analytes were well separated and the
best results (specificity, good resolution,
and short omega peak) were obtained
when the mobile phase contained 80%
methanol. Mobile phase pH can have a
large effect on retention times (tM),
retention factors (k), and the efficiency
(number of theoretical plates) of a
method. To select the optimum mobile
phase pH, values from 2.5 to 4.0 were
investigated. At the lowest pH, retention
of diltiazem and the NSAIDs was
delayed. At the highest pH peak tailing
and poor separation were observed.
Excellent performance was achieved at
pH 3.1 ± 0.02 and the total run time was
10 min; short analysis times are essential
for routine analysis.
Peak Identification
Under the optimized conditions, the
peaks of diltiazem and all the NSAIDs
were identified by comparison of their
retention times with those obtained by
chromatography of the corresponding
standard solutions. The method was
found to be a rapid and universal
approach for identification as diltiazem,
flurbiprofen, diclofenac, meloxicam, and
mefenamic acid, which eluted 2.4, 5.1,
6.2, 7.7, and 9.8 min, respectively.
Method Validation
In drug investigations method valida-
tion, which ensures the method is suit-
able for its intended use, is imperative
according to regulations such as those of
the FDA, EMEA, and ICH [31]. Method
validation requires appraisal of a variety
of method characteristics, for instance
system suitability, selectivity, specificity,
linearity, accuracy, precision, sensitivity,
limits of detection and quantification in
the matrix of interest [49].
Assessment of system suitability is
imperative to ensure the method is per-
forming appropriately throughout the
analysis. Results from measurement of
characteristics typically used to assess
method suitability are summarized in
Table 1.
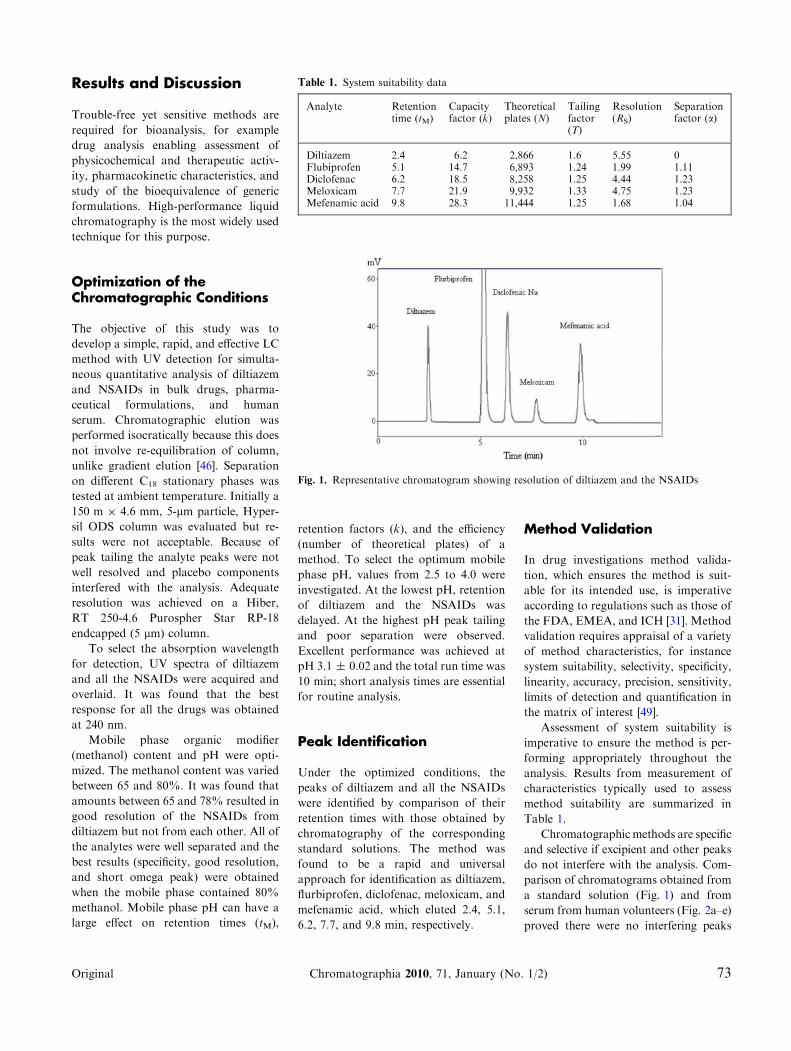
Chromatographic methods are specific
and selective if excipient and other peaks
do not interfere with the analysis. Com-
parison of chromatograms obtained from
a standard solution (Fig. 1) and from
serum from human volunteers (Fig. 2a–e)
proved there were no interfering peaks
Table 1. System suitability data
Analyte Retentiontime (tM)
Capacityfactor (k)
Theoreticalplates (N)
Tailingfactor(T)
Resolution(RS)
Separationfactor (a)
Diltiazem 2.4 6.2 2,866 1.6 5.55 0Flubiprofen 5.1 14.7 6,893 1.24 1.99 1.11Diclofenac 6.2 18.5 8,258 1.25 4.44 1.23Meloxicam 7.7 21.9 9,932 1.33 4.75 1.23Mefenamic acid 9.8 28.3 11,444 1.25 1.68 1.04
Fig. 1. Representative chromatogram showing resolution of diltiazem and the NSAIDs
Original Chromatographia 2010, 71, January (No. 1/2) 73
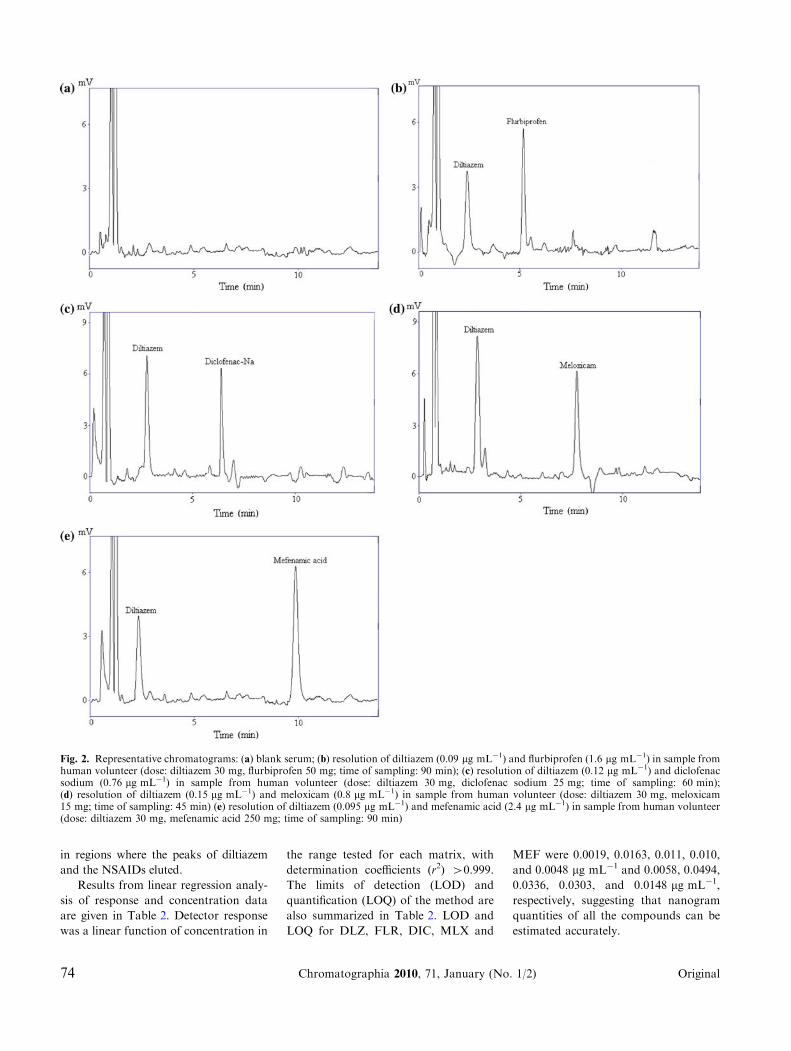
in regions where the peaks of diltiazem
and the NSAIDs eluted.
Results from linear regression analy-
sis of response and concentration data
are given in Table 2. Detector response
was a linear function of concentration in
the range tested for each matrix, with
determination coefficients (r2) >0.999.
The limits of detection (LOD) and
quantification (LOQ) of the method are
also summarized in Table 2. LOD and
LOQ for DLZ, FLR, DIC, MLX and
MEF were 0.0019, 0.0163, 0.011, 0.010,
and 0.0048 lg mL-1 and 0.0058, 0.0494,
0.0336, 0.0303, and 0.0148 lg mL-1,
respectively, suggesting that nanogram
quantities of all the compounds can be
estimated accurately.
Fig. 2. Representative chromatograms: (a) blank serum; (b) resolution of diltiazem (0.09 lg mL-1) and flurbiprofen (1.6 lg mL-1) in sample fromhuman volunteer (dose: diltiazem 30 mg, flurbiprofen 50 mg; time of sampling: 90 min); (c) resolution of diltiazem (0.12 lg mL-1) and diclofenacsodium (0.76 lg mL-1) in sample from human volunteer (dose: diltiazem 30 mg, diclofenac sodium 25 mg; time of sampling: 60 min);(d) resolution of diltiazem (0.15 lg mL-1) and meloxicam (0.8 lg mL-1) in sample from human volunteer (dose: diltiazem 30 mg, meloxicam15 mg; time of sampling: 45 min) (e) resolution of diltiazem (0.095 lg mL-1) and mefenamic acid (2.4 lg mL-1) in sample from human volunteer(dose: diltiazem 30 mg, mefenamic acid 250 mg; time of sampling: 90 min)
74 Chromatographia 2010, 71, January (No. 1/2) Original
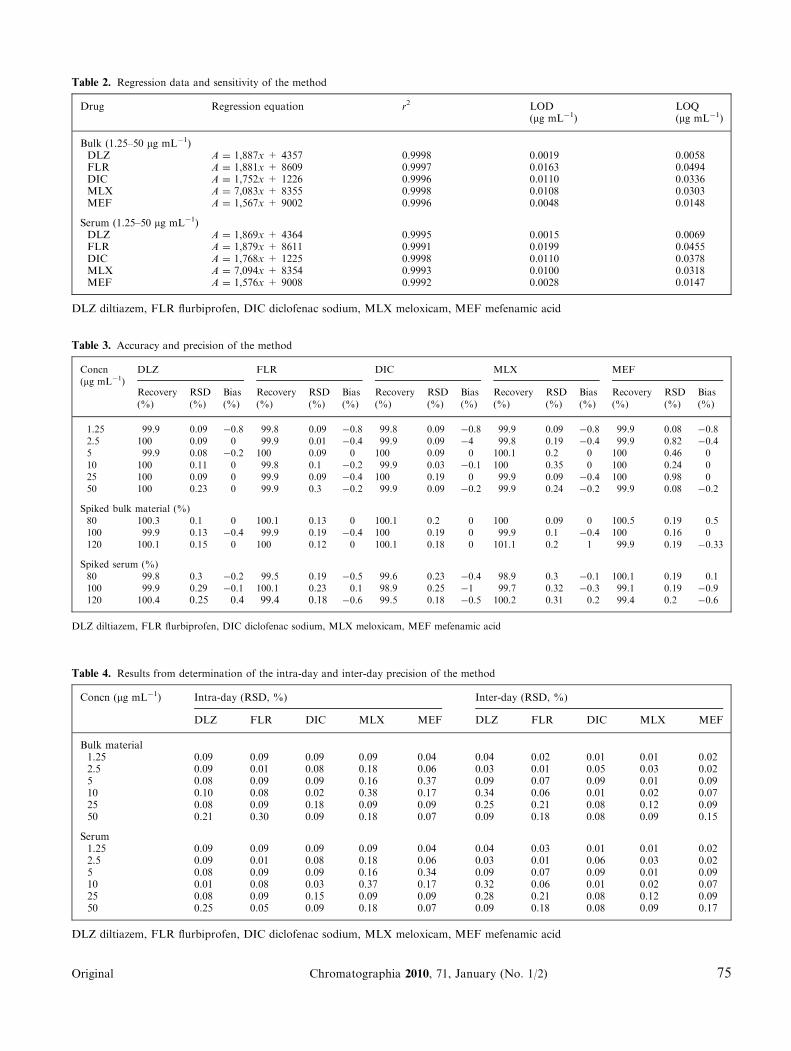
Table 2. Regression data and sensitivity of the method
Drug Regression equation r2 LOD(lg mL-1)
LOQ(lg mL-1)
Bulk (1.25–50 lg mL-1)DLZ A = 1,887x + 4357 0.9998 0.0019 0.0058FLR A = 1,881x + 8609 0.9997 0.0163 0.0494DIC A = 1,752x + 1226 0.9996 0.0110 0.0336MLX A = 7,083x + 8355 0.9998 0.0108 0.0303MEF A = 1,567x + 9002 0.9996 0.0048 0.0148
Serum (1.25–50 lg mL-1)DLZ A = 1,869x + 4364 0.9995 0.0015 0.0069FLR A = 1,879x + 8611 0.9991 0.0199 0.0455DIC A = 1,768x + 1225 0.9998 0.0110 0.0378MLX A = 7,094x + 8354 0.9993 0.0100 0.0318MEF A = 1,576x + 9008 0.9992 0.0028 0.0147
DLZ diltiazem, FLR flurbiprofen, DIC diclofenac sodium, MLX meloxicam, MEF mefenamic acid
Table 3. Accuracy and precision of the method
Concn(lg mL-1)
DLZ FLR DIC MLX MEF
Recovery(%)
RSD(%)
Bias(%)
Recovery(%)
RSD(%)
Bias(%)
Recovery(%)
RSD(%)
Bias(%)
Recovery(%)
RSD(%)
Bias(%)
Recovery(%)
RSD(%)
Bias(%)
1.25 99.9 0.09 -0.8 99.8 0.09 -0.8 99.8 0.09 -0.8 99.9 0.09 -0.8 99.9 0.08 -0.82.5 100 0.09 0 99.9 0.01 -0.4 99.9 0.09 -4 99.8 0.19 -0.4 99.9 0.82 -0.45 99.9 0.08 -0.2 100 0.09 0 100 0.09 0 100.1 0.2 0 100 0.46 010 100 0.11 0 99.8 0.1 -0.2 99.9 0.03 -0.1 100 0.35 0 100 0.24 025 100 0.09 0 99.9 0.09 -0.4 100 0.19 0 99.9 0.09 -0.4 100 0.98 050 100 0.23 0 99.9 0.3 -0.2 99.9 0.09 -0.2 99.9 0.24 -0.2 99.9 0.08 -0.2
Spiked bulk material (%)80 100.3 0.1 0 100.1 0.13 0 100.1 0.2 0 100 0.09 0 100.5 0.19 0.5100 99.9 0.13 -0.4 99.9 0.19 -0.4 100 0.19 0 99.9 0.1 -0.4 100 0.16 0120 100.1 0.15 0 100 0.12 0 100.1 0.18 0 101.1 0.2 1 99.9 0.19 -0.33
Spiked serum (%)80 99.8 0.3 -0.2 99.5 0.19 -0.5 99.6 0.23 -0.4 98.9 0.3 -0.1 100.1 0.19 0.1100 99.9 0.29 -0.1 100.1 0.23 0.1 98.9 0.25 -1 99.7 0.32 -0.3 99.1 0.19 -0.9120 100.4 0.25 0.4 99.4 0.18 -0.6 99.5 0.18 -0.5 100.2 0.31 0.2 99.4 0.2 -0.6
DLZ diltiazem, FLR flurbiprofen, DIC diclofenac sodium, MLX meloxicam, MEF mefenamic acid
Table 4. Results from determination of the intra-day and inter-day precision of the method
Concn (lg mL-1) Intra-day (RSD, %) Inter-day (RSD, %)
DLZ FLR DIC MLX MEF DLZ FLR DIC MLX MEF
Bulk material1.25 0.09 0.09 0.09 0.09 0.04 0.04 0.02 0.01 0.01 0.022.5 0.09 0.01 0.08 0.18 0.06 0.03 0.01 0.05 0.03 0.025 0.08 0.09 0.09 0.16 0.37 0.09 0.07 0.09 0.01 0.0910 0.10 0.08 0.02 0.38 0.17 0.34 0.06 0.01 0.02 0.0725 0.08 0.09 0.18 0.09 0.09 0.25 0.21 0.08 0.12 0.0950 0.21 0.30 0.09 0.18 0.07 0.09 0.18 0.08 0.09 0.15
Serum1.25 0.09 0.09 0.09 0.09 0.04 0.04 0.03 0.01 0.01 0.022.5 0.09 0.01 0.08 0.18 0.06 0.03 0.01 0.06 0.03 0.025 0.08 0.09 0.09 0.16 0.34 0.09 0.07 0.09 0.01 0.0910 0.01 0.08 0.03 0.37 0.17 0.32 0.06 0.01 0.02 0.0725 0.08 0.09 0.15 0.09 0.09 0.28 0.21 0.08 0.12 0.0950 0.25 0.05 0.09 0.18 0.07 0.09 0.18 0.08 0.09 0.17
DLZ diltiazem, FLR flurbiprofen, DIC diclofenac sodium, MLX meloxicam, MEF mefenamic acid
Original Chromatographia 2010, 71, January (No. 1/2) 75
Result from determination of recov-
ery of the analytes are listed in Table 3.
Accuracy ranged from 99.9 to 100.5%
for low, medium, and high levels of all
the analytes. Recovery from serum was
in the range 98.97–100.4%, indicating
there were no significant differences
between the amounts of the drugs added
to serum and the amounts recovered.
Results from assessment of method
precision (intra-day and inter-day
reproducibility) for diltiazem and the
NSAIDs, listed in Tables 3 and 4, indi-
cate there were no significant differences
between true and measured concentra-
tions both within day and between days,
which indicates the method is precise
and reproducible.
Results obtained from testing of
ruggedness are listed in Table 4. These
results of (RSD 0.0121–0.3829%) show
the method can be used to obtain highly
precise results on two different days,
which proves its ruggedness.
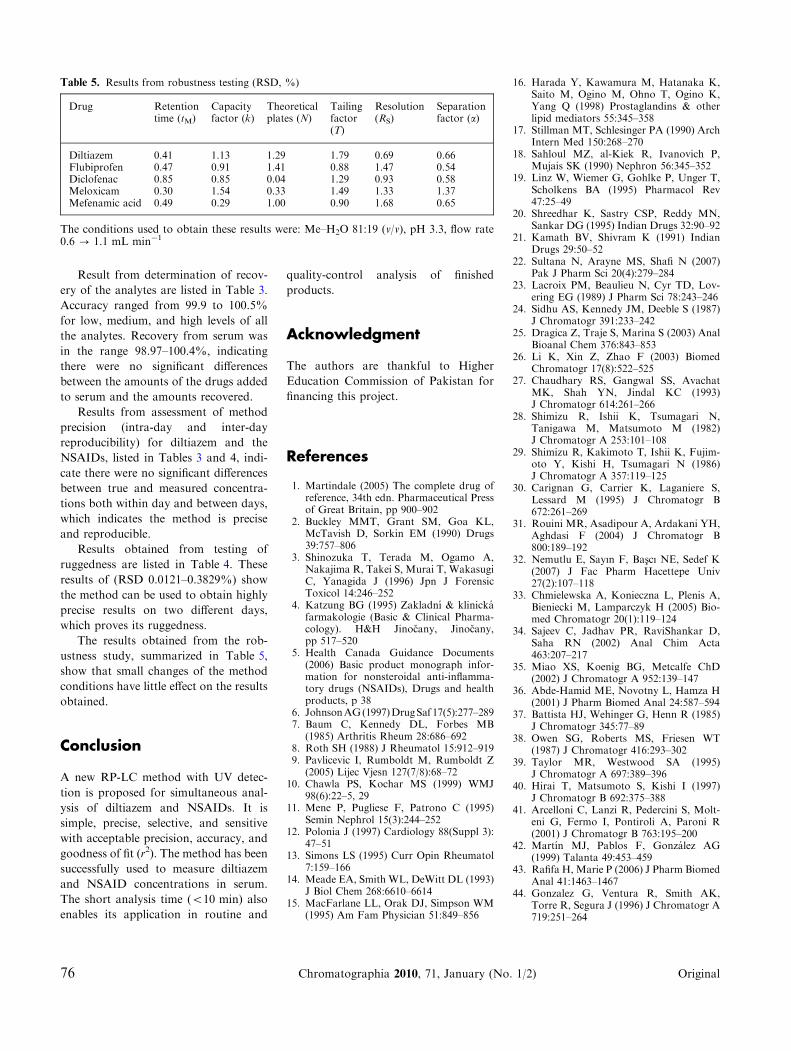
The results obtained from the rob-
ustness study, summarized in Table 5,
show that small changes of the method
conditions have little effect on the results
obtained.
Conclusion
A new RP-LC method with UV detec-
tion is proposed for simultaneous anal-
ysis of diltiazem and NSAIDs. It is
simple, precise, selective, and sensitive
with acceptable precision, accuracy, and
goodness of fit (r2). The method has been
successfully used to measure diltiazem
and NSAID concentrations in serum.
The short analysis time (<10 min) also
enables its application in routine and
quality-control analysis of finished
products.
Acknowledgment
The authors are thankful to Higher
Education Commission of Pakistan for
financing this project.
References
1. Martindale (2005) The complete drug ofreference, 34th edn. Pharmaceutical Pressof Great Britain, pp 900–902
2. Buckley MMT, Grant SM, Goa KL,McTavish D, Sorkin EM (1990) Drugs39:757–806
3. Shinozuka T, Terada M, Ogamo A,Nakajima R, Takei S, Murai T, WakasugiC, Yanagida J (1996) Jpn J ForensicToxicol 14:246–252
4. Katzung BG (1995) Zakladnı & klinickafarmakologie (Basic & Clinical Pharma-cology). H&H Jinocany, Jinocany,pp 517–520
5. Health Canada Guidance Documents(2006) Basic product monograph infor-mation for nonsteroidal anti-inflamma-tory drugs (NSAIDs), Drugs and healthproducts, p 38
6. JohnsonAG(1997)DrugSaf 17(5):277–2897. Baum C, Kennedy DL, Forbes MB
(1985) Arthritis Rheum 28:686–6928. Roth SH (1988) J Rheumatol 15:912–9199. Pavlicevic I, Rumboldt M, Rumboldt Z
(2005) Lijec Vjesn 127(7/8):68–7210. Chawla PS, Kochar MS (1999) WMJ
98(6):22–5, 2911. Mene P, Pugliese F, Patrono C (1995)
Semin Nephrol 15(3):244–25212. Polonia J (1997) Cardiology 88(Suppl 3):
47–5113. Simons LS (1995) Curr Opin Rheumatol
7:159–16614. Meade EA, Smith WL, DeWitt DL (1993)
J Biol Chem 268:6610–661415. MacFarlane LL, Orak DJ, Simpson WM
(1995) Am Fam Physician 51:849–856
16. Harada Y, Kawamura M, Hatanaka K,Saito M, Ogino M, Ohno T, Ogino K,Yang Q (1998) Prostaglandins & otherlipid mediators 55:345–358
17. Stillman MT, Schlesinger PA (1990) ArchIntern Med 150:268–270
18. Sahloul MZ, al-Kiek R, Ivanovich P,Mujais SK (1990) Nephron 56:345–352
19. Linz W, Wiemer G, Gohlke P, Unger T,Scholkens BA (1995) Pharmacol Rev47:25–49
20. Shreedhar K, Sastry CSP, Reddy MN,Sankar DG (1995) Indian Drugs 32:90–92
21. Kamath BV, Shivram K (1991) IndianDrugs 29:50–52
22. Sultana N, Arayne MS, Shafi N (2007)Pak J Pharm Sci 20(4):279–284
23. Lacroix PM, Beaulieu N, Cyr TD, Lov-ering EG (1989) J Pharm Sci 78:243–246
24. Sidhu AS, Kennedy JM, Deeble S (1987)J Chromatogr 391:233–242
25. Dragica Z, Traje S, Marina S (2003) AnalBioanal Chem 376:843–853
26. Li K, Xin Z, Zhao F (2003) BiomedChromatogr 17(8):522–525
27. Chaudhary RS, Gangwal SS, AvachatMK, Shah YN, Jindal KC (1993)J Chromatogr 614:261–266
28. Shimizu R, Ishii K, Tsumagari N,Tanigawa M, Matsumoto M (1982)J Chromatogr A 253:101–108
29. Shimizu R, Kakimoto T, Ishii K, Fujim-oto Y, Kishi H, Tsumagari N (1986)J Chromatogr A 357:119–125
30. Carignan G, Carrier K, Laganiere S,Lessard M (1995) J Chromatogr B672:261–269
31. Rouini MR, Asadipour A, Ardakani YH,Aghdasi F (2004) J Chromatogr B800:189–192
32. Nemutlu E, Sayın F, Bascı NE, Sedef K(2007) J Fac Pharm Hacettepe Univ27(2):107–118
33. Chmielewska A, Konieczna L, Plenis A,Bieniecki M, Lamparczyk H (2005) Bio-med Chromatogr 20(1):119–124
34. Sajeev C, Jadhav PR, RaviShankar D,Saha RN (2002) Anal Chim Acta463:207–217
35. Miao XS, Koenig BG, Metcalfe ChD(2002) J Chromatogr A 952:139–147
36. Abde-Hamid ME, Novotny L, Hamza H(2001) J Pharm Biomed Anal 24:587–594
37. Battista HJ, Wehinger G, Henn R (1985)J Chromatogr 345:77–89
38. Owen SG, Roberts MS, Friesen WT(1987) J Chromatogr 416:293–302
39. Taylor MR, Westwood SA (1995)J Chromatogr A 697:389–396
40. Hirai T, Matsumoto S, Kishi I (1997)J Chromatogr B 692:375–388
41. Arcelloni C, Lanzi R, Pedercini S, Molt-eni G, Fermo I, Pontiroli A, Paroni R(2001) J Chromatogr B 763:195–200
42. Martın MJ, Pablos F, Gonzalez AG(1999) Talanta 49:453–459
43. Rafifa H, Marie P (2006) J Pharm BiomedAnal 41:1463–1467
44. Gonzalez G, Ventura R, Smith AK,Torre R, Segura J (1996) J Chromatogr A719:251–264
Table 5. Results from robustness testing (RSD, %)
Drug Retentiontime (tM)
Capacityfactor (k)
Theoreticalplates (N)
Tailingfactor(T)
Resolution(RS)
Separationfactor (a)
Diltiazem 0.41 1.13 1.29 1.79 0.69 0.66Flubiprofen 0.47 0.91 1.41 0.88 1.47 0.54Diclofenac 0.85 0.85 0.04 1.29 0.93 0.58Meloxicam 0.30 1.54 0.33 1.49 1.33 1.37Mefenamic acid 0.49 0.29 1.00 0.90 1.68 0.65
The conditions used to obtain these results were: Me–H2O 81:19 (v/v), pH 3.3, flow rate0.6 ? 1.1 mL min-1
76 Chromatographia 2010, 71, January (No. 1/2) Original
45. Rodrıguez I, Carpinteiro J, Quintana JB,Carro AM, Lorenzo RA, Cela R (2004)J Chromatogr A 1024:1–8
46. Koichi S, Lee WL, Toyohide T, YasuhideS, Kiyohito S, Yuji T, Kanno S (2006)Anal Bioanal Chem 384:1501–1505
47. Plackett RL, Burman JP (1943–1946)Biometrika 33:305–325
48. ASTM E (1169-89) Standard guide forconducting ruggedness tests (Plackett–Burman design). American Society for
Testing and Materials, West Conshohoc-ken, PA 19428-2959
49. Mehta AC (1997) Analyst 122:83R
Original Chromatographia 2010, 71, January (No. 1/2) 77