
Localizing Disembodied Voice in Sandys's Englished 'Narcissus and Echo'

Simulation and control of narcissus phenomenonusing nonsequential ray tracing. I. Staring
camera in 3–5 μm waveband
M. Nadeem AkramInstitute of Microsystems Technology, University of Vestfold, N3103 Tønsberg, Norway
*Corresponding author: [email protected]
Received 24 November 2009; revised 20 January 2010; accepted 20 January 2010;posted 21 January 2010 (Doc. ID 120457); published 12 February 2010
A nonsequential ray tracing technique is used to simulate the narcissus phenomenon in infrared (IR)imaging cameras having cooled detectors. Imaging cameras based on two-dimensional focal plane arraydetectors are simulated. In a companion article, line-scan imaging cameras based on one-dimensionallinear detector arrays are simulated. Diffractive phase surfaces commonly used in modern IR camerasare modeled including multiple diffraction orders in the narcissus retroreflection path to correctly simu-late the stray light return signal. Practical optical design examples along with their performance curvesare given to elucidate the modeling technique. Optical methods to minimize the narcissus return signalare thoroughly explained, and modeling results are presented. It is shown that the nonsequential raytracing technique is an effective method to accurately calculate the narcissus return signal in complex IRcameras having diffractive surfaces. © 2010 Optical Society of America
OCIS codes: 110.3080, 220.3620, 090.1970, 290.2648, 290.2745.
1. Introduction and Background
The narcissus effect is a well known stray light phe-nomenon in IR imaging systems that incorporatedetectors at cryogenic temperatures [1,2]. PassiveIR imaging cameras usually operate around med-ium-wave IR band (3–5 μm) or long-wave IR band(7–12 μm) detecting thermal radiation contrastemitted by objects. Since the camera housing andthe lenses are at ambient temperature, they radiatein the same waveband as the detectors are sensitiveto. Thus to detect small temperature differences ofthe order of 50mK in the imaged scene, it is essentialto block the stray radiation reaching the detector pix-els arising from areas outside the scene of interestsuch as from the camera housing. The stringent re-quirement to block stray-light necessitates the use of100% cold shield efficiency in the detector housingwhere a physical aperture is provided to act as theaperture stop/cold shield/exit pupil of the whole cam-
era [2–4]. Since the detector housing is effectively atcryogenic temperature, there is essentially no self-radiation from inside the detector housing as com-pared to the camera housing. By this arrangement,we minimize the direct stray light reaching the de-tector pixels. But there is still the stray light thatis reflected specularly from the lens polished surfacesand reaches the detector pixels causing a ghost sig-nal. The lens surfaces are coated with a multilayerantireflection coating (AR) in the passband of inter-est. However, these AR coatings are not perfect, anda small residual reflection of the order of 0.5% stillexists. Due to a large temperature difference be-tween the detector housing and the camera housingand the fact that the IR camera is designed to be sen-sitive to a temperature difference of 50mK, even thesmall residual reflected stray light from the lenspolished surfaces creates a ghost signal visible onthe output screen. In modern IR cameras, wherethe detector analog signal is usually digitized andthe rest of the signal processing is done in the digitaldomain, an easy way to cancel out narcissus ghostimages and other residual imaging shading artifacts
0003-6935/10/060964-12$15.00/0© 2010 Optical Society of America
964 APPLIED OPTICS / Vol. 49, No. 6 / 20 February 2010

is to expose the camera to a uniform constant back-ground and record the picture. This picture is sub-tracted digitally from each frame in the normaloperation of the camera, thus effectively removingany constant ghost and shading background effectsin the displayed scene. The residual ghost signal doesnot change if all the lenses are stationary and thecamera housing temperature is also fixed. However,practically speaking, the lenses are usually movedaxially to refocus and to athermalize. Lenses mayalso be moved axially in a continuous zoom lens cam-era. Some lens groupsmay be inserted in or out of theray path to switch the field of view. The electronicsinside the camera heat up, and the camera housingtemperature also varies during the operation of thecamera. Under these circumstances, the narcissusreturn signal and other imaging artifacts are alsochanging, and hence the subtraction of a constantbackground picture does not usually give completecancellation of the stray light effects. It becomesessential to actually minimize the narcissus signalitself and to keep its variation below the minimumdetectable temperature difference level of thecamera.As derived in [1], The effect of narcissus on the im-
age quality depends on both the concentration of thereflected stray light at the detector focal plane and itsvariation with the scan angle for linear-array detec-tor based imager. Using paraxial ray tracing for thecentral detector pixel, the radius of the narcissusghost spot reflected from a lens surface and fallingon the detector plane is equal to 4ynif#, where y isthe on-axis marginal ray height on the surface underconsideration, n is the refractive index before thesurface, and i is the angle of incidence of the on-axismarginal ray at the surface. The variation of the nar-cissus return with the scan angle is given by the ratioi=i0 for the central detector pixel, where i0 is the full-field chief ray angle of incidence at the surface underconsideration. Similarly, the radius of the reflectednarcissus ghost and its variation with the scan anglecan be easily calculated for an off-axis detector pixelusing paraxial ray tracing. The paraxial parametersyni and i=i0 are targeted during the lens design phaseto be greater than a minimum value (usually unity)to minimize the narcissus ghost signal from an of-fending surface. Paraxial ray tracing methods donot take into account the effect of beam clippingdue to limiting apertures of lenses. Moreover, it is dif-ficult to implement such methods for diffractive lenssurfaces, which are commonly used in IR optics.Exact real-ray based methods [3–10] using sequen-tial ray tracing have also been developed to accu-rately calculate the narcissus return signal. Insuch methods, the optical path has to either be en-tered into the lens design program in a dual pass con-figuration [3], or the lens design program needs tohandle the dual pass ray trace internally [5]. Inthe forward ray path, a grid of rays completely fillingthe cold shield aperture starts from the detector pixeland is traced up to the lens surface of interest. The
lens surface of interest is modeled as a mirror withappropriate reflectivity. The return ray path simu-lates the reflected ray bundle going backwardsthrough the intermediate optics and finally reachingthe detector plane. This procedure is repeated for dif-ferent scan angles, for different lens surfaces underconsideration and for different pixels in the linear de-tector array to get a two-dimensional graph of theretroreflected narcissus signal. Real-ray based meth-ods give a much more accurate estimation of the nar-cissus signal and include the effects of intermediatelimiting apertures. Due to the time consuming nat-ure of real ray tracing, it is difficult to implementsuch methods during lens optimization. Such meth-ods are commonly employed after the lens optimiza-tion phase to verify that the narcissus return signalis below the acceptable level, and, if not, then thelens optimization is repeated by targeting the para-xial parameters yni and i=i0 at the offending surfaceto a higher value.
In the sequential ray tracing method, the opticalsurfaces are entered into the lens spread sheet ina certain order, and the rays travel from one surfaceto the next surface in the same order. Only polishedlens surfaces can be modeled, and the effects of lightscattering from rough mechanical surfaces and straylight effects cannot be modeled. In the nonsequentialray tracing method, the optical surfaces are notentered in any predetermined order, and only theirphysical location and orientation in the three dimen-sional (3D) space are entered. The rays do not have totravel in any particular order; rather the rays arelaunched from a source, hit any optical surface intheir path, are refracted, reflected, or diffracted ac-cording to the local surface properties, and continuetheir journey until they hit the next surface or areterminated by some criteria. Monte Carlo basedprobabilistic ray tracing can also be performed inwhich the surface scattering properties are modeledby a probabilistic function rather than Snell’s law.Child rays can be generated from a parent ray to si-mulate different surface scattering properties. Theray energy is taken care of appropriately after reflec-tion, transmission, or diffraction, and surface coatingspectral properties can be modeled appropriately.Multiple diffraction orders with appropriate energyfraction from diffractive surfaces can be modeled[11]. Hence nonsequential ray tracing methodsseems to be the natural choice for the simulationof narcissus in IR systems.
In this paper we have used the commercial lensdesign program Zemax [12] to do such simulations.Different optical designs including diffractive sur-faces are done in the sequential lens design mode.Paraxial narcissus calculations are performed to as-certain narcissus performance of these designs.Comprehensive modeling is done in the nonsequen-tial mode to accurately estimate the narcissus ghostsignal. Verification procedures are adopted to makesure that the lens data are correctly translated fromthe sequential mode to the nonsequential mode. The
20 February 2010 / Vol. 49, No. 6 / APPLIED OPTICS 965

effects of including multiple diffractive orders (otherthan the design order) from diffractive phase sur-faces are accounted for [11].
2. Optical Design for an FPA Detector in the 3–5 μmWaveband
A. Sequential Ray Trace Model
A telescope is designed for imaging in the 3–5 μmwaveband and is shown in Fig. 1. The first orderparameters of the optics are given in Table 1, andthe optics specifications are given in Table 2. The sec-ond and fifth surfaces are conic with a diffractivephase profile that is given by the polynomial
Φ ¼ MXNi¼1
d2iρ2i; ð1Þ
where N is the number of polynomial coefficientsused in the series (N ¼ 3 in our case), d2i is the coef-ficient on the 2ith power of ρ, where ρ is the normal-ized radial aperture coordinate, and M is thediffraction order (M ¼ 1 in our case).The optics is designed to be diffraction limited over
the wavelength region 3:8–4:6 μm. In the Zemaxmodel, equal weight is put on three wavelengths3.8, 4.2, and 4:6 μm for polychromatic calculations.The polychromatic modulation transfer function(MTF) calculated using only the main diffraction or-der of the diffractive surfaces is essentially diffrac-tion limited as shown in Fig. 2. The paraxial yniand i=i0 parameters of the lens surfaces are givenin Table 3. During optimization, no effort is madeto maximize the yni and i=i0 parameters. Hencethe narcissus return signal might be high, especiallyfrom surfaces 3 and 4, which have low yni and i=i0values. The cold shield surface inside the detectorhousing is modeled as the real aperture stop of theoptics. The three lenses in the eyepiece used for re-focusing at close-up targets are for thermal defocuscompensation in the telescope.
B. Nonsequential Ray Trace Model
In the nonsequential ray tracing method, the opticalsurfaces are not entered in the lens spreadsheet in
any predetermined order; only their physical locationand orientation in the 3D space are entered. The raysare launched from a defined source, hit any opticalsurface in their path, are refracted, reflected, or dif-fracted according to the local surface properties, andcontinue their journey until they hit the next surface,reach the detector surface, or leave the simulated re-gion. It is essentially a geometrical ray trace method.However, in Zemax, some physical optics effects suchas diffraction can also be simulated in the nonse-quential geometric ray tracing using a coherentdetector with a Huygens integration function [12].Thus the point spread function (PSF) of a well cor-rected, diffraction limited optical system, such asthat of the optical designs presented here, can alsobe calculated in the nonsequential mode.
The optics designed in the previous subsection isentered in Zemax in the nonsequential mode. Thediffractive surfaces are entered using a Binary 2 sur-face, which is a rotationally symmetric polynomialphase profile. The Binary 2 surface in nonsequentialmode can only be put on the first surface of a lens.Hence the first lens that has a diffractive surfaceon the second surface is entered in reverse orderand rotated by 180° around the y axis to model it cor-rectly. When we reverse the lens, the diffractive sur-face profile coefficients remain the same as they werein the forward order lens. However, this reversed androtated lens model has to be verified to be sure thatrays are being traced correctly.
C. Nonsequential Model Verification
In order to verify that the ray trace paths are iden-tical in the nonsequential and the sequential modes,we calculate the PSF in the nonsequential mode andcompare it with that of the sequential model. Onlythe main diffraction order of the diffractive surfaces
Fig. 1. (Color online) Preliminary optics design for the 3–5 μm waveband.
Table 1. First-Order Parameters for the 3–5 μm Optics
Entrance pupil diameter 80mmCold-shield diameter 7:5mmSystem focal length 220mmFPA dimensions 9:84mm× 7:38mmFPA pixel pitch 30 μm× 30 μmCold shield F# 2.75
966 APPLIED OPTICS / Vol. 49, No. 6 / 20 February 2010

is taken into account. In the nonsequential mode, allthe wavelengths emitted by the source are consid-ered coherent to each other. However, in calculatingthe polychromatic PSF in the sequential mode, thePSF of individual wavelengths are added incoher-ently. Hence in the nonsequential mode, we haveto calculate the PSF of each wavelength and addthem incoherently to get the polychromatic PSF,and from that we can get the polychromatic MTFby Fourier transformation [13]. The detector is takento be of dimension 400 μm× 400 μmwith 1000 × 1000pixels, which is enough to resolve the details in thediffraction limited PSF. The on-axis polychromatic
PSF cross sections are shown in Fig. 3. There arevery small differences between the sequential andnonsequential PSF cross sections, which can bedue to different numbers of rays traced and differentray grid filling algorithms in the two modes.
When a diffractive phase surface is reversed inZemax, the polynomial coefficients given by Eq. (1)of the phase profile do not change. It can be verifiedby modeling the optics in back-to-back two-pass con-figuration as shown in Fig.4. Such an optics model isentered in Zemax and the PSF calculated in the se-quential mode. For the nonsequential mode, oneneeds to enter the optical surfaces only once, and a
Fig. 2. (Color online) MTF calculated using sequential ray tracing.
Table 2. Lens Data Prescription of the Unoptimized Optics
No. Type Comment Radius Thickness Glass Conic
0 STANDARD - ∞
1 STANDARD Objective 128:210mm 6:0mm SILICON2 BINARY 2 194.711 149.687 0.6164283 STANDARD Eyepiece 1 −14:429 4.00 SILICON4 STANDARD −17:273 17.7605 BINARY 2 Eyepiece 2 37.94 4.00 SILICON −1:268606 STANDARD 159.01 0.007 STANDARD Eyepiece 3 16.214 4.00 SILICON8 STANDARD 13.332 9.3199 STANDARD Seal window ∞ 2.50 GERMANIUM
10 STANDARD ∞ 3.0011 STANDARD Cold shield ∞ 19.77512 STANDAR Cold filter ∞ 0.3 GERMANIUM13 STANDARD ∞ 0.0014 STANDARD FPA ∞ -
Norm. radius d2 d4 d6
2 BINARY 2 50mm −97:056 13.679 −12:4165 BINARY 2 25 −197:1 63.299 −131:655
20 February 2010 / Vol. 49, No. 6 / APPLIED OPTICS 967

flat reflecting mirror is entered after the front lensobjective. The ray bundle is traced starting fromthe detector toward the optics and gets retroreflectedback from the flat mirror toward the detector plane.The PSF calculated in the nonsequential mode andthe sequential mode are essentially identical asshown in Fig.5.We can essentially conclude that the optical sur-
faces including the diffractive surfaces are correctlymodeled in the nonsequential mode both in the for-ward and the backward path, and the ray trace pathsare identical in both modes.
3. Diffraction Efficiency and Multiple Diffraction-OrderModeling
A. Forward Ray Path
The diffractive surfaces 2 and 5 are designed to workin the main diffraction order 1 since the diffractionorder that maximizes the integral diffraction effi-ciency over a given spectral band is 1 [14]. Basedon the scalar theory, the diffraction efficiency ϵm inthe mth diffraction order is given by
ϵm ¼ sinc2ðα −mÞ; α ¼ λ0λ
�nðλÞ − 1nðλoÞ − 1
�≈λ0λ ; ð2Þ
where λ0 is the design wavelength for the diffractivesurface. The efficiency for the first order is
ϵ1 ¼ sinc2�λ0λ − 1
�: ð3Þ
The diffraction efficiency ϵ given by the above for-mulas is essentially for the on-axis chief ray sincethere can be both field variations and single-field pu-pil-averaged variations of the diffraction efficiency.However, such field and pupil-averaged variationsof the diffraction efficiency are not taken into accountin this paper.
For a spectral band from λ1 to λ2, the optimumdesign wavelength λ0 that gives highest integrateddiffraction efficiency for the first order is
λ0 ¼ 2λ1λ2λ1 þ λ2
: ð4Þ
In our case, the optics is designed for the 3.8 to4:6 μm waveband. Hence the optimum design wave-length is λ0 ¼ 4:16 μm. In order to get a phase differ-ence at the boundary between two facets equal to onewavelength for the first order, the optimum depth ofthe diffractive surface grooves is given by
d ¼ λ0n − 1
: ð5Þ
The diffraction efficiency at other wavelengths isϵ1ð3:8 μmÞ ¼ 0:964 and ϵ1ð4:6 μmÞ ¼ 0:975 for eachdiffractive surface. In the previous calculation ofthe polychromatic PSF and MTF, the diffraction effi-
Table 3. Paraxial Narcissus Values of the UnoptimizedOptics
Surface yni i=i0
1 12.4 11.742 −2:96 2.553 0.24 0.44 0.08 0.165 3.38 2.596 −0:79 0.497 2.27 5.088 1.58 28.59
0 0.05 0.1 0.15 0.2 0.25 0.3 0.35 0.410
−6
10−5
10−4
10−3
10−2
10−1
100
mm
Pol
ychr
omat
ic P
SF
Cro
ss S
ectio
n
Sequential ModeNon−sequential Mode
Fig. 3. PSF cross section calculated using nonsequential andsequential ray tracing.
Fig. 4. Double-pass optics model in the sequential mode.
−0.2 −0.15 −0.1 −0.05 0 0.05 0.1 0.15 0.210
−6
10−5
10−4
10−3
10−2
10−1
100
x−axis, mm
Pol
ychr
omat
ic P
SF
Cro
ss S
ectio
n
Sequential ModeNon−sequential Mode
Fig. 5. PSF cross section calculated using nonsequential andsequential ray tracing in a double-pass optics model.
968 APPLIED OPTICS / Vol. 49, No. 6 / 20 February 2010

ciency was assumed to be 1 for all wavelengths. If thedrop of diffraction efficiency against wavelength istaken into account, the polychromatic PSF can becalculated by multiplying monochromatic PSF calcu-lated at each wavelength λ by ϵ1ðλÞk, where k is thetotal number of diffractive surfaces in the system,and by summing the result incoherently. Sinceϵ1ðλÞ is almost constant over the operating wave-band, we can conclude that the variable diffractionefficiency has little influence on the polychromaticPSF in the forward ray path for our optical system.There is some residual energy in the diffraction or-
ders other than the main one for wavelengths otherthan the design wavelength λ0. In Table 4, the dif-fraction efficiency for different diffraction orders isgiven for each wavelength. The diffraction efficiencyϵmðλÞ is very low for orders other than the design or-der 1. In the nonsequential mode, we can include theeffect of stray energy in diffraction orders other thanthe main one from the diffractive optical element(DOE) surfaces to calculate the resultant PSF. In Ze-max, the amount of light energy in each diffractionorder is given in a table for each diffractive surface.By tracing a large number of rays, calculating themonochromatic PSF for each wavelength and addingthe PSF for all the wavelengths, we can get the poly-chromatic PSF including the effect of multiplediffraction orders. The two PSF calculated usingthe main diffraction order and multiple diffractionorders are almost identical as shown in Fig. 6. Hencefor PSF calculation in the forward path, we canignore the effect of light diffracted at orders otherthan the main order 1.
B. Reflected Ray Path
In the reflected ray path from a diffractive lens sur-face of order 1, the formula for optimum depth is
d ¼(
λ02 ; front-surface mirrorλ02n ; back-surface mirror
: ð6Þ
It can be seen from Eqs, (5) and (6) that the order ofmaximum diffraction efficiency for a reflected narcis-sus beam differs from the design order 1 of the for-ward transmitted beam and can be calculated fromthe two equations. The first diffractive surface of alens becomes a back-surface mirror for narcissus ra-diation, while the second diffractive surface becomesa front-surface mirror. The sign of the order of diffrac-tion is reversed for narcissus reflected beam whenthe diffractive surface is the second surface of thelens as explained in [11]. The order of maximumefficiency m0
max for the narcissus return signal is re-lated to the design order 1 as follows:
m0max ¼
(2nn−1 ; first lens surface−2n−1 ; second lens surface
: ð7Þ
The order m0max may not be an integer, and the
reflected energy will be distributed in orders in thevicinity of m0
max. The diffraction efficiency for the re-flected radiation is a function of both order m0
max andwavelength λ. Using scalar diffraction theory [11],the efficiency will be
ηm0λ ¼ sinc2�m0
maxλ0λ −m0
�: ð8Þ
Consider, for example, the first lens in our de-signed optics in Subsection 2.A. Its second surfaceis diffractive, which is designed to operate in the firstorder at wavelength λ0 ¼ 4:2 μm and n ¼ 3:4245 forsilicon. In accordance with Eq. (7), the order of max-imum efficiency for reflected radiation at 4:2 μm ism0
max ¼ −0:83. The relative efficiencies of variousorders at the central and extreme wavelengths aregiven in Table 5.
The third lens in our designed optics has a firstsurface diffractive that is designed to operate inthe first order at wavelength λ0 ¼ 4:2 μm. The orderof maximum efficiency for reflected radiation at4:2 μm ism0
max ¼ 2:83. The relative efficiencies of var-ious orders at the central and extreme wavelengthsare given in Table 6.
From the calculated values of the diffraction effi-ciency for the reflected radiation ηm0λ, one can chooseonly those diffraction orders that have significant
Table 4. Diffraction Efficiency ϵmλ for the Transmission Path
m ¼ −2 m ¼ −1 m ¼ 0 m ¼ 1 m ¼ 2 m ¼ 3 m ¼ 4
λ ¼ 3:8 μm 0.0011 0.0024 0.0087 0.9641 0.0133 0.0030 0.0013λ ¼ 4:2 μm 0.0000 0.0000 0.0000 1.0000 0.0000 0.0000 0.0000λ ¼ 4:6 μm 0.0009 0.0020 0.0088 0.9754 0.0062 0.0017 0.0008
−0.2 −0.15 −0.1 −0.05 0 0.05 0.1 0.15 0.210
−6
10−5
10−4
10−3
10−2
10−1
100
X−axis mm
Pol
ychr
omat
ic P
SF
Cro
ss S
ectio
n
Main Diffraction Order OnlyMultiple Diffraction Orders
Fig. 6. PSF cross section calculated using the main and multiplediffraction orders.
20 February 2010 / Vol. 49, No. 6 / APPLIED OPTICS 969

reflected energy during the narcissus simulation, asexplained in the subsequent sections.In Fig. 7, a back-surface flat mirror is modeled with
a diffractive phase profile. Ray trace paths for diffrac-tive orders m ¼ −1, 1, and 2 are shown individuallyas well as combined in a single ray trace by enteringall the important diffractive orders along with theircorresponding energy in a table format in the Zemaxnonsequential ray tracing modeling.
4. Modeling and Minimization of Narcissus Signal
A. Theoretical Model For Narcissus Calculation
The narcissus induced temperature difference(NITD) for a detector pixel i due to a lens surface jis given by [1]
NITDij ¼R λ2λ1 ½Nðλ;THÞ −Nðλ;TDÞ�RdðλÞdλR λ2
λ1∂Nðλ;TMSÞ
∂T RdðλÞdλt2jtoRjσij;
ð9Þwhere λ1, λ2 define the waveband of interest, TH isthe camera housing temperature, TD is the detectortemperature, TMS is the mean scene temperature,RdðλÞ is the normalized detector spectral response,t0 is the average optics transmission from the firstlens surface up to the detector, tj is the average opticstransmission starting from the detector surface up tothe lens surface under consideration, Rj is the sur-face spectral reflectivity of the lens surface underconsideration, and σij ¼ ΩRij=ΩCSi is the ratio of thesolid angle ΩRij of the radiation retroreflected fromthe surface j falling on the cooled detector surfaceto the detector cold shield solid angle ΩCSi for the de-tector pixel i. Assuming the camera housing and thescene radiate as blackbodies with spectral radianceNðλ;TÞ given by the Planck’s equation,
Nðλ;TÞ ¼ 2hc2
λ5�e
hcλkT − 1
�−1Watt=ðm2 · str ·mÞ; ð10Þ
where h is the Planck’s constant, c is the speed oflight, and k is the Boltzman’s constant. The ratio
of the solid angles σij is approximated by tracing agrid of large number rays that are equally spacedin the direction cosine space, starting from the detec-tor pixel i out into the optical system through the de-fined aperture of the cold shield and counting thenumber of rays retroreflected from the surface underconsideration and falling back through the coldshield on to the cooled FPA surface. If M is the totalnumber of rays traced outward starting from the de-tector pixel i and m is the number of rays fallingthrough the cold shield aperture back on to the cooledFPA surface after reflection from the lens surface j,the fraction of the solid angle σij transferring cold en-ergy from the cooled detector surface to the detectorpixel is [6]
σij ¼mM
: ð11Þ
B. Narcissus Calculation For Unoptimized Optics
The optics designed in Subsection 2.A is analyzed forits narcissus signature. Assuming a flat detectorspectral response RdðλÞ, TH ¼ TMS ¼ 300K, TD ¼77K, the integral factor in Eq. (9) for the 3.8 to4:6 μm waveband is equal to 27.02. For simplicity,the optical spectral transmission factors t0 and tjare considered to be unity over the waveband of in-terest even though the spectrally dependent materialabsorption and spectrally nonflat antireflectioncoatings can be included in the Zemax nonsequentialray-trace model. All the lens surfaces are givenperfect antireflection coating with the exception thatthe surface under consideration for narcissus reflec-tion calculation is made a perfect mirror. If the nar-cissus return surface is a diffractive surface such assurface 2 and surface 5 of the optics designed inSubsection 2.A, multiple diffraction orders are in-cluded in the return signal. Based on the resultsin Subsection 3.B, the diffraction efficiencies of thesignificant diffraction orders in the reflected ray pathare entered in a table format in Zemax. Based on theresults in the Subsection 3.A, only the main diffrac-tion order, which is 1, is considered for the transmis-sion ray path through a diffractive surface.
Table 5. Diffraction Efficiency ηm0λ of a First-Order Diffractive Surface on the Second Lens Surface (which becomes First-Surface Mirrorfor Reflection Path), Silicon, Reflected Path
m0 ¼ −3 m0 ¼ −2 m0 ¼ −1 m0 ¼ 0 m0 ¼ 1
λ ¼ 3:8 μm 0.0017 0.0064 0.9746 0.0091 0.0021λ ¼ 4:2 μm 0.0059 0.0201 0.9031 0.0407 0.0083λ ¼ 4:6 μm 0.0098 0.0319 0.8150 0.0875 0.0162
Table 6. Diffraction Efficiency ηm0λ of a First-Order Diffractive Surface on the First Lens Surface (which becomes Second-Surface Mirrorfor Reflection Path), Silicon, Reflected Path
m0 ¼ 1 m0 ¼ 2 m0 ¼ 3 m0 ¼ 4 m0 ¼ 5
λ ¼ 3:8 μm 0.0032 0.0113 0.9518 0.0185 0.0040λ ¼ 4:2 μm 0.0083 0.0407 0.9031 0.0201 0.0059λ ¼ 4:6 μm 0.0382 0.2836 0.5376 0.0471 0.0162
970 APPLIED OPTICS / Vol. 49, No. 6 / 20 February 2010

A predetermined number of rays, as shown inFig.8(a), filling the cold shield aperture, are tracedbackwards starting from a given detector pixel. Therays retroreflected from the narcissus surface, suchas shown in Fig. 8(b), where surface 2 is made asa mirror surface, that fall through the cold shield arecounted, and the solid angle factor σij is estimated.This procedure is repeated for all the lens surfacesin the optical system to estimate the surface-by-surface narcissus signal. The total narcissus signalfor a given detector pixel is estimated by summingall such contributions and multiplying by a realisticsurface reflectivity Rj. The calculations are done formany detector pixels in the FPA starting from thecentral detector pixel up to the corner pixel. A macroprogram is written in Zemax Programming Lan-guage (ZPL) [12] to calculate the narcissus returnsurface by surface. For calculating the reference nar-cissus signal, the eyepiece is at its mean position, and
the narcissus signature calculated is taken as a refer-ence signal. As the eyepiece is moved to focus thetelescope at near targets, the narcissus signal is re-calculated and subtracted from the reference narcis-sus signal to estimate the residual narcissus signal.In addition, as the camera housing temperaturechanges, so does the narcissus signature. The inte-gral factor in Eq. (9) is 32.5 at TH ¼ 305K. The resi-dual narcissus signal at different camera housingtemperature is also calculated.
In Fig. 9, narcissus induced temperature differ-ence (NITD) for each lens surface is shown. A meansurface reflectivity of 0.5% is assumed for all thesecalculations. In Fig. 10, total NITD for the opticsis shown at two eyepiece positions. In the first eye-piece position, the optics is focused to look at a targetat infinity in the object space, and in the second posi-tion, the eyepiece is shifted by 1 mm toward thedetector to focus on a target located at 35 m from
Diffractive Phase ProfileOn BackMirror Surface
Diffractive Order m=1
Diffractive Order m=2
Diffractive Order m=-1
Multiple Diffractive Orders m=-1,1,2
Fig. 7. (Color online) Multiple diffraction orders ray tracing from a reflective diffractive surface.
20 February 2010 / Vol. 49, No. 6 / APPLIED OPTICS 971

the telescope. The residual narcissus signal foreyepiece position 2 is also shown. In addition, inFig. 10, total NITD for the optics is shown at twocamera housing temperatures. The residual narcis-sus signal at elevated camera housing temperatureis also shown.
5. Optics Redesign with Reduced Narcissus Signal
Based on the analysis given in the previous section,the optics is redesigned in the sequential ray-trace
model. During the lens optimization, emphasis is gi-ven on the low yni and i=i0 values for the surfaces 3, 4,and 6. The yni and i=i0 values at these surfaces aretargeted to be greater than unity in the merit func-tion [12]. The reoptimized optics layout and its poly-chromatic MTF plot are shown in Figs. 11 and 12,respectively. The lens specifications and the paraxialyni and i=i0 values are given in Tables 7 and 8, respec-tively. The paraxial yni and i=i0 values for theoptimized optics are higher than those of the
Cold Shield
(a)
(b)
Fig. 8. (Color online) (a) Forward ray trace path and (b) retroreflected ray path from surface 2 from the center detector pixel for narcissussimulation.
Fig. 9. Narcissus contribution from each surface for the unopti-mized optics.
0 1 2 3 4 5 6 70
0.1
0.2
0.3
0.4
0.5
Pixel position along FPA diagonal, mm
Nar
ciss
us In
duce
d T
empe
ratu
re D
iffer
ence
(N
ITD
) °
K
Eye−piece Far Focused, Camera Housing T = 300 ° KEye−piece Near Focused, Camera Housing T = 300 ° KResidual Narcissus with Eye−piece MotionEye−piece Far Focused, Camera Housing T = 305 ° KResidual Narcissus with Temperature Change
Fig. 10. Effective narcissus signature for the unoptimized opticsat two different eyepiece positions and at two different camerahousing temperatures.
972 APPLIED OPTICS / Vol. 49, No. 6 / 20 February 2010

unoptimized optics, which would help in minimizingthe absolute value of the narcissus return signal le-vel as well as the variation of the narcissus signalacross the FPA for different focus position of theeyepiece.
A. Narcissus Calculation for the Optimized Optics
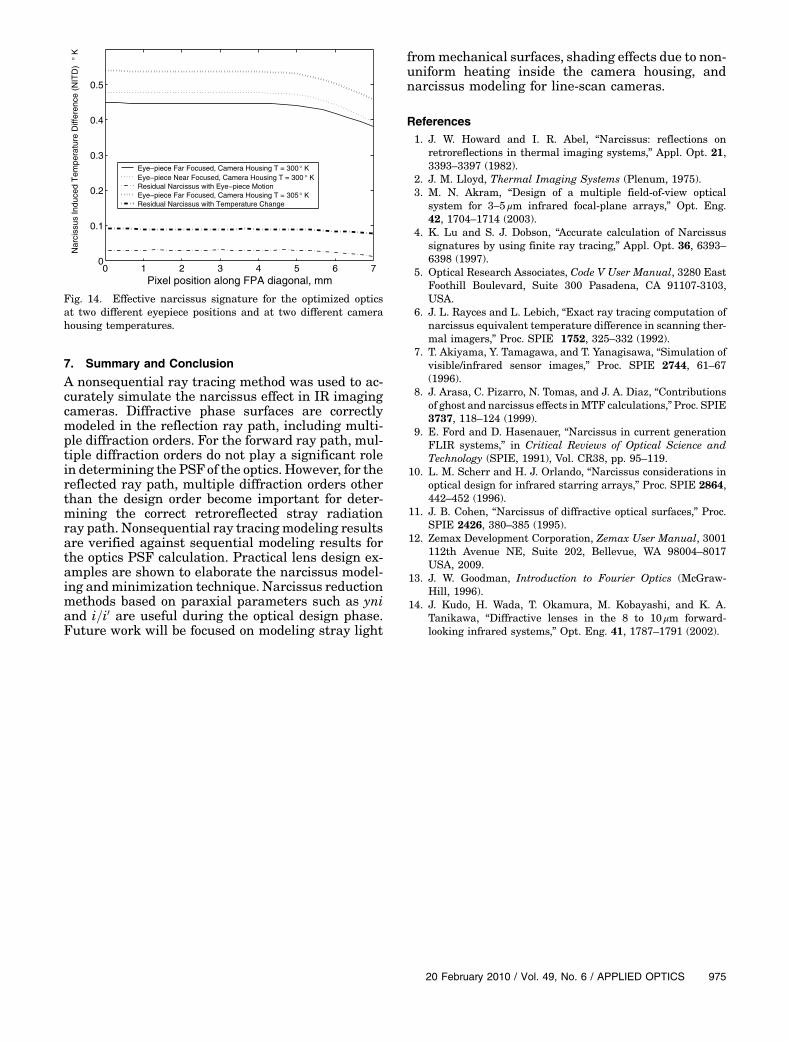
Theoptics designed inSection5 is analyzed for itsnar-cissus signature. Similar simulation conditions areassumed as mentioned in Subsection 3.B. In Fig. 13,narcissus induced temperature difference (NITD)for each lens surface is shown for a mean surface re-flectivity of 0.5%. In Fig. 14, total NITD for the opticsis shown at various eyepiece positions. The residualnarcissus with an eyepiece motion signal is also
shown. Inaddition, inFig. 14, totalNITDfor theopticsis shownat two camerahousing temperatures.The re-sidual narcissus signal with change in camera hous-ing temperature is also shown.
6. Discussion of Results
There is a correlation between the yni value of a sur-face and its narcissus return level. The lower the ynivalue of a surface is, the higher the narcissus returnsignal from it, and vice versa. In Table 3, surfaces 3and 4 have the lowest yni values and their narcissusreturn signal is highest as shown in Fig. 9. The i=i0value of a surface is inversely related to the variationof the narcissus signal across the FPA. In Table 3,surfaces 3, 4, and 6 have the lowest i=i0 values,
Fig. 11. (Color online) Narcissus optimized optics design for the 3–5 μm waveband.
Fig. 12. (Color online) MTF calculated using sequential ray tracing.
20 February 2010 / Vol. 49, No. 6 / APPLIED OPTICS 973

and their narcissus return signal shows the biggestvariation across the FPA surface, as shown in Fig. 9.For the unoptimized optics, the NITD across the FPAsurface from the center pixel to the diagonal edgepixel is 0:24K, which is much higher than the sensi-tivity of the imaging camera, which may be around50mK. When the eyepiece is moved to focus at neartarget, the residual narcissus signal is around 50mKand is not constant across the FPA pixels. With thechange in the camera housing temperature, the resi-dual narcissus signal is around 100mK and is notconstant across the FPA surface. Hence the residualnarcissus signal for the unoptimized optics might bedifficult to remove just by electronic means.Both the yni and i=i0 quantities on a surface can be
controlled during the lens optimization to suppressthe narcissus return signal and its variation acrossthe FPA. For the optimized optics, these values aremuch higher, especially the i=i0 value for surfaces 3and 4, as given in Table 8. Hence the variation of nar-cissus signature across the FPA is minimized asshown in Figs. 13 and 14. For surface 8, the yni valueis 1.49 for the optimized optic, which is higher than 1.However, as evident in Fig. 13, the pedestal level ofthe narcissus from surface 8 is high, which might bebecause surface 8 is very close to the cold shield aper-
ture and the reflected radiation gets into the coldshield without being clipped by the intermediatelenses or apertures.
The NITD for the optimized optics is 0:07K acrossthe FPA from the center to the edge. The residualnarcissus signal with eyepiece motion is around25mK and is relatively constant across the FPA.With a 5 °C camera housing temperature change,the residual narcissus signal is around 100mKand is relatively constant across the FPA. Hencethe residual narcissus signal for the optimized opticsmight be easier to remove by electronic means. Theoptical performance such as MTF for both optics isdiffraction limited. Further narcissus reductionmay be achieved by using antireflection coating withreflectivity lower than 0.5% only on those surfacesthat show big variation of the narcissus returnsignal.
Table 7. Lens Data Prescription of the Narcissus Optimized System
No. Type Comment Radius Thickness Glass Conic
0 STANDARD - ∞
1 BINARY 2 Objective 128:311mm 6:0mm SILICON −0:1776522 STANDARD 197.404 148.5813 STANDARD Eyepiece 1 −42:347 4.00 SILICON4 STANDARD −47:648 14.6655 BINARY 2 Eyepiece 2 43.553 6.00 SILICON −2:3821126 STANDARD 775.154 0.45847 STANDARD Eyepiece 3 16.747 6.00 SILICON8 STANDARD 12.338 6.19449 STANDARD Seal window ∞ 2.50 GERMANIUM
10 STANDARD ∞ 3.0011 STANDARD Cold shield ∞ 19.77512 STANDAR Cold filter ∞ 0.3 GERMANIUM13 STANDARD ∞ 0.0014 STANDARD FPA ∞ -
Norm. radius d2 d4 d6
1 BINARY 2 100mm −361:119 16.802 -223.4755 BINARY 2 25 −208:742 63.863 48.298
Table 8. Paraxial Narcissus Values for the NarcissusOptimized System
Surface yni i=i0
1 13.4 11.82 −3:6 3.053 0.73 3.064 0.81 3.665 3.9 2.996 −1:12 0.627 2.5 8.388 1.49 4.26 Fig. 13. Narcissus contribution from each surface for the
optimized optics.
974 APPLIED OPTICS / Vol. 49, No. 6 / 20 February 2010
7. Summary and Conclusion
A nonsequential ray tracing method was used to ac-curately simulate the narcissus effect in IR imagingcameras. Diffractive phase surfaces are correctlymodeled in the reflection ray path, including multi-ple diffraction orders. For the forward ray path, mul-tiple diffraction orders do not play a significant rolein determining the PSFof the optics. However, for thereflected ray path, multiple diffraction orders otherthan the design order become important for deter-mining the correct retroreflected stray radiationray path. Nonsequential ray tracingmodeling resultsare verified against sequential modeling results forthe optics PSF calculation. Practical lens design ex-amples are shown to elaborate the narcissus model-ing andminimization technique. Narcissus reductionmethods based on paraxial parameters such as yniand i=i0 are useful during the optical design phase.Future work will be focused on modeling stray light
frommechanical surfaces, shading effects due to non-uniform heating inside the camera housing, andnarcissus modeling for line-scan cameras.
References1. J. W. Howard and I. R. Abel, “Narcissus: reflections on
retroreflections in thermal imaging systems,” Appl. Opt. 21,3393–3397 (1982).
2. J. M. Lloyd, Thermal Imaging Systems (Plenum, 1975).3. M. N. Akram, “Design of a multiple field-of-view optical
system for 3–5 μm infrared focal-plane arrays,” Opt. Eng.42, 1704–1714 (2003).
4. K. Lu and S. J. Dobson, “Accurate calculation of Narcissussignatures by using finite ray tracing,” Appl. Opt. 36, 6393–6398 (1997).
5. Optical Research Associates, Code V User Manual, 3280 EastFoothill Boulevard, Suite 300 Pasadena, CA 91107-3103,USA.
6. J. L. Rayces and L. Lebich, “Exact ray tracing computation ofnarcissus equivalent temperature difference in scanning ther-mal imagers,” Proc. SPIE 1752, 325–332 (1992).
7. T. Akiyama, Y. Tamagawa, and T. Yanagisawa, “Simulation ofvisible/infrared sensor images,” Proc. SPIE 2744, 61–67(1996).
8. J. Arasa, C. Pizarro, N. Tomas, and J. A. Diaz, “Contributionsof ghost and narcissus effects inMTF calculations,”Proc. SPIE3737, 118–124 (1999).
9. E. Ford and D. Hasenauer, “Narcissus in current generationFLIR systems,” in Critical Reviews of Optical Science andTechnology (SPIE, 1991), Vol. CR38, pp. 95–119.
10. L. M. Scherr and H. J. Orlando, “Narcissus considerations inoptical design for infrared starring arrays,” Proc. SPIE 2864,442–452 (1996).
11. J. B. Cohen, “Narcissus of diffractive optical surfaces,” Proc.SPIE 2426, 380–385 (1995).
12. Zemax Development Corporation, Zemax User Manual, 3001112th Avenue NE, Suite 202, Bellevue, WA 98004–8017USA, 2009.
13. J. W. Goodman, Introduction to Fourier Optics (McGraw-Hill, 1996).
14. J. Kudo, H. Wada, T. Okamura, M. Kobayashi, and K. A.Tanikawa, “Diffractive lenses in the 8 to 10 μm forward-looking infrared systems,” Opt. Eng. 41, 1787–1791 (2002).
0 1 2 3 4 5 6 70
0.1
0.2
0.3
0.4
0.5
Pixel position along FPA diagonal, mm
Nar
ciss
us In
duce
d T
empe
ratu
re D
iffer
ence
(N
ITD
) °
K
Eye−piece Far Focused, Camera Housing T = 300 ° KEye−piece Near Focused, Camera Housing T = 300 ° KResidual Narcissus with Eye−piece MotionEye−piece Far Focused, Camera Housing T = 305 ° KResidual Narcissus with Temperature Change
Fig. 14. Effective narcissus signature for the optimized opticsat two different eyepiece positions and at two different camerahousing temperatures.
20 February 2010 / Vol. 49, No. 6 / APPLIED OPTICS 975
Copyright © 2022 FDOKUMEN