Simulating Carbon Stocks and Fluxes of an African Tropical Montane Forest with an Individual-Based...
13
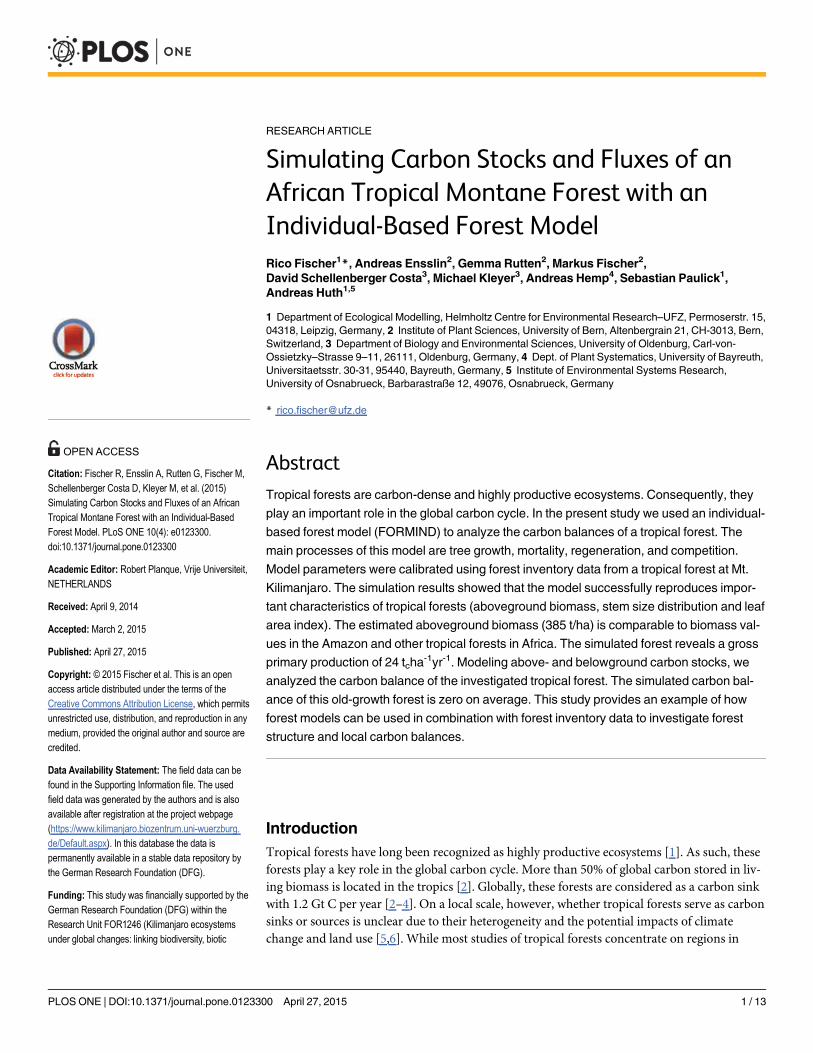
RESEARCH ARTICLE Simulating Carbon Stocks and Fluxes of an African Tropical Montane Forest with an Individual-Based Forest Model Rico Fischer 1 *, Andreas Ensslin 2 , Gemma Rutten 2 , Markus Fischer 2 , David Schellenberger Costa 3 , Michael Kleyer 3 , Andreas Hemp 4 , Sebastian Paulick 1 , Andreas Huth 1,5 1 Department of Ecological Modelling, Helmholtz Centre for Environmental Research–UFZ, Permoserstr. 15, 04318, Leipzig, Germany, 2 Institute of Plant Sciences, University of Bern, Altenbergrain 21, CH-3013, Bern, Switzerland, 3 Department of Biology and Environmental Sciences, University of Oldenburg, Carl-von- Ossietzky–Strasse 9–11, 26111, Oldenburg, Germany, 4 Dept. of Plant Systematics, University of Bayreuth, Universitaetsstr. 30-31, 95440, Bayreuth, Germany, 5 Institute of Environmental Systems Research, University of Osnabrueck, Barbarastraße 12, 49076, Osnabrueck, Germany * [email protected] Abstract Tropical forests are carbon-dense and highly productive ecosystems. Consequently, they play an important role in the global carbon cycle. In the present study we used an individual- based forest model (FORMIND) to analyze the carbon balances of a tropical forest. The main processes of this model are tree growth, mortality, regeneration, and competition. Model parameters were calibrated using forest inventory data from a tropical forest at Mt. Kilimanjaro. The simulation results showed that the model successfully reproduces impor- tant characteristics of tropical forests (aboveground biomass, stem size distribution and leaf area index). The estimated aboveground biomass (385 t/ha) is comparable to biomass val- ues in the Amazon and other tropical forests in Africa. The simulated forest reveals a gross primary production of 24 t c ha -1 yr -1 . Modeling above- and belowground carbon stocks, we analyzed the carbon balance of the investigated tropical forest. The simulated carbon bal- ance of this old-growth forest is zero on average. This study provides an example of how forest models can be used in combination with forest inventory data to investigate forest structure and local carbon balances. Introduction Tropical forests have long been recognized as highly productive ecosystems [1]. As such, these forests play a key role in the global carbon cycle. More than 50% of global carbon stored in liv- ing biomass is located in the tropics [2]. Globally, these forests are considered as a carbon sink with 1.2 Gt C per year [2–4]. On a local scale, however, whether tropical forests serve as carbon sinks or sources is unclear due to their heterogeneity and the potential impacts of climate change and land use [5,6]. While most studies of tropical forests concentrate on regions in PLOS ONE | DOI:10.1371/journal.pone.0123300 April 27, 2015 1 / 13 a11111 OPEN ACCESS Citation: Fischer R, Ensslin A, Rutten G, Fischer M, Schellenberger Costa D, Kleyer M, et al. (2015) Simulating Carbon Stocks and Fluxes of an African Tropical Montane Forest with an Individual-Based Forest Model. PLoS ONE 10(4): e0123300. doi:10.1371/journal.pone.0123300 Academic Editor: Robert Planque, Vrije Universiteit, NETHERLANDS Received: April 9, 2014 Accepted: March 2, 2015 Published: April 27, 2015 Copyright: © 2015 Fischer et al. This is an open access article distributed under the terms of the Creative Commons Attribution License, which permits unrestricted use, distribution, and reproduction in any medium, provided the original author and source are credited. Data Availability Statement: The field data can be found in the Supporting Information file. The used field data was generated by the authors and is also available after registration at the project webpage (https://www.kilimanjaro.biozentrum.uni-wuerzburg. de/Default.aspx). In this database the data is permanently available in a stable data repository by the German Research Foundation (DFG). Funding: This study was financially supported by the German Research Foundation (DFG) within the Research Unit FOR1246 (Kilimanjaro ecosystems under global changes: linking biodiversity, biotic
-
Upload
independent -
Category
Documents
-
view
6 -
download
0
Transcript of Simulating Carbon Stocks and Fluxes of an African Tropical Montane Forest with an Individual-Based...
RESEARCH ARTICLE
Simulating Carbon Stocks and Fluxes of anAfrican Tropical Montane Forest with anIndividual-Based Forest ModelRico Fischer1*, Andreas Ensslin2, Gemma Rutten2, Markus Fischer2,David Schellenberger Costa3, Michael Kleyer3, Andreas Hemp4, Sebastian Paulick1,Andreas Huth1,5
1 Department of Ecological Modelling, Helmholtz Centre for Environmental Research–UFZ, Permoserstr. 15,04318, Leipzig, Germany, 2 Institute of Plant Sciences, University of Bern, Altenbergrain 21, CH-3013, Bern,Switzerland, 3 Department of Biology and Environmental Sciences, University of Oldenburg, Carl-von-Ossietzky–Strasse 9–11, 26111, Oldenburg, Germany, 4 Dept. of Plant Systematics, University of Bayreuth,Universitaetsstr. 30-31, 95440, Bayreuth, Germany, 5 Institute of Environmental Systems Research,University of Osnabrueck, Barbarastraße 12, 49076, Osnabrueck, Germany
AbstractTropical forests are carbon-dense and highly productive ecosystems. Consequently, they
play an important role in the global carbon cycle. In the present study we used an individual-
based forest model (FORMIND) to analyze the carbon balances of a tropical forest. The
main processes of this model are tree growth, mortality, regeneration, and competition.
Model parameters were calibrated using forest inventory data from a tropical forest at Mt.
Kilimanjaro. The simulation results showed that the model successfully reproduces impor-
tant characteristics of tropical forests (aboveground biomass, stem size distribution and leaf
area index). The estimated aboveground biomass (385 t/ha) is comparable to biomass val-
ues in the Amazon and other tropical forests in Africa. The simulated forest reveals a gross
primary production of 24 tcha-1yr-1. Modeling above- and belowground carbon stocks, we
analyzed the carbon balance of the investigated tropical forest. The simulated carbon bal-
ance of this old-growth forest is zero on average. This study provides an example of how
forest models can be used in combination with forest inventory data to investigate forest
structure and local carbon balances.
IntroductionTropical forests have long been recognized as highly productive ecosystems [1]. As such, theseforests play a key role in the global carbon cycle. More than 50% of global carbon stored in liv-ing biomass is located in the tropics [2]. Globally, these forests are considered as a carbon sinkwith 1.2 Gt C per year [2–4]. On a local scale, however, whether tropical forests serve as carbonsinks or sources is unclear due to their heterogeneity and the potential impacts of climatechange and land use [5,6]. While most studies of tropical forests concentrate on regions in
PLOSONE | DOI:10.1371/journal.pone.0123300 April 27, 2015 1 / 13
a11111
OPEN ACCESS
Citation: Fischer R, Ensslin A, Rutten G, Fischer M,Schellenberger Costa D, Kleyer M, et al. (2015)Simulating Carbon Stocks and Fluxes of an AfricanTropical Montane Forest with an Individual-BasedForest Model. PLoS ONE 10(4): e0123300.doi:10.1371/journal.pone.0123300
Academic Editor: Robert Planque, Vrije Universiteit,NETHERLANDS
Received: April 9, 2014
Accepted: March 2, 2015
Published: April 27, 2015
Copyright: © 2015 Fischer et al. This is an openaccess article distributed under the terms of theCreative Commons Attribution License, which permitsunrestricted use, distribution, and reproduction in anymedium, provided the original author and source arecredited.
Data Availability Statement: The field data can befound in the Supporting Information file. The usedfield data was generated by the authors and is alsoavailable after registration at the project webpage(https://www.kilimanjaro.biozentrum.uni-wuerzburg.de/Default.aspx). In this database the data ispermanently available in a stable data repository bythe German Research Foundation (DFG).
Funding: This study was financially supported by theGerman Research Foundation (DFG) within theResearch Unit FOR1246 (Kilimanjaro ecosystemsunder global changes: linking biodiversity, biotic

South America or Asia (e.g., Amazonas: [7,8,9,10,11]), African tropical forests have been some-what neglected, despite the fact that they have the highest deforestation rates worldwide (yearly1.01% in East Africa, [12]). In Africa, large areas of tropical forest are located in the Congobasin, in the Eastern Arc Mountains and in the Kilimanjaro region [13].
Mt. Kilimanjaro supports high biodiversity due to its unique range of vegetation zones andclimatic conditions. Savannas and different forest types can be found along the elevation gradi-ent [14]. Before human settlement began here over 2,000 years ago, the southern elevation beltbetween 1,000 m and 1,800 m was covered by tropical lower submontane forest. Today, to alarge extent these forests have been converted into agroforestry systems, grasslands or coffeeplantations. Other natural ecosystems at Mt. Kilimanjaro are strongly impacted by burning orlogging, but they are also subject to climate change [14–19]. This has consequences for forestfunctions such as the allocation of biomass and carbon, water storage, climate regulation, andthe provision of food [20]. Recent field surveys and forest inventories have been used to monitorforest structure and carbon stocks (e.g., [21,22,23]) under ongoing land use and climate change.However, these surveys provided only a snapshot in time of the forest and did not allow conclu-sions to be drawn about forest dynamics and forest carbon emissions. In addition, forest inven-tories are spatially limited and represent a sample of a large ecosystem. In general, analyzing theheterogeneous structure and dynamics of tropical forests on a local scale poses a challenge.Here, forest models play an important role in process understanding and for a projection tolarger scales [24,25]. Process-based forest models simulate forest processes such as tree growth,mortality, and regeneration. For our study we used the local process-based forest model FOR-MIND [24,26–28] in combination with forest inventory data. This model simulates the dynam-ics of tropical forests over several hectares and centuries. FORMIND uses the concept of plantfunctional types (PFT) to comply with the high number of tree species found in the tropics.
The forest model FORMIND was applied here to reproduce the patterns of an almost undis-turbed tropical forest at Mt. Kilimanjaro. Specifically, we assessed (1) the patterns in numberof trees, basal area, aboveground biomass, stem size distribution, and leaf area index. (2) Wecalculated a local carbon balance of the investigated forest. (3) We asked if this lower montaneforest is a carbon sink or source.
Materials and Methods
Study SiteAt Mt. Kilimanjaro the submontane and lower montane forest belt between 1,000 m a.s.l. and1,800 m a.s.l. has to a large extent been converted to small-scale coffee-banana plantations, theso-called “Chagga home gardens”, a special type of agroforestry. The maximum populationdensity in the area is 1,000 persons per km2 [29]. The tropical submontane forest investigatedin the present study is located in a steep valley and is largely undisturbed due to restricted ac-cessibility. In this area five different forest research sites were established with a total size oftwo hectare. An extensive forest inventory was carried out in 2012 by the German ResearchFoundation (DFG) within the Research Unit FOR1246 (Kilimanjaro ecosystems under globalchanges: linking biodiversity, biotic interactions and biogeochemical ecosystem processes;www.kilimanjaro.biozentrum.uni-wuerzburg.de) in cooperation with the Kilimanjaro NationalPark (http://www.tanzaniaparks.com/kili.html). Andreas Hemp, Markus Fischer and IngolfSteffan-Dewenter are Spokesperson of the DFG project and are responsible for the permits forthe investigated forest at Mt. Kilimanjaro. This study was not carried out on private land andwe confirm that the field studies did not involve endangered or protected species.
Concerning this forest inventory, for each tree with DBH> 10 cm the specific position,stem diameter, tree height, crown expansion, and species identity were determined. The forest
Simulating Carbon Stocks and Fluxes of an African Tropical Forest
PLOS ONE | DOI:10.1371/journal.pone.0123300 April 27, 2015 2 / 13
interactions and biogeochemical ecosystemprocesses; www.kilimanjaro.biozentrum.uni-wuerzburg.de). The funders had no role in studydesign, data collection and analysis, decision topublish, or preparation of the manuscript.
Competing Interests: The authors have declaredthat no competing interests exist.

inventory of all five research sites were used to parameterize the model. These forest researchsites distinguish from each other by forest structure and species composition mainly due to thespatial location and disturbance history. For testing the simulation outcome we used a nearlyundisturbed research site (forest lower montane, denotation FLM3, 50m x 50m, S3.260150°,E37.417458°, see Fig 1). The dataset of this forest stand resembles an equilibrium situationwhich could be confirmed by the tree species found in this site (dominated by late successionspecies; fraction of pioneer trees is less than 1%). This test study site is dominated byHeinseniadiervilleoides (36% of all trees) and Strombosia scheffleri (24%), Entandophrangma excelsum(6%) and Garcinia tansaniensis (5%). In total, we discovered 93 trees and 16 tree species at thetest study site. The observations of the study site were linear scaled up to one hectare to be com-parable to our simulation results of the forest model (1 ha forest simulations).
Overview of the FORMIND forest modelForest gap models are tools for investigating forest dynamics [30–32]. These models simulatethe succession of forests. Considering a forest gap caused by a falling tree, for instance, theopened canopy results in increased light availability and hence to the growth of sub-canopytrees and recruits [33,34]. The FORMIND forest gap model [24,26] is an individual- and pro-cess-based simulation model designed specifically for tropical forests that considers the com-plex age structure of the tree community. FORMIND has been extensively tested and appliedto tropical forests in Panama, Malaysia, French Guyana, Venezuela, Mexico, Brazil, Madagas-car and Paraguay [26–28,35–42], and even to European forests [43] and grasslands [44].
By using this individual-based model, every single tree is simulated. The model considersfour main process groups: growth of single trees (increment of tree biomass), mortality, recruit-ment, and competition for light and space. The simulated forest area was divided into patchesaccording to the typical size of tree fall gaps (20 m x 20 m). The vertical leaf distribution andlight availability was calculated for each patch. The biomass growth of each tree was deter-mined on the basis of a carbon balance including photosynthesis, respiration, biomass alloca-tion, and litter fall. Photosynthetic production in the canopy depends on local light availability.Forests of up to 1,000 hectares can be simulated over a time period of several centuries. In thisstudy the FORMIND model was used to investigate the biomass production and mortality ofthe forest ecosystem. In addition, above- and belowground carbon stocks and the resulting netecosystem exchange (NEE in tcha
-1yr-1) was calculated as the balance of carbon sequestrationand carbon emissions (see S1 Text). The forest ecosystem is considered to be a carbon sink if itabsorbs more carbon then it releases (NEE is positive). If, on the other hand, the heterotrophic
Fig 1. The study site. Left: Photograph of the study site at Mt. Kilimanjaro (FLM3). Right: Visualization of theforest simulated with FORMIND, showing all trees with a stem diameter > 5 cm for a forest area of 1 ha. Thecolors of the crowns represent the six plant functional types (PFTs).
doi:10.1371/journal.pone.0123300.g001
Simulating Carbon Stocks and Fluxes of an African Tropical Forest
PLOS ONE | DOI:10.1371/journal.pone.0123300 April 27, 2015 3 / 13

respiration is greater than the net primary production, the forest is a carbon source (NEE isnegative). A detailed description of the FORMIND model can be found in S1 Text or at www.formind.org.
Species groupingGrouping tree species into plant functional types (PFT) is a well-established classificationmethod in vegetation ecology [45,46]. For the purpose of this study, local tree species with sim-ilar trait expressions were assigned to one of six groups according to their maximum heightand light requirements (see Table 1, S2 Text for the full species list and their traits). We usedthree height classes (<16m, 16–33m,>33m) and three classes of shade tolerance (shade-toler-ant—climax species, shade-intolerant—pioneer species, and intermediate shade-tolerant spe-cies). The grouping of tree species into shade tolerance classes was based on measured plantfunctional traits and expert knowledge. Specifically, we used stem dry matter content and leafnitrogen content to assign species to a shade tolerance scale (see S2 Text).
Simulation ExperimentsWe analyzed forest succession on 1 hectare over 1000 years, starting with bare ground condi-tions and without climate limitations. To assess the variability in the forest model we had 10 re-peated simulation runs. Two types of analysis are presented: First, for a comparison of themodel output with field data, we calculated the mean of simulated forest attributes over the last300–1,000 years, based on the assumption that the forest is in the equilibrium state for the en-tire period. In particular, we analyzed aboveground biomass, basal area, stem numbers(dbh>10 cm), stem size distribution, and leaf area index (LAI). Second, we analyzed forest at-tributes which are difficult and costly to measure in a real forest, namely gross primary produc-tion (GPP), aboveground respiration of the vegetation, the resulting net primary production(NPP), and mortality. Additionally, we calculated above- and belowground carbon stocks andnet ecosystem exchange (NEE). Details of the forest model and all parameter values are givenin S1 Text.
Calibration ProcessFor this study, most of the FORMINDmodel parameter values were determined from the localforest inventory (e.g., allometric relationship between DBH and tree height), while some param-eter values were taken from the literature (see S1 Text). Parameter values concerning treegrowth and mortality are unknown due to the lack of repeated forest surveys. These parameters
Table 1. Species grouping into six plant functional types (PFT) for the investigated forest.
PFT Maximum Height (m) Light Class Exemplary Tree Species
1 >33 Shade tolerant Strombosia scheffleri
2 16>33 Shade tolerant Heinsenia diervilleoides
3 16>33 Intermediate Ficus sur
4 16>33 Shade intolerant Polyscias albersiana
5 <16 Shade tolerant Leptonychia usambarensis
6 <16 Shade intolerant Cyathea.manniana
The grouping consists of three size classes and three light demand classes. The size class depends on the maximum attainable height of the respective
tree species. The light class indicates shade tolerance: shade-tolerant trees (climax species), shade-intolerant trees (mainly pioneer species) and
intermediate shade-tolerant trees.
doi:10.1371/journal.pone.0123300.t001
Simulating Carbon Stocks and Fluxes of an African Tropical Forest
PLOS ONE | DOI:10.1371/journal.pone.0123300 April 27, 2015 4 / 13

were estimated by a calibration process, comparing the simulated mature forest with the mea-sured forest inventory from the test site. In detail, we compared the total aboveground biomassand the fraction of biomass for each PFT for all trees with a DBH> 10 cm. The simulated bio-mass was averaged over the last 300–1,000 years. Aboveground biomass of the field data wascalculated by summing up the biomass of the individual trees using the same assumptions asthose used in the FORMINDmodel [24]. For this calibration process we varied growth andmortality parameter values and calculated the mean square error between field data and the av-eraged equilibrium state of the corresponding simulated value [47]. We used inverse parameter-ization techniques to find an optimal parameter set [48,49]. For the optimization 50,000different simulation runs were analyzed. All parameter values can be found in S1 Text. To vali-date the forest model we compared the simulated basal area, stem size distribution and leaf areaindex with the corresponding observations in the research test site (FLM 3, see S1 Dataset).
ResultsTo test the developed parameterization for the forest at Mt. Kilimanjaro we compared simulat-ed aboveground biomass, basal area and stem numbers with the field data for the test study site(scaled to one hectare). The comparison is made on the level of plant functional types (PFT).We found that shade-tolerant (PFT1&2) and intermediate shade-tolerant (PFT3) tree speciesare most dominant in the investigated forest. Especially tall-growing tree species correspondingto PFT1 dominate the study site. The simulated forest reproduced this high PFT1 fraction (seeFig 2) for all investigated attributes (basal area, aboveground biomass, stem number).
The aboveground biomass of the simulated forest (385 todm/ha) was 2% higher than observedin the field data (Fig 2c/2d). The aboveground biomass of all PFTs was reproduced well by themodel (difference ±4%). This is due to the fact that the biomass estimations of the study site wereused to calibrate the forest model. PFT1 is the dominating PFT in terms of biomass with 330todm/ha. The high variation in the total aboveground biomass (see Fig 2c/2d) is due to the deathof tall trees of PFT1. The biomass of PFT1 fluctuated between 250 and 450 todm/ha over time.
The total basal area of the simulated data (39 m2/ha) was close to the observed field data (40m2/ha, see Fig 2a/2b). The basal area of PFT1 was slightly underestimated (5%) in the simula-tion. Simulated basal areas of the remaining PFTs reproduced the field data very accurate (dif-ference ±2%). The consistence of simulated and observed basal area is due to the fact thatbiomass values, which by definition are closely linked to basal area, were used for calibration ofthe model. The mean total simulated basal area was 39 m2/ha and fluctuated between 28 and49 m2/ha over time. This variation was mainly due to fluctuations in the number of tall-grow-ing shade-tolerant canopy trees (PFT1).
Total stem numbers were 30% lower in the simulation (240 trees per hectare) than in thefield inventory (350 trees per hectare; see Fig 2e/2f). This difference is caused by PFT2 (shade-tolerant, up to 33 m in height), which had 100 trees per hectare less in the simulation than ob-served in the field. Overall, the stem numbers varied over time due to stochastic processes inthe model (between 150 and 400 trees per hectare).
The stem size distribution of the simulated data was similar to the field data for all treeswith a DBH> 20 cm (Fig 3). The number of trees between 10 and 20 cm DBH was underesti-mated up to 50% compared to the field data. Overall, the difference in simulated versus ob-served stem numbers is mainly due to fewer small trees within PFT2 with a DBH between 10cm and 20 cm (shade-tolerant tree species).
The leaf area index (LAI) was repeatedly measured at different heights (0 m, 0.5 m, 2.0 m)and ranged from 6 at ground level to 4 at 2.0 m above ground. The LAI in the simulated forestat 2.0 m height was similar to the observed values (see Fig 4). However, at ground level the
Simulating Carbon Stocks and Fluxes of an African Tropical Forest
PLOS ONE | DOI:10.1371/journal.pone.0123300 April 27, 2015 5 / 13

simulated LAI was 20% lower than that observed in the field. This is due to the fact that thesimulation has 30% fewer trees compared to the real forest. Additionally, this could be due tosmall plants growing in the understory in the field (shrubs, herbs) which reduce the light atground level but was not taken into account in the simulation. There was a high degree of LAIvariation in the simulated forest, which is also typical for real forests in the investigated areadue to the complex forest structure [23].
Fig 2. Simulation vs. Measurements.Comparison between simulated variables and measurements fromthe forest inventory at Mt. Kilimanjaro. Presented are simulated basal area (a), aboveground biomass (c), andstem numbers (e) over time for each PFT. The points represent the measured value from the inventory data.A direct comparison between mean values of the simulation (300–1000 years) versus measured values foreach PFT is also presented. The vertical lines represent the variation of the simulated value for basal area(b), aboveground biomass (d), and stem numbers (f).
doi:10.1371/journal.pone.0123300.g002
Simulating Carbon Stocks and Fluxes of an African Tropical Forest
PLOS ONE | DOI:10.1371/journal.pone.0123300 April 27, 2015 6 / 13

In the simulated mature forest, gross primary production (GPP) reached 23.5 tcha-1yr-1 (see
Fig 5). Respiration of the aboveground vegetation contributed 18.8 tcha-1yr-1. Thus, mean net
primary productivity (NPP) was approximately 4.7 tcha-1yr-1. The total loss of aboveground
biomass due to mortality events was in the same magnitude as NPP (4.7 tcha-1yr-1), which is
typical for forests in the late successional phase [50,51].To analyze the carbon stocks, we distinguished between three different carbon pools: carbon
stored in the living vegetation, carbon in the deadwood and carbon stored in the upper soillayer. According to the simulation, the mature forest stored 193 tc/ha in the living vegetation,32 tc/ha in the deadwood and 28 tc/ha in the soil (see Fig 6a). In total, there was 253 tc/ha car-bon stored above- and belowground in the investigated tropical forest.
Using the simulated carbon stocks and the fluxes between these stocks it is possible to esti-mate the carbon balance. According to the model results, the forest was a strong carbon sinkduring the first 150 years of simulation (see Fig 6b). During this phase the forest stored up to 6tcha
-1yr-1. After about 200 years of simulation the NEE got balanced with values between +1.0and -1.0 tcha
-1yr-1. In the mature state, the forest is in a nearly carbon neutral state.
DiscussionThe region around Mt. Kilimanjaro represents a biodiversity hotspot because of its uniquerange of vegetation zones and climatic conditions [17]. We parameterized the FORMIND for-est model for a lower montane tropical forest at Mt. Kilimanjaro. The simulation resultsshowed that the model successfully reproduces measured basal area and aboveground biomassdue to the fact that observed biomass values were used to calibrate the model. Total stem
Fig 3. Simulated stem size distribution. Number of trees for different DBH—classes. The red bars indicatethe simulated stem size distribution with its variation. The blue line indicates the measured stem sizedistribution for the investigated forest at Mt. Kilimanjaro.
doi:10.1371/journal.pone.0123300.g003
Simulating Carbon Stocks and Fluxes of an African Tropical Forest
PLOS ONE | DOI:10.1371/journal.pone.0123300 April 27, 2015 7 / 13

numbers are underestimated due to fewer small trees (understory) in the simulated forest(compared to the field data). However, we assume that this underestimation in stem number isof minor importance in the carbon dynamic analysis because most carbon is stored in hugetrees. To validate the model simulations we used independent measurements of leaf area indexwhich could be reproduced very well by the forest model. The simulated aboveground biomass(385 t/ha) is comparable to biomass estimations in the Amazon (312–464 t/ha; [9]) and low-land tropical forests in Africa (350–490 t/ha; [13,52]). Overall, we conclude that the FORMINDforest model is an appropriate tool for reproducing main structural characteristics of tropicallower montane forests at Mt. Kilimanjaro.
Tropical forests store a large amount of carbon [2,53]. However, further efforts have to bemade to measure the productivity and net ecosystem exchange of tropical forests in the field[3,54–56]. The average carbon stocks of African old-growth tropical forests were found to in-crease by one ton of carbon per hectare per year, as estimated by Lewis et al. based on monitor-ing of 79 forest inventory plots [52]. This might be due the positive effect of CO2-fertilizationon biomass production in tropical rainforests [52]. An alternative explanation could be that theforests investigated by Lewis may not have been in an old-growth phase and therefore had apositive carbon balance [57]. On a local scale, our study cannot confirm the finding that Afri-can tropical forests are carbon sinks. Under our assumptions of constant climatic conditionsand natural disturbances only (falling of large dying trees), the simulated carbon balance of anold-growth forest is zero on average. Grant et al. also found a balanced NEE in tropical forests
Fig 4. Leaf area index (LAI) for different height layers in a forest. The green line is the mean of thesimulated LAI, the green area is the range of the LAI in different height layers. The red points are the meanmeasurements of the LAI in the investigated forest, the red lines are the measured range.
doi:10.1371/journal.pone.0123300.g004
Simulating Carbon Stocks and Fluxes of an African Tropical Forest
PLOS ONE | DOI:10.1371/journal.pone.0123300 April 27, 2015 8 / 13

100 years after a clear-cut [8]. However, a changing climate could result in different NEE valuesfor the investigated region. This possibility needs to be investigated in future studies.
The forest model used here includes a detailed description of important forest processes(tree growth, mortality, recruitment, competition). Uncertain parameters were calibrated using
Fig 5. Simulated productivity and tree mortality over time. Presented are gross primary production(GPP), respiration of the vegetation, and the resulting net primary production (NPP). The red line indicatesthe loss of biomass due to mortality events.
doi:10.1371/journal.pone.0123300.g005
Fig 6. Carbon stocks and carbon fluxes. Simulated forest carbon pools and net ecosystem exchange(NEE) over time. (a) Presented is the amount of carbon in the living biomass, in the deadwood, and in the soil.(b) The NEE is a measurement of how much carbon is entering and leaving the forest. The simulated NEEstarted with a forest clearcut. Positive values indicate a carbon sink.
doi:10.1371/journal.pone.0123300.g006
Simulating Carbon Stocks and Fluxes of an African Tropical Forest
PLOS ONE | DOI:10.1371/journal.pone.0123300 April 27, 2015 9 / 13
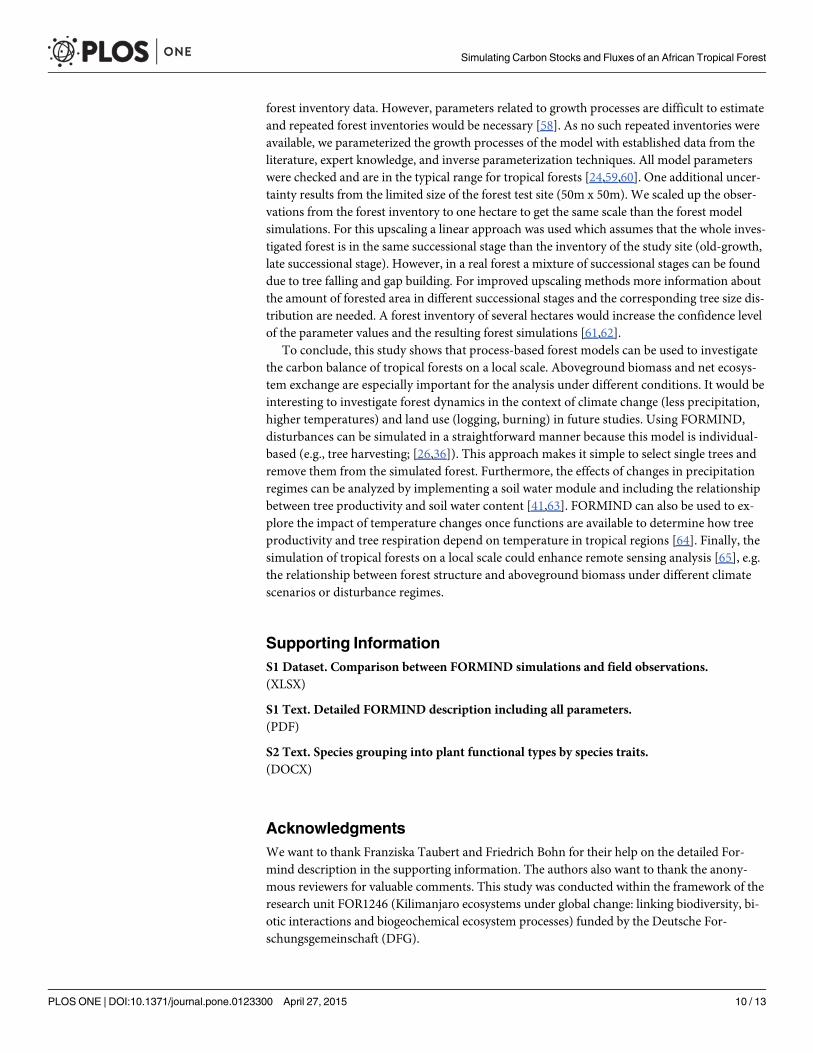
forest inventory data. However, parameters related to growth processes are difficult to estimateand repeated forest inventories would be necessary [58]. As no such repeated inventories wereavailable, we parameterized the growth processes of the model with established data from theliterature, expert knowledge, and inverse parameterization techniques. All model parameterswere checked and are in the typical range for tropical forests [24,59,60]. One additional uncer-tainty results from the limited size of the forest test site (50m x 50m). We scaled up the obser-vations from the forest inventory to one hectare to get the same scale than the forest modelsimulations. For this upscaling a linear approach was used which assumes that the whole inves-tigated forest is in the same successional stage than the inventory of the study site (old-growth,late successional stage). However, in a real forest a mixture of successional stages can be founddue to tree falling and gap building. For improved upscaling methods more information aboutthe amount of forested area in different successional stages and the corresponding tree size dis-tribution are needed. A forest inventory of several hectares would increase the confidence levelof the parameter values and the resulting forest simulations [61,62].
To conclude, this study shows that process-based forest models can be used to investigatethe carbon balance of tropical forests on a local scale. Aboveground biomass and net ecosys-tem exchange are especially important for the analysis under different conditions. It would beinteresting to investigate forest dynamics in the context of climate change (less precipitation,higher temperatures) and land use (logging, burning) in future studies. Using FORMIND,disturbances can be simulated in a straightforward manner because this model is individual-based (e.g., tree harvesting; [26,36]). This approach makes it simple to select single trees andremove them from the simulated forest. Furthermore, the effects of changes in precipitationregimes can be analyzed by implementing a soil water module and including the relationshipbetween tree productivity and soil water content [41,63]. FORMIND can also be used to ex-plore the impact of temperature changes once functions are available to determine how treeproductivity and tree respiration depend on temperature in tropical regions [64]. Finally, thesimulation of tropical forests on a local scale could enhance remote sensing analysis [65], e.g.the relationship between forest structure and aboveground biomass under different climatescenarios or disturbance regimes.
Supporting InformationS1 Dataset. Comparison between FORMIND simulations and field observations.(XLSX)
S1 Text. Detailed FORMIND description including all parameters.(PDF)
S2 Text. Species grouping into plant functional types by species traits.(DOCX)
AcknowledgmentsWe want to thank Franziska Taubert and Friedrich Bohn for their help on the detailed For-mind description in the supporting information. The authors also want to thank the anony-mous reviewers for valuable comments. This study was conducted within the framework of theresearch unit FOR1246 (Kilimanjaro ecosystems under global change: linking biodiversity, bi-otic interactions and biogeochemical ecosystem processes) funded by the Deutsche For-schungsgemeinschaft (DFG).
Simulating Carbon Stocks and Fluxes of an African Tropical Forest
PLOS ONE | DOI:10.1371/journal.pone.0123300 April 27, 2015 10 / 13
Author ContributionsConceived and designed the experiments: RF A. Huth. Performed the experiments: RF. Ana-lyzed the data: RF SP A. Huth. Contributed reagents/materials/analysis tools: RF AE GR DSCA. Hemp. Wrote the paper: RF AE GRMF DSCMK A. Hemp SP A. Huth.
References1. Bonan GB. Forests and climate change: Forcings, feedbacks, and the climate benefits of forests. Sci-
ence 2008; 320: 1444–1449. doi: 10.1126/science.1155121 PMID: 18556546
2. Pan YD, Birdsey RA, Fang JY, Houghton R, Kauppi PE, Kurz WA, et al. A large and persistent carbonsink in the world's forests. Science 2011; 333: 988–993. doi: 10.1126/science.1201609 PMID:21764754
3. Beer C, Reichstein M, Tomerelli E, Ciais P, Jung M, Carvalhais N, et al. Terrestrial gross carbon dioxideuptake: global distribution and covariation with climate. Science 2010; 329: 834–838. doi: 10.1126/science.1184984 PMID: 20603496
4. Houghton RA, Hall F, Goetz SJ. Importance of biomass in the global carbon cycle. Journal of Geophys-ical Research-Biogeosciences 2009; 114.
5. Luyssaert S, Schulze ED, Borner A, Knohl A, Hessenmoller D, Law BE, et al. Old-growth forests asglobal carbon sinks. Nature 2008; 455: 213–215. doi: 10.1038/nature07276 PMID: 18784722
6. Balch JK. Atmospheric science: Drought and fire change sink to source. Nature 2014; 506: 41–42. doi:10.1038/506041a PMID: 24499913
7. Cox PM, Betts RA, Collins M, Harris PP, Huntingford C, Jones CD. Amazonian forest dieback under cli-mate-carbon cycle projections for the 21st century. Theor Appl Climatol 2004; 78: 137–156.
8. Grant RF, Hutyra LR, de Oliveira RC, Munger JW, Saleska SR, Wofsy SC. Modeling the carbon bal-ance of Amazonian rain forests: resolving ecological controls on net ecosystem productivity. EcolMonogr 2009; 79: 445–463.
9. Houghton RA, Lawrence KT, Hackler JL, Brown S. The spatial distribution of forest biomass in the Bra-zilian Amazon: a comparison of estimates. Global Change Biol 2001; 7: 731–746.
10. Lewis SL, Brando PM, Phillips OL, van der Heijden GMF, Nepstad D. The 2010 Amazon Drought. Sci-ence 2011; 331: 554. doi: 10.1126/science.1200807 PMID: 21292971
11. Malhi Y, Roberts JT, Betts RA, Killeen TJ, Li WH, Nobre CA. Climate change, deforestation, and thefate of the Amazon. Science 2008; 319: 169–172. PMID: 18048654
12. FAO (2011) State of the World's Forests 2011. -179.
13. Lewis SL, Sonké B, Sunderland T, Begne SK, Lopez-Gonzalez G, van der Heijden GMF, et al. Above-ground biomass and structure of 260 African tropical forests. Phil Trans R Soc Lond B 2013; 368:20120295. doi: 10.1098/rstb.2012.0295 PMID: 23878327
14. Hemp A. Climate change and its impact on the forests of Kilimanjaro. Afr J Ecol 2009; 47: 3–10.
15. Hemp A. Ecology of the pteridophytes on the southern slopes of Mt. Kilimanjaro—I. Altitudinal distribu-tion. Plant Ecol 2002; 159: 211–239.
16. Hemp A. Climate change-driven forest fires marginalize the impact of ice cap wasting on Kilimanjaro.Global Change Biol 2005; 11: 1013–1023.
17. Hemp A. Continuum or zonation? Altitudinal gradients in the forest vegetation of Mt. Kilimanjaro. PlantEcol 2006; 184: 27–42.
18. Hemp A. The impact of fire on diversity, structure, and composition of the vegetation on Mt. Kilimanjaro.In: Spehn EM, LibermanM, Körner C, editors. Land use change and mountain biodiversity. BocaRaton, FL: CRC Press.2006. pp. 51–68.
19. Pabst H, Kühnel A, Kuzyakov Y. Effect of land-use and elevation on microbial biomass and water ex-tractable carbon in soils of Mt. Kilimanjaro ecosystems. Appl Soil Ecol 2013; 67: 10–19.
20. Pachauri RK, Reisinger A (2008) Climate Change 2007: Synthesis report. -104.
21. Chave J, Condit R, Aguilar S, Hernandez A, Lao S, Perez R. Error propagation and scaling for tropicalforest biomass estimates. Phil Trans R Soc Lond B 2004; 359: 409–420. PMID: 15212093
22. Brown S. Measuring carbon in forests: current status and future challenges. Environ Pollut 2002; 116:363–372. PMID: 11822714
23. Rutten G, Ensslin A, Hemp A, Fischer M. Forest structure and composition of previously selectivelylogged and non-logged montane forests at Mt. Kilimanjaro. Forest Ecol Manag 2015; 337: 61–66.
Simulating Carbon Stocks and Fluxes of an African Tropical Forest
PLOS ONE | DOI:10.1371/journal.pone.0123300 April 27, 2015 11 / 13

24. Dislich C, Günter S, Homeier J, Schröder B, Huth A. Simulating forest dynamics of a tropical montaneforest in South Ecuador. Erdkunde 2009; 63: 347–364.
25. Pacala S, Kinzig AP. Introduction to theory and the common ecosystemmodel. In: Kinzig AP, Pacala S,Tilman GD, editors. The functional consequences of biodiversity: empirical progress and theoretical ex-tensions. 2002. pp. 169–174.
26. Köhler P, Huth A. Simulating growth dynamics in a South-East Asian rainforest threatened by recruit-ment shortage and tree harvesting. Clim Change 2004; 67: 95–117.
27. Gutiérrez AG, Huth A. Successional stages of primary temperate rainforests of Chiloé Island, Chile.Perspect Plant Ecol Evol Syst 2012; 14: 243–256.
28. Rüger N, Gutiérrez AG, KisslingWD, Armesto JJ, Huth A. Ecological impacts of different harvestingscenarios for temperate evergreen rain forest in southern Chile—A simulation experiment. Forest EcolManag 2007; 252: 52–66.
29. Hemp A. The banana forests of Kilimanjaro: biodiversity and conservation of the Chagga homegar-dens. Biodivers Conserv 2006; 15: 1193–1217.
30. Botkin DB. Forest dynamics. Oxford, New York: Oxford University Press. 1993.
31. Bugmann H. A review of forest gap models. Clim Change 2001; 51: 259–305.
32. Shugart HH. A theory of forest dynamics. The Blackburn Press. 2003.
33. Shugart HH. A theory of forest dynamics. The Blackburn Press. 1984.
34. Martinez-Ramos M, Alvarez-Buylla E, Sarukhan J. Tree demography and gap dynamics in a tropicalrain forest. Ecology 1989; 70: 555–558.
35. Huth A, Ditzer T. Simulation of the growth of a lowland Dipterocarp rain forest with FORMIX3. Ecol Mod-ell 2000; 134: 1–25.
36. Huth A, Ditzer T. Long-term impacts of logging in a tropical rain forest—a simulation study. Forest EcolManag 2001; 142: 33–51.
37. Kammesheidt L, Köhler P, Huth A. Sustainable timber harvesting in Venezuela: a modelling approach.J Appl Ecol 2001; 38: 756–770.
38. Köhler P, Chave J, Riéra B, Huth A. Simulating the long-term response of tropical wet forests to frag-mentation. Ecosystems 2003; 6: 114–128.
39. Köhler P, Huth A. Impacts of recruitment limitation and canopy disturbance on tropical tree species rich-ness. Ecol Modell 2007; 203: 511–517.
40. Rüger N, Williams-Linera G, KisslingWD, Huth A. Long-term impacts of fuelwood extraction on a tropi-cal montane cloud forest. Ecosystems 2008; 11: 868–881.
41. Fischer R, Armstrong A, Shugart HH, Huth A. Simulating the impacts of reduced rainfall on carbonstocks and net ecosystem exchange in a tropical forest. Environ Modell Softw 2014; 52: 200–206.
42. Kazmierczak M, Wiegand T, Huth A. A neutral vs. non-neutral parametrizations of a physiological forestgap model. Ecol Modell 2014; 288: 94–102.
43. Bohn FJ, Frank K, Huth A. Of climate and its resulting tree growth: Simulating the productivity of temper-ate forests. Ecol Modell 2014; 278: 9–17.
44. Taubert F, Frank K, Huth A. A review of grassland models in the biofuel context. Ecol Modell 2012;245: 84–93.
45. Smith TM, Shugart HH (1997) Plant functional types.
46. Köhler P, Ditzer T, Huth A. Concepts for the aggregation of tropical tree species into functional typesand the application on Sabah's dipterocarp lowland rain forests. J Trop Ecol 2000; 16: 591–602.
47. Bennett ND, Croke BFW, Guariso G, Guillaume JHA, Hamilton SH, Jakeman AJ, et al. Characterisingperformance of environmental models. Environ Modell Softw 2013; 40: 1–20.
48. Hartig F, Dislich C, Wiegand T, Huth A. Technical Note: Approximate Bayesian parameterization of aprocess-based tropical forest model. Biogeosciences 2014; 11: 1261–1272.
49. Lehmann S, Huth A. Fast calibration of a dynamic vegetation model with minimum observation data.Ecol Modell 2015; 301: 98–105.
50. Malhi Y. The productivity, metabolism and carbon cycle of tropical forest vegetation. J Ecol 2012; 100:65–75.
51. Luyssaert S, Inglima I, Jung M, Richardson AD, Reichstein M, Papale D, et al. CO2 balance of boreal,temperate, and tropical forests derived from a global database. Global Change Biol 2007; 13: 2509–2537.
Simulating Carbon Stocks and Fluxes of an African Tropical Forest
PLOS ONE | DOI:10.1371/journal.pone.0123300 April 27, 2015 12 / 13

52. Lewis SL, López-González G, Sonké B, Affum-Baffoe K, Baker TR, Ojo LO, et al., Increasing carbonstorage in intact African tropical forests. Nature 2009; 457: 1003–1006. doi: 10.1038/nature07771PMID: 19225523
53. Malhi Y, Baker TR, Phillips OL, Almeida S, Alvarez E, Arroyo L, et al. The above-ground coarse woodproductivity of 104 Neotropical forest plots. Global Change Biol 2004; 10: 563–591.
54. Reichstein M, Falge E, Baldocchi D, Papale D, Aubinet M, Berbigier P, et al. On the separation of netecosystem exchange into assimilation and ecosystem respiration: review and improved algorithm.Global Change Biol 2005; 11: 1424–1439.
55. Lasslop G, Reichstein M, Papale D, Richardson AD, Arneth A, Barr A, et al. Separation of net ecosys-tem exchange into assimilation and respiration using a light response curve approach: critical issuesand global evaluation. Global Change Biol 2010; 16: 187–208.
56. Verbeeck H, Peylin P, Bacour C, Bonal D, Steppe K, Ciais P. Seasonal patterns of CO2 fluxes in Ama-zon forests: Fusion of eddy covariance data and the ORCHIDEEmodel. Journal of Geophysical Re-search-Biogeosciences 2011; 116: G02018.
57. Wright SJ. The carbon sink in intact tropical forests. Global Change Biol 2013; 19: 337–339. doi: 10.1111/gcb.12052 PMID: 23504773
58. Whitmore TC An introduction to tropical rain forests. Oxford: Oxford University Press. 1998. PMID:21238371
59. Phillips OL, Gentry AH. Increasing turnover through time in tropical forests. Science 1994; 263: 954–958. PMID: 17758638
60. Phillips OL, Hall P, Gentry AH, Sawyer SA, Vásquez R. Dynamics and species richness of tropical rainforests. PNAS 1994; 91: 2805–2809. PMID: 11607468
61. Clark DB, Clark DA. Landscape-scale variation in forest structure and biomass in a tropical rain forest.Forest Ecol Manag 2000; 137: 185–198.
62. Clark DB, Kellner JR. Tropical forest biomass estimation and the fallacy of misplaced concreteness. JVeg Sci 2012; 23: 1191–1196.
63. Granier A, Breda N, Biron P, Villette S. A lumped water balance model to evaluate duration and intensi-ty of drought constraints in forest stands. Ecol Modell 1999; 116: 269–283.
64. Prentice IC, Sykes MT, Cramer W. A simulation model for the transient effects of climate change on for-est landscapes. Ecol Modell 1993; 65: 51–70.
65. Köhler P, Huth A. Towards ground-truthing of spaceborne estimates of above-ground life biomass andleaf area index in tropical rain forests. Biogeosciences 2010; 7: 2531–2543.
Simulating Carbon Stocks and Fluxes of an African Tropical Forest
PLOS ONE | DOI:10.1371/journal.pone.0123300 April 27, 2015 13 / 13