Influence of hydromorphic soil conditions on greenhouse gas emissions and soil carbon stocks in a...
12
(This is a sample cover image for this issue. The actual cover is not yet available at this time.) This article appeared in a journal published by Elsevier. The attached copy is furnished to the author for internal non-commercial research and education use, including for instruction at the authors institution and sharing with colleagues. Other uses, including reproduction and distribution, or selling or licensing copies, or posting to personal, institutional or third party websites are prohibited. In most cases authors are permitted to post their version of the article (e.g. in Word or Tex form) to their personal website or institutional repository. Authors requiring further information regarding Elsevier’s archiving and manuscript policies are encouraged to visit: http://www.elsevier.com/copyright
Transcript of Influence of hydromorphic soil conditions on greenhouse gas emissions and soil carbon stocks in a...

(This is a sample cover image for this issue. The actual cover is not yet available at this time.)
This article appeared in a journal published by Elsevier. The attachedcopy is furnished to the author for internal non-commercial researchand education use, including for instruction at the authors institution
and sharing with colleagues.
Other uses, including reproduction and distribution, or selling orlicensing copies, or posting to personal, institutional or third party
websites are prohibited.
In most cases authors are permitted to post their version of thearticle (e.g. in Word or Tex form) to their personal website orinstitutional repository. Authors requiring further information
regarding Elsevier’s archiving and manuscript policies areencouraged to visit:
http://www.elsevier.com/copyright

Author's personal copy
Influence of hydromorphic soil conditions on greenhouse gas emissionsand soil carbon stocks in a Danish temperate forest
Jesper Riis Christiansen ⇑, Per Gundersen, Preben Frederiksen, Lars VesterdalDivision of Ecosystem and Biomass Science, Forest & Landscape Denmark, Faculty of Life Sciences, University of Copenhagen, Rolighedsvej 23, DK-1958 Frederiksberg C, Denmark
a r t i c l e i n f o
Article history:Received 15 March 2012Received in revised form 15 June 2012Accepted 27 July 2012
Keywords:Nitrous oxideMethaneSoil hydrologyHydromorphic soilsCarbon sequestration
a b s t r a c t
Recent research has shown that wet or hydromorphic soils in forests are hotspots for greenhouse gas(GHG) emission of methane (CH4) and nitrous oxide (N2O), and that emission of these gases may offsetthe mitigation potential from carbon (C) sequestration. However, quantitative evidence at the forest scaleis limited. We investigated the role of hydromorphic soils for N2O and CH4 fluxes at the forest districtlevel (Barritskov, 348 ha) by mapping the distribution of upland and hydromorphic soils, measuringthe soil carbon and nitrogen stocks and field fluxes of N2O and CH4 for a period of 2 years as well as inlaboratory experiments.
Field exchange rates of N2O (mean ± standard error of the mean(SE), lg N2O–N m�2 h�1) were similarfor hydromorphic (3.8 ± 1.2) and upland soils (3.8 ± 0.4). Although both soil types displayed net CH4 oxi-dation the average rate (lg CH4–C m�2 h�1) was significantly lower in hydromorphic soils (�5.8 ± 2)compared to the upland soils (�23 ± 1.2). Soil water content (SWC) was, as expected, higher in hydromor-phic soils which was consistent with lower uptake of CH4 as well as significantly larger soil carbon stocksin O horizon plus 0–30 cm mineral soil (86 ± 6 versus 66 ± 5 Mg C ha�1 in hydromorphic versus upland).Oxidation rates of CH4 in laboratory incubations at ambient concentration (2 lL L�1) were similar in thetwo soil types, but the hydromorphic soils oxidised CH4 fastest when incubated at 10,000 lL L�1 CH4:only hydromorphic soils produced CH4. Potential N2O production did not differ between soil types andN2 production was significantly higher in hydromorphic soils, which also had a higher pH > 6.
Based on four scenarios, we assessed how reduced ditching might affect the emissions of N2O and CH4
from upland soils. The CH4 sink of the soil decreased in all four reduced ditching scenarios from 1.3 to7 Mg CO2-equivalent (eqv) y�1. The emissions of N2O and CH4 in the current state and all scenarios com-prised only a minute fraction (<1%) of the global warming potential (GWP) of carbon stored in the soil.
We conclude that hydromorphic soils are potential hotspots for CH4 production and reduced uptake ofatmospheric CH4, but their limited area covered by such soils at Barritskov implies that upland soils aremost important in terms of soil C stock and the non-CO2 GHG budget. Ceased drainage activities in uplandsoils are expected to increase the likelihood of CH4 emissions and reduce soil CH4 uptake.
� 2012 Elsevier B.V. All rights reserved.
1. Introduction
Forests may sequester carbon dioxide (CO2) from the atmo-sphere reducing the human-induced greenhouse effect. In thenorthern hemisphere forests annually remove an estimated 2.2–2.6 Pg of atmospheric CO2 (Goodale et al., 2002), equal to 7–8% ofthe total global human CO2 emission of fossil fuels in 2010 (Peterset al., 2012). The sequestration of atmospheric greenhouse gases(GHGs) in forest vegetation and soil is partly offset by soilemissions of the strong GHGs N2O and CH4, 298 and 21 times
more effective as GHG than CO2, respectively. Soil hydrology isconsidered one of the most important drivers of GHG emissionsand it has been proposed that hotspots of emissions from hydro-morphic forest soils may constitute an important but underesti-mated contribution to the GHG balance of ecosystems (Jungkunstand Fiedler, 2007; Grunwald et al., 2012). In a recent assessmentof the European GHG balance oxidation of atmospheric CH4 in up-land soils (forest and heathlands) was equivalent to an annual CO2
sequestration of �4 Tg while upland forest and heathland soilswere only a minor source for N2O compared to arable lands (Schu-lze et al., 2010). In a comparison of CH4 fluxes comprising arable,grassland and forests soils from around the world it was found thatforest soils generally were stronger net sinks for atmospheric CH4
than the other land use types (Boeckx and Van Cleemput, 2001).Thus, experimental data suggest that forests are an important sinkfor atmospheric CH4. Although there has been increasing research
0378-1127/$ - see front matter � 2012 Elsevier B.V. All rights reserved.http://dx.doi.org/10.1016/j.foreco.2012.07.048
⇑ Corresponding author. Present address: Belowground Ecosystem Group,Department of Forest Sciences, Faculty of Forestry, Forest Sciences Centre, Univer-sity of British Columbia, 2424 Main Mall, Vancouver, British Columbia, Canada V6T1Z4. Tel.: +1 778 788 6184; fax: +45 3533 1517.
E-mail address: [email protected] (J.R. Christiansen).
Forest Ecology and Management 284 (2012) 185–195
Contents lists available at SciVerse ScienceDirect
Forest Ecology and Management
journal homepage: www.elsevier .com/locate / foreco

Author's personal copy
focus to understand the controls on GHG dynamics in soils, consid-erable uncertainty still exists to what degree N2O and CH4 fluxesfrom the soil offset the CO2 sink of forest soils especially whenaccounting for emissions of the strong GHGs CH4 and N2O fromthe wetter parts of the forest (Grunwald et al., 2012).
Hydromorphic soils in forests are often located in depressions inthe landscape where runoff water is concentrated. They are charac-terised by high groundwater table, morphological features such asgley and elevated stocks of soil carbon compared to soils on higherground (Christiansen et al., 2012). Comparing drained and un-drained deciduous forests in Sweden von Arnold et al. (2005a)showed that CH4 emissions in an undrained alder forest wereone to two magnitudes of order higher than in adjacent drainedplots. However, the wet soils under alder showed a smaller N2Oemission than the drained alder and birch soils. Furthermore,upscaling field observations of N2O and CH4 fluxes show that evensmall areas of hydromorphic forest soils are hotspots for CH4 andN2O emissions. Emissions of the strong GHGs from these areas willnegatively affecting the carbon sequestration potential of forests(Fiedler et al., 2005; Jungkunst and Fiedler, 2005, 2007).
Thus, the distribution of water in the landscape also dictates thespatial occurrence of GHG uptake and production. Recently, Grun-wald et al. (2012) attempted to elucidate the role of the hydromor-phic forest soils for the European CH4 balance. They found thatinclusion of hydromorphic forest soils in inventory calculationsdoubled net CH4 emissions from natural systems in Europe. How-ever, they also emphasised that the large uncertainty of the conti-nental CH4 budgets stems from the lack of knowledge regardingthe spatial distribution of hydromorphic soils. The same appliesto N2O emissions as distributions of hydromorphic and uplandsoils also drive N2O emission fingerprints from larger forest areas(Christiansen et al., 2012). Thus, improved knowledge of spatialvariability in soil hydrology together with field observations ofN2O and CH4 will provide more robust estimates of CH4 and N2Ofluxes from forests.
The need to account for the role of hydromorphic forest soilsmust also be seen in the light of future land-use change in forestsand of projected climate change (Gundersen et al., 2012). Currentland management trends in Denmark and parts of Europe are to re-store natural conditions by afforestation and forest restorationleading, amongst other effects, to re-establishment of foresthydrology to pre-drainage conditions (Stanturf and Madsen,2002). Understanding the role of hydromorphic soils is underlinedby the fact that the impacts of forest cover changes on greenhousegas fluxes in Nordic riparian forests remains unclear althoughthese forests are hotspots for C and N turnover in the environment(Gundersen et al., 2010). Furthermore, winter precipitation hasbeen suggested to increase for large parts of northern Europe inthe near future which could lead to increased soil wetness duringthis period with unknown consequences for the GHG balance inEuropean forests (Christensen et al., 2007).
While it has been shown that drainage of organic deciduous andconiferous forest soils decreased CH4 emissions, while (simulta-neously) increasing CO2 and N2O emissions and resulting in higherglobal warming potential of the soil compared to a non-drainedsite (von Arnold et al., 2005a,b), little is known regarding the ef-fects of rewetting previously drained soils. Without the possibilityof large scale landscape manipulations studying the processes ofN2O and CH4 formation and consumption for hydromorphic soilsin laboratory conditions compared to field observations may pro-vide us with clues to understand how rewetting of previouslywet soils might affect the regulation and emission of these impor-tant GHGs from forest soils.
With this in mind we set out to investigate the importance ofhydromorphic forest soils for N2O and CH4 emissions in a typicalDanish deciduous forest district. The objectives of this study were;
(1) to map hydromorphic and upland soils in the forest to developa strategy for representative sampling and upscaling of GHG fluxesbased on available spatial data in GIS, (2) to measure the fluxes ofN2O and CH4 in the chosen hydromorphic and upland study sites inthe field and laboratory, (3) to estimate the soil carbon pools in thechosen hydromorphic and upland study sites and (4) to assess howreduced drainage of upland forest soils could affect the GHG bud-get of N2O and CH4 at the forest district level.
2. Materials and methods
2.1. Study area
The study was carried out in the period from March 2008 toMay 2010 in the forests of Sønderskov, Barrit Tykke and KlakringSkovhaver (a total forested area of 348 ha) located close to thetown of Barrit on the northern shore of Vejle Fjord in Jutland,Denmark (55�410N, 9�550E). The forests are part of the Barritskovestate and documented as forests since 1770, possibly with for-ested cover dating further back in time (Lone Nørgaard Telling,pers. comm.). The dominant tree species are (in order of areal)European beech (Fagus sylvatica), pedunculate oak (Quercus robur),and ash (Fraxinus excelsior).
The climate is temperate with a mean annual temperature of7.9 �C and precipitation of 670 mm y�1 for the period 1961–1990(DMI, 2000). The area is gently sloping with a southward aspect to-ward Vejle Fjord and consists mainly of glacial till deposits. It isintersected by north-to-south oriented narrow valleys or gulleyswith illuvial deposits of sand and gytja. A previous soil survey ofthe forests (Jellesen et al., 2001) characterised the soils as TypicPaleudalf (Sønderskov), Typic Epiaquent and Humaqueptic Endoa-quent (Barrit Tykke) and Typic Epiaqoll (Klakring Skovhaver) (SoilSurvey Staff, 1998). The clay, silt and sand content varied between12% and 20%, 15% and 19%, 61% and 70%, respectively, with a rangeof 1.6–4% soil organic carbon in the A horizon. A detailed spatialinvestigation of the internal drainage conditions in the soils ofthe forest revealed that 51% of the glacial till soils or upland soils(comprising an area of 324 ha) suffer from poor internal drainageresulting in pseudogley (Jellesen et al., 2001).
We also included data on potential denitrification from twoadditional sites. Strødam, an unevenly aged mixed deciduous for-est, is located in northern Zealand, Denmark. The soil is sandy loa-my till and there is a steep hydrological gradient within the studysite. The second additional site, Vestskoven, was afforested in 1971with pedunculate oak. The soil at this site is classified as a MollicHapludalf (Soil Survey Staff, 1998) and consists of clayey loamy tilland quite variable in moisture content. Further details about thelatter two sites are given in Christiansen et al. (2012).
2.2. Identification of representative study sites
The GIS analyses were performed with ArcMap 9.3 (ESRI,Redlands, CA, USA). The spatial reference for each data layer wasstandardised and the spatial precision errors that occurred duringthis procedure were assessed not to have any practical significancefor the purpose of the analyses.
The aim of this GIS analysis was to map the hydromorphic andupland soils in order to devise a strategy for sampling and upscal-ing of GHG exchange and soil carbon stocks to forest district levelthat encompassed all dominant tree species types and representedaveragely aged stands.
We combined map layers (digital elevation map (NationalSurvey and Cadastre, 2012), national soil map 1:25,000 (GeologicalSurvey of Denmark and Greenland, 2008), forest map and ditchmap) and defined criteria for the site selection. First we selected
186 J.R. Christiansen et al. / Forest Ecology and Management 284 (2012) 185–195

Author's personal copy
the hydromorphic sites and then selected the remaining sites. Wedefined the hydromorphic soils to be present in the areas with soilmaterial originating from fluvial processes while upland soils occurin all areas defined as glacial till soils (Geological Survey of Den-mark and Greenland, 2008). On subsequent field trips we verifiedthis definition by using soil augers to sample soil to 100 cm depth.
A schematic flow chart of the GIS analysis with criteria for selec-tion of the 12 study sites is given in Supplementary material(Fig. A1). Eight of the sites were characterised as upland soils andfour sites as hydromorphic soils (Table 1). We validated the resultsof the GIS analysis in the field and altered the status of one oak sitefrom upland soil to hydromorphic soil, increasing the total numberof wet sites to five.
By identifying suitable study sites within the forest, it was pos-sible to optimise the collection regarding the number of samplesand obtain the broadest spatial representation of GHG fluxes andsoil carbon stocks.
2.3. Soil sampling and analyses
Forest floor and mineral soil were sampled at two points next toeach of the three chambers per study site. Forest floors were sam-pled in September 2008 just before the onset of foliar litterfall fordeciduous species, i.e. when forest floor mass was at a minimum.The forest floor was defined as the organic material above the min-eral soil and was sampled on an area basis using a 25 cm � 25 cmwooden frame. Forest floors were dried to constant weight at 55 �Cand hand-sorted to remove herbaceous litter and roots if presentbefore weighing. The two subsamples per chamber were subse-quently ground and pooled leaving three samples per study sitefor chemical analysis. Intact cores of mineral soil were sampledusing an auger with an internal diameter of 4.5 cm (Westman,1995). To determine bulk density of the mineral soil fraction coreswere divided into three segments: 0–5 cm, 5–15 cm, and 15–30 cm, and passed through a 2 mm sieve to remove stones andgravel. In three of the study sites, one upland and two hydromor-phic sites, we sampled the soil to a depth of 100 cm.
Fine and coarse roots were removed by hand. The sieved sam-ples were dried at 55 �C and weighed. Subsamples were dried at105 �C for correction of weight. Stone content ranged within1–7%. Following determination of bulk density the six soil coresper study site were pooled to one composite sample per depth seg-ment. A subsample of the mineral soil samples were finely groundin an agate mortar for carbon and nitrogen analysis. Ground sam-ples of forest floor material and mineral soil were analysed for totalC and N by dry combustion (Dumas method, VarioMax CH ana-lyzer, Elementar Analysensysteme GmbH, Hanau, Germany) atAgrolab, Institut Koldingen, Sarstedt, Germany.
Forest floor C contents were calculated by multiplying Cconcentrations with forest floor mass. Mineral soil organic carbon
content (SOC) for the fraction P2 mm was not assessed. Therewas no inorganic C (CaCO3) to a depth of 30 cm depth and all mea-sured C was consequently considered to be organic. Soil organic Ccontents in (Mg ha�1) for each of the three soil layers were calcu-lated by correcting for the fragment of the sample P2 mm contentand extrapolating to a hectare basis using the fine fraction bulkdensity according to the equation
SOCi ¼ qi 1� di;2mm
100
� �� �diCi � 10�1 ð1Þ
where qi is the bulk density of the <2 mm fraction in g cm�3, di,2 mm
is the relative volume of the fraction P2 mm (%), di denotes thethickness of layer i in cm, Ci denotes the C concentration of layer i(mg g�1), and 10�1 is a unit factor (10�9 mg Mg�1 � 108 cm2 ha�1).
Soil pH was determined for all mineral soil samples by mixing12 g of dried soil sample with 30 mL 0.01 M CaCl2. The pH wasmeasured in the supernatant using a video titrator (Radiometer,Copenhagen, Denmark).
2.4. Greenhouse gas measurements and flux calculation
Measurements of GHG fluxes were conducted approximately ona monthly basis during a period of 2 years from March 2008 to May2010. At each sampling occasion volumetric soil water content(SWC) (Theta probe ML2x, Delta T Devices, UK) and soil tempera-ture (model 550B, UEi, Beaverton, Oregon, USA) were also mea-sured 0–5 cm from each static chamber.
The net soil surface exchange of CH4 and N2O was measuredwith non-mixed closed static chambers that were installed in per-manent locations throughout the study period. Three chamberswere installed at random positions within each study site. Thechamber collar (inner diameter of 30.5 cm) was inserted 10 cm inthe soil and headspace volumes ranged from 6 to 8 L. For chambersplaced in the wet parts of the forest a platform was placed in thevicinity of the chamber so that gas samples could be withdrawnfrom the chamber without disturbing the soil around the chamber.During sampling of headspace air, a lid was placed on top of thecollar and sealed with a silicon rubber ring around the edge ofthe lid ensuring gas-tight conditions. Chamber headspace sampleswere withdrawn with 60 mL plastic syringes through a butyl rub-ber septum in the middle of the lid at times 0, 30, 60 and 120 min.From March 2009 the enclosure time was reduced to 60 min andsamples taken every 20th minute at 0, 20, 40 and 60 min. At eachheadspace sampling the syringe was used to mix the headspace bypumping three times before fully filling the syringe. Pressurechanges in a manually sampled chamber headspace has been re-ported to lead to overestimation of the estimated diffusive flux(Bekku et al., 1995), but we did not observe any changes, e.g.non-linear behaviour of concentrations over time in headspaceconcentrations that could be attributed to mass flow caused bydepressurisation of the chamber headspace. Headspace sampleswere transferred to non-evacuated 2.7 mL crimped vials with a bu-tyl rubber septum by flushing the vial with 58 mL of the sample inthe syringe and pressurising the vial with the remaining 2 mL.
Gas samples were stored for a maximum of 5 days in vials be-fore analysis. Gas samples were analysed on a Shimadzu GC-2014gas chromatograph (Shimadzu, Kyoto, Japan) equipped with elec-tron capture and flame ionisation detectors set at 300 �C and200 �C, respectively. The carrier gas was 100% N2 with a flow rateof 25 mL min�1. Methane and N2O were analysed in separate col-umns set in a constant oven temperature of 40 �C. The columnused for CH4 was a 60/80 Carboxen 1000 (15 ft, 1/8 in.). For N2Oan 80/100 Hayesep Q (2.5 m, 1/8 in.) column was used. An auto-sampler equipped with a syringe extracted 1.6 mL sample from
Table 1Main characteristics of the twelve study sites at Barritskov selected through the GISanalysis.
Soil type Tree species Parent material Year of planting
Upland Beech Glacial till 192618951946
Oak Glacial till 18951946
Ash Glacial till 19761961
Hydromorphic Beech Alluvial sand 189519051970
Ash Alluvial sand 1988Oak Alluvial sand 1911
J.R. Christiansen et al. / Forest Ecology and Management 284 (2012) 185–195 187

Author's personal copy
the vial and injected 0.75 mL into each column used for CH4 andN2O.
All gas fluxes were calculated by linear regression of gas con-centrations versus time. For this study we did not estimate theminimal detectable flux and instead used R2 of linear regressionas a threshold for a significant flux. Regressions with an R2-valueabove 0.85 were accepted for flux calculations. For regression anal-yses resulting in R2-values below 0.85, the increase or decrease inN2O and CH4 concentrations was smaller than we most likely coulddetect with our gas chromatographic setup and fluxes were set tozero. We always rejected chamber enclosure data that appearedchaotic in nature. Fluxes were expressed as lg N2O–N m�2 h�1 orlg CH4–C m�2 h�1. We estimated an annual budget in kg CH4 ha�1
or kg N2O ha�1 by assuming that the flux rate measured for a givendate represented the entire period until the next sampling date.We converted the annual budgets of CH4 and N2O to CO2-equiva-lents by a factor of 21 and 298, respectively (Forster et al., 2007).
2.5. Laboratory incubations
Intact soil cores from the top mineral soil (0–5 cm) were sam-pled in the middle of each chamber for all twelve study sites usingcorers with a diameter of 5 cm in November 2009 and 2011 atStrødam/Vestskoven and Barritskov, respectively. Upon arrival tothe laboratory the intact soil were kept in the corners in a dark coolroom at 4 �C until analysis. We divided the intact soil cores in fiveparts and removed stones and larger root fragments. Two partswere air dried and used for the potential CH4 oxidation experi-ment, one part was used for the potential CH4 production experi-ment, and the last two parts for the potential denitrificationdetermination. To determine the absolute SWC 20–30 g of freshand air dried soil were dried at 55 �C for 48 h.
For incubation, the soil was transferred to screw cap glass incu-bation bottles (approximately 120 mL) that were sealed with butylrubber septums. The headspace of the incubation bottles weredetermined by the difference in weight for a bottle with soil (andsubstrate solution) only and the same bottle with soil (and sub-strate solution) filled with water to the brim. For all three CH4
experiments we used three control bottles to check the back-ground of the experiments. Any rates smaller than the control rateswere set to zero. All rates were determined with linear regressionbetween concentration and time and expressed as lg N2O–N g dry soil�1 d�1 or lg CH4–C g dry soil�1 d�1.
2.5.1. Potential CH4 oxidationTwo experiments were performed to measure the CH4 oxidation
potential of the soils from Barritskov in order to target high andlow-affinity methanotrophic bacteria. Prior to the CH4 oxidationexperiments we air dried the fresh soil for 24 h to decrease theSWC and create more optimal conditions for CH4 oxidation(Gulledge and Schimel, 1998). We incubated 10 g of air dried soilin each bottle. In one set of bottles the initial CH4 concentrationin the headspace was maintained at ambient level (�2 lL L�1) totarget high-affinity methanotrophs (Reay et al., 2005). In anotherset of bottles we increased the headspace concentration to�10,000 lL L�1 by injecting 1 mL of 100% CH4 to target high-affinity methanotrophs (Reay et al., 2005). Bottles were thoroughlymixed by rolling prior to sampling. For the high-affinity methano-troph experiment we sampled at 0, 24 and 48 h after bottle closureand extracted 600 lL from the headspace and manually injected500 lL into the gas chromatograph. For the low-affinity methano-troph experiment we sampled at 0, 24, 74, 146 and 251 h afteraddition of pure CH4. We extracted 300 lL from the headspaceand injected 200 lL into a crimp sealed vial containing atmo-spheric air. The samples were subsequently analysed on the gaschromatograph using the autosampler system.
2.5.2. Potential CH4 productionWe added 3 mL of anoxic 10 mM sodium acetate solution to
10 g of fresh soil in an incubation bottle. MilliQ water was usedand the solution was anoxified in an ultrasonic bath for 10 minbefore addition to the bottles. We then evacuated the closed incu-bation bottle with a vacuum pump to a constant partial vacuum ofca.�700 mbar for 3 min. Subsequently, we flushed the bottles withpure N2 for 3 min and assumed we had created an O2 free head-space. Following this step we pressurised the bottle with 10 mL aH2/CO2 gas mixture (80%/20% v/v) obtaining an overpressure ofabout 15 mbar. Our protocol was slightly modified from that ofWagner et al. (2007). We sampled headspace at 0, 24, 240 and540 h after addition of the H2/CO2 gas mixture. We extracted600 lL from the headspace, rejected 100 lL and injected theremaining 500 lL in a crimp sealed vial containing atmosphericair. The samples were subsequently analysed on the gas chromato-graph using the autosampler system.
2.5.3. Potential denitrificationThe rate of potential denitrification was determined using the
acetylene inhibition technique where addition of the acetylenegas inhibits the reduction of N2O to N2 (Yoshinari et al., 1977).To two sets of incubation bottles with 10 g of fresh soil we added15 mL of a solution consisting of 1 mM KNO3, 0.5 mM glucose,0.5 mM sodium acetate, 0.5 mM sodium succinate (Bernsteinsä-ure). Similar to the CH4 production experiment anoxified MilliQwater was used in preparing the solutions and bottles were evacu-ated and flushed. In one set of bottles with soils from all the studysites 10 mL of acetylene was added and for the second set of bottleswe added 10 mL N2. The samples were incubated under constantshaking for 2.5 h and gas samples were extracted at 30, 60, 90,120 and 150 min after addition of gas and transferred to crimp-sealed vials and subsequently analysed on the gas chromatograph.Fluxes of potential N2O obtained without acetylene were sub-tracted from the N2O fluxes with acetylene for each sample to ob-tain a flux interpreted as the potential rate of completedenitrification to N2 expressed as lg N2–N g dry soil�1 d�1.
2.6. Reduced soil drainage scenario analysis
2.6.1. Affected forest areaThis analysis served to provide the data on the spatial extent of
soils affected by reduced drainage scenarios. The aforementionedGIS map layers were supplemented with the following informationand assumptions:
� A digitised map of internal soil drainage type in the top 120 cmof the forest soils divided in two classes: (A) temporary watersaturation and (B) no signs of temporary saturation (Jellesenet al., 2001).� Ceased drainage in class A would affect the whole area, whereas
ceased drainage in class B would affect the soil closest to theditches within an impact zone.� For class B areas we defined two scenarios (impact zones) in the
case of reduced drainage: A 2 m zone and a 30 m zone aroundthe ditches (zones intersecting with hydromorphic soils wereexcluded here, since already represented in class A).
The 2 m impact zone of ditches was calculated using the meth-odology of Skaggs et al. (2005) using data on hydrological conduc-tivity from a comparable loamy soil profile in Denmark(Frederiksborg in Gundersen et al. (2009)). The 30 m impact zonewas chosen as a ‘‘maximum influence’’ scenario of reduced soildrainage around ditches. Roads and tracks (25 ha out of the373 ha) were excluded from the analysis.
188 J.R. Christiansen et al. / Forest Ecology and Management 284 (2012) 185–195

Author's personal copy
2.6.2. Impact on GHG emissionsIn order to calculate the effect on the N2O and CH4 net exchange
by reduced soil drainage in the upland soils classes A and B we ex-plored the relationship between the mean N2O or CH4 exchangerate and soil moisture content for a given date and established a re-sponse function between GHG exchange rate and soil moisturecontent. Thus, we aggregated data on soil group (hydromorphicand upland) levels only and assumed the relationship to be validindependent of location.
To date we have no knowledge of studies in Danish forests thathave quantified the large scale impact on soil hydrology afterceased effect of ditching (although this currently occurs in manyforest districts). Thus, we attained a conservative approach and cal-culated the effect on GHG exchange by two levels of increased soilmoisture content for each of the impact scenarios in Section 2.6.1.We assumed that ceased maintenance of ditches would increaseSWC by 5% for the upland soils (classes A and B) and as a maximumresponse increased the SWC by 16% equalling the mean SWC ob-served for the hydromorphic soils.
In total we calculated the impact on the GHG exchange for six dif-ferent scenarios, including a scenario without the presence of hydro-morphic soils, the current distribution of hydromorphic and uplandsoils and the four combinations of reduced drainage discussed above(i.e. 5% and 15% SWC increases in both 2 and 30 m impact zones).
2.7. Statistics
For statistical analyses the SAS software version 9.2 (SAS Insti-tute Inc., Cary, North Carolina, USA, 2008) was used and signifi-cance was accepted at p 6 0.05. The statistical analyses in thisstudy focused on determining the effect of soil type between theupland (N = 7) and hydromorphic study sites (N = 5). For the fol-lowing parameters we used repeated measures ANOVA in PROCMIXED to test treatment effect time series of soil surface net ex-change of N2O and CH4, SWC and temperature in 0–5 cm. Thechamber measurements represented the subject repeated overtime and the stand was used to account for the random variationof the tested parameter in the repeated measure analyses.
We used one way ANOVA to test ‘treatment’ effect (hydromor-phic versus upland soils) on mineral soil pH, pools of organic carbonand total nitrogen in the organic horizon and mineral soil (0–30 cm)as well as the C:N ratio of the organic horizon and in the mineral soil(0–30 cm). Common for both analyses was that the type of soil wasthe independent variable. In order to comply with the assumptionsof the statistical test, i.e. variance homogeneity between groups andnormal distribution of residuals, N2O fluxes, SWC and temperaturewere square-root transformed, CH4 fluxes were transformed to(CH4 + 350)1.5 and C:N ratio of the organic horizon was log10 trans-formed. The transformation was adopted from the automatic rou-tine ‘‘Guided data analysis’’ in the SAS software version 9.2. Wedid not test for tree species differences for any of the treated dataas we did not have a fully balanced collection of tree species repre-sented on both upland and hydromorphic soils.
The differences in potential denitrification and CH4 oxidation andproduction was tested using Mann–Whitney rank sum test becausethese data were not normally distributed or there was no varianceheterogeneity between groups (hydromorphic and upland soils).
3. Results
3.1. Upland versus hydromorphic soils
3.1.1. Soil moisture and field GHG fluxesAs expected the mean SWC was �20% higher (Fig. 1A, p < 0.001)
in the hydromorphic soils and was associated with a fourfold lower
mean CH4 uptake (Fig. 1D, p < 0.001) compared to the upland soils(Table 2). All the study sites on upland soils were net sinks for CH4
whereas the study site with oak was the only net emitter for thehydromorphic soil group and ash and beech were small net sinks(Fig. 1D). Methane fluxes tended to decrease in summer periodsand increase during autumn and winter (Fig. 2C and D) althoughthe temporal variation in flux magnitude was around 20 lgCH4–C m�2 h�1. Furthermore, there was a high degree of covari-ance between CH4 fluxes (mean, min and max) in the hydromor-phic and upland soil types during the study period (Fig. 2C andD). We observed the majority of CH4 emission events in springwhen SWC was still high while the number of emission eventssharply decreased in the summer and the SWC in the hydromor-phic soils presumably fell below a threshold for CH4 production.
There was no significant effect of soil water regime on N2Ofluxes. Although we did not evaluate tree species differences statis-tically, some notable differences were observed. While the beechstands did not differ, the emission of N2O under ash was twice ashigh in the upland soils as for the hydromorphic, whereas theopposite trend was observed for oak (Fig. 1C). The most conspicu-ous difference in regard to CH4 fluxes was the net emission of CH4
under oak for the hydromorphic soils compared to the highest re-corded CH4 uptake for the oak on upland soils (Fig. 1D). These re-sults potentially point to important tree species specific differencesin these different soil environments which deserve further atten-tion for following studies. However, as mentioned earlier our studydesign did not offer an opportunity to test for tree speciesdifferences.
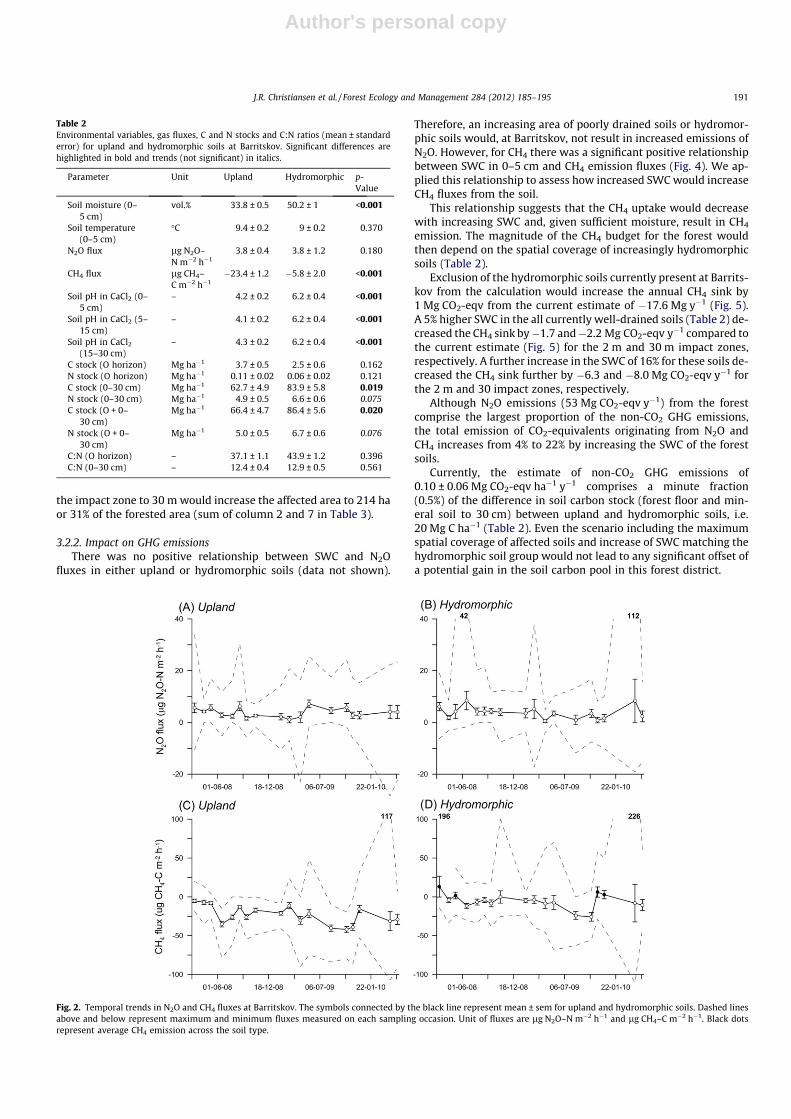
We did not observe any temporal trend in N2O fluxes in eitherupland or hydromorphic soils (Fig. 2A and B), however, there wasa tendency for higher maximum fluxes of N2O in the hydromorphicsoils (Fig. 2B).
3.1.2. Incubation studiesThe upland and hydromorphic soils did not differ significantly
in potential methane oxidation (mean ± standard error of themean(SE)) (5 ± 0.5 and 7 ± 2 ng CH4–C g dw�1 d�1, respectively)when incubated at atmospheric levels of CH4 (Fig. 3A). When incu-bated at 10,000 lL L�1 all soils showed higher CH4 oxidation ratesthan during incubation at ambient methane concentration. How-ever, the hydromorphic soils had a significantly (p < 0.001) higherCH4 oxidation potential (7.5 ± 2.9 lg CH4–C g dw�1 d�1) than up-land soils (0.05 ± 0.03 lg CH4–C g dw�1 d�1, Fig. 3B). Similarly, weobserved that the hydromorphic soils potentially produced signif-icantly (p < 0.001) more CH4 (0.001 ± 0.0003 lg CH4–C g dw�1 d�1),at least one order of magnitude, than the upland soils(0.00008 ± 0.00005 lg CH4–C g dw�1 d�1). Potential CH4 oxidationrates were in general markedly higher than CH4 production poten-tial (Fig. 3A–C).
No differences were observed in potential N2O production be-tween upland and hydromorphic soils (0.16 ± 0.02 and0.20 ± 0.03 lg N2O–N g dw�1 d�1, Fig. 3D) at Barritskov. However,our acetylene inhibition experiment for Barritskov indicated thatthe hydromorphic soils (0.35 ± 0.05 lg N2–N g dw�1 d�1) weremore efficient at reducing N2O to N2 than upland soils(0.05 ± 0.015 lg N2–N g dw�1 d�1, Fig. 3E). The potential N2O pro-duction rates at Strødam and Vestskoven were similar between up-land and hydromorphic soils as observed for Barritskov (Fig. 3D).Also, we found no significant difference in potential N2 productionbetween upland and hydromorphic soils, although the rate of N2
production was threefold higher for the hydromorphic soils atVestskoven (Fig. 3E).
3.1.3. Soil carbon and nitrogen stocks and pHHydromorphic soils had a significantly higher soil organic C stock
in 0–30 cm as well as a higher stock of C stock in the O-horizon plus
J.R. Christiansen et al. / Forest Ecology and Management 284 (2012) 185–195 189

Author's personal copy
0–30 cm (Fig. 1E); about 20 Mg ha�1 higher for the hydromorphicsoils compared to the upland soils (Table 3). There was also a trendtoward higher N stock in the hydromorphic soils, albeit not signifi-cant (Table 3, p = 0.075). Furthermore, the tree species showed thesame order in terms of C and N stocks in both upland and hydromor-phic soils, with ash having the highest and oak lowest stocks (Fig. 1Eand F). Thus, C:N ratios in the mineral soil and O-horizon were sim-ilar regardless of tree species (Fig. 1G and H) and soil moistureregime.
Mineral soil pH was significantly (p < 0.001) lower (4.2 ± 0.2) inthe upper 5 cm (Table 2) for the upland soils compared to thehydromorphic soils (6.2 ± 0.4). Consistently lower soil pH in upland
soils was also observed for the layers 5–15 cm (p < 0.001), 15–30 cm (p < 0.001) and 30–100 cm (data not shown).
3.2. Reduced drainage scenarios
3.2.1. Forested area affected by reduced drainageThe GIS analysis was used to determine the size of areas to be af-
fected and not affected by reduced drainage scenarios (Table 3). Thearea of soils with signs of permanent of temporary saturation(hydromorphic soils + till soils class A) was 190 ha or 28% of the for-ested area (Table 3). For the 2 m impact zones the area assessed tobe impacted by reduced drainage increased by 3 ha only. Increasing
Fig. 1. Mean values ± standard error of the mean for (A) soil water content (vol.%), (B) soil temperature (�C), (C) N2O flux (lg N2O–N m�2 h�1), (D) CH4 flux (lg CH4–C m�2 h�1), (E) soil carbon stock (Mg C ha�1), (F) soil nitrogen stock (Mg N ha�1), (G) mineral soil C/N ratio and (H) organic horizon CN ratio divided in the three investigatedtree species at Barritskov. Grey bars show data for upland soils and white bars for hydromorphic soils. For the C and N stocks bars are divided in the organic and mineral soilfraction down to 1 m depth. Values are given by tree species basis but p-values represent the overall difference between upland and hydromorphic soils.
190 J.R. Christiansen et al. / Forest Ecology and Management 284 (2012) 185–195
Author's personal copy
the impact zone to 30 m would increase the affected area to 214 haor 31% of the forested area (sum of column 2 and 7 in Table 3).
3.2.2. Impact on GHG emissionsThere was no positive relationship between SWC and N2O
fluxes in either upland or hydromorphic soils (data not shown).
Therefore, an increasing area of poorly drained soils or hydromor-phic soils would, at Barritskov, not result in increased emissions ofN2O. However, for CH4 there was a significant positive relationshipbetween SWC in 0–5 cm and CH4 emission fluxes (Fig. 4). We ap-plied this relationship to assess how increased SWC would increaseCH4 fluxes from the soil.
This relationship suggests that the CH4 uptake would decreasewith increasing SWC and, given sufficient moisture, result in CH4
emission. The magnitude of the CH4 budget for the forest wouldthen depend on the spatial coverage of increasingly hydromorphicsoils (Table 2).
Exclusion of the hydromorphic soils currently present at Barrits-kov from the calculation would increase the annual CH4 sink by1 Mg CO2-eqv from the current estimate of �17.6 Mg y�1 (Fig. 5).A 5% higher SWC in the all currently well-drained soils (Table 2) de-creased the CH4 sink by�1.7 and�2.2 Mg CO2-eqv y�1 compared tothe current estimate (Fig. 5) for the 2 m and 30 m impact zones,respectively. A further increase in the SWC of 16% for these soils de-creased the CH4 sink further by �6.3 and �8.0 Mg CO2-eqv y�1 forthe 2 m and 30 impact zones, respectively.
Although N2O emissions (53 Mg CO2-eqv y�1) from the forestcomprise the largest proportion of the non-CO2 GHG emissions,the total emission of CO2-equivalents originating from N2O andCH4 increases from 4% to 22% by increasing the SWC of the forestsoils.
Currently, the estimate of non-CO2 GHG emissions of0.10 ± 0.06 Mg CO2-eqv ha�1 y�1 comprises a minute fraction(0.5%) of the difference in soil carbon stock (forest floor and min-eral soil to 30 cm) between upland and hydromorphic soils, i.e.20 Mg C ha�1 (Table 2). Even the scenario including the maximumspatial coverage of affected soils and increase of SWC matching thehydromorphic soil group would not lead to any significant offset ofa potential gain in the soil carbon pool in this forest district.
Fig. 2. Temporal trends in N2O and CH4 fluxes at Barritskov. The symbols connected by the black line represent mean ± sem for upland and hydromorphic soils. Dashed linesabove and below represent maximum and minimum fluxes measured on each sampling occasion. Unit of fluxes are lg N2O–N m�2 h�1 and lg CH4–C m�2 h�1. Black dotsrepresent average CH4 emission across the soil type.
Table 2Environmental variables, gas fluxes, C and N stocks and C:N ratios (mean ± standarderror) for upland and hydromorphic soils at Barritskov. Significant differences arehighlighted in bold and trends (not significant) in italics.
Parameter Unit Upland Hydromorphic p-Value
Soil moisture (0–5 cm)
vol.% 33.8 ± 0.5 50.2 ± 1 <0.001
Soil temperature(0–5 cm)
�C 9.4 ± 0.2 9 ± 0.2 0.370
N2O flux lg N2O–N m�2 h�1
3.8 ± 0.4 3.8 ± 1.2 0.180
CH4 flux lg CH4–C m�2 h�1
�23.4 ± 1.2 �5.8 ± 2.0 <0.001
Soil pH in CaCl2 (0–5 cm)
– 4.2 ± 0.2 6.2 ± 0.4 <0.001
Soil pH in CaCl2 (5–15 cm)
– 4.1 ± 0.2 6.2 ± 0.4 <0.001
Soil pH in CaCl2
(15–30 cm)– 4.3 ± 0.2 6.2 ± 0.4 <0.001
C stock (O horizon) Mg ha�1 3.7 ± 0.5 2.5 ± 0.6 0.162N stock (O horizon) Mg ha�1 0.11 ± 0.02 0.06 ± 0.02 0.121C stock (0–30 cm) Mg ha�1 62.7 ± 4.9 83.9 ± 5.8 0.019N stock (0–30 cm) Mg ha�1 4.9 ± 0.5 6.6 ± 0.6 0.075C stock (O + 0–
30 cm)Mg ha�1 66.4 ± 4.7 86.4 ± 5.6 0.020
N stock (O + 0–30 cm)
Mg ha�1 5.0 ± 0.5 6.7 ± 0.6 0.076
C:N (O horizon) – 37.1 ± 1.1 43.9 ± 1.2 0.396C:N (0–30 cm) – 12.4 ± 0.4 12.9 ± 0.5 0.561
J.R. Christiansen et al. / Forest Ecology and Management 284 (2012) 185–195 191

Author's personal copy
4. Discussion
4.1. Upland versus hydromorphic soils
The significantly higher SWC of the hydromorphic soils agreeswith our expectations when we designed the study setup withthe GIS analysis. The temporal variations of SWC in the uplandand hydromorphic soils were similar but availability of water inthe landscape depressions systematically increased the wetnessof the soil. The similar temporal variation and magnitude of soiltemperatures also point to the same microclimatic conditions inthe hydromorphic and upland soils.
4.1.1. N2O fluxesSurprisingly, the mean N2O fluxes were similar for both the
hydromorphic and upland soils (3.8 lg N2O–N m�2 h�1) at Barrits-
kov (Fig. 1A and B), and in addition the potential rates were similar(Fig. 3D). Previously, we found considerably higher N2O emissions(8–15 lg N2O–N m�2 h�1) at the Strødam site at soil moisture lev-els corresponding to those in the hydromorphic soils at Barritskov(Christiansen et al., 2012). However, Beier et al. (2001) also did notdetect differences between the upland and wetter soils in another
Fig. 3. Comparison of mean ± standard error potential rates of (A) CH4 oxidation at a starting concentration of 2 lL L�1, (B) CH4 oxidation at a starting concentration of10,000 lL L�1, (C) CH4 production, (D) N2O production and (E) indirect measure of N2 production for Barritskov and the Strødam/Vestskoven locations. Rates are in lg CH4–C g dw�1 d�1 or lg N2O/N2–N g dw�1 d�1. Data for Barritskov are given by tree species but p-values represent the overall difference between upland and hydromorphic soilsat this site only. Bars represent standard error of the mean. Note the differences in units on y-axis for (A–C).
Table 3Areal coverage of hydromorphic and upland till soils in% of total forest area (348 ha)at Barritskov. The upland soils are further divided in classes (A) temporary saturationand (B) well-drained. It was assumed that the entire area of soils belonging to class Awas affected if ditching terminated whereas for class B only an impact zonesurrounding the ditches was affected. Columns 4–7 represent the GIS analysis used todetermine the area of class B till soils affected by two impact zone widths, e.g. 2 and30 m.
Hydromorphicsoils
Till soils (currentdrainage status)
Class B 2 m impactzone
Class B 30 mimpact zone
Class Atemporarysaturation
Class Bwelldrained
Notaffectedbyditching
Affectedbyditching
Notaffectedbyditching
Affectedbyditching
7 48 45 44 1 31 14
Fig. 4. Relationship between mean soil water content (vol.%) and mean CH4 fluxes(lg CH4–C m�2 h�1) based on the time series for upland and hydromorphic soils.
192 J.R. Christiansen et al. / Forest Ecology and Management 284 (2012) 185–195

Author's personal copy
Danish beech forest with a comparable glacial till soil (mean ratesof 5.7 lg N2O–N m�2 h�1).
Both soil types at Barritskov had mineral soil C:N ratios of 12–13 which are favourable for N2O emissions (Pilegaard et al., 2006).Higher emission rates could thereby be expected especially whencombined with an optimal SWC of �60% water filled pore space(Davidson et al., 2000). Low N2O emissions from the hydromorphicsoils may, however, be explained by the high soil pH in hydromor-phic soils. At pH > 6 (Table 2), the produced N2O is reduced to N2 bynitrous oxide reductase (Simek and Cooper, 2002) as is also indi-cated by the similar or higher potential N2 emissions (Fig. 3E) com-pared to the potential N2O emissions (Fig. 3D) from thehydromorphic Barritskov soils.
At lower pH nitrous oxide reductase is inhibited and the ratio ofN2O/N2 from denitrification increases (Weslien et al., 2009).Accordingly, the denitrification product was dominated by N2Oin all upland soils with lower pH than hydromorphic soils(Fig. 3D and E). For the Strødam soils (lowest pH) the potentialrates were more dominated by N2O in both upland and hydromor-phic soils than for Barritskov and Vestskoven soils (Fig. 3D and E),which is in line with the higher N2O emissions observed in the fieldat Strødam.
4.1.2. CH4 fluxesThe CH4 fluxes for the upland soils were lower, but in the same
range as recently published fluxes for upland European forest soils(mean ± SE: �46 ± 20 lg CH4–C m�2 h�1; Skiba et al., 2009). Thesimilarities in temporal variation of CH4 fluxes (Fig. 2) indicate thatthe differences between upland and hydromorphic soils are mainlydriven by differences in the magnitude of SWC. Soil water slowsdown diffusion of atmospheric CH4 in the soil matrix and the up-take of atmospheric CH4 is reduced compared to a well-drainedsoil.
Soils from Barritskov oxidised CH4 under ambient concentra-tion levels in the laboratory (Fig. 3A). This suggests that Type IIor high-affinity CH4 oxidising bacteria were present (Hanson andHanson, 1996). During incubation SWC of the upland andhydromorphic soil samples were adjusted by pre-drying to obtainsimilar physical conditions in the soil, e.g. for diffusion. Accord-ingly, the high-affinity CH4 oxidation between hydromorphicand upland soils (Fig. 3C and D) were similar, which supportsour conclusion that the higher SWC under field conditions causedthe lower oxidation rates of CH4 in the hydromorphic soils(Fig. 2D). Compared to previous studies of high-affinity CH4 oxida-tion our rates were lower. Menyailo et al. (2008) found up to 10times higher rates in Siberian forest soils, and high-affinity CH4
oxidation rates in soils under sessile oak (Quercus petraea) in theGisburn Experimental Forest in the UK were on average six timeshigher (Reay et al., 2005). Similar high rates were found for soilsunder beech in Germany (Degelmann et al., 2010).
The much higher low-affinity CH4 oxidation rates (Fig. 3B)measured at 5000 times ambient CH4 concentration level for bothupland and hydromorphic soils are in accordance with other stud-ies (Reay et al., 2005). By incubating the soil samples at10,000 lL L�1 CH4 we solely target low-affinity methanotrophsthriving under conditions with elevated CH4 concentrations, asthey are the only active methane oxidisers at concentrations above2500 lL L�1 (Bender and Conrad, 1992, 1995). Thus, low-affinitymethanotrophs are present in both soil types, but more abundantin hydromorphic soils which fits well with the significantly higherCH4 production rate in hydromorphic compared to upland soils.Even under optimal conditions for CH4 production there is notmuch evidence to support that the upland soils produce CH4. Only17 out of 370 CH4 flux measurements showed positive fluxes, alloccurring during the early spring or winter when SWC was high.For the hydromorphic soils 63 out of 262 measurements showedCH4 emission. Thus, our laboratory incubation studies and fielddata comply.
4.1.3. Carbon stocksThe total C stock in forest floor and mineral soil to 30 cm for the
whole forest district based on upland soil C contents only amountsto only 23.1 Gg C. Inclusion of the hydromorphic soils in the assess-ment increases the total C stock to 23.6 Gg C, or by only 2%.Although the hydromorphic soils have significantly higher C con-tents than upland soils their limited spatial coverage reduces theirinfluence on soil C stock at the forest (district) level.
Carbon stocks in mineral soil (to 30 cm) for upland soils were ofthe same order of magnitude as the ca. 55 Mg C ha�1 reported forthe upper 40 cm in Danish well-drained Alfisols by Vejre et al.(2003), but the C stocks in hydromorphic soils were clearly higher.Reduced oxygen availability hampering decomposition is believedto be the main factor responsible for the higher C stocks in hydro-morphic soils. In a study of Danish soil databases, Krogh et al.(2003) attributed their higher average forest soil C stock to 1 m(167 Mg ha�1) compared to the 125 Mg ha�1 reported by Vejreet al. (2003) to the fact that their database also included poorlydrained soils. Forest floor C stocks were quite similar between soilmoisture regimes and corresponded well to the stock of approx.5 Mg ha�1 reported by Vejre et al. (2003).
The difference in C stock between moisture regimes may be inter-preted as the potential C sequestration following reduced drainage.Based on this inference and an assumption of 50–100 years neededfor SOC stocks to reach a new steady state level, the rate of Csequestration would amount to 0.7–1.5 Mg CO2 ha�1 yr�1. This rateof soil C sequestration is within the range reported for, e.g. land-usechange from cropland to forest (Poeplau et al., 2011; Vesterdal et al.,2007), but higher than rates reported from forest soil inventories(e.g. Berg et al., 2009). Decreased CH4 oxidation resulting from
Fig. 5. Scenario analyses of the net CH4 budget for the entire forest at Barritskov inMg CO2-equivalents (eqv) y�1 ± standard error of the mean. Scenarios are (a) nohydromorphic soils, (b) the current situation and four scenarios (c–f) representingtwo different increases in soil water content paired with two different impact zonesscenarios around ditches in well-drained soils. Dashed lines represent theestimated mean value of the scenario and the bar-width represents the standarderror of the estimate.
J.R. Christiansen et al. / Forest Ecology and Management 284 (2012) 185–195 193

Author's personal copy
reduced ditching would offset the potential C sequestration by5–23 kg CO2 ha�1 y�1 or 0.7–3% in the upland soils assuming50–100 years to steady state in soil C as mentioned above.
4.2. The importance of hydromorphic soils
The preliminary GIS analysis of the soil types at Barritskovshowed that the hydromorphic soils occupied only 7% of the entireforested area of 348 ha, however, we deliberately chose to over-represent these soil types in the final selection of study sites inorder to establish a better data basis to compare upland and hydro-morphic soils. We based our mapping on the national geologicalsurvey of the general soil types, but this classification is relativelycoarse and it has been shown earlier that even relatively smallareas (5–10%) of the catchment can have a large impact on GHGbudgets. Thus, it is likely we slightly underestimated the spatialcoverage of hydromorphic soils.
The GIS analysis showed that in a worse case scenario we canexpect a decrease in the CH4 oxidation in the soil at the forest dis-trict level at Barritskov (Fig. 5) equivalent to 8 Mg CO2 y�1 or23 kg CO2 ha�1 y�1 by making the upland soils wetter. Currently,even a cautious estimate of non-CO2 GHG emissions (N2O + CH4)from the entire forest at Barritskov (36 ± 22 Mg CO2-eqv y�1 or104 ± 31 kg CO2-eqv ha�1 y�1) comprises a minute fraction (0.5%y�1) of the difference in soil C stock between upland andhydromorphic soils.
If the upland soils that become wet in the reduced drainagescenario were to increase the C content at a rate similar to theestimated equivalent change in non-CO2 flux it would take200 years to reach the C content of the hydromorphic soils. Thus,if the soil C reaches this level before 200 years, reduced drainagewill have an overall positive effect on the soil GHG balance.However, if the build-up takes in excess of 200 years itcannot fully off-set the non-CO2 emission change in this forestdistrict.
Even for the scenario including the maximum spatial coverageof affected soils and an increase of SWC matching the hydromor-phic soil type the total emissions of 44 ± 25 Mg CO2-eqv y�1 or124 ± 37 kg CO2-eqv ha�1 y�1 will not lead to any significant offsetof the difference in soil carbon pools.
The results of this study suggest that the global warming poten-tial from soil emissions will increase by an increasing proportion ofhydromorphic soils, but not to such a degree that it can offset theentire C sink in vegetation and soil for this type of forest. On theother hand, the practice of ditching has most likely facilitated anincrease in the CH4 sink of the forest and a termination of this prac-tice by filling up or ceasing maintenance of ditches will increasethe areas of wet soils in the future.
Our results indicate that increased wetness in these upland soilswould decrease the oxidation rate of atmospheric CH4 rather thaninduce net emission of CH4 (Figs. 3 and 4). It is likely that thehydromorphic soils will exhibit enhanced CH4 emissions underwetter soil conditions, but the results do not indicate that thesesoils would become overall net emitters of CH4.
An unknown in our assessment of the area affected by reducedditching is the lateral drainage effect of ditches. We used theSkaggs method originally developed to assess the lateral impactzone of ditches in peat soils (Skaggs et al., 2005). The calculationrequires the lateral hydraulic conductivity which is seldom knownand hence we used the vertical conductivity for a similar soil type.Whether the minimal estimated impact zone of 2 m is underesti-mated remains unknown, however we did arbitrarily set a maxi-mum lateral impact zone of 30 m which we assume covered theextremes of the lateral impact in these soil types.
5. Conclusions
We studied the importance of hydromorphic soils on the GHGbudgets and dynamics of CH4 and N2O as well as soil C and N stocksat the forest district level in a typical Danish deciduous forest.Hydromorphic soils had significantly higher soil water content,higher soil pH, higher soil organic C pool in the top 30 cm, lowerfield scale CH4 uptake, higher CH4 production potential and largerproportion of N2O reduced to N2 in comparison to upland soils.However, field N2O fluxes and rates of potential N2O productionwere similar in hydromorphic and upland soils in this forest. Theempirical evidence compiled in this study suggests that hydromor-phic soils are indeed capable of producing more CH4 than uplandsoils as observed in the laboratory. This may also be the case forN2O, but the difference in observed field and laboratory emissionswas not significant. On the other hand the hydromorphic soils alsodisplayed characteristics that offset the enhanced production ofN2O and CH4, such as the observed rates of low-affinity CH4 oxida-tion capable of oxidising large quantities of CH4. Also, the signifi-cantly higher reduction potential of N2O to N2 suggests that thehydromorphic soils are capable of limiting the net emission ofN2O. Our results indicated tree species specific effects on theGHG exchange that deserve further studies to identify possiblemitigation options through tree species choice in managed forests.
Our analysis of the impact of reduced ditching showed that theCH4 sink decreased due to expected increased soil water content.In this specific study we conclude that the hydromorphic soilsare hotspots of CH4 production and oxidation but not for N2O. Inthat the area covered by hydromorphic soils is limited at Barritskovimplies that the upland soils within this forest are most importantfor the soil C stock as well as the non-CO2 GHG budget. However,our analyses also suggest that increased wetness in upland forestsoils, e.g. due to ceased drainage activities, can impose an impacton the GHG budget by increasing the likelihood of CH4 emissionsand reducing soil CH4 uptake.
Future research focusing on a spatial prediction of where hydro-morphic soils naturally exist in forests and the extent to which thehydrological regime of these soils can be expected to move towarda hydromorphic state if drainage practices stop or precipitation in-creases is important to improve our estimates of GHG budgetsfrom forests.
Acknowledgements
We are very grateful for the support and fieldwork carried outby Trine Møller Kopp at Barritskov. Also, we would like to extendour gratitude to Thomas Harttung, owner of Barritskov, for grant-ing us unlimited access to forests during this study. We also thankLone Nørgaard Telling at Barritskov for support. The work pre-sented in this paper was part of the project ‘‘Målrettet NaturnærSkovdrift og Hydrologi som optimeringsredskaber for C-indhold ivedmasse og skovjord’’ in collaboration with Green Carbon Initia-tive c/o Barritskov Land- og Skovbrug Skovbrug supported by TheDanish Nature Agency. We thank the two anonymous reviewerswho provided constructive criticism that helped improve the pa-per. Also a thank you to Andy Howe for help with correcting thelanguage in the manuscript.
Appendix A. Supplementary material
Supplementary data associated with this article can be found, inthe online version, at http://dx.doi.org/10.1016/j.foreco.2012.07.048.
194 J.R. Christiansen et al. / Forest Ecology and Management 284 (2012) 185–195

Author's personal copy
References
Beier, C., Rasmussen, L., Pilegaard, K., Ambus, P., Mikkelsen, T., Jensen, N.O., Kjøller,A., Prieme, A., Ladekarl, U.L., 2001. Fluxes of NO�3 , NHþ4 , NO, NO2 and N2O in anold Danish beech forest. Water, Air, Soil Pollut.: Focus 1, 187–195.
Bekku, Y., Koizumi, H., Nakadai, T., Iwaki, H., 1995. Measurement of soil respirationusing closed-chamber method – an Irga technique. Ecol. Res. 10, 369–373.
Bender, M., Conrad, R., 1992. Kinetics of CH4 oxidation in oxic soils exposed toambient air or high CH4 mixing ratios. FEMS Microbiol. Ecol. 101, 261–270.
Bender, M., Conrad, R., 1995. Effect of CH4 concentrations and soil conditions on theinduction of CH4 oxidation activity. Soil Biol. Biochem. 27, 1517–1527.
Berg, B., Johansson, M.-B., Nilsson, Å., Gundersen, P., Norell, L., 2009. Sequestrationof carbon in the humus layer of Swedish forests – direct measurements. Can. J.For. Res. 39, 962–975.
Boeckx, P., Van Cleemput, O., 2001. Estimates of N2O and CH4 fluxes fromagricultural lands in various regions in Europe. Nutr. Cycl. Agroecosyst. 60,35–47.
Christensen, J.H., Hewitson, B., Busuioc, A., Chen, A., Gao, X., Held, I., Jones, R., Kolli,R.K., Kwon, K.-T., Laprice, R., Magaña Rueda, V., Mearns, L., Menéndez, C.G.,Räisänen, J., Rinke, A., Sarr, A., Whetton, P., 2007. Regional climate projections.In: Solomon, S., Qin, D., Manning, M., Chen, Z., Marquis, M., Averyt, K.B., Tignor,M., Miller, H.L. (Eds.), Climate Change 2007: The Physical Science Basis.Contribution of Working Group I to the Fourth Assessment Report of theIntergovernmental Panel on Climate Change. Cambridge University Press,Cambridge.
Christiansen, J.R., Vesterdal, L., Gundersen, P., 2012. Nitrous oxide and methaneexchange in two small temperate forest catchments-effects of hydrologicalgradients and implications for global warming potentials of forest soils.Biogeochemistry 107, 437–454.
Danish Meteorological Institute, 2000. Klimagrid – Danmark. Normaler 1961–90.Måneds-og årsværdier. Technical Report 00-11. Danish MeteorologicalInstitute, Copenhagen, pp. 1–17.
Davidson, E.A., Keller, M., Erickson, H.E., Verchot, L.V., Veldkamp, E., 2000. Testing aconceptual model of soil emissions of nitrous and nitric oxides. Bioscience 50,667–680.
Degelmann, D.M., Borken, W., Drake, H.L., Kolb, S., 2010. Different atmosphericmethane-oxidizing communities in European beech and Norway spruce soils.Appl. Environ. Microbiol. 76, 3228–3235.
Fiedler, S., Holl, B.S., Jungkunst, H.F., 2005. Methane budget of a Black Forest spruceecosystem considering soil pattern. Biogeochemistry 76, 1–20.
Forster, P., Ramaswamy, V., Artaxo, P., Berntsen, T., Betts, R., Fahey, D.W., Haywood,J., Lean, J., Lowe, D.C., Myhre, G., Nganga, J., Prinn, R., Raga, G., Schulz, M., vanDorland, R., 2007. Changes in atmospheric constituents and in radiative forcing.In: Solomon, S., Qin, D., Manning, M., Chen, Z., Marquis, M., Averyt, K.B., Tignor,M., Miller, H.L. (Eds.), Climate Change 2007: The Physical Science Basis.Contribution of Working Group I to the Fourth Assessment Report of theIntergovernmental Panel on Climate Change. Cambridge University Press,Cambridge.
Geological Survey of Denmark and Greenland, 2008. Digital National Soil Map,1:25,000. Danish Ministry of the Environment, Copenhagen, Denmark.
Goodale, C.L., Apps, M.J., Birdsey, R.A., Field, C.B., Heath, L.S., Houghton, R.A., Jenkins,J.C., Kohlmaier, G.H., Kurz, W., Liu, S.R., Nabuurs, G.J., Nilsson, S., Shvidenko, A.Z.,2002. Forest carbon sinks in the Northern Hemisphere. Ecol. Appl. 12, 891–899.
Grunwald, D., Fender, A.-C., Erasmi, S., Jungkunst, H.F., 2012. Towards improvedbottom-up inventories of methane from the European land surface. Atmos.Environ. 51, 203–211.
Gulledge, J., Schimel, J.P., 1998. Moisture control over atmospheric CH4
consumption and CO2 production in diverse Alaskan soils. Soil Biol. Biochem.30, 1127–1132.
Gundersen, P., Sevel, L., Christiansen, J.R., Vesterdal, L., Hansen, K., Bastrup-Birk, A.,2009. Do indicators of nitrogen retention and leaching differ betweenconiferous and broadleaved forests in Denmark? For. Ecol. Manage. 258,1137–1146.
Gundersen, P., Lauren, A., Finer, L., Ring, E., Koivusalo, H., Saetersdal, M., Weslien, J.-O., Sigurdsson, B.D., Högbom, L., Laine, J., Hansen, K., 2010. Environmentalservices provided from riparian forests in the Nordic countries. AMBIO 39, 555–566.
Gundersen, P., Christiansen, J.R., Alberti, G., Brüggemann, N., Castaldi, S., Gasche, R.,Kitzler, B., Klemedtsson, L., Lobo-do-Vale, R., Moldan, F., Rütting, T., Schleppi, P.,Weslien, P., Zechmeister-Boltenstern, S., 2012. The greenhouse gas exchangeresponses of methane and nitrous oxide to forest change in Europe. Biogeosci.Discuss. 9, 6129–6168.
Hanson, R.S., Hanson, T.E., 1996. Methanotrophic bacteria. Microbiol. Rev. 60, 439–471.
Jellesen, T., Jensen, J.K., Simonson, R., Skøtt, T., 2001. Lokalitetskortlægning afBarritskov ved Vejle Fjord. The Royal Veterinary and Agricultural University,Copenhagen, Denmark, pp. 1–28.
Jungkunst, H.F., Fiedler, S., 2005. Geomorphology – key regulator of net methaneand nitrous oxide fluxes from the pedosphere. Z. Geomorphol. 49, 529–543.
Jungkunst, H.F., Fiedler, S., 2007. Latitudinal differentiated water table control ofcarbon dioxide, methane and nitrous oxide fluxes from hydromorphic soils:feedbacks to climate change. Global Change Biol. 13, 2668–2683.
Krogh, L., Nørgaard, A., Hermansen, M., Greve, M.H., Balstrøm, T., Breuning-Madsen,H., 2003. Preliminary estimates of contemporary soil organic carbon stocks inDenmark using multiple datasets and four scaling-up modes. Agric. Ecosyst.Environ. 96, 19–28.
National Survey and Cadastre, 2012. <http://kmswww3.kms.dk/kortpaanettet/dkfoerognu.htm>. Accessed 1 February 2012.
Menyailo, O.V., Hungate, B.A., Abraham, W.R., Conrad, R., 2008. Changing land usereduces soil CH4 uptake by altering biomass and activity but not composition ofhigh-affinity methanotrophs. Global Change Biol 14, 2405–2419.
Peters, G.P., Marland, G., Le Quéré, C., Boden, T., Canadell, J.G., Raupach, M.R., 2012.Rapid growth in CO2 emissions after the 2008–2009 global financial crisis. Nat.Clim. Change 2, 2–4.
Pilegaard, K., Skiba, U., Ambus, P., Beier, C., Bruggemann, N., Butterbach-Bahl, K.,Dick, J., Dorsey, J., Duyzer, J., Gallagher, M., Gasche, R., Horvath, L., Kitzler, B.,Leip, A., Pihlatie, M.K., Rosenkranz, P., Seufert, G., Vesala, T., Westrate, H.,Zechmeister-Boltenstern, S., 2006. Factors controlling regional differences inforest soil emission of nitrogen oxides (NO and N2O). Biogeosciences 3, 651–661.
Poeplau, C., Don, A., Vesterdal, L., Leifeld, J., Van Wesemael, B., Schumacher, J., 2011.Temporal dynamics of soil organic carbon after land-use change in thetemperate zone – carbon response functions as a model approach. GlobalChange Biol 17, 2415–2427.
Reay, D.S., Nedwell, D.B., McNamara, N., Ineson, P., 2005. Effect of tree species onmethane and ammonium oxidation capacity in forest soils. Soil Biol. Biochem37, 719–730.
Schulze, E.D., Ciais, P., Luyssaert, S., Schrumpf, M., Janssens, I.A., Thiruchittampalam,B., Theloke, J., Saurat, M., Bringezu, S., Lelieveld, J., Lohila, A., Rebmann, C., Jung,M., Bastviken, D., Abril, G., Grassi, G., Leip, A., Freibauer, A., Kutsch, W., Don, A.,Nieschulze, J., Borner, A., Gash, J.H., Dolman, A.J., 2010. The European carbonbalance. Part 4: integration of carbon and other trace-gas fluxes. Global ChangeBiol 16, 1451–1469.
Simek, M., Cooper, J.E., 2002. The influence of soil pH on denitrification: progresstowards the understanding of this interaction over the last 50 years. Eur. J. SoilSci. 53, 345–354.
Skaggs, R.W., Chescheir, G.M., Phillips, B.D., 2005. Methods to determine lateraleffect of a drainage ditch on wetland hydrology. Trans. ASAE 48, 577–584.
Skiba, U., Drewer, J., Tang, Y.S., van Dijk, N., Helfter, C., Nemitz, E., Famulari, D., Cape,J.N., Jones, S.K., Twigg, M., Pihlatie, M., Vesala, T., Larsen, K.S., Carter, M.S.,Ambus, P., Ibrom, A., Beier, C., Hensen, A., Frumau, A., Erisman, J.W.,Bruggemann, N., Gasche, R., Butterbach-Bahl, K., Neftel, A., Spirig, C., Horvath,L., Freibauer, A., Cellier, P., Laville, P., Loubet, B., Magliulo, E., Bertolini, T.,Seufert, G., Andersson, M., Manca, G., Laurila, T., Aurela, M., Lohila, A.,Zechmeister-Boltenstern, S., Kitzler, B., Schaufler, G., Siemens, J., Kindler, R.,Flechard, C., Sutton, M.A., 2009. Biosphere–atmosphere exchange of reactivenitrogen and greenhouse gases at the NitroEurope core flux measurement sites:measurement strategy and first data sets. Agric. Ecosyst. Environ. 133, 139–149.
Soil Survey Staff, 1998. Keys to soil taxonomy, eighth ed. Pocahontas Press, Inc.,Blacksberg, Virginia, USA.
Stanturf, J.A., Madsen, P., 2002. Restoration concepts for temperate and borealforests of North America and Western Europe. Plant Biosyst. 136, 143–158.
Vejre, H., Callesen, I., Vesterdal, L., Raulund-Rasmussen, K., 2003. Carbon andnitrogen in Danish forest soils – contents and distribution determined by soilorder. Soil Sci. Soc. Am. J. 67, 335–343.
Vesterdal, L., Rosenqvist, L., van der Salm, C., Hansen, K., Groenenberg, B.-J.,Johansson, M.-B., 2007. Carbon sequestration in soil and biomass followingafforestation: experiences from oak and Norway spruce chronosequences inDenmark, Sweden and the Netherlands. In: Heil, G., Muys, B., Hansen, K. (Eds.),Effects of Afforestation in North-Western Europe – From Field Observations toDecision Support: Plant and Vegetation, vol. 1. Springer, pp. 19–52.
Von Arnold, K., Nilsson, M., Hånell, B., Weslien, P., Klemedtsson, L., 2005a. Fluxes ofCO2, CH4 and N2O from drained organic soils in deciduous forests. Soil Biol.Biochem. 37, 1059–1071.
Von Arnold, K., Weslien, P., Nilsson, M., Svensson, B.H., Klemedtsson, L., 2005b.Fluxes of CO2, CH4 and N2O from drained coniferous forests on organic soils. For.Ecol. Manage. 210, 239–254.
Wagner, D., Lipsky, A., Embacher, A., 2007. Methane fluxes in permafrost habitats ofthe Lena Delta: effects of microbial community structure and organic matterquality. Environ. Microbiol. 7, 1582–1592.
Weslien, P., Klemedtsson, A.K., Borjesson, G., Klemedtsson, L., 2009. Strong pHinfluence on N2O and CH4 fluxes from forested organic soils. Eur. J. Soil Sci. 60,311–320.
Westman, C.J., 1995. A simple device for sampling of volumetric forest soil cores.Silva Fennica 29, 247–251.
Yoshinari, T., Hynes, R., Knowles, R., 1977. Acetylene inhibition of nitrous-oxidereduction and measurement of denitrification and nitrogen-fixation in soil. SoilBiol. Biochem. 9, 177–183.
J.R. Christiansen et al. / Forest Ecology and Management 284 (2012) 185–195 195