Simulated geologic carbon storage leak reduces bacterial richness and alters bacterial community...
11
Simulated geologic carbon storage leak reduces bacterial richness and alters bacterial community composition in surface soil Sergio E. Morales a, b, * , William E. Holben b, c a Department of Microbiology and Immunology, Otago School of Medical Sciences, University of Otago, Dunedin, New Zealand b Cellular, Molecular and Microbial Biology Program, Division of Biological Sciences, The University of Montana, Missoula, MT, USA c Systems Ecology Program, Division of Biological Sciences, The University of Montana, Missoula, MT, USA article info Article history: Received 6 February 2014 Received in revised form 7 May 2014 Accepted 12 May 2014 Available online 3 June 2014 Keywords: 16S rRNA Carbon capture and sequestration Functional genes Quantitative PCR RNA Elevated CO 2 abstract Geologic carbon dioxide (CO 2 ) storage is being explored as a method for the long-term storage of CO 2 , but we lack information regarding the effects of accidental release of stored gas on near surface soil com- munities. Understanding microbial community response is particularly critical given microbes mediate many key geochemical processes essential for sustaining life. Here, we use a simulated underground storage site leak and pyrosequencing analysis of 16S rRNA genes to examine the effects of elevated CO 2 on microbial community richness and composition. Results demonstrate a decrease in bacterial richness, and shifts in bacterial community composition in response to CO 2 . These shifts in composition were correlated to specific geochemical processes by quantifying changes in functional gene and transcript abundance. Results suggest a link between community shifts and functional response to CO 2 . © 2014 Elsevier Ltd. All rights reserved. 1. Introduction Microorganisms are the engines of many biogeochemical and ecosystem processes, but as an unseen majority their response to environmental stressors is not always accounted for (Van Der Heijden et al., 2008). Understanding how soil microbial commu- nities respond to carbon dioxide (CO 2 ) releases from underground geologic storage sites is part of the ongoing assessment of carbon capture and storage (CCS) strategies as a viable form of CO 2 miti- gation. CCS, also referred to as geologic carbon storage or seques- tration, is the process of injecting gaseous or supercritical CO 2 deep underground (>1 km) into porous sedimentary formations in nat- ural sites such as deep geological cavities, saline aquifers, spent oil or gas fields, coal mines or on the ocean floor (White et al., 2003; IPCC, 2005; Mikkelsen et al., 2010). Each storage site would even- tually hold millions of tons of CO 2 which over time might find suitable pathways to escape and reach surface soils or the atmosphere (IPCC, 2005). It is known that catastrophic releases of large CO 2 plumes can lead to large die-offs of plant communities (Farrar et al., 1995, 1999), but the effect of less dramatic, yet continuous, low level leaks is less well understood. Studies using simulated release (leaks) sites have found strong effects on plant communities, with as little as 4e8% CO 2 by volume needed to stress vegetation (Stenhouse et al., 2009; West et al., 2009; Male et al., 2010). A 19-week (May to September 2006) low-level gas release was enough to alter plant coverage and shift dominant species. Although a significant drop in bacterial numbers in areas of high CO 2 concentration was reported (West et al., 2009), monitoring of shifts in soil microbial community composition was not performed in that study. Work by our group demonstrated that a simulated underground CO 2 leak affected both functional gene and transcript abundance for carbon and nitrogen cycling genes, although no consistent universal pattern of suppression or enhancement was identified (Morales and Holben, 2013). CO 2 - exposed soils could be distinguished from non-exposed soils in that study, but the work did not provide information regarding the ef- fect CO 2 had on microbial richness or composition. This information may be of significant interest when considering that, for plant communities, it has been shown that both species composition and functional group diversity respond to elevated CO 2 (Reich et al., * Corresponding author. Department of Microbiology and Immunology, Otago School of Medical Sciences, University of Otago, Dunedin, New Zealand. Tel.: þ64 3 479 3140; fax: þ64 3 479 8540. E-mail address: [email protected] (S.E. Morales). Contents lists available at ScienceDirect Soil Biology & Biochemistry journal homepage: www.elsevier.com/locate/soilbio http://dx.doi.org/10.1016/j.soilbio.2014.05.018 0038-0717/© 2014 Elsevier Ltd. All rights reserved. Soil Biology & Biochemistry 76 (2014) 286e296
-
Upload
independent -
Category
Documents
-
view
3 -
download
0
Transcript of Simulated geologic carbon storage leak reduces bacterial richness and alters bacterial community...
lable at ScienceDirect
Soil Biology & Biochemistry 76 (2014) 286e296
Contents lists avai
Soil Biology & Biochemistry
journal homepage: www.elsevier .com/locate/soi lbio
Simulated geologic carbon storage leak reduces bacterial richnessand alters bacterial community composition in surface soil
Sergio E. Morales a, b, *, William E. Holben b, c
a Department of Microbiology and Immunology, Otago School of Medical Sciences, University of Otago, Dunedin, New Zealandb Cellular, Molecular and Microbial Biology Program, Division of Biological Sciences, The University of Montana, Missoula, MT, USAc Systems Ecology Program, Division of Biological Sciences, The University of Montana, Missoula, MT, USA
a r t i c l e i n f o
Article history:Received 6 February 2014Received in revised form7 May 2014Accepted 12 May 2014Available online 3 June 2014
Keywords:16S rRNACarbon capture and sequestrationFunctional genesQuantitative PCRRNAElevated CO2
* Corresponding author. Department of MicrobiolSchool of Medical Sciences, University of Otago, Dune479 3140; fax: þ64 3 479 8540.
E-mail address: [email protected] (S.E. M
http://dx.doi.org/10.1016/j.soilbio.2014.05.0180038-0717/© 2014 Elsevier Ltd. All rights reserved.
a b s t r a c t
Geologic carbon dioxide (CO2) storage is being explored as a method for the long-term storage of CO2, butwe lack information regarding the effects of accidental release of stored gas on near surface soil com-munities. Understanding microbial community response is particularly critical given microbes mediatemany key geochemical processes essential for sustaining life. Here, we use a simulated undergroundstorage site leak and pyrosequencing analysis of 16S rRNA genes to examine the effects of elevated CO2
on microbial community richness and composition. Results demonstrate a decrease in bacterial richness,and shifts in bacterial community composition in response to CO2. These shifts in composition werecorrelated to specific geochemical processes by quantifying changes in functional gene and transcriptabundance. Results suggest a link between community shifts and functional response to CO2.
© 2014 Elsevier Ltd. All rights reserved.
1. Introduction
Microorganisms are the engines of many biogeochemical andecosystem processes, but as an unseen majority their response toenvironmental stressors is not always accounted for (Van DerHeijden et al., 2008). Understanding how soil microbial commu-nities respond to carbon dioxide (CO2) releases from undergroundgeologic storage sites is part of the ongoing assessment of carboncapture and storage (CCS) strategies as a viable form of CO2 miti-gation. CCS, also referred to as geologic carbon storage or seques-tration, is the process of injecting gaseous or supercritical CO2 deepunderground (>1 km) into porous sedimentary formations in nat-ural sites such as deep geological cavities, saline aquifers, spent oilor gas fields, coal mines or on the ocean floor (White et al., 2003;IPCC, 2005; Mikkelsen et al., 2010). Each storage site would even-tually hold millions of tons of CO2 which over time might findsuitable pathways to escape and reach surface soils or the
ogy and Immunology, Otagodin, New Zealand. Tel.: þ64 3
orales).
atmosphere (IPCC, 2005). It is known that catastrophic releases oflarge CO2 plumes can lead to large die-offs of plant communities(Farrar et al., 1995, 1999), but the effect of less dramatic, yetcontinuous, low level leaks is less well understood.
Studies using simulated release (leaks) sites have found strongeffects on plant communities, with as little as 4e8% CO2 by volumeneeded to stress vegetation (Stenhouse et al., 2009; West et al.,2009; Male et al., 2010). A 19-week (May to September 2006)low-level gas release was enough to alter plant coverage and shiftdominant species. Although a significant drop in bacterial numbersin areas of high CO2 concentration was reported (West et al., 2009),monitoring of shifts in soil microbial community composition wasnot performed in that study. Work by our group demonstrated thata simulated underground CO2 leak affected both functional geneand transcript abundance for carbon and nitrogen cycling genes,although no consistent universal pattern of suppression orenhancement was identified (Morales and Holben, 2013). CO2-exposed soils could be distinguished fromnon-exposed soils in thatstudy, but the work did not provide information regarding the ef-fect CO2 had onmicrobial richness or composition. This informationmay be of significant interest when considering that, for plantcommunities, it has been shown that both species composition andfunctional group diversity respond to elevated CO2 (Reich et al.,
S.E. Morales, W.E. Holben / Soil Biology & Biochemistry 76 (2014) 286e296 287
2004). However, given the immense diversity of microorganisms insoils (Delmont et al., 2011), elevated CO2 might either directly affectspecies richness or trigger shifts in composition without anydiscernible effect on diversity.
Herewe use high throughput sequencing to assess the effect of asimulated geologic CO2 storage site leak on microbial diversity, andidentify potential links between microbial phylogenetic and func-tional response. Our objectives were to determine: (1) the effect ofCO2 seepage on bacterial communities in surface soils at thephylogenetic level (2) the effect of CO2 seepage on bacterial di-versity measures; and (3) any potential links between specificbacterial populations (based on 16S rRNA gene phylogeny) andfunctional groups (based on DNA and transcript abundance ofspecific carbon and nitrogen cycling genes). This third objective isnovel, as it puts us one step closer to linking identity (specificspecies) to function (guilds based on functional characteristics).Based on observations in plant response and prior microbialstudies, we hypothesized that: 1) as seen in plants, microbialrichness would decrease with CO2 exposure; and 2) the abundanceand structure of the microbial community will shift depending onboth treatment (CO2 exposure) and seasons.
2. Materials and methods
2.1. Study site, CO2 release and sample collection
The study site and CO2 release protocols have been previouslydescribed in detail elsewhere (Lewicki et al., 2007; Spangler et al.,2009). Briefly, the Zero Emission Research and Technology (ZERT)field site and shallow subsurface controlled release facility is anagricultural plot located at the Montana Agricultural ExperimentResearch Center, at Montana State University in BozemanMT. Threeprior separate releases had been performed in 2007 and 2008 inthis field site. From 9 to 18 July 2007 (Prior Release 1) and from 3 to10 August 2007 (Prior Release 2), 0.1 t CO2 day�1 and0.3 t CO2 day�1, respectively, were released. From 9 July to 7 August2008 (Prior Release 3) 0.3 t CO2 day�1 was released. For this study,underground release of CO2 was performed during a spring releaseJune 7e14, 2009 (hereafter release 1 [R1]) of 0.3 t CO2 day�1 and asummer release July 17eAugust 4, 2009 (release 2 [R2]) of0.4 t CO2 day�1. Themetagenomic nucleic acid samples used for thisstudy correspond to a subset of samples taken in a prior study(Morales and Holben, 2013). The original sample names have beenreplaced as follows: N1 (pre-release) from the prior study is nowR1-1, N11 (144 h after initiation of first CO2 release of the season) isnow R1-2, Y13 (recovery period between releases with no activeCO2 flow) is now R1-3, Y19 (18 h after initiation of second CO2release of the season) is now R2-1, Y22 (168 h after initiation ofsecond CO2 release of the season) is now R2-2, Y23 (504 h afterinitiation of second CO2 release of the season) is now R2-3. Allsamples, except R1-1 and R1-3, were taken while CO2 was activelyflowing through the site.
Samples were taken between June 6 and September 9, 2009(spanning the spring to late summer seasons) by collecting soilcores within a 30 � 30 cm plot throughout the sampling period.Each core consisted of the top 5 cm of soils (2 cm dia. � 5 cmdeep) with CO2-exposed samples collected directly above thehorizontal well, at adjacent points roughly in the center of Zone 2.A control sample was taken for each CO2-exposed sample from anadjacent plot approximately 75 m northeast of the experimentalsite using the same approach described above. All soil sampleswere stored in Whirl-Pak bags on dry ice in the field and storedat �70 �C until processed for microbial community nucleic acidextraction.
2.2. Environmental conditions
Atmospheric temperature, relative humidity and barometricpressure were monitored continuously on-site by the ZERTWeather Station (http://orsl.eps.montana.edu/weather/zert/).
2.3. DNA/RNA extraction and real-time quantitative PCR assays
Total community RNA and DNA were extracted and processedfrom 1 g of each homogenized soil core (i.e. time point), in triplicateusing theMoBio PowerSoil™ Total RNA Isolation Kit (MoBio, SolanaBeach, CA) in conjunction with the MoBio RNA PowerSoil® DNAElution Accessory Kit as described previously (Morales and Holben,2013). All DNA samples were stored at �20 �C until used indownstream analyses. All RNA samples were stored at �70 �C untilused in downstream analyses.
Real-time qPCR was performed using previously describedconditions (Morales et al., 2010; Morales and Holben, 2013). Inbrief, real-time qPCR was performed in an iCycler iQ thermocycler(Bio-Rad, Hercules, CA) with an ABsolute Blue qPCR Sybr green ROXmix (ABgene, Rochester, NY) using primers specific for: nifH,nitrogenase gene; nosZ, nitrous oxide reductase gene; nirS, nitritereductase gene; rbcL, ribulose-1,5-bisphosphate carboxylase oxy-genase (RuBisCO); mxaF, methanol dehydrogenase; mcrA, methyl-coenzyme M reductase. Quantification of gene abundances wasperformed using 5 ng of total community DNA from individualreplicate extractions. For measurement of specific gene transcriptabundances, 0.525 mg of RNA was used in a 35 ml reverse tran-scription reaction using random hexamers (Promega) and theOmniscript Reverse Transcriptase (Qiagen, Valencia, CA). qPCR wasthen performed using 1 ml of RT reaction product as template. AllqPCR reactions for any given sample (for each individual extraction)were run at least in triplicate as described previously (Moraleset al., 2010; Morales and Holben, 2013).
2.4. 16S rRNA gene pyrosequencing and analysis
For each sample, equal amounts of DNA (25 ng) from eachreplicate extraction were pooled for use as PCR template. TriplicatePCR reactions were performed targeting the 16S rRNA gene using amodified 536f (50-CAGCMGCCGCGGTAATWC-30) and 907r (50-CCGTCAATTCMTTTRAGTTT-30) primer set, which included individ-ual barcode sequences for each sample and a linker at the 50 end ofeach primer. PCR reactions consisted of 25 ng of template, 1 Unit ofFastStart High Fidelity Taq (Roche, Indianapolis, IN), 1� buffer,200 mM of each deoxynucleoside triphosphate, 400 nM of eachprimer and 200 ng/mL of BSA in a total volume of 20 mL. Amplifi-cation conditions consisted of an initial denaturation step of 94 �Cfor 3 min, followed by 30 cycles of 94 �C for 45 s, 55 �C for 45 s, and72 �C for 1 min with a final extension at 72 �C for 7 min. Equalamplification of replicate PCR reactions and product purity wasconfirmed by agarose gel electrophoresis. Replicate reactions werepooled and purified twice using the AMpure PCR purification kit(Agencourt, Beverly, Massachusetts, USA) as per manufacturer'sprotocol. All samples were diluted to equal concentrations andpooled. Bidirectional sequencing was done using the 454 GSFLXTitanium Sequencer platform and standard protocols.
Prior to analysis, all sequences (from bidirectional sequencing)were oriented in the same direction and combined into one dataset.Low quality reads (as determined using default parameters), primerand barcode sequences were removed and datasets were denoisedusing Qiime (Caporaso et al., 2010). Open reference OTU pickingwas performed using the Greengenes reference library (McDonaldet al., 2012) to bin sequences into clusters based on 97% sequencesimilarity. The sequence sets from the samples were rarified

S.E. Morales, W.E. Holben / Soil Biology & Biochemistry 76 (2014) 286e296288
(normalized to be of equal size) to 3700 sequences per sample byrandomly re-sampling the entire pool of sequences for each sampleten times with replacement after each sampling. Resulting OTUtables were used to calculate alpha diversity, beta diversity, andclassification of OTUs using Qiime.
2.5. Statistical analysis
Analyses were performed using JMP software. Principal com-ponents analysis (PCA) consisted of datasets organized as datamatrices composed of relative sequence abundance (percent ofsequences detected for each OTU at 97% level for each sample),environmental data (pressure, temperature, humidity), and qPCRdata (copy numbers per 5 ng of nucleic acid of the following genesand their transcripts: nifH: nitrogenase gene; nosZ: nitrous oxidereductase gene; nirS: nitrite reductase gene; rbcL: ribulose-1,5-bisphosphate carboxylase oxygenase (RuBisCO); mxaF: methanoldehydrogenase; mcrA: methyl-coenzyme M reductase). Data wasorganized with rows representing different sampling dates andcolumns representing individual variables. Principal componentscores were plotted by time for the first two principal components.Parameters driving the distribution of the PCA plots were deter-mined by querying all variables against the first two principalcomponents. Hierarchical clustering (Mean distance) was per-formed to visualize patterns in the data using the same dataset asfor PCA analysis. Individual variables were also independentlyqueried to each other by conducting the non-parametric Spear-man's r. We used one-way analysis of variance (ANOVA) to test forsignificant CO2 effects (statistical significance was evaluated atp < 0.1) on microbial parameters.
3. Results
3.1. Effect of underground CO2 leakage on surface soil microbialcommunity diversity measures
A total of 52,821 16S rRNA gene sequences were analyzed afterremoval of low quality reads and denoising of the full dataset. Onesample (corresponding to the eCO2 treatment 144 h post-release)was removed after rarification due to low coverage. All remainingsamples were analyzed at a sequencing depth of 3700 sequencesper sample). Average diversity measures based on multiple
Fig. 1. Average and standard deviation of observed bacterial richness (based on 16S rRNAsummary for the distribution of the data in each treatment (all time points included). Releasea 0.4 t CO2 day�1 summer (JulyeAugust) release. Samples used for this study correspond to aindicated as active or inactive. R1-1 ¼ 24 h prior to release; R1-2 ¼ 144 h after initiation ofsecond CO2 release; R2-2 ¼ 168 h after initiation of second CO2 release; R2-3 ¼ 504 h afte
iterations indicated an increase in richness (Fig. 1) and diversity(Fig. S1) over the growing season, with increases detected beinglower as a result of CO2 exposure (statistical significance results inTable S1). An average of 762 operational taxonomic units (OTUs)per sample were detected under background conditions with 741detected in response to CO2 when sequences were clustered at 97%sequence identity (significance based on ANOVA of p < 0.0001).Phylogenetic Diversity had a mean ± std err by treatment of68 ± 0.37 [�CO2] and 67 ± 0.33 [þCO2 ] (significance based onANOVA of p ¼ 0.03).
3.2. Community composition
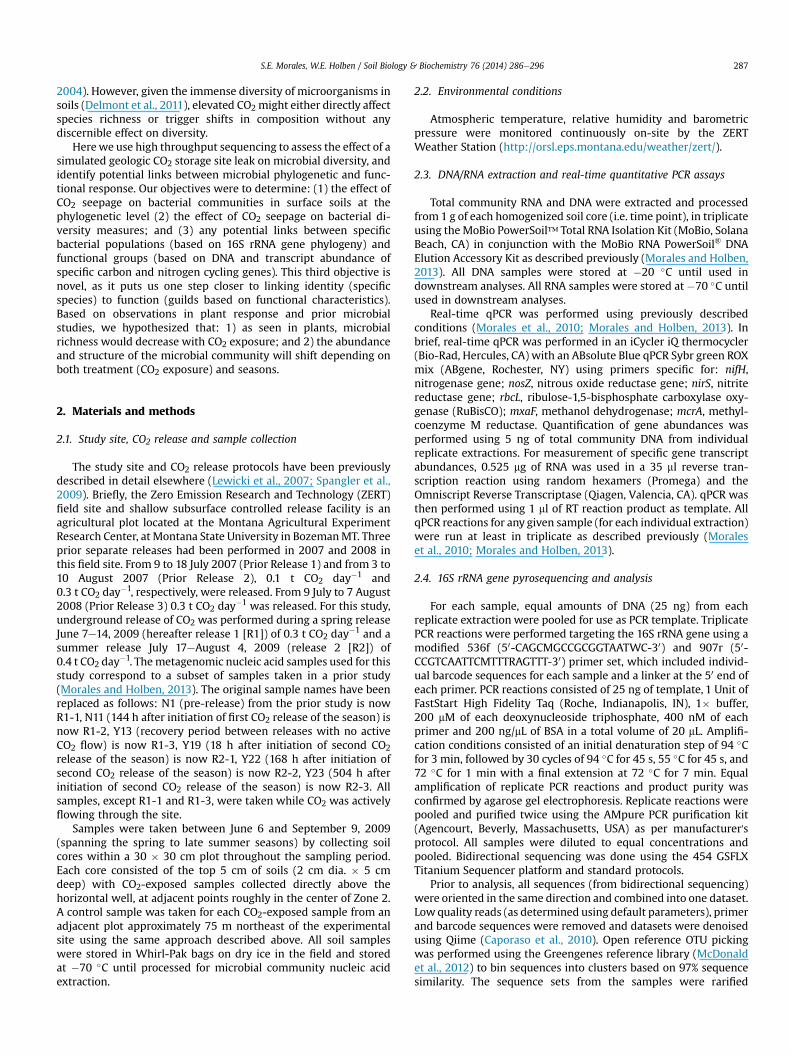
All of the sequences in the study were assigned into 16 knownphyla (Fig. 2, Cyanobacteria not shown) with no significant treat-ment effect when relative abundance values were averaged acrossall samples. The same pattern continued across the class, order andfamily levels (data not shown). However, genus-level differenceswere detected as described and discussed below. Although somegroups showed a distinct response in one sample, a consistenttreatment level response at higher classification levels was notdetected. However, a 103-fold increase (3.08% relative abundance)in Cyanobacterial sequences was detected for sample R2-2 (corre-sponding to the second release [July] under active CO2 release) thatwas the strongest single sample response detected. The most pre-dominant phylum was the Proteobacteria, which averaged 31%relative abundance within all samples, followed by the Actino-bacteria and Bacteroideteswith 21% each, the Acidobacteriawith 9%,the Firmicutes and Chloroflexi with 2% and the Planctomycetes, Ver-ucomicrobia, Gemmatimonadetes with 1%. The remaining phylawere represented by <1% of the total sample relative abundance(see Fig. 2).
To reduce the number of OTUs being analyzed and identify shiftsin specific bacterial populations, a clustering analysis was per-formed with OTUs showing a significant response to CO2 exposure(Fig. 3 and Table 1). Significant effects were detected for 41 OTUs97%out of a total of 540, including some that could not be classified toknown genera. OTUs belonging to the Nitrospira (5 of 5), Actino-bacteria (5 of 76), Bacteroidetes (11 of 49), Acidobacteria (7 of 41),Alpha (4 of 71), Beta (4 of 31), Delta (3 of 28), and Gamma-proteo-bacteria (2 of 41) were affected. Twenty-five OTUs were signifi-cantly reduced, with 7 Acidobacteria OTUs being affected. Sixteen
gene OTU97%) over time during two simulated CO2 leaks. Inset; Box plot displaying1 corresponds to a 0.3 t CO2 day�1 spring (June) release while Release 2 corresponds tosubset of samples taken in a prior study (Morales and Holben, 2013). CO2 flow status isCO2 release; R1-3 ¼ recovery period between releases; R2-1 ¼ 18 h after initiation ofr initiation of second CO2 release.
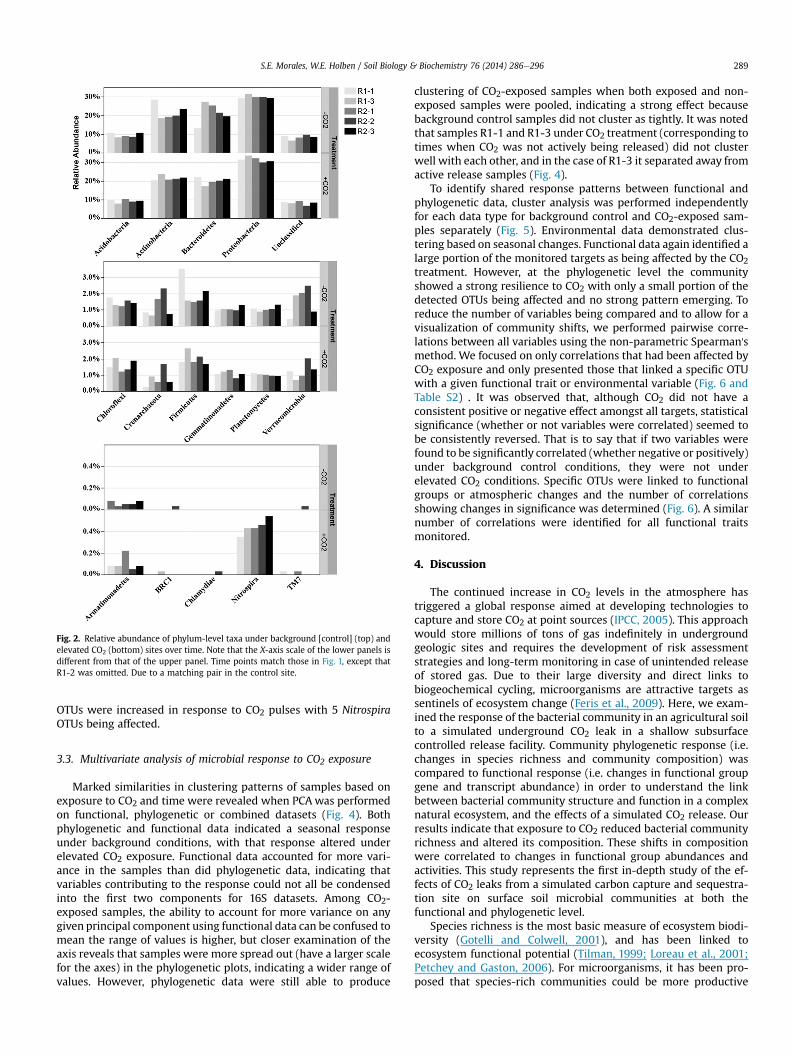
Fig. 2. Relative abundance of phylum-level taxa under background [control] (top) andelevated CO2 (bottom) sites over time. Note that the X-axis scale of the lower panels isdifferent from that of the upper panel. Time points match those in Fig. 1, except thatR1-2 was omitted. Due to a matching pair in the control site.
S.E. Morales, W.E. Holben / Soil Biology & Biochemistry 76 (2014) 286e296 289
OTUs were increased in response to CO2 pulses with 5 NitrospiraOTUs being affected.
3.3. Multivariate analysis of microbial response to CO2 exposure
Marked similarities in clustering patterns of samples based onexposure to CO2 and time were revealed when PCAwas performedon functional, phylogenetic or combined datasets (Fig. 4). Bothphylogenetic and functional data indicated a seasonal responseunder background conditions, with that response altered underelevated CO2 exposure. Functional data accounted for more vari-ance in the samples than did phylogenetic data, indicating thatvariables contributing to the response could not all be condensedinto the first two components for 16S datasets. Among CO2-exposed samples, the ability to account for more variance on anygiven principal component using functional data can be confused tomean the range of values is higher, but closer examination of theaxis reveals that samples were more spread out (have a larger scalefor the axes) in the phylogenetic plots, indicating a wider range ofvalues. However, phylogenetic data were still able to produce
clustering of CO2-exposed samples when both exposed and non-exposed samples were pooled, indicating a strong effect becausebackground control samples did not cluster as tightly. It was notedthat samples R1-1 and R1-3 under CO2 treatment (corresponding totimes when CO2 was not actively being released) did not clusterwell with each other, and in the case of R1-3 it separated away fromactive release samples (Fig. 4).
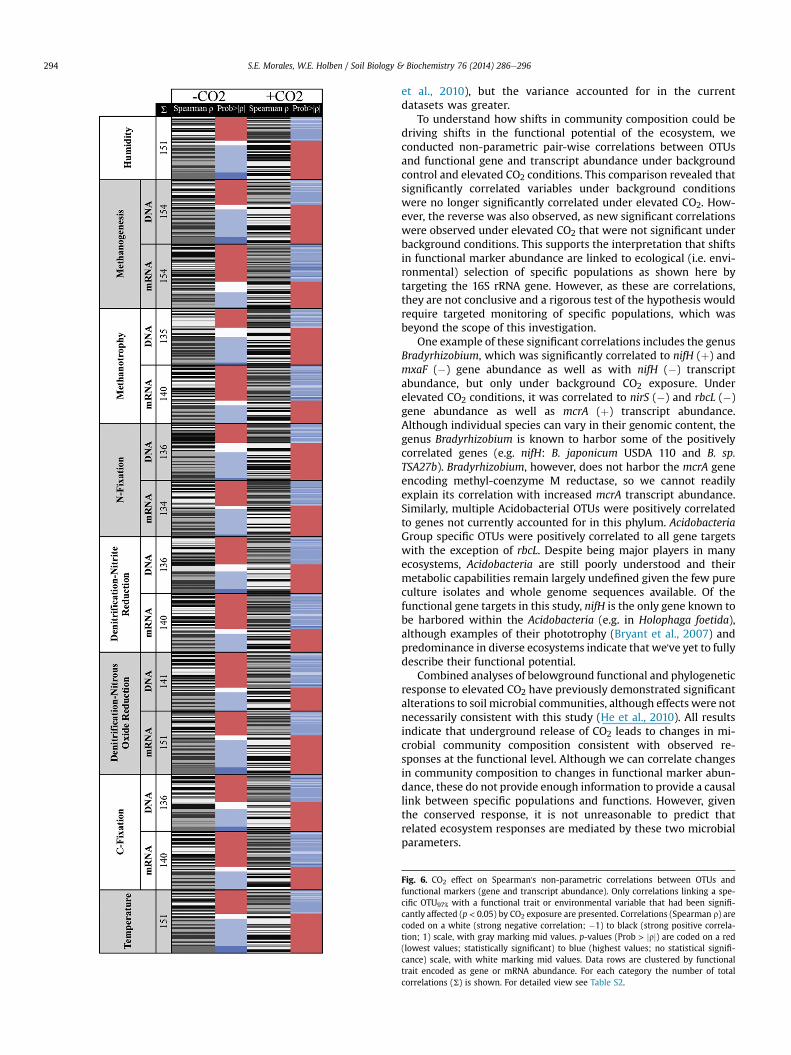
To identify shared response patterns between functional andphylogenetic data, cluster analysis was performed independentlyfor each data type for background control and CO2-exposed sam-ples separately (Fig. 5). Environmental data demonstrated clus-tering based on seasonal changes. Functional data again identified alarge portion of the monitored targets as being affected by the CO2treatment. However, at the phylogenetic level the communityshowed a strong resilience to CO2 with only a small portion of thedetected OTUs being affected and no strong pattern emerging. Toreduce the number of variables being compared and to allow for avisualization of community shifts, we performed pairwise corre-lations between all variables using the non-parametric Spearman'smethod. We focused on only correlations that had been affected byCO2 exposure and only presented those that linked a specific OTUwith a given functional trait or environmental variable (Fig. 6 andTable S2) . It was observed that, although CO2 did not have aconsistent positive or negative effect amongst all targets, statisticalsignificance (whether or not variables were correlated) seemed tobe consistently reversed. That is to say that if two variables werefound to be significantly correlated (whether negative or positively)under background control conditions, they were not underelevated CO2 conditions. Specific OTUs were linked to functionalgroups or atmospheric changes and the number of correlationsshowing changes in significance was determined (Fig. 6). A similarnumber of correlations were identified for all functional traitsmonitored.
4. Discussion
The continued increase in CO2 levels in the atmosphere hastriggered a global response aimed at developing technologies tocapture and store CO2 at point sources (IPCC, 2005). This approachwould store millions of tons of gas indefinitely in undergroundgeologic sites and requires the development of risk assessmentstrategies and long-term monitoring in case of unintended releaseof stored gas. Due to their large diversity and direct links tobiogeochemical cycling, microorganisms are attractive targets assentinels of ecosystem change (Feris et al., 2009). Here, we exam-ined the response of the bacterial community in an agricultural soilto a simulated underground CO2 leak in a shallow subsurfacecontrolled release facility. Community phylogenetic response (i.e.changes in species richness and community composition) wascompared to functional response (i.e. changes in functional groupgene and transcript abundance) in order to understand the linkbetween bacterial community structure and function in a complexnatural ecosystem, and the effects of a simulated CO2 release. Ourresults indicate that exposure to CO2 reduced bacterial communityrichness and altered its composition. These shifts in compositionwere correlated to changes in functional group abundances andactivities. This study represents the first in-depth study of the ef-fects of CO2 leaks from a simulated carbon capture and sequestra-tion site on surface soil microbial communities at both thefunctional and phylogenetic level.
Species richness is the most basic measure of ecosystem biodi-versity (Gotelli and Colwell, 2001), and has been linked toecosystem functional potential (Tilman, 1999; Loreau et al., 2001;Petchey and Gaston, 2006). For microorganisms, it has been pro-posed that species-rich communities could be more productive
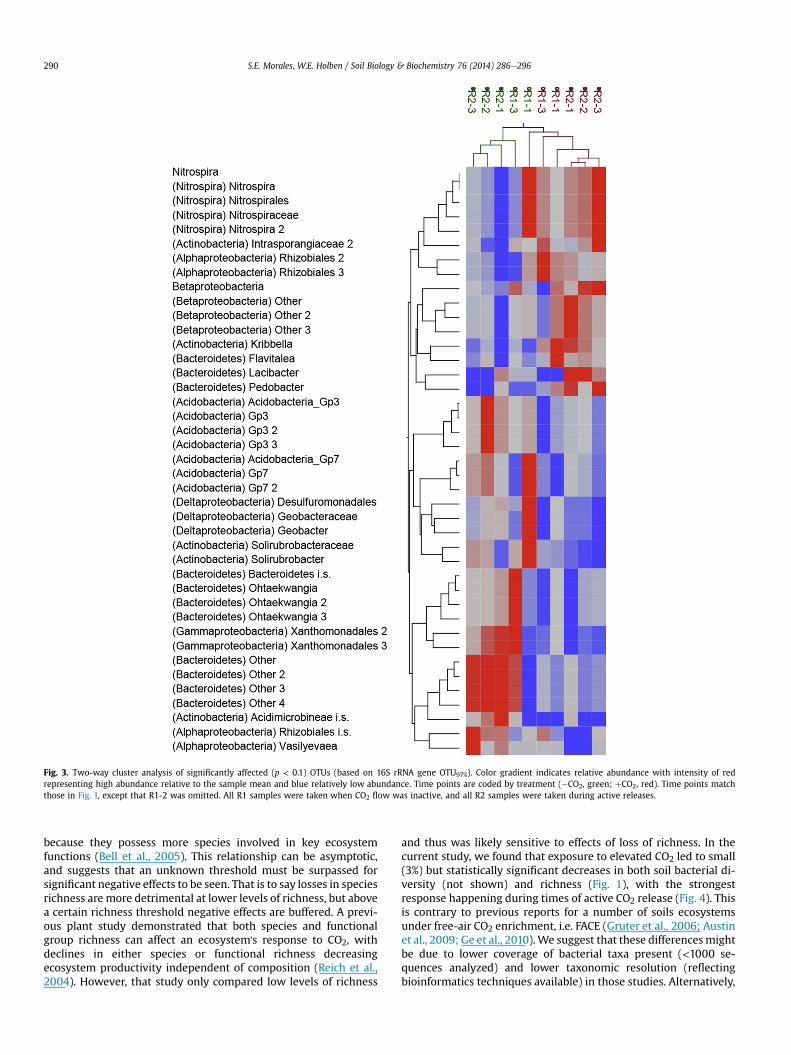
Fig. 3. Two-way cluster analysis of significantly affected (p < 0.1) OTUs (based on 16S rRNA gene OTU97%). Color gradient indicates relative abundance with intensity of redrepresenting high abundance relative to the sample mean and blue relatively low abundance. Time points are coded by treatment (�CO2, green; þCO2, red). Time points matchthose in Fig. 1, except that R1-2 was omitted. All R1 samples were taken when CO2 flow was inactive, and all R2 samples were taken during active releases.
S.E. Morales, W.E. Holben / Soil Biology & Biochemistry 76 (2014) 286e296290
because they possess more species involved in key ecosystemfunctions (Bell et al., 2005). This relationship can be asymptotic,and suggests that an unknown threshold must be surpassed forsignificant negative effects to be seen. That is to say losses in speciesrichness are more detrimental at lower levels of richness, but abovea certain richness threshold negative effects are buffered. A previ-ous plant study demonstrated that both species and functionalgroup richness can affect an ecosystem's response to CO2, withdeclines in either species or functional richness decreasingecosystem productivity independent of composition (Reich et al.,2004). However, that study only compared low levels of richness
and thus was likely sensitive to effects of loss of richness. In thecurrent study, we found that exposure to elevated CO2 led to small(3%) but statistically significant decreases in both soil bacterial di-versity (not shown) and richness (Fig. 1), with the strongestresponse happening during times of active CO2 release (Fig. 4). Thisis contrary to previous reports for a number of soils ecosystemsunder free-air CO2 enrichment, i.e. FACE (Gruter et al., 2006; Austinet al., 2009; Ge et al., 2010).We suggest that these differencesmightbe due to lower coverage of bacterial taxa present (<1000 se-quences analyzed) and lower taxonomic resolution (reflectingbioinformatics techniques available) in those studies. Alternatively,
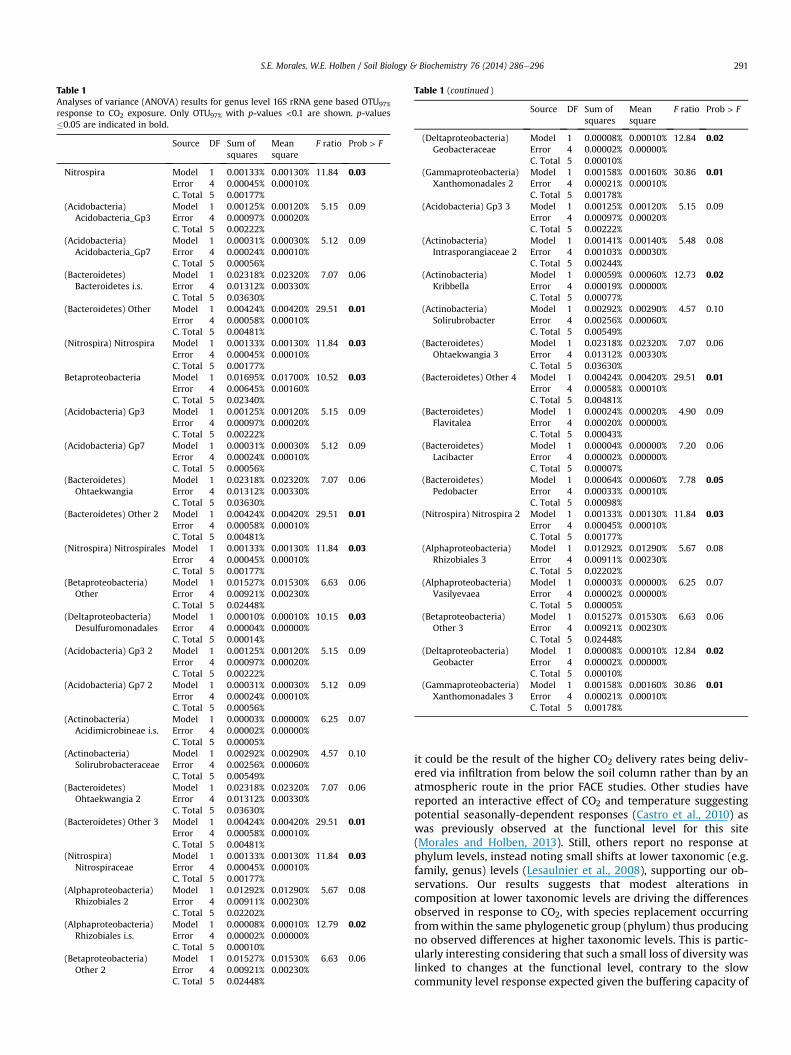
Table 1Analyses of variance (ANOVA) results for genus level 16S rRNA gene based OTU97%
response to CO2 exposure. Only OTU97% with p-values <0.1 are shown. p-values�0.05 are indicated in bold.
Source DF Sum ofsquares
Meansquare
F ratio Prob > F
Nitrospira Model 1 0.00133% 0.00130% 11.84 0.03Error 4 0.00045% 0.00010%C. Total 5 0.00177%
(Acidobacteria)Acidobacteria_Gp3
Model 1 0.00125% 0.00120% 5.15 0.09Error 4 0.00097% 0.00020%C. Total 5 0.00222%
(Acidobacteria)Acidobacteria_Gp7
Model 1 0.00031% 0.00030% 5.12 0.09Error 4 0.00024% 0.00010%C. Total 5 0.00056%
(Bacteroidetes)Bacteroidetes i.s.
Model 1 0.02318% 0.02320% 7.07 0.06Error 4 0.01312% 0.00330%C. Total 5 0.03630%
(Bacteroidetes) Other Model 1 0.00424% 0.00420% 29.51 0.01Error 4 0.00058% 0.00010%C. Total 5 0.00481%
(Nitrospira) Nitrospira Model 1 0.00133% 0.00130% 11.84 0.03Error 4 0.00045% 0.00010%C. Total 5 0.00177%
Betaproteobacteria Model 1 0.01695% 0.01700% 10.52 0.03Error 4 0.00645% 0.00160%C. Total 5 0.02340%
(Acidobacteria) Gp3 Model 1 0.00125% 0.00120% 5.15 0.09Error 4 0.00097% 0.00020%C. Total 5 0.00222%
(Acidobacteria) Gp7 Model 1 0.00031% 0.00030% 5.12 0.09Error 4 0.00024% 0.00010%C. Total 5 0.00056%
(Bacteroidetes)Ohtaekwangia
Model 1 0.02318% 0.02320% 7.07 0.06Error 4 0.01312% 0.00330%C. Total 5 0.03630%
(Bacteroidetes) Other 2 Model 1 0.00424% 0.00420% 29.51 0.01Error 4 0.00058% 0.00010%C. Total 5 0.00481%
(Nitrospira) Nitrospirales Model 1 0.00133% 0.00130% 11.84 0.03Error 4 0.00045% 0.00010%C. Total 5 0.00177%
(Betaproteobacteria)Other
Model 1 0.01527% 0.01530% 6.63 0.06Error 4 0.00921% 0.00230%C. Total 5 0.02448%
(Deltaproteobacteria)Desulfuromonadales
Model 1 0.00010% 0.00010% 10.15 0.03Error 4 0.00004% 0.00000%C. Total 5 0.00014%
(Acidobacteria) Gp3 2 Model 1 0.00125% 0.00120% 5.15 0.09Error 4 0.00097% 0.00020%C. Total 5 0.00222%
(Acidobacteria) Gp7 2 Model 1 0.00031% 0.00030% 5.12 0.09Error 4 0.00024% 0.00010%C. Total 5 0.00056%
(Actinobacteria)Acidimicrobineae i.s.
Model 1 0.00003% 0.00000% 6.25 0.07Error 4 0.00002% 0.00000%C. Total 5 0.00005%
(Actinobacteria)Solirubrobacteraceae
Model 1 0.00292% 0.00290% 4.57 0.10Error 4 0.00256% 0.00060%C. Total 5 0.00549%
(Bacteroidetes)Ohtaekwangia 2
Model 1 0.02318% 0.02320% 7.07 0.06Error 4 0.01312% 0.00330%C. Total 5 0.03630%
(Bacteroidetes) Other 3 Model 1 0.00424% 0.00420% 29.51 0.01Error 4 0.00058% 0.00010%C. Total 5 0.00481%
(Nitrospira)Nitrospiraceae
Model 1 0.00133% 0.00130% 11.84 0.03Error 4 0.00045% 0.00010%C. Total 5 0.00177%
(Alphaproteobacteria)Rhizobiales 2
Model 1 0.01292% 0.01290% 5.67 0.08Error 4 0.00911% 0.00230%C. Total 5 0.02202%
(Alphaproteobacteria)Rhizobiales i.s.
Model 1 0.00008% 0.00010% 12.79 0.02Error 4 0.00002% 0.00000%C. Total 5 0.00010%
(Betaproteobacteria)Other 2
Model 1 0.01527% 0.01530% 6.63 0.06Error 4 0.00921% 0.00230%C. Total 5 0.02448%
Table 1 (continued )
Source DF Sum ofsquares
Meansquare
F ratio Prob > F
(Deltaproteobacteria)Geobacteraceae
Model 1 0.00008% 0.00010% 12.84 0.02Error 4 0.00002% 0.00000%C. Total 5 0.00010%
(Gammaproteobacteria)Xanthomonadales 2
Model 1 0.00158% 0.00160% 30.86 0.01Error 4 0.00021% 0.00010%C. Total 5 0.00178%
(Acidobacteria) Gp3 3 Model 1 0.00125% 0.00120% 5.15 0.09Error 4 0.00097% 0.00020%C. Total 5 0.00222%
(Actinobacteria)Intrasporangiaceae 2
Model 1 0.00141% 0.00140% 5.48 0.08Error 4 0.00103% 0.00030%C. Total 5 0.00244%
(Actinobacteria)Kribbella
Model 1 0.00059% 0.00060% 12.73 0.02Error 4 0.00019% 0.00000%C. Total 5 0.00077%
(Actinobacteria)Solirubrobacter
Model 1 0.00292% 0.00290% 4.57 0.10Error 4 0.00256% 0.00060%C. Total 5 0.00549%
(Bacteroidetes)Ohtaekwangia 3
Model 1 0.02318% 0.02320% 7.07 0.06Error 4 0.01312% 0.00330%C. Total 5 0.03630%
(Bacteroidetes) Other 4 Model 1 0.00424% 0.00420% 29.51 0.01Error 4 0.00058% 0.00010%C. Total 5 0.00481%
(Bacteroidetes)Flavitalea
Model 1 0.00024% 0.00020% 4.90 0.09Error 4 0.00020% 0.00000%C. Total 5 0.00043%
(Bacteroidetes)Lacibacter
Model 1 0.00004% 0.00000% 7.20 0.06Error 4 0.00002% 0.00000%C. Total 5 0.00007%
(Bacteroidetes)Pedobacter
Model 1 0.00064% 0.00060% 7.78 0.05Error 4 0.00033% 0.00010%C. Total 5 0.00098%
(Nitrospira) Nitrospira 2 Model 1 0.00133% 0.00130% 11.84 0.03Error 4 0.00045% 0.00010%C. Total 5 0.00177%
(Alphaproteobacteria)Rhizobiales 3
Model 1 0.01292% 0.01290% 5.67 0.08Error 4 0.00911% 0.00230%C. Total 5 0.02202%
(Alphaproteobacteria)Vasilyevaea
Model 1 0.00003% 0.00000% 6.25 0.07Error 4 0.00002% 0.00000%C. Total 5 0.00005%
(Betaproteobacteria)Other 3
Model 1 0.01527% 0.01530% 6.63 0.06Error 4 0.00921% 0.00230%C. Total 5 0.02448%
(Deltaproteobacteria)Geobacter
Model 1 0.00008% 0.00010% 12.84 0.02Error 4 0.00002% 0.00000%C. Total 5 0.00010%
(Gammaproteobacteria)Xanthomonadales 3
Model 1 0.00158% 0.00160% 30.86 0.01Error 4 0.00021% 0.00010%C. Total 5 0.00178%
S.E. Morales, W.E. Holben / Soil Biology & Biochemistry 76 (2014) 286e296 291
it could be the result of the higher CO2 delivery rates being deliv-ered via infiltration from below the soil column rather than by anatmospheric route in the prior FACE studies. Other studies havereported an interactive effect of CO2 and temperature suggestingpotential seasonally-dependent responses (Castro et al., 2010) aswas previously observed at the functional level for this site(Morales and Holben, 2013). Still, others report no response atphylum levels, instead noting small shifts at lower taxonomic (e.g.family, genus) levels (Lesaulnier et al., 2008), supporting our ob-servations. Our results suggests that modest alterations incomposition at lower taxonomic levels are driving the differencesobserved in response to CO2, with species replacement occurringfromwithin the same phylogenetic group (phylum) thus producingno observed differences at higher taxonomic levels. This is partic-ularly interesting considering that such a small loss of diversity waslinked to changes at the functional level, contrary to the slowcommunity level response expected given the buffering capacity of
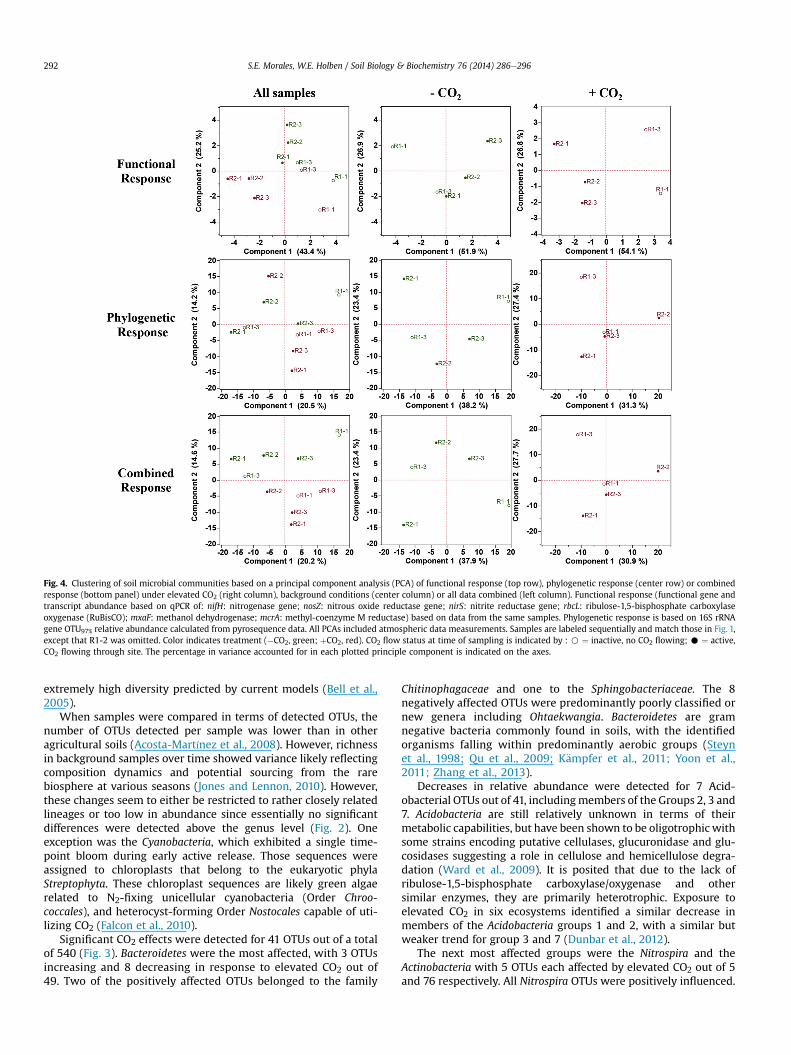
Fig. 4. Clustering of soil microbial communities based on a principal component analysis (PCA) of functional response (top row), phylogenetic response (center row) or combinedresponse (bottom panel) under elevated CO2 (right column), background conditions (center column) or all data combined (left column). Functional response (functional gene andtranscript abundance based on qPCR of: nifH: nitrogenase gene; nosZ: nitrous oxide reductase gene; nirS: nitrite reductase gene; rbcL: ribulose-1,5-bisphosphate carboxylaseoxygenase (RuBisCO); mxaF: methanol dehydrogenase; mcrA: methyl-coenzyme M reductase) based on data from the same samples. Phylogenetic response is based on 16S rRNAgene OTU97% relative abundance calculated from pyrosequence data. All PCAs included atmospheric data measurements. Samples are labeled sequentially and match those in Fig. 1,except that R1-2 was omitted. Color indicates treatment (�CO2, green; þCO2, red). CO2 flow status at time of sampling is indicated by : B ¼ inactive, no CO2 flowing; C ¼ active,CO2 flowing through site. The percentage in variance accounted for in each plotted principle component is indicated on the axes.
S.E. Morales, W.E. Holben / Soil Biology & Biochemistry 76 (2014) 286e296292
extremely high diversity predicted by current models (Bell et al.,2005).
When samples were compared in terms of detected OTUs, thenumber of OTUs detected per sample was lower than in otheragricultural soils (Acosta-Martínez et al., 2008). However, richnessin background samples over time showed variance likely reflectingcomposition dynamics and potential sourcing from the rarebiosphere at various seasons (Jones and Lennon, 2010). However,these changes seem to either be restricted to rather closely relatedlineages or too low in abundance since essentially no significantdifferences were detected above the genus level (Fig. 2). Oneexception was the Cyanobacteria, which exhibited a single time-point bloom during early active release. Those sequences wereassigned to chloroplasts that belong to the eukaryotic phylaStreptophyta. These chloroplast sequences are likely green algaerelated to N2-fixing unicellular cyanobacteria (Order Chroo-coccales), and heterocyst-forming Order Nostocales capable of uti-lizing CO2 (Falcon et al., 2010).
Significant CO2 effects were detected for 41 OTUs out of a totalof 540 (Fig. 3). Bacteroidetes were the most affected, with 3 OTUsincreasing and 8 decreasing in response to elevated CO2 out of49. Two of the positively affected OTUs belonged to the family
Chitinophagaceae and one to the Sphingobacteriaceae. The 8negatively affected OTUs were predominantly poorly classified ornew genera including Ohtaekwangia. Bacteroidetes are gramnegative bacteria commonly found in soils, with the identifiedorganisms falling within predominantly aerobic groups (Steynet al., 1998; Qu et al., 2009; K€ampfer et al., 2011; Yoon et al.,2011; Zhang et al., 2013).
Decreases in relative abundance were detected for 7 Acid-obacterial OTUs out of 41, includingmembers of the Groups 2, 3 and7. Acidobacteria are still relatively unknown in terms of theirmetabolic capabilities, but have been shown to be oligotrophic withsome strains encoding putative cellulases, glucuronidase and glu-cosidases suggesting a role in cellulose and hemicellulose degra-dation (Ward et al., 2009). It is posited that due to the lack ofribulose-1,5-bisphosphate carboxylase/oxygenase and othersimilar enzymes, they are primarily heterotrophic. Exposure toelevated CO2 in six ecosystems identified a similar decrease inmembers of the Acidobacteria groups 1 and 2, with a similar butweaker trend for group 3 and 7 (Dunbar et al., 2012).
The next most affected groups were the Nitrospira and theActinobacteria with 5 OTUs each affected by elevated CO2 out of 5and 76 respectively. All Nitrospira OTUs were positively influenced.
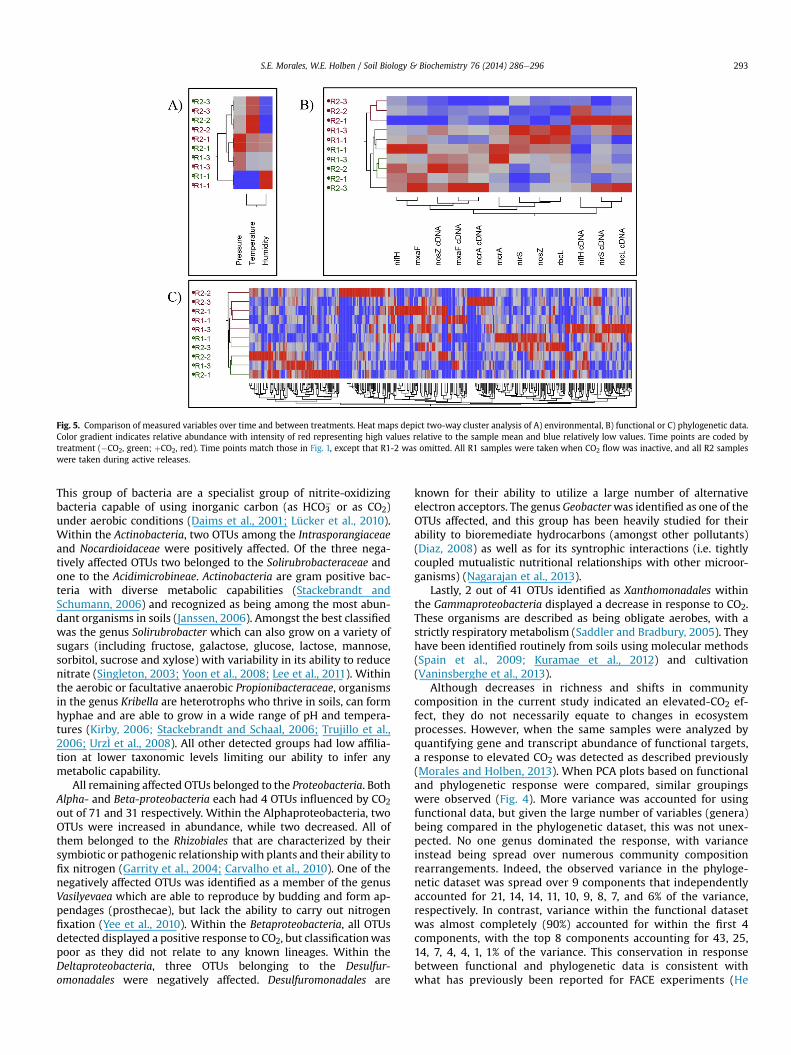
Fig. 5. Comparison of measured variables over time and between treatments. Heat maps depict two-way cluster analysis of A) environmental, B) functional or C) phylogenetic data.Color gradient indicates relative abundance with intensity of red representing high values relative to the sample mean and blue relatively low values. Time points are coded bytreatment (�CO2, green; þCO2, red). Time points match those in Fig. 1, except that R1-2 was omitted. All R1 samples were taken when CO2 flow was inactive, and all R2 sampleswere taken during active releases.
S.E. Morales, W.E. Holben / Soil Biology & Biochemistry 76 (2014) 286e296 293
This group of bacteria are a specialist group of nitrite-oxidizingbacteria capable of using inorganic carbon (as HCO3
� or as CO2)under aerobic conditions (Daims et al., 2001; Lücker et al., 2010).Within the Actinobacteria, two OTUs among the Intrasporangiaceaeand Nocardioidaceae were positively affected. Of the three nega-tively affected OTUs two belonged to the Solirubrobacteraceae andone to the Acidimicrobineae. Actinobacteria are gram positive bac-teria with diverse metabolic capabilities (Stackebrandt andSchumann, 2006) and recognized as being among the most abun-dant organisms in soils (Janssen, 2006). Amongst the best classifiedwas the genus Solirubrobacter which can also grow on a variety ofsugars (including fructose, galactose, glucose, lactose, mannose,sorbitol, sucrose and xylose) with variability in its ability to reducenitrate (Singleton, 2003; Yoon et al., 2008; Lee et al., 2011). Withinthe aerobic or facultative anaerobic Propionibacteraceae, organismsin the genus Kribella are heterotrophs who thrive in soils, can formhyphae and are able to grow in a wide range of pH and tempera-tures (Kirby, 2006; Stackebrandt and Schaal, 2006; Trujillo et al.,2006; Urz�I et al., 2008). All other detected groups had low affilia-tion at lower taxonomic levels limiting our ability to infer anymetabolic capability.
All remaining affected OTUs belonged to the Proteobacteria. BothAlpha- and Beta-proteobacteria each had 4 OTUs influenced by CO2
out of 71 and 31 respectively. Within the Alphaproteobacteria, twoOTUs were increased in abundance, while two decreased. All ofthem belonged to the Rhizobiales that are characterized by theirsymbiotic or pathogenic relationship with plants and their ability tofix nitrogen (Garrity et al., 2004; Carvalho et al., 2010). One of thenegatively affected OTUs was identified as a member of the genusVasilyevaea which are able to reproduce by budding and form ap-pendages (prosthecae), but lack the ability to carry out nitrogenfixation (Yee et al., 2010). Within the Betaproteobacteria, all OTUsdetected displayed a positive response to CO2, but classificationwaspoor as they did not relate to any known lineages. Within theDeltaproteobacteria, three OTUs belonging to the Desulfur-omonadales were negatively affected. Desulfuromonadales are
known for their ability to utilize a large number of alternativeelectron acceptors. The genus Geobacterwas identified as one of theOTUs affected, and this group has been heavily studied for theirability to bioremediate hydrocarbons (amongst other pollutants)(Diaz, 2008) as well as for its syntrophic interactions (i.e. tightlycoupled mutualistic nutritional relationships with other microor-ganisms) (Nagarajan et al., 2013).
Lastly, 2 out of 41 OTUs identified as Xanthomonadales withinthe Gammaproteobacteria displayed a decrease in response to CO2.These organisms are described as being obligate aerobes, with astrictly respiratory metabolism (Saddler and Bradbury, 2005). Theyhave been identified routinely from soils using molecular methods(Spain et al., 2009; Kuramae et al., 2012) and cultivation(Vaninsberghe et al., 2013).
Although decreases in richness and shifts in communitycomposition in the current study indicated an elevated-CO2 ef-fect, they do not necessarily equate to changes in ecosystemprocesses. However, when the same samples were analyzed byquantifying gene and transcript abundance of functional targets,a response to elevated CO2 was detected as described previously(Morales and Holben, 2013). When PCA plots based on functionaland phylogenetic response were compared, similar groupingswere observed (Fig. 4). More variance was accounted for usingfunctional data, but given the large number of variables (genera)being compared in the phylogenetic dataset, this was not unex-pected. No one genus dominated the response, with varianceinstead being spread over numerous community compositionrearrangements. Indeed, the observed variance in the phyloge-netic dataset was spread over 9 components that independentlyaccounted for 21, 14, 14, 11, 10, 9, 8, 7, and 6% of the variance,respectively. In contrast, variance within the functional datasetwas almost completely (90%) accounted for within the first 4components, with the top 8 components accounting for 43, 25,14, 7, 4, 4, 1, 1% of the variance. This conservation in responsebetween functional and phylogenetic data is consistent withwhat has previously been reported for FACE experiments (He
S.E. Morales, W.E. Holben / Soil Biology & Biochemistry 76 (2014) 286e296294
et al., 2010), but the variance accounted for in the currentdatasets was greater.
To understand how shifts in community composition could bedriving shifts in the functional potential of the ecosystem, weconducted non-parametric pair-wise correlations between OTUsand functional gene and transcript abundance under backgroundcontrol and elevated CO2 conditions. This comparison revealed thatsignificantly correlated variables under background conditionswere no longer significantly correlated under elevated CO2. How-ever, the reverse was also observed, as new significant correlationswere observed under elevated CO2 that were not significant underbackground conditions. This supports the interpretation that shiftsin functional marker abundance are linked to ecological (i.e. envi-ronmental) selection of specific populations as shown here bytargeting the 16S rRNA gene. However, as these are correlations,they are not conclusive and a rigorous test of the hypothesis wouldrequire targeted monitoring of specific populations, which wasbeyond the scope of this investigation.
One example of these significant correlations includes the genusBradyrhizobium, which was significantly correlated to nifH (þ) andmxaF (�) gene abundance as well as with nifH (�) transcriptabundance, but only under background CO2 exposure. Underelevated CO2 conditions, it was correlated to nirS (�) and rbcL (�)gene abundance as well as mcrA (þ) transcript abundance.Although individual species can vary in their genomic content, thegenus Bradyrhizobium is known to harbor some of the positivelycorrelated genes (e.g. nifH: B. japonicum USDA 110 and B. sp.TSA27b). Bradyrhizobium, however, does not harbor the mcrA geneencoding methyl-coenzyme M reductase, so we cannot readilyexplain its correlation with increased mcrA transcript abundance.Similarly, multiple Acidobacterial OTUs were positively correlatedto genes not currently accounted for in this phylum. AcidobacteriaGroup specific OTUs were positively correlated to all gene targetswith the exception of rbcL. Despite being major players in manyecosystems, Acidobacteria are still poorly understood and theirmetabolic capabilities remain largely undefined given the few pureculture isolates and whole genome sequences available. Of thefunctional gene targets in this study, nifH is the only gene known tobe harbored within the Acidobacteria (e.g. in Holophaga foetida),although examples of their phototrophy (Bryant et al., 2007) andpredominance in diverse ecosystems indicate that we've yet to fullydescribe their functional potential.
Combined analyses of belowground functional and phylogeneticresponse to elevated CO2 have previously demonstrated significantalterations to soil microbial communities, although effects were notnecessarily consistent with this study (He et al., 2010). All resultsindicate that underground release of CO2 leads to changes in mi-crobial community composition consistent with observed re-sponses at the functional level. Although we can correlate changesin community composition to changes in functional marker abun-dance, these do not provide enough information to provide a causallink between specific populations and functions. However, giventhe conserved response, it is not unreasonable to predict thatrelated ecosystem responses are mediated by these two microbialparameters.
Fig. 6. CO2 effect on Spearman's non-parametric correlations between OTUs andfunctional markers (gene and transcript abundance). Only correlations linking a spe-cific OTU97% with a functional trait or environmental variable that had been signifi-cantly affected (p < 0.05) by CO2 exposure are presented. Correlations (Spearman r) arecoded on a white (strong negative correlation; �1) to black (strong positive correla-tion; 1) scale, with gray marking mid values. p-values (Prob > jrj) are coded on a red(lowest values; statistically significant) to blue (highest values; no statistical signifi-cance) scale, with white marking mid values. Data rows are clustered by functionaltrait encoded as gene or mRNA abundance. For each category the number of totalcorrelations (S) is shown. For detailed view see Table S2.
S.E. Morales, W.E. Holben / Soil Biology & Biochemistry 76 (2014) 286e296 295
We observed that bacterial richness declines in response to CO2and that community changes are dominated by compositionaldifferences at lower taxonomic levels (genera) rather than by largeshifts at the phylum level. Among the dominant OTUs, thosebelonging to the Bacteroideteswere themost affected, with 11 OTUseither decreasing or increasing in response to CO2 enrichment.However, correlations between specific OTUs and functional targetsunder background control or elevated CO2 identified other OTUsinvolved in the observed response. These observations point to acumulative mechanism, whereby many seemingly modest changesaccumulate to trigger an observed functional effect. Such shifts insoil microbial communities could be drivers of ecosystem changeand alterations of aboveground processes.
Acknowledgments
This work was supported by the U.S. Department of Ener-gyeExperimental Program to Stimulate Competitive Research(DOE-EPSCoR Implementation Grant DE-FG02-08ER46527).
We thank Philip Drummond, Maria Rosario and Laura Dobeckfor help with sampling, and Joseph Shaw for sharing atmosphericdata with us. The authors would like to thank the anonymous re-viewers for their constructive comments.
Appendix A. Supplementary data
Supplementary data related to this article can be found at http://dx.doi.org/10.1016/j.soilbio.2014.05.018.
References
Acosta-Martínez, V., Dowd, S., Sun, Y., Allen, V., 2008. Tag-encoded pyrosequencinganalysis of bacterial diversity in a single soil type as affected by managementand land use. Soil Biology and Biochemistry 40, 2762e2770.
Austin, E.E., Castro, H.F., Sides, K.E., Schadt, C.W., Classen, A.T., 2009. Assessment of10 years of CO2 fumigation on soil microbial communities and function in asweetgum plantation. Soil Biology and Biochemistry 41, 514e520.
Bell, T., Newman, J.A., Silverman, B.W., Turner, S.L., Lilley, A.K., 2005. The contri-bution of species richness and composition to bacterial services. Nature 436,1157e1160.
Bryant, D.A., Costas, A.M.G., Maresca, J.A., Chew, A.G.M., Klatt, C.G., Bateson, M.M.,Tallon, L.J., Hostetler, J., Nelson, W.C., Heidelberg, J.F., Ward, D.M., 2007. Candi-datus Chloracidobacterium thermophilum: an aerobic Phototrophic Acid-obacterium. Science 317, 523e526.
Caporaso, J.G., Kuczynski, J., Stombaugh, J., Bittinger, K., Bushman, F.D., Costello, E.K.,Fierer, N., Pe~na, A.G., Goodrich, J.K., Gordon, J.I., Huttley, G.A., Kelley, S.T.,Knights, D., Koenig, J.E., Ley, R.E., Lozupone, C.A., McDonald, D., Muegge, B.D.,Pirrung, M., Reeder, J., Sevinsky, J.R., Turnbaugh, P.J., Walters, W.A., Widmann, J.,Yatsunenko, T., Zaneveld, J., Knight, R., 2010. QIIME allows analysis of high-throughput community sequencing data. Nature Methods 7, 335e336.
Carvalho, F.M., Souza, R.C., Barcellos, F.G., Hungria, M., Vasconcelos, A.T.R., 2010.Genomic and evolutionary comparisons of diazotrophic and pathogenic bac-teria of the order Rhizobiales. BMC Microbiology 10, 37.
Castro, H.F., Classen, A.T., Austin, E.E., Norby, R.J., Schadt, C.W., 2010. Soil microbialcommunity responses to multiple experimental climate change drivers. Appliedand Environmental Microbiology 76, 999e1007.
Daims, H., Nielsen, J.L., Nielsen, P.H., Schleifer, K.H., Wagner, M., 2001. In situcharacterization of Nitrospira-like nitrite-oxidizing bacteria active in waste-water treatment plants. Applied and Environmental Microbiology 67,5273e5284.
Delmont, T.O., Robe, P., Cecillon, S., Clark, I.M., Constancias, F., Simonet, P.,Hirsch, P.R., Vogel, T.M., 2011. Accessing the soil metagenome for studies ofmicrobial diversity. Applied and Environmental Microbiology 77, 1315e1324.
Diaz, E., 2008. Microbial Biodegradation. Horizon Scientific Press.Dunbar, J., Eichorst, S.A., Gallegos-Graves, L.V., et al., 2012. Common bacterial re-
sponses in six ecosystems exposed to 10 years of elevated atmospheric carbondioxide. Environmental Microbiology 14, 1145e1158.
Falcon, L.I., Magallon, S., Castillo, A., 2010. Dating the cyanobacterial ancestor of thechloroplast. The ISME Journal 4, 777e783.
Farrar, C.D., Neil, J.M., Howle, J.F., 1999. Magmatic Carbon dioxide Emissions atMammoth Mountain, California. Water-Resources Investigations. U.S. Geolog-ical Survey.
Farrar, C.D., Sorey, M.L., Evans, W.C., Howle, J.F., Kerr, B.D., Kennedy, B.M., King, C.Y.,Southon, J.R., 1995. Forest-killing diffuse CO2 emission at Mammoth Mountainas a sign of magmatic unrest. Nature 376, 675e678.
Feris, K.P., Ramsey, P.W., Gibbons, S.M., Frazar, C., Rillig, M.C., Moore, J.N.,Gannon, J.E., Holben, W.E., 2009. Hyporheic microbial community developmentis a sensitive indicator of metal contamination. Environmental Science &Technology 43, 6158e6163.
Garrity, G.M., Bell, J.A., Lilburn, T.G., 2004. Taxonomic Outline of the Prokaryotes.Bergey's Manual of Systematic Bacteriology. Springer, New York, Berlin,Heidelberg.
Ge, Y., Chen, C., Xu, Z., Oren, R., He, J.Z., 2010. The spatial factor, rather than elevatedCO2, controls the soil bacterial community in a temperate forest ecosystem.Applied and Environmental Microbiology 76, 7429e7436.
Gotelli, N.J., Colwell, R.K., 2001. Quantifying biodiversity: procedures and pitfalls inthe measurement and comparison of species richness. Ecology Letters 4,379e391.
Gruter, D., Schmid, B., Brandl, H., 2006. Influence of plant diversity and elevatedatmospheric carbon dioxide levels on belowground bacterial diversity. BMCMicrobiology 6, 68.
He, Z., Xu, M., Deng, Y., Kang, S., Kellogg, L., Wu, L., Van Nostrand, J.D., Hobbie, S.E.,Reich, P.B., Zhou, J., 2010. Metagenomic analysis reveals a marked divergence inthe structure of belowground microbial communities at elevated CO2. EcologyLetters 13, 564e575.
IPCC, 2005. IPCC Special Report on Carbon dioxide Capture and Storage. Prepared byWorking Group III of the Intergovernmental Panel on Climate Change 1e443.
Janssen, P.H., 2006. Identifying the dominant soil bacterial taxa in libraries of 16SrRNA and 16S rRNA genes. Applied and Environmental Microbiology 72,1719e1728.
Jones, S.E., Lennon, J.T., 2010. Dormancy contributes to the maintenance of micro-bial diversity. Proceedings of the National Academy of Sciences 107, 5881e5886.
K€ampfer, P., Lodders, N., Falsen, E., 2011. Hydrotalea flava gen. nov., sp. nov., a newmember of the phylum Bacteroidetes and allocation of the genera Chitinophaga,Sediminibacterium, Lacibacter, Flavihumibacter, Flavisolibacter, Niabella, Niastella,Segetibacter, Parasegetibacter, Terrimonas, Ferruginibacter, Filimonas and Hydro-talea to the family Chitinophagaceae fam. nov. International Journal of Sys-tematic and Evolutionary Microbiology 61, 518e523.
Kirby, B.M., 2006. Kribbella karoonensis sp. nov. and Kribbella swartbergensis sp. nov.,isolated from soil from the Western Cape, South Africa. International Journal ofSystematic and Evolutionary Microbiology 56, 1097e1101.
Kuramae, E.E., Yergeau, E., Wong, L.C., Pijl, A.S., Veen, J.A., Kowalchuk, G.A., 2012. Soilcharacteristics more strongly influence soil bacterial communities than land-use type. FEMS Microbiology Ecology 79, 12e24.
Lee, M., Ten, L.N., Woo, S.G., Park, J., 2011. Agromyces soli sp. nov., isolated from farmsoil. International Journal of Systematic and Evolutionary Microbiology 61,1286e1292.
Lesaulnier, C., Papamichail, D., McCorkle, S., Ollivier, B., Skiena, S., Taghavi, S., Zak, D.,van der Lelie, D., 2008. Elevated atmospheric CO2 affects soil microbial diversityassociated with trembling aspen. Environmental Microbiology 10, 926e941.
Lewicki, J.L., Oldenburg, C.M., Dobeck, L., Spangler, L., 2007. Surface CO2leakage during two shallow subsurface CO2 releases. Geophysical ResearchLetters 34.
Loreau, M., Naeem, S., Inchausti, P., Bengtsson, J., Grime, J.P., Hector, A., Hooper, D.U.,Huston, M.A., Raffaelli, D., Schmid, B., Tilman, D., Wardle, D.A., 2001. Biodiver-sity and ecosystem functioning: current knowledge and future challenges.Science 294, 804e808.
Lücker, S., Wagner, M., Maixner, F., Pelletier, E., Koch, H., Vacherie, B., Rattei, T.,Damst�e, J.S.S., Spieck, E., Le Paslier, D., 2010. A Nitrospira metagenome illumi-nates the physiology and evolution of globally important nitrite-oxidizingbacteria. Proceedings of the National Academy of Sciences 107, 13479e13484.
Male, E.J., Pickles, W.L., Silver, E.A., Hoffmann, G.D., Lewicki, J., Apple, M., Repasky, K.,Burton, E.A., 2010. Using hyperspectral plant signatures for CO2 leak detectionduring the 2008 ZERT CO2 sequestration field experiment in Bozeman, Mon-tana. Environmental Earth Sciences 60, 251e261.
McDonald, D., Price, M.N., Goodrich, J., Nawrocki, E.P., DeSantis, T.Z., Probst, A.,Andersen, G.L., Knight, R., Hugenholtz, P., 2012. An improved Greengenes tax-onomy with explicit ranks for ecological and evolutionary analyses of bacteriaand archaea. The ISME Journal 6, 610e618.
Mikkelsen, M., Jørgensen, M., Krebs, F.C., 2010. The teraton challenge. A review offixation and transformation of carbon dioxide. Energy & Environmental Science3, 43.
Morales, S.E., Cosart, T., Holben, W.E., 2010. Bacterial gene abundances as indicatorsof greenhouse gas emission in soils. The ISME Journal 4, 799e808.
Morales, S.E., Holben, W.E., 2013. Functional response of a near-surface soil mi-crobial community to a simulated underground CO2 storage leak. PLoS One 8,e81742.
Nagarajan, H., Embree, M., Rotaru, A.-E., Shrestha, P.M., Feist, A.M., Palsson, B.Ø.,Lovley, D.R., Zengler, K., 2013. Characterization and modelling of interspecieselectron transfer mechanisms and microbial community dynamics of a syn-trophic association. Nature Communications 4, 2809.
Petchey, O.L., Gaston, K.J., 2006. Functional diversity: back to basics and lookingforward. Ecology Letters 9, 741e758.
Qu, J.-H., Yuan, H.-L., Yang, J.-S., Li, H.-F., Chen, N., 2009. Lacibacter cauensis gen. nov.,sp. nov., a novel member of the phylum Bacteroidetes isolated from sediment ofa eutrophic lake.
Reich, P.B., Tilman, D., Naeem, S., Ellsworth, D.S., Knops, J., Craine, J., Wedin, D.,Trost, J., 2004. Species and functional group diversity independently influencebiomass accumulation and its response to CO2 and N. Proceedings of the Na-tional Academy of Sciences 101, 10101e10106.

S.E. Morales, W.E. Holben / Soil Biology & Biochemistry 76 (2014) 286e296296
Saddler, G.S., Bradbury, J.F., 2005. Xanthomonadales ord. nov. In: Bergey's Manual®
of Systematic Bacteriology. Springer, US, Boston, MA, pp. 63e122.Singleton, D.R., 2003. Solirubrobacter pauli gen. nov., sp. nov., a mesophilic bacte-
rium within the Rubrobacteridae related to common soil clones. InternationalJournal of Systematic and Evolutionary Microbiology 53, 485e490.
Spain, A.M., Krumholz, L.R., Elshahed, M.S., 2009. Abundance, composition, di-versity and novelty of soil Proteobacteria. The ISME Journal 3, 992e1000.
Spangler, L.H., Dobeck, L.M., Repasky, K.S., Nehrir, A.R., Humphries, S.D., Barr, J.L.,Keith, C.J., Shaw, J.A., Rouse, J.H., Cunningham, A.B., Benson, S.M.,Oldenburg, C.M., Lewicki, J.L., Wells, A.W., Diehl, J.R., Strazisar, B.R.,Fessenden, J.E., Rahn, T.A., Amonette, J.E., Barr, J.L., Pickles, W.L., Jacobson, J.D.,Silver, E.A., Male, E.J., Rauch, H.W., Gullickson, K.S., Trautz, R., Kharaka, Y.,Birkholzer, J., Wielopolski, L., 2009. A shallow subsurface controlled releasefacility in Bozeman, Montana, USA, for testing near surface CO2 detectiontechniques and transport models. Environmental Earth Sciences 60, 227e239.
Stackebrandt, E., Schaal, K.P., 2006. The Family Propionibacteriaceae: The GeneraFriedmanniella, Luteococcus, Microlunatus, Micropruina, Propioniferax, Propioni-microbium and Tessarococcus. In: Martin Dworkin, S.F., E.R.K.H.S.A.E.S. (Eds.),The Prokaryotes. Soringer, Berlin, Germany, pp. 383e399.
Stackebrandt, E., Schumann, P., 2006. Introduction to the Taxonomy of Actino-bacteria. In: Martin Dworkin, S.F., E.R.K.H.S.A.E.S. (Eds.), The Prokaryotes,pp. 297e321. Berlin, Germany.
Stenhouse, M., Arthur, R., Zhou, W., 2009. Assessing environmental impacts fromgeological CO2 storage. Energy Procedia 1, 1895e1902.
Steyn, P.L., Segers, P., Vancanneyt, M., Sandra, P., Kersters, K., Joubert, J.J., 1998.Classification of heparinolytic bacteria into a new genus, Pedobacter, comprisingfour species: Pedobacter heparinus comb. nov., Pedobacter piscium comb. nov.,Pedobacter africanus sp. nov. and Pedobacter saltans sp. nov. Proposal of thefamily Sphingobacteriaceae fam. nov. International Journal of SystematicBacteriology 48, 165e177.
Tilman, D., 1999. The ecological consequences of changes in biodiversity: a searchfor general principles. Ecology 80, 1455e1474.
Trujillo, M.E., Kroppenstedt, R.M., Schumann, P., Martínez-Molina, E., 2006. Kribbellalupini sp. nov., isolated from the roots of Lupinus angustifolius. InternationalJournal of Systematic and Evolutionary Microbiology 56, 407e411.
Urz�I, C., De Leo, F., Schumann, P., 2008. Kribbella catacumbae sp. nov. and Kribbellasancticallisti sp. nov., isolated from whitish-grey patinas in the catacombs of StCallistus in Rome, Italy. International Journal of Systematic and EvolutionaryMicrobiology 58, 2090e2097.
Van Der Heijden, M.G.A., Bardgett, R.D., van Straalen, N.M., 2008. The unseen ma-jority: soil microbes as drivers of plant diversity and productivity in terrestrialecosystems. Ecology Letters 11, 296e310.
Vaninsberghe, D., Hartmann, M., Stewart, G.R., Mohn, W.W., 2013. Isolation of asubstantial proportion of forest soil bacterial communities detected via pyrotagsequencing. Applied and Environmental Microbiology 79, 2096e2098.
Ward, N.L., Challacombe, J.F., Janssen, P.H., Henrissat, B., Coutinho, P.M., Wu, M.,Xie, G., Haft, D.H., Sait, M., Badger, J., Barabote, R.D., Bradley, B., Brettin, T.S.,Brinkac, L.M., Bruce, D., Creasy, T., Daugherty, S.C., Davidsen, T.M., DeBoy, R.T.,Detter, J.C., Dodson, R.J., Durkin, A.S., Ganapathy, A., Gwinn-Giglio, M., Han, C.S.,Khouri, H., Kiss, H., Kothari, S.P., Madupu, R., Nelson, K.E., Nelson, W.C.,Paulsen, I., Penn, K., Ren, Q., Rosovitz, M.J., Selengut, J.D., Shrivastava, S.,Sullivan, S.A., Tapia, R., Thompson, L.S., Watkins, K.L., Yang, Q., Yu, C., Zafar, N.,Zhou, L., Kuske, C.R., 2009. Three genomes from the phylum Acidobacteriaprovide insight into the lifestyles of these microorganisms in soils. Applied andEnvironmental Microbiology 75, 2046e2056.
West, J.M., Pearce, J.M., Coombs, P., Ford, J.R., Scheib, C., Colls, J.J., Smith, K.L.,Steven, M.D., 2009. The impact of controlled injection of CO2 on the soil ecosystemand chemistry of an English lowland pasture. Energy Procedia 1, 1863e1870.
White, C.M., Strazisar, B.R., Granite, E.J., Hoffman, J.S., Pennline, H.W., 2003. Sepa-ration and capture of CO2 from large stationary sources and sequestration ingeological formationsdcoalbeds and deep saline aquifers. Journal of the Air &Waste Management Association 53, 645e715.
Yee, B., Oertli, G.E., Fuerst, J.A., Staley, J.T., 2010. Reclassification of the polyphyleticgenus Prosthecomicrobium to form two novel genera, Vasilyevaea gen. nov. andBauldia gen. nov. with four new combinations: Vasilyevaea enhydra comb. nov.,Vasilyevaea mishustinii comb. nov., Bauldia consociata comb. nov. and Bauldialitoralis comb. nov. International Journal of Systematic and EvolutionaryMicrobiology 60, 2960e2966.
Yoon, J.-H., Kang, S.-J., Lee, S.-Y., Lee, J.-S., Park, S., 2011. Ohtaekwangia koreensis gen.nov., sp. nov. and Ohtaekwangia kribbensis sp. nov., isolated from marine sand,deep-branching members of the phylum Bacteroidetes.
Yoon, J.H., Schumann, P., Kang, S.J., Park, S., Oh, T.K., 2008. Agromyces terreus sp. nov.,isolated from soil. International Journal of Systematic and EvolutionaryMicrobiology 58, 1308e1312.
Zhang, L., Qin, B., Jia, Z., Wei, G., 2013. Flavitalea gansuensis sp. nov., isolated fromsoil from an arid area, and emended descriptions of the genus Flavitalea andFlavitalea populi. International Journal of Systematic and Evolutionary Micro-biology 63, 490e495.