SIMS Vol. 4 No. 1.cdr - Services Institute of Medical Sciences
Upload
independentCategory
view
2download
0
SIMS analysis of volatiles in silicate glasses
1. Calibration, matrix effects and comparisons with FTIR
Erik Hauri a,*, Jianhua Wang a, Jacqueline E. Dixon b, Penelope L. King c,1,Charles Mandeville d, Sally Newman e
aDepartment of Terrestrial Magnetism, Carnegie Institution of Washington, 5241 Broad Branch Rd. NW, Washington, DC 20015, USAbDivision of Marine Geology and Geophysics, Rosenstiel School of Marine and Atmospheric Science, University of Miami,
Coral Gables, FL 33149, USAcDepartment of Geological Sciences, Arizona State University, Tempe, AZ 85287, USA
dAmerican Museum of Natural History, Central Park West at 79th St., New York, NY 10024, USAeDivision of Geological and Planetary Sciences, California Institute of Technology, Pasadena, CA 91125, USA
Received 30 November 1999; accepted 2 May 2001
Abstract
This paper describes microanalysis techniques using secondary ion mass spectrometry (SIMS) to measure the abundances
and isotopic compositions of hydrogen, carbon, fluorine, sulfur and chlorine in volcanic glasses. SIMS measurement of total
H2O and total CO2 abundances compare very well with measurements on the same glasses using vibrational spectroscopy
techniques (FTIR). A typical 10-min SIMS measurement for volatile abundances is made on a singly polished specimen,
sputtering a crater 15–30 mm in diameter and 2–3 mm deep, utilizing 1–5� 10� 9 g of sample material. Detection limits are
routinely < 30 ppm H2O, < 3 ppm CO2, and < 1 ppm F, S and Cl. Measurements of dD, d13C and d34S in volcanic glasses are
currently reproducible and accurate to 2–5x, depending on the concentration of the element. Because of their spatial
selectivity, the SIMS methods allow resolution of magmatic volatile signatures from those carried by secondary phases, which
can sometimes plague traditional vacuum extraction methods that require large amounts of sample (tens to hundreds of
milligrams). Ease of sample preparation, rapid analysis and high sensitivity allow SIMS to be applied to volatile analysis of
small samples such as melt inclusions, in which large numbers of individual analyses are often required in order to obtain a
representative sample population. Combined abundance and isotopic composition data for volatile elements provide coupled
constraints on processes relevant to magma genesis and evolution, including degassing, magma contamination, mixing, and
source variability. D 2002 Elsevier Science B.V. All rights reserved.
Keywords: SIMS; Ion probe; Volatiles; Microbeam; Water; Isotopes
1. Introduction
Measurements of volatile species such as H2O,
CO2, F, S and Cl often rely on bulk rock analysis
techniques which utilize vacuum extraction combined
with either manometry or mass spectrometry (see
0009-2541/02/$ - see front matter D 2002 Elsevier Science B.V. All rights reserved.
PII: S0009-2541 (01 )00375 -8
* Corresponding author. Fax: +1-202-478-88211.
E-mail address: [email protected] (E. Hauri).1 Present address: Department of Earth Sciences, University of
Western Ontario, London ON N6A 5B7, UK.
www.elsevier.com/locate/chemgeo
Chemical Geology 183 (2002) 99–114

review by Ihinger et al., 1994). In the analysis of
volcanic glasses with low volatile abundances, when a
primary magmatic signature is desired, bulk extraction
techniques can sometimes suffer from problems asso-
ciated with the large amounts of material (up to
several hundred milligrams) required for accurate
measurements. Even with careful handpicking, bulk
analyses of such large amounts of material can be
compromised by contamination associated with
adsorbed volatiles and minute amounts of altered
material, and place sample size limitations on the
types of studies which can be undertaken. In principal,
a microbeam technique with sufficient sensitivity to
measure low volatile abundances could circumvent
these problems.
Within the last 25 years, electron microprobes have
been modified to allow direct and indirect (in the case
of water) microanalysis of volatile elements, but the
high detection limits of this technique (tens to hun-
dreds of ppm) place limitations on many volatile
studies (cf. Devine et al., 1995 and references therein).
Microanalysis techniques based on vibrational spec-
troscopy (such as Fourier Transform Infrared spectro-
scopy, FTIR) and secondary ion mass spectrometry
(SIMS) have permitted the direct measurement of a
number of volatile elements in silicate glasses, along
with fine-scale spatial resolution which can be used to
avoid contributions from secondary phases. The past
decade has seen a rapid increase in the use of FTIR to
measure quantitatively the abundance of a number of
hydrogen- and carbon-bearing species in geological
samples (Stolper, 1982; Fine and Stolper, 1986; New-
man et al., 1986; Dixon et al., 1988; Fogel, 1989;
Michael, 1995; Zhang et al., 1997; Wallace and
Anderson, 1998; King, 1999). This technique com-
bines a number of attractive improvements over bulk
extraction and electron beam methods, which include
a non-destructive analysis, the ability for microanal-
ysis (down to 10–20 mm) and low detection limits
(single ppm range), and the important ability to
measure quantitatively the abundance of several H-
and C-bearing species (H2O, OH � , CO2, CO3� ).
These advantages have facilitated improved experi-
mental studies of volatile behavior in magmatic sys-
tems (Stolper and Holloway, 1988; Silver et al., 1990;
Zhang and Stolper, 1991; Dixon and Stolper, 1995),
with resulting benefits in understanding volatile
behavior in natural samples. Disadvantages of this
technique include a laborious double-polishing sam-
ple preparation and the requirement of sufficient
sample thickness to allow precise absorbance meas-
urements. Some sample preparation problems are
circumvented by reflectance FTIR (Grzechnik et al.,
1996), but development efforts with both IR techni-
ques have revealed significant matrix effects (Dixon
and Pan, 1995; Zhang et al., 1997; King, 1999).
Most of these disadvantages are circumvented by
ion probe analysis with some success (Delaney and
Karsten, 1981; Hervig, 1992; Sisson and Layne, 1993;
Deloule et al., 1995; Sobolev and Chaussidon, 1996).
However, beginning with the first SIMS measure-
ments of volatile contents (Hinthorne and Anderson,
1975), historically the ion probe techniques have
suffered from high backgrounds and poor detection
limits, particularly for H2O and CO2 (Ihinger et al.,
1994; Devine et al., 1995). In this paper we describe
new improvements in secondary ion mass spectrom-
etry which permit the rapid analysis of the volatile
elements H, C, F, S and Cl at the 5–10 mm scale in
standard singly polished samples (e.g. thin sections,
grain mounts) with greatly improved detection limits.
In this paper we describe in detail our methods for
minimizing these problems, discuss the overall tech-
nique and its calibration against high-quality FTIR
measurements, outline methods for SIMS isotopic
analysis of H, C and S in volcanic glasses, and apply
the SIMS techniques to the study of volatile elements
in olivine-hosted melt inclusions from several Hawai-
ian volcanoes (Hauri, 2001).
2. Standards and cross-calibration
We have utilized a number of natural and synthetic
glass samples, ranging from nephelenite to rhyolite, to
construct a SIMS calibration for the analysis of H, C,
F, S and Cl abundances, and the isotopic compositions
of H, C and S (Table 1). Many of these glasses have
previously been analyzed for H2O and CO2 abundan-
ces by vacuum extraction manometry to provide a
calibration for FTIR absorbance measurements. Most
of the remaining glasses have been analyzed by FTIR
using the most current absorbance calibrations, taking
into account matrix effects on IR absorbance (Dixon
and Pan, 1995; Zhang et al., 1997; King, 1999). SIMS
calibrations for S and Cl abundances are based on
E. Hauri et al. / Chemical Geology 183 (2002) 99–114100
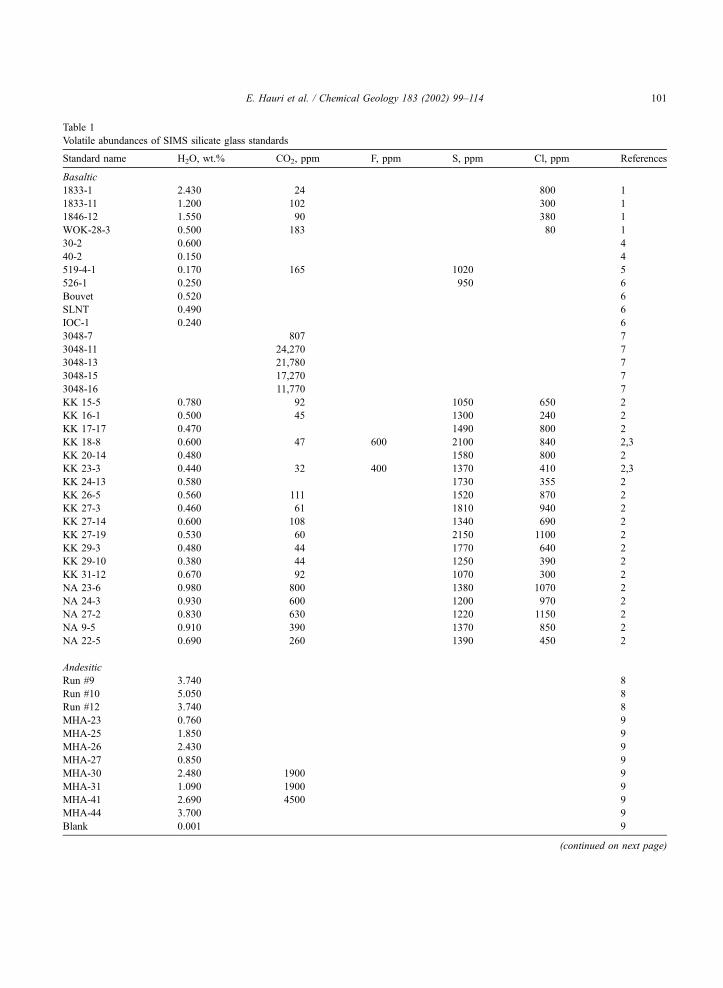
Table 1
Volatile abundances of SIMS silicate glass standards
Standard name H2O, wt.% CO2, ppm F, ppm S, ppm Cl, ppm References
Basaltic
1833-1 2.430 24 800 1
1833-11 1.200 102 300 1
1846-12 1.550 90 380 1
WOK-28-3 0.500 183 80 1
30-2 0.600 4
40-2 0.150 4
519-4-1 0.170 165 1020 5
526-1 0.250 950 6
Bouvet 0.520 6
SLNT 0.490 6
IOC-1 0.240 6
3048-7 807 7
3048-11 24,270 7
3048-13 21,780 7
3048-15 17,270 7
3048-16 11,770 7
KK 15-5 0.780 92 1050 650 2
KK 16-1 0.500 45 1300 240 2
KK 17-17 0.470 1490 800 2
KK 18-8 0.600 47 600 2100 840 2,3
KK 20-14 0.480 1580 800 2
KK 23-3 0.440 32 400 1370 410 2,3
KK 24-13 0.580 1730 355 2
KK 26-5 0.560 111 1520 870 2
KK 27-3 0.460 61 1810 940 2
KK 27-14 0.600 108 1340 690 2
KK 27-19 0.530 60 2150 1100 2
KK 29-3 0.480 44 1770 640 2
KK 29-10 0.380 44 1250 390 2
KK 31-12 0.670 92 1070 300 2
NA 23-6 0.980 800 1380 1070 2
NA 24-3 0.930 600 1200 970 2
NA 27-2 0.830 630 1220 1150 2
NA 9-5 0.910 390 1370 850 2
NA 22-5 0.690 260 1390 450 2
Andesitic
Run #9 3.740 8
Run #10 5.050 8
Run #12 3.740 8
MHA-23 0.760 9
MHA-25 1.850 9
MHA-26 2.430 9
MHA-27 0.850 9
MHA-30 2.480 1900 9
MHA-31 1.090 1900 9
MHA-41 2.690 4500 9
MHA-44 3.700 9
Blank 0.001 9
(continued on next page)
E. Hauri et al. / Chemical Geology 183 (2002) 99–114 101

high-quality electron microprobe measurements of
these elements in many of the same standards which
have been analyzed by FTIR for H2O and CO2 (Dixon
et al., 1997; Dixon and Clague, 2001).
Dissolved water concentration were analyzed on a
Bruker IFS-66 infrared spectrometer at the University
of Miami. Spectra were collected using an infrared
microscope attachment, a Globar source, KBr beams-
plitter and a HgCdTe2 detector for the infrared region
and the main sample chamber, a W source, CaF2beamsplitter and an InSb detector for the near-infrared
region. Glasses were double polished to a thickness of
50–300 mm. Thicknesses were measured using a
digital micrometer to F 2 mm. Reported water con-
centrations are the sum of molecular H2O (5230
cm� 1 band) and hydroxyl group (4500 cm � 1) con-
centrations calculated from measured absorbances
using densities reported in the literature (Stolper,
Table 1 (continued )
Standard name H2O, wt.% CO2, ppm F, ppm S, ppm Cl, ppm References
Silicic
MC84-t 0.793 5 a
MC84-df 0.707 7 a
North Coulee 0.101 a
NW Coulee 0.297 a
Panum Dome 0.120 1 a
UA 1113 2.800 11
UA 1112 4.800 11
Lipari 0.400 a
Ab1 1.740 224 a
UA 1162 6.380 7 a
UA 1170 2.920 342 a
UA 1115 0.660 a
DC-1 0.238 a
DC-2 0.127 a
NC5-V 0.798 a
BGM-8 0.386 a
GML 0.120 6
NOR 6.050 a
CO2-1 blank 0.137 < 10 12
147 0.192 2860 12
149 0.107 1790 12
152 0.112 950 12
NBS 610 295 500 500 13,14
NBS 612 50 50 50 14
NBS 620 1120 14
(1) Stolper and Newman, 1994; Newman et al., 2000.
(2) Dixon and Clague, 2001.
(3) Byers et al., 1985.
(4) A. Sobolev, unpublished data.
(5) Fine and Stolper, 1986.
(6) Stolper, 1982.
(7) Dixon and Pan, 1995.
(8) Mandeville, unpublished data.
(9) King, unpublished data.
(10) Newman et al., 1988.
(11) Virgo, unpublished data.
(12) Fogel and Rutherford, 1990.
(13) Hoskin, 1999.
(14) Nominal and certified NIST values.a This study.
E. Hauri et al. / Chemical Geology 183 (2002) 99–114102

1982; Newman et al., 1986; Silver et al., 1990) and,
for rhyolitic glasses, the method of Zhang et al. (1997)
which allows the molar absorptivities to vary as a
function of the total water content. Total water con-
centrations were also determined using the 3550
cm� 1 absorption on both infrared and near-infrared
spectra for rhyolitic glasses having less than about 0.7
wt.% H2O.
Most of the rhyolitic glasses common to this study
and those of Stolper (1982) and Newman et al. (1986)
have been remeasured, and most of the new water
concentrations are within 5% of the amounts deter-
mined by manometry with the exceptions of DC1
(16% lower), NC5V (11% higher) and North Coulee
(2.5 times lower). Differences of our values from
those determined by manometry may be related to
sample heterogeneity. For the rhyolitic glasses, the
mean water content determined from the 3550 cm � 1
band and using a molar absorptivity of 90 l mol� 1
cm� 1 are within 8% of the reported values. Previ-
ously published values of e3550 for rhyolitic glasses of100 l mol � 1 cm� 1 (Newman et al., 1986) and 80 l
mol� 1 cm� 1 (Ihinger et al., 1994) result in total
water concentrations that are 11% lower and higher,
respectively, than our reported values.
Carbon dissolved as carbonate in basaltic glasses
was determined using methods and absorbances
described by Dixon and Pan (1995). Carbon dissolved
as molecular CO2 in the albitic glasses was measured
using the 2350 cm � 1 absorption in both near-IR
(NIR) and mid-IR (MIR) spectra and a molar absorp-
tivity of 945 l mol� 1 cm � 1 (Fine and Stolper, 1985).
Carbon dissolved as carbonate groups in the albite
glasses was difficult to measure because of the over-
lap of the molecular water (1630 cm � 1) and carbo-
nate (1610 and 1375 cm� 1) bands. We estimated the
amount of carbonate in these glasses by assuming
constant proportions of carbonate and molecular car-
bon dioxide (CO32� = 1.43 CO2 molecular) as deter-
mined for albitic glasses by Fine and Stolper (1985).
Reported total CO2 concentrations are the sum of the
measured molecular CO2 and estimated CO32� con-
centrations.
All of the standards listed in Table 1 were used to
construct the SIMS calibration curves. In most cases,
FTIR and SIMS analyses were performed on the same
spot on the same chip of glass. SIMS calibrations for
S and Cl abundances are based on high-quality
electron probe measurements of these elements in
many of the same standards which have been ana-
lyzed by FTIR for H2O and CO2. Table 1 provides the
sample numbers, concentrations, references, and ana-
lytical comments for each of the standards used in the
SIMS calibrations.
3. Ion microprobe methods
3.1. Sample preparation for SIMS
The quality of the vacuum inside the ion microp-
robe sample chamber is the dominant factor which
controls the background for H2O and D/H measure-
ments, and epoxy from sample mounts is the largest
detractor to the mass spectrometer vacuum. In order to
control the H background, the standards were
mounted in one of two ways. Irregularly shaped glass
fragments were mounted in epoxy in Al-metal disks
and polished, or were first polished and pressed into
indium metal. Doubly polished wafers prepared for
FTIR were cleaned with methanol and mounted with
super-glue directly onto the polished and cleaned
surface of an Al-metal disk. All mounts were dried
in an oven at 70 �C for several days before coating
with gold (both top and sides) for ion probe analysis.
Between ion probe sessions, all standards (and sam-
ples) are stored in an oven at 70 �C so as to minimize
the adsorption of water vapor from laboratory air.
3.2. Volatile abundance measurements
The Cameca IMS 6f ion microprobe at the Depart-
ment of Terrestrial Magnetism was used for all of the
SIMS measurements. Prior to measurements, samples
and standards are allowed to outgas in an airlock
attached to the ion microprobe sample chamber, until
pressures reached < 5� 10� 8 Torr. Sample mounts
outgas further once they are inserted into the sample
chamber, and analyses are not begun until the sample
chamber pressure has reached < 5� 10� 9 Torr with-
out the use of a cold finger. It is usually possible to
obtain measurements at total sample chamber pres-
sures < 10� 9 Torr.
The major improvements over previous ion probe
techniques are the high-quality vacuum and the use of
a Cs + primary beam with collection of negatively
E. Hauri et al. / Chemical Geology 183 (2002) 99–114 103

charged secondary ions. The primary beam (5–10
nA) is accelerated to 10 kV, tuned using Kohler
illumination of a 100-mm diameter aperture, and
slightly defocused to obtain a 20–40-mm diameter
spot with a homogeneous intensity, resulting in a flat-
bottomed sputter crater. Tuning of the primary beam is
made with the mass spectrometer at low mass reso-
lution, at a mass resolving power (MRP) of 300.
Due to implantation of Cs + ions and extraction of
both negatively charged secondary ions and electrons,
positive charging of the sample surface must be
compensated with the use of an electron flood gun
which delivers electrons to the sample surface. Tuning
of the electron gun is made with the mass spectrom-
eter at low mass resolution (MRP= 300) and the
energy slit wide open. During analysis, the sample
potential is held at � 5 kV and the electron gun is
operated at � 5 kV, so that electrons arrive at the
sample surface with near-zero energy. Tuning of the
intensity and density of the electron gun prior to each
analysis session is achieved by offsetting the sample
voltage by + 20 V, allowing electrons to impact a
conductive sample surface (Cu–Al grid) and viewing
an image of H � ions desorbed from the sample
surface. The image of desorbed H� ions defines the
impact area of the electron beam, and the electron
beam is tuned to deliver at least 40 mA of electron
current (at 20 eV impact energy) homogeneously
distributed over a 150-mm diameter area. Final adjust-
ments in the position and tuning of the electron beam
are made by returning the sample potential to � 5 kV,
sputtering a gold-coated insulating sample (silicate
glass) with the primary beam, and examining the
images of H, O and Si with a narrow energy slit
(F 2–3 eV). Particular attention is paid to achieving a
homogeneous spot image (indicating homogeneity of
charge compensation) and precise spatial coincidence
of H, O and Si images. Finally, the filament current of
the electron flood gun is decreased to an electron
emission current well in excess of that required for
charge compensation of a 20 nA Cs + primary beam
(typically 200–300 nA). This ‘‘minimalist’’ electron
current reduces the instrumental H background
derived from electron sputtering along the electron
beam path inside the machine, and provides the best
possible sharpness of the secondary ion extraction
optics and ion image of the sputtered sample surface
while still maintaining effective charge compensation.
For analysis of H, C, F, S and Cl abundances, the
mass spectrometer is tuned with an imaged field of
view of 150 mm diameter on the sample surface, using
a large contrast aperture at the crossover (400 mm). A
100-mm diameter field aperture is inserted into the
image plane, and entrance and exit slits are then
closed to achieve a mass resolution of 2400, sufficient
to resolve 18OH from 19F and 16O2 from32S. The use
of the 100-mm field aperture is important; when
properly aligned with the sputter crater, it limits the
ion optical field of view to an area 10 mm in diameter
(e.g. smaller than the primary beam diameter) and
admits into the mass spectrometer only those ions
originating from the central 10 mm of the crater. The
elimination of stray ions sputtered from the crater
walls and desorbed from the sample surface results in
very low volatile backgrounds, particularly for hydro-
gen. The lack of charging is confirmed to within a few
eV by checking manually the centering of a nearly
closed energy slit on the peak of the Si energy
distribution. Analyses are made with the energy slit
wide open (250 eV bandpass).
Negatively charged secondary ions were counted
by a Pulse Count Technologies ECL counting system
(deadtime 11 ns), counting for 10 s on 1H, 12C, 19F,32S and 35Cl, and 2 s on the normalizing isotope 30Si.
The counting system background is < 5 counts per
minute for the counting system at half-mass positions
with the primary beam and electron gun on. A single
measurement consists of a 5-min presputter period
with subsequent collection of five sets of ratios; the
total analysis time is 10 min per spot. The depth of the
sputter crater varies from 1 to 3 mm depending on
primary beam intensity. Even using a small field
aperture, useful ion yields are quite high for the
elements of interest (H = 1 cps/ppm H2O/nA; C = 0.4
cps/ppm/nA; F = 50 cps/ppm/nA; S = 10 cps/ppm/nA;
Cl = 16 cps/ppm/nA). Detection limits were deter-
mined by analysis of San Carlos olivine, using liter-
ature estimates for concentrations of H2O (10 ppm,
Mackwell and Kohlstedt, 1990) and C ( < 2 ppm,
Mathez and Delaney, 1981). Routine detection limits
are < 10–30 ppm H2O, < 3 ppm CO2, and < 1 ppm F,
S and Cl. These low detection limits are made
possible by a combination of factors, dominated by
(1) the high-quality vacuum, (2) the high useful yield
of negative ions of these elements when using a Cs +
beam, (3) the use of a small field aperture which
E. Hauri et al. / Chemical Geology 183 (2002) 99–114104

masks ion emission from outside the center of the
sputter crater, and (4) low total electron current from
the electron gun used for charge compensation.
3.3. Isotopic measurements by SIMS
Methods for D/H measurements will be described
in detail in an upcoming paper (Hauri et al., in
preparation); only a brief description will be given
here. The mass spectrometer is operated at low mass
resolution (MRP= 300). Under good vacuum condi-
tions in the ion probe sample chamber ( < 5� 10� 9
Torr), repeated measurements of the H2/D ratio in
volcanic glasses demonstrate that this ratio is always
< 1.5� 10� 3 in glasses ranging from 0.1 to 5.6 wt.%
H2O, permitting dD measurements at the 2–3xlevel
at low mass resolution without hydride corrections.
In order to maximize the instrument sensitivity for H,
a larger field aperture is used (400 mm) in combination
with a smaller image field (100 mm), and the primary
Table 2
Glass standards for hydrogen, carbon and sulfur isotope analysis
Standard name H2O, wt.% dD, x C, ppm d13C, x S, ppm d34S, x References
Basaltic
GL07 D30-1 1.54 � 40 1
GL07 D52-5 1.00 � 51 1
GL07 D53-2 0.77 � 54 1
MK1-2 0.56 � 78 2
GL07 D51-3 0.44 � 52 1
KK29-10 0.38 � 74 3
EN113 20D-1 0.25 � 75 1
EN113 35D-1 0.16 � 44 1
EN113 46D-2 0.11 � 65 1
SAV-C-1 7000 � 8.0 a
ALV981-R23 406 � 5.7 4
ALV519-4-1 980 1.6 a
Andesitic
Run58a 5.68 � 244 a
Run58b 4.45 � 201 a
Run9 4.35 � 47 a
MHA-44 3.70 � 76 1300 � 29.0 5
MHA-41 2.69 � 83 920 � 28.0 5
MHA-30 2.48 � 63 270 � 27.0 5
MHA-25 1.85 � 62 5
MHA-31 1.09 � 81 270 � 27.0 5
Silicic
#71 4.53 � 118 6
#18 2.35 � 140 6
GB37 1.14 � 133 6
MC 84-t 0.79 � 75 7
MC 84-df 0.70 � 69 7
NWCoulee 0.30 � 104 7
Panum Dome 0.12 � 123 7
(1) Dixon and Kingsley, unpublished data.
(2) Garcia et al., 1989.
(3) Rison and Craig, 1983.
(4) Macpherson et al., 1999.
(5) King, unpublished data.
(6) Hervig, personal communication.
(7) Newman et al., 1988.a This study.
E. Hauri et al. / Chemical Geology 183 (2002) 99–114 105

beam is further defocused so that ions from the outer
10 mm of the sputter crater are not admitted into the
mass spectrometer.
The D/H measurements rely on several natural and
synthetic glasses of basaltic, andesitic and rhyolitic
compositions with known compositions and D/H
ratios (Table 2). All of these glasses show excellent
agreement between water determinations by FTIR and
the manometric methods used during D/H analysis via
bulk extraction. Negatively charged H and D ions are
counted at low mass resolution (MRP= 300) and full
transmission using an ETP multiplier and an ECL
counting system (11–14 ns deadtime) at count rates
up to 2 MHz for H. These high H count rates do not
result in short-term degradation of the EM gain
because the low secondary electron yield of H on
the first dynode of the multiplier (i.e. quantum effi-
ciency) does not result in the high fluxes of secondary
electrons at the end of the EM dynode chain typical of
heavier isotopes at similar count rates. At these count
rates, drift in the D/H instrumental mass fractionation
(IMF) is usually < 5x per day.
A typical SIMS D/H analysis requires 20–40 min
to reach 2–3xprecision (1r), limited only by
counting statistics on D. The reproducibility of repeat
measurements is identical to counting statistics for
samples with H2O� 0.5 wt.%, but is sometimes
worse for samples with lower water contents (F 4–
6x1r), particularly among the rhyolite glasses. In
practice, from sample to sample, the primary beam
intensity is adjusted in order to maintain a count rate
of 1–2� 106 cps on H, such that samples with 0.1
wt.% H2O require a beam intensity of about 10–15
nA. The poorer reproducibility on some (but not all)
low-H2O glasses may be indicative of sample hetero-
geneity.
For analysis of C and S isotopes, the mass reso-
lution is increased to 3200 to eliminate several inter-
ferences: 12CH on 13C, 16O2 on 32S, and 33SH and17O2 on 34S. The isotopic standards for d13C include
several andesite glasses and two basalts, one of which
is a natural glass (ALV981-R23 from Macpherson et
al., 1999). The other basalt glass is a synthetic sub-
aerial basalt from Samoa which was doped with
Iceland Spar calcite (d13C =� 8.0F 0.1x, 2r) and
synthesized to a glass at a P–T condition (10 kbar–
1400 �C) which assures that the melt remained under-
saturated with CO2. The resulting CO2 concentration
measured by SIMS is 7000 ppm. The isotopic stand-
ard for d34S is a sulfide-saturated MORB glass (ALV
519-4-1 from FAMOUS) in which dissolved sulfur is
assumed to be isotopically identical to the d34S of co-
existing immiscible sulfides ( + 1.6F 1.0x, 2r).Typical precision and reproducibility on d13C and
d34S depend upon the elemental concentrations, but
is usually in the range of 2–4xfor a 30–60 min
analysis at 100–2000 ppm levels of CO2 and S.
4. Calibration, matrix effects and accuracy
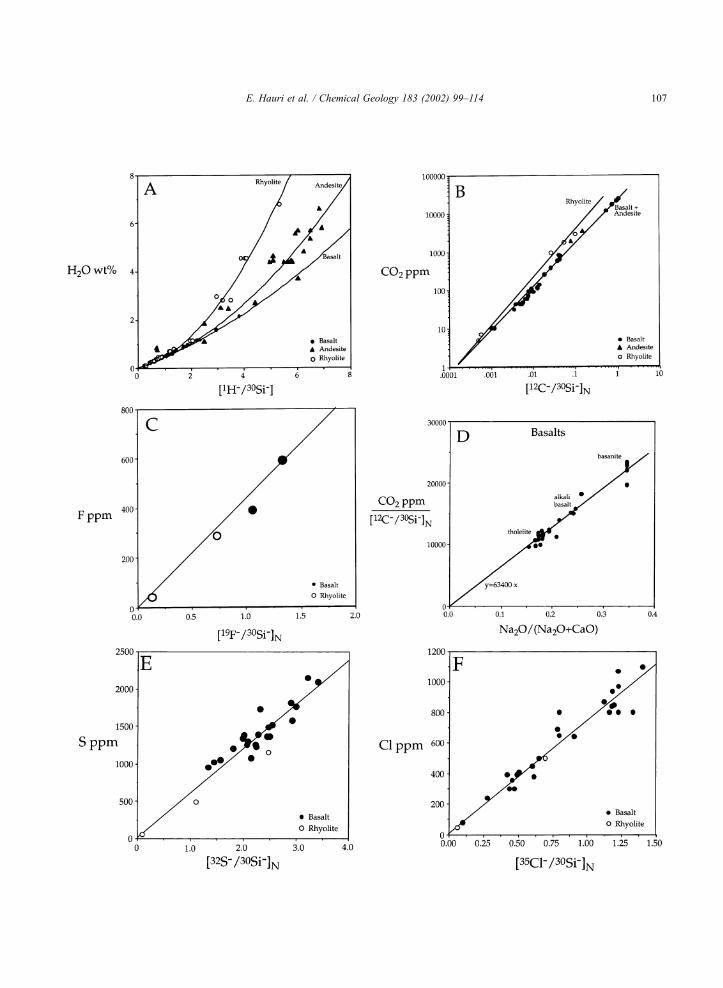
The SIMS calibration curves for H2O, CO2, F, S
and Cl are shown in Fig. 1. The calibrations for H2O
are linear up to 1.5 wt.% H2O, with basalts, andesites
and rhyolites describing a single line (Fig. 1A). At
higher H2O, the calibrations become non-linear and
the three compositional groups begin to deviate from
one another; a similar deviation for basalt was
observed by Sobolev and Chaussidon (1996) using
different analytical conditions. The CO2 calibrations
for basalt and andesite are identical, while the rhyolite
CO2 calibration shows a steeper slope (Fig. 1B). The
other calibration curves (F, S, Cl) are linear over
several orders of magnitude in volatile concentration
for all glasses, with no differences among the three
groups of standards. The calibration curves are all
constrained by a large number of samples of varying
composition. For F, S and Cl, the measured isotope
ratios (19F/30Si, 32S/30Si, 35Cl/30Si) are normalized to
a SiO2 content of 50 wt.% (e.g. multiplied by the ratio
[wt.% SiO2/50]) and then regressed against the stand-
ard concentrations (from FTIR, manometry, and/or
electron probe data). A linear regression is made in
log–log space so that high-concentration standards do
Fig. 1. SIMS calibration curves for abundances of (A) water, (B) carbon dioxide, (C) fluorine, (E) sulfur and (F) chlorine. Panel (D) shows the
SIMS matrix effect on the CO2 calibration, correlated with Na and Ca concentrations of the standard glasses. The H2O calibrations for basalt,
andesite and rhyolite are identical below 1.5 wt.% H2O, but deviate and become non-linear at higher H2O. The other calibrations are linear over
several orders of magnitude in concentration. Detection limits are 10–30 ppm H2O, < 3 ppm CO2, and < 1 ppm for F, S and Cl. Solid circles are
basalts, solid triangles are andesites, and open circles are rhyolites.
E. Hauri et al. / Chemical Geology 183 (2002) 99–114106
E. Hauri et al. / Chemical Geology 183 (2002) 99–114 107

not dominate the slope of the calibration line, and the
calibrations are linear (in linear–linear space) within
error. The scatter of standards about the calibration
lines is the best estimate of accuracy, and averages
10% for all elements.
Most previous efforts at SIMS calibrations for
volatile elements have involved the use of a beam
O � ions and measurement of positively charged
sputtered ions (Hervig, 1992; Sisson and Layne,
1993; Ihinger et al., 1994; Devine et al., 1995;
Deloule et al., 1995; Sobolev and Chaussidon,
1996). This strategy has the advantage of simplified
charge compensation, but the disadvantage of low
sensitivity for electronegative elements such as C, F,
S and Cl and correspondingly poor detection limits.
Improvements in electron charge compensation have
permitted the development of the present technique,
and our efforts have focussed on analysis of a large
number of compositionally diverse standard glasses.
Matrix effects were searched for by calculating slopes
for tie lines between each standard and the origin, and
plotting the slopes against various compositional
parameters. The calibrations for F, S and Cl are free
of significant matrix effects, but the H2O and CO2
abundance calibrations have resolvable matrix effects
which deserve further mention.
4.1. Water
For our technique, the best correlative for water
matrix effects is the H2O content of the standard. Ion
yields for both H and Si decrease with increasing
water content. The water calibrations for basalt, ande-
site and rhyolite are identical below 1.5 wt.% H2O,
but become increasingly different at higher water
contents (Fig. 1A). The average scatter of standards
about the calibration line is 12%, but the comparison
between FTIR and SIMS on the same polished wafers
is better at 8%, comparable to the accuracy of the
FTIR method alone. We consider the accuracy of the
SIMS calibration for water to be accurate to 10% for
compositions ranging from nephelenite through ande-
site to rhyolite.
Another feature we have noted about the H2O
calibration is that the slope of the calibration line
has been observed to change by as much as a factor of
two between analytical sessions, while preserving the
relative positions of all the standards along the cali-
bration line. These changes in slope are unique to the
H2O calibration, and are related to two factors: (1) the
quality of electron gun tuning and corresponding
homogeneity in charge compensation, and (2) the
quantum efficiency (number of secondary electrons
per incident ion) of the electron multiplier for H ions,
which is a sensitive function of multiplier high voltage
and age. In the Cameca 6f instrument, the stray
magnetic field originating from the mass spectrometer
magnet is sufficiently strong to deflect the electron
beam by 20 mm when switching between mass 1 (H)
and mass 35 (Cl), and this has been mediated during
analysis by including a shift in the electron beam
deflection which is correlated with mass. For the
electron multiplier, the efficiency is routinely meas-
ured by comparing count rates on the multiplier and
Faraday cup detectors. If the multiplier efficiency for28Si is kept near 90% (by adjusting multiplier high
voltage), then changes in the H2O calibration slope
are minimized. To check these effects, at the begin-
ning of each analytical session, the H2O calibration is
always redetermined and standards are run frequently
to make sure that the calibration does not drift during
a single analytical session.
4.2. Carbon
For our technique, the best correlative for CO2
matrix effects is the ratio of Na2O/(Na2O+CaO), as
has been observed for FTIR absorbance measure-
ments (Dixon and Pan, 1995). This matrix effect is
resolvable even among the basaltic glasses (nephelen-
ite through tholeiite) (Fig. 1F). The CO2 calibration is
thus constructed by regressing standard concentra-
tions against SiO2-normalized 12C/30Si ratios, the
slopes of which are then adjusted according to the
ratio of Na2O/(Na2O +CaO). The resulting calibration
is linear over almost four orders of magnitude in CO2
abundance, with an accuracy (15%) which is compa-
rable to the accuracy of FTIR measurements.
4.3. Fluorine, sulfur and chlorine
The main advantage of ion probe measurements of
F, S and Cl over electron probe methods is in the
signal-to-background ratio. Typical background meas-
urements on the ion probe are on the order of 0.05–
0.1 counts per second, compared to tens to hundreds
E. Hauri et al. / Chemical Geology 183 (2002) 99–114108
of counts per second for the electron probe. In
particular, F analyses in Fe-bearing materials suffer
from interferences from Fe X-rays, making electron
probe F analysis of basaltic and andesitic glasses
difficult. For the SIMS methods, hundreds of counts
on 19F, 32S and 35Cl are obtained even for measure-
ments of detection limits on San Carlos olivine, with
corresponding signal-to-background ratios of > 1000
in olivine which is nominally free of F, S and Cl. As a
result, ion probe detection limits are better and anal-
ysis times shorter for these elements compared with
existing electron probe methods.
5. Isotopic measurements: hydrogen, carbon, and
sulfur
Hydrogen and carbon isotope analysis of low-H2O
and low-CO2 glasses requires careful attention to
background effects. Despite careful cleaning of glass
surfaces with teflon-distilled water and subsequent
drying of samples in an oven, hydrogen and carbon
contamination of the sample surface is ubiquitous and
unavoidable. Although this surface layer is usually
sputtered through in a matter of seconds, the inter-
section of this layer with the wall of the sputter crater
is a site of continuous formation of contaminant ions.
For both measurements, particular attention must be
paid to centering of the field aperture in the sharply
focused image of the sputter crater, so that ion con-
tributions from the crater walls are entirely eliminated.
Backgrounds for H and C are usually determined by
sputtering of San Carlos olivine, which is thought to
have nominal concentrations of 10 ppm H2O and < 1
ppm CO2. Typical count rates are 1–2� 104 cps 1H
and 2–5 cps 12C, with a measured D/H ratio which is
typically within 50–80xof D/H ratios measured in
standard glasses. We consider these counts to be
dominated by H (and perhaps C) atoms which are
actually present in the olivine crystal, because San
Carlos olivine often plots close to the basalt calibra-
tion curve. As a result, the true instrumental back-
grounds are difficult to quantify, but are routinely
< 10–30 ppm H2O and < 2 ppm CO2, and insignif-
icant for isotopic measurements.
Typically, a 40-mm diameter primary beam is used.
The 400-mm field aperture images a circular area 20
mm in diameter on the sample surface and thereby
masks ions from the outer 10 mm of the crater.
Obtaining a sharp ion image of the sputter crater is
essential for this application, and can be complicated
by the electron gun used for charge compensation.
When the electron current is too high, the electrostatic
field established by the presence of the electron beam
in the secondary ion path results in an ion image
which is degraded. In addition, if the high voltage
setting of the electron beam is not matched perfectly
with the sample voltage, electrons can impact the
sample and produce desorbed H � ions (Hervig et
al., 1992). For these reasons, the electron beam
current is kept to a level twice that which is required
for charge compensation of a 20–40 nA Cs + beam.
SIMS hydrogen isotope measurements of basalt,
andesite and rhyolite glasses are shown in Fig. 2A. The
value of the instrumental mass fractionation (IMF)
factor a (a =D/Hmeasured/D/Htrue) is a complex function
of sample composition, as found for amphiboles under
different analytical conditions (Deloule et al., 1991),
but H2O and Fe content are two important correlatives.
For example, IMF is negatively correlated with H2O
content in all three glass compositions (basalt, ande-
site, rhyolite) but is positively correlated with Fe
content in glasses with similar H2O abundances.
Basalts with < 1 wt.% H2O all show similar IMF
values (Fig. 2A), but rhyolite IMF is a function of
H2O content in this range. The absolute values of avary between analysis sessions, driven by changes
related to quantum efficiency and aging of the electron
multiplier, but the relative differences in IMF among
different standards are constant. A more detailed con-
sideration of D/H matrix effects will be presented
elsewhere (Hauri et al., in preparation).
Carbon isotope data for the natural (406 ppm CO2)
and synthetic (7000 ppm CO2) basalts give the same
IMF to better than 1x, and also give IMF values that
are larger than the andesite glasses (Fig. 2B). Carbon
isotope data for MORB glasses and three Loihi melt
inclusions are shown in Fig. 2C. Several factors
conspire to limit the precision and reproducibility
of d13C analyses of CO2-bearing glasses to about
2–3x, not the least of which is the low abundance
of the element of interest. The requirement of high
mass resolution places limits on the size of the field
aperture used, charge compensation considerations
limit the intensity of the primary beam to < 50 nA,
and control over instrumental mass fractionation pla-
E. Hauri et al. / Chemical Geology 183 (2002) 99–114 109

ces limits on the depth of the sputter crater ( < 50% of
the beam diameter). However, an advantage of SIMS
over vacuum combustion for d13C analyses is the
ability to access directly carbon dissolved in the
silicate glass, thus avoiding problems related to
adsorption, carbonate or seawater alteration and
organic contamination (Mattey et al., 1984), CO2
gas in micro-vesicles (Pineau and Javoy, 1983), and
precipitation of reduced C phases on vesicle walls
(Mathez and Delaney, 1981).
For d34S analyses in basaltic glasses, the instru-
mental mass fractionation factor a is relatively repro-
ducible at 0.990F 0.003; this value is strictly appli-
cable only to relatively low-H2O ( < 1 wt.%) basaltic
Fig. 2. (A) Instrumental mass fractionation (IMF) factors for D/H measurements in silicate glasses (given as the permil deviation of the
measured D/H ratio from the true D/H ratio) against mole fraction of water in the standards. IMF measurements on any single standard are
usually reproducible to F 3 permil (1r), but some glasses show subtle heterogeneity. Significant matrix effects are apparent, as IMF is strongly
correlated with H2O content within each group of glasses. Small numbers beside andesite points (triangles) give the total FeO content. (B) IMF
factors for analysis of carbon isotopes in silicate glasses. Two basalt standards give the same IMF value to within 2x, but the basalts are more
fractionated than the andesites by about 6x. No variation of carbon isotope IMF is apparent within the andesites (1.09–3.70 wt.% H2O). (C)
Carbon isotope data for several MORB H2O standards and three basaltic melt inclusions from Koolau volcano, Hawaii. (D) Sulfur isotope data
for MORB H2O glass standards, showing resolvable S isotope variability.
E. Hauri et al. / Chemical Geology 183 (2002) 99–114110

glasses similar to the ALV 519-4-1 standard. This avalue is different from that measured in our lab on
Fe–Ni–Cu sulfide standards at high mass resolution
(0.96–0.98). Sulfur ion counts for basaltic glasses
(usually >700 ppm S) are sufficiently high that a
count rate of 10e + 6 cps on 32S is easily attainable,
producing an in-run precision of 0.3xin 30 min.
However, reproducibility is typically worse at 1–
2x (Fig. 2D). Sample heterogeneity may be one
explanation for this observation, particularly if tiny
immiscible sulfides (occasionally observed in ion
images) with a values different from glass are sput-
tered during analysis. An equally likely explanation
for this poor reproducibility relates to the fact that
small changes in the primary beam position within the
secondary ion optical image field result in subtle
changes in the position of the ion optic crossover
relative to the entrance slits, which are closed slightly
to achieve the required mass resolution. Since the
crossover is known to be isotopically heterogeneous
in Cameca ion probes (Shimizu and Hart, 1982), these
small changes in beam position may contribute to
errors at the 1–2xlevel. Such problems are absent
in techniques which transmit the entire crossover,
such as for S isotope analyses on sulfides using
energy filtering at low mass resolution (Riciputi,
1996), or techniques utilizing a mass spectrometer
with an intrinsically high minimum mass resolving
power such as the Cameca 1270 or SHRIMP.
6. Applications
In its current state of development, we regard the
SIMS techniques for measuring volatiles as being
superior to existing electron probe methods, and
complementary to current FTIR methods. Infrared
spectroscopy provides important quantitative informa-
tion on volatile speciation which is not obtainable by
SIMS, and this information is critical to studies of
stable isotope fractionation of volatile species (Taylor,
1988), low-temperature alteration (Dixon et al., 1997),
and for understanding diffusion (Zhang and Stolper,
1991). With sufficient absorbance, FTIR techniques
also may provide a better detection limit for H2O than
SIMS, making possible the analysis of nominally
anhydrous minerals (Bell and Rossman, 1992), but
SIMS calibration efforts for such minerals are begin-
ning to improve (Koga et al., unpublished data). The
SIMS technique offers ease of sample preparation,
adequate detection limits for most studies, and the
capability to obtain stable isotope data for hydrogen
and, if present in sufficient quantity, carbon and sulfur.
Both techniques offer the advantages of rapid analysis
and micron-scale spatial resolution.
The techniques described above have obvious
utility in studies of volatile degassing during volcanic
eruptions. Fig. 3 shows the H2O and D/H data
obtained by SIMS for the four Mono Craters rhyolite
standards, compared with FTIR data for H2O and gas-
source mass spectrometry data on bulk glass separates
reported by Newman et al. (1988). Except for the
previously mentioned discrepancy for the H2O con-
tent of our North Coulee glass sample (not plotted),
the two data sets show good agreement. Combined
with FTIR data on hydrogen speciation in these
glasses, the data fit well the model of Newman et al.
(1988) in which the vapor-melt D/H fractionation
factor changes with water content and H-speciation.
Similar H2O and D/H measurements can be obtained
on melt inclusions contained in phenocrysts from
Fig. 3. H2O and dD data for Mono Craters rhyolite glasses,
comparing data obtained by conventional vacuum extraction mass
spectrometry (open symbols, Newman et al., 1988) and data
obtained by SIMS (closed symbols, this study). The SIMS H2O and
D/H data were corrected for matrix effects using calibrations
constrained by all standards. SIMS data were obtained on separate
fragments from the same hand specimens used for the vacuum
extractions, and the results show good agreement.
E. Hauri et al. / Chemical Geology 183 (2002) 99–114 111

silicic eruptions; when combined with CO2 measure-
ments, such data have the potential to provide impor-
tant in information on volatile zonation of silicic
magma chambers prior to eruption (Wallace et al.,
1995).
Carbon isotope data are shown in Fig. 2C for
several MORB glass H2O standards. Data for d13Cin the MORB glasses cluster around a value of
� 8.0F 3x, close the proposed mantle value of
� 5x(Pineau and Javoy, 1983; Mattey et al.,
1984). Three melt inclusions from a Koolau (Hawaii)
basalt, however, show variable depletion in 13C
reaching values of d13C of � 29x. Due to the
mass fractionation between dissolved carbonate and
CO2 vapor at magmatic temperatures, these very
depleted d13C values could have been generated by
open-system CO2 loss, but the slope of the trend with
CO2 content is too shallow for degassing with a
4xfractionation between CO2 vapor and dissolved
carbonate (Javoy et al., 1978). An additional possi-
bility is mixing between highly degassed and unde-
gassed magma batches (Dixon et al., 1991), but the
generally moderate CO2 contents of these melt inclu-
sions (250–550 ppm) would require initial CO2
contents of several thousand parts per million to
reach a d13C value of � 5x. Although these postu-
lated CO2 abundances are high, they are consistent
with several similar determinations (Pineau and
Javoy, 1983; Des Marais and Moore, 1984; Green-
land et al., 1985; Gerlach and Graeber, 1985). The
isotopically depleted CO2 contained within melt
inclusions demonstrate conclusively the presence of
isotopically depleted carbon dissolved in the glass,
and suggests that magmatic degassing could be
capable of producing large C isotope shifts. Thus
the origin of very low d13C values in volcanic glasses
are not uniquely explained by organic carbon con-
tamination (Mattey et al., 1984) or by late-stage
precipitation of carbonaceous phases within vesicles
(Mathez and Delaney, 1981).
Isotope data for some volatile elements may also
provide information on magma source compositions.
Fig. 2D shows sulfur isotope data for three of our
MORB glass H2O standards. Sample 40-2 is a
strongly LREE-depleted N-type MORB glass, sample
30-2 is a LREE-enriched E-type MORB, and 519-4-1
is transitional. There are resolvable isotopic differ-
ences between these three samples. Because the
samples were erupted at >1000 m depth on the
seafloor and are H2O-undersaturated, it is very
unlikely that they have degassed significant amounts
of sulfur. Possibilities to explain the data include
high-temperature S isotope fractionations during melt-
ing or segregation of immiscible sulfides, assimilation
of seawater sulfate in the crust, or mantle heteroge-
neity.
7. Conclusions
This report demonstrates the advantages of SIMS
in sensitivity, rapidity and detection limits over other
microbeam methods for analysis of volatiles in
silicate glasses. Indeed, the sensitivity is sufficiently
high to permit useful isotopic measurement of H, C
and S dissolved in quenched silicate melts. This
technique is applicable to the study of submarine
and subaerial volcanic glasses as well as laboratory
melting experiments. The study of volatile abundan-
ces in phenocryst-hosted melt inclusions is one area
where the strengths of the SIMS volatile techniques
become highly advantageous. Though many IR stud-
ies of melt inclusions have been reported (e.g. An-
derson and Brown, 1993; Clague et al., 1996;
Wallace and Anderson, 1998), preparation of doubly
polished wafers of small inclusions is time-con-
suming and difficult, and the polished inclusions
must be thick enough to permit accurate absorbance
measurements. These factors mitigate against ana-
lyzing large numbers of inclusions, and introduces
a potential bias against small inclusions. Melt in-
clusions down to 10–15 mm in diameter can be
analyzed for volatile abundances by SIMS, and
the use of singly polished grain mounts makes
possible the rapid preparation of a large number
of inclusions. In particular, the SIMS techniques
described here offer the possibility of obtaining iso-
topic information for H, C and S in melt inclusions
when these elements are present in sufficient quanti-
ties. When applied to melt inclusions from Hawaii
(Hauri, 2001), combined data for volatile abundan-
ces and isotopic compositions reveal several pro-
cesses which influence magmatic volatile contents.
Indeed, several of these processes would escape de-
tection altogether in the absence of a complete vo-
latile dataset.
E. Hauri et al. / Chemical Geology 183 (2002) 99–114112
Acknowledgements
We thank Alex Sobolev for providing MORB
glasses 30-2 and 40-2, Rick Hervig for loans of ion
probe mounts and illuminating discussions, Richard
Kingsley and Bruce Taylor for D/H measurements,
and Dave Virgo for uncovering and donating a
number of H2O-bearing glasses from the olden days.
Thanks also to Colin Macpherson and David Hilton
for providing sample ALV981-R23 as a C isotope
standard, and Jean Guy-Schilling and Richard Kings-
ley for basalt glasses from the Pacific Ocean.
Acquisition of the DTM ion microprobe was made
possible by funds from NSF, the Carnegie Institution
of Washington, the W.M. Keck Foundation, the
Smithsonian Institution, the USGS and Dr. Robert
Goelet. The paper was improved by thorough reviews
from John Eiler, Marc Chaussidon and Paul Wallace.
This work was supported by NSF grants EAR-
9413985 and OCE-9712278 to EHH.
References
Anderson, A.T., Brown, G.G., 1993. CO2 and formation pressures
of some Kilauea melt inclusions. Am. Mineral. 78, 794–803.
Bell, D.R., Rossman, G.R., 1992. Water in the Earth’s mantle: the
role of nominally anhydrous minerals. Science 255, 1391–
1397.
Byers, C.D., Garcia, M.O., Muenow, D.W., 1985. Volatiles in pillow
rim glasses from Loihi and Kilauea volcanoes, Hawaii. Geo-
chim. Cosmochim. Acta 49, 1887–1896.
Clague, D.A., Moore, J.G., Dixon, J.E., Friesen, W.B., 1996. Pet-
rology of submarine lavas from Kilauea’s Puna Ridge, Hawaii.
J. Petrol. 36, 299–349.
Delaney, J.R., Karsten, J.L., 1981. Ion microprobe studies of water
in silicate melts: concentration dependent water diffusion in
obsidian. Earth Planet. Sci. Lett. 52, 191–202.
Deloule, E., France-Lanord, C., Albarede, F., 1991. D/H analysis of
minerals by ion probe. In: Taylor, H.P., O’Neil, J., Kaplan, I.R.
(Eds.), Stable Isotope Geochemistry: A Tribute to Samuel Ep-
steinGeochemical Society, Special Publication, vol. 3, 53–62.
Deloule, E., Paillat, O., Pichavant, M., Scaillet, B., 1995. Ion mi-
croprobe determination of water in silicate glasses: methods and
applications. Chem. Geol. 125, 19–28.
Des Marais, D.J., Moore, J.G., 1984. Carbon and its isotopes in
mid-oceanic basaltic glasses. Earth Planet. Sci. Lett. 69, 43–57.
Devine, J.D., Gardner, J.E., Brack, H.P., Layne, G.D., Rutherford,
M.J., 1995. Comparison of microanalytical methods for estimat-
ing H2O contents of silicic volcanic glasses. Am. Mineral. 80,
319–328.
Dixon, J.E., Clague, D.A., 2001. Volatiles in basaltic glasses from
Loihi Seamount, Hawaii: evidence for a relatively dry plume
component. J. Petrol. 42, 627–654.
Dixon, J.E., Pan, V., 1995. Determination of the molar absorptivity
of dissolved carbonate in basanitic glass. Am. Mineral. 80,
1339–1342.
Dixon, J.E., Stolper, E.M., 1995. An experimental study of water and
carbon dioxide solubilities in mid-ocean ridge basaltic liquids:
Part II. Applications to degassing. J. Petrol. 36, 1633–1646.
Dixon, J.E., Stolper, E., Delaney, J.R., 1988. Infrared spectroscopic
measurements of CO2 and H2O in Juan de Fuca Ridge basaltic
glasses. Earth Planet. Sci. Lett. 90, 87–104.
Dixon, J.E., Clague, D.A., Stolper, E.M., 1991. Degassing history
of water, sulfur and carbon in submarine lavas from Kilauea
volcano, Hawaii. J. Geol. 99, 371–394.
Dixon, J.E., Clague, D.A., Wallace, P., Poreda, R., 1997. Volatiles in
alkalic basalts from the North Arch volcanic field, Hawaii: ex-
tensive degassing of deep submarine-erupted alkalic series
lavas. J. Petrol. 38, 911–939.
Fine, G., Stolper, E.M., 1985. The speciation of carbon dioxide in
sodium aluminosilicate glasses. Contrib. Mineral. Petrol. 91,
105–121.
Fine, G., Stolper, E.M., 1986. Dissolved carbon dioxide in basaltic
glasses: concentration and speciation. Earth Planet. Sci. Lett. 76,
263–278.
Fogel, R.A., 1989. The role of H–C–O–S volatile in planetary
igneous processes. PhD Thesis, Brown University, Providence,
RI.
Fogel, R.A., Rutherford, M.J., 1990. The solubility of carbon diox-
ide in rhyolitic melts: a quantitative FTIR study. Am. Mineral.
75, 1311–1326.
Garcia, M.O., Muenow, D.W., Aggrey, K.E., O’Neil, J.R., 1989.
Major element, volatile and stable isotope geochemistry of Ha-
waiian submarine tholeiitic glasses. J. Geophys. Res. 94,
10525–10538.
Gerlach, T.M., Graeber, E.J., 1985. Volatile budget of Kilauea vol-
cano. Nature 313, 273–277.
Greenland, L.P., Rose, W.I., Stokes, J.B., 1985. An estimate of gas
emissions and magmatic gas content from Kilauea volcano.
Geochim. Cosmochim. Acta 49, 125–129.
Grzechnik, A., Zimmermann, H.D., Hervig, R.L., King, P.L., Mc-
Millan, P.F., 1996. FTIR micro-reflectance measurements of the
CO3� ion content in basanitic and leucitite glasses. Contrib.
Mineral. Petrol. 125, 311–318.
Hauri, E.H., 2002. SIMS investigations of volatiles in volcanic
glasses, 2: isotopes and abundances in Hawaiian melt inclu-
sions. Chem. Geol.
Hauri, E.H., Wang, J., Dixon, J.E., King, P., Mandeville, C., New-
man, S., 2002. Sputtering and matrix effects during SIMS anal-
ysis of hydrogen isotopes in silicate glasses. Chem. Geol. (in
preparation).
Hervig, R.L., 1992. Ion probe microanalyses for volatile elements in
melt inclusions (abst.). EOS Trans. Am. Geophys. Union 73,
367.
Hervig, R.L., Williams, P., Thomas, R.M., Schauer, S.N., Steele,
I.M., 1992. Microanalysis of oxygen isotopes in insulators by
secondary ion mass spectrometry. Int. J. Mass Spectrom. Ion
Proc. 120, 45–63.
E. Hauri et al. / Chemical Geology 183 (2002) 99–114 113

Hinthorne, J.R., Anderson, C.A., 1975. Microanalysis of fluorine
and hydrogen in silicates with the ion microprobe mass analyzer.
Am. Mineral. 60, 143–147.
Hoskin, P.W.O., 1999. SIMS determination of mg/g-level fluorine ingeogical samples and its concentration in NIST SRM 610. Geo-
stand. Newsl. 23, 69–76.
Ihinger, P., Hervig, R.L., McMillan, P.F., 1994. Analytical methods
for volatiles in glasses. In: Valley, J.W., Taylor, H.P., O’Neil,
J.R. (Eds.), Stable Isotopes in High Temperature Geologic Pro-
cesses. Mineralogical Society of America, Chelsea, MI, pp. 67–
121.
Javoy,M., Pineau, F., Iiyama, I., 1978. Experimental determination of
the isotopic fractionation between gaseous CO2 and carbon dis-
solved in tholeiitic magma. Contrib. Mineral. Petrol. 67, 35–39.
King, P.L., 1999. C–O–H Volatiles in Igneous Rocks: Experimen-
tal and Natural Studies of Hydrous Minerals and Glasses. PhD
thesis, Arizona State University, Tempe, AZ.
Macpherson, C.G., Hilton, D.R., Newman, S., Mattey, D.P., 1999.
CO2,13C/12C and H2O variability in natural basalt glasses: a
study comparing stepped heating and FTIR spectroscopic tech-
niques. Geochim. Cosmochim. Acta 63, 1805–1813.
Mathez, E.A., Delaney, J.R., 1981. The nature of carbon in sub-
marine basalts and peridotite nodules. Earth Planet. Sci. Lett. 56,
217–232.
Mattey, D.P., Carr, R.C., Wright, I.P., Pillinger, C.T., 1984. Carbon
isotopes in submarine basalts. Earth Planet. Sci. Lett. 70, 196–
206.
Mackwell, S.J., Kohlstedt, D.L., 1990. Diffusion of hydrogen in
olivine: implications for water in the mantle. J. Geophys. Res.
95, 5079–5088.
Michael, P., 1995. Regionally distinctive sources of depleted
MORB: evidence from trace elements and H2O. Earth Planet.
Sci. Lett. 131, 301–320.
Newman, S., Stolper, E.M., Stolper, E., 1986. Measurement of
water in rhyolitic glasses: calibration of an infrored spectro-
scopic technique. Am. Miner. 71, 1527–1541.
Newman, S., Epstein, S., Stolper, E., 1988. Water, carbon dioxide,
and hydrogen isotopes in glasses from the ca. 1340 A.D. erup-
tion of the Mono craters, California: constraints on degassing
phenomena and initial volatile content. J. Volcanol. Geotherm.
Res. 35, 75–96.
Pineau, F., Javoy, M., 1983. Carbon isotopes and concentrations in
mid-ocean ridge basalts. Earth Planet. Sci. Lett. 62, 239–257.
Riciputi, L.R., 1996. A comparison of extreme energy filtering and
high mass resolution techniques for the measurement of 34S/32S
ratios by ion microprobe. Rapid Commun. Mass Spectrom. 10,
282–286.
Rison, W., Craig, H., 1983. Helium isotopes and mantle volatiles in
Loihi seamount and Hawaiian Island basalts and xenoliths.
Earth Planet. Sci. Lett. 66, 407–426.
Shimizu, N., Hart, S.R., 1982. Applications of the ion microprobe to
geochemistry and cosmochemistry. Annu. Rev. Earth Planet.
Sci. 10, 483–526.
Silver, L.A., Ihinger, P.D., Stolper, E.M., 1990. The influence of
bulk composition on the speciation of water in silicate glasses.
Contrib. Mineral. Petrol. 104, 142–162.
Sisson, T.W., Layne, G.D., 1993. H2O in basalt and basaltic andesite
glass inclusions from four subduction-related volcanoes. Earth
Planet. Sci. Lett. 117, 619–635.
Sobolev, A.V., Chaussidon, M., 1996. H2O concentrations in pri-
mary melts from supra-subduction zones and mid-ocean ridges:
implications for H2O storage and recycling in the mantle. Earth
Planet. Sci. Lett. 137, 45–55.
Stolper, E., 1982. Water in silicate glasses: an infrared spectroscopic
study. Contrib. Mineral. Petrol. 81, 1–17.
Stolper, E.M., Holloway, J.R., 1988. Experimental determination of
the solubility of carbon dioxide in molten basalt at low pressure.
Earth Planet. Sci. Lett. 87, 397–408.
Stolper, E.M., Newman, S., 1994. The role of water in the petro-
genesis of Mariana Trough magmas. Earth Planet. Sci. Lett. 121,
293–325.
Taylor, B.E., 1988. Magmatic volatiles: isotopic variation of H, C
and S. In: Valley, J.W., Taylor, H.P., O’Neil, J.R. (Eds.), Stable
Isotopes in High Temperature Geologic Processes. Mineralogi-
cal Society of America, Chelsea, MI, pp. 185–225.
Wallace, P.J., Anderson, A.T., 1998. Effects of eruption and lava
drainback on the H2O contents of basaltic magmas at Kilauea
volcano. Bull. Volcanol. 59, 327–344.
Wallace, P.J., Wallace Jr., A.T.A., Davis, A.M. 1995. Quantification
of pre-eruptive exsolved gas contents in silicic magmas. Nature
377, 612–616.
Zhang, Y., Stolper, E.M., 1991. Water diffusion in a basaltic melt.
Nature 351, 306–309.
Zhang, Y., Belcher, R., Ihinger, P.D., Wang, L., Xu, Z., Newman, S.,
1997. New calibration of infrared measurement of dissolved
water in rhyolitic glasses. Geochim. Cosmochim. Acta 61,
3089–3100.
E. Hauri et al. / Chemical Geology 183 (2002) 99–114114
Copyright © 2022 FDOKUMEN