
a study of some neutron-rich isotopes - International Nuclear ...

www.elsevier.com/locate/chemgeo
Chemical Geology 223
SIMS analyses of oxygen isotopes: Matrix effects in
Fe–Mg–Ca garnets
Daniel Vielzeuf a,*, Michel Champenois b, John W. Valley c,
Fabrice Brunet d, J.L. Devidal e
a CRMCN–CNRS, Campus de Luminy, case 913, 13288 Marseilles Cedex 9, Franceb CRPG–CNRS, 15 rue Notre-Dame des Pauvres, 54501 Vandoeuvre-les-Nancy, France
c Department of Geology and Geophysics, University of Wisconsin, Madison, WI 53706, USAd Laboratoire de Geologie–Ecole Normale Superieure — 24 rue Lhomond, 75231 Paris, France
e Laboratoire Magmas et Volcans, Universite Blaise Pascal — CNRS, 5, rue Kessler, 63038 Clermont-Ferrand, France
Received 9 November 2004; received in revised form 2 July 2005; accepted 25 July 2005
Abstract
Large instrumental mass fractionation (IMF) may occur during measurements of oxygen isotope ratios by SIMS. Part of this
fractionation depends on crystal structure and mineral composition. In order to improve the accuracy of SIMS measurements,
we gathered 6 commonly used garnet standards and prepared 6 others to adequately cover the composition range Alm0–73, Prp0–
99, Grs0–20. Electron microprobe analyses were performed at UBP-Clermont to check the chemical homogeneity of these
standards. Oxygen isotope compositions were determined by laser fluorination and mass spectrometry at UW-Madison. Ten
SIMS sessions and 336 d18O measurements at CRPG-Nancy, on a Cameca IMS1270 instrument, demonstrate that the standards
are homogeneous with external reproducibility of 0.3x (1r). In terms of d18O, SIMS measurements indicate that, during a
single session, IMF can vary up to 6.3x from one garnet standard to another. In most of the sessions, IMF can be correlated
with the grossular content. However, for a satisfactory correction scheme, we suggest the combination of the 3 main
components (Ca, Fe, Mg). This is done using a simple least square calculation routine. The correction coefficients determined
for each session can be used to calculate the IMF and correct the measured isotopic ratio of a garnet of known chemical
composition. This way, we were able to reproduce the d18O values of most of the Fe–Mg–Ca garnet standards within F0.6x.
Interestingly, the use of only 3 end-member standards (AlmCMG, PrpMM, GrsSE) plus a standard of intermediate composition
(e.g. UWG-2) is sufficient to reproduce d18O within the same precision. Thus, linear interpolation among end-member
standards is satisfactory in the case of the garnet solid-solutions. Two studies carried out on zoned garnets from the Alps
and the Pyrenees indicate that matrix effects become significant when variations in grossular contents are important (N10%). In
order to obtain reliable isotope ratio measurements on Fe–Mg–Ca garnets using a SIMS, we suggest a correction scheme using
at least 3 reliable end-member standards plus a standard of intermediate composition (a garnet standard closest to the average
0009-2541/$ - s
doi:10.1016/j.ch
* Correspondin
E-mail addre
(2005) 208–226
ee front matter D 2005 Elsevier B.V. All rights reserved.
emgeo.2005.07.008
g author.
ss: [email protected] (D. Vielzeuf).

D. Vielzeuf et al. / Chemical Geology 223 (2005) 208–226 209
composition of the analysed garnet). This allows cross-checking and incorporates a correction based on the variations in
composition of zoned crystals.
D 2005 Elsevier B.V. All rights reserved.
Keywords: Ion microprobe; Oxygen isotopes; Matrix effects; Garnet standards
1. Introduction
A major advance in understanding the dynamics of
geological systems comes from the development of in
situ analytical techniques with micrometer (Am) spa-
tial resolutions. Secondary Ion Mass Spectrometry
(SIMS) allows the analysis of oxygen isotopic ratios
in minerals at a fine scale. However, large instrumen-
tal mass fractionation (IMF) occurs during such mea-
surements. Part of this fractionation may depend on
mineral type and composition, this is commonly
referred as a bmatrix effectQ (e.g. Eiler et al., 1997).In order to improve the precision and accuracy of
SIMS measurements, a better knowledge of the matrix
effect is required for each mineral group, this is
particularly important for those with multiple solid-
solutions. Indeed, such mineral series are particularly
interesting for petrological studies since they are able
to record changes of geological conditions through
major, trace and isotopic zoning which are often
combined, for instance in single zoned garnet crystals.
In such situations, it is important to determine whether
Fig. 1. Garnet standards in the Alm+Spe, Prp, Grs+And triangle.
oxygen isotopic heterogeneities are real or just instru-
mental artefacts associated with variations in major
element concentrations. As noted by Riciputi and
Paterson (1994) and Eiler et al. (1997), SIMS analysis
of zoned crystals is a difficult task because the varia-
tion of solid solution end-members and its potential
effect on oxygen ratio determinations cannot be cor-
rected using a single standard. On the other hand, the
linear interpolation among end-member standards
may introduce large errors in some cases (Eiler et
al., 1997). Thus, specific measurements to character-
ize the matrix effect in each mineral series must be
carried out.
The garnet group is a complex solid solution series
(see Table 2), particularly important for hydrothermal,
metamorphic and magmatic studies. In this paper, we
present 336 SIMS determinations of 18O/ 16O ratios in
twelve Fe–Mg–Ca (–Mn) garnets (Fig. 1), with
known and independently determined 18O/ 16O ratios.
The aim is to characterize specific matrix effects and
propose a simple and reliable correction scheme
applicable to this mineral group for oxygen isotope
analysis by SIMS. We did not focus our attention on
the manganese component in garnet, particularly
important for studying hydrothermal systems, since
the grossular–spessartine join has been considered
elsewhere (Jamtveit and Hervig, 1994; Riciputi et
al., 1998).
2. Garnet standards: major and trace element
contents, and oxygen isotope ratios
2.1. Origin
Five garnet standards, with previously determined18O/ 16O ratio, were gathered (Table 1). The following
garnets AlmSE, AlmCMG, GrsSE and SpeSE were
used by Eiler et al. (1997) in their study of matrix
effects in complex minerals. These are various gem
garnets, selected for their clarity and absence of

Table 1
Garnet standards analyzed for 18O/ 16O by SIMS
Name Main components Composition d18O per mila
2B3 Almandine–Grossular Alm66Grs20And7Spe4Prp3 6.9
AlmCMG Almandine–Pyrope Alm68Prp26Spe2And2Grs1 7.5
AlmSE Almandine–Pyrope Alm73Prp26And1 8.3
Bal509 Almandine–Pyrope Alm50Prp46And3Spe1 12.3
h114 Almandine–Pyrope Alm58Prp34And5Grs2Spe1 9.3
GrsSE Grossular Grs93And3Spe1Alm1TiAl1 3.8
PrpAA Pyrope Prp71Alm15Uv6And4Grs2Spe1 5.5
PrpAk Pyrope Prp67Alm20Uv4Grs4And4Spe1 5.5
PrpDM Pyrope Prp99And1 5.6
PrpMM Pyrope Prp65Alm23And5Grs4TiAl2Spe1 5.3
SpeSE Spessartine Spe94Alm6 5.4
UWG-2 Pyrope–Almandine Prp43Alm42Grs11And4Spe1 5.8
a Determined by conventional laser fluorination technique.
D. Vielzeuf et al. / Chemical Geology 223 (2005) 208–226210
defects, bought at gemmological trade shows, for use
as diffusion samples (Elphick et al., 1985). The exact
origin is unknown except for the SpeSE sample com-
ing from Pala area in California. The fifth one UWG-2
is at present the best characterized garnet standard for
oxygen isotope analysis, prepared from a single large
porphyroblast in granulite facies mafic amphibolite
from the Gore Mountain mine, Adirondack Moun-
tains, NY, USA (Valley et al., 1995).
In addition to these, seven other garnet separates
were prepared and analysed for 18O/ 16O ratios (Table
1). PrpMM is derived from a gem quality single
garnet megacryst from the Monastery Kimberlite
pipe, South Africa (Moore, 1986). Another garnet
from Monastery Mine has already been used as an
oxygen standard by Harris et al. (2000). PrpDM
comes from a large porphyroblast of pyrope in a
quartzite from high-grade blueschists of the Western
Alps, Dora Maira massif, Italy (Chopin, 1984). PrpAA
was extracted from a garnet peridotite from Alpe
Arami in the Central Alps, Switzerland (Nimis and
Trommsdorff, 2001). PrpAk is a pyrope-rich garnet
from a garnet peridotite (Almklovdalen) in the Wes-
tern Gneiss Region of Norway (Medaris, 1984).
Bal509 comes from a metapelitic granulite found as
a xenolith in a late Tertiary alkaline volcano from the
Velay area, Massif Central, France (Leyreloup et al.,
1977). b114 was extracted from a paragneiss of the
High Himalaya Crystalline Formation 1 of the Lam-
jung (Central Nepal). The paragenesis includes two
micas, garnet and kyanite (France-Lanord et al.,
1988). Finally, 2B3 was prepared from a Qtz–Kfs–
Cpx–Grt igneous rock within a diorite–norite complex
in the Pyrenees (Vielzeuf, 1984).
2.2. Chemical and physical properties
Garnet grains of the different standards were
mounted in epoxy. Depending on the original quality
of the garnet crystals and the abundance of mineral
inclusions, the grain size after light crushing or grind-
ing varies from 0.2 mm (UWG-2) up to 5 mm in the
case of gem quality garnets (e.g. PrpAA or PrpMM).
872 electron microprobe (EMP) analyses were per-
formed using a Cameca SX100 electron microprobe at
Universite Blaise Pascal, Clermont-Ferrand, in order
to precisely determine the chemical composition of
these garnets and check for their homogeneity. Oper-
ating conditions were 15 kV accelerating voltage, and
10 nA sample current. The counting times were 10 s
on peak and 5 s on the background. Three spectro-
meters were used simultaneously and the following
standards were used for calibration: natural albite (Si),
Al2O3 (Al), synthetic Fe2O3 (Fe), olivine (Mg), wol-
lastonite (Ca), MnTiO3 (Mn, Ti), Cr2O3 (Cr), and a
glass with 1000 ppm P2O5 (P). The ZAF correction
procedures were applied. For the calculation of struc-
tural formulae, the program VFNorm written by P.
Ulmer at ETH Zurich was used. Seven end-members
were taken into consideration (see Table 2). The low
standard deviations (1r) calculated for each element
confirm the absence of important chemical heteroge-
neities in these garnets. Molar weights were calculated
using the end-member proportions of each standard

Table 2
Chemical compositions, structural formulae and end-member proportions of the 12 garnet standards used in this study
Garnet end members
Mol. wt. (g/mol) Mol. vol. (cc/mol) Ionic por. (Z)a (%)
General formula of the major components: (X2+)3 ( Y3+)2 (SiO4)3
X2+ Y3+
Almandine Fe Al 497.76 115.3 25.1
Pyrope Mg Al 403.17 112.6 24.3
Spessartine Mn Al 495.03 118.1 26.2
Grossular Ca Al 450.45 125.3 27.3
Andradite Ca Fe 508.21 131.7 30.5
Uvarovite Ca Cr 500.53 130.7 –
Minor component:
Ti–Al garnet Ca3 Ti2 Al2Si O12 490.07 – –
Sample AlmCMG AlmSE PrpDM PrpAk PrpAA PrpMM GrsSE SpeSE 2B3 Bal509 h114 UWG-2
d18O (x) 7.5 8.3 5.6 5.5 5.5 5.3 3.8 5.4 6.9 12.3 9.3 5.8
Chemical compositions of the 12 garnet standards (wt.%)
SiO2 37.72 37.47 44.56 41.35 41.71 41.36 39.16 35.52 36.33 39.43 38.17 39.36
TiO2 0.02 0.00 0.02 0.10 0.12 0.92 0.54 0.09 0.04 0.02 0.01 0.06
Al2O3 21.57 21.42 25.30 22.39 22.23 21.66 22.21 20.40 19.86 22.55 21.73 22.38
P2O5 0.05 0.09 0.12 0.01 0.01 0.04 0.02 0.11 0.01 0.06 0.01 0.03
Cr2O3 0.02 0.00 0.01 1.54 2.07 0.03 0.02 0.00 0.00 0.06 0.03 0.01
Fe2O3 0.74 0.98 1.32 1.47 1.62 1.75 1.12 0.22 2.33 1.10 1.58 1.38
FeO 30.94 32.85 0.00 9.89 7.62 11.39 0.40 2.68 28.72 23.53 26.57 19.65
MnO 1.06 0.17 0.02 0.37 0.40 0.34 0.69 39.50 1.80 0.25 0.63 0.41
MgO 6.63 6.47 29.80 18.57 19.96 18.44 0.01 0.00 0.68 12.27 8.74 11.24
CaO 1.09 0.35 0.32 4.85 4.99 4.50 36.09 0.07 9.16 1.28 2.27 5.53
Total 99.84 99.80 101.47 100.54 100.73 100.43 100.26 98.59 98.93 100.55 99.74 100.05
Standard deviation (1r) in wt.%
Nb An. 68 95 53 117 56 205 33 22 51 58 36 78
SiO2 0.36 0.48 0.52 0.44 0.43 0.50 0.28 0.33 0.57 0.39 0.30 0.35
TiO2 0.02 0.02 0.03 0.04 0.04 0.05 0.06 0.04 0.03 0.03 0.02 0.03
Al2O3 0.14 0.21 0.21 0.24 0.15 0.19 0.15 0.14 0.26 0.18 0.17 0.17
Cr2O3 0.03 0.02 0.01 0.21 0.11 0.02 0.02 0.01 0.01 0.03 0.02 0.02
FeO2 0.29 0.32 0.31 0.28 0.28 0.29 0.08 0.10 0.41 0.23 0.36 0.47
MnO 0.06 0.04 0.03 0.04 0.04 0.04 0.03 0.20 0.12 0.04 0.14 0.04
MgO 0.09 0.20 0.30 0.16 0.18 0.13 0.01 0.01 0.05 0.12 0.37 0.15
CaO 0.05 0.04 0.21 0.14 0.14 0.08 0.22 0.02 0.31 0.07 0.19 0.25
Number of atoms on the basis of 12 oxygens
Si 2.9706 2.9634 2.9639 2.9643 2.9615 2.9790 2.9499 2.9705 2.9687 2.9622 2.9585 2.9618
Ti 0.0012 0.0001 0.0011 0.0053 0.0063 0.0499 0.0304 0.0056 0.0025 0.0014 0.0006 0.0031
Al 2.0015 1.9961 1.9836 1.8914 1.8599 1.8386 1.9714 2.0105 1.9128 1.9966 1.9851 1.9853
P 0.0031 0.0062 0.0066 0.0009 0.0007 0.0022 0.0012 0.0076 0.0005 0.0035 0.0009 0.0020
Cr 0.0015 0.0002 0.0004 0.0874 0.1161 0.0017 0.0011 0.0002 0.0001 0.0034 0.0019 0.0006
Fe3+ 0.0441 0.0580 0.0659 0.0793 0.0863 0.0951 0.0633 0.0141 0.1431 0.0623 0.0920 0.0782
Fe2+ 2.0375 2.1727 0.0000 0.5927 0.4525 0.6859 0.0255 0.1872 1.9629 1.4782 1.7222 1.2364
Mn 0.0709 0.0112 0.0010 0.0222 0.0243 0.0208 0.0438 2.7975 0.1243 0.0160 0.0410 0.0260
Mg 0.7778 0.7621 2.9547 1.9842 2.1127 1.9793 0.0007 0.0004 0.0831 1.3737 1.0092 1.2606
Ca 0.0918 0.0299 0.0228 0.3724 0.3798 0.3473 2.9128 0.0063 0.8020 0.1027 0.1884 0.4460
(continued on next page)
D. Vielzeuf et al. / Chemical Geology 223 (2005) 208–226 211

Table 2 (continued)
Sample AlmCMG AlmSE PrpDM PrpAk PrpAA PrpMM GrsSE SpeSE 2B3 Bal509 h114 UWG-2
d18O (x) 7.5 8.3 5.6 5.5 5.5 5.3 3.8 5.4 6.9 12.3 9.3 5.8
End members proportions
Grossular 0.007 0.000 0.000 0.038 0.022 0.042 0.929 0.000 0.196 0.001 0.016 0.109
Almandine 0.684 0.730 0.000 0.199 0.152 0.226 0.009 0.063 0.660 0.498 0.582 0.416
Pyrope 0.261 0.256 0.992 0.668 0.712 0.653 0.000 0.000 0.028 0.462 0.341 0.425
Spessartine 0.024 0.004 0.000 0.007 0.008 0.007 0.015 0.935 0.042 0.005 0.014 0.009
Andradite 0.022 0.010 0.008 0.040 0.044 0.047 0.032 0.002 0.072 0.031 0.047 0.040
Uvarovite 0.001 0.000 0.000 0.044 0.059 0.001 0.001 0.000 0.000 0.002 0.001 0.000
Ti–Al garnet 0.001 0.000 0.000 0.003 0.003 0.025 0.015 0.000 0.001 0.001 0.000 0.002
Mol. wt.
(g/mol)
472.4 473.6 404.0 431.3 428.5 422.5 447.1 495.2 485.5 453.8 465.7 452.3
a (A) 11.523 11.5208 11.456 11.5332 11.5297 11.5295 11.8749 11.6332 11.6258 11.5073 11.5267 11.5465
Mol. vol.
(cc/mol)
115.3 115.2 113.3 115.6 115.5 115.5 126.2 118.6 118.4 114.8 115.4 115.10
AMU (g/at.) 23.62 23.68 20.20 21.57 21.42 21.13 22.36 24.76 24.27 22.69 23.29 22.61
Z (%) 25.06 24.95 24.35 25.09 25.11 24.93 27.37 26.14 25.95 24.92 25.14 25.23
a Z values from Dahl, 1997.
D. Vielzeuf et al. / Chemical Geology 223 (2005) 208–226212
and the molar weights of the theoretical end-members
reported in Table 2. These garnets adequately cover
the range Alm0–73, Prp0–99, Grs0–20. Out of this range,
results obtained on an almost pure grossular are also
reported. In addition, a sample of spessartine was
analysed and data will be provided but, as already
mentioned, emphasis will not be put on this compo-
nent. For a better visualization, the compositions of all
the garnet standards are plotted in a triangular diagram
Alm+Spe�Prp�Grs+And+Uv (Fig. 1).
X-ray diffraction data (powder and single crystal)
were collected at UBP-Clermont on a Sigma 2080
diffractometer using Cu–Ka radiation with an accel-
erating voltage of 40 kV and a filament current of 35
mA. Crystal fragments were analysed with a Gandolfi
X-ray camera. After exposure of 20 h, the XRD films
were scanned and diffraction lines extracted. Lattice
parameters were obtained with the non linear least
square cell refinement program Unitcell (Holland
and Redfern, 1997) based on 12 to 15 reflections.
For powder diffraction patterns, a silicon single-crys-
tal low background sample holder and Cu–Ka1 radia-
tion (focusing quartz-monochromator on incident
beam) were used. Step scanned data were acquired
in the range 16–808 2H with a step width of 0.028 anda counting time of 6 s per step. The cell parameters
were calculated using the Fullprof Rietveld refinement
software operating in profile-matching mode (Rodri-
guez-Carvajal, 1998).
2.3. Mass spectrometry oxygen ratio determinations
Oxygen isotope analyses by ion microprobe were
standardized against values determined by conven-
tional laser fluorination techniques at the University
of Wisconsin-Madison (Valley et al., 1995). From 1 to
2 mg of garnet were pre-treated with BrF5 overnight at
room temperature. Samples were then heated with
fresh BrF5 reagent using a CO2 laser (k =10.6 Am).
The evolved oxygen was purified cryogenically and
with hot Hg, before combustion to CO2, measurement
for analytical yield, and isotope analysis in a Finni-
gan/MAT 251 mass-spectrometer. On each day of
analysis, at least three aliquots of the UWG-2 garnet
standard were analyzed with the average precision of
F0.07x. Values were corrected to the accepted d18O
of UWG-2 (5.8x) as recommended by Valley et al.
(1995).
3. SIMS analytical techniques
Ion microprobe analyses were performed at
CRPG–CNRS (Nancy) using the French national
facility Cameca IMS 1270 instrument. Instrumental
conditions are described in detail by Rollion-Bard
(2001) and Rollion-Bard et al. (2003). Oxygen iso-
topes were analysed as O� ions produced by the
bombardment of the target by a 133Cs+ primary

Table 3
SIMS measurements of oxygen isotope ratios in 12 garnet standards, listed in order of analysis
d18OVSMOW
(x)
18O/ 16O(actual) Measured
d18O (x)
18O/16O(measured) aSIMS IMF
(x)
n r int.
(x)
r ext.
(x)
Counts on18O (millions/s)
SESSION 1
h114 9.3 0.0020238 11.6 0.0020285 1.00228 2.3 11 0.1 0.6 8.5
PrpMM 5.3 0.0020158 7.4 0.0020200 1.00206 2.1 5 0.1 0.2 9.25
UWG-2 5.8 0.0020168 8.3 0.0020217 1.00244 2.4 4 0.1 0.2 7.56
PrpDM 5.6 0.0020164 6.4 0.0020181 1.00083 0.8 4 0.2 0.2 6.95
Bal 509 12.3 0.0020299 14.4 0.0020341 1.00209 2.1 3 0.1 0.2 8.18
SESSION 2
PrpMM 5.3 0.0020158 6.4 0.0020181 1.00111 1.1 3 0.1 0.2 9.78
h114 9.3 0.0020238 11.7 0.0020287 1.00238 2.4 3 0.1 0.6 10
UWG-2 5.8 0.0020168 7.4 0.0020201 1.00162 1.6 3 0.1 0.2 8.79
SESSION 3
PrpAk 5.5 0.0020162 3.3 0.0020119 0.99786 �2.1 6 0.2 0.3 5.45
PrpAA 5.5 0.0020162 4.0 0.0020132 0.99849 �1.5 7 0.3 0.6 5.17
PrpDM 5.6 0.0020164 2.0 0.0020092 0.99641 �3.6 4 0.2 0.4 4.59
Alm SE 8.3 0.0020218 3.6 0.0020125 0.99537 �4.6 5 0.2 0.5 5.34
Spe SE 5.4 0.0020160 2.9 0.0020110 0.99752 �2.5 3 0.4 0.2 5.36
Bal 509 12.3 0.0020299 9.3 0.0020238 0.99701 �3.0 6 0.2 0.4 5.15
2B3 6.9 0.0020190 6.3 0.0020178 0.99938 �0.6 4 0.3 0.2 5.32
Grs SE 3.8 0.0020128 4.4 0.0020141 1.00063 0.6 5 0.3 0.7 4.25
Alm CMG 7.5 0.0020202 4.8 0.0020148 0.99731 �2.7 4 0.3 0.3 5.53
h114 9.3 0.0020238 6.7 0.0020187 0.99746 �2.5 4 0.3 0.2 5.59
UWG-2 5.8 0.0020168 3.8 0.0020127 0.99796 �2.0 5 0.3 0.3 5.16
PrpMM 5.3 0.0020158 2.0 0.0020092 0.99673 �3.3 5 0.2 0.2 5.44
PrpDM 5.6 0.0020164 2.6 0.0020104 0.99702 �3.0 2 0.4 0.4 5.18
SESSION 4
PrpAk 5.5 0.0020162 4.6 0.0020144 0.99909 �0.9 3 0.3 0.3 5.29
h114 9.3 0.0020238 7.6 0.0020204 0.99829 �1.7 4 0.3 0.5 6
UWG-2 5.8 0.0020168 3.7 0.0020125 0.99786 �2.1 4 0.3 0.5 5.5
PrpAk 5.5 0.0020162 4.5 0.0020142 0.99899 �1.0 1 0.2 – 5.81
h114 9.3 0.0020238 8.3 0.0020218 0.99899 �1.0 1 0.2 – 6.57
UWG-2 5.8 0.0020168 3.9 0.0020129 0.99807 �1.9 1 0.3 – 6.04
Alm CMG 7.5 0.0020202 5.7 0.0020165 0.99817 �1.8 3 0.2 0.5 6.56
2B3 6.9 0.0020190 5.9 0.0020171 0.99905 �1.0 4 0.2 0.6 6.3
PrpAk 5.5 0.0020162 3.1 0.0020113 0.99757 �2.4 2 0.3 0.6 6.03
PrpAA 5.5 0.0020162 2.7 0.0020106 0.99720 �2.8 2 0.2 0.4 5.7
h114 9.3 0.0020238 7.6 0.0020205 0.99835 �1.7 2 0.2 0.4 6.76
UWG-2 5.8 0.0020168 4.0 0.0020133 0.99825 �1.7 2 0.3 1.4 6.2
Alm CMG 7.5 0.0020202 6.1 0.0020173 0.99856 �1.4 2 0.2 0.2 6.87
Grs SE 3.8 0.0020128 4.9 0.0020149 1.00105 1.0 2 0.3 0.8 5.44
2B3 6.9 0.0020190 5.2 0.0020155 0.99826 �1.7 2 0.3 0.4 6.43
Bal 509 12.3 0.0020299 8.8 0.0020229 0.99655 �3.4 2 0.2 0.3 6.25
Spe SE 5.4 0.0020160 1.7 0.0020087 0.99635 �3.7 2 0.2 0.2 6.15
Alm SE 8.3 0.0020218 3.8 0.0020127 0.99550 �4.5 2 0.2 0.5 5.89
PrpDM 5.6 0.0020164 0.5 0.0020062 0.99491 �5.1 3 0.3 0.8 5.15
SESSION 5
h114 9.3 0.0020238 6.8 0.0020188 0.99752 �2.5 3 0.1 0.2 –
PrpAk 5.5 0.0020162 3.8 0.0020128 0.99829 �1.7 3 0.1 0.3 –
(continued on next page)
D. Vielzeuf et al. / Chemical Geology 223 (2005) 208–226 213

Table 3 (continued)
d18OVSMOW
(x)
18O/ 16O(actual) Measured
d18O (x)
18O/ 16O(measured) aSIMS IMF
(x)
n r int.
(x)
r ext.
(x)
Counts on18O (millions/s)
SESSION 5
PrpAA 5.5 0.0020162 3.0 0.0020112 0.99752 �2.5 3 0.1 0.2 –
PrpDM 5.6 0.0020164 2.3 0.0020098 0.99673 �3.3 3 0.1 0.1 –
Spe SE 5.4 0.0020160 3.1 0.0020114 0.99770 �2.3 3 0.1 0.2 –
Bal 509 12.3 0.0020299 10.0 0.0020252 0.99771 �2.3 3 0.1 0.1 –
2B3 6.9 0.0020190 6.3 0.0020177 0.99935 �0.6 3 0.1 0.1 –
Alm CMG 7.5 0.0020202 5.3 0.0020158 0.99782 �2.2 3 0.1 0.1 –
UWG-2 5.8 0.0020168 4.1 0.0020133 0.99826 �1.7 3 0.1 0.1 –
h114 9.3 0.0020238 6.9 0.0020190 0.99760 �2.4 1 0.1 – –
SESSION 6
h114 9.3 0.0020238 7.4 0.0020201 0.99813 �1.9 4 0.1 0.3 –
PrpDM 5.6 0.0020164 3.9 0.0020129 0.99826 �1.7 4 0.1 0.1 –
Spe SE 5.4 0.0020160 3.9 0.0020131 0.99854 �1.5 3 0.2 0.1 –
Grs SE 3.8 0.0020128 7.8 0.0020209 1.00402 4.0 2 0.2 0.0 –
2B3 6.9 0.0020190 6.8 0.0020188 0.99987 �0.1 3 0.1 0.2 –
Alm CMG 7.5 0.0020202 5.8 0.0020168 0.99831 �1.7 3 0.1 0.1 –
UWG-2 5.8 0.0020168 4.8 0.0020147 0.99897 �1.0 3 0.1 0.3 –
PrpAA 5.5 0.0020162 4.6 0.0020143 0.99906 �0.9 3 0.1 0.3 –
Bal 509 12.3 0.0020299 10.9 0.0020271 0.99863 �1.4 3 0.1 0.2 –
PrpDM 5.6 0.0020164 3.6 0.0020124 0.99798 �2.0 2 0.2 0.0 –
PrpDM 5.6 0.0020164 3.3 0.0020119 0.99774 �2.3 3 0.2 0.2 –
SESSION 7
PrpDM 5.6 0.0020164 4.2 0.0020137 0.99863 �1.4 3 0.1 0.2 –
h114 9.3 0.0020238 8.3 0.0020218 0.99898 �1.0 3 0.1 0.1 –
UWG-2 5.8 0.0020168 5.4 0.0020160 0.99961 �0.4 3 0.1 0.1 –
2B3 6.9 0.0020190 6.9 0.0020190 0.99996 0.0 2 0.1 0.0 –
PrpAk 5.5 0.0020162 4.5 0.0020141 0.99896 �1.0 3 0.1 0.0 –
PrpDM 5.6 0.0020164 3.5 0.0020123 0.99793 �2.1 3 0.2 0.2 –
PrpAk 5.5 0.0020162 4.3 0.0020138 0.99879 �1.2 3 0.1 0.1 –
h114 9.3 0.0020238 7.6 0.0020205 0.99835 �1.7 2 0.1 0.0 –
PrpDM 5.6 0.0020164 3.7 0.0020126 0.99810 �1.9 1 0.1 – –
SESSION 8
PrpMM 5.3 0.0020158 �1.2 0.0020027 0.99349 �6.5 4 0.3 0.4 3.47
h114 9.3 0.0020238 2.2 0.0020095 0.99293 �7.1 5 0.3 0.5 3.35
Bal 509 12.3 0.0020299 6.4 0.0020180 0.99415 �5.8 3 0.2 0.5 3.47
PrpDM 5.6 0.0020164 �0.4 0.0020043 0.99400 �6.0 3 0.2 0.3 3.24
UWG-2 5.8 0.0020168 1.0 0.0020072 0.99522 �4.8 3 0.3 0.4 –
SESSION 9
PrpAA 5.5 0.0020162 0.2 0.0020057 0.99476 �5.2 4 0.2 0.3 5.61
PrpDM 5.6 0.0020164 0.4 0.0020061 0.99487 �5.1 4 0.2 0.2 5.12
Alm SE 8.3 0.0020218 2.5 0.0020101 0.99421 �5.8 4 0.2 0.2 5.92
Spe SE 5.4 0.0020160 1.2 0.0020076 0.99583 �4.2 3 0.2 0.1 6.38
Bal 509 12.3 0.0020299 7.5 0.0020202 0.99525 �4.8 3 0.2 0.1 5.9
PrpMM 5.3 0.0020158 1.5 0.0020082 0.99623 �3.8 3 0.2 0.0 6.12
2B3 6.9 0.0020190 4.4 0.0020140 0.99749 �2.5 3 0.2 0.2 6.52
Grs SE 3.8 0.0020128 3.1 0.0020114 0.99931 �0.7 4 0.2 0.2 5.39
Alm CMG 7.5 0.0020202 3.6 0.0020124 0.99614 �3.9 3 0.2 0.1 6.5
h114 9.3 0.0020238 5.4 0.0020160 0.99611 �3.9 4 0.2 0.3 6.64
PrpAk 5.5 0.0020162 1.9 0.0020090 0.99641 �3.6 4 0.2 0.4 6.32
D. Vielzeuf et al. / Chemical Geology 223 (2005) 208–226214

Table 3 (continued)
d18OVSMOW
(x)
18O/ 16O(actual) Measured
d18O (x)
18O/16O(measured) aSIMS IMF
(x)
n r int.
(x)
r ext.
(x)
Counts on18O (millions/s)
SESSION 9
UWG-2 5.8 0.0020168 2.3 0.0020098 0.99653 �3.5 3 0.2 0.1 6.51
PrpAA 5.5 0.0020162 1.8 0.0020089 0.99635 �3.6 2 0.2 0.0 –
UWG-2 5.8 0.0020168 2.0 0.0020092 0.99623 �3.8 2 0.2 0.3 –
h114 9.3 0.0020238 5.2 0.0020156 0.99595 �4.1 1 0.2 – –
PrpAA 5.5 0.0020162 1.9 0.0020091 0.99645 �3.6 1 0.2 – –
SESSION 10
h114 9.3 0.0020238 9.7 0.0020247 1.00040 0.4 4 0.1 0.3 7.35
UWG-2 5.8 0.0020168 6.4 0.0020179 1.00055 0.5 3 0.1 0.2 7.31
2B3 6.9 0.0020190 10.0 0.0020253 1.00312 3.1 3 0.1 0.1 7.96
Spe SE 5.4 0.0020160 6.7 0.0020186 1.00128 1.3 3 0.1 0.2 8.31
h114 9.3 0.0020238 10.0 0.0020252 1.00065 0.7 3 0.1 0.4 7.96
Alm CMG 7.5 0.0020202 8.0 0.0020212 1.00049 0.5 3 0.1 0.3 8.3
Alm SE 8.3 0.0020218 8.3 0.0020219 1.00004 0.0 3 0.1 0.3 8.15
Bal 509 12.3 0.0020299 12.8 0.0020309 1.00052 0.5 3 0.1 0.4 7.98
PrpDM 5.6 0.0020164 6.3 0.0020177 1.00065 0.6 3 0.1 0.1 7.05
h114 9.3 0.0020238 10.0 0.0020253 1.00070 0.7 3 0.1 0.2 8.5
Grs SE 3.8 0.0020128 7.3 0.0020199 1.00351 3.5 3 0.1 0.7 7.5
PrpAk 5.5 0.0020162 5.9 0.0020169 1.00035 0.3 3 0.1 0.3 8.29
PrpMM 5.3 0.0020158 4.9 0.0020151 0.99964 �0.4 3 0.1 0.4 8.35
PrpAA 5.5 0.0020162 6.7 0.0020186 1.00117 1.2 3 0.1 0.4 8.33
h114 9.3 0.0020238 9.8 0.0020249 1.00053 0.5 3 0.1 0.2 8.84
(mean values). See Table A in electronic supplementary material for detailed analytical results.
aSIMS=[18O/16O(measured)] / [18O/ 16O(actual)].
IMF = Instrumental Mass Fractionation.
n = number of independent spot analyses on a given standard.
r int. = average of the 1 standard error of n *30 cycles in a single standard (internal precision).
r ext. = 1 standard deviation of n independent spot analyses on a given standard (spot to spot reproducibility).
D. Vielzeuf et al. / Chemical Geology 223 (2005) 208–226 215
beam at 10 kV with a 5 nA sample current. The size of
the oval spots varied from 30 to 50 Am with a depth of
about 2 Am. The normal incidence electron flood gun
was used to compensate sample charging during ana-
lysis (Slodzian et al., 1987). Secondary negative ions
of O were accelerated at 10 kVand analysed at a mass
resolution of about 5000 using the circular focusing
mode of the IMS 1270 and a transfer optic of 150 Am.
There is no species interference on the 16O� and 18O�
peaks at this mass resolution. The position of the
energy window was �25F60 eV which corresponds
to the optimized acceptance of the ions by the spectro-
meter. Measurements of O isotopes were conducted in
multicollection mode (secondary ions counted simul-
taneously) using two off-axis Faraday cups (L’2 and
H1). The measurements were performed with ion
intensities in the range 3 to 8d 106 counts/s on the18O� peak (see Table 3). The typical acquisition time
was 2 s for oxygen analysis during each of the 30
cycles that comprise one 60 s analysis. The gains of
the L’2 and H1 Faraday cups were systematically
inter-calibrated at the beginning of each analytical
session using the built-in amplifier calibration routine,
derived by Cameca from the Finnegan hardware
developed for solid source mass spectrometry (de
Chambost, 1997).
Previous studies on matrix effects in complex
minerals (Hervig et al., 1992; Eiler et al., 1997; Rici-
puti et al., 1998) were conducted using a SIMS with
high-energy filtering technique and a single collector.
For this study, we used a multicollector large radius
instrument (Cameca IMS 1270). On such a machine,
both the internal precision (i.e. within the 30 cycles in
one spot) and external reproducibility (from spot to
spot in a given grain) are improved for various rea-
sons: (1) the transfer optics located in the secondary
column between the sample and the electrostatic sec-
tor have been optimized in the IMS1270 and provides

D. Vielzeuf et al. / Chemical Geology 223 (2005) 208–226216
better ion transmission; (2) higher total counts on 18O
give better precision; (3) the multi-collection mode
allows simultaneous counting of the two isotopes,
while ions are counted one after the other in single
collection mode. In other words, in multi-collection
mode, an isotopic ratio is determined from the same
ablated material while, in mono-collection mode, the
isotopic ratio is determined from two slightly different
ablated materials; (4) multi-collection allows faster
measurements (about 3 min instead of 15) which
improves the quality of the measurement in the case
of instrumental drift. Previous work with a single
Fig. 2. Instrumental Mass Fractionation (IMF x) as a function
IMF=d18O(measured)�d18O(actual). Error bars correspond to the external
the height of the symbol is larger than the error bar.
collector demonstrated that the external precision on
homogeneous standards was limited by counting-sta-
tistics down to 0.3x for ca. 1 h analyses. Therefore,
one of the main improvements of the multi-Faraday
measurements is high count rates and better counting
statistics limits within an acceptable time period (a
few minutes); (5) the use of Faraday cup detectors
instead of an electron multiplier is required for high
signal intensities (greater than ca. 1 million counts/s).
A Faraday detector has the disadvantage of having a
higher background noise than an electron multiplier
and some care must be taken to optimize the signal /
of major components in garnet in two analytical sessions.
precision (or reproducibility) of the measurements. In most cases,

D. Vielzeuf et al. / Chemical Geology 223 (2005) 208–226 217
noise ratio. For instance, on the instrument we used,
we found that a signal z5d 106 counts/s on 18O is
adequate to obtain good analyses in garnet. On the
other hand, the use of Faraday detectors eliminates
problems related to aging of an electron multiplier
detector, which can be a major cause of instrument
drift in previous analyses.
4. Results
336 SIMS measurements were carried out during
10 different sessions from September 2001 to Novem-
ber 2002 (Table 3, and Table A in electronic supple-
mentary materials). Each spot measurement consists
of 30 acquisition cycles lasting 2 s each. As cycles
accumulate, the average d18O is calculated together
with a standard deviation; cycles outside the 2r inter-
val are discarded. On the remaining cycles, a new
average d18O is calculated (the final result) with its
standard deviation. This standard deviation divided by
the square root of the number of retained cycles gives
a standard error of the mean commonly referred to as
internal precision (rint). It reflects the stability of the
signal from a block to another within a given spot
measurement. For each standard, an average of 3
different spots (n) was analyzed in a row. rint listed
in Table 3 is the average rint of the n measurements.
On the other hand, rext is the standard deviation on
the n measurements (spot to spot external precision
referred to as reproducibility). Note that contrary to
internal precision, external precision is calculated as a
standard deviation and not a standard error of the
mean (Fitzsimons et al., 2000). Data are reported in
Table 3 as the average measured and actual 18O /16O
ratios, together with their d18O notation in per mil
variations relative to the Standard Mean Ocean Water
(SMOW), whose 18O/ 16O ratio equals 2.00520*10�3
(Baertschi, 1976). The average Instrumental Mass
Fractionation (IMF) is expressed as an alpha ratio:
aSIMS=(18O /16Omeasured) / (
18O/ 16Oactual). The IMF is
also reported in units per mil, calculated according to
the following relationship: [(18O/ 16Omeasured)� (18O /16Oactual) / (
18O/ 16Oactual)] *1000.
According to the data listed in Table 3, the stan-
dards are isotopically homogeneous with a spot to
spot reproducibility of d18OV0.3x (1r) for most
garnets, except for AlmSE and GrsSE (rext=0.37
and 0.49x, respectively). In terms of d18O, SIMS
measurements indicate that, during a single session,
IMF can differ up to 6.3x from one garnet standard to
the other. The difference remains small between al-
mandine, pyrope and spessartine end-members (b2x).
Conversely, the maximum difference is found between
AlmSE or PrpDM on one side and GrsSE on the other
side. In most of the sessions, IMF can be correlated
with the grossular (+andradite) content and, to a lesser
extent, with the pyrope component. The results
obtained on two representative sessions (#6 and 9)
are shown in Fig. 2. Summarizing, a significant matrix
effect is observed on oxygen isotope SIMS measure-
ments of Fe–Mg–Ca garnets and the grossular compo-
nent plays a major role in causing this effect.
5. Discussion
5.1. Correction scheme
The correlation between the calcium content of the
garnet and IMF may appear good enough to generate
a simple correction scheme. However, we prefer a
correction scheme combining the 4 main end-mem-
bers [Alm, Prp, Grs, Spe] for the following reasons:
(1) this is a general, easy to adapt, multivariate correc-
tion scheme taking into account all of the garnet
components; it considers compositional effects that
may have been overlooked by the user; (2) detailed
analysis of the results of standard measurements and
the design of a new specific correction scheme for
each session are not required; (3) contrary to the
appearance, the calculation of correction coefficients
in the proposed multivariate analysis is extremely
simple and requires a single line of Matlab script;
(4) the use of the same routine to calculate correction
coefficients facilitates the objective comparison of
results obtained during different sessions. This multi-
variate correction scheme is based on the following
relationship M[IMF]=M[conc] *M[w, x, y, z]. The left
hand side member of this equation (M[IMF]) is a 1
column, s line, matrix with the measured IMF for each
standard, M[conc] is a 4 column, s line matrix with the
Alm, Prp, Grs+And, Spe contents for each standard,
and M[w, x, y, z] is a 1 column, 4 line matrix of
unknown parameters related to Alm, Prp, Grs+And,
Spe, respectively (s is the number of standards mea-

D. Vielzeuf et al. / Chemical Geology 223 (2005) 208–226218
sured in a given session (e.g. s =11 for session 6 and
s=16 for session 9). Knowing IMF and the concen-
trations, the matrix M[w, x, y, z] can be determined by
solving the set of s equations:
IMF1 ¼ wAlm1 þ xPrp1 þ y Grsþ Andð Þ1 þ zSpe1
IMF2 ¼ wAlm2 þ . . .
IMFs ¼ wAlms þ xPrps þ y Grsþ Andð Þs þ zSpes
using a simple least square method. A Matlab script of
the routine we used to determine the w, x, y, z
correction coefficients, together with a worked exam-
ple are given in the Appendix A.
Once determined, the w, x, y, z coefficients can be
used to determine the IMF and correct the measured
oxygen isotopic ratio of any Fe–Mg–Ca (–Mn) garnet
of known chemical composition.
It is important to note that the coefficients used to
relate instrumental mass fractionation to mineral
chemistry differ slightly from day to day in both
their absolute and relative values. This is due to
instrumental conditions that may vary from day to
day. Thus, an accurate determination of oxygen iso-
tope ratios in a sample requires a calibration of the
instrument using standards during the same session,
before and after the analysis of the sample to check
for instrumental drift. For this purpose, the sample
and the standards are ideally held on the same
sample holder (preferably, mounted and polished
together in the same preparation) to avoid changing
sample mounts, breaking vacuum, and possible
changes of instrumental conditions (Valley et al.,
1995).
In order to test this scheme, the correction coeffi-
cients were determined for each session, and then
used to recalculate the IMF required to correct the
measured value of d18O for each standard. An exam-
ple of this calculation is given in the Appendix A.
Results for sessions 6 and 9 are reported in Fig. 3 as
the difference between recalculated and actual d18O
values (D). The average standard deviation of the
mean D for all the sessions equal 0.6 x with varia-
tions from 1.12 to 0.25 for the worst and best sessions
(#4 and #7), respectively.
Interestingly, the use of only 5 standards (4 end-
members: AlmCMG, PrpDM, GrsSE, SpeSE and 1
standard of intermediate composition: UWG-2) is suf-
ficient to calculate the M[w, x, y, z] matrix without alter-
ing the results in a significant way. In addition, if we
exclude the manganese-rich standard (SpeSE) from the
calculation, there is no significant effect on the recal-
culation of the d18O of all the standards, but SpeSE, and
the D are identical to the ones shown in Fig. 3A and B.
This is simply due to the fact that all of our standards,
but one, are poor in spessartine component.
To summarize, for manganese-poor garnets (spes-
sartine contents b5%), 3 end-member standards such
as AlmCMG, PrpDM, GrsSE, plus a standard of
intermediate composition (e.g. UWG-2), are sufficient
to obtain reliable and accurate isotope ratio measure-
ments on Fe–Mg–Ca garnets using a IMS1270 instru-
ment. A major consequence of this result is that the
linear interpolation among end-member standards is
satisfactory in the case of the garnet solid-solutions.
Using this correction scheme, 75% of the d18Oestimates on the garnet standards were reproduced
within F0.6x of their actual value, 85% within
F1x, and 95% within F2x . These are indications
of the accuracy of the measurements we can expect
for SIMS measurements of oxygen isotopes in garnets
under the present operating conditions. It is important
to note that in most petrological studies, for instance
in the case of zoned minerals, precision of the mea-
surement is more important than its accuracy. In this
respect, the SIMS is an extremely powerful instrument
as variations as low as 0.3x in a crystal can be
considered as significant (Cavosie et al., 2005; Viel-
zeuf et al., 2005, and Fig. 5C).
5.2. IMF, mean atomic mass and molar volume
It is beyond the scope of this paper to discuss the
physical processes responsible for isotopic matrix
effects. However exploring the possible correlations
between physical properties of the minerals and IMF
might prove helpful in the debate. In their contribu-
tion to the determination of the matrix effects in
complex minerals on SIMS analyses of oxygen iso-
topes, Eiler et al. (1997) following Hervig et al.
(1992) noted a significant correlation between IMF
and mean atomic mass (AMU) of the minerals, even
if they consider that this correlation remains unsui-
table for a correction scheme (see also Riciputi et al.,
1998). In Fig. 4A and B, the instrumental mass
fractionations for measurements of sessions 6 and 9
have been plotted against the mean atomic mass. A

Fig. 3. Differences between recalculated and actual d18O values in the garnet standards measured in two analytical sessions:
D=d18O(recalculated)�d18O(actual). Error bars correspond to the external precision (or reproducibility) of the measurements. In most cases, the
height of the symbol is larger than the error bar. The 2r standard deviation of the mean is shown as dashed lines.
D. Vielzeuf et al. / Chemical Geology 223 (2005) 208–226 219
poor positive correlation can be found for the Fe–
Mg–Mn garnet solid-solution and, most importantly,
the representative point of the grossular garnet lies
far off the trend. Thus, we conclude that, contrary to
previous studies, but on a different type of SIMS,
there is no significant correlation between IMF and
AMU in the Ca–Fe–Mg garnet solid-solution. The
correlation between IMF and molar volume is more
convincing and incorporates the grossular end-mem-
ber as well (Fig. 4C and D). It has been suggested
that closeness of atomic packing in a crystal structure
exerts a major control on ion diffusivities such that
compact structures tend to inhibit volume diffusion
while open structures enhance it (Dowty, 1980; For-
tier and Giletti, 1989; Dahl, 1997). Ionic porosity (Z)
is the fraction of a mineral’s unit-cell volume not
occupied by ions (see Table 2), and thus an indica-
tion of the degree of compactness in a mineral. In
Fig. 4E and F, IMF has been plotted against the ionic
porosity Z for the two sessions 6 and 9. A positive
correlation exists but is not better than the previous
IMF vs. molar volume correlation; it remains unsui-
table for a correction scheme.
The instrumental mass fractionations reported by
earlier studies of matrix effect in garnet cannot be
directly compared to those of this study because of
differences in conditions of analysis. Previous studies
used a single electron multiplier detection system on
a Cameca ims-4f operated at lower secondary poten-
tial and a high energy offset (Eiler et al., 1997;
Schulze et al., 2003). The IMFs measured by Eiler
et al. (1997) are in the range 50–60x for garnets
while those in the present study do not exceed 7x.
These authors report the greater difference of IMF

Fig. 4. Instrumental mass fractionation versus mean atomic mass (AMU), molar volume and ionic porosity (Z) in sessions 6 and 9. Error bars
correspond to the external precision (or reproducibility) of the measurements. In most cases, the height of the symbol is larger than the error bar.
The two encircled dots in Fig. 4D correspond to 2 measurements outside the F1x interval at the beginning of the session (see Fig. 3).
D. Vielzeuf et al. / Chemical Geology 223 (2005) 208–226220
between almandine and pyrope (ca. 16x) and no
difference between pyrope and grossular. On the
other hand, we observe almost no difference between
almandine and pyrope and the largest difference
between pyrope and grossular (ca. 6x). Previous
studies of instrumental mass fractionations accompa-
nying oxygen isotope analyses of garnets and other
silicates (Hervig et al., 1992; Eiler et al., 1997;
Riciputi et al., 1998) employed a high energy offset
technique in which only ions sputtered from the
sample surface with kinetic energies above ca. 250
eV were accepted for analysis. This was done to
make the isotope ratio measurements more stable
and less susceptible to subtle surface charging, and
also to minimize isobaric molecular interferences.
The high energy ion population is a small fraction
(less than 1 part in 1000) of all sputtered ions. There
is a pronounced mass dependence of the transfer of
kinetic energy from the primary ion beam to this
population. This mass dependence contributes to the
large overall IMF and the strong dependence of IMF
on atomic mass (for instance, see the data on Na–Al-

D. Vielzeuf et al. / Chemical Geology 223 (2005) 208–226 221
silicate glasses with various sputter rates in Eiler et
al., 1997). On the other hand, this population of ions
has relatively weak interactions with other ions near
the sample surface, and so charge transfer reactions
that may re-neutralize them are less important as a
control on matrix effects. Therefore, differences in
electrochemistry among various cations do not man-
ifest themselves; at least not noticeably. The present
study has been conducted at the opposite extreme.
With the IMS1270, isobaric interferences are
removed with high mass-resolution above 2500 and
a high energy offset is not required. Thus a larger
proportion of ions ejected from the same surface
with near-zero kinetic energies is analyzed. This
population more closely approaches the isotopic
composition of the bulk material, but is more subject
to charge-transfer reactions in the ion cloud just
above the sample surface. Thus, it has a smaller
instrumental mass fractionation, but matrix effects
are still significant and show no simple dependence
on mass. These issues are discussed in Eiler et al.
(1997), and explained in more detail in papers by
Slodzian et al. (1980) and Shimizu and Hart (1982).
Fig. 5. A: Electron microprobe X-ray image (Cameca SX100, Clermont) of
location of the analytical traverse (black line). B: Electron microprobe cal
Thus, there is no theoretical reason why the larger
IMFs measured by 4f can be simply scaled down to
make predictions for the present study. It is neces-
sary to make the instrumental corrections for this and
other studies using the results of standards run at the
same conditions and calibrated by standard analyses
that bracket sample analyses in the same session of
analysis.
6. Applications
6.1. Garnets from the Ursuya massif (western
Pyrenees)
In a plutonic complex from the Pyrenees, we
discovered composite garnets with two main growth
zones: a core relatively poor in calcium (Grs 7–9%)
and a more Ca-rich rim (Grs 12–14%). A SIMS
study carried out at Nancy indicates that d18O is
higher in the core (12–14x) than in the rim (7–
12x). In addition, a traverse at the core/rim interface
shows a progressive transition for both the grossular
calcium in a composite garnet from the Pyrenees (sample U822) and
cium traverse. C: d18O traverse along the same profile.

D. Vielzeuf et al. / Chemical Geology 223 (2005) 208–226222
and the oxygen isotopic ratios (Fig. 5). We inter-
preted these features in terms of chemical relaxation
by diffusion for both calcium and oxygen isotopes
(Vielzeuf et al., 2005). In such a study, it is critical
to determine if the d18O variations are real or an
artefact linked to the variations in IMF due to gros-
sular content.
The SIMS traverse was performed during session 9
and intercalated between analyses of PrpAA and
UWG-2 (see Fig. 3). Table 4 provides the measured
d18O values and the composition of the garnet along
the traverse. The measured values of d18O were cor-
rected using two methods: a single standard calibration
with UWG-2 (i.e. applying a constant instrumental
correction of 3.6x), and a multi-standard calibration
as discussed in the text (i.e. applying instrumental
corrections dependent on composition). The correction
factors determined for session 9 are given in Table 4.
The two methods generate identical results (maximum
difference b0.2x), which means that the d18O varia-
tions measured in these garnets are real and not the
Table 4
d18O SIMS measurements in a zoned Pyrenean garnet
Distance
(Am)
Grs
(x)
Prp
(x)
Alm
(x)
Spe
(x)
Measured d18O
(x)
83 13.1 22.6 61.7 2.6 6.4
153 13.3 22.7 61.5 2.5 6.2
288 13.5 22.6 61.4 2.5 6.6
390 13.3 22.9 61.0 2.8 6.3
492 13.3 23.2 60.6 2.9 7.3
559 12.4 22.8 62.2 2.5 6.9
627 12.7 22.4 62.2 2.8 6.6
712 12.4 21.9 63.0 2.7 7.6
780 11.3 23.8 62.0 2.9 7.0
797 11.3 23.8 62.0 2.9 7.2
848 10.9 24.2 62.5 2.4 8.0
915 9.9 24.8 62.8 2.4 8.4
966 9.4 24.4 63.4 2.8 9.0
1034 8.4 24.2 64.7 2.6 9.0
1153 7.7 25.2 64.6 2.5 8.5
1220 7.6 25.2 64.0 3.1 8.9
1373 7.7 25.2 65.0 2.2 9.9
1526 7.7 25.2 64.9 2.2 9.6
1644 7.8 24.4 65.5 2.3 9.8
1763 7.9 25.3 64.3 2.5 10.0
1898 8.1 24.8 64.7 2.4 10.6
2017 8.5 22.1 66.6 2.8 10.8
Comparison of corrections with the UWG-2 standard on one side and the
Correction coefficients: w =�0.0372, x =�0.0473, y =�0.0053, z =�0.0
result of chemical zoning. This example suggests that,
though a correction is still needed to correct d18O vs.
SMOW, the variation of matrix effect in zoned Fe–
Mg–Ca garnets can be neglected if the variation in
end-member components is less than 10%. This is a
direct consequence of the fact that, under the present
operating conditions, the maximum difference of IMF
between end-member standards is not very large and
never exceeded 7x.
6.2. Garnets from the Dora Maira massif (Western
Alps)
In the framework of a study of minor elements,
HREE, and d18O distributions in UHP garnets from
the Dora-Maira massif (Brunet et al., 2003), we col-
lected SIMS data on garnets from gneisses intercalated
within coesite-bearing whiteschists (e.g. Compagnoni
and Hirajima, 2001). These measurements were made
during session 6 (Table 5). One of the garnet crystals
we studied (sample DM94-09) is strongly zoned (Fig.
Corrected d18O
with UWG-2 (x)
Calculated IMF
with matrix (x)
Corrected d18O
with matrix (x)
10.0 �3.5 10.0
9.8 �3.5 9.7
10.2 �3.5 10.1
9.9 �3.5 9.8
10.9 �3.5 10.8
10.5 �3.6 10.4
10.2 �3.6 10.1
11.2 �3.6 11.1
10.6 �3.6 10.6
10.8 �3.6 10.9
11.6 �3.6 11.6
12.0 �3.7 12.0
12.6 �3.7 12.7
12.6 �3.7 12.7
12.1 �3.7 12.2
12.5 �3.7 12.7
13.5 �3.7 13.7
13.2 �3.7 13.3
13.4 �3.7 13.5
13.6 �3.7 13.7
14.2 �3.7 14.3
14.4 �3.7 14.5
matrix correction scheme on the other side.
416.

Table 5
d18O SIMS measurements in a zoned garnet (DM94-09) from a UHP terrane in the Alps (Dora Maira)
Analysis
number
Grs (%) Prp (%) Alm (%) Spe (%) Measured d18O
(x)
Corrected d18O with
2B3 IMF=0.13xCalculated IMF
with matrix (x)
Corrected d18O
with matrix (x)
51 50 1 41 6 6.7 6.9 1.3 5.5
52 21 3 70 5 7.2 7.3 �0.5 7.7
53 22 3 69 5 6.9 7.0 �0.5 7.4
54 22 3 69 5 7.5 7.7 �0.5 8.0
55 21 3 70 5 7.2 7.3 �0.5 7.7
56 21 3 70 5 7.1 7.2 �0.5 7.6
57 44 1 47 6 5.9 6.0 0.9 5.0
Comparison of corrections using the 2B3 standard with the matrix correction scheme (session 6).
Correction coefficients: w =�0.0183, x =�0.0195, y =0.0424, z =�0.0145.
D. Vielzeuf et al. / Chemical Geology 223 (2005) 208–226 223
6) with an almandine-rich core (Alm70Grs20Py5Sp5)
and a grossular-rich rim (Grs50Alm41Py1Sp6). The rim
is interpreted as a high-pressure overgrowth zone. A
SIMS transect across this garnet shows d18O ranging
from 7.7x in the core down to 6x in the rim (Fig. 6).
These values were obtained using a single standard
correction (2B3) and a constant IMF equal to �0.13
x. When the multi-standard regression is taken into
account, the d18O values at the rim drop to 5.0–5.5x(IMF=+0.9 and +1.3x, respectively) whereas the
core values increase by about 0.3x (IMF=�0.5x).
Fig. 6. Scanning electron microprobe X-ray image (Hitachi S-2500,
ENS-Paris) of Ca, and location of the SIMS d18O point analyses in
a garnet from a UHP metamorphic terrane in the Italian Alps
(sample DM94-09, Dora Maira). The average compositions of
core and rim are indicated in black and white, respectively.
Thus, the use of the multi-standard correction
increases the difference in d18O between the core
and the rim and yields d18O ratios that are consistent
with laser-based oxygen data for garnets from the Dora
Maira country-gneisses (8.7–8.8x, Sharp et al., 1993)
and whiteschists (5.6x, Sharp et al., 1993, and this
study — PrpDM). In addition, this example shows that
matrix effect becomes significant when variations in
grossular content are large (N10%). Garnets from the
UHP series in the Alps are a typical case where special
care should be taken for d18O SIMS measurements
because (i) garnets are strongly zoned in calcium, and
(ii) grossular contents in garnets vary significantly (0%
to 70%) from one rock to another at a decimeter scale
(Shertl et al., 1991).
7. Conclusions
In order to obtain reliable and accurate oxygen
isotope ratio measurements on Fe–Mg–Ca garnets,
zoned crystals especially, using a SIMS, we suggest
the application of a correction scheme using at least 3
reliable end-member standards such as PrpDM,
AlmCMG and GrsSE, plus a standard of intermediate
composition (e.g. UWG-2 or the garnet standard clo-
sest to the average composition of the analysed garnet).
This allows (i) the control on the result obtained with a
single standard and (ii) incorporates a correction based
on the variations in composition of zoned crystals. The
fact that linear interpolation among end-member stan-
dards applies in the case of the garnet solid-solutions
implies that the complete compositional field can be
covered with a limited number of standards. Some of
D. Vielzeuf et al. / Chemical Geology 223 (2005) 208–226224
the garnet standards used in this study (PrpMM, PrpAk,
PrpAA, PrpDM, Bal509, UWG-2) are available and
will be provided upon request.
Acknowledgements
This work has been supported by CNRS–INSU
through grants IT 2001/021 and IT 2002 to DV and
FB. We thank J. Craven, S. Elphick, C. Graham, B.
Devouard, V. Trommsdorff, E. Krogh, A. Leyreloup
and C. France-Lanord for providing valuable garnets
or garnet-bearing rocks. The final stage of this study
was carried out while DV was on a sabbatical leave
from CNRS at Caltech with a financial support
provided by E.M. Stolper. The manuscript benefited
from discussions with M. Chaussidon, E. Deloule,
R. Hervig, and C. Rollion-Bard. We thank J. Eiler
and an anonymous reviewer for their constructive
comments. [PD]
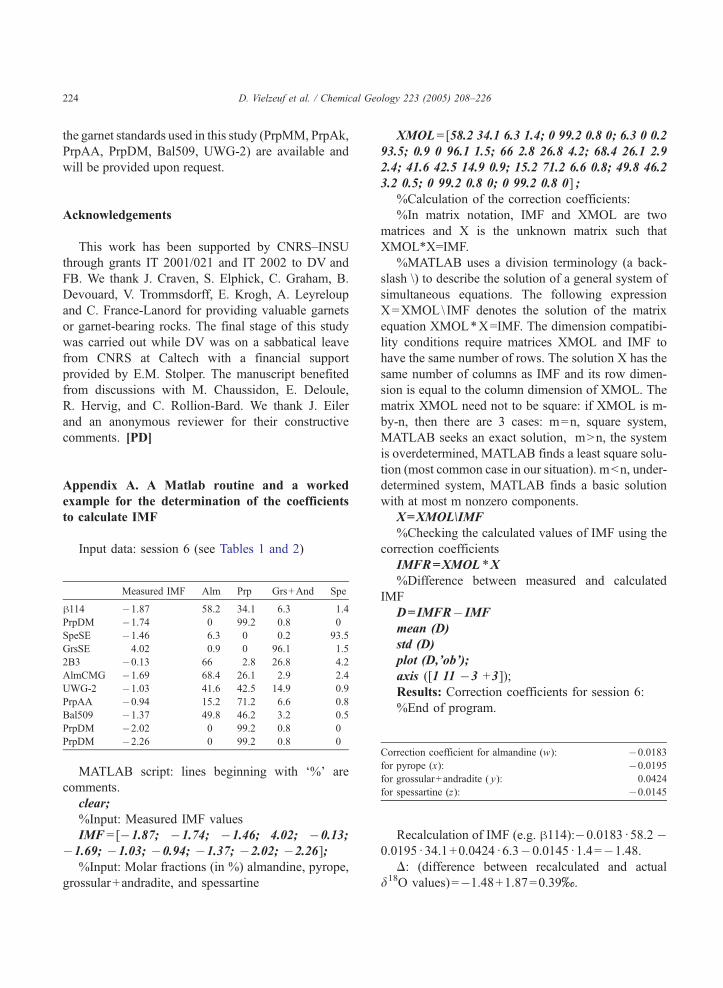
Appendix A. A Matlab routine and a worked
example for the determination of the coefficients
to calculate IMF
Input data: session 6 (see Tables 1 and 2)
Measured IMF Alm Prp Grs+And Spe
h114 �1.87 58.2 34.1 6.3 1.4
PrpDM �1.74 0 99.2 0.8 0
SpeSE �1.46 6.3 0 0.2 93.5
GrsSE 4.02 0.9 0 96.1 1.5
2B3 �0.13 66 2.8 26.8 4.2
AlmCMG �1.69 68.4 26.1 2.9 2.4
UWG-2 �1.03 41.6 42.5 14.9 0.9
PrpAA �0.94 15.2 71.2 6.6 0.8
Bal509 �1.37 49.8 46.2 3.2 0.5
PrpDM �2.02 0 99.2 0.8 0
PrpDM �2.26 0 99.2 0.8 0Correction coefficient for almandine (w): �0.0183
for pyrope (x): �0.0195
for grossular+andradite ( y): 0.0424
for spessartine (z): �0.0145
MATLAB script: lines beginning with d%T are
comments.
clear;
%Input: Measured IMF values
IMF =[�1.87; �1.74; �1.46; 4.02; �0.13;
�1.69; �1.03; �0.94; �1.37; �2.02; �2.26];
%Input: Molar fractions (in %) almandine, pyrope,
grossular+andradite, and spessartine
XMOL=[58.2 34.1 6.3 1.4; 0 99.2 0.8 0; 6.3 0 0.2
93.5; 0.9 0 96.1 1.5; 66 2.8 26.8 4.2; 68.4 26.1 2.9
2.4; 41.6 42.5 14.9 0.9; 15.2 71.2 6.6 0.8; 49.8 46.2
3.2 0.5; 0 99.2 0.8 0; 0 99.2 0.8 0] ;
%Calculation of the correction coefficients:
%In matrix notation, IMF and XMOL are two
matrices and X is the unknown matrix such that
XMOL*X=IMF.
%MATLAB uses a division terminology (a back-
slash \) to describe the solution of a general system of
simultaneous equations. The following expression
X=XMOL\ IMF denotes the solution of the matrix
equation XMOL*X=IMF. The dimension compatibi-
lity conditions require matrices XMOL and IMF to
have the same number of rows. The solution X has the
same number of columns as IMF and its row dimen-
sion is equal to the column dimension of XMOL. The
matrix XMOL need not to be square: if XMOL is m-
by-n, then there are 3 cases: m=n, square system,
MATLAB seeks an exact solution, mNn, the system
is overdetermined, MATLAB finds a least square solu-
tion (most common case in our situation). mbn, under-
determined system, MATLAB finds a basic solution
with at most m nonzero components.
X=XMOL\IMF
%Checking the calculated values of IMF using the
correction coefficients
IMFR=XMOL *X
%Difference between measured and calculated
IMF
D=IMFR� IMF
mean (D)
std (D)
plot (D,’ob’);
axis ([1 11 �3 +3]);
Results: Correction coefficients for session 6:
%End of program.
Recalculation of IMF (e.g. h114):�0.0183d 58.2 �0.0195d 34.1+0.0424d 6.3�0.0145d 1.4=�1.48.
D: (difference between recalculated and actual
d18O values)=�1.48+1.87=0.39x.

D. Vielzeuf et al. / Chemical Geology 223 (2005) 208–226 225
Summary:
Session 6 Actual d18O Measured d18O IMF Recalculated IMF Recalculated d18O D
h114 9.3 7.41 �1.87 �1.48 8.9 0.4
PrpDM 5.6 3.85 �1.74 �1.90 5.7 �0.1
SpeSE 5.4 3.93 �1.46 �1.46 5.4 0
GrsSE 3.8 7.84 4.02 4.04 3.8 0
2B3 6.9 6.77 �0.13 �0.19 7.0 �0.1
AlmCMG 7.5 5.8 �1.69 �1.67 7.5 0
UWG-2 5.8 4.76 �1.03 �0.97 5.7 0.1
PrpAA 5.5 4.55 �0.94 �1.40 5.9 �0.4
Bal509 12.3 10.91 �1.37 �1.68 12.6 �0.3
PrpDM 5.6 3.57 �2.02 �1.90 5.5 0.1
PrpDM 5.6 3.33 �2.26 �1.90 5.2 0.4
Average 0
r 0.25
Appendix B. Supplementary data
Supplementary data associated with this article
can be found, in the online version, at doi:10.1016/
j.chemgeo.2005.07.008.
References
Baertschi, P., 1976. Absolute 18O content of standard mean ocean
water. Earth Planet. Sci. Lett. 31, 341–344.
Brunet, F., Chazot, G., Burchard, M., Vielzeuf, D., Chopin, C.,
2003. Minor elements, HREE and d18O distribution in UHP
garnets from the Dora-Maira massif (Western Alps): evidence
for Gneiss and Mg–quartzite interaction at UHP? Geochim.
Cosmochim. Acta, Suppl. 67, A46.
Cavosie, A.J., Valley, J.W., Wilde, S.A., 2005. Magmatic d18O in
4400–3900 Ma detrital zircons: a record of the alteration and
recycling of crust in the Early Archean. Earth Planet. Sci. Lett.
235, 663–681.
Chopin, C., 1984. Coesite and pure pyrope in high-grade blueschists
of the Western Alps; a first record and some consequences.
Contrib. Mineral. Petrol. 86, 107–118.
Compagnoni, R., Hirajima, T., 2001. Superzoned garnets in the
coesite-bearing Brossasco–Isasca Unit, Dora-Maira massif, Wes-
tern Alps, and the origin of the whiteschists. Lithos 57, 219–236.
Dahl, P.S., 1997. A crystal-chemical basis for Pb retention and
fission-track annealing systematics in U-bearing minerals, with
implications for geochronology. Earth Planet. Sci. Lett. 150,
277–290.
de Chambost, E., 1997. User’s Guide for Multicollector Cameca
IMS 1270. Cameca, Courbevoie, France.
Dowty, E., 1980. Crystal-chemical factors affecting the mobility of
ions in minerals. Am. Mineral. 65, 174–182.
Eiler, J.M., Graham, C., Valley, J.W., 1997. SIMS analysis of
oxygen isotopes: matrix effects in complex minerals and
glasses. Chem. Geol. 138, 221–244.
Elphick, S.C., Ganguly, J., Loomis, T.P., 1985. Experimental deter-
mination of cation diffusivities in aluminosilicate garnets. Con-
trib. Mineral. Petrol. 90, 36–44.
Fitzsimons, C.W., Harte, B., Clark, R.M., 2000. SIMS stable isotope
measurement: counting statistics and analytical precision.
Mineral. Mag. 64, 59–83.
Fortier, S.M., Giletti, B.J., 1989. An empirical model for predict-
ing diffusion coefficients in silicate minerals. Science 245,
1481–1484.
France-Lanord, C., Sheppard, S.M.F., LeFort, P., 1988. Hydrogen
and oxygen variations in the high Himalaya peraluminous Ma-
naslu leucogranite; evidence for heterogeneous sedimentary
source. Geochim. Cosmochim. Acta 52, 513–526.
Harris, C., Smith, H.S., le Roex, A.P., 2000. Oxygen isotope
composition of phenocrysts from Tristan da Cunha and Gough
Island lavas; variation with fractional crystallization and evi-
dence for assimilation. Contrib. Mineral. Petrol. 138, 164–175.
Hervig, R.L., Williams, P., Thomas, R.M., Schauer, S.N., Steele,
I.M., 1992. Microanalysis of oxygen isotopes in insulators by
secondary ion mass spectrometry. Int. J. Mass Spectrom. Ion
Process. 120, 45–63.
Holland, T.J.B., Redfern, S.A.T., 1997. Unit cell refinement from
powder diffraction data: the use of regression diagnostics.
Mineral. Mag. 61, 65–77.
Jamtveit, B., Hervig, R.L., 1994. Constraints on transport and
kinetics in hydrothermal systems from zoned garnet crystals.
Science 263, 505–508.
Leyreloup, A., Dupuy, C., Andriambololona, R., 1977. Catazonal
xenoliths in French Neogene volcanic rocks; constitution of the
lower crust: 2. Chemical composition and consequences of the
evolution of the French Massif Central Precambrian crust. Con-
trib. Mineral. Petrol. 62, 283–300.
Medaris, L.G., 1984. A geobarometric investigation of garnet peri-
dotites in the Western gneiss region of Norway. Contrib.
Mineral. Petrol. 87, 72–86.
Moore, R.O., 1986. A study of the kimberlites, diamonds and
associated rocks and minerals from the Monastery Mine,
South Africa. Ph.D. Thesis, Univ. Cape Town.

D. Vielzeuf et al. / Chemical Geology 223 (2005) 208–226226
Nimis, P., Trommsdorff, V., 2001. Revised thermobarometry of
Alpe Arami and other garnet peridotites from the Central
Alps. J. Petrol. 42, 103–115.
Riciputi, L.R., Paterson, B.A., 1994. High spatial resolution mea-
surement of O isotope ratios in silicates and carbonates by ion
microprobe. Am. Mineral. 79, 1227–1230.
Riciputi, L.R., Paterson, B.A., Ripperdan, R.L., 1998. Measurement
of light stable isotope ratios by SIMS: matrix effects for oxygen,
carbon, and sulfur isotopes in minerals. Int. J. Mass Spectrom.
178, 81–112.
Rodriguez-Carvajal, J., 1998. Fullprof98 version 3.5d, LLB-JRC,
France.
Rollion-Bard, C., 2001. Variabilite des isotopes de l’oxygene dans
les coraux Porites: developpement et implications des micro-
analyses d’isotopes stables (B, C et O) par sonde ionique. These
d’Universite, INPL — Nancy. 165 pp.
Rollion-Bard, C., Chaussidon, M., France-Lanord, C., 2003. pH
control on oxygen isotopic composition of symbiotic corals.
Earth Planet. Sci. Lett. 215, 275–288.
Schulze, D.J., Valley, J.W., Spicuzza, M.J., Channer, D.M.DeR.,
2003. Oxygen isotope composition of peridotitic garnet xeno-
crysts from the La Ceniza kimberlite, Guaniamo, Venezuela. Int.
Geol. Rev. 45, 968–975.
Sharp, Z.D., Essene, E.J., Hunziker, J.C., 1993. Stable isotope
geochemistry and phase equilibria of coesite-bearing whites-
chists, Dora Maira Massif, western Alps. Contrib. Mineral.
Petrol. 114, 1–12.
Shertl, H.-P., Schreyer, W., Chopin, C., 1991. The pyrope–coesite
rocks and their country rocks at Parigi, Dora Maira Massif,
Western Alps: detailed petrography, mineral chemistry and PT-
path. Contrib. Mineral. Petrol. 108, 1–21.
Shimizu, N., Hart, S.R., 1982. Applications of the ion microprobe to
geochemistry and cosmochemistry. Annu. Rev. Earth Planet.
Sci. 10, 483–526.
Slodzian, G., Lorin, J.C., Havette, A., 1980. Isotopic effect on the
ionization probabilities in secondary ion emission. J. Phys. 41,
L555–L558.
Slodzian, G., Daigne, B., Girard, F., Boust, F., 1987. High sensi-
tivity and high spatial resolution. In: Benninghoven, A., Huber,
A.M., Werner, H.W. (Eds.), Secondary Ion Mass Spectrometry,
SIMS VI. John Wiley & Sons Ltd., pp. 189–192.
Valley, J.W., Kitchen, N., Kohn, M.J., Niendorf, C.R., Spicuzza,
M.J., 1995. UWG-2, a garnet standard for oxygen isotope ratios:
strategies for high precision and accuracy with laser heating.
Geochim. Cosmochim. Acta 59, 5223–5231.
Vielzeuf, D., 1984. Relations de phases dans le facies granulite et
implications geodynamiques. L’exemple des granulites des
Pyrenees. These de Doctorat d’Etat — Clermont-Ferrand.
288 pp.
Vielzeuf, D., Veschambre, M., Brunet, F., 2005. Oxygen isotope
heterogeneities and diffusion profiles in composite meta-
morphic/magmatic garnets from the Pyrenees. Am. Mineral.
90, 463–472.
Copyright © 2022 FDOKUMEN