
Quantification of calcium content in bone by using ToF-SIMS–a first approach
8
ORIGINAL ARTICLE Open Access Quantification of calcium content in bone by using ToF-SIMS–a first approach Anja Henss 1 , Marcus Rohnke 1* , Sven Knaack 2 , Matthias Kleine-Boymann 1 , Thomas Leichtweiss 1 , Peter Schmitz 1 , Thaqif El Khassawna 3 , Michael Gelinsky 2 , Christian Heiss 3,4 and Jürgen Janek 1 Abstract The determination of the spatially resolved calcium distribution and concentration in bone is essential for the assessment of bone quality. It enables the diagnosis and elucidation of bone diseases, the course of bone remodelling and the assessment of bone quality at interfaces to implants. With time-of-flight secondary ion mass spectrometry (ToF-SIMS) the calcium distribution in bone cross sections is mapped semi-quantitatively with a lateral resolution of up to 1 μm. As standards for the calibration of the ToF-SIMS data calcium hydroxyapatite collagen scaffolds with different compositions were synthesized. The standards were characterised by loss of ignition, x-ray diffractometry (XRD) and x-ray photoelectron spectroscopy (XPS). The secondary ion count rate for calcium and the calcium content of the standards show a linear dependence. The obtained calibration curve is used for the quantification of the calcium content in the bone of rats. The calcium concentration within an animal model for osteoporosis induction is monitored. Exemplarily the calcium content of the bones was quantified by XPS for validation of the results. Furthermore a calcium mass image is compared with an XPS image to demonstrate the better lateral resolution of ToF-SIMS which advances the locally resolved quantification of the calcium content. Keywords: Calcium quantification bone; Time of flight secondary ion mass spectrometry; Osteoporosis; Bone imaging Background Quantification of the mineral content in osseous tissue is important for assessing bone quality–especially in case of bone diseases like such as osteoporosis. Dual energy X-ray absorptiometry (DEXA) and quantitative compu- ted tomography (Q-CT) are widely used for the clinical diagnosis of osteoporosis [1,2]. With DEXA X-ray ab- sorption of the whole body is measured to determine the bone mineral density (BMD). However, DEXA does not sufficiently include bone thickness and bone volume when determining the BMD. Thus in clinical research micro-and nano-computed tomography (μ-CT and n- CT) with a spatial resolution of 10 μm or 10 nm, re- spectively, are often used for the complementary 3D analysis of bone architecture. Although DEXA and Q-CT are essential, these x-ray based methods are not chemically selective and do not allow the exclu- sive evaluation of the local Ca content. Therefore, in bone research additional spectrometric and spectroscopic methods are applied to determine the elemental composition of bone samples. These include atom absorption spectroscopy [3] or inductively coupled plasma optical emission spectroscopy (ICP-OES) of ashed and dissolved bone samples, mostly applied to prove and quantify elements like Pb, Na, K, Al, Mg as well as Ca and P in bone [4,5]. Also laser ablation combined with induc- tively coupled plasma mass spectrometry (LA-ICP-MS) al- lows quantitative analysis and imaging in the lower μm regions [6]. Zoehrer et al. used x-ray photoelectron spec- troscopy (XPS) to evaluate the calcium and phosphorous content as well as the Ca/P ratio to assess bone quality in case of fragility fractures of male patients [7]. In this study the well-established bone mineral density distribution (BMDD) was applied to characterise the degree and distri- bution of bone mineralisation. BMDD is calculated from backscattered electron images and is a validated method for the clinical use [8]. For the development of modified therapies and im- plants for patients with osteoporosis a profound know- ledge about the local calcium distribution and content, * Correspondence: [email protected] 1 Institute of Physical Chemistry, Justus-Liebig-University of Giessen, Heinrich-Buff-Ring 58, 35392 Giessen, Germany Full list of author information is available at the end of the article © 2013 Henss et al.; licensee Springer. This is an Open Access article distributed under the terms of the Creative Commons Attribution License (http://creativecommons.org/licenses/by/2.0), which permits unrestricted use, distribution, and reproduction in any medium, provided the original work is properly cited. Henss et al. Biointerphases 2013, 8:31 http://www.biointerphases.com/content/8/1/31
-
Upload
independent -
Category
Documents
-
view
0 -
download
0
Transcript of Quantification of calcium content in bone by using ToF-SIMS–a first approach

Henss et al. Biointerphases 2013, 8:31http://www.biointerphases.com/content/8/1/31
ORIGINAL ARTICLE Open Access
Quantification of calcium content in bone byusing ToF-SIMS–a first approachAnja Henss1, Marcus Rohnke1*, Sven Knaack2, Matthias Kleine-Boymann1, Thomas Leichtweiss1, Peter Schmitz1,Thaqif El Khassawna3, Michael Gelinsky2, Christian Heiss3,4 and Jürgen Janek1
Abstract
The determination of the spatially resolved calcium distribution and concentration in bone is essential for theassessment of bone quality. It enables the diagnosis and elucidation of bone diseases, the course of boneremodelling and the assessment of bone quality at interfaces to implants. With time-of-flight secondary ion massspectrometry (ToF-SIMS) the calcium distribution in bone cross sections is mapped semi-quantitatively with a lateralresolution of up to 1 μm. As standards for the calibration of the ToF-SIMS data calcium hydroxyapatite collagenscaffolds with different compositions were synthesized. The standards were characterised by loss of ignition, x-raydiffractometry (XRD) and x-ray photoelectron spectroscopy (XPS). The secondary ion count rate for calcium and thecalcium content of the standards show a linear dependence. The obtained calibration curve is used for thequantification of the calcium content in the bone of rats. The calcium concentration within an animal model forosteoporosis induction is monitored. Exemplarily the calcium content of the bones was quantified by XPS forvalidation of the results. Furthermore a calcium mass image is compared with an XPS image to demonstrate thebetter lateral resolution of ToF-SIMS which advances the locally resolved quantification of the calcium content.
Keywords: Calcium quantification bone; Time of flight secondary ion mass spectrometry; Osteoporosis; Bone imaging
BackgroundQuantification of the mineral content in osseous tissueis important for assessing bone quality–especially in caseof bone diseases like such as osteoporosis. Dual energyX-ray absorptiometry (DEXA) and quantitative compu-ted tomography (Q-CT) are widely used for the clinicaldiagnosis of osteoporosis [1,2]. With DEXA X-ray ab-sorption of the whole body is measured to determine thebone mineral density (BMD). However, DEXA does notsufficiently include bone thickness and bone volumewhen determining the BMD. Thus in clinical researchmicro-and nano-computed tomography (μ-CT and n-CT) with a spatial resolution of 10 μm or 10 nm, re-spectively, are often used for the complementary 3Danalysis of bone architecture. Although DEXA andQ-CT are essential, these x-ray based methods arenot chemically selective and do not allow the exclu-sive evaluation of the local Ca content.
* Correspondence: [email protected] of Physical Chemistry, Justus-Liebig-University of Giessen,Heinrich-Buff-Ring 58, 35392 Giessen, GermanyFull list of author information is available at the end of the article
© 2013 Henss et al.; licensee Springer. This is aAttribution License (http://creativecommons.orin any medium, provided the original work is p
Therefore, in bone research additional spectrometricand spectroscopic methods are applied to determine theelemental composition of bone samples. These includeatom absorption spectroscopy [3] or inductively coupledplasma optical emission spectroscopy (ICP-OES) of ashedand dissolved bone samples, mostly applied to prove andquantify elements like Pb, Na, K, Al, Mg as well as Ca andP in bone [4,5]. Also laser ablation combined with induc-tively coupled plasma mass spectrometry (LA-ICP-MS) al-lows quantitative analysis and imaging in the lower μmregions [6]. Zoehrer et al. used x-ray photoelectron spec-troscopy (XPS) to evaluate the calcium and phosphorouscontent as well as the Ca/P ratio to assess bone quality incase of fragility fractures of male patients [7]. In this studythe well-established bone mineral density distribution(BMDD) was applied to characterise the degree and distri-bution of bone mineralisation. BMDD is calculated frombackscattered electron images and is a validated methodfor the clinical use [8].For the development of modified therapies and im-
plants for patients with osteoporosis a profound know-ledge about the local calcium distribution and content,
n Open Access article distributed under the terms of the Creative Commonsg/licenses/by/2.0), which permits unrestricted use, distribution, and reproductionroperly cited.

Henss et al. Biointerphases 2013, 8:31 Page 2 of 8http://www.biointerphases.com/content/8/1/31
especially in the most stressed and most fractured re-gions of the skeleton, is highly eligible. Time-of-flightsecondary ion mass spectrometry (ToF-SIMS) as a sur-face sensitive technique is chemically specific and offershigh spatial resolution–its applicability for the investiga-tion of biological samples and biomaterials interfaceshas already been demonstrated in several cases so far[9,10]. In our previous studies ToF-SIMS was success-fully applied for the analysis of osteogenic differentiatedhMSCs, for tracking pharmaceuticals in a biomaterialfrom in vitro to in vivo experiments, as well as for theinvestigation and imaging of osteoporotic bone in ananimal model [11-13]. ToF-SIMS provided detailed che-mical information of bone with high sensitivity and alateral resolution of up to 300 nm. Mass images revealedthe distribution of the organic compounds as well as thelocalisation of mineralised parts of the bone. Assumingthe secondary ion count of calcium to be proportional toits surface concentration, a semi-quantitative compari-son of healthy and osteoporotic bone confirmed the re-duction of the calcium content in diseased tissue, asproven additionally by DEXA measurements [11].In the present paper a first step toward the quantita-
tive evaluation of the Ca content of bone is reported,thereby expanding the use of ToF-SIMS for the analysisof osseous tissue. Generally, quantification of concentra-tions using ToF-SIMS is challenging, as the ionisationprocess and hence the ion yields strongly depend on thechemical environment of the elements and molecules atthe surface [14]. Therefore appropriate standards withan almost identical chemical composition as the ana-lysed material are required, and the relative fragmentmass intensity of the analyte of interest should follow alinear relationship with its concentration in the standard.For quantification in biological systems internal stan-dards are often used to derive a calibration curve, orsensitivity factors are estimated from a model matrix[15]. For the quantification of Ca in healthy trabecularbone the standards should consist of collagen with60–70 wt% of mineralised hydroxyapatite (HAP) or cor-respondingly less for osteoporotic bone. Once the quanti-fication with ToF-SIMS is reliable, distinct additionalbenefit is gained. ToF-SIMS has a higher lateral resolutionin contrast to XPS, and in comparison with BMDD fromSEM images, ToF-SIMS allows to distinguish unequi-vocally between different elements (e.g. differentiation ofSr and Ca).
MethodsPreparation of the mineralised collagen standardsScaffolds from mineralised collagen I [16] were preparedby synchronous mineralisation of a collagen type I solu-tion according to a method developed by Bradt et al. [15].The procedure was published in detail elsewhere [17].
To describe the procedure briefly, acid-soluble colla-gen type I isolated from calf skin (Collaplex 1.0, GfN,Wald-Michelbach, Germany) was dissolved in 10 mMHCl and mixed with a CaCl2 solution. The pH was ad-justed to 7 by addition of TRIS and phosphate bufferand the mixture then warmed to 37°C for 12 h. Underthese conditions collagen fibril reassembly and forma-tion of nano-crystalline HAP occurs simultaneously.The product–homogeneously mineralised collagen fi-brils–was collected by centrifugation. By variation of thecollagen to calcium and phosphate ratio in the precursormixture the collagen to mineral ratio in the final productcould be adjusted.To prepare the standards, thoroughly resuspended
mineralised collagen was condensed by vacuum filtrationusing a porous G4 glass filter frit (Schott, Germany) andthen cross-linked with an aqueous solution of 1% N-(3-dimethylaminopropyl)-N’-ethyl carbodiimide hydro-chloride (EDC; Merck, Germany) for 1 h. Finally, thescaffolds were rinsed in distilled water, in 1% glycine so-lution, once again in water, and freeze dried.
XRD of standardsXRD analysis was carried out in scanning mode with CuKα and Cu Kβ radiation on a Panalytical X’Pert PRO in-strument. The Cu anode was operated at 40 kV and40 mA. Samples were rotated during measurement. Forthe data analysis only Cu Kα lines were used, and theXRD pattern was compared with entries in the ICSDdatabase.
X-ray photoelectron spectroscopy (XPS)XPS measurements were carried out with a PHI 5000Versaprobe Scanning ESCA Microprobe (Physical Elec-tronics) using a monochromatic Al Kα X-ray source(hv = 1486.6 eV).
Analysis of the standardsQuantitative analysis of the standard samples was per-formed by recording detailed spectra for the elements ofinterest. An x-ray spot size of 100 μm diameter was usedand the analyser pass energy was set to 23.5 eV. Aftersubtraction of a Shirley-type background function, elem-ental concentrations were calculated from the peak areasby applying the appropriate sensitivity factors (providedby the instrument manufacturer). Assuming that all Caoriginates from HAP (formula Ca5(PO4)3OH), the HAPcontent is evaluated on the basis of the Ca content inat% and wt%.
Analysis of bone cross sectionsElemental mapping was carried out for C 1s (for energycalibration) O 1s, N 1s, P 2p and Ca 2p lines with a passenergy of 93.9 eV and a spot size of the focussed x-ray

Henss et al. Biointerphases 2013, 8:31 Page 3 of 8http://www.biointerphases.com/content/8/1/31
beam of 15 μm in diameter at 2.5 W. The energy inter-val of each signal was partitioned into sixteen intervals,each of them was than assigned to one specific channelof the multi-channel detector to reduce measurementtime. The analysed area was 500 × 500 μm2 divided in128 × 128 pixels.In addition to the XPS imaging detailed point spectra
were recorded on the same areas that were investigatedby mapping. We therefore selected three spots of inter-est on every sample, which were a) on the trabecularstructure, b) on the edge of the trabecular and c) on anarea far away from the trabecular. Here, we recorded de-tail spectra for C 1s (for energy calibration) O 1s, N 1s,P 2p and Ca 2p with a spot size of 15 μm in diameter at2.5 W. The pass energy was set to 23.5 eV. Elementalconcentrations were calculated as described above.For evaluation of the HAP content of the bone sam-
ples we used a calibration factor F (F = 1.15), which wasdetermined by the ratio of the measured and the nom-inal Ca content obtained by the analysis of pure hy-droxyapatite as reference material. Further details of theXPS analysis of calcium phosphate phases and syste-matic errors of calculated Ca and P concentrations aredescribed elsewhere (Kleine-Boymann M, Rohnke M,Sann J, Henss A, Janek J, Differentiation of biologicallyrelevant calcium phosphate phases by surface-sensitivetechniques, submitted to Appl Surf Sci).
Time-of-flight secondary ion mass spectrometry(ToF-SIMS)ToF-SIMS data of the standards and bone samples werecollected in the positive ion mode on a TOF.SIMS5–100 machine (IonTOF Company, Münster, Germany)equipped with a bismuth cluster primary ion source(25 keV) and Cs, O2 and C60 sputter guns. Spectra wereacquired using 25 keV Bi3
+ primary ions (~0.3 pA pulsedcurrent) with a primary ion dose of ~7·1012 cm−2,100 μs cycle time and operated in the high-current-bunched mode (hc-bu). Ions were registered within themass range from m/z = 1 to 800 u with high mass reso-lution of about 6000 FWHM (full width half maximum)at m/z = 29.00 u (e.g. the fragment CHO) and a spatialresolution of < 10 μm. Six to seven measurements weretaken of each prepared standard material on differentareas of 49.5 × 49.5 μm2 with 128 × 128 pixels and 50scans. The analysis of the Ca concentration of trabecularbone was carried out by measurement of 3–5 areas of asize of 49.5 × 49.5 μm2 on the trabeculae of each sample.After normalization to the applied primary ion current,the mean values for the Ca signal intensity of the variousgroups were calculated. Due to the linear dependence ofthe normalized Ca-signal intensity from the HAP con-tent of the scaffolds, a linear fit was possible and a linearequation (1) was obtained. The equation reveals the
dependence of the signal intensity (I (counts)) fromthe HAP content (x (wt%)) by the factor 9265� 581ð Þcountswt%
� �, slope of the line respectively. So for the sub-
sequent calculation of the HAP content equation (1)was used.
I countsð Þ ¼ 9265� 581ð Þ countswt%
� �⋅ x wt%ð Þ ð1Þ
The mass image was taken in the low current bunchedmode (lc-bu), where good mass resolution is combinedwith an optimized lateral resolution of about 1 μm. Theapplied primary ion current was 0.13 pA.
Sample preparation of bone cross sectionsFor the application and testing of the calibration curvebone samples from a long-term small animal model forosteoporosis induction were used. Osteoporosis was in-duced in female Sprague–Dawley rats by ovariectomy(OVX) combined with a special multi-deficiency diet. Theanimal study was performed in full compliance to theGerman animal protection laws and was approved bythe ethical commission of the local governmental in-stitution (“Regierungspräsidium” Giessen, Germany,permit number: 89/2009 & 20/10-No. A31/2009). Theprotocol and procedures employed in the animal ex-periment were reported previously in detail [18].Vertebrae samples of three different groups were ana-
lysed: A sham group with 13 animals (time of euthanasiain months, number of animals; 3, 7; 12, 6), OVX + dietgroup with 14 animals (3, 7; 12, 7) and the referencegroup with 8 animals at the beginning of the experiment(0, 8). After euthanasia at distinct times (0, 3, and 12)the vertebrae samples were embedded in poly methylmethacrylate (Technovit 9100; Heraeus Kulzer, Hanau,Germany) and afterwards cut and ground into slides of20 μm–50 μm thickness.
Statistical analysisThe data were checked for statistical significance by theone-way ANOVA test accompanied by Games-Howellpair wise multiple comparisons to determine the vari-ation of the Ca content in each group, among groups atparticular times and throughout the whole experiment.The asterisks indicate the significance level (* p < 0.05,** p < 0.01, *** p < 0.001). The results were expressedas mean and standard error. The statistical analysiswas done using the software IBM SPSS Statistics 20.
Results and discussionThe mineralised collagen scaffolds have been synthesizedin a synchronous biomineralisation process leading to anano-composite material of collagen fibrils and nano-crystalline HAP. The formation of an apatite-like phase

1000
2000
3000
4000
Impu
lse
10 20 4030 50 60 70 80 900Position [°2Theta] (Cu)
Figure 1 X-ray diffraction pattern (XRD) of nano-crystallinehydroxyapatite (HAP) mineralised on a collagen scaffold (CuKαradiation). The pattern from ICSD database is shown in red colour.
Henss et al. Biointerphases 2013, 8:31 Page 4 of 8http://www.biointerphases.com/content/8/1/31
has been proven by x-ray diffraction (XRD), shown inFigure 1. The scaffolds have also been characterized indetail by infrared spectroscopy (IR) [19] and SEM [17]and its micro-porous 3-D modification by SEM andTEM [20]. Several samples with different HAP content(weight per cent) were produced by varying the ratio ofcollagen and calcium phosphate precursor. To reveal theexact composition, the samples were ashed completelyand the Ca content was calculated from the residue. Pre-vious studies showed that the scaffolds still contain asmall part of water but apart from that they are exclu-sively composed of collagen and minerals. So the HAPcontent was found to be 54–81 wt% with 14–41 wt%collagen, which is an appropriate composition for theuse of these materials as standard materials for thequantification of healthy and osteoporotic bone viaToF-SIMS. The results of the bulk analysis are givenin Table 1.As ToF-SIMS is a purely surface sensitive technique in
the static mode, only the uppermost molecular layers areanalysed. Inhomogeneous samples or surface segregationcan result in different bulk and surface compositions.Thus, bulk information (like HAP content) as deter-mined by ignition loss of the standard materials is notfeasible in any case for the quantitative evaluation of theCa content with ToF-SIMS. Therefore XPS was appliedas a surface sensitive and quantitative method to de-termine the surface content of Ca. Based on this, theHAP content was calculated assuming the sum formulaCa5(PO4)3OH. A typical survey spectrum is shown inFigure 2a. It indicates the main components carbon,oxygen, calcium and phosphorous, as expected. The re-sults of the quantification of the HAP content at the
Table 1 HAP content of the mineralised collagen scaffolds
Sample S 1 S 2 S 3
Bulk (Ignition) HAP (wt%) 67 54.2 78.4
Surface (XPS) HAP (wt%) 40.8 8.8 69.1
HAP content evaluated by ignition loss and by XPS measurements (surface content
surface are given in Table 1. They show a significant sys-tematic deviation to lower values from the bulk valuesobtained by ashing. McLeod et al. also found a signifi-cant difference between the Ca/P ratio of bulk and sur-face for deposited layers of HAP [21]. They also detecteda decreased Ca/P ratio on the surface compared to thebulk material. This might be due to a Ca deficit on HAPsurfaces like observed by us with our standards andwhich has been reported in other studies as well [22,23].Figure 2b shows the linear correlation between the mea-sured surface concentration of Ca and the bulk contentof HAP (wt%) given by ignition loss of the samples.The subsequent ToF-SIMS analysis of the standards
showed mass signals (ion, m/z value;) of HAP and colla-gen like Ca+, 39.96; Ca2PO4
+, 174.87; Ca3PO5+, 230.83;
Ca5P3O12+ , 484.12 and C4H8N
+, 70.07 for example. Atypical positive mass spectrum with some more labelledHAP fragments is given in Figure 3b. The comparisonwith mass spectra of mineralised tissue reveals almostidentical mass spectra with characteristic peaks and frag-mentation patterns of HAP and collagen, which are wellknown from our study of bony tissue amongst others[11,24]. The plot of the obtained signal intensities of Caversus the surface concentration obtained from XPS mea-surements results in a linear relationship, see Figure 3c.This linear correlation is an important prerequisite for thetarget quantification. It demonstrates that the matrix ef-fect is negligible within the concentration ranges of about9–76 wt% HAP and that quantification is well possible.Nevertheless, the error bars indicate an appreciabledeviation of the Ca signal intensities measured withToF-SIMS. The surfaces of the standards were surely notideally planar which influenced the signal intensityand is responsible for part of the error. However, des-pite of the effect of the sample roughness the linearrelationship between Ca signal intensity and Ca con-tent clearly indicates that the samples are suitable stan-dards within the error tolerances for a first approach of Caquantification of bone.After analysis of the standards several cross sections of
rat vertebrae were analysed using the same measurementconditions. The osteoporotic induction applied over se-veral months allows a tracking of the degradation of thebone which comes along with a reduction of the bonemineral content and density [18]. In a previous studythese results were confirmed by a semi quantitative ana-lysis of the Ca content [11]. Applying the linear equation(1) of diagram 3c, the semi-quantitative evaluation is
S 4 S 5 S6 S7 S8 S9
81.2 59.4 69.7 76.1 62.1 72.9
74.7 21.9 49.9 69.3 26.6 50.1
): The mean error for the quantification by XPS accounts to ±10%.

50 60 70 90
10
20
30
40
50
60
70
80
0
HA
P c
onte
nt (
wt%
) by
XPS
HAP content (wt%) ignition residueBinding Energy (eV)0100200300400500600
O1s
Ca2s N1s
Ca2p
C1s
P2s P2pO2p
Inte
nsity
(a.
u.)
a b
Figure 2 XPS survey spectrum and cross correlation for surface and bulk concentrations. a) Exemplary XPS survey spectrum of amineralised scaffold showing the five compositional elements Ca, P, N, C, O and b) the linear relationship of the HAP content evaluated by XPSversus the HAP content determined by ignition residue of the mineralised collagen standards.
Henss et al. Biointerphases 2013, 8:31 Page 5 of 8http://www.biointerphases.com/content/8/1/31
improved to become a truly quantitative analysis of theHAP content as shown in Figure 3d. The results aregiven in Table 2.The obtained mean values for the HAP content of the
analysed trabeculae agree well with the realistic range ofHAP concentration for healthy bone. It is known thathealthy bone consists of about 70% HAP [25], which isin fairly good agreement with the result of 62% HAPat the beginning of the animal experiment (referencegroup). Due to the maturing of the animals an increaseof the HAP content is expected and is documented by
Figure 3 ToF-SIMS data from standards and rat bone. a) Schematic graspectrum of a mineralised scaffold showing the expected HAP fragments uCa-signal intensity from the HAP content of the scaffolds. Linear fit and theresults for different groups and different times after osteoporosis induction
76% HAP after 3 months for the sham operated, healthyanimals. Beside this a remarkable and statistical signifi-cant reduction of about 50% of the HAP content for theosteoporotic animals (OVX + diet group) can be found.However, the extreme reduction revealed by ToF-SIMSmeasurements is plausible and a qualitative comparisonwith BMD evaluated by DEXA measurements shows thesame tendencies although not to this extent [18]. Due tothe experimental conditions, like the Ca and Vitamin Ddeficient diet, wide regions of the trabeculae are notmineralised anymore, which indicates rather osteomalacia
ph of the ToF-SIMS analysis of trabecular bone. b) Positive ion massp to high masses [24]. c) Linear dependence of the normalizedlinear equation are shown. d) Summary of the Ca quantificationin rats.
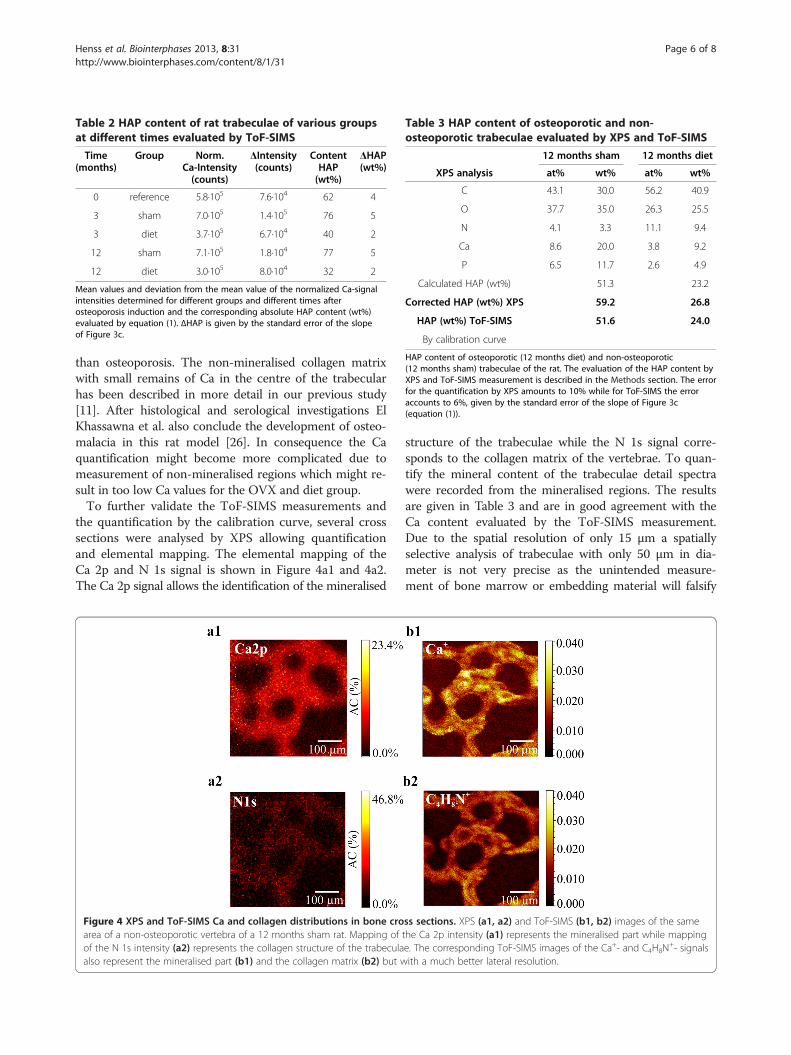
Table 2 HAP content of rat trabeculae of various groupsat different times evaluated by ToF-SIMS
Time(months)
Group Norm.Ca-Intensity(counts)
ΔIntensity(counts)
ContentHAP(wt%)
ΔHAP(wt%)
0 reference 5.8·105 7.6·104 62 4
3 sham 7.0·105 1.4·105 76 5
3 diet 3.7·105 6.7·104 40 2
12 sham 7.1·105 1.8·104 77 5
12 diet 3.0·105 8.0·104 32 2
Mean values and deviation from the mean value of the normalized Ca-signalintensities determined for different groups and different times afterosteoporosis induction and the corresponding absolute HAP content (wt%)evaluated by equation (1). ΔHAP is given by the standard error of the slopeof Figure 3c.
Table 3 HAP content of osteoporotic and non-osteoporotic trabeculae evaluated by XPS and ToF-SIMS
12 months sham 12 months diet
XPS analysis at% wt% at% wt%
C 43.1 30.0 56.2 40.9
O 37.7 35.0 26.3 25.5
N 4.1 3.3 11.1 9.4
Ca 8.6 20.0 3.8 9.2
P 6.5 11.7 2.6 4.9
Calculated HAP (wt%) 51.3 23.2
Corrected HAP (wt%) XPS 59.2 26.8
HAP (wt%) ToF-SIMS 51.6 24.0
By calibration curve
HAP content of osteoporotic (12 months diet) and non-osteoporotic(12 months sham) trabeculae of the rat. The evaluation of the HAP content byXPS and ToF-SIMS measurement is described in the Methods section. The errorfor the quantification by XPS amounts to 10% while for ToF-SIMS the erroraccounts to 6%, given by the standard error of the slope of Figure 3c(equation (1)).
Henss et al. Biointerphases 2013, 8:31 Page 6 of 8http://www.biointerphases.com/content/8/1/31
than osteoporosis. The non-mineralised collagen matrixwith small remains of Ca in the centre of the trabecularhas been described in more detail in our previous study[11]. After histological and serological investigations ElKhassawna et al. also conclude the development of osteo-malacia in this rat model [26]. In consequence the Caquantification might become more complicated due tomeasurement of non-mineralised regions which might re-sult in too low Ca values for the OVX and diet group.To further validate the ToF-SIMS measurements and
the quantification by the calibration curve, several crosssections were analysed by XPS allowing quantificationand elemental mapping. The elemental mapping of theCa 2p and N 1s signal is shown in Figure 4a1 and 4a2.The Ca 2p signal allows the identification of the mineralised
Figure 4 XPS and ToF-SIMS Ca and collagen distributions in bone croarea of a non-osteoporotic vertebra of a 12 months sham rat. Mapping ofof the N 1s intensity (a2) represents the collagen structure of the trabeculaalso represent the mineralised part (b1) and the collagen matrix (b2) but w
structure of the trabeculae while the N 1s signal corre-sponds to the collagen matrix of the vertebrae. To quan-tify the mineral content of the trabeculae detail spectrawere recorded from the mineralised regions. The resultsare given in Table 3 and are in good agreement with theCa content evaluated by the ToF-SIMS measurement.Due to the spatial resolution of only 15 μm a spatiallyselective analysis of trabeculae with only 50 μm in dia-meter is not very precise as the unintended measure-ment of bone marrow or embedding material will falsify
ss sections. XPS (a1, a2) and ToF-SIMS (b1, b2) images of the samethe Ca 2p intensity (a1) represents the mineralised part while mappinge. The corresponding ToF-SIMS images of the Ca+- and C4H8N
+- signalsith a much better lateral resolution.

Henss et al. Biointerphases 2013, 8:31 Page 7 of 8http://www.biointerphases.com/content/8/1/31
the result. ToF-SIMS offers a much better lateral reso-lution and indeed enables analysis with sufficient spatialresolution. Figure 4b1 and 4b2 show ToF-SIMS imagesrecorded with a lateral resolution of 1 μm for comparisonwith the XPS-map of the same region (Figure 4a).Finally, we like to note that further improvements will
be possible. Trabecular bone does not consist of pureHAP, rather it is known that HAP is only the final phaseof matured bone. During the process of bone formationdifferent Ca phosphate phases like amorphous calciumphosphate (ACP) or octa calcium phosphate (OCP) areformed [27]. At the end of this process usually a Ca defi-cient HAP phase is found. Moreover, the matured HAPis not a pure hydroxyapatite mineral. Also other anionslike fluoride or carbonate are part of the crystal structure[28]. Therefore our current approach to equate the Cacontent with the HAP content of the bone samples ac-cording to the formula Ca5(PO4)3OH should only beconsidered as a first successful step. It is a quite challen-ging task to synthesise and test standards, which arecomparable to natural bone in composition, lattice struc-ture of the crystalline component, density and surfaceroughness. However, optimized standards will help tofurther improve the validity of ToF-SIMS data.
ConclusionsCalcium quantification by ToF-SIMS is possible, how-ever, the quality of the results is strongly affected by thesurface properties of the standards. Although the stan-dards consisted of collagen and HAP comparable to nor-mal bone–which makes the matrix-effect differences ofthe standards and bone negligible–the surface roughnessis not really suitable for the ToF-SIMS measurements.Despite the influence of the surface morphology, thepresent results are encouraging. A linear relation is ob-tained between the Ca secondary ion counts rate andthe Ca concentration of the prepared standards. The ap-plication of the calibration data to natural rat bone sam-ples leads to plausible results, which were cross-checkedby XPS measurements. As the ToF-SIMS analysis offersinformation on both organic and inorganic componentsof osseous tissue with high spatial resolution, the quanti-fication of the Ca content based on the ToF-SIMS mea-surements might become a useful and complementarymethod to assess bone quality and damage. Future workon improved standards will allow a more precise quanti-fication with smaller error. The mapping of various Caconcentrations and of different calcium phosphate pha-ses to track the mineralisation process will be furtheruseful applications of ToF-SIMS.
Competing interestsThe authors declare that they have no competing interests.
Authors’ contributionsAH carried out the ToF-SIMS measurements, evaluated and interpreted thedata and drafted the manuscript. MR assisted in the design of the experi-ments, data evaluation and revised the manuscript. SK synthesized andashed the standard materials. MKB and TL carried out the XPS measurementsand XPS data evaluation. PS recorded the shown ToF-SIMS image. CH andTEK designed and carried out the animal experiments including samplepreparation. MG has been involved in drafting the manuscript. JJ adjustedand proofread the manuscript. All authors read and approved the finalmanuscript.
AcknowledgementWe gratefully acknowledge funding and support by the DeutscheForschungsgemeinschaft (DFG, German Research Foundation) within thecollaborative research centre–SFB/TRR 79 “Materials for tissue regenerationwithin systemically altered bone”, projects M5, M4 and T1.
Author details1Institute of Physical Chemistry, Justus-Liebig-University of Giessen,Heinrich-Buff-Ring 58, 35392 Giessen, Germany. 2Centre for TranslationalBone, Joint and Soft Tissue Research, Technische Universität Dresden,Fetscherstrasse 74, 01307 Dresden, Germany. 3Laboratory of ExperimentalTrauma Surgery, University of Giessen, Kerkrader Strasse 9, 35394 Giessen,Germany. 4Department of Trauma Surgery, University Hospital ofGiessen-Marburg, Rudolf-Buchheim-Strasse 7, 35385 Giessen, Germany.
Received: 2 October 2013 Accepted: 4 November 2013Published: 14 November 2013
References1. Blake GM, Fogelman I (2007) The role of DXA bone density scans in the
diagnosis and treatment of osteoporosis. Postgrad Med J 83(982):509–5172. Engelke K, Adams JE, Armbrecht G, Augat P, Bogado CE, Bouxsein ML, et al.
(2008) Clinical use of quantitative computed tomography and peripheralquantitative computed tomography in the management of osteoporosis inadults: the 2007 ISCD official positions. J Clin Densitom 11(1):123–162
3. Haase A, Arlinghaus H, Tentschert J, Jungnickel H, Graf P, Mantion A, et al.(2011) Application of laser postionization secondary neutral massspectrometry/time-of-flight secondary ion mass spectrometry innanotoxicology: visualization of nanosilver in human macrophages andcellular responses. ACS Nano 5(4):3059–3068
4. Hasegawa T, Matsuura H, Inagaki K, Haraguchi H (2003) Major-to-ultratraceelements in bone-marrow fluid as determined by ICP-AES and ICP-MS.Anal Sci 19(1):147–150
5. Noor Z, Sumitro SB, Hidayat M, Rahim AH, Sabarudin A, Umemura T (2012)Atomic mineral characteristics of Indonesian osteoporosis by high-resolution inductively coupled plasma mass spectrometry. Sci World J372972
6. Hare D, Austin C, Doble P (2012) Quantification strategies for elementalimaging of biological samples using laser ablation-inductively coupledplasma-mass spectrometry. Analyst 137(7):1527–1537
7. Zoehrer R, Perilli E, Kuliwaba JS, Shapter JG, Fazzalari NL, Voelcker NH (2012)Human bone material characterization: integrated imaging surfaceinvestigation of male fragility fractures. Osteoporos Int 23(4):1297–1309
8. Roschger P, Paschalis EP, Fratzl P, Klaushofer K (2008) Bone mineralizationdensity distribution in health and disease. Bone 42(3):456–466
9. Palmquist A, Emanuelsson L, Sjovall P (2012) Chemical and structuralanalysis of the bone-implant interface by TOF-SIMS, SEM, FIB and TEM:experimental study in animal. Appl Surf Sci 258(17):6485–6494
10. Fletcher JS, Vickerman JC, Winograd N (2011) Label free biochemical 2Dand 3D imaging using secondary ion mass spectrometry. Curr Opin ChemBiol 15(5):733–740
11. Henss A, Rohnke M, El Khassawna T, Govindarajan P, Schlewitz G, Heiss C,et al. (2013) Applicability of ToF-SIMS for monitoring compositional changesin bone in a long-term animal model. J R Soc Interface 10(86):20130332
12. Kokesch-Himmelreich J, Schumacher M, Rohnke M, Gelinsky M, Janek J(2013) ToF-SIMS analysis of osteoblast-like cells and their mineralizedextracellular matrix on strontium enriched bone cements. Biointerphases 8
13. Rohnke M, Henss A, Kokesch-Himmelreich J, Schumacher M, Ray S, Alt V,et al. (2013) Mass spectrometric monitoring of Sr-enriched bone cements—from in vitro to in vivo. Anal Bioanal Chem 405(27):8769–8780

Henss et al. Biointerphases 2013, 8:31 Page 8 of 8http://www.biointerphases.com/content/8/1/31
14. Vickerman JC, Briggs D (2013) ToF-SIMS: Materials Analysis by MassSpectrometry, 2nd edition. IM Publications LLP and Surface Spectra Limited,Chichester, UK
15. Belu AM, Graham DJ, Castner DG (2003) Time-of-flight secondary ion massspectrometry: techniques and applications for the characterization ofbiomaterial surfaces. Biomaterials 24(21):3635–3653
16. Burth R, Gelinsky M, Pompe W (1999) Collagen-hydroxyapatite tapes–a newimplant material. Tech Textile 8:20–21
17. Bernhardt A, Lode A, Boxberger S, Pompe W, Gelinsky M (2008) Mineralisedcollagen–an artificial, extracellular bone matrix–improves osteogenicdifferentiation of bone marrow stromal cells. J Mater Sci Mater Med19(1):269–275
18. Heiss C, Govindarajan P, Schlewitz G, Hemdan N, Schliefke N, Alt V, et al.(2012) Induction of osteoporosis with its influence on osteoporoticdeterminants and their interrelationships in rats by DEXA. Med Sci Monit18(6)
19. Bradt JH, Mertig M, Teresiak A, Pompe W (1999) Biomimetic mineralizationof collagen by combined fibril assembly and calcium phosphate formation.Chem Mater 11(10):2694–2701
20. Gelinsky M, Welzel PB, Simon P, Bernhardt A, Konig U (2008) Porous three-dimensional scaffolds made of mineralised collagen: preparation andproperties of a biomimetic nanocomposite material for tissue engineeringof bone. Chem Eng J 137(1):84–96
21. McLeod K, Kumar S, Dutta NK, Smart RSC, Voelcker NH, Anderson GI(2010) X-ray photoelectron spectroscopy study of the growth kinetics ofbiomimetically grown hydroxyapatite thin-film coatings. Appl Surf Sci256(23):7178–7185
22. Lu HB, Campbell CT, Graham DJ, Ratner BD (2000) Surface characterizationof hydroxyapatite and realted calcium phosphates by XPS and TOF-SIMS.Anal Chem 72:2886–2894
23. Chusuei CC, Goodman DW, Van Stipdonk MJ, Justes DR, Schweikert EA(1999) Calcium phosphate phase identification using XPS and time-of-flightcluster SIMS. Anal Chem 71(1):149–153
24. Malmberg P, Nygren H (2008) Methods for the analysis of the compositionof bone tissue, with a focus on imaging mass spectrometry (TOF-SIMS).Proteomics 8(18):3755–3762
25. Vanselow K, Heuck F (2005) Radiologische Analyse des Knochen. SpringerMedizin Verlag, Heidelberg, Germany
26. El Khassawna T, Boecker W, Govindarajan P, Schliefke N, Huerter B,Kampschulte M, et al. (2013) Effects of multi-deficiencies-diet on boneparameters of peripheral bone in ovariectomized mature rat. PLoS One 8(8)
27. Campi G, Ricci A, Guagliardi A, Giannini C, Lagomarsino S, Cancedda R, et al.(2012) Early stage mineralization in tissue engineering mapped by highresolution X-ray microdiffraction. Acta Biomater 8(9):3411–3418
28. Rey C, Combes C, Drouet C, Glimcher MJ (2009) Bone mineral: update onchemical composition and structure. Osteoporos Int 20(6):1013–1021
doi:10.1186/1559-4106-8-31Cite this article as: Henss et al.: Quantification of calcium content inbone by using ToF-SIMS–a first approach. Biointerphases 2013 8:31.
Submit your manuscript to a journal and benefi t from:
7 Convenient online submission
7 Rigorous peer review
7 Immediate publication on acceptance
7 Open access: articles freely available online
7 High visibility within the fi eld
7 Retaining the copyright to your article
Submit your next manuscript at 7 springeropen.com


![Reg. No. [TITTITT 15] - Sims Library](https://static.fdokumen.com/doc/165x107/631b195a19373759090eb4a3/reg-no-tittitt-15-sims-library.jpg)

