Simple to sample: Vascular plants as surrogate group in a nature reserve
10
Journal for Nature Conservation 18 (2010) 2—11 Simple to sample: Vascular plants as surrogate group in a nature reserve E. Santi a , S. Maccherini a,b, , D. Rocchini a,b , I. Bonini a , G. Brunialti a,b , L. Favilli a , C. Perini a , F. Pezzo a , S. Piazzini a , E. Rota a , E. Salerni a , A. Chiarucci a,b a Dipartimento di Scienze Ambientali ‘‘G. Sarfatti’’, Universita` di Siena, Via P.A. Mattioli 4, 53100 Siena, Italy b TerraData s.r.l. environmetrics, via P.A. Mattioli 4, 53100 Siena, Italy Received 2 October 2008; accepted 9 February 2009 KEYWORDS Conservation biology; Cross-taxon congruence; Species composition; Species richness; Surrogate Summary One of the basic tools to quantify biodiversity is based on the use of surrogate species. Such groups of species are easily assessed and may reflect the diversity of other important and less easily detectable taxa (cross-taxon surrogacy). Among these key groups of species, the vascular plant flora has great potential in determining diversity of other groups, since in terrestrial ecosystems it constitutes the bulk of total biomass and provides the physical structure for other organisms. The cross-taxon congruence of species diversity (species richness and species composition) among vascular plants, bryophytes, lichens, fungi, oligochaetes, butterflies and birds was investigated with special attention to testing the potential role of vegetation as surrogate for the other studied taxa. The 271 ha Nature Reserve ‘‘Bosco di S. Agnese’’ (Tuscany, Italy) characterised by evergreen Mediterranean woodlands, scrublands, garigues, xeric grasslands and cultivations was used as study area. A multi-scale sampling design, based on a restricted random selection of plots, was used to get information about vascular plants, bryophytes, lichens, fungi, oligochaetes, butterflies and birds. The congruence in species richness and composition among the different taxa was tested by Spearman rank correlation coefficient. Most of the pair-wise comparisons showed weak and statistically not significant correlations for both species richness and compositional data, indicating a limited cross-taxon congruence. Species richness of vascular plants was significantly correlated only to that of birds and butterflies. Compositional patterns were congruent only between vascular plants and butterflies. The results of this study ARTICLE IN PRESS www.elsevier.de/jnc 1617-1381/$ - see front matter & 2009 Elsevier GmbH. All rights reserved. doi:10.1016/j.jnc.2009.02.003 Corresponding author at: Dipartimento di Scienze Ambientali ‘‘G. Sarfatti’’, Universita ` di Siena, Via P.A. Mattioli 4, 53100 Siena, Italy. Tel.: +390577232874. E-mail address: [email protected] (S. Maccherini).
-
Upload
independent -
Category
Documents
-
view
4 -
download
0
Transcript of Simple to sample: Vascular plants as surrogate group in a nature reserve
ARTICLE IN PRESS
Journal for Nature Conservation 18 (2010) 2—11
1617-1381/$ - sdoi:10.1016/j.
�CorrespondItaly. Tel.: +39
E-mail addr
www.elsevier.de/jnc
Simple to sample: Vascular plants as surrogategroup in a nature reserve
E. Santia, S. Maccherinia,b,�, D. Rocchinia,b, I. Boninia,G. Brunialtia,b, L. Favillia, C. Perinia, F. Pezzoa, S. Piazzinia,E. Rotaa, E. Salernia, A. Chiaruccia,b
aDipartimento di Scienze Ambientali ‘‘G. Sarfatti’’, Universita di Siena, Via P.A. Mattioli 4, 53100 Siena, ItalybTerraData s.r.l. environmetrics, via P.A. Mattioli 4, 53100 Siena, Italy
Received 2 October 2008; accepted 9 February 2009
KEYWORDSConservationbiology;Cross-taxoncongruence;Species composition;Species richness;Surrogate
ee front matter & 2009jnc.2009.02.003
ing author at: Dipartime0577232874.ess: [email protected]
SummaryOne of the basic tools to quantify biodiversity is based on the use of surrogatespecies. Such groups of species are easily assessed and may reflect the diversity ofother important and less easily detectable taxa (cross-taxon surrogacy). Amongthese key groups of species, the vascular plant flora has great potential indetermining diversity of other groups, since in terrestrial ecosystems it constitutesthe bulk of total biomass and provides the physical structure for other organisms.The cross-taxon congruence of species diversity (species richness and speciescomposition) among vascular plants, bryophytes, lichens, fungi, oligochaetes,butterflies and birds was investigated with special attention to testing the potentialrole of vegetation as surrogate for the other studied taxa. The 271 ha Nature Reserve‘‘Bosco di S. Agnese’’ (Tuscany, Italy) characterised by evergreen Mediterraneanwoodlands, scrublands, garigues, xeric grasslands and cultivations was used as studyarea. A multi-scale sampling design, based on a restricted random selection of plots,was used to get information about vascular plants, bryophytes, lichens, fungi,oligochaetes, butterflies and birds. The congruence in species richness andcomposition among the different taxa was tested by Spearman rank correlationcoefficient. Most of the pair-wise comparisons showed weak and statistically notsignificant correlations for both species richness and compositional data, indicating alimited cross-taxon congruence. Species richness of vascular plants was significantlycorrelated only to that of birds and butterflies. Compositional patterns werecongruent only between vascular plants and butterflies. The results of this study
Elsevier GmbH. All rights reserved.
nto di Scienze Ambientali ‘‘G. Sarfatti’’, Universita di Siena, Via P.A. Mattioli 4, 53100 Siena,
t (S. Maccherini).
ARTICLE IN PRESS
Simple to sample: Vascular plants as surrogate group in a nature reserve 3
indicated that neither vascular plants nor any other taxonomic group is a validsurrogate in this nature reserve.& 2009 Elsevier GmbH. All rights reserved.
Introduction
The growing impact of human activities onnatural ecosystems leads to a pressing need fordevelopment of straightforward methodologies forquantifying and monitoring biodiversity (Colwell &Coddington 1994; Gaston 2000; Harper & Hawksworth1994; Kati et al. 2004). The proper managementand monitoring of ecosystems and nature reservesrequire high-quality biological data, but timeand costs often prevent the collection of a greatamount of such data. The quantification of totalspecies richness is practically impossible becauseof (i) the high number of species found in severalhabitats (Gaston 1996; Palmer 1995); and (ii) theimpossibility of applying complete and objectivespecies inventories (Palmer et al. 2002). Moreover,an apparent flaw in the systematic knowledge ofcertain taxonomic groups inevitably hampers theuse of such groups for monitoring aims (Chiarucciet al. 2007; Palmer 1995).
In conservation biology, one of the basic toolsfor quick and economic measurements involves theuse of surrogate species (Caro & O’Doherty 1999;Favreau et al. 2006; Lindenmayer et al. 2000).Taxon surrogacy hypothesis is based on the assump-tion of a concordance among the species richness orcompositional patterns across different taxonomicgroups (i.e. cross-taxon congruence, Howard et al.1998; Lamoreux et al. 2006; Lund & Rahbek 2002;Prendergast et al. 1993; Su et al. 2004). Inparticular, some groups of organisms seem to becorrelated with the diversity of the other groups.Among these, vascular plants are certainly afundamental component for the structuring andfunctioning of terrestrial ecosystems; they consti-tute the bulk of net primary productivity andthey represent an important taxon for the selectionof nature reserves (see Ryti 1992). Moreover,sampling vascular plants is relatively easy (Pharoet al. 2000) and their taxonomy is sufficiently welldescribed and standardised. Vascular plant speciesrichness has been positively correlated with speciesrichness of bryophytes (Sætersdal et al. 2003;Sauberer et al. 2004), lichens (Dynesius & Zinko2006; Sætersdal et al. 2003), fungi (Sætersdalet al. 2003) and animal groups such as butterflies(Hawkins & Porter 2003; Howard et al. 1998) andbirds (Kati et al. 2004; Qian 2007; Vessby et al.2002).
The importance of compositional data has re-cently been demonstrated by Su et al. (2004) andby Simila et al. (2006), who found a high correlationbetween patterns of species composition of differ-ent taxa, despite their incongruence in speciesrichness. Vascular plants species composition hasbeen positively correlated with that of bryophytes(Chiarucci et al. 2007; Sætersdal et al. 2003),lichens (Pharo et al. 2000; Sætersdal et al. 2003),fungi (Chiarucci et al. 2005; Packham et al. 2002),butterflies (Howard et al. 1998; Maccherini et al.2009; Su et al. 2004) and birds (Howard et al. 1998;Su et al. 2004). Reyers and Jaarsveld (2000) suggestthat different techniques can produce dissimilarand even contrasting results for the same data set,but not necessarily contradictory because differenttechniques assess different aspects of speciesdiversity. However few researchers have directlycompared patterns of cross-taxon congruencein species richness and community composition(Howard et al. 1998; Oertli et al. 2005; Simila et al.2006; Su et al. 2004). Many authors have analysedcross-taxon congruence, but the results are frag-mentary and only partially in agreement even withrespect to the same taxa (Howard et al. 1998; Katiet al. 2004; Negi & Gadgil 2002; Oertli et al. 2005;Prendergast et al. 1993; Ricketts et al. 2002;Schouten et al. 2009; Simila et al. 2006; Su et al.2004; Vessby et al. 2002). Because of thesecontrasting results, the practical value of biodiver-sity indicators requires rigorous testing beforeimplementation (Gustafsson 2000).
Following this view, cross-taxon congruence canbe investigated by comparing species richnessat individual site (a-diversity), or the variationin species composition among sites (b-diversity,Whittaker 1972). Some authors (e.g. Legendre2007) considered b-diversity an interesting ‘‘cur-rency’’ for comparing different ecological commu-nities. Ordination methods have largely been used topartition the variation of community compositionmatrices, structuring the b-diversity of the systeminto orthogonal axes, which can be used to produceordination plots (Legendre 2007). The ordinationaxes obtained for different taxa can then becompared by calculating pair-wise correlations(e.g. Hajek et al. 2002; ter Braak & Shaffers 2004).
The aim of this paper is to investigate the degreeof congruence between species richness and com-positional patterns (presence/absence of species)
ARTICLE IN PRESS
E. Santi et al.4
of seven taxonomic groups (vascular plants, bryo-phytes, lichens, fungi, oligochaetes, butterflies,birds) in a nature reserve, to test whether vascularplants can be a potential surrogate group forpredicting diversity of the other taxonomic groupsat local scale.
Materials and methods
Study area
The study area is the Nature Reserve ‘‘Bosco diSant’Agnese’’ (l 1111300000E, f 4312900000N, WGS84),in southern Tuscany (Italy). The Reserve covers 271ha,with an elevation range from 246 to 419m and ageological substrate formed by limestones and marls.Mean annual rainfall amounts to about 782mm, whilethe average annual temperature is 12.4 1C.
The landscape is dominated by evergreen Medi-terranean woodlands and scrublands, in whichCupressus sempervirens L., Quercus ilex L. andArbutus unedo L. are the most abundant species.Garigues and xeric grasslands are present on erodedslopes, while cultivations (mostly olive and vine-yards) cover a small proportion of the area. Ingeneral, the soils are very shallow and poor inorganic matter.
Sampling design and field data collection
The spatial grains adopted for collecting infor-mation on species composition were 1m2, 100m2
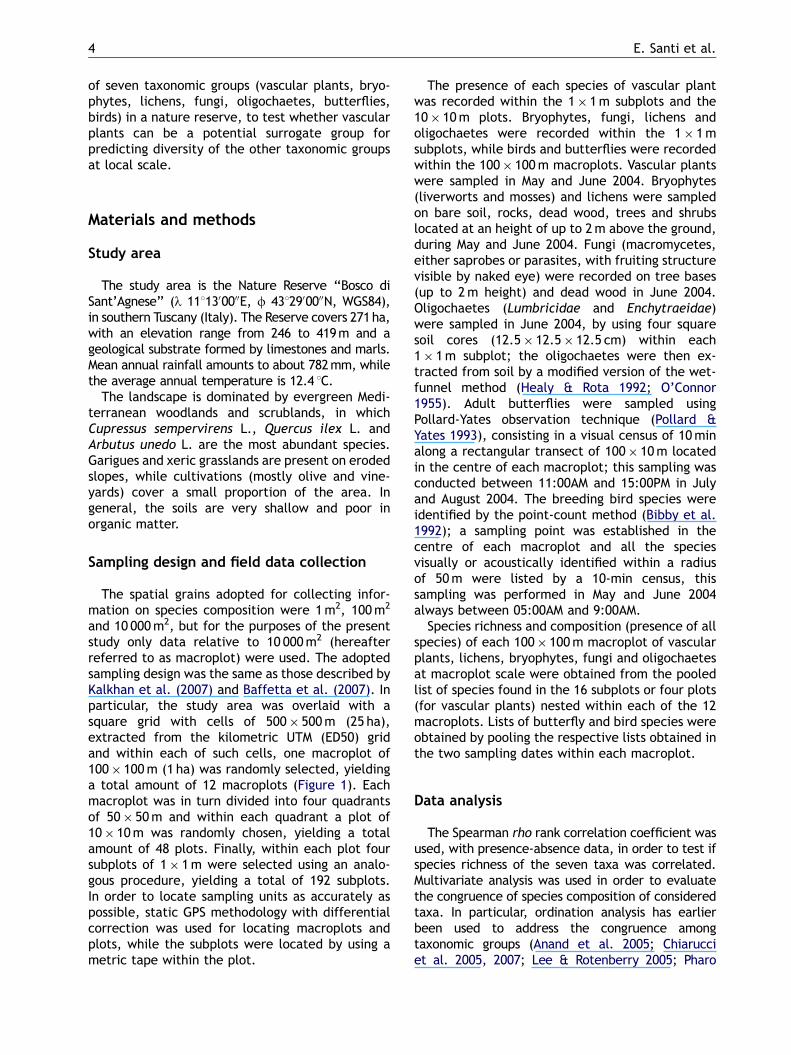
and 10 000m2, but for the purposes of the presentstudy only data relative to 10 000m2 (hereafterreferred to as macroplot) were used. The adoptedsampling design was the same as those described byKalkhan et al. (2007) and Baffetta et al. (2007). Inparticular, the study area was overlaid with asquare grid with cells of 500� 500m (25 ha),extracted from the kilometric UTM (ED50) gridand within each of such cells, one macroplot of100� 100m (1 ha) was randomly selected, yieldinga total amount of 12 macroplots (Figure 1). Eachmacroplot was in turn divided into four quadrantsof 50� 50m and within each quadrant a plot of10� 10m was randomly chosen, yielding a totalamount of 48 plots. Finally, within each plot foursubplots of 1� 1m were selected using an analo-gous procedure, yielding a total of 192 subplots.In order to locate sampling units as accurately aspossible, static GPS methodology with differentialcorrection was used for locating macroplots andplots, while the subplots were located by using ametric tape within the plot.
The presence of each species of vascular plantwas recorded within the 1� 1m subplots and the10� 10m plots. Bryophytes, fungi, lichens andoligochaetes were recorded within the 1� 1msubplots, while birds and butterflies were recordedwithin the 100� 100m macroplots. Vascular plantswere sampled in May and June 2004. Bryophytes(liverworts and mosses) and lichens were sampledon bare soil, rocks, dead wood, trees and shrubslocated at an height of up to 2m above the ground,during May and June 2004. Fungi (macromycetes,either saprobes or parasites, with fruiting structurevisible by naked eye) were recorded on tree bases(up to 2m height) and dead wood in June 2004.Oligochaetes (Lumbricidae and Enchytraeidae)were sampled in June 2004, by using four squaresoil cores (12.5� 12.5� 12.5 cm) within each1� 1m subplot; the oligochaetes were then ex-tracted from soil by a modified version of the wet-funnel method (Healy & Rota 1992; O’Connor1955). Adult butterflies were sampled usingPollard-Yates observation technique (Pollard &Yates 1993), consisting in a visual census of 10minalong a rectangular transect of 100� 10m locatedin the centre of each macroplot; this sampling wasconducted between 11:00AM and 15:00PM in Julyand August 2004. The breeding bird species wereidentified by the point-count method (Bibby et al.1992); a sampling point was established in thecentre of each macroplot and all the speciesvisually or acoustically identified within a radiusof 50m were listed by a 10-min census, thissampling was performed in May and June 2004always between 05:00AM and 9:00AM.
Species richness and composition (presence of allspecies) of each 100� 100m macroplot of vascularplants, lichens, bryophytes, fungi and oligochaetesat macroplot scale were obtained from the pooledlist of species found in the 16 subplots or four plots(for vascular plants) nested within each of the 12macroplots. Lists of butterfly and bird species wereobtained by pooling the respective lists obtained inthe two sampling dates within each macroplot.
Data analysis
The Spearman rho rank correlation coefficient wasused, with presence-absence data, in order to test ifspecies richness of the seven taxa was correlated.Multivariate analysis was used in order to evaluatethe congruence of species composition of consideredtaxa. In particular, ordination analysis has earlierbeen used to address the congruence amongtaxonomic groups (Anand et al. 2005; Chiarucciet al. 2005, 2007; Lee & Rotenberry 2005; Pharo
ARTICLE IN PRESS
0 250 500Meters
N
1012
11
8
6
5
32
1
7
9
Figure 1. Location of the study area ‘‘Bosco di Sant’Agnese’’ Nature Reserve in central Italy and the kilometric UTM(ED50) grid divided into 500� 500m cells, within which one macroplot of 100� 100m (1 ha) was randomly selected,yielding a total amount of 12 macroplots.
Simple to sample: Vascular plants as surrogate group in a nature reserve 5
ARTICLE IN PRESS
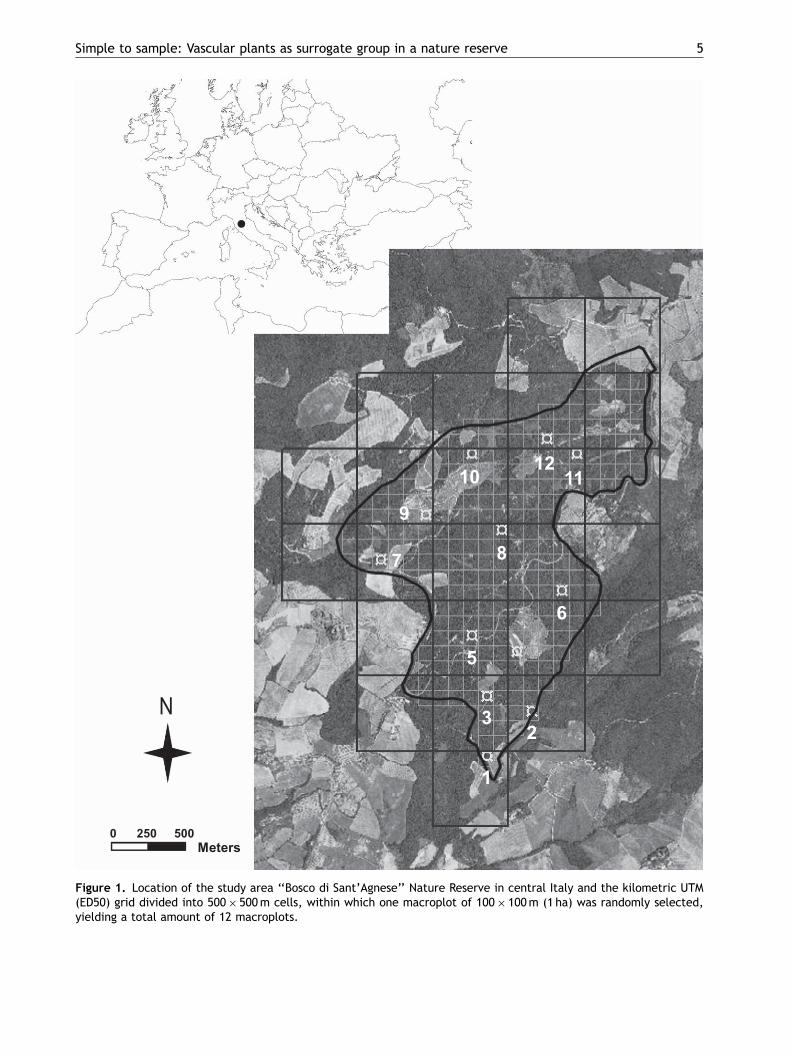
Table 1. Summary statistics for each taxonomic group in all 12 macroplots (each macroplot was 100� 100m).
Taxonomicgroup
Mean number of species(SD)
Minimum number ofspecies
Maximum number ofspecies
Pooled number of species in themacroplots
Vascularplants
32.7 (10.8) 17 54 144
Bryophytes 17.3 (4.2) 8 22 44Lichens 18.5 (11.9) 0 34 68Fungi 7 (3.8) 2 16 46Oligochaetes 8.4 (7.5) 0 22 34Butterflies 6 (5.7) 1 18 32Birds 11.5 (3.8) 5 17 31
Table 2. Spearman rank correlation coefficient (Spearman rho) among the species richness of all taxonomic groups atthe macroplot scale.
Vascularplants
Bryophytes Lichens Fungi Oligochaetes Butterflies Birds
Vascularplants
– 0.003 (0.991) �0.233 (0.467) �0.470 (0.123) �0.178 (0.580) 0.638 (0.026) 0.729 (0.007)
Bryophytes – 0.201 (0.531) 0.297 (0.348) 0.357 (0.255) 0.093 (0.775) �0.280 (0.379)Lichens – 0.096 (0.763) 0.071 (0.826) �0.054 (0.867) 0.017 (0.957)Fungi – 0.562 (0.057) �0.089 (0.783) �0.463 (0.129)Oligochaetes – 0.091 (0.779) �0.075 (0.817)Butterflies – 0.647 (0.023)Birds –
Parentheses show the P-value.
E. Santi et al.6
et al. 1999, 2000; Sætersdal et al. 2003; Simila et al.2006). We relied on Principal Component Analysis(PCA-ordination) based on presence/absence data.We used linear methods because of (i) their potentialuse with empty samples contrary to unimodalmethods (Leps & Smilauer 2003); and (ii) therelatively short length of the compositional gradi-ents. Multivariate analysis was performed by usingthe CANOCO 4.5 software package (ter Braak &Smilauer 2002). The potential use of the composi-tional pattern of each taxon as a surrogate of that ofall others was tested by the Spearman rho correla-tion of the sample scores along the PC axes.Significant (positive or negative) correlation indi-cates parallel variation in the species compositionamong taxonomic groups.
Results
Species richness
The 12 sampled macroplots were largely com-posed of woodlands and scrublands (eight macro-plots) and, to a lesser extent, by grasslands andcultivation fields with small patches of included
woodlands (four macroplots). The total numberof species recorded in the 12 macroplots (Table 1)was highly variable across the seven taxa: 144 forvascular plants; 44 for bryophytes (six liverwortsand 38 mosses); 68 for lichens; 46 for fungi; 34 foroligochaetes (two Lumbricidae and 32 Enchytraei-dae); 32 for butterflies; and 31 for birds. Vascularplants were the most species-rich group while birdswere the least species-rich group (Table 1).
Correlations of the species richness among theseven taxonomic groups were generally weak andstatistically not significant for most comparisons(Table 2). In particular, the species richness ofvascular plants was significantly correlated to thatof butterflies and birds only, while these two lattergroups were also significantly correlated to eachother (Table 2). Furthermore, some correlationresults were negative but not significant.
Species composition
The correlations between the sample scores ofPC axis 1 (correlations between PC axis 2 were notsignificant for all comparisons) for the differenttaxonomic groups were low and not statisticallysignificant for most of the comparisons (Table 3):
ARTICLE IN PRESS
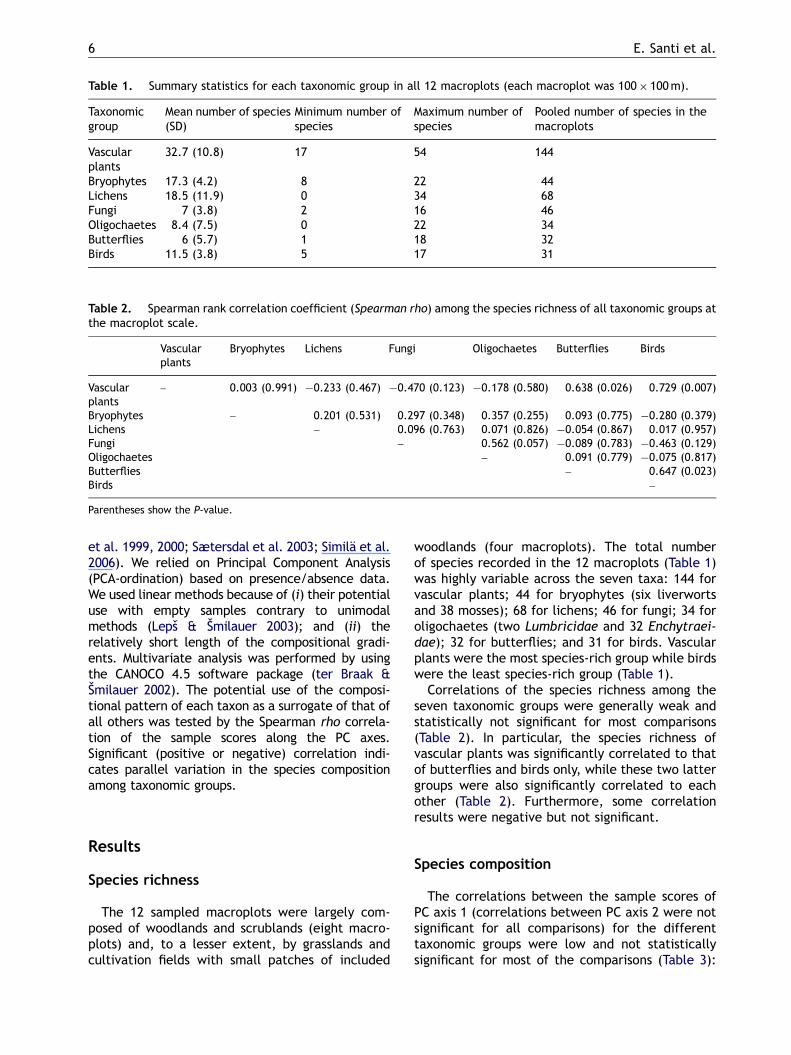
Table 3. Spearman rank correlation coefficient (Spearman rho) among sample score relative to the PC1 for alltaxonomic groups at the macroplot scale.
Vascularplants
Bryophytes Lichens Fungi Oligochaetes Butterflies Birds
Vascularplants
– 0.023 (0.994) 0.047 (0.884) 0.166 (0.606) �0.112 (0.708) 0.759 (0.004) �0.182 (0.572)
Bryophytes – 0.00 (1.000) 0.014 (0.966) �0.040 (0.902) 0.100 (0.758) �0.582 (0.047)Lichens – 0.084 (0.794) �0.061 (0.851) �0.051 (0.876) 0.005 (0.987)Fungi – 0.555 (0.061) 0.177 (0.583) 0.264 (0.407)Oligochaetes – 0.095 (0.770) 0.300 (0.344)Butterflies – �0.283 (0.372)Birds –
Parentheses show the P-value.
Simple to sample: Vascular plants as surrogate group in a nature reserve 7
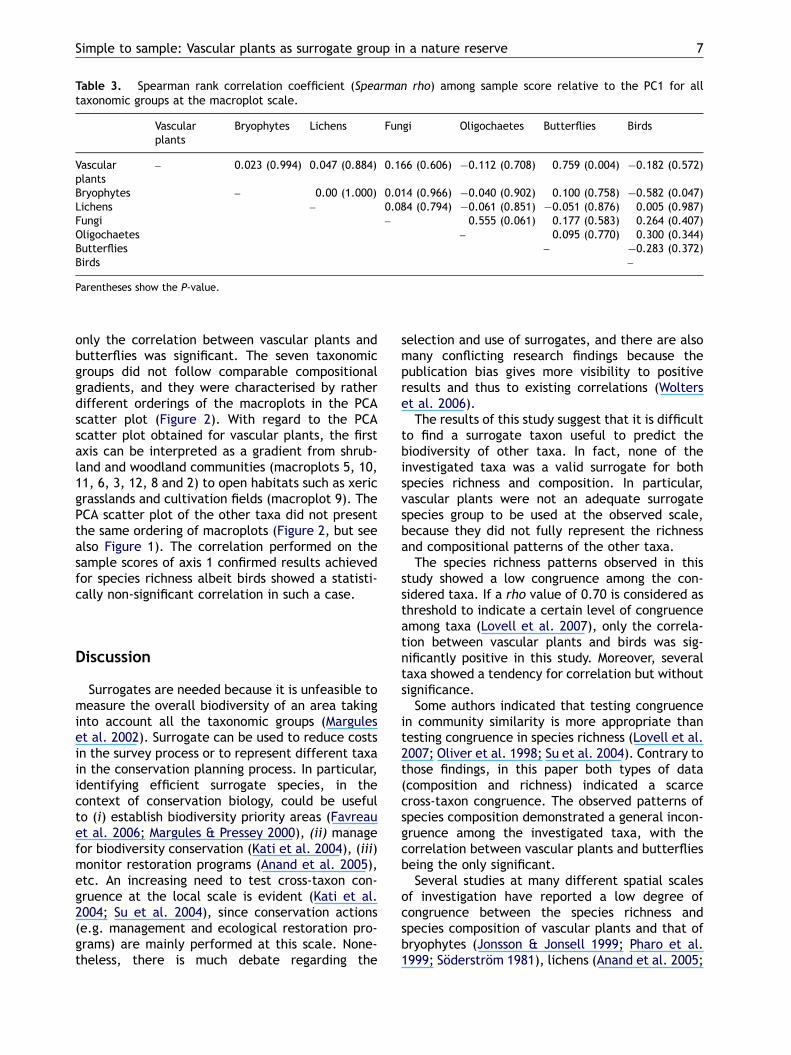
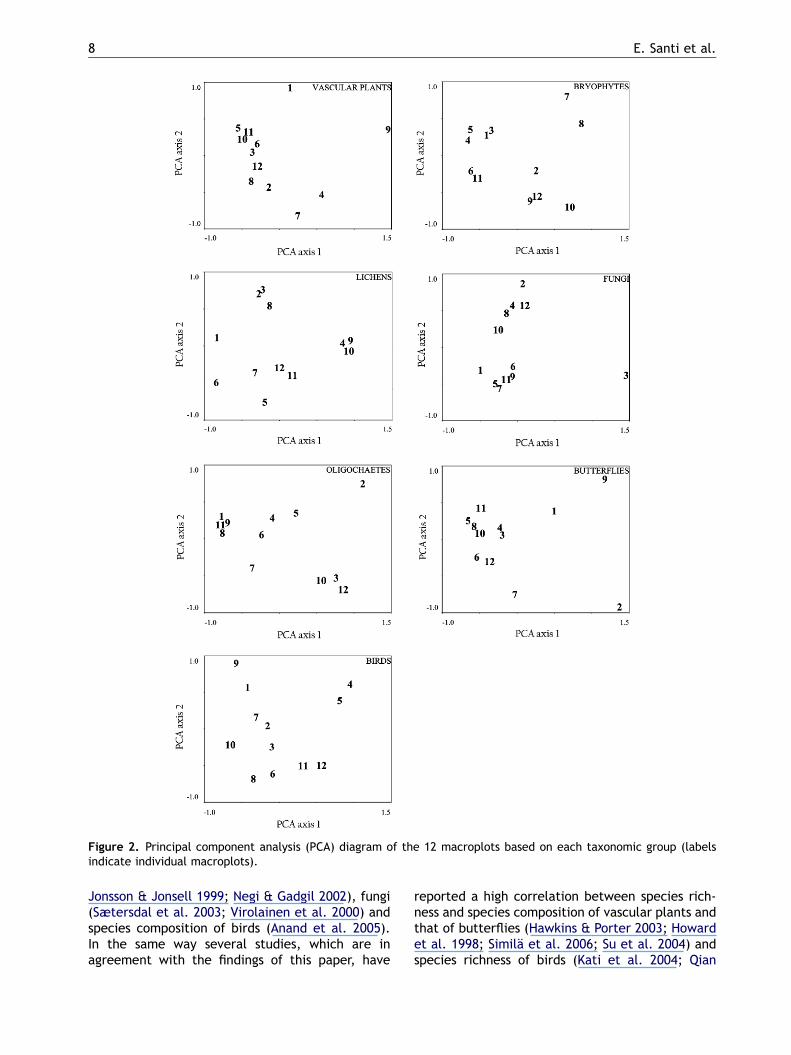
only the correlation between vascular plants andbutterflies was significant. The seven taxonomicgroups did not follow comparable compositionalgradients, and they were characterised by ratherdifferent orderings of the macroplots in the PCAscatter plot (Figure 2). With regard to the PCAscatter plot obtained for vascular plants, the firstaxis can be interpreted as a gradient from shrub-land and woodland communities (macroplots 5, 10,11, 6, 3, 12, 8 and 2) to open habitats such as xericgrasslands and cultivation fields (macroplot 9). ThePCA scatter plot of the other taxa did not presentthe same ordering of macroplots (Figure 2, but seealso Figure 1). The correlation performed on thesample scores of axis 1 confirmed results achievedfor species richness albeit birds showed a statisti-cally non-significant correlation in such a case.
Discussion
Surrogates are needed because it is unfeasible tomeasure the overall biodiversity of an area takinginto account all the taxonomic groups (Marguleset al. 2002). Surrogate can be used to reduce costsin the survey process or to represent different taxain the conservation planning process. In particular,identifying efficient surrogate species, in thecontext of conservation biology, could be usefulto (i) establish biodiversity priority areas (Favreauet al. 2006; Margules & Pressey 2000), (ii) managefor biodiversity conservation (Kati et al. 2004), (iii)monitor restoration programs (Anand et al. 2005),etc. An increasing need to test cross-taxon con-gruence at the local scale is evident (Kati et al.2004; Su et al. 2004), since conservation actions(e.g. management and ecological restoration pro-grams) are mainly performed at this scale. None-theless, there is much debate regarding the
selection and use of surrogates, and there are alsomany conflicting research findings because thepublication bias gives more visibility to positiveresults and thus to existing correlations (Wolterset al. 2006).
The results of this study suggest that it is difficultto find a surrogate taxon useful to predict thebiodiversity of other taxa. In fact, none of theinvestigated taxa was a valid surrogate for bothspecies richness and composition. In particular,vascular plants were not an adequate surrogatespecies group to be used at the observed scale,because they did not fully represent the richnessand compositional patterns of the other taxa.
The species richness patterns observed in thisstudy showed a low congruence among the con-sidered taxa. If a rho value of 0.70 is considered asthreshold to indicate a certain level of congruenceamong taxa (Lovell et al. 2007), only the correla-tion between vascular plants and birds was sig-nificantly positive in this study. Moreover, severaltaxa showed a tendency for correlation but withoutsignificance.
Some authors indicated that testing congruencein community similarity is more appropriate thantesting congruence in species richness (Lovell et al.2007; Oliver et al. 1998; Su et al. 2004). Contrary tothose findings, in this paper both types of data(composition and richness) indicated a scarcecross-taxon congruence. The observed patterns ofspecies composition demonstrated a general incon-gruence among the investigated taxa, with thecorrelation between vascular plants and butterfliesbeing the only significant.
Several studies at many different spatial scalesof investigation have reported a low degree ofcongruence between the species richness andspecies composition of vascular plants and that ofbryophytes (Jonsson & Jonsell 1999; Pharo et al.1999; Soderstrom 1981), lichens (Anand et al. 2005;
ARTICLE IN PRESS
Figure 2. Principal component analysis (PCA) diagram of the 12 macroplots based on each taxonomic group (labelsindicate individual macroplots).
E. Santi et al.8
Jonsson & Jonsell 1999; Negi & Gadgil 2002), fungi(Sætersdal et al. 2003; Virolainen et al. 2000) andspecies composition of birds (Anand et al. 2005).In the same way several studies, which are inagreement with the findings of this paper, have
reported a high correlation between species rich-ness and species composition of vascular plants andthat of butterflies (Hawkins & Porter 2003; Howardet al. 1998; Simila et al. 2006; Su et al. 2004) andspecies richness of birds (Kati et al. 2004; Qian
ARTICLE IN PRESS
Simple to sample: Vascular plants as surrogate group in a nature reserve 9
2007; Vessby et al. 2002). The close relationshipsbetween vascular plant and butterfly diversity canbe due to both the evolutionary bonds (i.e.pollination co-evolution) and the consumer-resource interactions between these two taxa,since several butterflies are obligatorily associatedwith vascular plants during their larval stage (seeEhrlich & Raven 1964). In the same way the richnessof vascular plants and birds can be linked toconsumer-resource interactions and evolutionarybonds (i.e. seed dissemination). In general, plantspecies diversity can influence animal speciesdiversity in several ways; a greater variety ofplants is expected to lead to a greater variety oftrophic levels, which in turn can lead to a greatervariety of consumers (MacArthur 1972; Rosenzweig1995). Moreover vascular plants provide food andnesting sites, and it is reasonable to hypothesisethat plant diversity is associated with diversity ofdifferent major groups of animals (Hawkins &Porter 2003).
Although several studies showed that speciesrichness patterns of bryophytes, lichens, fungi andoligochaetes are linked to environmental features,which also determine, in the same way, thevegetation (Campana et al. 2002; Dynesius & Zinko2006; Sætersdal et al. 2003; Simila et al. 2006), thevascular plant species richness was not an appro-priate predictor for those taxa. In fact bryophytesand lichens species richness has been found to berelated to soil nutrient richness and humidity(Økland 1996; Sætersdal et al. 2003), the richnessof polypore species to the total volume of deadwood (Sætersdal et al. 2003; Simila et al. 2006) andearthworm species richness to the total vegetationcover (Campana et al. 2002).
The lack of similar patterns of species richness orcomposition among taxa could be explained by thefact that cross-taxon congruence is highly variableand depends on different factors, such as (i)the considered spatial scale (Flather et al. 1997;Hess et al. 2006), (ii) the analysed taxa and (iii)the environmental heterogeneity of the area(Margules & Pressey 2000), but also (iv) the typeof investigation (e.g. measures of species richnessversus measures of community similarity, Cushman& McGarigal 2004). In fact, the incongruenceemerged in this study could be due to the factthat the study area shows a high degree oflandscape homogeneity with no evident gradients,with evergreen Mediterranean woodlands andscrublands dominating the whole area.
As emerged from this study, the vegetation-driven conservation planning, and consequently thehabitat-based approach, is likely to be an ineffec-tive means to protect other taxa (maybe with the
exclusion of butterflies and birds). This studyconfirmed that cross-taxon congruence patternsare highly complex and call for extensive localityand taxon specific assessments.
Acknowledgements
We are particularly grateful to two anonymousreviewers for their suggestions on a previous draftof the paper. For this research A. Chiarucci wasfunded by the University of Siena, as a PAR 2003Project (Analysis of the cross-taxon congruence inthe biodiversity of key groups).
References
Anand, M., Laurence, S., & Rayfield, B. (2005). Diversityrelationship among taxonomic groups in recoveringand restored forests. Conservation Biology, 19,955–962.
Baffetta, F., Bacaro, G., Fattorini, L., Rocchini, D., &Chiarucci, A. (2007). Multi-stage cluster sampling forestimating average species richness at differentspatial grains. Community Ecology, 8, 119–127.
Bibby, C. J., Burgess, N. D., & Hill, D. A. (1992). Birdcensus techniques. London: Academic Press.
Campana, C., Gauvin, S., & Ponge, J.-F. (2002). Influenceof ground cover on earthworm communities in aunmanaged beech forest: Linear gradient studies.European Journal of Soil Biology, 38, 213–224.
Caro, T., & O’Doherty, G. (1999). On the use of surrogatespecies in conservation biology. Conservation Biology,13, 805–814.
Chiarucci, A., D’Auria, F., & Bonini, I. (2007). Is vascularplant species diversity a predictor of bryophytespecies diversity in Mediterranean forests? Biodiver-sity and Conservation, 16, 525–545.
Chiarucci, A., D’Auria, F., De Dominicis, V., Lagana, A.,Perini, C., & Salerni, E. (2005). Using vascularplants as surrogate taxon to maximize fungal speciesrichness in reserve design. Conservation Biology, 19,1644–1652.
Colwell, R. K., & Coddington, J. A. (1994). Estimatingterrestrial biodiversity through extrapolation. Philo-sophical Transactions of the Royal Society of LondonSeries B, 345, 101–118.
Cushman, S. A., & McGarigal, K. (2004). Patterns in thespecies–environment relationship depend on bothscale and choice of response variables. Oikos, 105,117–124.
Dynesius, M., & Zinko, U. (2006). Species richnesscorrelations among primary producers in borealforests. Diversity and Distributions, 12, 703–713.
Ehrlich, P. R., & Raven, P. H. (1964). Butterfliesand plants: A study in coevolution. Evolution, 18,586–608.
ARTICLE IN PRESS
E. Santi et al.10
Favreau, J. M., Drew, C. A., Hess, G. R., Rubino, M. J.,Koch, F. H., & Eschelbach, K. A. (2006). Recommenda-tions for assessing the effectiveness of surrogatespecies approaches. Biodiversity and Conservation,15, 3949–3969.
Flather, C. H., Wilson, K. R., Dean, D. J., & McComb, W.C. (1997). Identifying gaps in conservation networks:Of indicators and uncertainty in geographic-basedanalyses. Ecological Applications, 7, 531–542.
Gaston, K. J. (1996). Biodiversity. A biology of numberand differences. Oxford: Blackwell.
Gaston, K. J. (2000). Global patterns in biodiversity.Nature, 405, 220–227.
Gustafsson, L. (2000). Red-listed species and indicators:Vascular plants in woodland key habitats and sur-rounding production forests in Sweden. BiologicalConservation, 92, 35–43.
Hajek, M., Hekera, P., & Hajkova, P. (2002). Springfen vegetation and water chemistry in the WesternCarpathian flysch zone. Folia Geobotanica, 37,205–224.
Harper, J. L., & Hawksworth, D. L. (1994). Biodiversitymeasurement and estimation. Philosophical Transac-tions of the Royal Society of London B, 345, 5–12.
Hawkins, B. A., & Porter, E. E. (2003). Does herbivorediversity depend on plant diversity? The caseof California butterflies. American Naturalist, 161,40–49.
Healy, B., & Rota, E. (1992). Methods for collectingEnchytraeidae during expeditions. Soil Biology andBiochemistry, 24, 1279–1281.
Hess, G. R., Bartel, R. A., Leidner, A. K., Rosenfeld, K.M., Rubino, M. J., Snider, S. B., et al. (2006).Effectiveness of biodiversity indicators varies withextent, grain, and region. Biological Conservation,132, 448–457.
Howard, P. C., Viskanic, P., Davenport, T. R. B., Kigenyi,F. W., Baltzer, M., Dickinson, C. J., et al. (1998).Complementarity and the use of indicator groups forreserve selection in Uganda. Nature, 394, 472–475.
Jonsson, B. G., & Jonsell, M. (1999). Exploring potentialbiodiversity indicators in boreal forest. Biodiversityand Conservation, 8, 1417–1433.
Kalkhan, M. A., Stafford, E. J., & Stohlgren, T. J. (2007).Rapid plant diversity assessment using a pixel nestedplot design: A case study in Beaver Meadows, RockyMountain National Park, Colorado, USA. Diversity andDistributions, 13, 379–388.
Kati, V., Devillers, P., Dufrene, M., Legakis, A., Vokou, D.,& Lebrun, P. (2004). Testing the value of six taxonomicgroups as biodiversity indicators at local scale.Conservation Biology, 18, 667–675.
Lamoreux, J. F., Morrison, J. C., Ricketts, T. H., Olson, D.M., Dinerstein, E., McKnight, M. W., et al. (2006).Global tests of biodiversity concordance and theimportance of endemism. Nature, 440, 212–214.
Lee, P.-Y., & Rotenberry, J. T. (2005). Relationshipsbetween bird species and tree species assemblagesin forested habitats of eastern North America. Journalof Biogeography, 32, 1139–1150.
Legendre, P. (2007). Studying beta diversity: Ecologicalvariation partitioning by multiple regression andcanonical analysis. Journal of Plant Ecology, 1, 3–8.
Leps, J., & Smilauer, P. (2003). Multivariate analysis ofecological data using CANOCO. Cambridge: CambridgeUniversity Press.
Lindenmayer, D. B., Margules, C. R., & Botkin, D. B.(2000). Indicators of biodiversity for ecologicallysustainable forest management. Conservation Biology,14, 941–950.
Lovell, S., Hamer, M., Slotow, R., & Herbert, D. (2007).Assessment of congruency across invertebrate taxaand taxonomic levels to identify potential surrogates.Biological Conservation, 139, 113–125.
Lund, M. P., & Rahbek, C. (2002). Cross-taxon congruencein complementarity and conservation of temperatebiodiversity. Animal Conservation, 5, 163–171.
MacArthur, R. H. (1972). Geographical ecology. New York:Harper & Row.
Maccherini, S., Bacaro, G., Favilli, L., Piazzini, S., Santi,E., & Marignani, M. (2009). Congruence amongvascular plants and butterflies in the evaluation ofgrassland restoration success. Acta Oecologica, 35,311–317.
Margules, C. R., & Pressey, R. L. (2000). Systematicconservation planning. Nature, 405, 243–253.
Margules, C. R., Pressey, R. L., & Williams, P. H. (2002).Representing biodiversity: Data and procedures foridentifying priority areas for conservation. Journal ofBiosciences, 27, 309–326.
Negi, H. R., & Gadgil, M. (2002). Cross-taxon surrogacy ofbiodiversity in the Indian Garhwal Himalaya. Biologi-cal Conservation, 105, 143–155.
O’Connor, F. B. (1955). Extraction of enchytraeid wormsfrom a coniferous forest soil. Nature, 175, 815–816.
Oertli, S., Muller, A., Steiner, D., Breitenstein, A., &Dorn, S. (2005). Cross-taxon congruence of speciesdiversity and community similarity among three insecttaxa in a mosaic landscape. Biological Conservation,126, 195–205.
Økland, T. (1996). Vegetation–environment relationshipsof boreal spruce forests in ten monitoring referenceareas in Norway. Sommerfeltia, 22, 1–349.
Oliver, I., Beattie, A. J., & York, A. (1998). Spatial fidelityof plant, vertebrate, and invertebrate assemblages inmultiple-use forest in Eastern Australia. ConservationBiology, 12, 822–835.
Packham, J. M., May, T. W., Brown, M. J., Wardlaw, T. J.,& Mills, A. K. (2002). Macrofungal diversity andcommunity ecology in mature and regrowth weteucalypt forest in Tasmania: A multivariate study.Austral Ecology, 27, 149–161.
Palmer, M. W. (1995). How should one count species?Natural Areas Journal, 15, 124–135.
Palmer, M. W., Earls, P. G., Hoagland, B. W., White, P. S.,& Wohlgemuth, T. (2002). Quantitative tools forperfecting species lists. Environmetrics, 13, 121–137.
Pharo, E. J., Beattie, A. J., & Binns, D. (1999). Vascularplants diversity as a surrogate for bryophyte andlichen diversity. Biological Conservation, 13, 282–292.
ARTICLE IN PRESS
Simple to sample: Vascular plants as surrogate group in a nature reserve 11
Pharo, E. J., Beattie, A. J., & Pressey, R. L. (2000).Effectiveness of using vascular plants to selectreserves for bryophytes and lichens. Biological Con-servation, 96, 371–378.
Pollard, E., & Yates, T. J. (1993). Monitoring butterflies forecology and conservation. London: Chapman & Hall.
Prendergast, J. R., Quinn, R. M., Lawton, J. H.,Eversham, B. C., & Gibbons, D. W. (1993). Rarespecies, the coincidence of diversity hotspots andconservation strategies. Nature, 365, 335–337.
Qian, H. (2007). Relationships between plant and animalspecies richness at a regional scale in China. Con-servation Biology, 21, 937–944.
Reyers, B., & Jaarsveld, A. S. (2000). Assessmenttechniques for biodiversity surrogates. South AfricanJournal of Science, 96, 406–408.
Ricketts, T. H., Daily, G. C., & Ehrlich, P. R. (2002). Doesbutterfly diversity predict moth diversity? Testing apopular indicator taxon at local scale. BiologicalConservation, 103, 361–370.
Rosenzweig, M. L. (1995). Species diversity in space andtime. Cambridge: Cambridge University Press.
Ryti, R. T. (1992). Effect of the focal taxon on the selectionof nature reserves. Ecological Applications, 2, 404–410.
Sætersdal, M., Gjerde, I., Blom, H. H., Ihlen, P. G.,Myreseth, E. W., Pommeresche, R., et al. (2003).Vascular plant as a surrogate species group incomplementary site selection for bryophytes, macro-lichens, spiders, carabids, staphylinids, snails, andwood living polypore fungi in a northern forest.Biological Conservation, 115, 21–31.
Sauberer, N., Zulka, K. P., Abensperg-Traun, M., Berg, H-M., Bieringer, G., Milasowszky, N., et al. (2004).Surrogate taxa for biodiversity in agricultural land-scapes of eastern Austria. Biological Conservation,117, 181–190.
Schouten, M. A., Verweij, P. A., Barendregt, A., Kleukers,R. M. J. C., Kalkman, V. J., & de Ruiter, P. C. (2009).
Determinants of species richness patterns in theNetherlands across multiple taxonomic groups. Biodi-versity and Conservation, 18, 203–217.
Simila, M., Kouki, J., Monkkonen, M., Sippola, A., &Huhta, E. (2006). Co-variation and indicators ofspecies diversity: Can richness of forest-dwellingspecies be predicted in northern boreal forests?Ecological Indicators, 6, 686–700.
Soderstrom, L. (1981). Distribution of bryophytes inspruce forests on hill slopes in central Sweden.Wahlenbergia, 7, 141–153.
Su, J. C., Debinski, D. M., Jakubauskas, M. E., &Kindscher, K. (2004). Beyond species richness: Com-munity similarity as a measure of cross-taxon con-gruence for coarse-filter conservation. ConservationBiology, 18, 167–173.
ter Braak, C. J. F., & Shaffers, A. P. (2004). Co-correspondence analysis: A new ordination methodto relate two community compositions. Ecology, 85,834–846.
ter Braak C. J. F., & Smilauer, P. (2002). CANOCOreference manual and CanoDraw for Windows user’sguide: Software for canonical community ordination.Microcomputer Power, 4.5, Ithaca, New York.
Vessby, K., Soderstrom, B., Glimskar, A., & Svensson, B.(2002). Species-richness correlation of six differenttaxa in Swedish seminatural grasslands. ConservationBiology, 16, 430–439.
Virolainen, K. M., Ahlroth, P., Hyvarinen, E., Korkeamaki,E., Mattila, J., Paiivinen, J., et al. (2000). Hot spots,indicator taxa, complementarity and optimal net-works of taiga. Proceedings of the Royal Society ofLondon B, 267, 1143–1147.
Whittaker, R. H. (1972). Evolution and measurement ofspecies diversity. Taxon, 21, 213–251.
Wolters, V., Bengtsson, J., & Zaitsev, A. S. (2006).Relationship among the species richness of differenttaxa. Ecology, 87, 1886–1895.