Preparation of lipoproteins containing cation-dependent ATPase

Research ArticleSilencing of Plasma Membrane Ca2+-ATPase Isoforms 2 and 3Impairs Energy Metabolism in Differentiating PC12 Cells
Tomasz Boczek1 Malwina Lisek1 Bozena Ferenc1 Antoni Kowalski12
Magdalena Wiktorska3 and Ludmila Zylinska1
1 Department of Molecular Neurochemistry Medical University Mazowiecka 68 Street 92215 Lodz Poland2Department of Molecular Biology and Genetics Science Park Aarhus University GustavWieds Vej No 10 8000 Aarhus C Denmark3Department of Molecular Cell Mechanisms Medical University Mazowiecka 68 Street 92-215 Lodz Poland
Correspondence should be addressed to Tomasz Boczek tomaszboczekumedlodzpl
Received 1 June 2014 Accepted 29 July 2014 Published 7 September 2014
Academic Editor Namasivayam Elangovan
Copyright copy 2014 Tomasz Boczek et alThis is an open access article distributed under the Creative Commons Attribution Licensewhich permits unrestricted use distribution and reproduction in any medium provided the original work is properly cited
A close link between Ca2+ ATP level and neurogenesis is apparent however the molecular mechanisms of this relationship havenot been completely elucidated Transient elevations of cytosolic Ca2+ may boost ATP synthesis but ATP is also consumed byion pumps to maintain a low Ca2+ in cytosol In differentiation process plasma membrane Ca2+ ATPase (PMCA) is consideredas one of the major players for Ca2+ homeostasis From four PMCA isoforms the fastest PMCA2 and PMCA3 are expressedpredominantly in excitable cells In the present study we assessed whether PMCA isoform composition may affect energy balancein differentiating PC12 cells We found that PMCA2-downregulated cells showed higher basal O
2consumption lower NAD(P)H
level and increased activity of ETC These changes associated with higher [Ca2+]c resulted in elevated ATP level Since PMCA2-reduced cells demonstrated greatest sensitivity to ETC inhibition we suppose that the main source of energy for PMCA isoforms1 3 and 4 was oxidative phosphorylation Contrary cells with unchanged PMCA2 expression exhibited prevalence of glycolysis inATP generation Our results with PMCA2- or PMCA3-downregulated lines provide an evidence of a novel role of PMCA isoformsin regulation of bioenergetic pathways and mitochondrial activity and maintenance of ATP level during PC12 cells differentiation
1 Introduction
Neuronal development is highly organized sequence of eventseventually leading to the formation of functional nerve cellsNeurogenesis occurs globally during development and tosome extent is also active in adult nervous system [1] Theformation of new neurites is critically dependent on the ade-quate energy supply However the degree to which glycolysisor oxidative phosphorylation (OxPh) contributes to energyprovision remains controversial It is now a textbook fact thatcomplete glucose oxidation is themost energetically favorableand provides nearly 87 of total ATP [2 3] Because of highATP yield during OxPh (26 of 30 ATP molecules are har-vested this way) one may assume that during developmentATP will also be synthesized mostly by mitochondria Thisis supported by studies in primarily cultures isolated from
embryos and postnatal cultured neurons both showing ATPderived from OxPh [4] Mitochondrial prevalence in ATPsynthesis during differentiation could be also highlighted bya large number of mitochondria distributed throughout thelength of axons and in presynaptic terminals [5]
Ca2+ as a link betweenATP handling and neurogenesis issuggested by numerous studies [6 7] Transient elevations ofcytosolic Ca2+ concentration ([Ca2+]c) may on the one handboost ATP synthesis but on the other ATP is required forhomeostaticmaintenance of a low resting [Ca2+]c in neuronalcells [8] In the differentiation process plasma membraneCa2+ ATPase (PMCA) an ATP-consuming pump extrudingcytosolic Ca2+ is considered as one of the major players forCa2+ homeostasis PMCA exists in four isoforms PMCA1ndash4which differ considerably by basal activity Ca2+ affinity and
Hindawi Publishing CorporationBioMed Research InternationalVolume 2014 Article ID 735106 13 pageshttpdxdoiorg1011552014735106
2 BioMed Research International
tissue distribution [8] The fastest PMCA2 and PMCA3isoforms are expressed predominantly in excitable cells andare termed neurospecific PMCA1 and PMCA4 are abun-dantly expressed and perform a housekeeping function Theexpression of particular PMCAs is developmentally regu-lated what has been shown at mRNA and protein level [9ndash11] It is believed that changes in the expression of particularvariants of the pump are spatially and temporary controlledto regulate the magnitude and duration of Ca2+ signals dur-ing differentiation Recently it has been demonstrated thatPMCA acting as Ca2+H+ countertransporter is also a majorsource of cellular protons [12] In view of this finding andtaking into consideration the different kinetic parametersPMCA isoforms may be an important regulator of cellularbioenergetics and ATP demands during differentiation
To evaluate this we used differentiated PC12 cellsobtained after transfection with eukaryotic vectors con-taining antisense sequences designed to either PMCA2 orPMCA3 The PC12 lines with stable downregulated expres-sion of PMCA2or PMCA3were validated in our several otherstudies [13ndash15] showing the reduction of PMCA2 or PMCA3protein level by almost 50 PC12 cells with their uniquefeatures characteristic for sympathetic-like neurons are awell-established model for studying the processes occurringduring neurite outgrowth Additionally upon induction ofdifferentiation they not only become more neuronal in thesense of oxidative metabolism predominance but also relyon glycolysis for ATP supply [16] Using stable transfectedPC12 lines we could control the level of PMCA isoforms andmonitor long-time effects of their suppression Therefore wehave attempted to answer whether neuron-specific PMCAisoformsmay affect energy balance in differentiating cells andwhether their presence confers a survival advantage duringenergy deprivation
2 Materials and Methods
21 Reagents Reagents if not otherwise stated were pur-chased from Sigma-Aldrich (Germany) The PC12 rat phe-ochromocytoma cell line was obtained from ATCC (USA)or Sigma-Aldrich (Germany) RPMI 1640 medium was fromPAA (Austria) Calf and horse sera were from BioChrom(UK) Annexin V-FITC Apoptosis Detection Kit was pur-chased in Roche Diagn (Germany) Alexa Fluor 488 andFluo-4 Calcium Assay kit were from Life Technologies(USA) Protein Assay Kit was from Bio-Rad (USA) Primaryantibodies against 120573III-tubulin andGAPDHwere from SantaCruz Biotech (USA)
22 Cell Culture and Differentiation PC12 rat pheochro-mocytoma cells were routinely maintained in RPMI-1640medium containing 10 horse serum 5 fetal bovine serum25mM HEPES pH 74 (21∘C) 2mML-glutamine 25UmLpenicillin and 25 120583gmL streptomycin in a humidified incu-bator at 37∘C with 5 CO
2 Nearly 50 reduction in
PMCA2 or PMCA3 protein level was achieved using anantisense RNA cloned into pcDNA31(+) vector transfectedto naive PC12 cells Following selection with increasing
G418 concentration (up to 1mgmL) we obtained stablytransfected lines in which PMCA2 ( 2 line) or PMCA3( 3 line) was downregulated PC12 cells carrying an emptyvector were used as a control (C) Plasmids constructionclones selection and characterization were described previ-ously [14] Differentiation process was induced with 1mMdibutyryl-cAMP (db-cAMP) The cells were cultured in thepresence of differentiating agent for another 48 h and allthe results presented here were obtained following 2-daydifferentiation process Routinely no more than 12 passageswere used and the expression level of PMCA2 and PMCA3was controlled every 4 passages Because PC12 cells exhibitsome level of variability we separately transfected two PC12lines of different sources to increase fidelity and maintain thereproducibility of our results
23 Microscopic Analysis Cell morphology was analyzedwith an Olympus CK-40 inverted microscope and imageswere captured using a CCD camera For confocal imagingsim103 cells seeded on poly-L-lysine coated glass LabTek IIchamber slides were fixed with 38 paraformaldehyde for30min at room temperature permeabilized with 01 TritonX-100 for 10min at 4∘C and blocked with 6 BSA for3 h at room temperature Fixed cells were then overnightincubated with mouse monoclonal anti-120573III-tubulin (1 150)at 4∘C followed by incubation with secondary anti-mouseantibodies conjugated to Alexa Fluor 488 (1 1000) for 2 h atroom temperature Images were taken on TCS SP5 confocallaser scanning microscope with 63x objective (Leica) Theaverage fluorescence intensity after background subtractionwas measured with Leica LAS AF Lite software (Leica)Mitochondrial mass was quantified with MitoTracker GreenFM In this method differentiated cells were first loaded with150 nM MitoTracker Green FM for 30min at 37∘C and thenfixed and imaged as described above
For electron microscopy cells were fixed with 3paraformaldehyde and 1 glutaraldehyde in 100mM phos-phate buffer for 1 h at room temperature Then they weredehydrated in increasing ethanol concentration 25 for5min 50 for 10min 75 for 15min 90 for 20min and998 for 2 times 20min Following dehydration cells wereinfiltrated in LR White resin 998 ethanol (1 1) for 30minat room temperature The embedded cells were encapsulatedin pure LR White resin for solidification The process wascarried out for 12 h at 37∘C 12 h at 46∘C and 48 h at 56∘CTheultrathin sections were transferred to carbon-sprayed nickelgrids counterstainedwith 25uranyl acetate and lead citratefor 30min and observed with JEOL JEM 1010 transmissionelectron microscope Mitochondria-to-cell-volume ratio wascalculated by Cavaileri estimator using Stereo-Investigator(MBF Bioscience)
24 Ca2+Measurement Approximately 1times104 differentiatedcells in each well of 96-well plate were loaded with 10 120583MFluo-4 for 1 h at 37∘CThe fluorescencemonitored in a kineticmode on Victor X3 plate fluorometer was recorded using488 nm excitation filter and 535 emission filter Appropriatecontrols for estimation of background fluorescence including
BioMed Research International 3
phenol-red-free RPMI medium Fluo-4 solution alone andcell-free recording solution were included Changes in Fluo-4 fluorescence were converted to absolute [Ca2+]c accordingto the equation [Ca2+]free = K
119889((119865minus119865min)(119865max minus119865)) where
K119889= 345 nMMaximal signal (119865max) was obtainedwith 10 120583M
ionomycin while the minimal signal (119865min) was obtainedwith 10mMEGTA In a separate set of experiments cells werepreincubated for 30min with 10 120583MBAPTA-AM and [Ca2+]cwere monitored as above
25 Drug Treatment If not stated otherwise the givenparameters were assessed in a buffer containing 5mM D-glucose (+glucose) 1mM KCN was added alone 20minbefore measurement to glucose-containing buffer (+glucose+ KCN) The contribution of glycolysis to ATP synthesis wasdetermined with 2-DG (20 120583M) added in presence of glucoseand pyruvate (5mM and 1mM resp) 2 h before measure-ment (+glucose + 2-DG + pyruvate) Short (3 h treatment)and long (48 h treatment) time effects of 6 120583M oligomycinaction were determined in glucose-containing buffer
26 Flow Cytometry Analysis Cells were incubated witheither 6 120583M oligomycin (for 3 h or 48 h) or with 20 120583M 2-deoxyglucose (for 2 h) in the presence of glucose sim1 times 106cells were double stained with Annexin VPropidium iodideusing Annexin V-FITC Apoptosis Detection Kit I accordingto the manufacturerrsquos protocol and analyzed with FACScanBecton Dickinson The fluorescence recorded from 104 cellswas measured in each experiment The data were plottedusing CellQuest Becton Dickinson software The basal levelof mortality was determined with or without 01 DMSO(solvent for oligomycin) in the presence of glucose Due tolack of differences the data obtained without DMSO werechosen for further comparisons
27 ATP Measurement ATP was measured in nontreatedcells andupon treatmentwith inhibitors as described inDrugTreatment section ATP concentration was determined usingadenosine 51015840-triphosphate (ATP) Bioluminescent Assay Kiton GloMax 2020 luminometer (Promega) and normalizedto the protein content In experiments with oligomycincells incubated with 01 DMSO (oligomycin solvent) wereused as a negative control and ATP values from these cellswere subtracted from ATP values obtained in oligomycin(+) experiments For each set of measurements a secondnegative control (no cells) was included and a backgroundfluorescence was further subtracted from all other values
28 Glucose Consumption and Lactate Release Medium ofa 48 h culture of differentiated cells was used to quantifybasal glucose consumption and lactate release using LactateAssay Kit and Glucose Assay Kit The same method wasused to assessed glucose and lactate concentration followingtreatments with inhibitors (see Results and Drug Treatmentsections)
29 Enzymatic Activities For citrate synthase activity sim1 times106 cells were suspended in a buffer containing 50mM TRIS-HCl pH 80 50mM acetyl-CoA 01 Triton X-100 and100mM dithionitrobenzoic acid (DTNB) and the reactionwas initiated by the addition of oxaloacetate to a finalconcentration of 250mM After 5min of incubation theabsorbance of a resulting product thionitrobenzoic acid(TNB) was determined spectrophotometrically at 412 nm[17]The activity of ETC complexes IndashIII was assessed at 37∘Cin mitochondrial fraction obtained as described in [18] usingBeckman DU 640 spectrophotometer and are expressed asnmolmin after normalization to citrate synthase activityThe activity of complex I was measured as a rate of NADHoxidation using decylubiquinone as an electron acceptorTheabsorbance was monitored at 340 nm with 380 nm as a ref-erence wavelength and the rate sensitive to rotenone (10 120583M)was taken as complex I activity [19] Complex II activity wasmeasured by the reduction of 26-dichlorophenolindophenol(DCIP) The reaction was initiated by the addition of 50 120583Mdecylubiquinone in the presence of succinate KCN androtenone The activity of complex II was calculated basedon the rate of DCIP reduction at 600 nm with a referencewavelength of 520 nm [20] Complex III activity was mea-sured by monitoring of cytochrome c reduction at 550 nmThe 580 nm wavelength was used as a reference In parallelexperiment 50120583M rotenone was added to the incubationbuffer to assess rotenone-insensitive activity [21] ComplexIV activity was determined in digitonin-permeabilized cellsprepared as described in [22] using an oxygraph (AntonPaar) sim2 times 106 permeabilized cells suspended in a reactionbuffer containing 50mM MOPS pH 75 03 Tween 20and 1mM FCCP were injected into polarographic chamberSubsequently 10mM ascorbate and 03mM tetramethyl-p-phenylenediamine (TMPD) were added and the oxygenconsumptionwas recorded for 5minThen 700120583MKCNwasadded and the respiration wasmeasured for additional 5minThe complex IV activity obtained by subtracting the KCN-insensitive respiration was calculated by an accompanyingsoftware and is expressed as nmolO
2min after normalization
to citrate synthase activity
210Monitoring of NAD(P)H andOxygenUptake NAD(P)Hautofluorescence was measured at 30∘C in a kinetic mode onVictor X3 multilabel plate fluorometer using an excitationwavelength of 350 nm with emission recorded at 450 nm1 times 10
4 cells were seeded per well of 96-well plate and dif-ferentiated for 48 h Then the culture medium was changedto serum-free RPMI containing 5mM glucose and afterstabilization of the signal 2mMKCNwas applied to obtain amaximal fluorescence (positive control) and 1 120583MFCCPwasused to monitor a minimal signal (negative control)
The endogenous respiratory rate was measured at 37∘Cusing OROBOROS oxygraph (Anton Paar) with a computer-interfaced Clark-type electrode sim1 times 107 cellsmL sus-pended in a buffer containing 10mM HEPES pH 74250mM sucrose 1 BSA and 1mM potassium phosphatewere allowed to reach O
2and temperature equilibrium for
3min to record a basal signal Respiration was inhibited by
4 BioMed Research International
PMCA2 PMCA30
05
10
15Re
lativ
e fol
d ch
ange
lowastlowast
2
3
(a)
CPMCA2GAPDH
PMCA3GAPDH
PMCA2 PMCA30
05
10
15
2 3 C 2 3
2
3
lowastlowast(A
U)
(b)
Figure 1 Efficiency of PMCA isoforms downregulation in differentiated PC12 cells (a)The relative amount of PMCA2 or PMCA3 transcriptswas evaluated by real-time PCR with Gapdh used as a reference gene The relative fold change was calculated using 2minusΔΔCt method The levelof target gene expression in control line was taken as 1 (dotted line) lowast119875 lt 005 PMCA-deficient lines versus control cells (b) Western blotanalysis of PMCA2 and PMCA3 protein level The results are shown as arbitrary units (AU) obtained after normalization to endogenousGAPDH content The level of either PMCA2 or PMCA3 protein in control line was taken as 1 (dotted line) lowast119875 lt 005 PMCA-deficient linesversus control cells C mock-transfected PC12 2 PMCA2-reduced PC12 and 3 PMCA3-reduced PC12
the addition of 2mM KCN and the minimal O2consump-
tion was monitored for 25min For uncoupled respirationmeasurements 1 120583M FCCP was added and the maximal O
2
consumption was further monitored for 3min Respiratoryrate was expressed as nmol O
2consumedmgmin
211 Real-Time PCR Total cellular RNA was extracted usingTrizol reagent according to the manufacturerrsquos protocolcDNA was synthesized using 1120583g of isolated RNA oligo(dT)primers and M-MLV reverse transcriptase in a 20120583L ofreaction mixture PMCA2 or PMCA3 gene expression levelwas quantified using SYBR Green fluorescent dye in thefollowing conditions 15min at 95∘C followed by 40 cycles at95∘C for 15 s 60∘C for 30 s and 72∘C for 30 s PCR reactionswere performed in an AbiPrism 7000 sequence detectionsystem (Applied Biosciences) The relative fold change afternormalization to Gapdh expression was calculated using acomparative 2minusΔΔCt method [23]
212 Western Blot 40 120583g of total cell lysate prepared asdescribed in [15] was resolved on a 10 SDS-PAGE gel andelectroblotted onto nitrocellulose membranes Membraneswere blocked with 5 BSA in TBS-T buffer (10mM TRIS-HCl pH 74 150mMNaCl and 005 Tween-20) for 1 hat room temperature and incubated overnight at 4∘C witheither anti-PMCA2 (1 1000) anti-PMCA3 (1 1000) anti-120573-actin (1 1000) anti-GAPDH (1 2500) or anti-120573-III tubu-lin (1 1000) antibodies followed by 4 h incubation withsecondary antibodies (1 10000) coupled to alkaline phos-phatase BCIPNBTwas used according to themanufacturerrsquosinstructions to visualize immunoreactive bands Blots were
scanned and quantified using GelDocTMEQ system withQuantity One 1-D Analysis Software version 441 (Bio-Rad)
213 Statistical Analysis Thedata are shown asmeans plusmn SEMof 119899 separate experiments (119899 ge 3) Statistical analyses weredone using STATISTICA 80 (StatSoft) with ANOVA test and119875 value lt005 was considered as statistically significant
3 Results
31 PMCA2- or PMCA3-Downregulated Differentiated PC12Lines Real-time PCR analysis revealed that experimentaldownregulation of PMCA2 or PMCA3 in differentiated PC12cells [15] significantly decreased transcript level by 63 plusmn13 and 58 plusmn 15 for PMCA2 and PMCA3 respectively(Figure 1(a)) Furthermore changes in mRNA content cor-responded to an approximate sim50 reduction in PMCAisoforms protein amount (Figure 1(b))
Additionally our previous study revealed that 48 h treat-ment with db-cAMP accelerated differentiation process ofPC12 lines [15] In comparison to the mock-transfectedcontrol cells PMCA-deficient lines exhibited more intensiveformation of neurite network particularly visible in PMCA2-downregulated line (Figure 2(a)) To analyze the bioenergeticprocesses we first assessed the number of mitochondria inexamined lines using MitoTracker Green TM (Figure 2(b))Single-cell fluorescence level indicated a similar mitochon-drial mass in all lines (365 plusmn 24 382 plusmn 38 and 344 plusmn 19units of fluorescence intensity in Control 2 and 3 linesresp) Also despite the different shape of mitochondriavisualized in ultrastructural studies (Figure 2(c)) the average
BioMed Research International 5
Control 2 3
(a)
(b)
lowastlowast
(c)
Figure 2 Microscopic characteristic of differentiated PC12 lines (a) Morphological changes induced by differentiation with 1mM db-cAMPThe morphology was analyzed with an Olympus CK-40 inverted microscope and images were captured using a CCD camera Scale bar10120583m (b) Evaluation of mitochondrial mass with MitoTracker Green TM in fixed cells using TCS S5 confocal microscope Scale bar 20120583m(c) Representative micrographs of cell ultrastructure at 105000x magnification with mitochondria marked with asterisks Control mock-transfected PC12 2 PMCA2-reduced PC12 and 3 PMCA3-reduced PC12
mitochondria-to-cell-volume ratio calculated using Stereo-Investigator was comparable between lines (0056 plusmn 000800515 plusmn 0004 and 00555 plusmn 0011 for C 2 and 3resp) Given that activity of citrate synthase is considered asbiochemical determination of mitochondrial mass we nextassayed the enzyme activity which was 432 plusmn 21 499 plusmn 28and 428 plusmn 16 nmolmgmin for C 2 and 3 respectively Itconfirmed in addition tomicroscopic analysis a similar levelof functional mitochondria in all examined cell lines
As we have already reported [15] PMCA2 or PMCA3knockdown resulted in permanent increase in resting [Ca2+]cand these changes were associated with reduced protein levelof examined PMCA isoforms Thereby we next clarifiedthe possible relationship between [Ca2+]c and ATP content(Table 1) A short-time (30min) treatment with calciumchelator BAPTA-AM decreased [Ca2+]c in PMCA-reducedlines but only in 2 line that this change correlated withdiminished ATP level It suggests a close link between Ca2+and ATP levels in PMCA2-reduced cells
32 Contribution of Glycolysis versus Oxidative Phosphory-lation to Cellular ATP Maintenance Next we assessed theeffect of PMCA isoforms downregulation on glycolysis and
OxPh contribution to ATP supply in differentiated PC12 lines(Figure 3) Under steady state conditions (with glucose inmedium) the highest intracellular ATP level was detected in2 line and it was sim30 higher than that of control mock-transfected cells In connectionwithmicroscopic analysis thischange is unlikely to result from increased mitochondrialvolume or mitochondrial mass and simply indicates higherATP concentration in individual cell
Cultivation of cells for 15min in glucose-free mediumbut with addition of pyruvate decreased ATP content inall lines more intensively in control and 3 lines It isnoteworthy that observed ATP values reflected mainly theeffectiveness of OxPh To evaluate contribution of glycolysisto ATP synthesis we added 2-DG in the presence of glucoseand pyruvate to inhibit glycolytic hexokinase Following2 h treatment ATP content in all lines was reduced tothe level previously detected in glucose-free but pyruvatesupplemented conditions Treatment with cyanide for 20minto block mitochondrial ETC decreased ATP by 23 71and 20 in C 2 and 3 lines respectively Similar resultswere obtained after incubation for 3 h in the presence ofoligomycinThis indicates that PMCA2 preferentially utilizesglycolytic pathway for ATP production whereas remaining
6 BioMed Research International
Table 1 Relationship between cytosolic Ca2+ and ATP level Changes in total cellular ATP level upon BAPTA treatment are expressed as change in relation to nontreated line in which ATP level in particular line was taken as 100The values of ATP concentration in steady statenoninhibitory conditions are as follows 366 plusmn 032 472 plusmn 039 and 343 plusmn 066 nmolmg for C 2 and 3 lines respectively and these valuesare also presented in Figure 2 (conditions ldquo+glucoserdquo)
C 2 3[Ca2+]c [nM] 95 plusmn 8 149 plusmn 17lowast 130 plusmn 11lowast
[Ca2+]c + BAPTA [nM] 90 plusmn 14 100 plusmn 11 96 plusmn 15
ATP + BAPTA [] 103 plusmn 10 80 plusmn 5 94 plusmn 8lowast119875 lt 005 versus control untreated cells 119875 lt 005 treated versus untreated cells C mock-transfected PC12 2 PMCA2-reduced PC12 and 3 PMCA3-
reduced PC12
lowast
lowast
lowast
lowast
lowast lowast
lowast
lowast
lowast
lowast
lowastlowastlowast
lowast lowast
+G
luco
se
+G
luco
se
+G
luco
se
0
1
2
3
4
5
6
C2
3
minusG
luco
se+
pyru
vate
+G
luco
se+2
-DG
+G
luco
se+
KCN
(3h)
(48
h)+
olig
omyc
in
+ol
igom
ycin
+py
ruva
te
[ATP
] i(n
mol
mg
of p
rote
in)
Figure 3 ATP amount in differentiated PC12 lines after drug treat-ment ATP level was quantified luminometrically and calculatedusing ATP standard and normalized to the protein content in thesample The results are averages of 119899 = 7 experiments performedin duplicate using different cell cultures lowast119875 lt 005 versus controluntreated cells
119875 lt 005 treated versus untreated cells Cmock-transfected PC12 2 PMCA2-reduced PC12 and 3 PMCA3-reduced PC12
PMCA isoforms rely more on the OxPh Moreover culturingcells in the presence of oligomycin for 2 days revealed adramatic reduction in ATP content in all lines also showinga prevalence of OxPh in energy generation over a long periodof time
33 Energy Deprivation Induced Cell Death in DifferentiatedPC12 Cells To resolve possible consequences of energydeprivation on cell survival a double staining with AnnexinV and propidium iodide was done (Figure 4) It showedthat inhibition of hexokinase even in the presence of pyru-vate increased necrotic cell number in all lines as wellslightly enhanced apoptosis in 2 and 3 cells Treatmentwith oligomycin for 3 h reduced cell viability in all lines byincreasing apoptosis (but not necrosis) These results suggestthat neither glycolysis alone nor OxPh are able to sufficientlyprotect cells against death A massive necrosis was induced
by oligomycin after 48 h which was however less severe in2 and 3 lines Due to highly deleterious effect of prolongedoligomycin treatment in further experiments we decided tolimit its action to 3 h
34 PMCA2- and PMCA3-Deficient Cells Exhibit HigherGlycolytic Activity To evaluate which energy-generatingpathway was used by the cells with altered PMCA isoformscomposition we first looked into the fermentative glu-cose metabolism Under standard conditions higher glucoseconsumption in both PMCA-reduced lines was observed(Figure 5(a)) Nearly complete loss of glucose utilization wasdetected when PC12 lines were cultured in the presence of2-DG and pyruvate Also diminished glucose consumptionwas noticed after incubation with oligomycin The lowestvalue was in 2 line (about 50 in relation to nontreatedcells) suggesting that some portion of glucose might bepreferentially metabolized to fuel OxPh
In the presence of glucose lactate concentration in themedium after 48 h of cells cultivation was higher by 50in 2 and by 39 in 3 line (Figure 5(b)) Inhibition ofhexokinase with 2-DG and addition of pyruvate resultedin a dramatic reduction of released lactate in all linesProduction of lactate increased in 2 and 3 lines in responseto oligomycin indicating a compensatory ATP generationthrough glycolysis via the Pasteur effect
Based on the results and taking into consideration thechanges in [ATP]i upon 2-DG treatment we assume thatanaerobic glycolysis may be primarily responsible for supply-ing ATP for control and 3 lines
35 Mitochondrial Respiration Fueled by Increased NADHAvailability Meets Higher Energy Demands in PMCA2-ReducedCells Based onKCN- and oligomycin-evoked chan-ges in [ATP]i we hypothesized that OxPh rather than anaero-bic glycolysis is ought to provide most of the energy requiredfor 2 cells Indeed 2 cells presented substantially higherbasal oxygen consumption whereas the O
2utilization in 3
line was comparable to control cells (Figure 6(a)) FollowingKCN treatment a decline in oxygen consumption was againthe most pronounced in 2 cells (about 30 below the levelin control) suggesting that ATP turnover in this line mightbe significantly higher than in others (Figure 6(b)) Also 2cells presented higher maximal respiration measured in thepresence of FCCP a chemical uncoupler of electron transportand oxidative phosphorylation Moreover the monitoring
BioMed Research International 7
100
101
102
103
104
100
101
102 103 104FL
2-H
FL1-H
100
101
102
103
104
100
101
102 103 104
FL2-
H
FL1-H
100
101
102
103
104
100
101
102 103 104
FL2-
H
FL1-H
100
101
102
103
104
100
101
102 103 104
FL2-
H
FL1-H
100
101
102
103
104
100
101
102 103 104
FL2-
H
FL1-H
100
101
102
103
104
100
101
102 103 104
FL2-
H
FL1-H
100
101
102
103
104
100
101
102 103 104
FL2-
H
FL1-HAnnexin V
100
101
102
103
104
100
101
102 103 104
FL2-
H
FL1-HAnnexin V
100
101
102
103
104
100
101
102 103 104
FL2-
H
FL1-HAnnexin V
Prop
idiu
m io
dide
100
101
102
103
104
100
101
102 103 104
FL2-
HFL1-H
Prop
idiu
m io
dide
100
101
102
103
104
100
101
102 103 104
FL2-
H
FL1-H
Prop
idiu
m io
dide
100
101
102
103
104
100
101
102 103 104
FL2-
H
FL1-H
Prop
idiu
m io
dide
+G
luco
se+
Glu
cose
+2
-DG
+py
ruva
te+
Glu
cose (3
h)+
olig
omyc
in+
Glu
cose (48
h)+
olig
omyc
in
C 2 3
N LA
EAV
(a)
0
50
100
0
50
100
23
C23
C
+G
luco
se(
)
+G
luco
se
()
+G
luco
se
()
+G
luco
se
()
0
50
100
0
50
100
lowast
lowast lowast
lowast lowast lowast
lowastlowastlowast
lowastlowast
lowast
lowastlowast
lowast
lowastlowastlowast
lowastlowastlowast
lowast lowast lowastlowast
Viable Earlyapoptosis
Lateapoptosis Necrosis
(3h)
+ol
igom
ycin
(48
h)+
olig
omyc
in
+2
-DG
+py
ruva
te
Viable Earlyapoptosis
Lateapoptosis Necrosis
(b)Figure 4 Flow cytometry analysis of differentiated PC12 cells after drug treatment (a) The analysis was performed using Annexin V-FITCpropidium iodide staining (FACScan Becton Dickinson) Typical dot plots are presented (119899 = 3 independent experiments with similarresults) and indicate N necrotic cells V live cells LA late apoptosis and EA early apoptosis (b) Quantification of apoptosis and necrosisafter drug treatment The bars indicate the distribution ( plusmn SD) within cell population Data shown are the mean of 119899 = 3 independentexperiments Quantification of cells was done using CellQuest software (Becton Dickinson) lowast119875 lt 005 versus corresponding untreated cells119875 lt 005 versus treated control line as indicated C mock-transfected PC12 2 PMCA2-reduced PC12 and 3 PMCA3-reduced PC12
8 BioMed Research International
2
3
C
lowastlowast
lowast
lowastlowast
lowast
0
5
10
15
20G
luco
se co
nsum
ptio
n(m
g10
6ce
lls)
+G
luco
se
+G
luco
se+2
-DG
(3h)
+py
ruva
te
+G
luco
se+
olig
omyc
in
(a)
2
3
C
0
5
10
15
20
25
+G
luco
se
lowast
lowast lowast
lowast
lowast
+G
luco
se+
olig
omyc
in(3
h)
+G
luco
se+2
-DG
Lact
ate r
eleas
e (m
M)
+py
ruva
te
(b)
Figure 5 Glucose consumption and lactate release (a) Changes in glucose concentration assessed in culture medium (+glucose) or inmedium supplemented with metabolic inhibitors 2-deoxyglucose or oligomycin (b) Accompanied changes in lactate release determinedunder the same conditions In both panels lowast119875 lt 005 versus nontreated cells 119875 lt 005 versus control cells C mock-transfected PC12 2PMCA2-reduced PC12 and 3 PMCA3-reduced PC12
of NAD(P)H autofluorescence revealed lower basal level ofreduced NAD greater cell response to KCN and loweredNAD(P)H upon uncoupling the mitochondria with FCCP in2 line (Figures 6(c) and 6(d))
Further we assessed the activity of all four ETC complexesand normalized the results to citrate synthase activity Weobserved higher activity of complexes I III and IV in 2line (Figures 7(a) and 7(b)) which explained higher O
2
utilization and together with NAD(P)H profile suggestedmore effective energy conversion into ATP through OxPh
36 Oxidative Phosphorylation Is Necessary to Support Neu-ronal Differentiation In view of the changes in energygenerating pathways we analyzed if OxPh is involved indifferentiation process We found that 120573III-tubulin a pro-tein found almost exclusively in neurons was present athigher amounts in 2 and 3 lines in comparison to controlcells After incubation with oligomycin its level decreasedto comparable values in all lines (Figures 8(a) and 8(b))Similarly decline in fluorescence intensity corresponding to120573III-tubulin was visible at the single-cell level (Figures 8(c)and 8(d)) Because 120573III-tubulin is commonly considered asa neuronal marker in developmental neurobiology our datasuggest the requirement of mitochondrially generated ATPfor neuronal differentiationMoreover PMCAs-reduced linesexhibited higher sensitivity to OxPh inhibition in terms ofproper differentiation process
4 Discussion
Some publications suggest that neurons contributeminimallyto glucose consumption in the brain but have high ratesof glucose utilization and oxidative metabolism [24 25]Glycolysis is thought to be crucial for neural activity [26]and the selective inhibition of hexokinase impaired the abilityof neurite outgrowth in cultured adult sensory neurons[27] Similarly inhibition of mitochondrial ATP synthesisprevented axon formation [28] also suggesting the importantcontribution of OxPh to neural development This is inagreement with studies demonstrating that neurons utilizea combination of both extracellular lactate and oxidativeglucose metabolism as their energy sources [29] Despitethe ongoing debate regarding the contribution of differentmetabolic pathways in neurons even less is known about theenergy changes during differentiation
In our study we used an in vitromodel of pseudoneuronalPC12 cells with permanently downregulated PMCA2 andPMCA3 expression We have already shown that experi-mental reduction in the PMCA2 or PMCA3 content inPC12 cells caused a significant drop in the efficiency ofcalcium extrusion [15] The results presented here providethe evidence of a novel role of PMCA isoforms in regu-lation of bioenergetic pathways and mitochondrial activityand maintenance of ATP level during differentiation Inparticular profound consequences of neurospecific PMCAisoforms downregulation on energy metabolism seem to be
BioMed Research International 9
C23
0
50
100
150
200
400 500300200100
KCN
FCCP
Time (s)
Resp
iratio
n ra
te(n
mol
O2m
gm
in)
(a)
2
3
lowast
lowast
lowast
0
50
100
150
200
250
Resp
iratio
n (
of co
ntro
l)
Resting KCN FCCP
(b)
FCCP
0
05
10
15KCN
400 500300200100Time (s)
(AU
)
C23
NA
D(P
)H au
toflu
ores
cenc
e
(c)
2
3
lowast
lowast
lowast
0
50
100
150
250
200(
of co
ntro
l)
Resting KCN FCCP
NA
D(P
)H au
toflu
ores
cenc
e
(d)
Figure 6 The effect of PMCAs downregulation on bioenergetic parameters (a) The representative traces of O2consumption 2mM KCN
was used to assess minimal O2consumption and 1 120583M FCCP to measure uncoupled respiration (b) Quantification of respiratory rate The
respiration rate in control cells was taken as 100 (dotted line) lowast119875 lt 005 versus control line 119875 lt 005maximal or minimal O2consumption
versus resting (c) Mean time course of NAD(P)H autofluorescence 2mM KCN and 1 120583M FCCP were used to obtain maximal and minimalsignals respectively AU arbitrary units (d) Quantification of NAD(P)H changes The autofluorescence level in control cells was taken as100 and is indicated as a dotted line in the graph lowast119875 lt 005 versus control line 119875 lt 005 maximal or minimal signal versus resting Cmock-transfected PC12 2 PMCA2-reduced PC12 and 3 PMCA3-reduced PC12
a part of an adaptation process of both lines to altered Ca2+balance Nonetheless we cannot exclude the contributionof compensatory upregulation of PMCA1 in both lines andPMCA4 in 3 line previously reported by us in PMCA-deficient cells [15] In our just published paper we howeverfound that manipulation of PMCA2 or PMCA3 level resultedin disruption of pH gradient across the inner mitochondrialmembrane and significantly attenuated pH response duringintracellular Ca2+ loads [30] All the reported changes wereattributed to decreased level of neurospecific PMCA isoforms
and occurred even despite the induction of some compen-satory mechanisms Based on the results we concluded thatPMCA2 and to lesser extent PMCA3 were indeed primarilyresponsible for driving the formation of a proton gradientand thus may exert a significant effect on cellular ATPpool In view of these findings the potential involvementof constitutive PMCA1 and PMCA4 in bioenergetic changesreported here seems to be of minor importance
Focusing on the differences between control and PMCAs-reduced lines we found that ATP content in 2 line exhibited
10 BioMed Research International
0
20
40
60
80
100
C
Com
plex
I
Com
plex
II
Com
plex
III
nmol
min
Uni
t citr
ate s
ynth
ase a
ctiv
ity
2
3
lowast
lowast
(a)
C
50
100
150
200
0
lowast
2 3
Complex IV
Uni
t citr
ate s
ynth
ase a
ctiv
itynm
olO2m
in
(b)
Figure 7 The effect of PMCAs downregulation on complexes of respiratory chain (a) The activity of ETC complexes IndashIII was assessedspectrophotometrically at 37∘C in mitochondrial fraction and is expressed as nmolmin after normalization to citrate synthase activity asdescribed in Section 2 (b) Complex IV activity was determined in digitonin-permeabilized cells using an oxygraph (Anton Paar) accordingto the procedure described in Section 2 and is expressed as nmol O
2min after normalization to citrate synthase activity The results are from
119899 = 5 independent determinations lowast119875 lt 005 versus control cells C mock-transfected PC12 2 PMCA2-reduced PC12 and 3 PMCA3-reduced PC12
the greatest sensitivity to ETC inhibition Higher activity ofI III and IV respiratory chain complexes in 2 line indicatesthat the main source of energy for PMCA isoforms 1 3 and 4could be an oxidative phosphorylation In addition resting[Ca2+]c in this line increased more than in 3 line whichmay be crucial for activation of respiratory chain complexesThis is confirmed by ATP decrease observed in the presenceof BAPTA and also in the presence of KCN or oligomycinHowever depletion of PMCA2 which is the fastest isoformresponsible for immediate clearance of increased intracellularCa2+ [31ndash33] may lead to prolongation of Ca2+ signal Thisin turn could stimulate Ca2+-dependent processes includingTCA cycle and OxPh
Pyruvate in the absence of glucose largely preventedATP loss in 2 cells indicating together with the abovegreater reliance on OxPh Several in vitro and in vivo studiesdemonstrated that pyruvate can protect neurons from energydeprivation and subsequent cell death [34 35] In contrastonly a marginal rescue effect of pyruvate observed in Cand 3 lines (with unchanged PMCA2 expression) suggestedthe contribution of glycolysis to ATP generation Despitedifferent pyruvate action increased population of necroticcells in all lines due to glycolysis inhibition indicated thatOxPh is still insufficient to fully meet energy needs andglycolysis may be an important completive pathway
Our data indicate PMCA2-dependent switch of cellularmetabolism toward stimulation of OxPh which could benecessary to fulfill higher ATP demands This is supportedby our findings of greater O
2utilization and lower NAD(P)H
level all accompanied by higher consumption of NADHby ETC due to increased activity of proton-pumping com-plexesTherefore the rate of oxidative phosphorylation when
PMCA2 level is reduced may be controlled at the activityof ETC proteins which is supported by the metabolic studydemonstrated in isolated mitochondria [36] In view of theabove findings lower NAD(P)H level presumably reflectsits faster oxidation Long-time maintenance of this balancerequires however stimulation of NADH production or itsmore effective transport to mitochondria In our study TCAcycle was found not to be a source of higher NADH synthesissince the activity of citrate synthase and complex II of ETCremained unchanged We cannot exclude that higher basalCa2+ produced by PMCA2 downregulation may transientlyactivate TCA cycle dehydrogenases This would be expectedbecause the elevations in [Ca2+]c are thought to increaseATP consumption by Ca2+ clearance mechanisms [37] Weassume that NADH transport to mitochondria rather thanits overproduction may explain lower steady-state level ofNAD(P)H in 2 line
Compensation of ATP level in 2 line by pyruvateaddition when glucose was removed or 2-DG was appliedalso suggests the existence of pyruvate-dependent systemtransferring electrons to the ETC This phenomenon canbe attributed to the stimulation of neuronal glycerol-3-phosphate shuttle which directly transfers electrons to coen-zymeQand is regulated byCa2+ andNADHNAD+ level [38ndash40]
The correlation between cell death and ATP is stillcontroversial On the one hand ATP depletion has beensuggested to be a switch from apoptosis to necrosis as ATPis required for apoptotic processes but not for necrosis [41]Contrary several reports demonstrated neuronal survivalat very low ATP level evidencing that energy deprivationnot always correlates with neuronal death [42ndash44] Our 2
BioMed Research International 11
GAPDH
GAPDH
C120573III-Tubulin
120573III-Tubulin
minusOligomycin
2 3
+Oligomycin (3h)
(a)
C 2 3
(AU
)
lowastlowast
minusOligomycin
10
15
05
00
+Oligomycin (3h)
(b)
Control 2 3
(3h)
minusO
ligom
ycin
+O
ligom
ycin
(c)
C
Fluo
resc
ence
ratio
025
05
075
10
002 3
lowast
lowast
(d)
Figure 8 Determination of 120573III-tubulin in differentiated PC12 cell lines (a) 120573III-Tubulin level was determined by immunoblotting in thepresence or absence of oligomycin (b) Densitometric quantification of bands intensity The results are presented as arbitrary units (AU)obtained after normalization to endogenous GAPDH level lowast119875 lt 005 versus control cells 119875 lt 005 oligomycin treated versus nontreatedcells (c) Representative images of immunofluorescent staining of 120573III-tubulin in single cells fixed with paraformaldehyde The images weretaken using TCS SP5 confocal microscope Scale bar 20 120583m (d) Decrease in 120573III-tubulin fluorescent signal following 3 h treatment witholigomycin from randomly selected 10 cells Fluorescence ratio was calculated as 119865oligo119865 where 119865oligo is a fluorescence measured followingoligomycin treatment and 119865 is a corresponding fluorescence intensity in the absence of oligomycin lowast119875 lt 005 versus control cells C mock-transfected PC12 2 PMCA2-reduced PC12 and 3 PMCA3-reduced PC12
and 3 lines were highly sensitive to glycolysis inhibitionand both necrosis and apoptosis were detected within 3 hFollowing the idea that ion homeostasis may be fuelled byATP synthesized locally by glycolysis [45] even relativelysmall depletion of glycolytically derived ATP as we observedin 2 line may profoundly distort ion pumping and initiatedeath cascades
Decreased expression of even single neurospecific PMCAisoform may impair Ca2+ extrusion thereby leading to celldeath due to Ca2+ overload Moreover reduction of ATPproduction by mitochondria can induce neuronal apoptosisor increase sensitivity to apoptotic death [46] In line withit cells stay alive as long as ATP is maintained at certainthreshold level Our study showed that this critical level couldbe sensitive to submembrane ATP consumption rate whichseems to be designated by PMCA membrane compositionBased on this we hypothesize that presence of PMCA2
and PMCA3 during neuronal differentiation may confer asurvival advantage
It is well known that calcium ions upregulate signalingpathways engaged in cell differentiation [11 47 48] Thusmore intensive ATP synthesis by OxPh could explain moreintense differentiation of 2 line Control and 3 linespossessing normal level of PMCA2 rely mainly on ATPproduced by glycolysis suggesting the predominance of thisenergetic pathway in energy provision for this isoformTaking both into account the plasma membrane locationof calcium pump as well as the presence in close proximityof glycolytic enzymes seems to be suitable for fast ATPharvesting in excitable cells Availability of ATP necessary forquick response to increasing Ca2+ may be therefore crucialfor ion homeostasis maintenance
In summary our findings demonstrate that changes inATP pool during differentiation are tightly coupled to Ca2+
12 BioMed Research International
signaling Disruption in Ca2+ balance as a result of PMCA2or PMCA3 downregulation may in turn profoundly affectcellular bioenergetic processes Depending whether pro-longed Ca2+ signal was originated from PMCA2 or PMCA3reduced clearing potency cells upregulate different energy-generating pathways to keep ATP level above the thresholdnecessary for survival In our experimental model this adap-tive response may represent a feedback mechanism of ATPsupply to maintain cellular ion homeostasis This would beparticularly beneficial whenPMCA2 level is reduced and cellsare exposed to protracting periods ofmild calcium elevationsThese relatively small variations in [Ca2+]c are howeverable to modify mitochondrial metabolism suggesting a tightrelationship between PMCA2 and ATP production Becauseeven small changes in cellular energy state may initiate cel-lular pathology and death fast reacting PMCA2 and PMCA3isoformsmay be considered as cellular bodyguards protectingagainst Ca2+ overload and subsequent mitochondrial failure
Conflict of Interests
The authors declare that there is no conflict of interestsregarding the publication of this paper
Authorsrsquo Contribution
TomaszBoczek andMalwina Lisek contributed equally to thiswork
Acknowledgments
This work was supported by the National Science Cen-tre Grant (to Tomasz Boczek) based on decision UMO-201205DNZ402982 and in part by Medical Universityof Lodz Grants nos 5036-086-02503-01 and 502-036-086-02502-64-061
References
[1] A Cheng Y Hou and M P Mattson ldquoMitochondria andneuroplasticityrdquo ASN Neuro vol 2 no 5 Article ID e000452010
[2] S S Kety ldquoThe general metabolism of the brain in vivo inrdquo inMetabolism of the Nervous System D Richter Ed pp 221ndash237Pergamon London UK 1957
[3] L Sokoloff ldquoThe metabolism of the central nervous system invivordquo in Handbook of Physiology Section I Neurophysiology JField H W Magoun and V E Hall Eds vol 3 pp 1843ndash1864American Physiological Society Washington DC USA 1960
[4] A M Surin S S Khiroug L R Gorbacheva B I Khodorov VG Pinelis and L Khiroug ldquoComparative analysis of cytosolicand mitochondrial ATP synthesis in embryonic and postnatalhippocampal neuronal culturesrdquo Frontiers in Molecular Neuro-science vol 2012 article 5 2012
[5] V Popov N I Medvedev H A Davies and M G Stew-art ldquoMitochondria form a filamentous reticular network inhippocampal dendrites but are present as discrete bodies inaxons a three-dimensional ultrastructural studyrdquo Journal ofComparative Neurology vol 492 no 1 pp 50ndash65 2005
[6] V Voccoli and L Colombaioni ldquoMitochondrial remodeling indifferentiating neuroblastsrdquo Brain Research vol 1252 pp 15ndash292009
[7] S S Rosenberg and N C Spitzer ldquoCalcium signaling inneuronal developmentrdquo Cold Spring Harbor Perspectives inBiology vol 3 no 10 Article ID 004259 2011
[8] M Brini T Calı D Ottolini and E Carafoli ldquoThe plasmamembrane calcium pump in health and diseaserdquo The FEBSJournal vol 280 no 21 pp 5385ndash5397 2013
[9] D A Zacharias and C Kappen ldquoDevelopmental expression ofthe four plasmamembrane calciumATPase (Pmca) genes in themouserdquo Biochimica et Biophysica ActamdashGeneral Subjects vol1428 no 2-3 pp 397ndash405 1999
[10] M R Sepulveda M Hidalgo-Sanchez D Marcos and AM Mata ldquoDevelopmental distribution of plasma membraneCa2+-ATPase isoforms in chick cerebellumrdquo DevelopmentalDynamics vol 236 no 5 pp 1227ndash1236 2007
[11] S N Kip N W Gray A Burette A Canbay R J Weinbergand E E Strehler ldquoChanges in the expression of plasmamembrane calcium extrusion systems during the maturation ofhippocampal neuronsrdquo Hippocampus vol 16 no 1 pp 20ndash342006
[12] D Poburko J Santo-Domingo and N Demaurex ldquoDynamicregulation of the mitochondrial proton gradient during cytoso-lic calcium elevationsrdquo Journal of Biological Chemistry vol 286no 13 pp 11672ndash11684 2011
[13] J Szemraj I Kawecka J Bartkowiak and L Zylinska ldquoTheeffect of antisense oligonucleotide treatment of plasma mem-brane Ca2+-ATPase in PC12 cellsrdquo Cellular and MolecularBiology Letters vol 9 no 3 pp 451ndash464 2004
[14] L Zylinska A Kozaczuk J Szemraj C Kargas and I KowalskaldquoFunctional importance of PMCA isoforms in growth anddevelopment of PC12 cellsrdquo Annals of the New York Academyof Sciences vol 1099 pp 254ndash269 2007
[15] T Boczek M Lisek A Kowalski et al ldquoDownregulation ofPMCA2 or PMCA3 reorganizes Ca2+ handling systems indifferentiating PC12 cellsrdquo Cell Calcium vol 52 no 6 pp 433ndash444 2012
[16] J G Duman L Chen and B Hille ldquoCalcium transportmechanisms of PC12 cellsrdquo Journal of General Physiology vol131 no 4 pp 307ndash323 2008
[17] D Shepherd andP BGarland ldquoATP controlled acetoacetate andcitrate synthesis by rat liver mitochondria oxidising palmitoyl-carnitine and the inhibition of citrate synthase by ATPrdquoBiochemical and Biophysical Research Communications vol 22no 1 pp 89ndash93 1966
[18] M Pytlowany J B Strosznajder H Jesko M Cakała and R PStrosznajder ldquoMolecular mechanism of PC12 cell death evokedby sodium nitroprusside a nitric oxide donorrdquo Acta BiochimicaPolonica vol 55 no 2 pp 339ndash347 2008
[19] Y Nakashima K Shinzawa-Itoh K Watanabe K Naoki NHano and S Yoshikawa ldquoSteady-state kinetics of NADHcoen-zyme Q oxidoreductase isolated from bovine heart mitochon-driardquo Journal of Bioenergetics and Biomembranes vol 34 no 1pp 11ndash19 2002
[20] Y Hatefi and D L Stiggall ldquoPreparation and properties ofsuccinate ubiquinone oxidoreductase (complex II)rdquoMethods inEnzymology vol 53 pp 21ndash27 1978
[21] C I Ragan M T Wilson V M Darley-Usmar and P N LoweMitochondria A Practical Approach IRL Press London UK1978
BioMed Research International 13
[22] T Milakovic and G V W Johnson ldquoMitochondrial respirationand ATP production are significantly impaired in striatal cellsexpressing mutant huntingtinrdquo Journal of Biological Chemistryvol 280 no 35 pp 30773ndash30782 2005
[23] K J Livak and T D Schmittgen ldquoAnalysis of relative geneexpression data using real-time quantitative PCR and the 2-ΔΔCT methodrdquoMethods vol 25 no 4 pp 402ndash408 2001
[24] K A Kasischke H D Vishwasrao P J Fisher W R Zipfeland W W Webb ldquoNeural activity triggers neuronal oxidativemetabolism followed by astrocytic glycolysisrdquo Science vol 305no 5680 pp 99ndash103 2004
[25] L Hertz L Peng and G A Dienel ldquoEnergy metabolismin astrocytes High rate of oxidative metabolism and spa-tiotemporal dependence on glycolysisglycogenolysisrdquo Journalof Cerebral Blood Flow and Metabolism vol 27 no 2 pp 219ndash249 2007
[26] K Yamane K Yokono and Y Okada ldquoAnaerobic glycolysisis crucial for the maintenance of neural activity in guinea pighippocampal slicesrdquo Journal of Neuroscience Methods vol 103no 2 pp 163ndash171 2000
[27] Z Wang N J Gardiner and P Fernyhough ldquoBlockade of hex-okinase activity and binding to mitochondria inhibits neuriteoutgrowth in cultured adult rat sensory neuronsrdquo NeuroscienceLetters vol 434 no 1 pp 6ndash11 2008
[28] M PMattson and J Partin ldquoEvidence formitochondrial controlof neuronal polarityrdquo Journal of Neuroscience Research vol 56no 1 pp 8ndash20 1999
[29] F Galeffi K A Foster M P Sadgrove C J Beaver andD A Turner ldquoLactate uptake contributes to the NAD(P)Hbiphasic response and tissue oxygen response during synapticstimulation in area CA1 of rat hippocampal slicesrdquo Journal ofNeurochemistry vol 103 no 6 pp 2449ndash2461 2007
[30] T Boczek M Lisek B Ferenc et al ldquoPlasma membrane Ca2+-ATPase isoforms composition regulates cellular pH homeosta-sis in differentiating PC12 cells in a manner dependent oncytosolic Ca2+ elevationsrdquo PLoS ONE vol 9 no 7 Article IDe102352 2014
[31] D Fernandes A Zaidi J Bean D Hui and M L MichaelisldquoRNAi-induced silencing of the plasma membrane Ca2+-ATPase 2 in neuronal cells Effects on Ca2+ homeostasis and cellviabilityrdquo Journal of Neurochemistry vol 102 no 2 pp 454ndash4652007
[32] M C Curry N A Luk P A Kenny S J Roberts-ThomsonandG RMonteith ldquoDistinct regulation of cytoplasmic calciumsignals and cell death pathways by different plasma membranecalcium ATPase isoforms in MDA-MB-231 breast cancer cellsrdquoJournal of Biological Chemistry vol 287 no 34 pp 28598ndash28608 2012
[33] M P Kurnellas H Li M R Jain et al ldquoReduced expressionof plasma membrane calcium ATPase 2 and collapsin responsemediator protein 1 promotes death of spinal cord neuronsrdquo CellDeath and Differentiation vol 17 no 9 pp 1501ndash1510 2010
[34] G Trendelenburg and U Dirnagl ldquoNeuroprotective role ofastrocytes in cerebral ischemia focus on ischemic precondi-tioningrdquo Glia vol 50 no 4 pp 307ndash320 2005
[35] Y Miao Y Qiu Y Lin Z Miao J Zhang and X Lu ldquoProtec-tion by pyruvate against glutamate neurotoxicity is mediatedby astrocytes through a glutathione-dependent mechanismrdquoMolecular Biology Reports vol 38 no 5 pp 3235ndash3242 2011
[36] R Rossignol T Letellier M Malgat C Rocher and J MazatldquoTissue variation in the control of oxidative phosphorylation
implication for mitochondrial diseasesrdquo Biochemical Journalvol 347 no 1 pp 45ndash53 2000
[37] P Detimary P Gilon and J-C Henquin ldquoInterplay betweencytoplasmic Ca2+ and the ATPADP ratio a feedback controlmechanism in mouse pancreatic isletsrdquo Biochemical Journalvol 333 no 2 pp 269ndash274 1998
[38] M C McKenna H S Waagepetersen A Schousboe andU Sonnewald ldquoNeuronal and astrocytic shuttle mechanismsfor cytosolic-mitochondrial transfer of reducing equivalentscurrent evidence and pharmacological toolsrdquoBiochemical Phar-macology vol 71 no 4 pp 399ndash407 2006
[39] N H T Nguyen A Brathe and B Hassel ldquoNeuronal uptakeand metabolism of glycerol and the neuronal expression ofmitochondrial glycerol-3-phosphate dehydrogenaserdquo Journal ofNeurochemistry vol 85 no 4 pp 831ndash842 2003
[40] M Ramos A Del Arco B Pardo et al ldquoDevelopmental changesin the Ca2+-regulated mitochondrial aspartate-glutamate car-rier aralar1 in brain and prominent expression in the spinalcordrdquo Developmental Brain Research vol 143 no 1 pp 33ndash462003
[41] G W Dorn ldquoMolecular mechanisms that differentiate apopto-sis from programmed necrosisrdquo Toxicologic Pathology vol 41no 2 pp 227ndash234 2013
[42] PNicotera andGMelino ldquoRegulation of the apoptosis-necrosisswitchrdquo Oncogene vol 23 no 16 pp 2757ndash2765 2004
[43] Y Tsujimoto ldquoApoptosis and necrosis intracellular ATP level asa determinant for cell death modesrdquo Cell Death and Differenti-ation vol 4 no 6 pp 429ndash434 1997
[44] S Orrenius B Zhivotovsky and P Nicotera ldquoRegulation of celldeath the calcium-apoptosis linkrdquo Nature Reviews MolecularCell Biology vol 4 no 7 pp 552ndash565 2003
[45] S N Vaishnavi A G Vlassenko M M Rundle A Z SnyderM A Mintun and M E Raichle ldquoRegional aerobic glycolysisin the human brainrdquo Proceedings of the National Academy ofSciences of the United States of America vol 107 no 41 pp17757ndash17762 2010
[46] X Q Wang A Y Xiao C Sheline et al ldquoApoptotic insultsimpair Na+ K+-ATPase activity as a mechanism of neuronaldeath mediated by concurrent ATP deficiency and oxidantstressrdquo Journal of Cell Science vol 116 no 10 pp 2099ndash21102003
[47] X Gu and N C Spitzer ldquoDistinct aspects of neuronal differen-tiation encoded by frequency of spontaneous Ca2+ transientsrdquoNature vol 375 no 6534 pp 784ndash787 1995
[48] I A Silver J Deas and M Erecinska ldquoIon homeostasisin brain cells Differences in intracellular ion responses toenergy limitation between cultured neurons and glial cellsrdquoNeuroscience vol 78 no 2 pp 589ndash601 1997
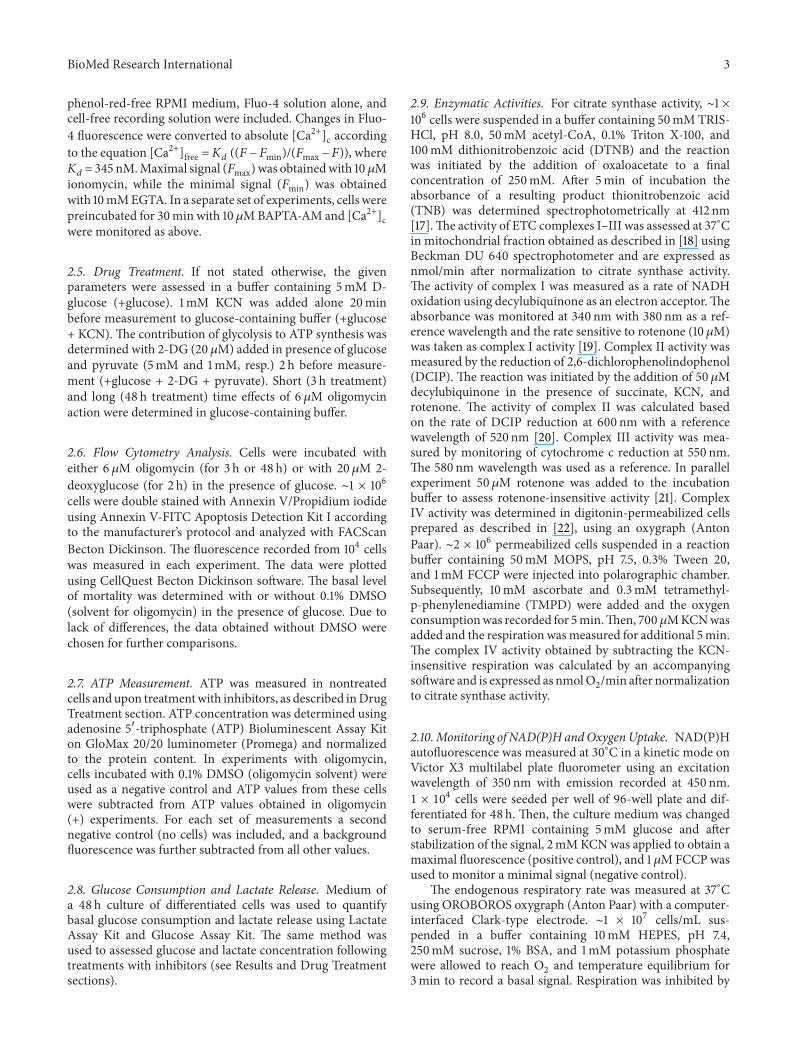
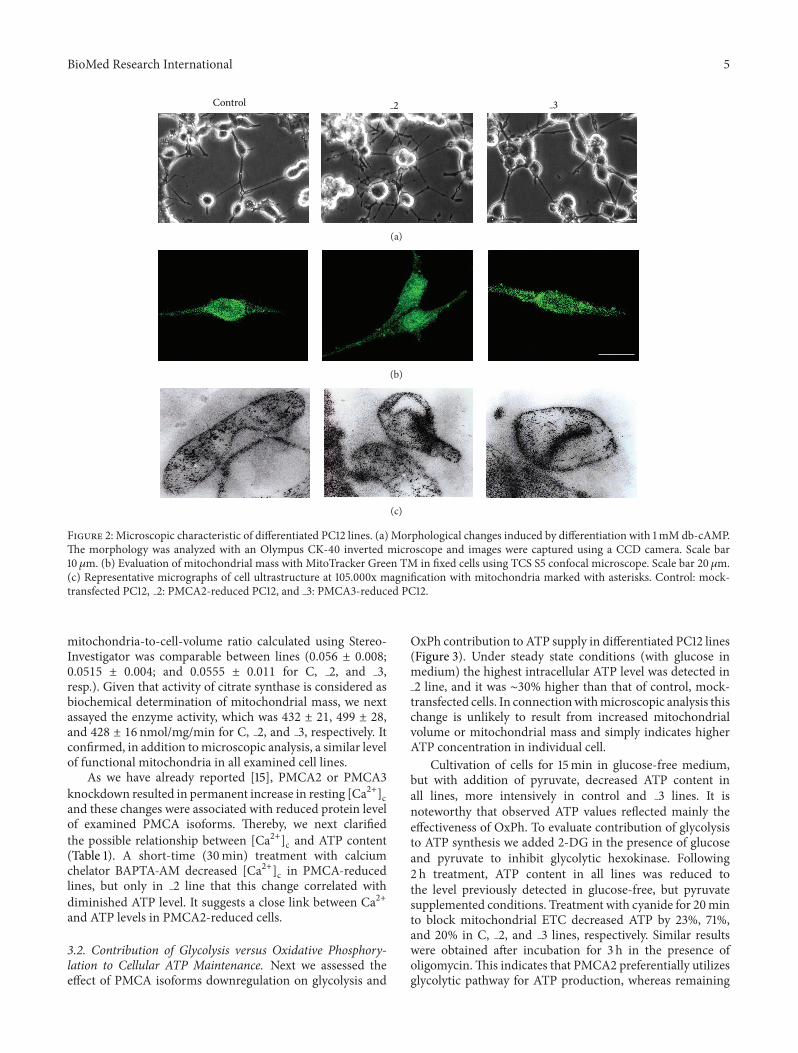
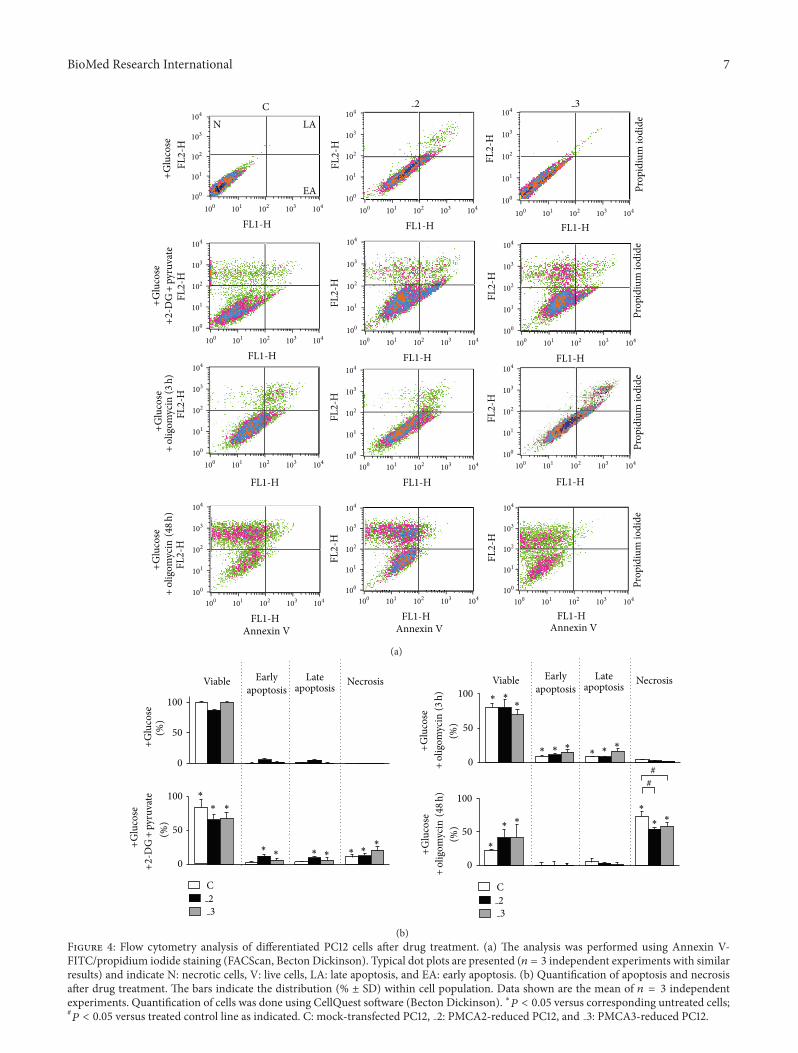
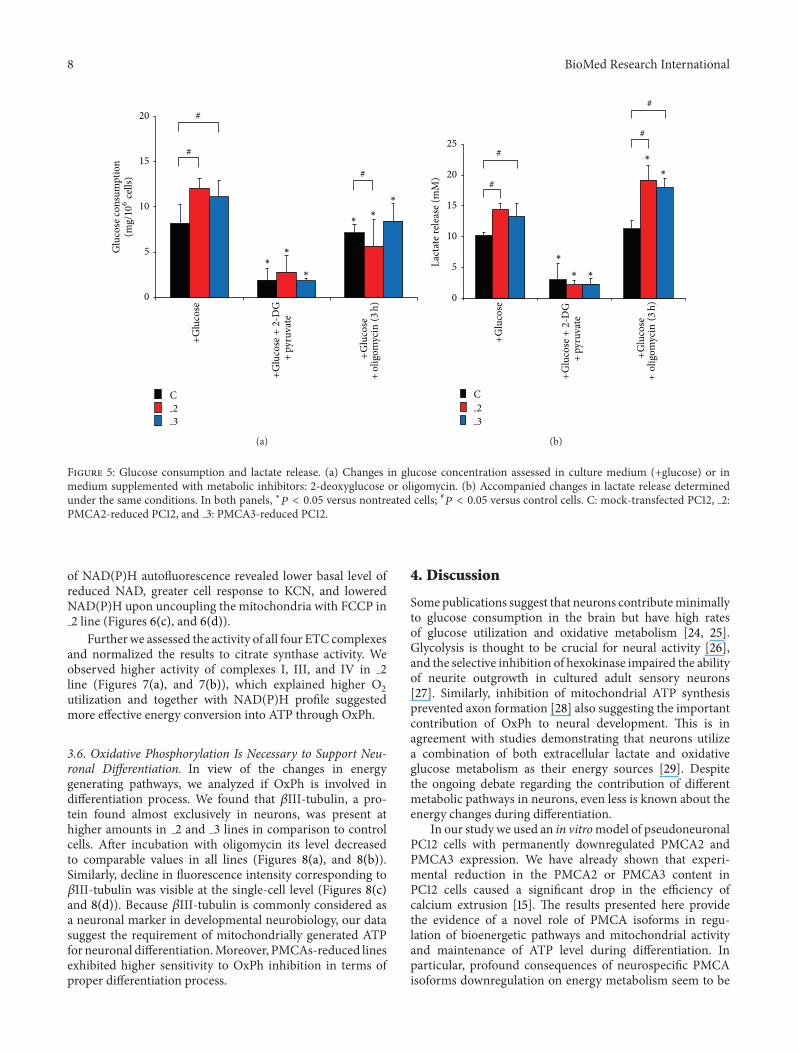
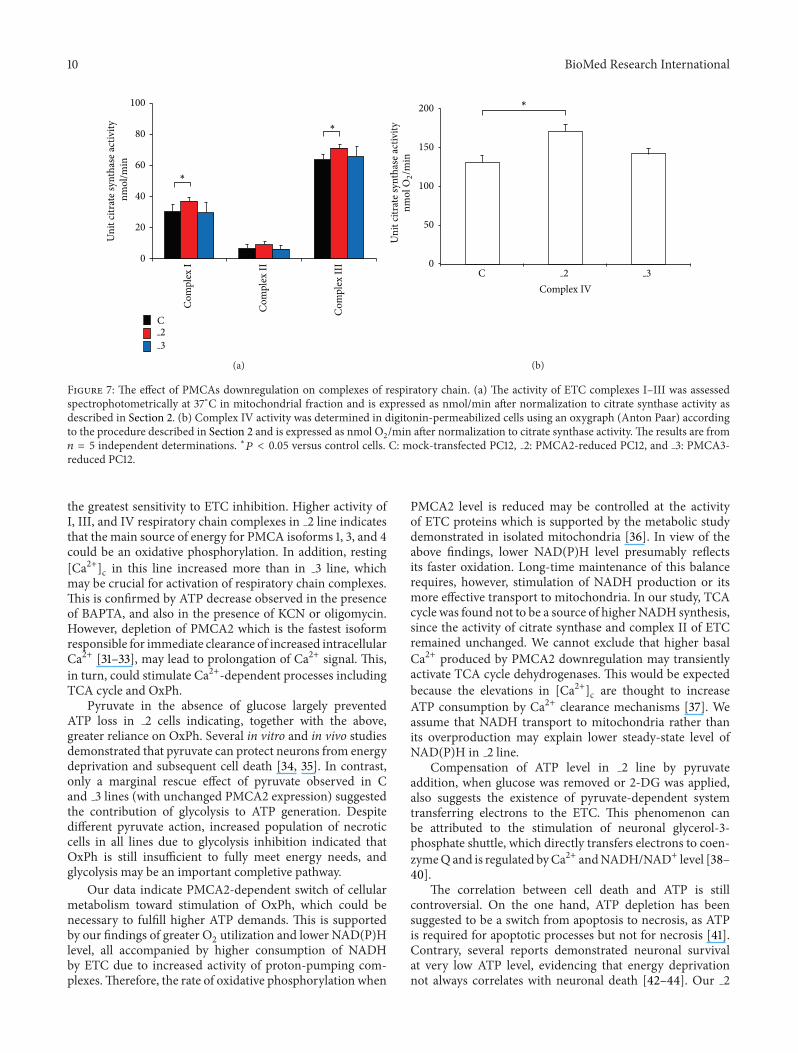
Copyright © 2022 FDOKUMEN