Shriram Transport - Google Groups
26
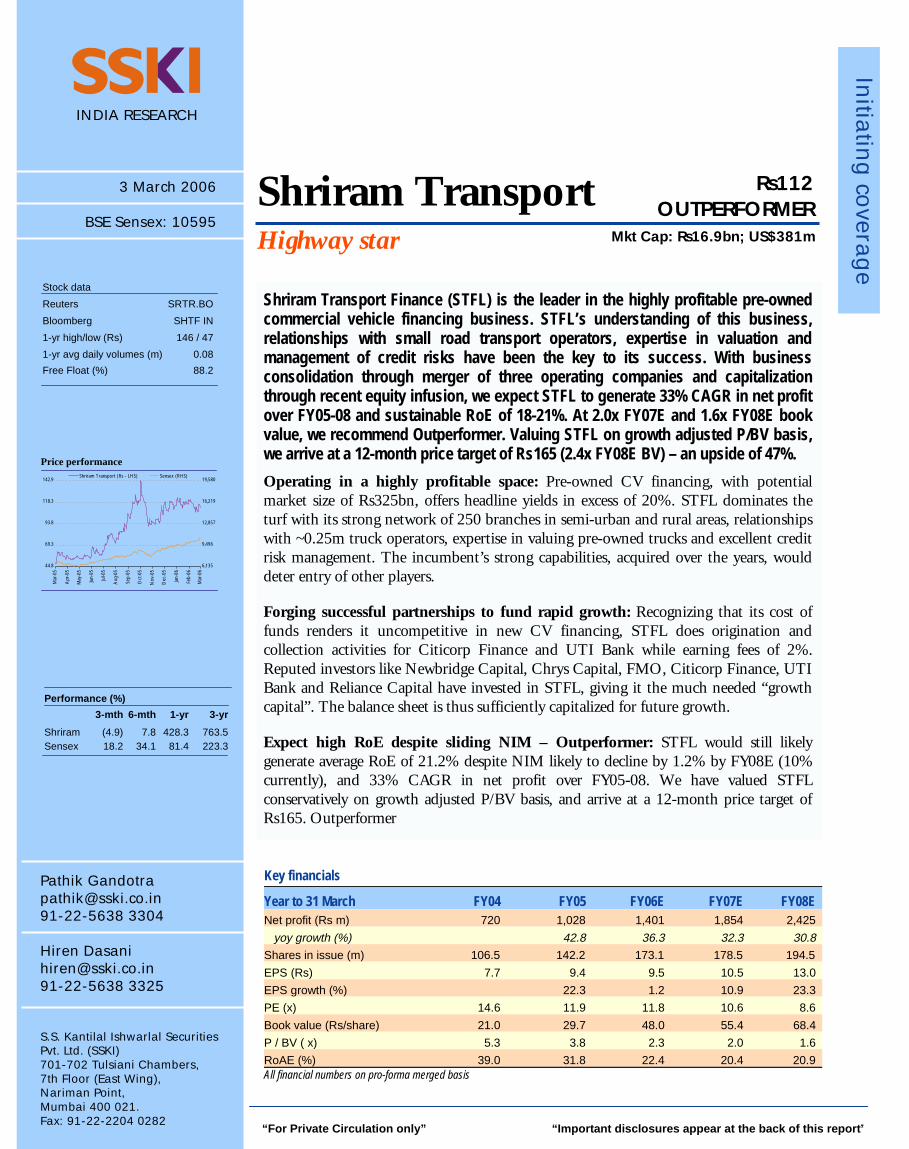
Initiating coverage INDIA RESEARCH Key financials Year to 31 March FY04 FY05 FY06E FY07E FY08E Net profit (Rs m) 720 1,028 1,401 1,854 2,425 yoy growth (%) 42.8 36.3 32.3 30.8 Shares in issue (m) 106.5 142.2 173.1 178.5 194.5 EPS (Rs) 7.7 9.4 9.5 10.5 13.0 EPS growth (%) 22.3 1.2 10.9 23.3 PE (x) 14.6 11.9 11.8 10.6 8.6 Book value (Rs/share) 21.0 29.7 48.0 55.4 68.4 P / BV ( x) 5.3 3.8 2.3 2.0 1.6 RoAE (%) 39.0 31.8 22.4 20.4 20.9 All financial numbers on pro-forma merged basis Pathik Gandotra [email protected] 91-22-5638 3304 Hiren Dasani [email protected] 91-22-5638 3325 S.S. Kantilal Ishwarlal Securities Pvt. Ltd. (SSKI) 701-702 Tulsiani Chambers, 7th Floor (East Wing), Nariman Point, Mumbai 400 021. Fax: 91-22-2204 0282 3 March 2006 BSE Sensex: 10595 Price performance Performance (%) 3-mth 6-mth 1-yr 3-yr Shriram (4.9) 7.8 428.3 763.5 Sensex 18.2 34.1 81.4 223.3 “For Private Circulation only” “Important disclosures appear at the back of this report” Shriram Transport Highway star Shriram Transport Finance (STFL) is the leader in the highly profitable pre-owned commercial vehicle financing business. STFL’s understanding of this business, relationships with small road transport operators, expertise in valuation and management of credit risks have been the key to its success. With business consolidation through merger of three operating companies and capitalization through recent equity infusion, we expect STFL to generate 33% CAGR in net profit over FY05-08 and sustainable RoE of 18-21%. At 2.0x FY07E and 1.6x FY08E book value, we recommend Outperformer. Valuing STFL on growth adjusted P/BV basis, we arrive at a 12-month price target of Rs165 (2.4x FY08E BV) – an upside of 47%. Operating in a highly profitable space: Pre-owned CV financing, with potential market size of Rs325bn, offers headline yields in excess of 20%. STFL dominates the turf with its strong network of 250 branches in semi-urban and rural areas, relationships with ~0.25m truck operators, expertise in valuing pre-owned trucks and excellent credit risk management. The incumbent’s strong capabilities, acquired over the years, would deter entry of other players. Forging successful partnerships to fund rapid growth: Recognizing that its cost of funds renders it uncompetitive in new CV financing, STFL does origination and collection activities for Citicorp Finance and UTI Bank while earning fees of 2%. Reputed investors like Newbridge Capital, Chrys Capital, FMO, Citicorp Finance, UTI Bank and Reliance Capital have invested in STFL, giving it the much needed “growth capital”. The balance sheet is thus sufficiently capitalized for future growth. Expect high RoE despite sliding NIM – Outperformer: STFL would still likely generate average RoE of 21.2% despite NIM likely to decline by 1.2% by FY08E (10% currently), and 33% CAGR in net profit over FY05-08. We have valued STFL conservatively on growth adjusted P/BV basis, and arrive at a 12-month price target of Rs165. Outperformer Rs112 OUTPERFORMER Mkt Cap: Rs16.9bn; US$381m Stock data Reuters SRTR.BO Bloomberg SHTF IN 1-yr high/low (Rs) 146 / 47 1-yr avg daily volumes (m) 0.08 Free Float (%) 88.2 44.8 69.3 93.8 118.3 142.9 Mar-05 Apr-05 May-05 Jun-05 Jul-05 Aug-05 Sep-05 Oct-05 Nov-05 Dec-05 Jan-06 Feb-06 Mar-06 6,135 9,496 12,857 16,219 19,580 Shriram Transport (Rs - LHS) Sensex (RHS)
-
Upload
khangminh22 -
Category
Documents
-
view
1 -
download
0
Transcript of Shriram Transport - Google Groups
Initia
ting
covera
ge
INDIA RESEARCH
Key financials
Year to 31 March FY04 FY05 FY06E FY07E FY08E Net profit (Rs m) 720 1,028 1,401 1,854 2,425
yoy growth (%) 42.8 36.3 32.3 30.8
Shares in issue (m) 106.5 142.2 173.1 178.5 194.5
EPS (Rs) 7.7 9.4 9.5 10.5 13.0
EPS growth (%) 22.3 1.2 10.9 23.3
PE (x) 14.6 11.9 11.8 10.6 8.6
Book value (Rs/share) 21.0 29.7 48.0 55.4 68.4
P / BV ( x) 5.3 3.8 2.3 2.0 1.6
RoAE (%) 39.0 31.8 22.4 20.4 20.9 All financial numbers on pro-forma merged basis
Pathik Gandotra [email protected] 91-22-5638 3304 Hiren Dasani [email protected] 91-22-5638 3325 S.S. Kantilal Ishwarlal Securities Pvt. Ltd. (SSKI) 701-702 Tulsiani Chambers, 7th Floor (East Wing), Nariman Point, Mumbai 400 021. Fax: 91-22-2204 0282
3 March 2006
BSE Sensex: 10595
Price performance
Performance (%)
3-mth 6-mth 1-yr 3-yr
Shriram (4.9) 7.8 428.3 763.5 Sensex 18.2 34.1 81.4 223.3
“For Private Circulation only” “Important disclosures appear at the back of this report ”
Shriram Transport Highway star
Shriram Transport Finance (STFL) is the leader in the highly profitable pre-owned commercial vehicle financing business. STFL’s understanding of this business, relationships with small road transport operators, expertise in valuation and management of credit risks have been the key to its success. With business consolidation through merger of three operating companies and capitalization through recent equity infusion, we expect STFL to generate 33% CAGR in net profit over FY05-08 and sustainable RoE of 18-21%. At 2.0x FY07E and 1.6x FY08E book value, we recommend Outperformer. Valuing STFL on growth adjusted P/BV basis, we arrive at a 12-month price target of Rs165 (2.4x FY08E BV) – an upside of 47%.
Operating in a highly profitable space: Pre-owned CV financing, with potential market size of Rs325bn, offers headline yields in excess of 20%. STFL dominates the turf with its strong network of 250 branches in semi-urban and rural areas, relationships with ~0.25m truck operators, expertise in valuing pre-owned trucks and excellent credit risk management. The incumbent’s strong capabilities, acquired over the years, would deter entry of other players.
Forging successful partnerships to fund rapid growth: Recognizing that its cost of funds renders it uncompetitive in new CV financing, STFL does origination and collection activities for Citicorp Finance and UTI Bank while earning fees of 2%. Reputed investors like Newbridge Capital, Chrys Capital, FMO, Citicorp Finance, UTI Bank and Reliance Capital have invested in STFL, giving it the much needed “growth capital”. The balance sheet is thus sufficiently capitalized for future growth.
Expect high RoE despite sliding NIM – Outperformer: STFL would still likely generate average RoE of 21.2% despite NIM likely to decline by 1.2% by FY08E (10% currently), and 33% CAGR in net profit over FY05-08. We have valued STFL conservatively on growth adjusted P/BV basis, and arrive at a 12-month price target of Rs165. Outperformer
Rs112 OUTPERFORMER
Mkt Cap: Rs16.9bn; US$381m
Stock data
Reuters SRTR.BO
Bloomberg SHTF IN
1-yr high/low (Rs) 146 / 47
1-yr avg daily volumes (m) 0.08
Free Float (%) 88.2
44.8
69.3
93.8
118.3
142.9
Mar
-05
Apr
-05
May
-05
Jun-
05
Jul-0
5
Aug
-05
Sep-
05
Oct
-05
Nov
-05
Dec
-05
Jan-
06
Feb-
06
Mar
-06
6,135
9,496
12,857
16,219
19,580Shriram Transport (Rs - LHS) Sensex (RHS)

�
MARCH 2006 2
SSKI INDIA
INVESTMENT ARGUMENT STFL is India’s largest corporate entity in pre-owned truck financing, estimated to be a Rs325bn market. Although intense competition has dented lending yields in the new CV financing market, pre-owned CV financing still offers fat margins due to underpenetration of organized lenders. STFL has developed high entry barriers over the years by way of a network of ~250 branches spread over relevant freight hubs, strong relationships with clients and expertise in valuation of pre-owned trucks. Although lending yields and NIMs are likely to decline from the existing levels, the impact is expected to be mitigated by falling cost of funds owing to an improving credit profile. We expect STFL to generate 33% CAGR in net profit over FY05-08 with average RoE of 21.2%.
��Pre-owned CV financing market is underpenetrated The commercial vehicle (CV) financing market can be broadly divided into two segments – financing of new trucks and old trucks. A closer look at the CV financing industry throws up an interesting aspect – while new truck financing market is estimated to be a Rs186bn annual opportunity, pre-owned trucks financing market offers a potentially larger opportunity of Rs325bn. Buoyant economic outlook leading to strong growth in CV sales, aggressive stance adopted by private sector banks in terms of higher Loan to Value (LTV), longer tenures and sliding interest rates are some of the key growth drivers for new CV financing market. On the other hand, pre-owned CV financing is largely dominated by the unorganized sector and STFL is arguably the only large corporate entity active in this space. Modernization of trucking industry and increasing penetration of organized financiers are the key growth drivers for pre-owned CV financing market.
Exhibit 1: CV financing market
Source: SSKI Research
��STFL – an efficient player in pre-owned CV financing STFL is the largest organized financier in pre-owned CV financing market with a balance sheet size of Rs60bn as of FY06E (and Rs23bn in off balance sheet managed assets). Over the past 25 years, STFL has developed strong and crucial competencies in the areas of loan origination, valuation of pre-owned trucks and collection of receivables. The company’s ability to manage credit risks in a seemingly difficult business for lenders (most of its customers do not have developed banking habits) is quite commendable.
STFL has stron g competencies in loa n
origination and collectio n as also credit ris k
managemen t
Pre-owned truck financin g estimated to be a Rs325b n
opportunity; STFL is th e largest corporat e
entity her e
&RPPHUFLDO�YHKLFOH�ILQDQFLQJ
3UH�RZQHG�&9�ILQDQFLQJ
0NW VL]H� 5V���EQ�EDVHG�RQ�WRWDO�RXWVWDQGLQJ�SRSXODWLRQ
'RPLQDWHG�E\� XQRUJDQL]HG�VHFWRU��6KULUDP 7UDQVSRUW��
ODUJHVW�RUJDQL]HG�ILQDQFLHU
.H\�JURZWK�GULYHUV� PRGHUQL]DWLRQ�RI�WUXFNLQJ�LQGXVWU\��
LQFUHDVLQJ�SHQHWUDWLRQ�RI�RUJDQL]HG�ILQDQFLHUV�
1HZ�&9�ILQDQFLQJ
0NW VL]H� 5V���EQ�SHU�DQQXP�
'RPLQDWHG�E\� QHZ�SULYDWH�VHFWRU�EDQNV
.H\�JURZWK�GULYHUV� JURZWK�LQ�&9�VDOHV��ORZHU�\LHOGV��
IOH[LEOH�ORDQ�WHUPV

�
MARCH 2006 3
SSKI INDIA
��Consistent track record of growth and healthy asset quality STFL has shown consistent growth in its loan book and balance sheet. While the loan book has burgeoned at a CAGR of 51% over FY02-05, net interest income has shown CAGR of 39% over the same period. More importantly, the company has not compromised on its asset quality to achieve such high growth rates – in fact, provisioning has averaged at 1.5% of loan assets over this period. It is mandatory for field officers of STFL to meet the customers every month for collection, which helps the company keep defaults to such a low level.
Exhibit 2:Growth in loan book… …improving asset quality
Source: SSKI Research
��Significant entry barriers The Shriram group has erected strong entry barriers over the years in its business segment, i.e. pre-owned truck financing.
• Network: STFL has an extensive pan-India network of 250 branches and more than 1,000 field officers. Its branch network is concentrated in “relevant” freight centers. (Please refer Annexure – I for details about branch network). The potential competitors are PSU banks having widespread coverage of semi-urban and rural areas. However, we do not see PSU banks entering the market, as they are operationally not geared for the same.
• Large customer base: STFL’s relationships with about 0.25m single and small truck operators as well as large fleet operators provide very valuable market information about borrowers. Any new entrant would take considerable time in acquiring the skill.
• Valuation skills: STFL has, over the years, developed considerable expertise in valuation of pre-owned trucks. Valuation expertise is an absolute must to succeed in this space given that the amount of loan, EMI and truck operator’s ability to repay depend on the value of the truck.
• Aversion of banks to cash collection: Due to underdeveloped banking habits of small truck operators, a large part of monthly collections are in the form of cash and not by way of cheques. Banks are generally seen not comfortable with large amounts of cash collection, whereas compulsory monthly visits to borrowers by field officers of STFL helps the company in managing large cash collections.
• Low employee turnover: All the employees of STFL have risen through the ranks and have been with the company for a long time. STFL has initiated an ESOP scheme, which covers all of its employees right down to the lowest cadre, and is expected to dissuade employees from leaving the organization.
Loan book (Rs bn)
-
8
16
24
32
2002 2003 2004 2005
51% CAGR
Net NPA (%)
0.0
0.4
0.8
1.2
1.6
2003 2004 2005
STFL’s extensive branc h network, large custome r base and valuation skill s
act as entry barriers fo r new player s

�
MARCH 2006 4
SSKI INDIA
��Managing alliances successfully STFL concedes that access to low cost funds is the key to improving its overall performance. Hence, the company has developed strong relationships with public sector as well as private sector banks. Keen to win a piece of the new CV financing pie, STFL has been successfully managing new CV portfolios of Citicorp Finance and UTI Bank. Here, although the asset rests on UTI Bank or Citicorp Finance’s books, origination and collection activities are done by STFL. STFL gets ~2% fees for the same while it bears partial credit risk. On the other hand, promoters have been able to attract private equity investors to capitalize the balance sheet, which has enabled the company to achieve rapid growth in its loan book.
Exhibit 3: STFL – strategic relationships
Source: SSKI Research
��Falling cost of funds to mitigate decline in lending yields STFL’s cost of funds has been falling consistently over the years owing to a downward bias in interest rates in the system, shift in funding profile from high cost retail debentures to wholesale debentures and term loans from banks, as also an improving credit profile. Going forward, we expect the cost of funds to decline driven by a further shift in favour of bank financing and improving credit profile. STFL has been passing on the benefits of lower cost of funds to its customers, which has meant lower lending yields for the company. Going forward, although lending yields are likely to fall due to increasing competition in its core area of business from commercial banks, the same would be partially offset by lower cost of funds.
Exhibit 4:Lending yields and cost of funds
0
10
20
30
40
2003 2004 2005 2006E 2007E 2008E
Cost of funds (%) Lending yields (%)
Source: Company, SSKI Research
Cost of funds comin g down in line wit h
improving credit profile; t o alleviate pressure o n
lending yield s
STFL’s balance sheet wel l capitalized for growth; als o
forging alliances for ne w CV financing, which bring s
in additional revenue s
6WUDWHJLF�5HODWLRQVKLSV�RI�6KULUDP�7UDQVSRUW
6RXUFLQJ��FROOHFWLRQ�RI�ORDQV
� &LWLFRUS�ILQDQFH
� 87,�%DQN
� ,&,&,�%DQN�
'HEW�IXQGLQJ
� &RQVRUWLXP�RI�SXEOLF�DV�
ZHOO�DV�SULYDWH�VHFWRU�EDQNV
� 0XWXDO�IXQGV�WKURXJK�
GHEHQWXUH�URXWH�
(TXLW\�SDUWQHUVKLSV
� 1HZ�EULGJH�FDSLWDO
� &KU\V�FDSLWDO
� &LWLFRUS�ILQDQFH
� 87,�%DQN
� )02��1HWKHUODQGV
� 5HOLDQFH�&DSLWDO

�
MARCH 2006 5
SSKI INDIA
��NIM to decline but still adequate to provide healthy RoE We expect net interest margin to decline gradually, mainly due to falling yields in the face of increasing competition. However, we expect NIM to be in the range of 8.5-9.0%, which would be more than adequate to compensate for the high operating cost (mainly due to significant collection in cash and incentives given to field officers for timely collections) and higher credit cost. As STFL steps up lending growth, we expect provisioning to increase in the coming period. Despite these issues, we expect STFL to maintain average RoA of 2.6% and RoE of 21.2% over FY05-08.
Exhibit 5:Net interest margin and RoE
0
10.0
20.0
30.0
40.0
2004 2005 2006E 2007E 2008E0.0
3.5
7.0
10.5
14.0RoE (% - LHS) NIM (% - RHS)
Source: Company, SSKI Research
��Attractive valuations – Outperformer STFL has consistently generated high RoE on the back of firm lending rates and efficient management of credit defaults. Going forward, RoE is likely to come off due to substantial capitalization and a likely decline in NIMs in the face of stiff competition. However, we expect RoE to average 21.2% over FY05-08, which is still quite attractive.
We have valued STFL using the growth adjusted P/BV method and believe that 2.4x book value is a fair multiple considering 21.2% average RoE over FY05-08. We initiate coverage on the stock with an Outperformer rating and a 12-month price target of Rs165 (2.4x FY08E adjusted book value) – a potential upside of 47%.
Exhibit 6: Comparative valuations
Company Recommendation Price (Rs) as Mkt Cap P / BV (x) EPS growth (%) RoE (%)
on 3 Mar 06 (Rs m) FY06E FY07E FY08E FY08 / 05 FY06E FY07E FY08E Shriram Transport Outperformer 112.25 16,898 2.3 2.0 1.6 11.4 22.4 20.4 20.9
IDFC Neutral 71.0 79,638 3.1 2.8 2.6 37.1 8.3 10.0 12.5
ICICI Bank Outperformer 608.9 541,766 2.5 2.2 2.0 20.7 14.5 13.9 16.5
Centurion Bank Outperformer 25.9 33,170 3.7 3.2 2.7 75.0 15.1 13.1 16.1
HDFC N.A. 1318.9 328,858 7.0 5.7 5.2 18.0 28.9 29.4 30.3
M&M Finance N.A. 200 17,200 2.7 N.A. N.A. N.A. N.A. N.A. N.A. Source: SSKI Research * HDFC estimates are consensus numbers from Bloomberg ** M&M finance price is IPO allotment price and FY06 book value estimated by annualizing 9mth profits
NIMs, though likely to fal l to 8.5-9.0%, sufficient t o
offset high operating cos t and higher credit cos t
RoE to moderate to 21.2 % over FY05-0 8
Growth adjusted P/B V method gives a fair price o f Rs165 over next 12 month s
�
MARCH 2006 6
SSKI INDIA
��Key risks We believe the following factors may impact STFL’s future performance:
• Single product concentration: STFL is active only in truck finance business and within that only in pre-owned truck financing. As the company does not extend financing for other assets, it runs the risk of getting adversely impacted in case of a slow down in CV sales or by regulatory issues affecting the CV industry.
• Large scale entry of commercial banks: As of now, private sector as well as public sector banks are not very active in pre-owned CV financing (as the business dynamics do not support the high overhead structure) and due to relatively slower decision making of PSU banks. However, if large banks decide to aggressively pursue this business, it would definitely lead to decline in lending yields and margins. However, we believe that financing of pre-owned assets inherently supports higher yields – experience of pre-owned car financing is a pointer to that direction, where yields are still at 12-16% despite intense competition. Moreover, PSU banks may not be successful in managing credit risks in this business in the long term (as has been witnessed in mortgages).
• Sharp economic downturn: Economics of a truck operator are closely aligned to the macro economic environment. Any sharp downturn in the economy could lead to truck opeartors’ financing worsening and increase in default rates for financiers like STFL.
�
MARCH 2006 7
SSKI INDIA
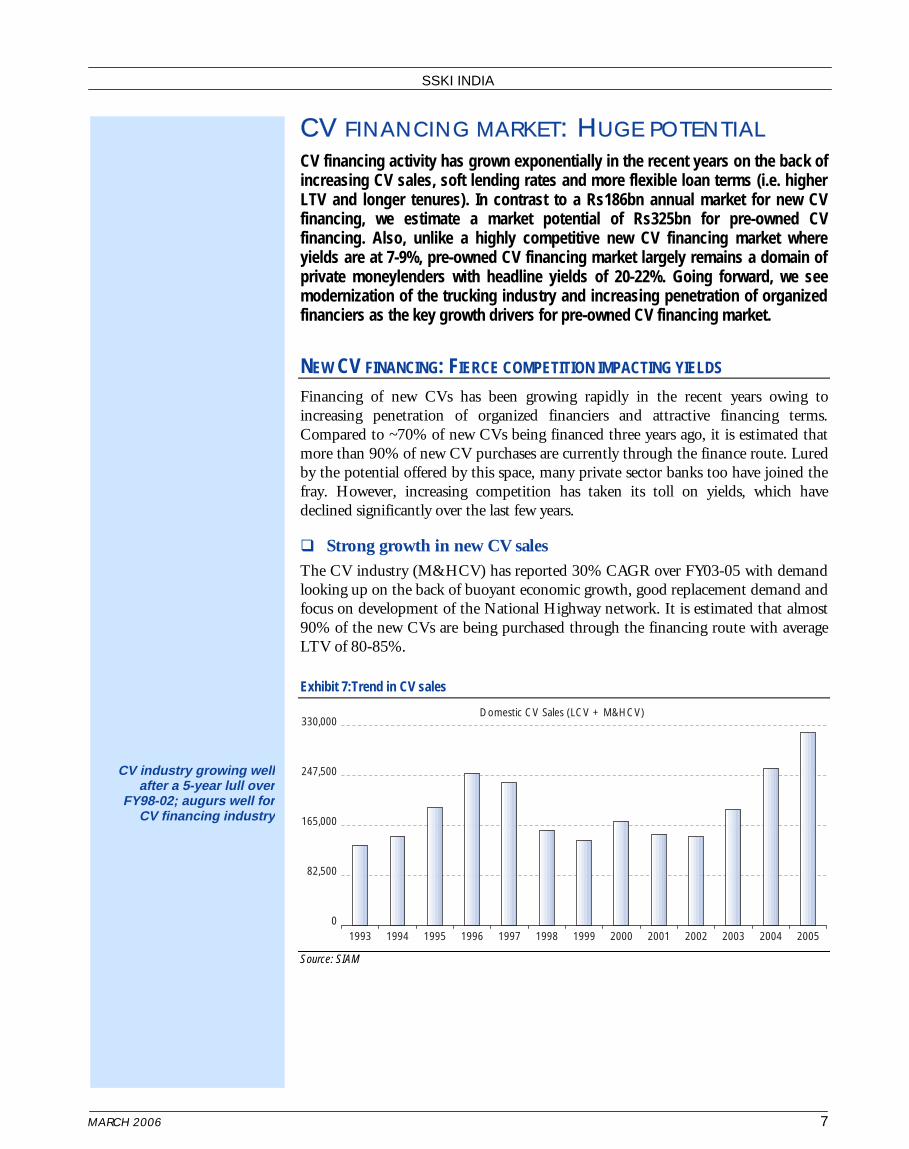
CV FINANCING MARKET: HUGE POTENTIAL CV financing activity has grown exponentially in the recent years on the back of increasing CV sales, soft lending rates and more flexible loan terms (i.e. higher LTV and longer tenures). In contrast to a Rs186bn annual market for new CV financing, we estimate a market potential of Rs325bn for pre-owned CV financing. Also, unlike a highly competitive new CV financing market where yields are at 7-9%, pre-owned CV financing market largely remains a domain of private moneylenders with headline yields of 20-22%. Going forward, we see modernization of the trucking industry and increasing penetration of organized financiers as the key growth drivers for pre-owned CV financing market.
NEW CV FINANCING: FIERCE COMPETITION IMPACTING YIELDS Financing of new CVs has been growing rapidly in the recent years owing to increasing penetration of organized financiers and attractive financing terms. Compared to ~70% of new CVs being financed three years ago, it is estimated that more than 90% of new CV purchases are currently through the finance route. Lured by the potential offered by this space, many private sector banks too have joined the fray. However, increasing competition has taken its toll on yields, which have declined significantly over the last few years.
��Strong growth in new CV sales The CV industry (M&HCV) has reported 30% CAGR over FY03-05 with demand looking up on the back of buoyant economic growth, good replacement demand and focus on development of the National Highway network. It is estimated that almost 90% of the new CVs are being purchased through the financing route with average LTV of 80-85%.
Exhibit 7:Trend in CV sales
Domestic CV Sales (LCV + M&HCV)
0
82,500
165,000
247,500
330,000
1993 1994 1995 1996 1997 1998 1999 2000 2001 2002 2003 2004 2005 Source: SIAM
CV industry growing wel l after a 5-year lull ove r
FY98-02; augurs well fo r CV financing industr y

�
MARCH 2006 8
SSKI INDIA
��Entry of new private sector banks – decline in lending yields Private sector banks such as ICICI Bank, HDFC Bank, Kotak Bank, and NBFCs such as GE capital and Citicorp Finance are quite aggressive in the new CV financing business. However, given their low cost of funds, banks are in a better position to offer loans at a substantially lower cost vis-à-vis NBFCs, which used to be the traditional CV financiers not so long ago. In line with an overall decline in interest rates and also due to aggressive competition, yields in CV financing have come down substantially. For new trucks, yields – that used to be as high as 18% in 1999-00 – have come down to 7.5-8.0% (including subventions) in FY04-05.
Exhibit 8:Yields in new CV financing have been declining
Yield
5
10
15
20
(%)
2000 2001 2002 2003 2004 2005 Source: SSKI Research
��Loan terms more flexible with higher LTV and longer tenures Price of a truck/ bus involves two components – price of chassis and that of the body. While LTV – i.e. amount of ex-show room price financed – for new CVs used to be 65-67% earlier, average LTV (including cost of body for HCVs) has gone up to 85% owing to increasing competition among banks and NBFCs. Currently, almost 100% of the chassis and a small portion of the body value are financed.
Escalating competition among financiers is also being manifested in loan tenures. Majority of loans are typically disbursed for three years as fleet owners – especially larger ones – tend to replace their vehicles within 3-5 years of purchase and prefer to have an unencumbered fleet within three years. However, some financiers have now started disbursing loans for longer tenures (up to five years), which effectively reduces the EMI amount and makes the vehicle more affordable.
��Cyclicality in CV sales leads to higher volatility in asset quality New CV sales are highly cyclical and have a strong correlation with GDP growth. Trucking industry has gone through cycles of unmet demand and overcapacity, leading to two-way movements in freight rates. Since economics of truck operators are directly linked to freight rate realizations, their profitability declines when the industry is passing through a lean phase, which leads to higher default rates for CV financiers.
With banks usurping th e monopoly of NBFCs in C V
financing, yields on th e same have decline d
significantl y
Increasing competitio n driving a rise in LTVs a s
also loan tenure s
Default rates in C V financing closely linked t o
overall CV cycl e

�
MARCH 2006 9
SSKI INDIA
��New CV financing – opportunity and market share The new commercial vehicle finance market is estimated at Rs186bn (M&HCV: Rs136bn and LCV: Rs50bn) for FY05-06.
Exhibit 9: Estimated size of new CV financing market
M&HCV LCV Volume sales (‘000 units) 211.9 131.9
Average selling price incl cost of body (Rs m) 1.0 0.6
Total sales (Rs bn) 211.9 79.1
% vehicles financed 80 80
Average LTV (%) 80 80
Total financing market (Rs bn) 135.6 50.6 Source: SSKI Research
The CV financing market, till 4-5 years ago, was dominated by NBFCs such as Cholamandalam Finance, Sundaram Finance, Tata Finance and Ashok Leyland Finance. However, with the entry of new generation private sector banks in this segment, market share composition has changed considerably. Currently, ICICI Bank and HDFC Bank control almost 37% of the total market.
Exhibit 10:Indicative market share in new CV financing
ICICI Bank27%
Kotak Mahindra Bank3%
Citibank16%HDFC Bank
9%
Indusind Bank11%
UTI Bank5%
Tata Finance14%
Sundaram Finance10%
Cholamandalam Finance
4%
Others1%
Source: SSKI Research
Competitive landscap e dominated by new privat e
sector bank s

�
MARCH 2006 10
SSKI INDIA
PRE-OWNED TRUCKS FINANCING: TOUGH BUT PROFITABLE BUSINESS Although new truck financing has become quite competitive and yields have dropped significantly, old/ pre-owned truck financing continues to be a lucrative business. Headline yields are still in the region of 20-22% and penetration of organized financiers remains low. The “perceived” high risk associated with pre-owned truck financing, a relatively lower ticket size and underdeveloped banking habits of borrowers in this segment are some of the factors that have kept commercial banks at bay.
��Market dynamics – quite different from new truck market Market dynamics of new and pre-owned trucks are quite different in terms of usage, haulage distances and borrower profile.
Exhibit 11: Dynamics of transport operators – new v/s pre-owned trucks
Long hauls Medium hauls Short hauls Movement Inter-state Intra state Intra-city / In-out from a city
Age of trucks 0-4 years 4-8 years 8-15 years
Type of operators Primarily large fleet owners Primarily small fleet owners Dominated by small operators
Borrower profile Financially savvy. Negotiates financial awareness but not starved for credit. Typically first time
hard on interest rates savvy. Moderate borrowers. Not in the position to
negotiating power negotiate
Economics Freight earnings marginally Freight earnings less and operating Operating costs very high but EMI
exceed EMI and operating costs costs higher than new trucks becomes quite small, as leverage is
(Maintenance and diesel). However, EMI much lower due to much lower
EMI much higher lower absolute value as
well as lower LTV Source: SSKI Research
��Fragmented ownership leads to resistance in modernization The average age of trucks is about 10 years in India, which is quite high compared to developed countries. Truck ownership is fragmented in the domestic market with 77% operators owning only up to five trucks, which leads to undercutting freight rates on smaller routes. This, in turn, reduces the incentive to go for purchase of new trucks, as funding cost of a new truck would be quite high compared to that of an old truck.
��Modernization of trucking industry – key growth driver Heightened environmental activism is leading to implementation of advanced emission control norms. Last year, the government notified implementation of Bharat III emission norms (equivalent of Euro III norms) in 11 major cities. Bharat III norms are likely to be implemented in rest of the country over 2008-10. Stricter emission control norms would mean that trucks more than 15 years old or so would be banned from entering cities where such norms are in place. As owners of trucks more than 10 years old upgrade to newer trucks, it would generate huge demand for 4-10 years old trucks.
Small operators prefer ol d trucks to new ones a s
rampant undercutting o n freight rates restrict s
profitabilit y
As stricter emission norm s are implemented i n
phases, we foresee hug e demand for 4-10 year ol d
truck s
�
MARCH 2006 11
SSKI INDIA
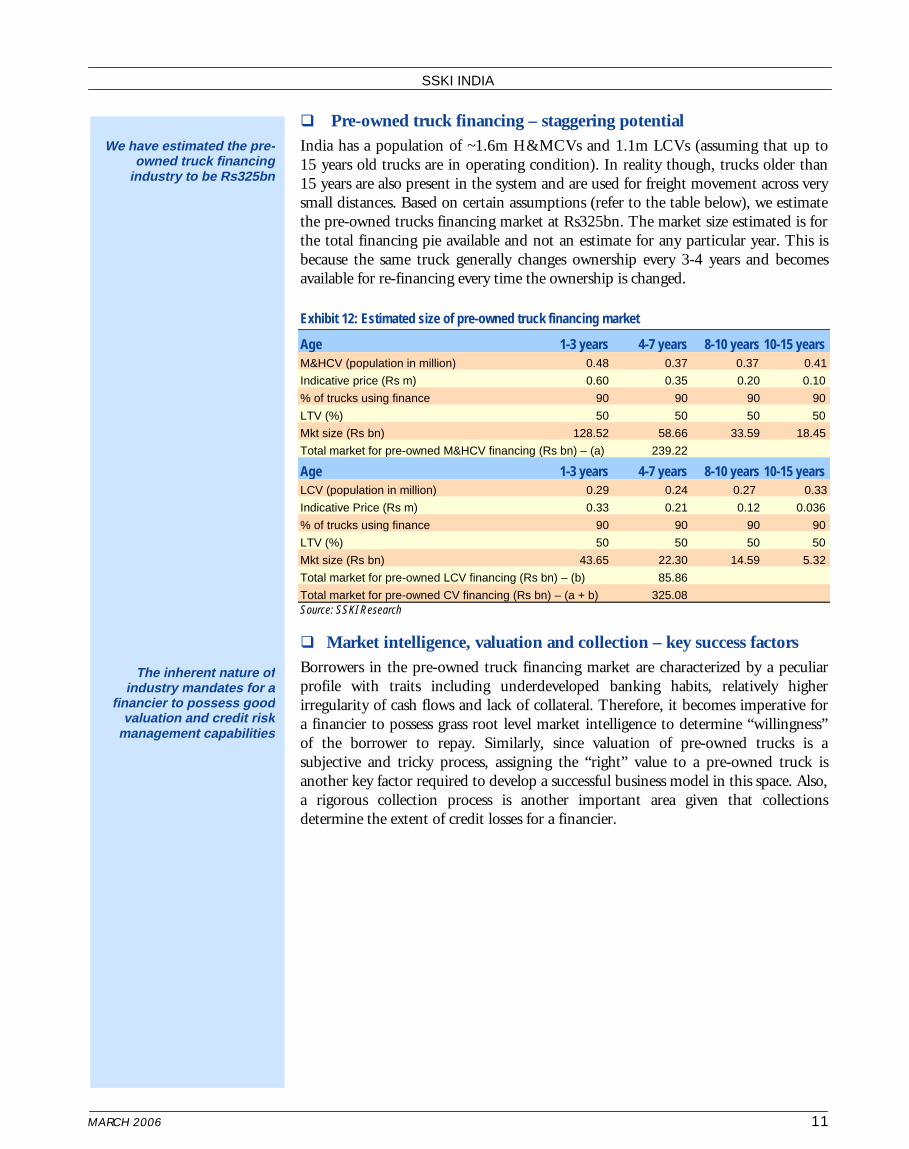
�� Pre-owned truck financing – staggering potential India has a population of ~1.6m H&MCVs and 1.1m LCVs (assuming that up to 15 years old trucks are in operating condition). In reality though, trucks older than 15 years are also present in the system and are used for freight movement across very small distances. Based on certain assumptions (refer to the table below), we estimate the pre-owned trucks financing market at Rs325bn. The market size estimated is for the total financing pie available and not an estimate for any particular year. This is because the same truck generally changes ownership every 3-4 years and becomes available for re-financing every time the ownership is changed.
Exhibit 12: Estimated size of pre-owned truck financing market
Age 1-3 years 4-7 years 8-10 years 10-15 years M&HCV (population in million) 0.48 0.37 0.37 0.41
Indicative price (Rs m) 0.60 0.35 0.20 0.10
% of trucks using finance 90 90 90 90
LTV (%) 50 50 50 50
Mkt size (Rs bn) 128.52 58.66 33.59 18.45
Total market for pre-owned M&HCV financing (Rs bn) – (a) 239.22
Age 1-3 years 4-7 years 8-10 years 10-15 years LCV (population in million) 0.29 0.24 0.27 0.33
Indicative Price (Rs m) 0.33 0.21 0.12 0.036
% of trucks using finance 90 90 90 90
LTV (%) 50 50 50 50
Mkt size (Rs bn) 43.65 22.30 14.59 5.32
Total market for pre-owned LCV financing (Rs bn) – (b) 85.86
Total market for pre-owned CV financing (Rs bn) – (a + b) 325.08 Source: SSKI Research
��Market intelligence, valuation and collection – key success factors Borrowers in the pre-owned truck financing market are characterized by a peculiar profile with traits including underdeveloped banking habits, relatively higher irregularity of cash flows and lack of collateral. Therefore, it becomes imperative for a financier to possess grass root level market intelligence to determine “willingness” of the borrower to repay. Similarly, since valuation of pre-owned trucks is a subjective and tricky process, assigning the “right” value to a pre-owned truck is another key factor required to develop a successful business model in this space. Also, a rigorous collection process is another important area given that collections determine the extent of credit losses for a financier.
We have estimated the pre -owned truck financin g
industry to be Rs325b n
The inherent nature o f industry mandates for a
financier to possess goo d valuation and credit ris k
management capabilitie s
�
MARCH 2006 12
SSKI INDIA
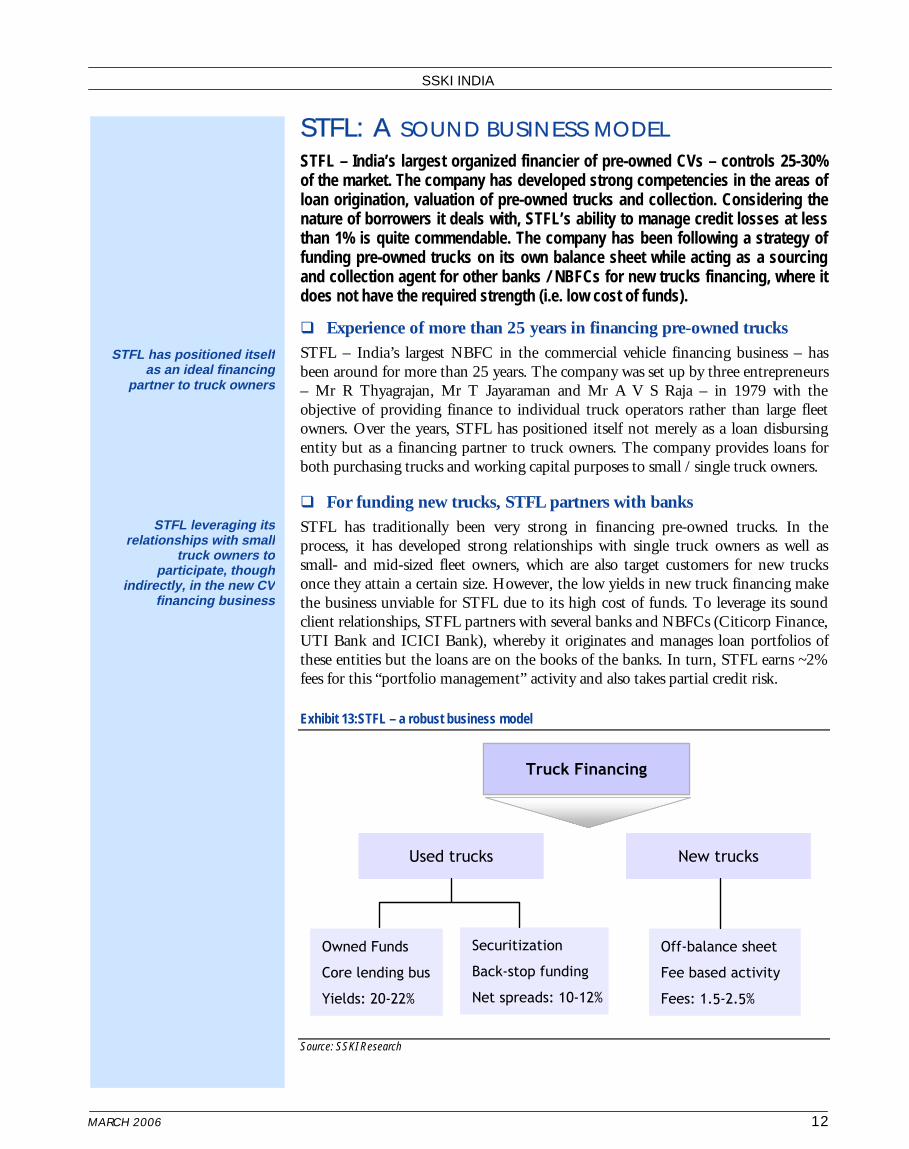
STFL: A SOUND BUSINESS MODEL STFL – India’s largest organized financier of pre-owned CVs – controls 25-30% of the market. The company has developed strong competencies in the areas of loan origination, valuation of pre-owned trucks and collection. Considering the nature of borrowers it deals with, STFL’s ability to manage credit losses at less than 1% is quite commendable. The company has been following a strategy of funding pre-owned trucks on its own balance sheet while acting as a sourcing and collection agent for other banks / NBFCs for new trucks financing, where it does not have the required strength (i.e. low cost of funds).
��Experience of more than 25 years in financing pre-owned trucks STFL – India’s largest NBFC in the commercial vehicle financing business – has been around for more than 25 years. The company was set up by three entrepreneurs – Mr R Thyagrajan, Mr T Jayaraman and Mr A V S Raja – in 1979 with the objective of providing finance to individual truck operators rather than large fleet owners. Over the years, STFL has positioned itself not merely as a loan disbursing entity but as a financing partner to truck owners. The company provides loans for both purchasing trucks and working capital purposes to small / single truck owners.
��For funding new trucks, STFL partners with banks STFL has traditionally been very strong in financing pre-owned trucks. In the process, it has developed strong relationships with single truck owners as well as small- and mid-sized fleet owners, which are also target customers for new trucks once they attain a certain size. However, the low yields in new truck financing make the business unviable for STFL due to its high cost of funds. To leverage its sound client relationships, STFL partners with several banks and NBFCs (Citicorp Finance, UTI Bank and ICICI Bank), whereby it originates and manages loan portfolios of these entities but the loans are on the books of the banks. In turn, STFL earns ~2% fees for this “portfolio management” activity and also takes partial credit risk.
Exhibit 13:STFL – a robust business model
Source: SSKI Research
7UXFN�)LQDQFLQJ
8VHG�WUXFNV 1HZ�WUXFNV
2ZQHG�)XQGV
&RUH�OHQGLQJ�EXV
<LHOGV��������
2II�EDODQFH�VKHHW
)HH�EDVHG�DFWLYLW\
)HHV����������
6HFXULWL]DWLRQ
%DFN�VWRS�IXQGLQJ
1HW�VSUHDGV���������
7UXFN�)LQDQFLQJ
8VHG�WUXFNV 1HZ�WUXFNV
2ZQHG�)XQGV
&RUH�OHQGLQJ�EXV
<LHOGV��������
2II�EDODQFH�VKHHW
)HH�EDVHG�DFWLYLW\
)HHV����������
6HFXULWL]DWLRQ
%DFN�VWRS�IXQGLQJ
1HW�VSUHDGV���������
STFL has positioned itsel f as an ideal financin g
partner to truck owner s
STFL leveraging it s relationships with smal l
truck owners t o participate, thoug h
indirectly, in the new C V financing busines s
�
MARCH 2006 13
SSKI INDIA
��STFL – erecting strong entry barriers In a business with seemingly low entry barriers, STFL has managed to scale up operations over the years. In the process, it has also built substantial entry barriers for any new corporate entity looking to enter pre-owned truck financing business. These entry barriers are more in the nature of relationships and competencies developed within the organization rather than any physical aspects.
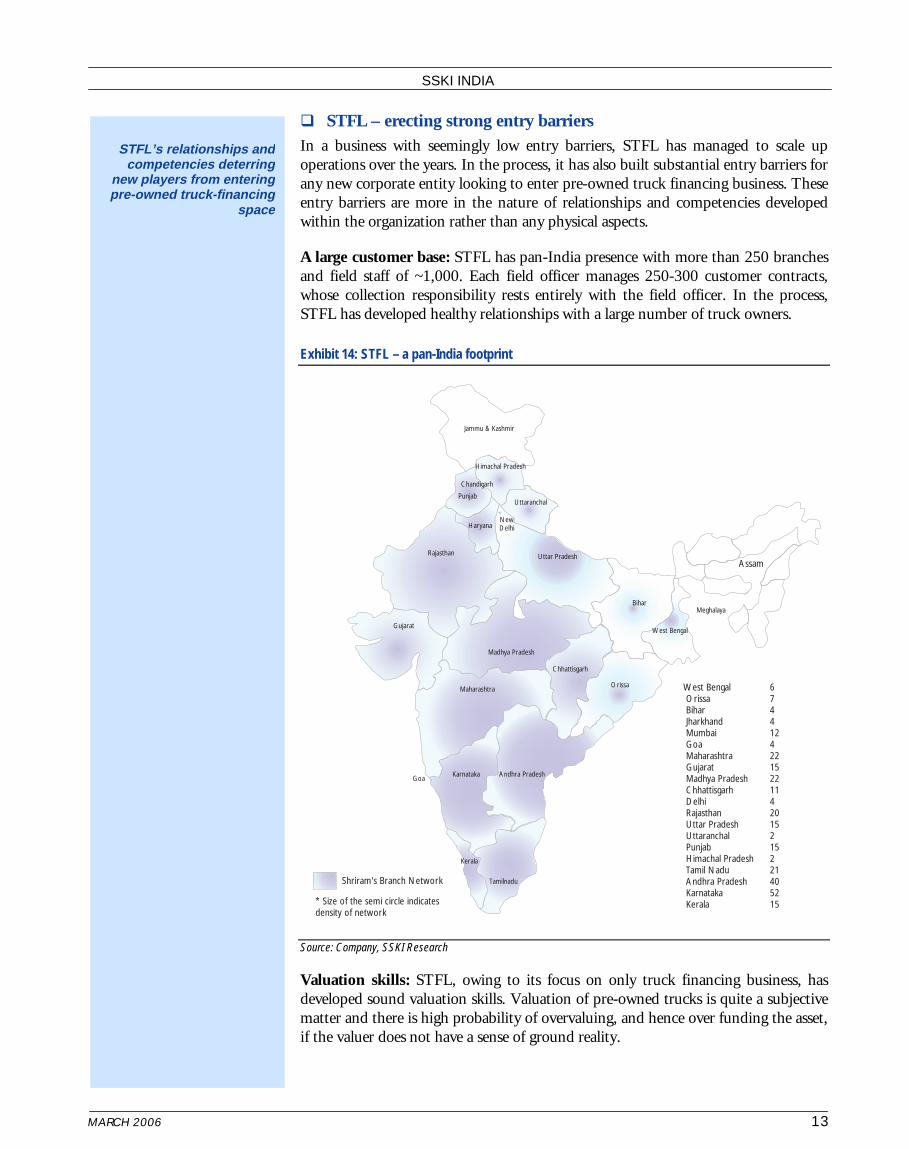
A large customer base: STFL has pan-India presence with more than 250 branches and field staff of ~1,000. Each field officer manages 250-300 customer contracts, whose collection responsibility rests entirely with the field officer. In the process, STFL has developed healthy relationships with a large number of truck owners.
Exhibit 14: STFL – a pan-India footprint
Source: Company, SSKI Research
Valuation skills: STFL, owing to its focus on only truck financing business, has developed sound valuation skills. Valuation of pre-owned trucks is quite a subjective matter and there is high probability of overvaluing, and hence over funding the asset, if the valuer does not have a sense of ground reality.
STFL’s relationships an d competencies deterrin g
new players from enterin g pre-owned truck-financin g
spac e
Gujarat
Madhya Pradesh
Orissa
West Bengal
Meghalaya
Uttar Pradesh
West Bengal 6Orissa 7Bihar 4Jharkhand 4Mumbai 12Goa 4Maharashtra 22Gujarat 15Madhya Pradesh 22Chhattisgarh 11Delhi 4Rajasthan 20Uttar Pradesh 15Uttaranchal 2Punjab 15Himachal Pradesh 2Tamil Nadu 21Andhra Pradesh 40Karnataka 52Kerala 15
Bihar
Himachal Pradesh
Rajasthan
Jammu & Kashmir
* Size of the semi circle indicatesdensity of network
Shriram's Branch Network
Assam
Andhra PradeshKarnataka
Tamilnadu
Kerala
Maharashtra
Punjab
Chandigarh
Haryana
Goa
Uttaranchal
NewDelhi
Chhattisgarh
�
MARCH 2006 14
SSKI INDIA
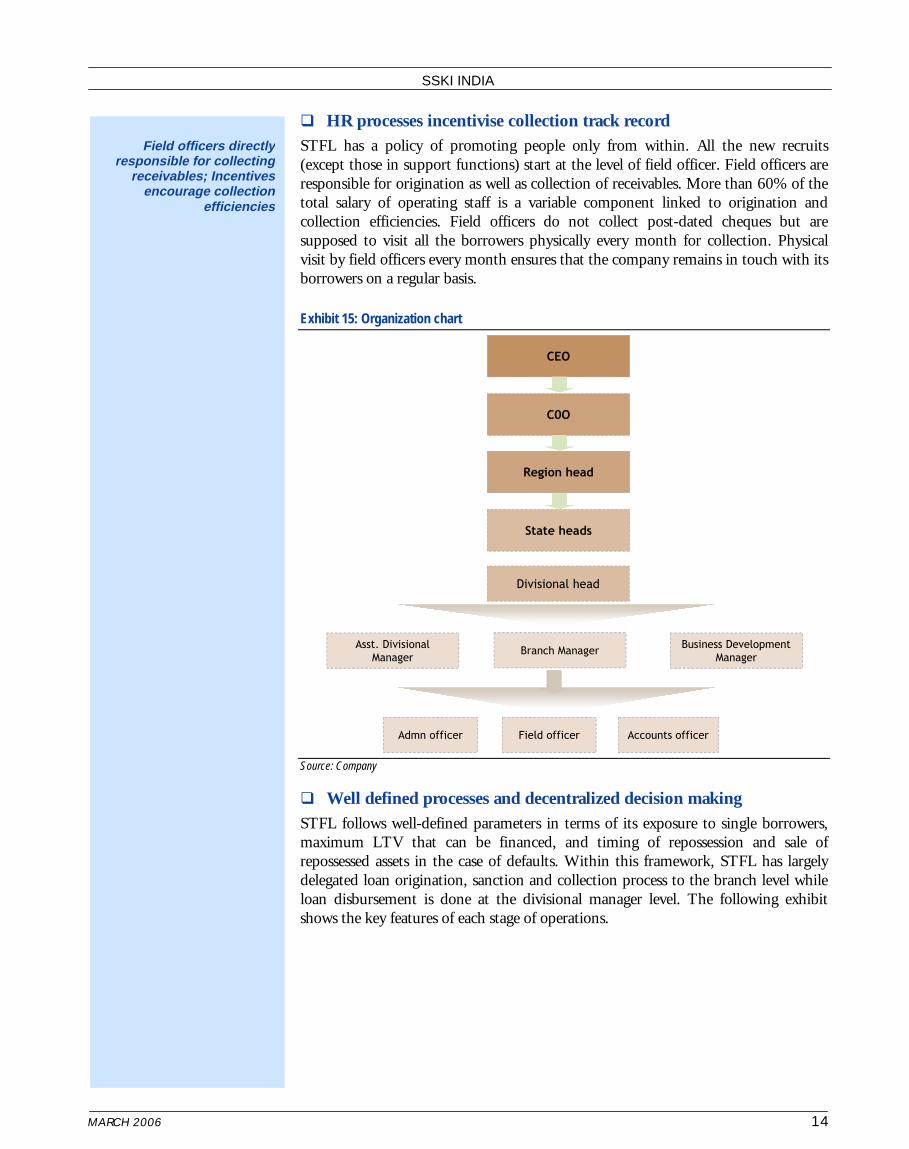
��HR processes incentivise collection track record STFL has a policy of promoting people only from within. All the new recruits (except those in support functions) start at the level of field officer. Field officers are responsible for origination as well as collection of receivables. More than 60% of the total salary of operating staff is a variable component linked to origination and collection efficiencies. Field officers do not collect post-dated cheques but are supposed to visit all the borrowers physically every month for collection. Physical visit by field officers every month ensures that the company remains in touch with its borrowers on a regular basis.
Exhibit 15: Organization chart
Source: Company
��Well defined processes and decentralized decision making STFL follows well-defined parameters in terms of its exposure to single borrowers, maximum LTV that can be financed, and timing of repossession and sale of repossessed assets in the case of defaults. Within this framework, STFL has largely delegated loan origination, sanction and collection process to the branch level while loan disbursement is done at the divisional manager level. The following exhibit shows the key features of each stage of operations.
Field officers directl y responsible for collectin g
receivables; Incentive s encourage collectio n
efficiencie s
&�2
5HJLRQ�KHDG
6WDWH�KHDGV
'LYLVLRQDO�KHDG
%UDQFK�0DQDJHU$VVW��'LYLVLRQDO�
0DQDJHU
%XVLQHVV�'HYHORSPHQW�
0DQDJHU
)LHOG�RIILFHU$GPQ RIILFHU $FFRXQWV�RIILFHU
&(2
&�2
5HJLRQ�KHDG
6WDWH�KHDGV
'LYLVLRQDO�KHDG
%UDQFK�0DQDJHU$VVW��'LYLVLRQDO�
0DQDJHU
%XVLQHVV�'HYHORSPHQW�
0DQDJHU
)LHOG�RIILFHU$GPQ RIILFHU $FFRXQWV�RIILFHU
&(2

�
MARCH 2006 15
SSKI INDIA
Exhibit 16: Stages in CV financing activity
Source: Company, SSKI Research
��Multiple growth levers exist STFL has achieved 62% CAGR in disbursements over FY02-05. Such high growth has been made possible by extending its branch network, eating into share of traditional moneylenders and partnering with commercial banks to access relatively cheaper funding.
Exhibit 17: Growth in disbursements
0
22,500
45,000
67,500
90,000
Disbursements (Rs m)
2002 2003 2004 2005 2006E 2007E 2008E Source: SSKI Research
CAGR 62%
/RDQ�RULJLQDWLRQ /RDQ�6DQFWLRQLQJ /RDQ�UHFRYHU\
� &XVWRPHU�SURILOH��6PDOO�
URDG�WUDQVSRUW�RSHUDWRU��
ILUVW�WLPH�ERUURZHU
� 1HHG�IRU�ORDQ��SXUFKDVH�RI�
DVVHW�RU�ZRUNLQJ�FDSLWDO
� 7UXFN�VHOHFWLRQ�FULWHULD��$OO�
OHDGLQJ�EUDQGV��$JH�QRW�
H[FHHGLQJ����\HDUV
� �������/79�DQG�PD[����
PRQWKV�WHQXUH
� 6LQJOH�ERUURZHU�H[SRVXUH�
FDSSHG�DW�5V���P�IRU 6572V
� 3UH�GLVEXUVHPHQW�FKHFNV��
SK\VLFDO�LQVSHFWLRQ�RI�
WUXFN��GRFXPHQW�
YHULILFDWLRQ
� 9DOXDWLRQ�DQG�ORDQ�DPRXQW�
GHWHUPLQDWLRQ�E\�EUDQFK�
PDQDJHU
� 6HQW�WR�GLYLVLRQDO�PDQDJHU�
IRU�GLVEXUVHPHQW
� 1R 3'&V FROOHFWHG�
� 5HFRYHU\�UHVSRQVLELOLW\�RI�
ILHOG�RIILFHU�DQG�EUDQFK�
PDQDJHU
� 5HSRVVHVVLRQ�SURFHVV�
EHJLQV��LI�GHIDXOW�IRU�PRUH�
WKDQ���PRQWKV
� 5HSRVVHVVHG�WUXFNV�UHOHDVHG�
RQ�UHFHLSW�RI�RYHUGXH�RU�
VROG�RII�DV�VRRQ�DV�SRVVLEOH�
� (YHQWXDO�ORVVHV�PDQDJHG�DW�
OHVV�WKDQ�����
Extending branch networ k and partnering wit h
commercial banks t o access relatively cheape r
funding drivin g disbursement s
CAGR 41%
�
MARCH 2006 16
SSKI INDIA
Going forward, STFL has identified the following growth drivers for pre-owned as well as new truck financing business.
• In the portfolio management scheme, STFL is acting as an originator for banks. The company wants to adopt a similar strategy going forward, albeit at the other side of the value chain. It plans to enter into franchise arrangements with local moneylenders, whereby the latter would source and collect on behalf of STFL while the loan will be booked on STFL’s balance sheet.
• As of now, STFL restricts itself to financing up to 10-year-old trucks. However, it plans to increase the financing age up to 12-year old vehicles, which would expand its addressable population by 0.35m-0.40m trucks.
• Majority of STFL’s business is concentrated on single axle truck financing. Going forward, it plans to enter funding of multi axle trucks and passenger commercial vehicles (buses).
• In the new truck financing business, STFL will continue to confine itself to sourcing and collection. It would stick to the strategy of partnering with commercial banks for funding new trucks and earn a 2% management fee while taking partial credit risk.
Entry into multi-axle truck s financing and tie-ups wit h traditional moneylender s
to act as growth driver s
�
MARCH 2006 17
SSKI INDIA
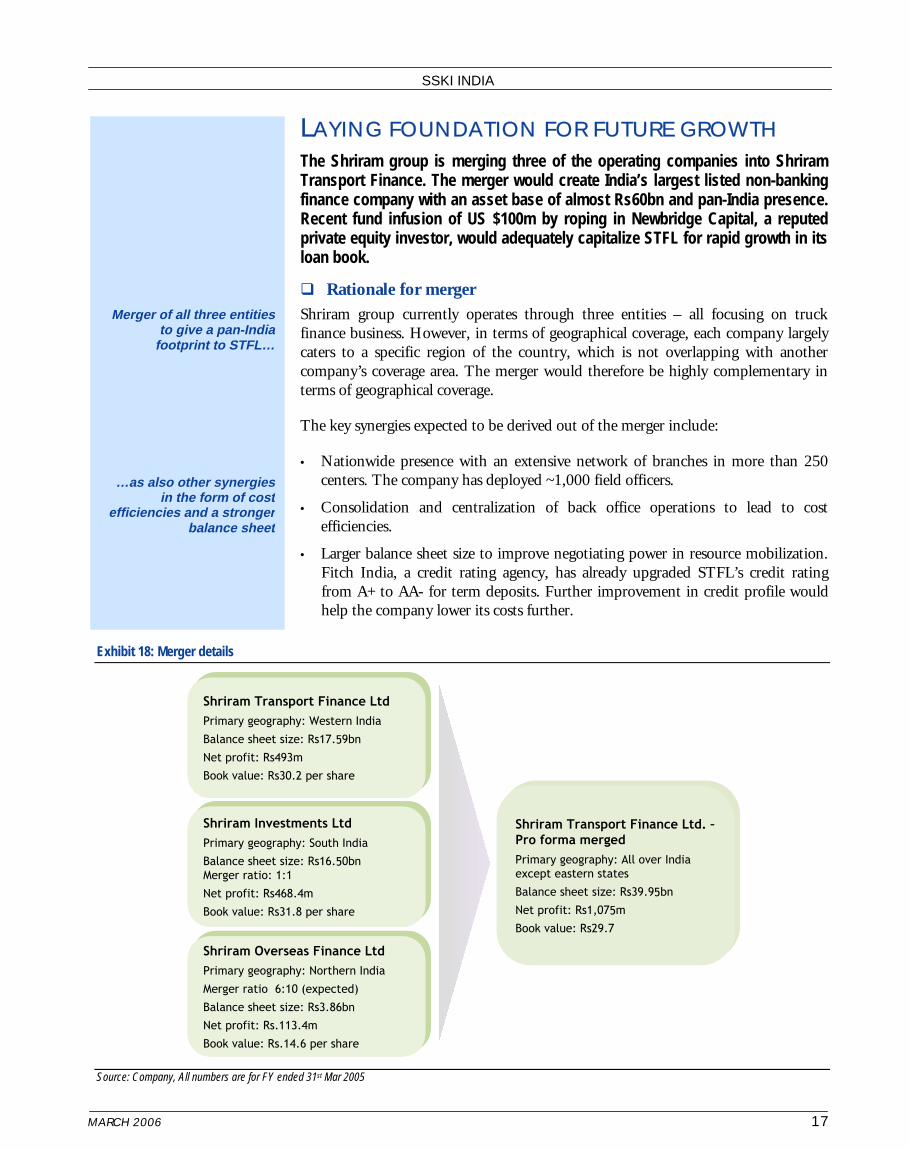
LAYING FOUNDATION FOR FUTURE GROWTH The Shriram group is merging three of the operating companies into Shriram Transport Finance. The merger would create India’s largest listed non-banking finance company with an asset base of almost Rs60bn and pan-India presence. Recent fund infusion of US $100m by roping in Newbridge Capital, a reputed private equity investor, would adequately capitalize STFL for rapid growth in its loan book.
��Rationale for merger Shriram group currently operates through three entities – all focusing on truck finance business. However, in terms of geographical coverage, each company largely caters to a specific region of the country, which is not overlapping with another company’s coverage area. The merger would therefore be highly complementary in terms of geographical coverage.
The key synergies expected to be derived out of the merger include:
• Nationwide presence with an extensive network of branches in more than 250 centers. The company has deployed ~1,000 field officers.
• Consolidation and centralization of back office operations to lead to cost efficiencies.
• Larger balance sheet size to improve negotiating power in resource mobilization. Fitch India, a credit rating agency, has already upgraded STFL’s credit rating from A+ to AA- for term deposits. Further improvement in credit profile would help the company lower its costs further.
Exhibit 18: Merger details
Source: Company, All numbers are for FY ended 31st Mar 2005
6KULUDP 7UDQVSRUW�)LQDQFH�/WG
3ULPDU\�JHRJUDSK\��:HVWHUQ�,QGLD
%DODQFH�VKHHW�VL]H��5V�����EQ
1HW�SURILW��5V���P
%RRN�YDOXH��5V�����SHU�VKDUH
6KULUDP 7UDQVSRUW�)LQDQFH�/WG
3ULPDU\�JHRJUDSK\��:HVWHUQ�,QGLD
%DODQFH�VKHHW�VL]H��5V�����EQ
1HW�SURILW��5V���P
%RRN�YDOXH��5V�����SHU�VKDUH
6KULUDP ,QYHVWPHQWV�/WG
3ULPDU\�JHRJUDSK\��6RXWK�,QGLD
%DODQFH�VKHHW�VL]H��5V�����EQ��������������
0HUJHU�UDWLR�����
1HW�SURILW��5V�����P
%RRN�YDOXH��5V�����SHU�VKDUH
6KULUDP ,QYHVWPHQWV�/WG
3ULPDU\�JHRJUDSK\��6RXWK�,QGLD
%DODQFH�VKHHW�VL]H��5V�����EQ��������������
0HUJHU�UDWLR�����
1HW�SURILW��5V�����P
%RRN�YDOXH��5V�����SHU�VKDUH
6KULUDP 2YHUVHDV�)LQDQFH�/WG
3ULPDU\�JHRJUDSK\��1RUWKHUQ�,QGLD
0HUJHU�UDWLR��������H[SHFWHG�
%DODQFH�VKHHW�VL]H��5V����EQ
1HW�SURILW��5V������P
%RRN�YDOXH��5V������SHU�VKDUH
6KULUDP 2YHUVHDV�)LQDQFH�/WG
3ULPDU\�JHRJUDSK\��1RUWKHUQ�,QGLD
0HUJHU�UDWLR��������H[SHFWHG�
%DODQFH�VKHHW�VL]H��5V����EQ
1HW�SURILW��5V������P
%RRN�YDOXH��5V������SHU�VKDUH
6KULUDP 7UDQVSRUW�)LQDQFH�/WG��²
3UR�IRUPD�PHUJHG
3ULPDU\�JHRJUDSK\��$OO�RYHU�,QGLD�
H[FHSW�HDVWHUQ�VWDWHV
%DODQFH�VKHHW�VL]H��5V�����EQ
1HW�SURILW��5V�����P
%RRN�YDOXH��5V����
6KULUDP 7UDQVSRUW�)LQDQFH�/WG��²
3UR�IRUPD�PHUJHG
3ULPDU\�JHRJUDSK\��$OO�RYHU�,QGLD�
H[FHSW�HDVWHUQ�VWDWHV
%DODQFH�VKHHW�VL]H��5V�����EQ
1HW�SURILW��5V�����P
%RRN�YDOXH��5V����
6KULUDP 7UDQVSRUW�)LQDQFH�/WG
3ULPDU\�JHRJUDSK\��:HVWHUQ�,QGLD
%DODQFH�VKHHW�VL]H��5V�����EQ
1HW�SURILW��5V���P
%RRN�YDOXH��5V�����SHU�VKDUH
6KULUDP 7UDQVSRUW�)LQDQFH�/WG
3ULPDU\�JHRJUDSK\��:HVWHUQ�,QGLD
%DODQFH�VKHHW�VL]H��5V�����EQ
1HW�SURILW��5V���P
%RRN�YDOXH��5V�����SHU�VKDUH
6KULUDP ,QYHVWPHQWV�/WG
3ULPDU\�JHRJUDSK\��6RXWK�,QGLD
%DODQFH�VKHHW�VL]H��5V�����EQ��������������
0HUJHU�UDWLR�����
1HW�SURILW��5V�����P
%RRN�YDOXH��5V�����SHU�VKDUH
6KULUDP ,QYHVWPHQWV�/WG
3ULPDU\�JHRJUDSK\��6RXWK�,QGLD
%DODQFH�VKHHW�VL]H��5V�����EQ��������������
0HUJHU�UDWLR�����
1HW�SURILW��5V�����P
%RRN�YDOXH��5V�����SHU�VKDUH
6KULUDP 2YHUVHDV�)LQDQFH�/WG
3ULPDU\�JHRJUDSK\��1RUWKHUQ�,QGLD
0HUJHU�UDWLR��������H[SHFWHG�
%DODQFH�VKHHW�VL]H��5V����EQ
1HW�SURILW��5V������P
%RRN�YDOXH��5V������SHU�VKDUH
6KULUDP 2YHUVHDV�)LQDQFH�/WG
3ULPDU\�JHRJUDSK\��1RUWKHUQ�,QGLD
0HUJHU�UDWLR��������H[SHFWHG�
%DODQFH�VKHHW�VL]H��5V����EQ
1HW�SURILW��5V������P
%RRN�YDOXH��5V������SHU�VKDUH
6KULUDP 7UDQVSRUW�)LQDQFH�/WG��²
3UR�IRUPD�PHUJHG
3ULPDU\�JHRJUDSK\��$OO�RYHU�,QGLD�
H[FHSW�HDVWHUQ�VWDWHV
%DODQFH�VKHHW�VL]H��5V�����EQ
1HW�SURILW��5V�����P
%RRN�YDOXH��5V����
6KULUDP 7UDQVSRUW�)LQDQFH�/WG��²
3UR�IRUPD�PHUJHG
3ULPDU\�JHRJUDSK\��$OO�RYHU�,QGLD�
H[FHSW�HDVWHUQ�VWDWHV
%DODQFH�VKHHW�VL]H��5V�����EQ
1HW�SURILW��5V�����P
%RRN�YDOXH��5V����
Merger of all three entitie s to give a pan-Indi a
footprint to STFL…
…as also other synergie s in the form of cos t
efficiencies and a stronge r balance shee t
�
MARCH 2006 18
SSKI INDIA
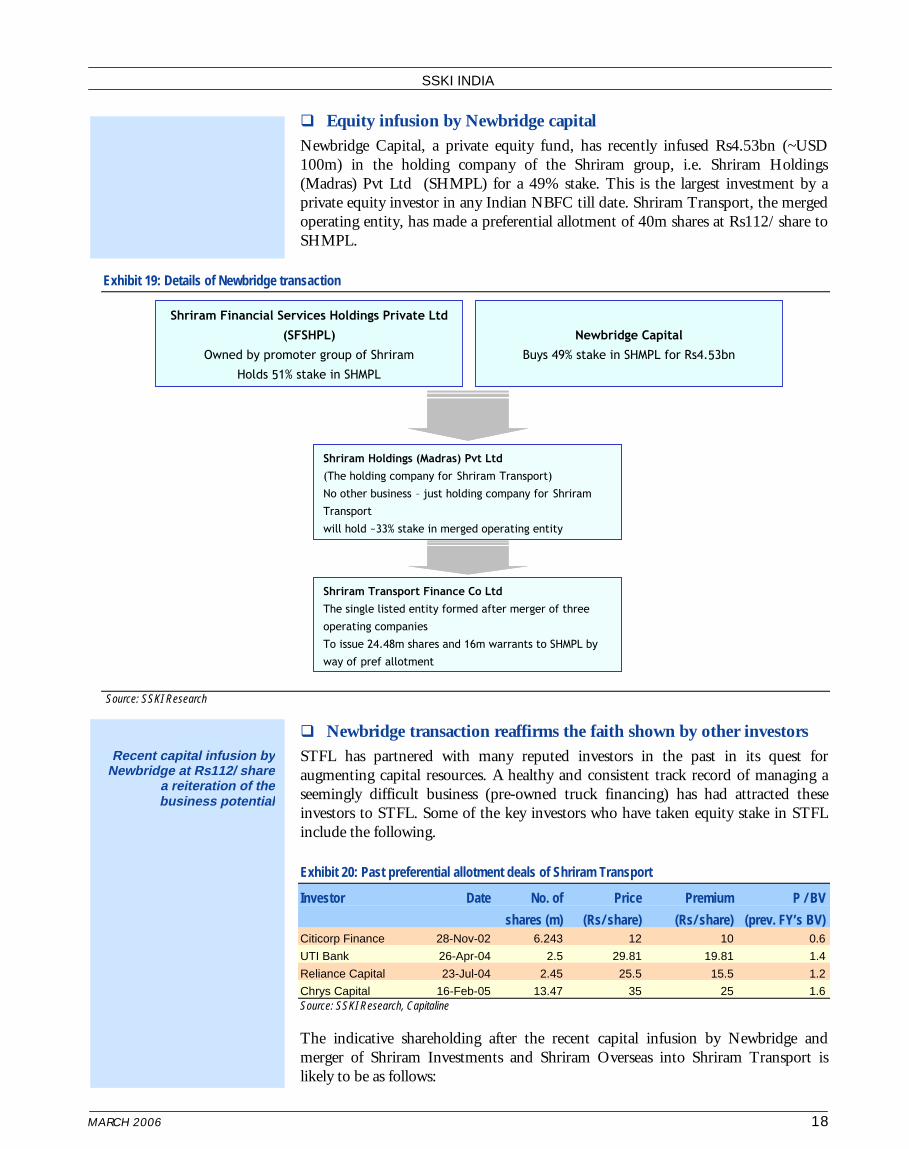
��Equity infusion by Newbridge capital Newbridge Capital, a private equity fund, has recently infused Rs4.53bn (~USD 100m) in the holding company of the Shriram group, i.e. Shriram Holdings (Madras) Pvt Ltd (SHMPL) for a 49% stake. This is the largest investment by a private equity investor in any Indian NBFC till date. Shriram Transport, the merged operating entity, has made a preferential allotment of 40m shares at Rs112/ share to SHMPL.
Exhibit 19: Details of Newbridge transaction
Source: SSKI Research
��Newbridge transaction reaffirms the faith shown by other investors STFL has partnered with many reputed investors in the past in its quest for augmenting capital resources. A healthy and consistent track record of managing a seemingly difficult business (pre-owned truck financing) has had attracted these investors to STFL. Some of the key investors who have taken equity stake in STFL include the following.
Exhibit 20: Past preferential allotment deals of Shriram Transport
Investor Date No. of Price Premium P / BV
shares (m) (Rs/ share) (Rs/ share) (prev. FY’s BV) Citicorp Finance 28-Nov-02 6.243 12 10 0.6
UTI Bank 26-Apr-04 2.5 29.81 19.81 1.4
Reliance Capital 23-Jul-04 2.45 25.5 15.5 1.2
Chrys Capital 16-Feb-05 13.47 35 25 1.6 Source: SSKI Research, Capitaline
The indicative shareholding after the recent capital infusion by Newbridge and merger of Shriram Investments and Shriram Overseas into Shriram Transport is likely to be as follows:
6KULUDP )LQDQFLDO�6HUYLFHV�+ROGLQJV�3ULYDWH�/WG�
�6)6+3/��������
2ZQHG�E\�SURPRWHU�JURXS�RI 6KULUDP
+ROGV�����VWDNH�LQ�6+03/
1HZEULGJH &DSLWDO�
%X\V�����VWDNH�LQ�6+03/�IRU�5V����EQ
6KULUDP +ROGLQJV��0DGUDV� 3YW /WG�
�7KH�KROGLQJ�FRPSDQ\�IRU 6KULUDP 7UDQVSRUW�
1R�RWKHU�EXVLQHVV�² MXVW�KROGLQJ�FRPSDQ\�IRU 6KULUDP
7UDQVSRUW
ZLOO�KROG�a����VWDNH�LQ�PHUJHG�RSHUDWLQJ�HQWLW\
6KULUDP 7UDQVSRUW�)LQDQFH�&R�/WG
7KH�VLQJOH�OLVWHG�HQWLW\�IRUPHG�DIWHU�PHUJHU�RI�WKUHH�
RSHUDWLQJ�FRPSDQLHV
7R�LVVXH������P�VKDUHV�DQG���P�ZDUUDQWV�WR�6+03/�E\�
ZD\�RI SUHI DOORWPHQW
Recent capital infusion b y Newbridge at Rs112/ shar e
a reiteration of th e business potentia l
�
MARCH 2006 19
SSKI INDIA
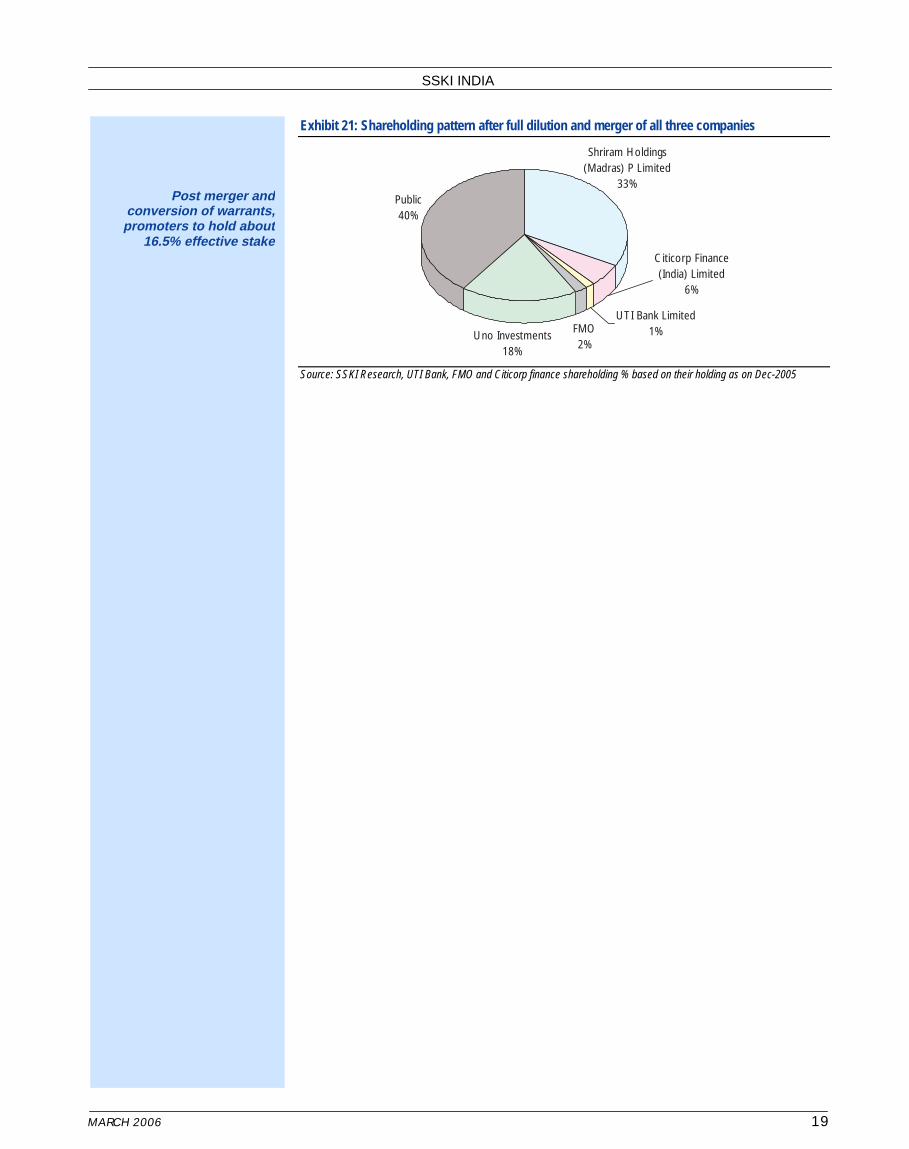
Exhibit 21: Shareholding pattern after full dilution and merger of all three companies
Shriram Holdings (Madras) P Limited
33%
Uno Investments18%
Public40%
FMO2%
UTI Bank Limited1%
Citicorp Finance (India) Limited
6%
Source: SSKI Research, UTI Bank, FMO and Citicorp finance shareholding % based on their holding as on Dec-2005
Post merger an d conversion of warrants, promoters to hold abou t
16.5% effective stak e

�
MARCH 2006 20
SSKI INDIA
FINANCIAL ANALYSIS STFL is likely to witness strong loan growth, which in turn would drive a 34% CAGR in its net interest income over FY05-08. Although cost of funds is likely to decline owing to a larger balance sheet and expected improvement in credit profile, we believe net interest margin would decline going forward (from 10.1% in FY06E to 8.8% in FY08E) as the company looks at aggressive volume growth and competition heats up in its traditional stronghold. However, net interest margin would still allow STFL to achieve average RoA of 2.6%. We expect net profit to increase at CAGR of 33.1% over FY05-08 with average RoE of 21.2%.
��Strong loan growth ahead Having merged the three operating companies and capitalized its balance sheet, STFL aims to achieve strong loan growth in its core business (pre-owned truck financing). We expect 50.6% CAGR in STFL’s loan book over FY05-08 while total managed assets are expected to increase at CAGR of 33.3%.
Exhibit 22: Loan book growth
0
30
60
90
120 Outstanding loan book (Rs bn)
2004 2005 2006E 2007E 2008E Source: Company, SSKI Research
��Composition of assets changing in favour of funded loans Till now, the composition of managed assets was more or less equally distributed between loan book and the off-balance sheet PMS portfolio. However, future growth would be driven mainly by loans on the balance sheet rather than PMS, as the company leverages the money raised through preferential allotment of shares to Newbridge Capital.
Exhibit 23: Changing composition of managed assets
Source: Annual report, SSKI Research
FY05
Loan book on the balance-
sheet55%
Off-balance sheet assets
45%
FY08E
Loan book on the balance-
sheet
Off-balance sheet assets
20%
Future growth to be drive n mainly by loans on balanc e
sheet rather than PMS, a s STFL leverages mone y
raised through preferentia l allotmen t
Managed asset s composition to shift i n favour of funded loan s

�
MARCH 2006 21
SSKI INDIA
��Expect 33.7% 3-year CAGR in net interest income Going forward, we expect STFL’s net interest income to increase at a CAGR of 33.7% over FY05-08 on the back of strong loan growth.
��Composition of funding likely to shift in favour of loans Traditionally, retail debentures have been the largest source of funding for STFL while fixed deposits form a small component of the overall funding. However, the funding pattern has been changing significantly in the past few years in favour of term loans as banks recognize STFL’s expertise in truck financing business.
Exhibit 24: Sources of funds
Source: Annual Report
��Improving credit profile to drive down cost of funds STFL’s long-term debenture programme and term deposits had been rated as A+ by Fitch India. However, with improving financials and regular capitalization of the balance sheet, the company’s rating has recently been upgraded to AA(-) for term deposits. Higher credit rating, along with a stronger balance sheet, would help STFL negotiate better rates with its lenders. With this, we expect STFL’s overall cost of funds to come down from 13.8% in FY05 to 10.9% in FY08.
Exhibit 25: Cost of funds – improving in sync with credit profile
Interest expense / avg borrowings (%)
10.0
12.0
14.0
16.0
18.0
2003 2004 2005 2006E 2007E 2008E Source: SSKI Research
FY02
Debentures90%
Term loans from banks /
FIs8%
Fixed deposits2%
FY05
Debentures65%
Term loans from banks /
FIs29%
Fixed deposits1%
Others5%
As banks recognize STFL’ s expertise in truck financin g
business, funding patter n changing in favour of ter m
loan s
With improving credi t profile, cost of funds t o
come down from 13.8% i n FY05 to 10.9% in FY0 8
�
MARCH 2006 22
SSKI INDIA
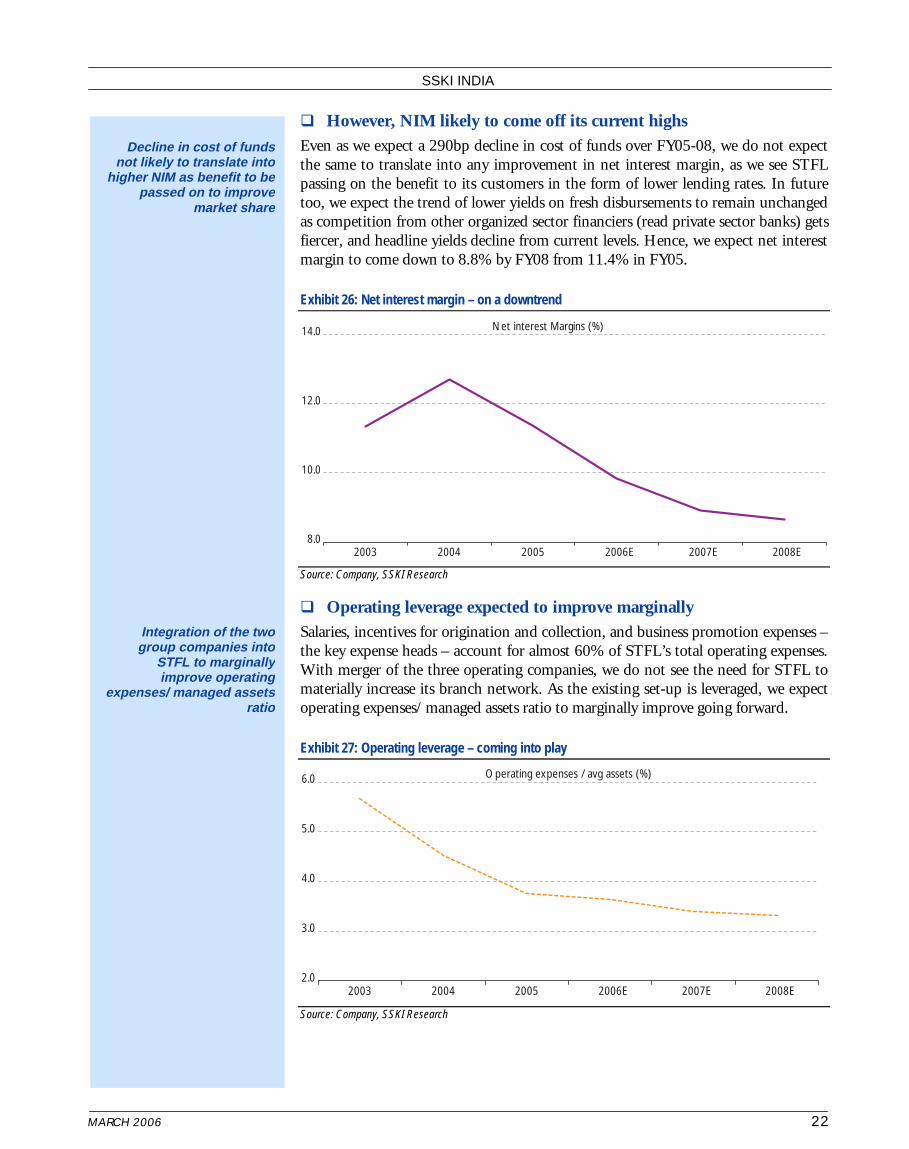
��However, NIM likely to come off its current highs Even as we expect a 290bp decline in cost of funds over FY05-08, we do not expect the same to translate into any improvement in net interest margin, as we see STFL passing on the benefit to its customers in the form of lower lending rates. In future too, we expect the trend of lower yields on fresh disbursements to remain unchanged as competition from other organized sector financiers (read private sector banks) gets fiercer, and headline yields decline from current levels. Hence, we expect net interest margin to come down to 8.8% by FY08 from 11.4% in FY05.
Exhibit 26: Net interest margin – on a downtrend
Net interest Margins (%)
8.0
10.0
12.0
14.0
2003 2004 2005 2006E 2007E 2008E Source: Company, SSKI Research
��Operating leverage expected to improve marginally Salaries, incentives for origination and collection, and business promotion expenses – the key expense heads – account for almost 60% of STFL’s total operating expenses. With merger of the three operating companies, we do not see the need for STFL to materially increase its branch network. As the existing set-up is leveraged, we expect operating expenses/ managed assets ratio to marginally improve going forward.
Exhibit 27: Operating leverage – coming into play
Operating expenses / avg assets (%)
2.0
3.0
4.0
5.0
6.0
2003 2004 2005 2006E 2007E 2008E Source: Company, SSKI Research
Decline in cost of fund s not likely to translate int o
higher NIM as benefit to b e passed on to improv e
market shar e
Integration of the tw o group companies int o
STFL to marginall y improve operatin g
expenses/ managed asset s rati o

�
MARCH 2006 23
SSKI INDIA
��..while provisioning likely to go up in line with assets STFL has managed to bring down its net NPAs to less than 1% by adopting an effective collection process and timely repossession of underlying assets pertaining to defaulting accounts. (As per prevalent regulatory guidelines, an NBFC is supposed to recognize non-performing asset after 180 days past the due date.) Going forward, we expect provisioning to remain at 1.5-1.7% of average loan book as loan growth remains robust.
��Expect strong net profit growth with healthy RoE We expect 33.1% CAGR in STFL’s net profit over FY05-08 and average RoE of 21.2%, driven by strong loan growth, improving operating leverage and healthy net interest margins. However, EPS growth is likely to be lower at 17% CAGR over FY06-08 because of equity dilution in FY06 by way of preferential allotment and expected conversion of warrants issued to Newbridge Capital in FY08.
Exhibit 28: Healthy growth in net profit and robust RoE
0
600
1,200
1,800
2,400
Mar-04 Mar-05 Mar-06E Mar-07E Mar-08E10
20
30
40
50Net profit (Rs m - LHS) RoE (% - RHS)
Source: Company, SSKI Research
Effective collectio n process and timel y
repossession of suspec t assets circumvents th e
need for additiona l provisionin g
Strong loan growth, improving operatin g
leverage and healthy NI M to drive net profit growt h
and keep RoE stable ove r coming year s
�
MARCH 2006 24
SSKI INDIA
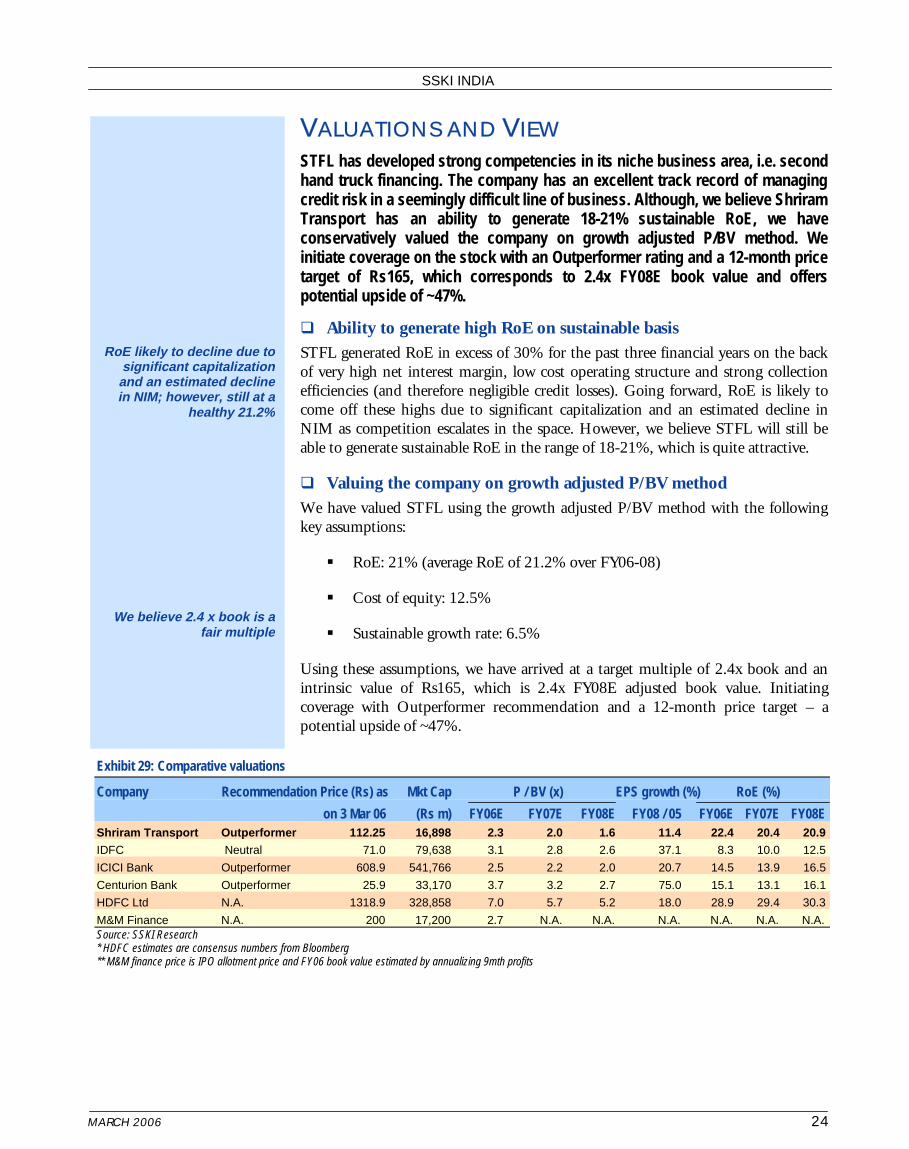
VALUATIONS AND VIEW STFL has developed strong competencies in its niche business area, i.e. second hand truck financing. The company has an excellent track record of managing credit risk in a seemingly difficult line of business. Although, we believe Shriram Transport has an ability to generate 18-21% sustainable RoE, we have conservatively valued the company on growth adjusted P/BV method. We initiate coverage on the stock with an Outperformer rating and a 12-month price target of Rs165, which corresponds to 2.4x FY08E book value and offers potential upside of ~47%.
��Ability to generate high RoE on sustainable basis STFL generated RoE in excess of 30% for the past three financial years on the back of very high net interest margin, low cost operating structure and strong collection efficiencies (and therefore negligible credit losses). Going forward, RoE is likely to come off these highs due to significant capitalization and an estimated decline in NIM as competition escalates in the space. However, we believe STFL will still be able to generate sustainable RoE in the range of 18-21%, which is quite attractive.
��Valuing the company on growth adjusted P/BV method We have valued STFL using the growth adjusted P/BV method with the following key assumptions:
��RoE: 21% (average RoE of 21.2% over FY06-08)
��Cost of equity: 12.5%
�� Sustainable growth rate: 6.5%
Using these assumptions, we have arrived at a target multiple of 2.4x book and an intrinsic value of Rs165, which is 2.4x FY08E adjusted book value. Initiating coverage with Outperformer recommendation and a 12-month price target – a potential upside of ~47%.
Exhibit 29: Comparative valuations
Company Recommendation Price (Rs) as Mkt Cap P / BV (x) EPS growth (%) RoE (%)
on 3 Mar 06 (Rs m) FY06E FY07E FY08E FY08 / 05 FY06E FY07E FY08E Shriram Transport Outperformer 112.25 16,898 2.3 2.0 1.6 11.4 22.4 20.4 20.9 IDFC Neutral 71.0 79,638 3.1 2.8 2.6 37.1 8.3 10.0 12.5
ICICI Bank Outperformer 608.9 541,766 2.5 2.2 2.0 20.7 14.5 13.9 16.5
Centurion Bank Outperformer 25.9 33,170 3.7 3.2 2.7 75.0 15.1 13.1 16.1
HDFC Ltd N.A. 1318.9 328,858 7.0 5.7 5.2 18.0 28.9 29.4 30.3
M&M Finance N.A. 200 17,200 2.7 N.A. N.A. N.A. N.A. N.A. N.A. Source: SSKI Research * HDFC estimates are consensus numbers from Bloomberg ** M&M finance price is IPO allotment price and FY06 book value estimated by annualizing 9mth profits
RoE likely to decline due t o significant capitalizatio n
and an estimated declin e in NIM; however, still at a
healthy 21.2 %
We believe 2.4 x book is a fair multipl e
�
MARCH 2006 25
SSKI INDIA
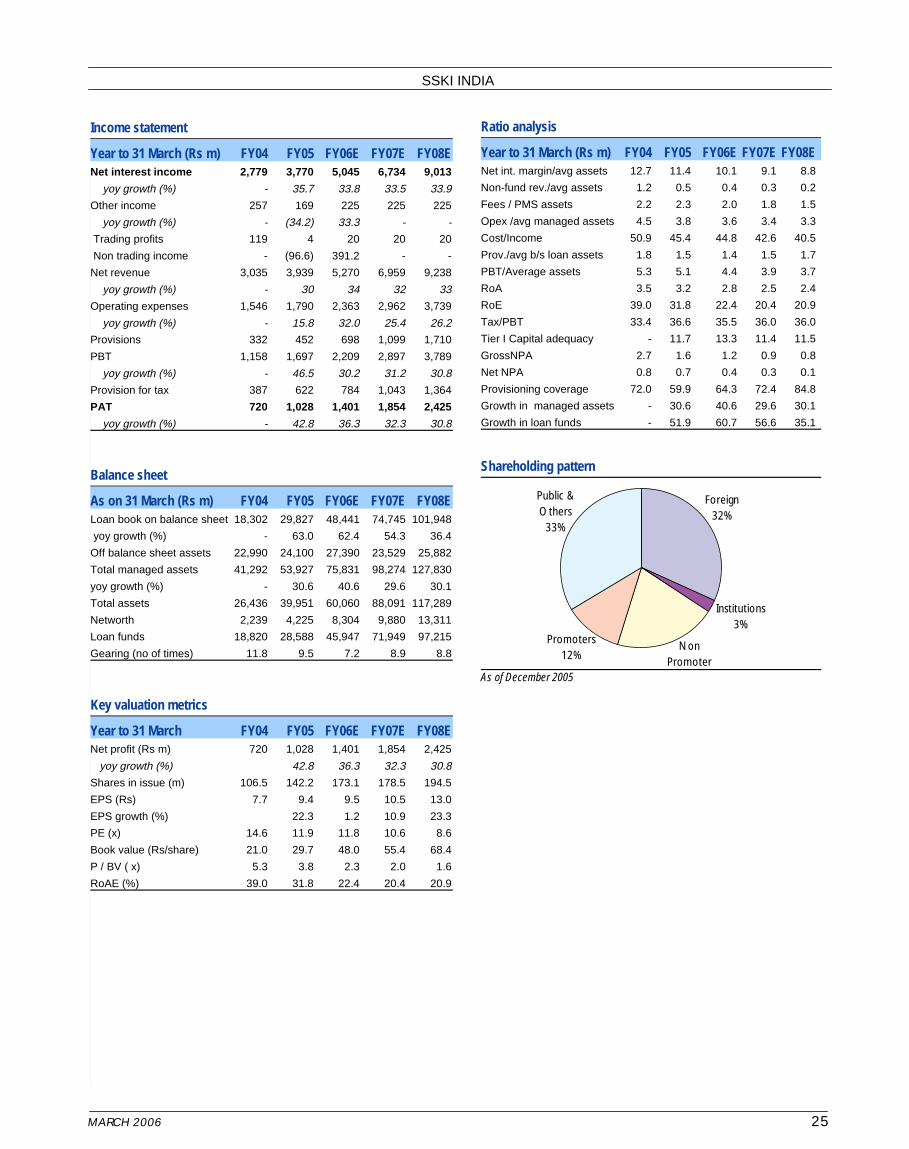
Income statement
Year to 31 March (Rs m) FY04 FY05 FY06E FY07E FY08E Net interest income 2,779 3,770 5,045 6,734 9,013
yoy growth (%) - 35.7 33.8 33.5 33.9
Other income 257 169 225 225 225
yoy growth (%) - (34.2) 33.3 - -
Trading profits 119 4 20 20 20
Non trading income - (96.6) 391.2 - -
Net revenue 3,035 3,939 5,270 6,959 9,238
yoy growth (%) - 30 34 32 33
Operating expenses 1,546 1,790 2,363 2,962 3,739
yoy growth (%) - 15.8 32.0 25.4 26.2
Provisions 332 452 698 1,099 1,710
PBT 1,158 1,697 2,209 2,897 3,789
yoy growth (%) - 46.5 30.2 31.2 30.8
Provision for tax 387 622 784 1,043 1,364
PAT 720 1,028 1,401 1,854 2,425
yoy growth (%) - 42.8 36.3 32.3 30.8
Balance sheet
As on 31 March (Rs m) FY04 FY05 FY06E FY07E FY08E Loan book on balance sheet 18,302 29,827 48,441 74,745 101,948
yoy growth (%) - 63.0 62.4 54.3 36.4
Off balance sheet assets 22,990 24,100 27,390 23,529 25,882
Total managed assets 41,292 53,927 75,831 98,274 127,830
yoy growth (%) - 30.6 40.6 29.6 30.1
Total assets 26,436 39,951 60,060 88,091 117,289
Networth 2,239 4,225 8,304 9,880 13,311
Loan funds 18,820 28,588 45,947 71,949 97,215
Gearing (no of times) 11.8 9.5 7.2 8.9 8.8
Key valuation metrics
Year to 31 March FY04 FY05 FY06E FY07E FY08E Net profit (Rs m) 720 1,028 1,401 1,854 2,425
yoy growth (%) 42.8 36.3 32.3 30.8
Shares in issue (m) 106.5 142.2 173.1 178.5 194.5
EPS (Rs) 7.7 9.4 9.5 10.5 13.0
EPS growth (%) 22.3 1.2 10.9 23.3
PE (x) 14.6 11.9 11.8 10.6 8.6
Book value (Rs/share) 21.0 29.7 48.0 55.4 68.4
P / BV ( x) 5.3 3.8 2.3 2.0 1.6
RoAE (%) 39.0 31.8 22.4 20.4 20.9
Ratio analysis
Year to 31 March (Rs m) FY04 FY05 FY06E FY07E FY08E Net int. margin/avg assets 12.7 11.4 10.1 9.1 8.8
Non-fund rev./avg assets 1.2 0.5 0.4 0.3 0.2
Fees / PMS assets 2.2 2.3 2.0 1.8 1.5
Opex /avg managed assets 4.5 3.8 3.6 3.4 3.3
Cost/Income 50.9 45.4 44.8 42.6 40.5
Prov./avg b/s loan assets 1.8 1.5 1.4 1.5 1.7
PBT/Average assets 5.3 5.1 4.4 3.9 3.7
RoA 3.5 3.2 2.8 2.5 2.4
RoE 39.0 31.8 22.4 20.4 20.9
Tax/PBT 33.4 36.6 35.5 36.0 36.0
Tier I Capital adequacy - 11.7 13.3 11.4 11.5
GrossNPA 2.7 1.6 1.2 0.9 0.8
Net NPA 0.8 0.7 0.4 0.3 0.1
Provisioning coverage 72.0 59.9 64.3 72.4 84.8
Growth in managed assets - 30.6 40.6 29.6 30.1
Growth in loan funds - 51.9 60.7 56.6 35.1
Shareholding pattern
Foreign32%
Institutions3%
Non Promoter
Promoters12%
Public & Others33%
As of December 2005

Analyst Sector/Industry/Coverage E-mail Tel. +91-22-5638 3300
Pathik Gandotra Head of Research: Banking, Strategy [email protected] Ext: 304 Shirish Rane Cement, Construction, Metals, Power [email protected] Ext: 313 Nikhil Vora FMCG, Media, Retailing, Mid Caps [email protected] Ext: 308 Surendra Goyal, CFA IT Services, Telecom [email protected] Ext: 307 Ramnath S Automobiles, Auto ancillaries [email protected] Ext: 380 Nitin Agarwal Pharmaceuticals [email protected] Ext: 395 Harshad Katkar Oil & Gas, Engineering [email protected] Ext: 358 Chirag Shah Textiles, Metals [email protected] Ext: 306 Bhoomika Nair Construction, Power [email protected] Ext: 337 Shiladitya Dasgupta Mid Caps [email protected] Ext: 365 Avishek Datta Oil & Gas, Engineering [email protected] Ext: 217 Bhushan Gajaria FMCG, Retailing, Media [email protected] Ext: 367 Shreyash Devalkar IT Services, Telecom [email protected] Ext: 311 Hiren Dasani Banking [email protected] Ext: 325 Ashish Shah Automobiles, Auto ancillaries [email protected] Ext: 371 Salil Desai Cement [email protected] Ext: 373
Sadanand Raje Technical Analyst [email protected] Ext: 392
Equity Sales/Dealing Designation E-mail Tel. +91-22-5638 3300
Naishadh Paleja CEO [email protected] Ext: 211 GV Alankara Head of Dealing [email protected] Ext: 201-210 Vishal Purohit VP - Sales [email protected] Ext: 212 Nikhil Gholani VP - Sales [email protected] Ext: 363 Sanjay Panicker VP - Sales [email protected] Ext: 368 V Navin Roy AVP - Sales [email protected] Ext: 370 Rohan Soares AVP – Sales [email protected] Ext: 310
Naresh Panjnani Sales Trader [email protected] Ext: 201-210 Rishi Kohli VP - Derivatives [email protected] Ext: 201-210 Sachin Kochhar Derivatives - Sales [email protected] Ext: 201-210
SSKI INDIA
Disclaimer
This document has been prepared by S S Kantilal Ishwarlal Securities Private Limited (SSKI). SSKI and its subsidiaries and associated companies are full-service, integrated investment banking, investment management and brokerage group. Our research analysts and sales persons provide important input into our investment banking activities.
This document does not constitute an offer or solicitation for the purchase or sale of any financial instrument or as an official confirmation of any transaction.
The information contained herein is from publicly available data or other sources believed to be reliable. While we would endeavor to update the information herein on reasonable basis, SSKI, its subsidiaries and associated companies, their directors and employees ("SSKI and affiliates") are under no obligation to update or keep the information current. Also, there may be regulatory, compliance, or other reasons that may prevent SSKI and affiliates from doing so.
We do not represent that information contained herein is accurate or complete and it should not be relied upon as such. This document is prepared for assistance only and is not intended to be and must not alone betaken as the basis for an investment decision. The user assumes the entire risk of any use made of this information. Each recipient of this document should make such investigations as it deems necessary to arrive at an independent evaluation of an investment in the securities of companies referred to in this document (including the merits and risks involved). The investment discussed or views expressed may not be suitable for all investors.
Affiliates of SSKI may have issued other reports that are inconsistent with and reach different conclusion from the information presented in this report.
This report is not directed or intended for distribution to, or use by, any person or entity who is a citizen or resident of or located in any locality, state, country or other jurisdiction, where such distribution, publication, availability or use would be contrary to law, regulation or which would subject SSKI and affiliates to any registration or licensing requirement within such jurisdiction. The securities described herein may or may not be eligible for sale in all jurisdictions or to certain category of investors. Persons in whose possession this document may come are required to inform themselves of and to observe such restriction.
Reports based on technical analysis centers on studying charts of a stock's price movement and trading volume, as opposed to focusing on a company's fundamentals and as such, may not match with a report on a company's fundamentals.
SSKI & affiliates may have used the information set forth herein before publication and may have positions in, may from time to time purchase or sell or may be materially interested in any of the securities mentioned or related securities. SSKI may from time to time solicit from, or perform investment banking, or other services for, any company mentioned herein. Without limiting any of the foregoing, in no event shall SSKI, any of its affiliates or any third party involved in, or related to, computing or compiling the information have any liability for any damages of any kind. Any comments or statements made herein are those of the analyst and do not necessarily reflect those of SSKI.
This document is subject to changes without prior notice and is intended only for the person or entity to which it is addressed to and may contain confidential and/or privileged material and is not for any type of circulation. Any review, retransmission, or any other use is prohibited.
Though disseminated to all the customers simultaneously, not all customers may receive this report at the same time. SSKI will not treat recipients as customers by virtue of their receiving this report.
Explanation of Ratings: 1. Outperformer: More than 10% to Index 2. Neutral: Within 0-10% to Index 3. Underperformer: Less than 10% to Index
Disclosure of interest: 1. SSKI has not received compensation from the company covered herein in the past twelve months for Issue Management, Capital Structure, Mergers & Acquisitions, Buyback of
shares and Other corporate advisory services. 2. SSKI is currently not having a mandate for the subject company. 3. SSKI and its affiliate do not hold the paid up capital of the company 4. The Equity Analyst and his/her relatives/dependents do not hold shares of the company covered as on the date of publication of research on the subject company".
Copyright in this document vests exclusively with SSKI