Industry Focus - Google Groups
140
Citi Investment Research & Analysis is a division of Citigroup Global Markets Inc. (the "Firm"), which does and seeks to do business with companies covered in its research reports. As a result, investors should be aware that the Firm may have a conflict of interest that could affect the objectivity of this report. Investors should consider this report as only a single factor in making their investment decision. Citigroup Global Markets Asia Pacific | India Equity Strategy (Citi) Corporate Securities Strategy 18 May 2010 140 pages India Investor Conference 2010 26-28 May Taj Land’s End. Mumbai, India See Appendix A-1 for Analyst Certification, Important Disclosures and non-US research analyst disclosures. Equity Aditya Narain, CFA +91-22-6631-9879 [email protected] India Research Team
-
Upload
khangminh22 -
Category
Documents
-
view
0 -
download
0
Transcript of Industry Focus - Google Groups

Citi Investment Research & Analysis is a division of Citigroup Global Markets Inc. (the "Firm"), which does and seeks to do business with companies covered in its research reports. As a result, investors should be aware that the Firm may have a conflict of interest that could affect the objectivity of this report. Investors should consider this report as only a single factor in making their investment decision.
Citigroup Global Markets
Asia Pacific | India Equity Strategy (Citi)
Corporate Securities Strategy
18 May 2010 140 pages
India Investor Conference 2010 26-28 May Taj Land’s End. Mumbai, India
India Investor Conference 2010: 26-28 May, Taj Land’s End. Mumbai, India
See Appendix A-1 for Analyst Certification, Important Disclosures and non-US research analyst disclosures.
Equity
Aditya Narain, CFA +91-22-6631-9879 [email protected]
India Research Team

India Investor Conference 2010 18 May 2010
Citigroup Global Markets 2
Statistical Snapshot 5
Adani Enterprises (ADEL.BO) 6
Aditya Birla Nuvo (ABRL.BO) 8
Ambuja Cements (ABUJ.BO) 10
Apollo Hospitals (APLH.BO) 12
Cairn India (CAIL.BO) 14
CESC (CESC.BO) 16
DB Corp (DBCL.BO) 18
DLF (DLF.BO) 20
Edelweiss Capital (EDEL.BO) 22
Essar Oil (ESRO.BO) 24
Glenmark Pharmaceuticals (GLEN.BO) 26
GMR Infrastructure (GMRI.BO) 28
Godrej Consumer Products (GOCP.BO) 30
Grasim Industries (GRAS.BO) 32
GVK Power and Infrastructure (GVKP.BO) 34
HCC (HCNS.BO) 36
HCL Technologies (HCLT.BO) 38
HDFC Bank (HDBK.BO) 40
Hero Honda (HROH.BO) 42
Hindalco Industries (HALC.BO) 44
ICICI Bank (ICBK.BO) 46
ICICI Prudential Life Insurance 48
Infosys Technologies (INFY.BO) 50
Infrastructure Development Finance
(IDFC.BO) 52
IRB Infrastructure Developers (IRBI.BO) 54
ITC (ITC.BO) 56
IVRCL (IVRC.BO) 58
JSW Steel (JSTL.BO) 60
Jubilant Organosys (JUBO.BO) 62
Kotak Mahindra Bank (KTKM.BO) 64
Larsen & Toubro (LART.BO) 66
Marico (MRCO.BO) 68
Maruti Suzuki India (MRTI.BO) 70
Max India (MAXI.BO) 72
Moser Baer India (MOSR.BO) 74
Mundra Port & Special Economic Zone
(MPSE.BO) 76
National Aluminium (NALU.BO) 78
NMDC (NMDC.BO) 80
Oil India (OILI.BO) 82
ONGC (ONGC.BO) 84
Opto Circuits (OPTO.BO) 86
Pantaloon Retail (PART.BO) 88
Phoenix Mills Limited (PHOE.BO) 90
Punjab National Bank (PNBK.BO) 92
Puravankara Projects (PPRO.BO) 94
Ranbaxy (RANB.BO) 96
Reliance Capital (RLCP.BO) 98
Reliance Communications (RLCM.BO) 100
Reliance Industries (RELI.BO) 102
Reliance Infrastructure (RLIN.BO) 104
Reliance Power (RPOL.BO) 106
Shriram Transport Finance (SRTR.BO) 108
State Bank of India (SBI.BO) 110
Sterlite Technologies (STTE.BO) 112
Sun Pharmaceuticals (SUN.BO) 114
Tata Consultancy Services (TCS.BO) 116
Tata Motors (TAMO.BO) 118
Tata Steel (TISC.BO) 120
Tech Mahindra (TEML.BO) 122
Thermax (THMX.BO) 124
Union Bank of India (UNBK.BO) 126
United Spirits (UNSP.BO) 128
Wipro (WIPR.BO) 130
WTTIL (Tata Quippo) 132
Yes Bank (YESB.BO) 134
Appendix A-1 137
Contents

India Investor Conference 2010 18 May 2010
Citigroup Global Markets 3
Dear Guest:
Welcome to the Citi India Investor Conference 2010, Mumbai.
Over the past year the India story has played out well: demand has remained resilient, the market has generated returns, and investment in and into India has continued unabated. Investors’ perceptions of India such as ‘abundant domestic demand’, ‘favored capital destination’, ‘much to be done on policy and infrastructure’, and ‘expensive but attractive market’ have reinforced themselves. But none of the country’s achievements have come without surprises and disappointments, highs and lows, and gains and losses. On balance, the big picture has only become bigger in a changed environment.
So what does this year hold for investing in India? Will opportunities overshadow challenges? Will strengthening micro dynamics offset what some believe is a faltering macro? Will government policy initiatives begin to deliver or deter? Have Corporate India become risk-takers or risk-averse? Is there more value in the market, and growth in the economy?
With the Citi India Investor Conference, we hope to provide investors an on-the-ground platform to try and absorb the changing landscape, and assess and capture opportunities through meetings with Corporate India. Around 75 leading Indian companies covering a wide range of sectors will meet investors over three days. For a top-down perspective, we have invited policy makers, regulators and economic commentators to address some of the issues and opportunities that lie ahead.
We hope the large number of international and domestic investors attending this conference come away with a clearer understanding of India’s opportunities, challenges and investment outlook and, more importantly, with actionable stock ideas.
We, and the entire Citi team, are available to assist you. We hope you have an enlightening experience.
Keshav Sanghi Aditya Narain
Head of India Equities Head of India Research

India Investor Conference 2010 18 May 2010
Citigroup Global Markets 4
Citi Investment Research and Analysis India Team --- Coverage by Sector
Role Sectors Office Tel Mobile E-mail Strategy Aditya Narain HoR, Analyst Strategy +91-22-6631 9879 +91-98202 99964 [email protected] Economics Rohini Malkani Economist Economics +91-22-6631 9876 +91-98202 99965 [email protected] Anushka Shah Economist Economics +91-22-6631 9878 +91-98192 98291 [email protected] Autos, Ancillaries, Airlines Jamshed Dadabhoy Analyst Autos, Ancillaries, Transportation +91-22-6631 9883 +91-98206 03698 [email protected] Arvind Sharma Associate Autos, Ancillaries, Transportation +91-22-6631-9852 +91 981972 1110 [email protected] Banks / Financials, Real Estate, Hotels Aditya Narain HoR, Analyst Banks, Financial Services +91-22-6631 9879 +91-98202 99964 [email protected] Manish Chowdhary Analyst Banks, Financial Services +91-22-6631 9853 +91-98195 44425 [email protected] Pooja Kapur Associate Banks, Financial Services +91-22-6631 9881 +91-978988 2055 [email protected] Vidhi Sodhani Associate Hotels, Real Estate +91-22-6631 9854 +91-982014 2385 [email protected] Capital Goods, Construction, Utilities Venkatesh Balasubramaniam Analyst Capital Goods, Power, Construction +91-22-6631 9864 +91-98204 48768 [email protected] Deepal Delivala Analyst Capital Goods, Power, Construction +91-22-6631 9857 +91-98204 14901 [email protected] Atul Tiwari Associate Capital Goods, Power, Construction +91-22-6631 9866 +91-98195 77306 [email protected] Consumer & Retail Jamshed Dadabhoy Analyst Consumer, Retail +91-22-6631 9883 +91-98206 03698 [email protected] Aditya Mathur Associate Consumer, Retail +91-22-6631 9841 +91-98206 79920 [email protected] IT Services, Technology Surendra K Goyal Analyst IT Services, Technology +91-22-6631 9870 +91-98203 45291 [email protected] Vishal Agarwal Associate IT Services, Technology +91-22-6631 2742 +91-98339 20892 [email protected] Media Surendra K Goyal Analyst Media +91-22-6631 9870 +91-98203 45291 [email protected] Aditya Mathur Associate Media +91-22-6631 9841 +91-98206 79920 [email protected] Metals, Mining, Building Materials Pradeep Mahtani Analyst Metals, Mining, Building Materials +91-22-6631 9882 +91-98202 28355 [email protected] Raashi Chopra Associate Metals, Mining, Building Materials +91-22-6631 9862 +91-98200 17185 [email protected] Oil & Gas, Chemicals Rahul Singh Analyst Oil & Gas, Chemicals +91-22-6631 9863 +91-98920 46226 [email protected] Saurabh Handa Analyst Oil & Gas, Chemicals +91-22-6631 9858 +91-98190 74974 [email protected] Garima Mishra Associate Oil & Gas, Chemicals +91-22-6631 9877 +91-98190 74974 [email protected] Pharmaceuticals, Healthcare Prashant Nair Analyst Pharmaceuticals, Healthcare, Agrochem +91-22-6631 9855 +91-98200 95476 [email protected] Akshay Rai Associate Pharmaceuticals, Healthcare, Agrochem +91-22-6631 9873 +91-98208 14373 [email protected] Telecom Rahul Singh Analyst Telecom +91-22-6631 9863 +91-98920 46226 [email protected] Gaurav Malhotra Associate Telecom +91-22-6631 9885 +91-982030 2081 [email protected]
Source: Citi Investment Research and Analysis

India Investor Conference 2010 18 May 2010
Citigroup Global Markets 5
India – Macroeconomic Summary, FY99-12E (%)
Year to 31 March FY99 FY00 FY01 FY02 FY03 FY04 FY05 FY06 FY07 FY08 FY09 FY10E FY11E FY12ENational income indicators Nominal GDP (Rs bn) 18,193 20,279 21,840 23,676 25,500 28,617 32,392 37,065 42,840 49,479 55,744 61,642 70,272 79,758Nominal GDP (US$ bn) 431 467 478 493 528 623 720 837 948 1,231 1,212 1,300 1,606 1,957Per Capita GDP (US$) 439 467 469 474 500 582 661 756 845 1,082 1,050 1,110 1,351 1,622Real GDP growth (%) 6.7 6.0 4.4 5.8 3.8 8.5 7.5 9.4 9.7 9.2 6.7 7.2 8.4 8.6 Agriculture growth (%) 6.3 0.5 -0.2 6.3 -7.2 10.0 0.7 5.2 3.7 4.7 1.6 -0.2 4.0 3.0 Industry growth (%) 4.1 4.6 6.4 2.7 7.1 7.4 9.5 9.3 12.7 9.5 3.9 8.2 9.1 9.4 Services growth (%) 8.3 9.5 5.7 7.2 7.5 8.5 9.6 11.0 10.2 10.5 9.8 8.7 9.1 9.5By Demand (%YoY) Consumption 7.4 7.2 3.0 5.3 2.3 5.4 1.8 8.5 7.6 9.7 8.3 4.8 6.5 7.3 Pvt Consm 6.5 6.1 3.4 6.0 2.9 5.9 1.6 8.6 8.3 9.7 6.8 4.1 6.5 7.5 Public Consm 12.2 13.2 0.9 2.3 -0.4 2.6 2.7 8.3 3.8 9.7 16.7 8.2 6.5 6.5Gross Capital Formn 0.1 20.6 -3.5 -2.9 16.8 17.6 23.7 15.3 16.1 14.8 -1.7 4.4 10.4 11.4Cons; Invst, Savings * (%GDP) Consumption 78.7 79.5 78.6 79.1 77.3 75.2 70.5 69.1 68.2 67.3 69.4 69.9 68.0 67.0Capital Formation 22.7 25.3 23.8 22.3 24.6 26.9 32.7 34.3 35.5 37.7 34.9 36.0 38.0 38.5Gross Domestic Savings 21.7 24.2 23.2 22.9 25.7 29.1 32.2 33.1 34.4 36.4 32.5 34.0 36.0 36.5Real indicators (% Y/Y)
Cement despatches 6.4 14.1 0.1 8.6 11.1 6.5 9.5 11.4 9.6 8.0 8.1 11.0 11.0 12.0Commercial vehicle sales -11.2 22.0 -11.9 -4.5 40.4 37.5 25.5 12.3 32.2 5.8 -22.3 35.6 15.0 12.0Car sales -4.0 45.3 -5.3 3.2 5.3 32.1 19.2 7.4 19.7 11.2 7.0 26.9 17.0 13.0Two-wheelers 11.7 9.4 0.7 15.3 15.8 12.6 16.8 15.0 12.1 -4.8 4.7 24.4 12.0 10.0Diesel consumption 3.7 5.5 2.0 -3.5 3.0 4.5 5.5 -2.2 5.0 0.7 3.2 5.7 6.0 7.0 Mobile Tele density 0.1 0.2 0.3 0.6 1.3 3.1 4.7 8.1 14.0 21.9 32.4 42.1 50.2 NAMonetary indicators Money supply 19.4 15.0 16.4 14.1 14.7 16.7 12.0 21.1 21.7 21.4 18.6 17.4 17.0 17.0Int rate PLR - year end 12.0 12.0 11.5 11.5 10.8 10.3 10.3 10.3 12.3 12.3 11.0 11.5 11.5 11.5Inflation – WPI (Avg) 5.9 3.3 7.1 3.6 3.4 5.5 6.5 4.4 5.4 4.7 8.5 3.8 7.4 6.5CPI (Avg) 13.1 3.4 3.7 4.3 4.1 3.8 3.9 4.2 6.8 6.2 9.1 13.0 7.0 6.0Bank credit growth 13.8 18.2 17.3 15.3 23.7 15.3 30.9 37.0 28.1 22.3 17.5 16.7 17.0 17.0Deposit growth 19.3 13.9 18.4 14.6 16.1 17.5 13.0 24.0 23.8 22.4 18.0 17.0 16.0 16.0Fiscal Indicators Centre's fiscal deficit -4.9 -5.2 -5.4 -6.0 -5.7 -4.3 -3.9 -3.9 -3.3 -2.6 -6.0 -6.7 -5.5 -5.0State fiscal deficit -4.1 -4.5 -4.0 -4.1 -3.9 -4.2 -3.3 -2.4 -1.8 -2.2 -2.6 -3.2 -3.0 -3.1Combined deficit (Centre+State) -8.6 -9.1 -9.2 -9.6 -9.2 -8.2 -7.2 -6.5 -5.4 -4.0 -8.5 -9.7 -8.5 -8.1Off Balance Sheet Items - - - - - - - -0.5 -0.9 -0.6 -1.7 -0.2 NA NACombined domestic liabilities 71.0 74.1 77.1 82.0 85.5 85.7 85.7 83.2 79.7 76.4 75.9 76.0 75.2 71.9Combined o/s guarantees 8.5 10.7 11.7 11.0 10.8 10.7 9.6 8.3 6.2 5.6 NA NA NA NAExternal Sector Exports (US$bn) 34.3 37.5 45.5 44.7 53.8 66.3 85.2 105.2 128.9 166.2 189.0 170.1 195.6 234.7 % YoY -3.9 9.5 21.1 -1.6 20.3 23.3 28.5 23.4 22.6 28.9 13.7 -10.0 15.0 20.0Imports (US$bn) 47.5 55.4 57.9 56.3 64.5 80.0 118.9 157.1 190.7 257.6 307.7 280.0 315.5 359.7 %YoY -7.1 16.5 4.6 -2.8 14.5 24.1 48.6 32.1 21.4 35.1 19.4 -9.0 12.7 14.0Trade deficit (US$bn) -13.2 -17.8 -12.5 -11.6 -10.7 -13.7 -33.7 -51.9 -61.8 -91.5 -118.7 -109.9 -119.9 -125.0Invisibles (US$bn) 9.2 13.7 9.8 15.0 17.0 27.8 31.2 42.0 52.2 75.7 89.9 80.9 94.4 102.6Current Account Deficit (US$bn) -4.0 -4.1 -2.7 3.4 6.3 14.1 -2.5 -9.9 -9.6 -15.7 -28.7 -29.0 -25.5 -22.4 % to GDP -0.9 -0.9 -0.6 0.7 1.2 2.3 -0.3 -1.2 -1.0 -1.3 -2.4 -2.2 -1.6 -1.1Capital Account (US$bn) 8.0 9.5 8.8 8.6 10.8 16.7 28.0 25.5 45.2 106.6 7.2 55.1 59.6 64.6% GDP 1.9 2.0 1.9 1.7 2.1 2.7 3.9 3.0 4.8 8.7 0.6 4.2 3.6 3.3Forex Assets (excl gold) (US$bn) 29.5 35.1 39.6 51.0 71.9 106.1 135.1 145.1 191.9 299.1 241.6 252.7 286.9 329.1Months of imports 7.5 7.6 8.2 10.9 13.4 15.9 13.6 11.1 12.1 13.9 9.4 10.8 10.9 11.0Exchange rate
Rs/US$ - annual avg 42.2 43.4 45.7 48.0 48.3 45.9 45.0 44.3 45.2 40.2 46.0 47.4 43.8 40.8 % depreciation 13.4 2.8 5.3 5.0 0.6 -5.0 -2.0 -1.6 2.0 -11.1 14.4 3.0 -7.7 -6.9Rs/US$ - year end 42.4 43.6 46.5 48.9 47.5 43.6 43.8 44.6 43.6 40.1 50.7 44.9 42.5 40.0 % depreciation 7.3 2.8 6.7 5.2 -2.9 -8.2 0.3 2.0 -2.3 -8.0 26.4 -11.4 -5.4 -5.9
* At current prices. Source: CSO, RBI, Ministry of Finance and CIRA estimates
Statistical Snapshot

India Investor Conference 2010 18 May 2010
Citigroup Global Markets 6
Platform for new entrepreneurial efforts — AEL is: 1) the platform to back the Adani Group’s entrepreneurial and execution abilities; 2) a play on India’s persistent deficits and merchant power markets; 3) the only listed play on the Indian coal mining theme; and 4) new entrepreneurial efforts of the group are likely to be housed in AEL.
Trading to diversified conglomerate — AEL is leveraging on its experience as a star trading house and execution record of building mega projects (MPSEZ) to embark on an asset-backed diversification plan to exploit opportunities in infrastructure – power, coal mining , trading, real estate and others.
End game – Explosive growth and substantial increase in return ratios — 1) Net fixed assets 4x; 2) sales CAGR of 18%; 3) EBITDA CAGR of 102%; 4) PAT CAGR of 81%; and 5) RoCE expanding from 7% to 16% over FY09 to FY12E. AEL is already a highly geared entity and shall remain the same given high gearing of individual businesses. Fundraising (both equity and debt) and execution are the key success factors for the company.
Key positive catalysts for the stock — 1) Equity rising; 2) debt closure for individual projects; 3) commissioning of projects; and 4) new project wins.
Downside risks — Execution; financial closure; clearances; coal license; real estate volumes/prices and resource estimation.
Statistical Abstract
Year to Net Profit Diluted EPS EPS growth EV/EBITDA P/E P/B P/CEPS ROE Yield31 Mar (RsM) (Rs) (%) (x) (x) (x) (x) (%) (%)2008A 3,675 7.5 na 46.7 78.1 13.6 69.2 na 0.12009A 5,067 10.3 37.9 35.1 56.7 9.6 48.9 19.7 0.12010E 9,830 19.9 94.0 19.5 29.2 7.3 24.8 28.3 0.12011E 13,881 28.1 41.2 14.9 20.7 5.4 16.9 30.0 0.12012E 30,176 61.2 117.4 7.0 9.5 3.5 7.6 44.4 0.1
Source: Company, Citi Investment Research and Analysis estimates
Adani Enterprises (ADEL.BO)
Buy/Medium Risk 1MPrice (11 May 10) Rs582.00Target Price Rs448.00Expected share price return -23.0%Expected dividend yield 0.1%Expected total return -22.9%Market Cap Rs306,733M US$6,802M
Price Performance
200250300350400450500550600
May 09 Aug 09 Nov 09 Feb 10 May 10
INR
Source: dataCentral
Venkatesh Balasubramaniam +91-22-6631-9864 [email protected]
Company description
Adani Enterprises Limited, founded in 1988 as a partnership firm, has interests in trading, coal mining, real estate development, shipping, bunkering, city gas distribution, power generation, edible oil refining, grain storage and food processing. With onset of infrastructure development cycle in earlier part of this decade, company started to move away from being a pure trader to infrastructure asset developer. Today, the company has interests in coal mine development, power generation, city gas distribution, real estate development, and food storage and processing. Apart from moving into infrastructure asset development, company has also diversified into trading of coal (coal imports into India) and power trading.

India Investor Conference 2010 18 May 2010
Citigroup Global Markets 7
Adani Enterprises (ADEL.BO): Financial Summary
Fiscal year end 31-Mar 2008 2009 2010E 2011E 2012E
Valuation RatiosP/E adjusted (x) 78.1 56.7 29.2 20.7 9.5EV/EBITDA adjusted (x) 48.1 37.8 22.1 16.1 7.4P/BV (x) 13.6 9.6 7.3 5.4 3.5Dividend yield (%) 0.1 0.1 0.1 0.1 0.1Per Share Data (Rs)EPS adjusted 7.45 10.27 19.93 28.14 61.18EPS reported 7.50 10.23 19.93 28.14 61.18BVPS 42.94 60.72 80.07 107.63 168.23DPS 0.30 0.50 0.50 0.50 0.50
Profit & Loss (RsM)Net sales 196,097 262,583 261,693 323,692 429,489Operating expenses -189,388 -253,385 -242,803 -292,927 -354,700EBIT 6,709 9,198 18,891 30,766 74,789Net interest expense -2,770 -3,488 -6,310 -11,359 -24,991Non-operating/exceptionals 390 146 135 135 135Pre-tax profit 4,329 5,856 12,716 19,542 49,933Tax -591 -782 -1,506 -2,568 -7,935Extraord./Min.Int./Pref.div. -40 -28 -1,380 -3,092 -11,821Reported net income 3,698 5,047 9,830 13,881 30,176Adjusted earnings 3,675 5,067 9,830 13,881 30,176Adjusted EBITDA 7,157 10,020 20,638 33,851 82,536Growth Rates (%)Sales 15.7 33.9 -0.3 23.7 32.7EBIT adjusted 47.8 37.1 105.4 62.9 143.1EBITDA adjusted 52.2 40.0 106.0 64.0 143.8EPS adjusted 111.5 37.9 94.0 41.2 117.4
Cash Flow (RsM)Operating cash flow 5,917 -2,474 14,678 21,452 58,272Depreciation/amortization 448 822 1,748 3,086 7,746Net working capital -1,218 -12,023 -3,582 -8,357 -12,379Investing cash flow -30,416 -49,804 -112,034 -82,033 -84,694Capital expenditure -27,577 -48,587 -112,152 -82,150 -84,807Acquisitions/disposals 0 0 0 0 0Financing cash flow 24,529 61,763 72,129 67,566 55,466Borrowings 17,512 59,801 77,979 77,721 76,775Dividends paid -173 -289 -289 -289 -289Change in cash 30 9,486 -25,227 6,985 29,045
Balance Sheet (RsM)Total assets 123,924 201,212 277,056 376,898 500,615Cash & cash equivalent 16,346 25,832 605 7,590 36,635Accounts receivable 14,058 34,006 32,636 39,331 47,704Net fixed assets 40,940 88,704 199,109 278,173 355,234Total liabilities 99,244 166,492 231,416 314,574 396,582Accounts payable 20,772 26,811 18,701 22,114 25,399Total Debt 61,041 120,842 198,822 276,543 353,317Shareholders' funds 24,680 34,719 45,640 62,325 104,034
Profitability/Solvency Ratios (%)EBITDA margin adjusted 3.6 3.8 7.9 10.5 19.2ROE adjusted 22.5 19.8 28.3 30.0 44.4ROIC adjusted 11.3 8.6 9.4 9.9 17.9Net debt to equity 181.1 273.7 434.3 431.5 304.4Total debt to capital 71.2 77.7 81.3 81.6 77.3
For further data queries on Citi’s full coverage universe please contact CIRA Data Services Asia Pacific ([email protected]) or +852-2501-2791
Investment Strategy
We rate Adani Enterprises Buy/ Medium (1M) risk given:
Adani Enterprises (AEL) is leveraging on its experience of a 5-star trading house and execution track record of building a mega project like Mundra Ports and SEZ (MPSEZ) to embark on an ambitious asset-backed diversification plan that will exploit opportunities in the infrastructure space. The end game is not only to de-risk the business model from fluctuating trading volumes and prices but also to improve operating margins, RoCE and RoE over a 5 year time frame. To a large extent investing in AEL would entail backing the Adani Group’s ability to (1) get different types of clearances on time (2) raise sufficient debt and equity to fund the projects and (3) execute the same on time.
Valuation
We value Adani Enterprises using a sum of the parts (SOTP) methodology given the conglomerate nature of the business (1) Power – using DCF valuation with FCFE discounted using a CoE = 13%; (2) Coal Mining – using DCF valuation with FCFE discounted using a CoE = 15%; (3) Real Estate – using DCF valuation with FCFE discounted using a CoE = 14%; (4) Trading – FY11E EV/EBITDA multiple of 3x; (5) Adani Wilmar – FY11E EV/EBITDA multiple of 5x; (6) Agri Fresh – FY11E P/BV multiple of 1x (7) Agri Logistics – FY11E P/BV multiple of 2x (8) City Gas - using DCF valuation with FCFE discounted using a CoE = 13%; (9) Shipping - using DCF valuation with FCFE discounted using a CoE = 13% (10) Bunkering - using DCF valuation with FCFE discounted using a CoE = 13% and (11) Less net debt at the end of FY09. We also apply a conglomerate discount of 5% to arrive at a target price of Rs448.

India Investor Conference 2010 18 May 2010
Citigroup Global Markets 8
Financial Services Conglomerate
Conglomerate business, with significant financial services presence — A part of Aditya Birla Group, Aditya Birla Nuvo (ABNL) has a significant presence across various financial services segments – life insurance, asset management, wealth management, retail broking and non banking financial services. Aditya Birla is amongst the few leading, integrated and scale financial services providers in India. It also owns a stake (27%) in Idea Telecom and has presence in businesses including – textiles, fertilizers, insulators, carbon black, rayon and BPO services.
On way to generating significant synergies — ABNL has been working towards a common brand and platform for its financial services business, and reaping the large efficiencies available. It collectively manages over Rs800b in assets across its platforms, revenue momentum has been significant, its branch network exceeds 1500 with over 200,000 channel partners, and it has a wide product spread. Significant gains have already been realized, with scope remaining for much more
Life Insurance — ABNL owns a 74% stake in its life insurance JV with Sun Life. It is the sixth largest private sector insurance company in India, with over 1.8m individual policies. Birla Sunlife has a strong record of product innovation (the first to introduce ULIPs) and distribution expansion (amongst the few large insurance companies that do not have a Bank in the group). It has been in a relative consolidation phase in the past year, after a period of relatively high growth and market share gains. It is also amongst the few insurance companies in India disclosing their Embedded Values (Rs30.6bn in FY09) with implied VNB margins of over 20%.
Asset Management — Birla Sun Life Asset Management is a 50:50 JV between ABNL and Sun Life. It is the fifth largest asset management company in India. Its AUMs have shown significant growth in the previous year (+34% YoY) and currently stand at Rs695bn.
Other Businesses — ABNL’s other business interests span a wide spectrum of assets. The manufacturing businesses are housed as separate divisions within the company, are partly commodity linked and cyclical. The garments business is classified as a “growth” business, while the others as “value”.
_______________________________________________________________
_______________________________________________________________
_______________________________________________________________
_______________________________________________________________
_______________________________________________________________
_______________________________________________________________
_______________________________________________________________
_______________________________________________________________
_______________________________________________________________
_______________________________________________________________
Aditya Birla Nuvo (ABRL.BO)
Non-Rated Price (11 May’10) Rs775.75 Market Cap Rs79,910M US$1,772M
Price Performance
450
650
850
1050
May 09 Aug 09 Nov 09 Feb 10 May 10
INR
Source: dataCentral
Manish Chowdhary, CFA +91-22-6631-9853 [email protected] Aditya Narain, CFA +91-22-6631-9879 [email protected] Pooja Kapur [email protected]
Company Description
A part of Aditya Birla Group, Aditya Birla Nuvo (ABNL) has a significant presence across various financial services segments – life insurance, asset management, wealth management, retail broking and non banking financial services. Aditya Birla is amongst the few leading, integrated and scale financial services providers in India. It also owns a stake (27%) in Idea Telecom and has presence in businesses including – textiles, fertilizers, insulators, carbon black, rayon and BPO services.

India Investor Conference 2010 18 May 2010
Citigroup Global Markets 9
This page is left blank intentionally

India Investor Conference 2010 18 May 2010
Citigroup Global Markets 10
Low-Cost Producer; Strong Market Share
Relatively high EBITDA margins — Ambuja Cements (ACL) is amongst India's lowest-cost cement producers. Its EBITDA margins are relatively high due to a combination of: retail cement market focus (higher realizations), state-of-the-art plants with low consumption of power and fuel, and use of sea transport. ACL has 6,000 dealers, more than 400MW of captive power, and has recently added a bulk terminal in Kochi (Kerala) in addition to terminals in Mumbai and Surat. Holcim holds ~46% in ACL.
Market breakdown and growth plans — ACL’s key markets are North India (35% of sales volumes), West/South India (37%) and East India (17%). Its capacity of 25m tpa will rise to 27m tpa by end CY10. Recent expansions include 2.2m tpa of clinker each at Bhatapara (Chhattisgarh) and Rauri (HP) and cement grinding facilities at Dadri (UP), Nalagarh (HP), Maharashtra and Chhattisgarh. ACL’s sales grew 6.5% to 18.8mt in CY09 and management is targeting a growth of 12% in CY10 to take sales to 21mt.
Cost pressures to resurface — EBITDA margins fell on a yoy basis in CY09 due to: (1) Large inventory of high cost imported coal which was gradually wound down through the year and helped reduce average costs. However coal costs are on an uptrend especially in the international market; imported coal accounts for 30% of ACL’s usage. ACL is optimizing use of alternative fuels to cut costs. (2) Clinker purchases of 1.7m tonnes (+70%) in CY09 in order to meet robust demand. This included 1.1m tonnes imported from Indonesia. Clinker purchases should fall in CY10. ACL should also benefit from additional captive power in CY10.
Good performance in 1Q CY10 — Adj PAT for 1Q was Rs4.5bn, +34% yoy and higher than our estimates. EBITDA/t was Rs1,180 (vs. Rs1,115 for ACC), its highest in the past two years due to lower imported coal costs and lower clinker purchases. However margins are at risk going forward as imported coal costs are rising and we expect prices to be under pressure in the coming quarters. Average realizations rose 3% yoy and 4% qoq due to better prices in West India. Volumes were up 4% yoy to 5.3m tonnes. Its domestic sales rose 7.7% to 5.14m tonnes due to better demand in eastern and western India. 1QCY10 margins were 31.3% vs 28.3% last year.
Ambuja Cements – Statistical Abstract
YE 31 Dec Revenue Net Profit EBITDA EPS EPS growth P/E EV/EBITDA EV/tonne (Rs m) (Rs m) (Rs m) (Rs) (%) (x) (x) (US$)CY07 56,314 14,000 22,387 9.2 43% 12.1 6.8 183CY08 62,347 11,828 19,533 7.8 -16% 14.3 8.2 162CY09E 72,023 13,819 23,490 9.1 17% 12.2 6.7 149CY10E 71,260 9,772 18,308 6.4 -29% 17.3 8.5 139CY11E 75,828 9,188 17,316 6.0 -6% 18.4 8.8 128
Source: Company Reports and Citi Investment Research and Analysis estimates.
Price as on 11 May 2010. Rs/U$ rate at 45. Note - CY09E is still estimate as we have not updated for the
actual data.
Ambuja Cements (ABUJ.BO)
Sell/Medium Risk 3MPrice (11 May 10) Rs111.00Target Price Rs71.00Expected share price return -36.0%Expected dividend yield 2.0%Expected total return -34.1%Market Cap Rs169,212M US$3,752M
Price Performance
60
80
100
120
140
May 09 Aug 09 Nov 09 Feb 10 May 10
INR
Source: dataCentral
Pradeep Mahtani +91-22-6631-9882 [email protected]
Raashi Chopra +91-22-6631-9862 [email protected]
Company description
Ambuja Cements (ACL) is one of India's lowest-cost cement producers and enjoys relatively high EBITDA margins due to its focus on the retail cement market (giving higher realizations), modern plants with low power and fuel consumption, and use of sea transport. Its largest markets are North India (35% of sales volumes) and West/South India (37%). Exports account for ~2% of its revenue. Holcim holds around 46% in ACL. Both ACC and ACL give the Holcim Group a total capacity of 51m tpa in India, which should rise to ~57.5m tpa by CY11E.

India Investor Conference 2010 18 May 2010
Citigroup Global Markets 11
Ambuja Cements (ABUJ.BO): Financial Summary
Fiscal year end 31-Dec 2007 2008 2009E 2010E 2011E
Valuation RatiosP/E adjusted (x) 12.1 14.3 12.2 17.3 18.4EV/EBITDA adjusted (x) na 8.2 7.0 8.8 9.1P/BV (x) 3.6 3.0 2.5 2.3 2.1Dividend yield (%) 3.2 2.0 2.0 1.4 1.4Per Share Data (Rs)EPS adjusted 9.20 7.77 9.08 6.42 6.04EPS reported 9.20 7.77 9.08 6.42 6.04BVPS 30.58 37.24 43.74 48.40 52.68DPS 3.50 2.20 2.20 1.50 1.50
Profit & Loss (RsM)Net sales 56,314 62,347 72,023 71,260 75,828Operating expenses -36,291 -45,411 -51,355 -56,856 -62,647EBIT 20,023 16,936 20,668 14,404 13,181Net interest expense -759 -321 -289 -260 -245Non-operating/exceptionals 0 0 0 0 0Pre-tax profit 19,265 16,615 20,380 14,144 12,935Tax -5,265 -4,787 -6,560 -4,371 -3,748Extraord./Min.Int./Pref.div. 0 0 0 0 0Reported net income 14,000 11,828 13,819 9,772 9,188Adjusted earnings 14,000 11,828 13,819 9,772 9,188Adjusted EBITDA 22,387 19,533 23,490 18,308 17,316Growth Rates (%)Sales na 10.7 15.5 -1.1 6.4EBIT adjusted na -15.4 22.0 -30.3 -8.5EBITDA adjusted na -12.7 20.3 -22.1 -5.4EPS adjusted na -15.5 16.8 -29.3 -6.0
Cash Flow (RsM)Operating cash flow 15,518 9,662 16,079 12,320 11,392Depreciation/amortization 2,363 2,598 2,822 3,904 4,135Net working capital -1,179 -2,612 1,370 234 -105Investing cash flow -1,629 -2,749 -11,259 -6,682 -5,104Capital expenditure -5,284 -16,415 -13,279 -8,061 -6,700Acquisitions/disposals 2,647 12,417 0 0 0Financing cash flow -11,243 -4,820 -2,070 -4,179 -2,918Borrowings -5,350 -418 0 0 0Dividends paid -5,834 -3,919 -1,781 -3,919 -2,672Change in cash 2,645 2,093 2,750 1,459 3,371
Balance Sheet (RsM)Total assets 65,329 78,118 90,765 96,785 104,193Cash & cash equivalent 6,426 8,518 11,268 12,727 16,098Accounts receivable 1,457 2,246 2,155 2,148 2,285Net fixed assets 36,567 51,400 61,857 66,014 68,579Total liabilities 18,779 21,432 24,179 23,099 23,991Accounts payable 5,740 8,802 9,525 9,964 11,130Total Debt 3,304 2,887 2,887 2,887 2,887Shareholders' funds 46,550 56,686 66,586 73,686 80,202
Profitability/Solvency Ratios (%)EBITDA margin adjusted 39.8 31.3 32.6 25.7 22.8ROE adjusted na 22.9 22.4 13.9 11.9ROIC adjusted na 25.7 23.5 15.1 13.5Net debt to equity -6.7 -9.9 -12.6 -13.4 -16.5Total debt to capital 6.6 4.8 4.2 3.8 3.5
For further data queries on Citi’s full coverage universe please contact CIRA Data Services Asia Pacific ([email protected]) or +852-2501-2791
Investment Strategy
We rate ACL Sell/Medium Risk (3M) with a target price of Rs71. This is based on pricing pressures leading to an earnings decline during CY10-11. ACL is vulnerable in its northern market which has hitherto been quite profitable. A large proportion of the new capacity being set up in the current phase of supply creation is expected in the Northern region. We expect EBITDA margins to decline during CY10-11 largely due to price weakness. ACL benefits from some cost savings due to use of alternative fuels and from its captive power capacity getting enhanced more than 400MW. These savings are unlikely to offset the EBITDA fall expected in CY10 and CY11.
Valuation
We use EV/tonne to value ACL, a common metric for cement companies. We set our target price at Rs71, based on 15% discount to replacement cost of ~US$100/t due to our expectation that profitability of cement companies will be impacted going forward on increased new cement capacities and competitive pressures. At our target price of Rs71, Sep 10 EV/EBITDA is 4.9x and P/E is 10x.

India Investor Conference 2010 18 May 2010
Citigroup Global Markets 12
Best Play on Indian Healthcare
Best Play on Indian Healthcare — We are positive on the long-term prospects of Indian healthcare. Apollo is our preferred play, given its scale, national footprint and presence in multiple disease/delivery segments. Its exposure to retail pharmacies & healthcare BPO would also act as a support to valuations.
Well Positioned in a Growing Sector — Apollo Hospital is a leading player in a growth sector with high entry barriers. Robust profitability despite the aggressive rollout of pharmacies indicates the buoyancy in the core hospitals business. Besides, we see material hidden value in the form of its retail pharmacy operations, 46% stake in Apollo Health Street & Land on its books – most of which could be unlocked over the next few years.
Expansion Plans — Apollo plans to add ~1,700 beds to its network over the next two years, including ~800 beds under its reach initiative. Other major projects in the pipeline include its JV with Western Hospitals to set up a 225 bed hospital in Mumbai and new facilities in Hyderabad (200 beds), Vizag (222 beds) and Chennai (130 beds). It also intends to expand its pharmacy network.
Pharmacies Nearing Break-Even — Apollo’s retail pharmacy network comprises of 1,035 stores. With the biz now attaining critical scale & improving profitability in the established pharmacies (EBITDA margin of 3.4% for pharmacies set up pre-FY08), we expect it to break even in FY11.
Statistical Abstract
Year to Net Profit Diluted EPS EPS growth EV/EBITDA P/E P/B P/CEPS ROE Yield31 Mar (RsM) (Rs) (%) (x) (x) (x) (x) (%) (%)2008A 772 13.1 na 25.0 54.5 3.2 32.6 na 0.72009A 1,065 17.7 34.5 19.7 40.5 2.9 26.0 7.4 1.02010E 1,558 25.9 46.3 14.9 27.7 2.8 18.3 10.3 1.42011E 1,940 32.2 24.5 12.1 22.2 2.6 14.5 12.1 1.82012E 2,383 39.6 22.8 10.4 18.1 2.4 12.1 13.8 2.2
Source: dataCentral, Citi Investment Research and Analysis estimates
Apollo Hospitals (APLH.BO)
Buy/Medium Risk 1M Price (11 May 10) Rs723.80 Target Price Rs840.00 Expected share price return 16.1% Expected dividend yield 1.4% Expected total return 17.5% Market Cap Rs44,720M US$992M
Price Performance
300400500600700800900
May 09 Aug 09 Nov 09 Feb 10 May 10
INR
Source: dataCentral
Prashant Nair, CFA +91-22-6631-9855 [email protected] Akshay Rai [email protected]
Company description
Apollo Hospitals is an integrated healthcare company in India's private sector, with the largest hospital network in Asia. The group and its subsidiaries own 26 hospitals, and it operates 20 hospitals. These hospitals are owned either by joint ventures and associated companies or operated under contracts as franchise hospitals or under consultancy contracts across the Afro-Asian region, with more than 8,000 operational beds. It also operates a network of primary-care clinics, a medical back-office operation, a health-insurance company and a healthcare staffing company that provides nurses to the UK, the US and other countries. Its retail pharmacy business is one of the largest in India, with a network of over 1,000 outlets.

India Investor Conference 2010 18 May 2010
Citigroup Global Markets 13
Apollo Hospitals (APLH.BO): Financial Summary
Fiscal year end 31-Mar 2008 2009 2010E 2011E 2012E
Valuation RatiosP/E adjusted (x) 55.1 40.9 28.0 22.5 18.3EV/EBITDA adjusted (x) 24.8 20.1 15.0 12.1 10.4P/BV (x) 3.3 3.0 2.8 2.6 2.4Dividend yield (%) 0.7 1.0 1.4 1.8 2.2Per Share Data (Rs)EPS adjusted 13.15 17.68 25.86 32.20 39.55EPS reported 13.15 17.02 25.86 32.20 39.55BVPS 221.35 243.85 258.04 275.71 297.42DPS 5.26 7.07 10.35 12.88 15.82
Profit & Loss (RsM)Net sales 12,164 16,142 20,540 24,081 27,458Operating expenses -10,844 -14,507 -18,147 -21,014 -23,720EBIT 1,319 1,635 2,393 3,066 3,738Net interest expense -382 -459 -581 -650 -735Non-operating/exceptionals 170 283 400 422 491Pre-tax profit 1,107 1,459 2,212 2,838 3,495Tax -374 -490 -696 -907 -1,112Extraord./Min.Int./Pref.div. 39 56 42 8 0Reported net income 772 1,025 1,558 1,940 2,383Adjusted earnings 772 1,065 1,558 1,940 2,383Adjusted EBITDA 1,836 2,267 3,196 4,094 4,915Growth Rates (%)Sales 28.1 32.7 27.2 17.2 14.0EBIT adjusted 15.7 23.9 46.4 28.1 21.9EBITDA adjusted 18.6 23.5 41.0 28.1 20.1EPS adjusted 1.2 34.5 46.3 24.5 22.8
Cash Flow (RsM)Operating cash flow -462 1,130 2,020 2,093 3,038Depreciation/amortization 517 632 803 1,028 1,177Net working capital -1,420 -207 -19 -608 -255Investing cash flow -6,247 -3,338 -3,190 -3,176 -3,530Capital expenditure -2,236 -3,666 -3,190 -3,176 -3,530Acquisitions/disposals 0 0 0 0 0Financing cash flow 6,891 2,814 1,782 1,650 450Borrowings 1,743 1,384 1,594 1,700 1,300Dividends paid -348 -481 -703 -875 -1,075Change in cash 181 606 612 566 -42
Balance Sheet (RsM)Total assets 22,351 26,243 29,315 32,556 35,627Cash & cash equivalent 4,869 3,286 2,830 3,122 3,248Accounts receivable 1,423 1,744 2,138 2,375 2,558Net fixed assets 9,541 12,590 14,977 17,126 19,478Total liabilities 9,022 11,289 13,549 15,734 17,496Accounts payable 1,810 2,148 2,814 3,299 3,761Total Debt 5,322 6,706 8,300 10,000 11,300Shareholders' funds 13,329 14,954 15,766 16,823 18,130
Profitability/Solvency Ratios (%)EBITDA margin adjusted 15.1 14.0 15.6 17.0 17.9ROE adjusted 7.5 7.7 10.3 12.1 13.8ROIC adjusted 8.2 7.6 9.1 10.1 11.0Net debt to equity 3.4 22.9 34.7 40.9 44.4Total debt to capital 28.5 31.0 34.5 37.3 38.4
For further data queries on Citi’s full coverage universe please contact CIRA Data Services Asia Pacific ([email protected]) or +852-2501-2791
Investment Strategy
We rate Apollo Hospitals shares Buy/Medium Risk (1M). We are positive on the Indian healthcare delivery market and believe that Apollo is one of the best plays on the burgeoning healthcare opportunity in India. It appears poised to benefit from healthcare opportunities in India, driven by both domestic and international patients, and is ahead of most of its competitors on scale, brand recognition and service offerings. We expect Apollo's new hospitals and improvements in asset utilization to drive 19% revenue CAGR and 29% in EBIDTA over FY09-12E.
Valuation
Our target price for Apollo is Rs840. We use EV/EBIDTA vs. EBIDTA CAGR as our primary methodology to value Apollo Hospitals. We believe Indian hospitals should trade at a premium to their global counterparts given the much higher growth opportunity in the Indian market. We benchmark our target sector multiple with comparable peers in the Asia Pac region. Our current EV/EBIDTA multiple of 14x is also in the range that Apollo has traded over the last several years. At 14x Mar 11E EBITDA we arrive at our target price of Rs840.
India Investor Conference 2010 18 May 2010
Citigroup Global Markets 14
New Reserves Data Validate Confidence in Rajasthan Upside
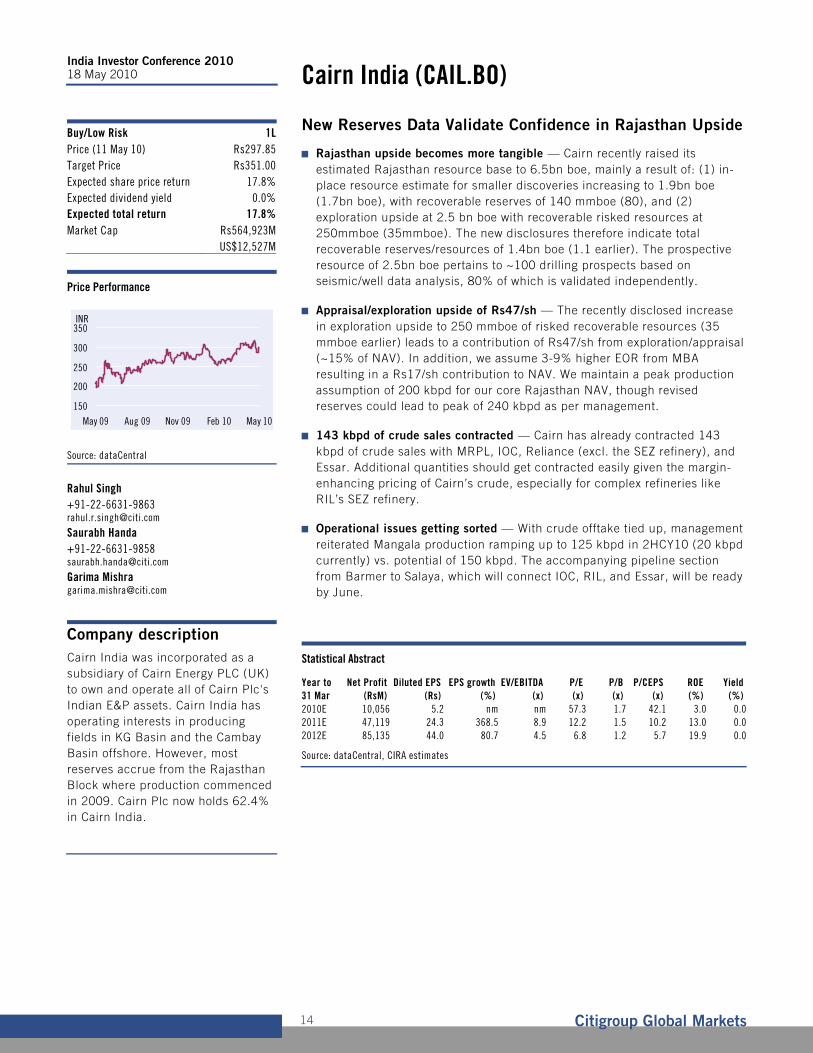
Rajasthan upside becomes more tangible — Cairn recently raised its estimated Rajasthan resource base to 6.5bn boe, mainly a result of: (1) in-place resource estimate for smaller discoveries increasing to 1.9bn boe (1.7bn boe), with recoverable reserves of 140 mmboe (80), and (2) exploration upside at 2.5 bn boe with recoverable risked resources at 250mmboe (35mmboe). The new disclosures therefore indicate total recoverable reserves/resources of 1.4bn boe (1.1 earlier). The prospective resource of 2.5bn boe pertains to ~100 drilling prospects based on seismic/well data analysis, 80% of which is validated independently.
Appraisal/exploration upside of Rs47/sh — The recently disclosed increase in exploration upside to 250 mmboe of risked recoverable resources (35 mmboe earlier) leads to a contribution of Rs47/sh from exploration/appraisal (~15% of NAV). In addition, we assume 3-9% higher EOR from MBA resulting in a Rs17/sh contribution to NAV. We maintain a peak production assumption of 200 kbpd for our core Rajasthan NAV, though revised reserves could lead to peak of 240 kbpd as per management.
143 kbpd of crude sales contracted — Cairn has already contracted 143 kbpd of crude sales with MRPL, IOC, Reliance (excl. the SEZ refinery), and Essar. Additional quantities should get contracted easily given the margin-enhancing pricing of Cairn’s crude, especially for complex refineries like RIL’s SEZ refinery.
Operational issues getting sorted — With crude offtake tied up, management reiterated Mangala production ramping up to 125 kbpd in 2HCY10 (20 kbpd currently) vs. potential of 150 kbpd. The accompanying pipeline section from Barmer to Salaya, which will connect IOC, RIL, and Essar, will be ready by June.
Statistical Abstract
Year to Net Profit Diluted EPS EPS growth EV/EBITDA P/E P/B P/CEPS ROE Yield31 Mar (RsM) (Rs) (%) (x) (x) (x) (x) (%) (%)2010E 10,056 5.2 nm nm 57.3 1.7 42.1 3.0 0.02011E 47,119 24.3 368.5 8.9 12.2 1.5 10.2 13.0 0.02012E 85,135 44.0 80.7 4.5 6.8 1.2 5.7 19.9 0.0
Source: dataCentral, CIRA estimates
Cairn India (CAIL.BO)
Buy/Low Risk 1LPrice (11 May 10) Rs297.85Target Price Rs351.00Expected share price return 17.8%Expected dividend yield 0.0%Expected total return 17.8%Market Cap Rs564,923M US$12,527M
Price Performance
150
200
250
300
350
May 09 Aug 09 Nov 09 Feb 10 May 10
INR
Source: dataCentral
Rahul Singh +91-22-6631-9863 [email protected]
Saurabh Handa +91-22-6631-9858 [email protected]
Garima Mishra [email protected]
Company description
Cairn India was incorporated as a subsidiary of Cairn Energy PLC (UK) to own and operate all of Cairn Plc's Indian E&P assets. Cairn India has operating interests in producing fields in KG Basin and the Cambay Basin offshore. However, most reserves accrue from the Rajasthan Block where production commenced in 2009. Cairn Plc now holds 62.4% in Cairn India.

India Investor Conference 2010 18 May 2010
Citigroup Global Markets 15
Cairn India (CAIL.BO): Financial Summary
Fiscal year end 31-Mar 2009 2010E 2011E 2012E
Valuation RatiosP/E adjusted (x) na 57.3 12.2 6.8EV/EBITDA adjusted (x) na 42.5 8.6 4.2P/BV (x) na 1.7 1.5 1.2Dividend yield (%) na 0.0 0.0 0.0Per Share Data (Rs)EPS adjusted na 5.20 24.34 43.98EPS reported na 5.20 24.34 43.98BVPS na 174.67 199.01 243.00DPS na 0.00 0.00 0.00
Profit & Loss (RsM)Net sales na 16,154 70,738 130,775Operating expenses na -6,262 -15,656 -28,097EBIT na 9,892 55,082 102,678Net interest expense na -3,371 -3,150 -3,080Non-operating/exceptionals na 149 140 137Pre-tax profit na 6,670 52,072 99,735Tax na 3,386 -4,953 -14,600Extraord./Min.Int./Pref.div. na 0 0 0Reported net income na 10,056 47,119 85,135Adjusted earnings na 10,056 47,119 85,135Adjusted EBITDA na 13,527 64,411 118,894Growth Rates (%)Sales na na 337.9 84.9EBIT adjusted na na 456.9 86.4EBITDA adjusted na na 376.2 84.6EPS adjusted na na 368.5 80.7
Cash Flow (RsM)Operating cash flow na 14,430 56,215 101,248Depreciation/amortization na 3,635 9,329 16,216Net working capital na 738 -233 -103Investing cash flow na -46,080 -36,900 -29,920Capital expenditure na -46,080 -36,900 -29,920Acquisitions/disposals na 0 0 0Financing cash flow na -5,164 4,350 10,050Borrowings na -5,164 4,350 10,050Dividends paid na 0 0 0Change in cash na -36,814 23,665 81,378
Balance Sheet (RsM)Total assets na 398,301 453,908 558,966Cash & cash equivalent na 28,966 70,800 166,069Accounts receivable na 8,994 10,063 10,306Net fixed assets na 107,148 119,852 129,399Total liabilities na 60,222 68,710 88,633Accounts payable na 18,456 19,292 19,432Total Debt na 38,400 42,750 52,800Shareholders' funds na 338,080 385,199 470,333
Profitability/Solvency Ratios (%)EBITDA margin adjusted na 83.7 91.1 90.9ROE adjusted na 3.0 13.0 19.9ROIC adjusted na 3.8 14.0 23.9Net debt to equity na 2.8 -7.3 -24.1Total debt to capital na 10.2 10.0 10.1
For further data queries on Citi’s full coverage universe please contact CIRA Data Services Asia Pacific ([email protected]) or +852-2501-2791
Investment Strategy
We rate Cairn India as Buy/Low Risk (1L) with a target price of Rs351. Cairn India's ownership of valuable oil reserves in Rajasthan has started generating steady cash flows from FY10E, besides having potential to generate further upside from EOR and exploration. Cairn India's valuations are among the most highly leveraged to crude among global E&P peers, which together with operational momentum and E&A upside offsets the inherent operational risks. Given its excellent track record in exploration and execution, we believe that there exists a reasonable upside from current levels.
Valuation
We base our target price of Rs351 on estimated NAVs of under-development and producing assets and incorporating recovery upside. Given Cairn's leverage to crude, our target of Rs351 is based on an average NAV value of Rs334 derived using two different crude scenarios: 1) CIRA global crude price forecasts yielding a base NAV of Rs319, and 2) Crude futures curve yielding an NAV of Rs350. In addition, we ascribe a 5% premium to the blended NAV to build in exploration potential in other blocks and to factor in the potential for a positive surprise in project development targets in the Rajasthan Block. We believe that the stock would partially factor in a combination of longer-term fundamentals and near-term momentum in underlying crude prices, till it can establish a track record of success outside Rajasthan. Key assumptions for our NAV analysis are: crude realization at a 12% discount to Brent; cess at Rs2,550/MT; plateau production at 200kbpd in 2H12; and total life-of-field development capex (including pipeline) of US$4.35bn.

India Investor Conference 2010 18 May 2010
Citigroup Global Markets 16
Store level break even in FY11E; Overall break even in 2-3 years — In FY09 retailing had cash losses of ~ Rs270mn/month. Signs of improvement are visible with cash losses down to Rs130mn/month now and should come down to Rs100mn/month by Jun10. At these levels company will achieve break even at the store level. However, cash expenses are required at distribution level (Rs60mn/month) and corporate level (Rs25-30mn/month) and this will continue for some time. Overall company level break even will occur after 2-3 years.
Update on real estate business — Rs2bn order for Spencer Galleria mall given to L&T. Will fund capex with 60:40 D:E ratio and CESC will invest equity of Rs800mn. Mall will have retail area of 0.4mnsqft and car park of 0.3mnsqft. Company expects average rentals of Rs100/sqft/month. Expect rentals of Rs450mn/year out of which Rs40mn will be used to reduce expenses under parent business.
Update on Chandrapur and Haldia — On Chandrapur (600MW) 100% stake has been acquired. BoP given to Punj Lloyd and BTG given to Shanghai Electric. Zero date is Mar10 and the CoD will be Mar13. The plant will be run on 50% merchant and 50% regulated tariffs. For Haldia (600MW) have acquired 287 acres and 40 acres yet to be acquired. Zero date will be Sept 10 and CoD by Sep 13.
Update on Orissa and Jharkand — For Jharkhand (1000MW) has Mahuagarhi coal block (110 MT) which is enough for 750MW. Progress is slow due to political uncertainties but will pick up once new government comes in. For Orissa (1320MW) have acquired 450 acres and 53 acres remains to be acquired. Expects to get coal linkage whenever next coal linkage committee meeting takes place.
Fundraising plans — CESC’s cash flows are enough to fund Chandrapur, Haldia and retailing losses. CESC will have to raise equity capital either at subsidiary or parent level to fund capex if Orissa and Jharkhand projects are revived.
Statistical Abstract
Year to Net Profit Diluted EPS EPS growth EV/EBITDA P/E P/B P/CEPS ROE Yield31 Mar (RsM) (Rs) (%) (x) (x) (x) (x) (%) (%)2008A 3,554 28.4 na 10.7 13.7 1.6 9.3 na 1.02009A 4,097 32.8 15.3 9.0 11.9 1.4 8.3 12.9 1.02010E 4,611 36.9 12.5 7.6 10.5 1.3 7.2 12.9 1.02011E 5,183 41.5 12.4 6.9 9.4 1.1 6.5 12.9 1.02012E 5,385 43.1 3.9 6.5 9.0 1.0 6.2 12.0 1.0
Source: Company, Citi Investment Research and Analysis estimates
CESC (CESC.BO)
Buy/Medium Risk 1MPrice (11 May 10) Rs388.90Target Price Rs514.00Expected share price return 32.2%Expected dividend yield 1.0%Expected total return 33.2%Market Cap Rs48,588M US$1,077M
Price Performance
200250300350400450500550600
May 09 Aug 09 Nov 09 Feb 10 May 10
INR
Source: dataCentral
Venkatesh Balasubramaniam +91-22-6631-9864 [email protected]
Company description
CESC is a vertically integrated electric utility engaged in the business of generation, transmission and distribution of electricity to consumers in its licensed area, which covers Kolkata and Howrah. It currently has four power plants with a generation capacity of 1225MW servicing 2.2m consumers in its 567sqkm license area. CESC has a 26% stake in Integrated Coal Mining Ltd (ICML) (74% held by RPG group companies). ICML supplies c.2.5m MTPA of coal to CESC (52% of CESC's coal requirement) with the remaining being sourced from Coal India and imported coal from Indonesia.

India Investor Conference 2010 18 May 2010
Citigroup Global Markets 17
CESC (CESC.BO): Financial Summary
Fiscal year end 31-Mar 2008 2009 2010E 2011E 2012E
Valuation RatiosP/E adjusted (x) 13.7 11.9 10.5 9.4 9.0EV/EBITDA adjusted (x) 9.8 8.9 7.4 6.6 6.2P/BV (x) 1.6 1.4 1.3 1.1 1.0Div idend yield (%) 1.0 1.0 1.0 1.0 1.0Per Share Data (Rs)EPS adjusted 28.44 32.79 36.90 41.48 43.10EPS reported 28.44 32.79 36.90 41.48 43.10BVPS 237.19 270.87 303.10 339.89 378.31DPS 4.00 4.00 4.00 4.00 4.00
Profit & Loss (RsM)Net sales 27,750 30,313 33,410 34,303 35,477Operating expenses -23,911 -25,938 -27,582 -27,729 -28,697EBIT 3,839 4,376 5,829 6,574 6,780Net interest expense -1,363 -1,410 -1,874 -1,930 -1,892Non-operating/exceptionals 1,554 1,683 1,600 1,600 1,600Pre-tax profit 4,029 4,649 5,555 6,244 6,488Tax -476 -552 -944 -1,062 -1,103Extraord./Min.Int./Pref.div. 0 0 0 0 0Reported net income 3,554 4,097 4,611 5,183 5,385Adjusted earnings 3,554 4,097 4,611 5,183 5,385Adjusted EBITDA 5,523 6,125 7,928 8,915 9,203Growth Rates (%)Sales 11.7 9.2 10.2 2.7 3.4EBIT adjusted -7.7 14.0 33.2 12.8 3.1EBITDA adjusted -3.8 10.9 29.4 12.4 3.2EPS adjusted -20.3 15.3 12.5 12.4 3.9
Cash Flow (RsM )Operating cash flow 5,904 3,580 4,085 5,261 6,095Depreciation/amortization 1,685 1,749 2,100 2,341 2,424Net work ing capital 666 -2,266 -2,625 -2,262 -1,713Investing cash flow -9,776 -10,927 -5,400 -3,900 -3,000Capital expenditure -6,493 -13,519 -5,400 -3,900 -3,000Acquis itions/disposals 0 0 0 0 0Financing cash flow 5,447 8,595 2,115 -485 -585Borrowings -1,695 7,693 2,000 -500 -500Div idends paid -585 -585 -585 -585 -585Change in cash 1,575 1,249 800 876 2,510
Balance Sheet (RsM)Total assets 67,462 86,290 94,784 99,739 105,070Cash & cash equivalent 9,864 12,510 13,311 14,187 16,697Accounts receivable 3,152 3,889 4,286 4,400 4,551Net fixed assets 42,148 53,919 57,219 58,778 59,355Total liabilit ies 37,826 52,446 56,913 57,271 57,801Accounts payable 10,931 15,645 16,950 17,149 17,659Total Debt 16,288 23,981 25,981 25,481 24,981Shareholders' funds 29,636 33,845 37,871 42,469 47,268
Profitability /Solvency Ratios (%)EBITDA margin adjusted 19.9 20.2 23.7 26.0 25.9ROE adjusted 14.4 12.9 12.9 12.9 12.0ROIC adjusted 8.7 8.0 8.4 8.7 8.5Net debt to equity 21.7 33.9 33.5 26.6 17.5Total debt to capital 35.5 41.5 40.7 37.5 34.6
For further data queries on Citi’s full coverage universe please contact CIRA Data Services Asia Pacific ([email protected]) or +852-2501-2791
Investment Strategy
We rate CESC as Buy/Medium Risk (1M). Having turned from a loss of Rs1.3bn in FY99 to profit of Rs4.1bn in FY09, the power business, aided by the West Bengal Electricity Regulatory Commission's (WBERC's) benign tariff orders, continues to create value. However, we have been worried about the company's retailing business which on merger with CESC led to a 37% equity dilution and has been a drain on CESC power cash flows. We view that the retail business could see some improvement in FY10E, although losses are expected to continue. This aside, we had also been worried about the slow progress in the power expansion projects. However, developments on the power business in the last six months have impressed us, including: (1) acquisition of 600MW Chandrapur project, and (2) significant progress on the Haldia Phase - I project. We view that both these projects will be lucrative and are likely to deliver project IRRs of 13%-14% and equity IRRs of 19%-20%.
Valuation
Our Rs514 target price is based on a sum-of-the-parts (SOTP) methodology. We value the power business using a DCF at Rs410 (WACC = 12.1% and g = 2%). We also value the Chandrapur and Haldia projects using DCF (Cost of Equity = 13%) and apply a 15% discount in the interest of conservatism. The negative NPV of the power business support to the retail business is Rs75. We value CESC's 94.72% stake in Spencer's Retail at an EV/Sales of 1.0x FY09, implying a value of Rs63

India Investor Conference 2010 18 May 2010
Citigroup Global Markets 18
Broad Exposure Supports Structural Growth
Healthy advertising growth — Ad market turnaround has been visible over the last two quarters, and management has spoken about ad rates hikes of ~10%-12%. One needs to understand the drivers of growth going forward, discuss details on advertiser’s profile, increasing proportion of color ads, and potential of yield improvement. Impact of the addition of the Gwalior edition to the FY11 ad/subscription revenues is another consideration.
Newsprint tailwinds? — Newsprint is the largest cost item for DBCL. With newsprint prices ~25% off the peak, margins rebounded sharply in FY10. The current outlook on newsprint prices and factors driving demand supply dynamics need to be understood. Higher proportion of indigenous newsprint (~82% now, ~57% in FY06) and an appreciating rupee should aid margins to some extent.
Bihar and Jharkhand launch — Existing cover prices for the incumbents in these markets is very high at ~Rs4. Premium pricing creates an opportunity to break in. This, coupled with low penetration levels, makes the expansion attractive. Capex would be to the tune of Rs700-750m. Strategically, entry into high growth regional markets (current ad market size of ~Rs2bn) is a long-term positive, however, the extent of losses and launch strategy could be discussed.
Radio business merger — The recent radio business demerger from SMEL and merger with itself does not materially impact consolidated financials, given that its contribution is <5% of consolidated revenues. Management believes this transaction will offer better synergies for advertisers. We think there could be tax benefits accruing to DBCL, given that SMEL has accumulated losses. Management views on regulatory changes permitting news on FM radio and Phase 3 bidding process could be looked into.
Stable operating margins — Management expects stable EBITDA margins of ~30%-33% in the near- to medium-term, despite a rise in newsprint costs. Discussions on cost rationalization initiatives, improving contribution from some editions, buoyancy in advertising/circulation revenues, etc. should help with understanding the drivers of future profit growth.
Statistical Abstract
Year to Net Profit Diluted EPS EPS growth EV/EBITDA P/E P/B P/CEPS ROE Yield31 Mar (RsM) (Rs) (%) (x) (x) (x) (x) (%) (%)2008A 759 4.5 na 27.9 53.9 18.6 41.8 na 0.22009A 477 2.8 -37.1 34.5 85.8 15.9 53.4 20.0 0.02010E 1,906 10.5 271.5 14.0 23.1 6.3 18.9 39.9 0.42011E 2,411 13.3 26.5 11.5 18.3 4.9 15.5 30.0 0.62012E 2,727 15.0 13.1 10.1 16.1 3.8 13.8 26.5 0.6
Source: Company Reports and CIRA Estimates
DB Corp (DBCL.BO)
Buy/Low Risk 1LPrice (11 May 10) Rs242.50Target Price Rs280.00Expected share price return 15.5%Expected dividend yield 0.4%Expected total return 15.9%Market Cap Rs44,018M US$976M
Price Performance
205
225
245
265
May 09 Aug 09 Nov 09 Feb 10 May 10
INR
Source: dataCentral
Surendra Goyal, CFA +91-22-6631-9870 [email protected] Aditya Mathur +91-22-6631-9841 [email protected]
Company description
DB Corp is one of India's leading publishing houses, with newspapers cumulatively commanding the highest readership in the country (average daily readership of 15.5m). The company benefits from a strong position in key non-metro markets like Madhya Pradesh, Chattisgarh, Rajasthan, Gujarat, Punjab and Haryana. In total, it publishes seven newspapers, 48 newspaper editions and around 130 sub-editions in three languages (Hindi, Gujarati and English) in 11 Indian states. The company has interests in radio under the MY FM brand, operating in 17 FM radio stations across mini metros and small towns. Another subsidiary, I Media Corp provides exposure to internet and SMS portals.

India Investor Conference 2010 18 May 2010
Citigroup Global Markets 19
DB Corp (DBCL.BO): Financial Summary
Fiscal year end 31-Mar 2008 2009 2010E 2011E 2012E
Valuation RatiosP/E adjusted (x) 53.9 85.8 23.1 18.3 16.1EV/EBITDA adjusted (x) 27.6 35.4 13.4 11.4 9.9P/BV (x) 18.6 15.9 6.3 4.9 3.8Dividend yield (%) 0.2 0.0 0.4 0.6 0.6Per Share Data (Rs)EPS adjusted 4.50 2.83 10.50 13.28 15.02EPS reported 4.50 2.83 10.50 13.28 15.02BVPS 13.02 15.27 38.42 49.99 63.30DPS 0.50 0.00 1.00 1.50 1.50
Profit & Loss (RsM)Net sales 8,506 9,490 10,514 11,956 13,502Operating expenses -7,018 -8,426 -7,419 -8,468 -9,623EBIT 1,488 1,063 3,095 3,489 3,879Net interest expense -281 -402 -295 -48 62Non-operating/exceptionals 121 120 129 166 196Pre-tax profit 1,328 782 2,930 3,607 4,137Tax -630 -423 -1,099 -1,226 -1,407Extraord./Min.Int./Pref.div. 61 118 74 31 -4Reported net income 759 477 1,906 2,411 2,727Adjusted earnings 759 477 1,906 2,411 2,727Adjusted EBITDA 1,709 1,353 3,516 3,921 4,336Growth Rates (%)Sales 27.9 11.6 10.8 13.7 12.9EBIT adjusted 105.2 -28.5 191.1 12.7 11.2EBITDA adjusted 102.3 -20.8 159.8 11.5 10.6EPS adjusted 37.2 -37.1 271.5 26.5 13.1
Cash Flow (RsM)Operating cash flow 2,267 1,437 2,194 2,328 2,623Depreciation/amortization 220 290 421 433 457Net working capital 1,057 342 -297 -398 -303Investing cash flow -1,330 -3,773 -769 -693 -881Capital expenditure -1,079 -3,138 -604 -811 -1,140Acquisitions/disposals 0 0 0 0 0Financing cash flow -328 1,980 -8 -1,560 -1,310Borrowings -341 2,195 -2,500 -1,250 -1,000Dividends paid -99 0 -207 -310 -310Change in cash 609 -356 1,416 75 431
Balance Sheet (RsM)Total assets 7,936 10,914 12,794 13,836 15,519Cash & cash equivalent 808 452 1,868 1,943 2,374Accounts receivable 1,755 1,774 1,959 2,293 2,589Net fixed assets 3,623 6,471 6,655 7,033 7,715Total liabilities 5,497 8,213 5,696 4,637 3,904Accounts payable 0 0 0 0 0Total Debt 3,436 5,631 3,131 1,881 881Shareholders' funds 2,439 2,701 7,098 9,199 11,615
Profitability/Solvency Ratios (%)EBITDA margin adjusted 20.1 14.3 33.4 32.8 32.1ROE adjusted 39.3 20.0 39.9 30.0 26.5ROIC adjusted 15.8 9.6 24.1 25.4 25.3Net debt to equity 107.8 191.8 17.8 -0.7 -12.9Total debt to capital 58.5 67.6 30.6 17.0 7.1
For further data queries on Citi’s full coverage universe please contact CIRA Data Services Asia Pacific ([email protected]) or +852-2501-2791
Investment Strategy
We rate DBCL as Buy/Low Risk (1L) with a target price of Rs280. The company is well placed in key regional markets, growing at a faster pace than the industry average. Superior execution skills, localization of content/advertising and scale result in strong competitive positioning. We expect 79% PAT CAGR over FY09-12E, backed by multiple growth drivers. Strong growth in the Indian advertising market on strong economic growth, sustainable ad rate hikes, and breakeven of maturing editions are significant drivers. With newsprint prices still ~30% off peak levels, margins have rebounded sharply - we expect ~33% EBITDA margin in FY10. In FY11, we expect stable operating margins as we think healthy advertising growth (~15% YoY), better cost controls and positive contribution from newer editions should be able to offset newsprint increase.
Valuation
Our Rs280 target price is based on 21x FY11E EPS, at a premium to the Asian peer average. Strong franchise, presence in growth markets and advertising upturn should help DBCL sustain premium valuations. Asian publishing companies trade at a FY11E P/E of ~15x with 3-year earnings CAGR (FY09-12E) of 2%. Our P/E target multiple of 21x FY11E earnings for DBCL seems reasonable given its ~75% EPS CAGR (FY09-12E). The Indian print media companies trade at 11-22x FY11E P/E based on consensus earnings estimates. Given its good visibility on revenues and a good track record of earnings, we believe earnings-based valuations are the best way to value DBCL.

India Investor Conference 2010 18 May 2010
Citigroup Global Markets 20
Best Poised for Commercial Recovery
Traction seen in pre-sales and execution as construction ramps up — DLF is looking at ~3.5msf pre-sales in 4Q (vs. 3.1 msf in 3Q and 2.7msf in 2Q), targeting ~12msf for FY10. Further, ramp-up in construction is generating faster cash-flows across its projects and is likely to see big step-up in 4Q (~4msf vs. 2msf in 3Q).
Commercial showing more promising signs of recovery — Management expects to lease ~1msf in 4Q, with enquiries continuing to pick up. It presently has ~0.5msf of ready inventory and ~2msf of space ready for delivery in six months. While leasing rates have stabilized, the company is still not looking at ramping up construction in commercial properties (~presently 17msf).
DAL–DLF integration — The integration is to be completed by the end of FY10. With a consolidated strong rental annuity of Rs15bn by FY11E (of which ~Rs7bn is currently securitized), the company continues to explore possibilities of a potential DAL listing in 1H FY11.
De-leveraging remains a priority, but slow progress — O/S net-debt as of Dec-2009 stood at Rs128bn (~Rs27bn is due till Mar-2011 and ~Rs10bn due in Dec-2010). Integration with Caraf-DAL added another ~Rs30bn and recent buy-out in SC Asia would take total debt to ~Rs190 bn. D/E of 0.8 vs. 0.6 earlier would keep deleveraging in the priority list. That said, the company is focusing on de-leveraging through its non-core asset sales and by increasing operating cash flows, although the progress has been slow.
Our Top Pick; key reasons — 1) Pre-sales momentum, construction activities ramping up; 2) Increased visibility on new launches; 3) Commercial leasing recovery, looking more promising now, will act as a boon; 4) DAL-DLF integration seeing some direction remains a potential catalyst; and 5) Valuations look attractive at a 46% discount to estimated NAV.
Statistical Abstract
Year to Net Profit Diluted EPS EPS growth P/E P/B ROE Yield31 Mar (RsM) (Rs) (%) (x) (x) (%) (%)2008A 78,120 45.8 na 6.4 2.7 na 1.42009A 46,292 27.3 -40.5 10.8 2.2 22.3 0.02010E 19,905 11.7 -57.0 25.2 2.0 8.4 0.02011E 24,208 14.3 21.6 20.7 1.8 9.3 0.02012E 32,588 19.2 34.6 15.4 1.6 11.3 0.0
Source: Company Reports and CIRA Estimates
DLF (DLF.BO)
Buy/Low Risk 1LPrice (11 May 10) Rs295.00Target Price Rs464.00Expected share price return 57.3%Expected dividend yield 0.0%Expected total return 57.3%Market Cap Rs500,730M US$11,104M
Price Performance
100
200
300
400
500
May 09 Aug 09 Nov 09 Feb 10 May 10
INR
Source: dataCentral
Ashish Jagnani +91-22-6631-9861 [email protected]
Vidhi Sodhani +91-22-6631-9854 [email protected]
Company description
One of India's oldest real estate developers established in Delhi in 1946, DLF has continued to expand and diversify its real estate businesses, and is among the largest developers in India. It has historically built its businesses in Delhi and adjoining areas, known as the National Capital Region (NCR) and has diversified into other geographic locations over the past few years, with a focus on the Northern India belt, Kolkata, Mumbai, Chennai, and a number of other large and rapidly growing cities. DLF enjoys a strong brand franchise with a good track record in execution and delivery. This is the flagship company of the KP Singh family, with the founders holding a 78.6% stake.

India Investor Conference 2010 18 May 2010
Citigroup Global Markets 21
DLF (DLF.BO): Financial Summary
Fiscal year end 31-Mar 2008 2009 2010E 2011E 2012E
Valuation RatiosP/E adjusted (x) 6.4 10.8 25.2 20.7 15.4P/E reported (x) 6.4 10.8 25.2 20.7 15.4P/BV (x) 2.7 2.2 2.0 1.8 1.6Dividend yield (%) 1.4 0.0 0.0 0.0 0.0Per Share Data (Rs)EPS adjusted 45.82 27.28 11.73 14.26 19.20EPS reported 45.82 27.28 11.73 14.26 19.20BVPS 109.92 134.09 145.82 160.08 179.28NAVps ordinary na na na na naDPS 4.00 0.00 0.00 0.00 0.00
Profit & Loss (RsM)Net operating income (NOI) 100,148 59,472 33,603 40,684 54,028G&A expenses -2,998 -4,592 -4,821 -5,786 -6,943Other Operating items -636 -2,566 -2,988 -3,262 -3,699EBIT including associates 96,514 52,315 25,793 31,637 43,386Non-oper./net int./except. -636 1,394 747 641 65Pre-tax profit 95,878 53,708 26,540 32,278 43,451Tax -17,391 -7,115 -6,635 -8,069 -10,863Extraord./Min. Int./Pref. Div. -367 -302 0 0 0Reported net income 78,120 46,292 19,905 24,208 32,588Adjusted earnings 78,120 46,292 19,905 24,208 32,588Adjusted EBIT 96,250 52,525 25,793 31,637 43,386Adjusted EBITDA 97,151 54,881 28,781 34,898 47,085Growth Rates (%)NOI 527.9 -40.6 -43.5 21.1 32.8EBIT adjusted 572.2 -45.4 -50.9 22.7 37.1EPS adjusted 259.6 -40.5 -57.0 21.6 34.6
Cash Flow (RsM)Operating cash flow -26,960 -4,560 85,691 11,454 20,688Depreciation/amortization 901 2,355 2,988 3,262 3,699Net working capital -105,815 -51,290 62,797 -16,016 -15,599Investing cash flow -60,142 -42,020 -16,540 -2,816 -10,591Capital expenditure -47,678 -39,450 -17,065 -2,816 -10,591Acquisitions/disposals 0 0 0 0 0Financing cash flow 104,368 37,880 -78,201 -7,000 -7,000Borrowings 23,177 41,890 -78,201 -7,000 -7,000Dividends paid -7,979 -4,010 0 0 0Change in cash 17,266 -8,700 -9,050 1,638 3,097
Balance Sheet (RsM)Total assets 396,065 489,320 433,827 467,966 510,354Cash & cash equivalent 21,421 11,956 5,000 6,639 9,735Net fixed assets 100,031 136,006 150,082 149,636 156,529Total liabilities 195,287 241,445 166,048 175,979 185,778Total Debt 122,771 163,201 85,000 78,000 71,000Shareholders' funds 200,778 247,874 267,779 291,987 324,576
Profitability/Solvency RatiosEBIT margin adjusted (%) 66.7 52.3 39.5 37.0 39.0ROE adjusted (%) 73.2 22.3 8.4 9.3 11.3ROA adjusted (%) 27.1 10.5 4.3 5.4 6.7Net debt to equity (%) 50.5 61.0 29.9 24.4 18.9Interest coverage (x) 31.3 15.4 10.5 19.5 28.7
For further data queries on Citi’s full coverage universe please contact CIRA Data Services Asia Pacific ([email protected]) or +852-2501-2791
Investment Strategy
We rate DLF as Buy/Low Risk (1L), with a target price of Rs464. DLF's proactive measures to address receivable worries, boost pre-sales by cutting prices/launching city centre projects, along with steps to ensure liquidity, has differentiated it. Further, promoters bringing in additional capital to address liquidity concerns without dilution augur well, removing concerns about high receivables from DLF Assets (DAL). Given DLF's execution track record, growing rental income and geographic-asset mix, we believe it is strongly positioned vs. peers. We recommend a Buy rating for the stock and believe it should be a core holding for exposure to the Indian real estate sector.
Valuation
Our target price of Rs464 is based on a 15% discount to our March 2010E NAV of Rs546. Our NAV includes Rs455 for the development portfolio and Rs91 for other asset holdings and new JV businesses (Rs73/sh for the existing 11m sq ft of leased assets and 7.2m sq ft of plots and Rs18/sh for DLF's share in the hotel JV). The lower discount vs. peers (30%-35%) is attributed to: 1) Relatively healthy balance sheet vs. peers; 2) Superior business model, strong execution track record; and 3) Relatively better disclosure standards.
Our March 2010E NAV is based on: 1) 20% decline in prices from peak levels; 2) Development volume of 397msf; 3) Cap rate of 10% for commercial/IT Park, IT SEZs in Super Metros and Metros, and 11% for other locations; 4) Average cost of capital of 13% given tight liquidity; and 5) A tax rate of 25%

India Investor Conference 2010 18 May 2010
Citigroup Global Markets 22
Adding Retail to its Tale
Brokerage franchise — Edelweiss is among the larger institutional brokerage firms in India, with a strong domestic investment-banking business. It has a large market share in the institutional broking segment, with an especially strong presence in the derivatives segment. The recently purchased "Anagram" platform (50% of own volumes) provides it meaningful scale in the retail segment and access to a large and underleveraged distribution network (137 branches, 1,300 franchisees and 180,000 customers), which should substantially improve its revenue mix and return profile.
Institutional player –backed by arbitrage trading — Edelweiss' institutional broking business is backed by investment banking, which combines capital issuances, distribution, private-equity syndication, and structured finance. Edelweiss also runs a market leading treasury portfolio focused on low risk, arbitrage, and short-term trading opportunities.
Broadening product offering through new initiatives — Edelweiss’ new initiatives, meant to build on its existing franchise and broaden its revenue mix, are in the areas of wealth management, asset management and life insurance businesses. It recently launched its domestic asset-management business, which leverages off its expertise in the alternative asset-management segment.
Insurance – long-term play — Edelweiss also recently announced a life insurance JV with Tokio Marine (74% stake with Edelweiss, will be diluted to 49% on regulatory approvals). We believe this adds to Edelweiss’ expanding retail product suite and could be a longer-term value driver.
Large capital base, stable financing business — The company is well positioned to capture any upside in overall industry volumes due to its relatively large capital base that can be leveraged quickly. Edelweiss also has a securities financing business which provides relative stability to its revenue profile.
Risks — Equity market volatility, competitive pressures, possible losses on treasury portfolio, margin finance risks, interest rates, execution, and regulatory risks.
Statistical Abstract
Year to Net profit EPS EPS Growth PE PB ROAE ROAA Div Yield31 Mar (RsM) (Rs) (%) (x) (x) (%) (%) (%)FY08 2,732 46 73.2 9.0 1.7 23 8.5 0.5FY09 1,864 25 -45.4 16.5 1.5 10 3.8 0.7FY10E 2,798 37 50.0 11.0 1.4 13 4.9 1.0FY11E 3,441 46 23.0 9.0 1.2 14 4.5 1.1FY12E 4,118 55 19.7 7.5 1.1 15 4.5 1.2
Source: Company Data, Citi Investment Research and Analysis Estimates
Edelweiss Capital (EDEL.BO)
Buy/Medium Risk 1MPrice (11 May 10) Rs411.75Target Price Rs612.00Expected share price return 48.6%Expected dividend yield 1.0%Expected total return 49.6%Market Cap Rs30,919M US$686M
Price Performance
300350400450500550
May 09 Aug 09 Nov 09 Feb 10 May 10
INR
Source: dataCentral
Manish Chowdhary, CFA +91-22-6631-9853 [email protected] Aditya Narain, CFA +91-22-6631-9879 [email protected] Pooja.Kapur [email protected]
Company description
Edelweiss, founded in 1995, started as a niche investment bank that focused on private-equity syndications. It was co-founded by Rashesh Shah, MD and CEO, and Venkat Ramaswamy, ED and Co-Head – Investment Banking. Edelweiss has over the years built a diversified product offering in the institutional segment through broking and investment-banking services, backed by a strong treasury and arbitrage trading portfolio. Edelweiss also offers financing against shares, asset and wealth management, and insurance broking. It operates its various businesses directly and through various subsidiaries, which are consolidated under the parent.

India Investor Conference 2010 18 May 2010
Citigroup Global Markets 23
Edelweiss Capital (EDEL.BO): Financial Summary
2008 2009 2010E 2011E 2012E
Valuation RatiosP/E adjusted (x) 9.0 16.5 11.0 9.0 7.5P/E reported (x) 9.0 16.5 11.0 9.0 7.5P/BV (x) 1.7 1.5 1.4 1.2 1.1P/Adjusted BV diluted (x) 1.7 1.5 1.4 1.2 1.1Dividend yield (%) 0.5 0.7 1.0 1.1 1.2Per Share Data (Rs)EPS adjusted 45.60 24.88 37.33 45.92 54.95EPS reported 45.60 24.88 37.33 45.92 54.95BVPS 246.64 267.95 300.69 341.44 390.64Tangible BVPS 246.64 267.95 300.69 341.44 390.64Adjusted BVPS diluted 246.64 267.95 300.69 341.44 390.64DPS 2.00 3.00 4.00 4.50 5.00
Profit & Loss (RsM)Net interest income 159 1,978 1,701 2,370 2,755Fees and commissions 1,400 359 805 1,058 1,292Other operating Income 7,318 5,332 6,789 8,028 9,579Total operating income 8,877 7,668 9,295 11,456 13,626Total operating expenses -4,311 -4,323 -4,732 -5,799 -6,886Oper. profit bef. provisions 4,566 3,345 4,562 5,657 6,740Bad debt provisions -100 -55 -40 -50 -50Non-operating/exceptionals 0 0 0 0 0Pre-tax profit 4,467 3,290 4,522 5,607 6,690Tax -1,540 -1,199 -1,583 -1,962 -2,342Extraord./Min. Int./Pref. Div. -195 -227 -142 -203 -231Attributable profit 2,732 1,864 2,798 3,441 4,118Adjusted earnings 2,732 1,864 2,798 3,441 4,118Growth Rates (%)EPS adjusted 73.2 -45.4 50.0 23.0 19.7Oper. profit bef. prov. 162.8 -26.7 36.4 24.0 19.2
Balance Sheet (RsM)Total assets 51,619 45,536 69,636 84,580 97,466Avg interest earning assets 30,347 45,991 54,828 73,728 87,117Customer loans 12,125 7,625 10,125 12,125 12,125Gross NPLs 0 0 0 0 0Liab. & shar. funds 51,619 45,536 69,636 84,580 97,466Total customer deposits 0 0 0 0 0Reserve for loan losses 0 0 0 0 0Shareholders' equity 18,476 20,081 22,534 25,588 29,275
Profitability/Solvency Ratios (%)ROE adjusted 22.5 9.7 13.1 14.3 15.0Net interest margin 0.5 4.3 3.1 3.2 3.2Cost/income ratio 48.6 56.4 50.9 50.6 50.5Cash cost/average assets 13.4 8.9 8.2 7.5 7.6NPLs/customer loans 0.0 0.0 0.0 0.0 0.0Reserve for loan losses/NPLs na na na na naBad debt prov./avg. cust. loans 1.4 0.6 0.5 0.4 0.4Loans/deposit ratio na na na na naTier 1 capital ratio na na na na naTotal capital ratio na na na na na
For further data queries on Citi’s full coverage universe please contact CIRA Data Services Asia Pacific ([email protected]) or +852-2501-2791
Investment Strategy
We rate Edelweiss as Buy/Medium Risk (1M). It is among the largest institutional brokerages in India and enjoys a favorable market positioning and a strong management team. In a rising equity market this should create strong leverage in its operating revenues. Moreover, it has a large capital base, which can be leveraged quickly to be deployed in its market leading arbitrage business. It currently trades at about a 20%-30% discount to peers. Capital market volumes have increased substantially over the recent months and have more than doubled from the troughs. While we are cautious of extrapolating current volumes into the future, even at 10%-15% lower volumes than currently, we expect industry volumes to grow at 20%-25% YoY in FY10E. We believe the initial volumes pickup will largely come from the institutional segment, which is likely to benefit Edelweiss disproportionately. Also we anticipate higher primary market activities, which will yield revenues and earnings pick up. Moreover, we expect cost pressures to lag revenue growth, leading to an expansion in profit margins in FY10E.
Valuation
Our Rs612 target price is based on a SOTP valuation. We use a 15x 1yr Fwd PE multiple to value its brokerage business, a 15% discount to the broader Sensex multiple (we argue brokerages should trade at discounts in a strong market and vice versa), which values the brokerage and related businesses at Rs336/sh. We value the financing business and arbitrage businesses at 1.25x 1yr Fwd BV, valuing them at Rs89/sh and Rs187/sh respectively. We value the brokerage/related businesses at a discount to broader market earnings multiples in the current environment. We believe that such cyclical businesses should trade at a discount to the market during a strong market environment and vice versa.

India Investor Conference 2010 18 May 2010
Citigroup Global Markets 24
Leveraged to Recovery, But Valuations Factor in Upside
Refining outlook better; complexity provides cushion — Expansions and associated increase in complexity will improve product slate (Euro IV/V fuels to comprise 39%/54% of product slate post-phase I/II) and enhance crude diet (by processing more heavy, sour, and acidic crudes) for Essar Oil (EOL). Full-fledged recovery is contingent on return of demand growth and capacity rationalization (complete by 2011), but in our view the cycle has bottomed and is likely to show moderate improvement. Timing of Phase I (ahead of new capacities in the Middle East) and increase in complexity provides a further cushion.
Capex reasonable; phase I on track for March-11 completion — EOL is expanding its 10.5 MMTPA refinery (currently operating at 14 MMTPA) to 36 MMTPA in two phases – (i) Phase I to 18 MMTPA (complexity to increase from 6.1 to 11.8) at a capex of US$1.56bn, and (ii) Phase II to 36 MMTPA (complexity to increase to 12.8) at a capex of US$4.44bn. The company has completed 41% of phase I, which is on track for completion by March-11 (vs. December-10 earlier), while phase II expansion has been delayed from December-11 to March-13 (financial closure expected by 3QCY10). The capex per complexity bbl works out to a reasonable US$880-890 for both phases.
Target price of Rs155 — We have a Hold (2M) rating on Essar Oil and Rs155 target price based on SOTP comprising: (i) existing refinery (post-phase I) at Rs60/sh based on 6.5x FY12E EV/EBITDA discounted back, (ii) option value for phase II (50% risk-weighted) at Rs33/sh based on 6.5x FY14E EV/EBITDA discounted back, (iii) value of E&P (Raniganj & Ratna, the latter 25% risk-weighted) at Rs30/sh, (iv) value of tax benefits (IT & sales) at Rs32/sh. We factor GRMs of US$9.7/10.0 (incl. sales tax benefits) after completion of phase I/II.
Key risks — Upside: (i) sustainable uptick in GRMs, (ii) financial closure of phase II, and (iii) monetization of E&P resources. Downside: (i) deterioration in economic outlook, (ii) discontinuation of sales tax benefit, and (iii) delay/cancellation of phase II.
Statistical Abstract
Year to Net Profit Diluted EPS EPS growth EV/EBITDA P/E P/B P/CEPS ROE Yield31 Mar (RsM) (Rs) (%) (x) (x) (x) (x) (%) (%)2008A -413 -0.3 na nm nm 4.3 -406.5 na 0.02009A -4,828 -4.0 1,042.5 22.4 nm 3.9 85.3 -12.4 0.02010E -781 -0.6 -83.9 15.0 nm 4.0 24.7 -1.9 0.02011E 6,275 5.2 -905.1 10.5 25.7 3.4 12.2 14.4 0.02012E 17,287 11.2 117.1 7.1 11.8 1.8 7.3 21.6 0.0
Source: dataCentral, CIRA Estimates
Essar Oil (ESRO.BO)
Hold/Medium Risk 2MPrice (11 May 10) Rs132.40Target Price Rs155.00Expected share price return 17.1%Expected dividend yield 0.0%Expected total return 17.1%Market Cap Rs171,375M US$3,800M
Price Performance
100
140
180
May 09 Aug 09 Nov 09 Feb 10 May 10
INR
Source: dataCentral
Saurabh Handa +91-22-6631-9858 [email protected]
Rahul Singh +91-22-6631-9863 [email protected]
Garima Mishra [email protected]
Company description
Essar Oil (EOL) is a majority-owned subsidiary of Essar Energy Holdings Limited (through direct holding of equity shares and GDS), which in turn is owned by Essar Global Limited. Besides the 10.5 MMTPA refinery complex at Vadinar, EOL’s assets include developmental rights in proven exploration blocks in India and abroad. Essar Oil also has a marketing network of 1,293 oil retail stations across India with plans to increase this network. EOL is expanding its current refinery at Vadinar to 36 MMTPA from the existing 10.5 MMTPA (operating post-debottlenecking at a run-rate of ~14 MMTPA) in a phase-wise manner.

India Investor Conference 2010 18 May 2010
Citigroup Global Markets 25
Essar Oil (ESRO.BO): Financial Summary
Fiscal year end 31-Mar 2008 2009 2010E 2011E 2012E
Valuation RatiosP/E adjusted (x) nm nm nm 25.7 11.8EV/EBITDA adjusted (x) na 22.5 15.4 11.8 7.9P/BV (x) 4.3 3.9 4.0 3.4 1.8Dividend yield (%) 0.0 0.0 0.0 0.0 0.0Per Share Data (Rs)EPS adjusted -0.35 -3.96 -0.64 5.15 11.19EPS reported -0.35 -3.96 -0.64 5.15 11.19BVPS 30.91 33.95 33.31 38.46 73.29DPS 0.00 0.00 0.00 0.00 0.00
Profit & Loss (RsM)Net sales 5,623 375,561 343,210 373,595 503,728Operating expenses -6,148 -370,596 -333,050 -354,464 -467,045EBIT -525 4,965 10,159 19,131 36,683Net interest expense -61 -11,203 -11,440 -12,203 -16,693Non-operating/exceptionals 144 1,488 650 511 655Pre-tax profit -442 -4,750 -631 7,439 20,645Tax 29 199 -150 -1,164 -3,358Extraord./Min.Int./Pref.div. 0 -278 0 0 0Reported net income -413 -4,828 -781 6,275 17,287Adjusted earnings -413 -4,828 -781 6,275 17,287Adjusted EBITDA -500 11,684 17,469 26,047 47,518Growth Rates (%)Sales na 6,579.1 -8.6 8.9 34.8EBIT adjusted na 1,045.4 104.6 88.3 91.7EBITDA adjusted na 2,437.3 49.5 49.1 82.4EPS adjusted na -1,042.5 83.9 905.1 117.1
Cash Flow (RsM)Operating cash flow 14,919 14,032 37,646 -3,339 -10,723Depreciation/amortization 25 6,719 7,310 6,916 10,835Net working capital 15,307 11,864 31,116 -16,530 -38,845Investing cash flow -30,545 -24,422 -47,924 -61,661 -107,420Capital expenditure -30,609 -24,231 -47,924 -61,661 -107,420Acquisitions/disposals 0 0 0 0 0Financing cash flow 13,136 1,770 7,793 63,320 128,990Borrowings 12,677 1,514 9,000 63,320 79,850Dividends paid 0 0 0 0 0Change in cash -2,491 -8,619 -2,485 -1,680 10,847
Balance Sheet (RsM)Total assets 218,646 222,369 261,542 318,473 443,968Cash & cash equivalent 10,890 11,841 9,356 7,676 18,523Accounts receivable 8,034 11,654 14,105 15,353 20,701Net fixed assets 142,814 160,502 201,115 255,860 352,445Total liabilities 181,847 181,010 220,964 271,621 330,689Accounts payable 79,776 76,408 108,826 96,162 75,381Total Debt 101,624 103,139 112,139 175,459 255,309Shareholders' funds 36,799 41,358 40,578 46,852 113,279
Profitability/Solvency Ratios (%)EBITDA margin adjusted -8.9 3.1 5.1 7.0 9.4ROE adjusted na -12.4 -1.9 14.4 21.6ROIC adjusted na 3.9 7.2 10.0 11.8Net debt to equity 246.6 220.7 253.3 358.1 209.0Total debt to capital 73.4 71.4 73.4 78.9 69.3
For further data queries on Citi’s full coverage universe please contact CIRA Data Services Asia Pacific ([email protected]) or +852-2501-2791
Investment Strategy
We rate EOL as Hold/Medium Risk (2M) with a Rs155 target price. The expansions and associated increase in complexity will improve product slate (Euro IV/V fuels to comprise 39%/54% of product slate post-phase I/II) and enhance crude diet (by processing more heavy, sour, and acidic crudes). While full-fledged recovery of the refining business is contingent on return of demand growth and capacity rationalization (complete by 2011), the cycle has bottomed and is likely to improve moderately. Timing of Phase I (ahead of new capacities in the Middle East) and increase in complexity provides some cushion. However, the limited upside coupled with project risks is the key reason for our Hold rating.
Valuation
Our SOTP-based target price of Rs155 for EOL comprises: i) existing refinery (post-phase I expansion) valued at Rs60/share based on 6.5x FY12E EV/EBITDA and discounted back, ii) option value for phase II (50% risk-weighted) at Rs33/share based on 6.5x FY14E EV/EBITDA and discounted back, (iii) value of E&P (Raniganj & Ratna, the latter 25% risk-weighted) at Rs30/share, and (iv) value of tax benefits (IT & sales tax) at Rs32/share. Our target price is based on GRMs of US$9.7/10.0 (incl. sales tax benefits) after completion of phase I/II.

India Investor Conference 2010 18 May 2010
Citigroup Global Markets 26
On the Road to Recovery
Long-term growth drivers — Glenmark has built up a robust, well diversified NCE/NBE pipeline, which would be a key value driver long-term. While setbacks in FY09 led to erosion in the R&D option value, the recent deal with Sanofi has restored some confidence on this front. We also believe that Glenmark's base business remains secure despite being hit by transient issues such as currency volatility & trade level destocking and that it would continue to benefit from the recovery in emerging markets.
Slow but Visible Progress in Base Biz — Growth has picked up in most markets, as credit availability improved & currencies stabilized. We believe the worst is behind and have more comfort on cash flows, as efforts to rein in capex and working capital appear to be making slow, but sure, progress. Recent approvals in the US, settlements (Zetia, Malarone) and tie-up for a niche launch (with Taro) should also provide impetus to the base business.
Sanofi Deal Revives Interest in NCE R&D — Besides restoring confidence in its R&D effort (and some option value being built into the stock), Glenmark’s deal with Sanofi will also ease some of the pressure on the company’s R&D program. The cash flows from the deal would allow Glenmark to fund its proprietary R&D spend without depending too much on its generics cash flows.
Key catalysts — (1) NCE R&D: Crofelemer launch in RoW markets, expected in end FY11; Potential deal for Melogliptin and / or other molecules in pipeline; (2) Generics: Faster pace of approvals, niche launches in the US; US launch of generic Tarka would be a key near-term catalyst
Statistical Abstract
Year to Net Profit Diluted EPS EPS growth EV/EBITDA P/E P/B P/CEPS ROE Yield31 Mar (RsM) (Rs) (%) (x) (x) (x) (x) (%) (%)2008A 6,321 23.6 na 10.4 11.7 4.5 10.5 na 0.22009A 2,739 10.2 -56.7 14.2 27.1 4.3 25.0 12.4 0.12010E 3,592 13.2 28.9 13.4 21.0 3.2 16.4 16.4 0.42011E 5,712 21.0 59.0 9.5 13.2 2.6 10.4 22.2 0.42012E 5,939 21.8 4.0 9.0 12.7 2.2 9.9 19.0 0.4
Source: datacentral, Citi Investment Research and Analysis estimates
Glenmark Pharmaceuticals (GLEN.BO)
Buy/Medium Risk 1M Price (11 May 10) Rs272.90 Target Price Rs335.00 Expected share price return 22.8% Expected dividend yield 0.4% Expected total return 23.1% Market Cap Rs73,650M US$1,633M
Price Performance
100
150
200
250
300
May 09 Aug 09 Nov 09 Feb 10 May 10
INR
Source: dataCentral
Prashant Nair, CFA +91-22-6631-9855 [email protected] Akshay Rai [email protected]
Company description
Glenmark Pharmaceuticals is a fully integrated research-based pharmaceutical company, with a business model spanning drug discovery research, APIs and formulations in the domestic and international markets. It operates in more than 65 countries, including the regulated markets of the US and Europe, with around 60% of its revenues coming from overseas markets. The company came into the limelight in September 2004 after it licensed out the US market rights of its first new chemical entity (NCE), GRC-3886, to Forest Laboratories.

India Investor Conference 2010 18 May 2010
Citigroup Global Markets 27
Glenmark Pharmaceuticals (GLEN.BO): Financial Summary
Fiscal year end 31-Mar 2008 2009 2010E 2011E 2012E
Valuation RatiosP/E adjusted (x) 11.6 26.7 20.7 13.0 12.5EV/EBITDA adjusted (x) 10.2 15.0 12.9 9.2 8.7P/BV (x) 4.5 4.3 3.2 2.6 2.2Dividend yield (%) 0.3 0.1 0.4 0.4 0.4Per Share Data (Rs)EPS adjusted 23.59 10.22 13.18 20.95 21.78EPS reported 23.59 7.22 11.73 20.95 21.78BVPS 61.03 63.79 85.43 105.47 126.36DPS 0.69 0.40 1.00 1.00 1.00
Profit & Loss (RsM)Net sales 19,757 20,865 24,695 29,556 32,111Operating expenses -12,469 -16,042 -19,043 -21,681 -24,207EBIT 7,288 4,823 5,651 7,876 7,904Net interest expense -632 -1,405 -1,576 -1,177 -977Non-operating/exceptionals 458 -729 -269 101 142Pre-tax profit 7,115 2,689 3,806 6,800 7,070Tax -794 -754 -609 -1,088 -1,131Extraord./Min.Int./Pref.div. 0 0 0 0 0Reported net income 6,321 1,935 3,197 5,712 5,939Adjusted earnings 6,321 2,739 3,592 5,712 5,939Adjusted EBITDA 8,005 5,850 7,065 9,439 9,606Growth Rates (%)Sales 61.7 5.6 18.4 19.7 8.6EBIT adjusted 89.8 -33.8 17.2 39.4 0.4EBITDA adjusted 87.8 -26.9 20.8 33.6 1.8EPS adjusted 104.4 -56.7 28.9 59.0 4.0
Cash Flow (RsM)Operating cash flow 3,718 159 5,017 6,801 6,859Depreciation/amortization 717 1,027 1,413 1,563 1,702Net working capital -3,846 -3,877 -621 -1,768 -1,843Investing cash flow -5,099 -9,502 -2,199 -2,099 -1,908Capital expenditure -5,174 -9,561 -2,400 -2,200 -2,050Acquisitions/disposals 0 0 0 0 0Financing cash flow 1,785 8,747 -2,991 -3,492 -4,292Borrowings 692 9,838 -5,235 -2,000 -3,000Dividends paid -201 0 -315 -315 -315Change in cash 404 -596 -173 1,210 659
Balance Sheet (RsM)Total assets 29,256 42,089 44,534 48,944 52,481Cash & cash equivalent 1,565 715 1,012 2,222 2,881Accounts receivable 8,069 9,553 9,878 11,470 12,844Net fixed assets 12,557 21,117 22,103 22,740 23,088Total liabilities 14,062 26,076 21,503 20,517 18,430Accounts payable 3,030 4,399 4,939 5,735 6,422Total Debt 9,909 20,943 15,708 13,708 10,708Shareholders' funds 15,194 16,013 23,031 28,428 34,051
Profitability/Solvency Ratios (%)EBITDA margin adjusted 40.5 28.0 28.6 31.9 29.9ROE adjusted 57.4 17.6 18.4 22.2 19.0ROIC adjusted 32.3 13.3 13.4 17.1 16.2Net debt to equity 54.9 126.3 63.8 40.4 23.0Total debt to capital 39.5 56.7 40.5 32.5 23.9
For further data queries on Citi’s full coverage universe please contact CIRA Data Services Asia Pacific ([email protected]) or +852-2501-2791
Investment Strategy
We have a Buy/Medium Risk (1M) rating on Glenmark. At current levels, the stock trades at reasonable valuations for the base business and does not appear to build in any value for its R&D pipeline. Meanwhile, there are signs of a turnaround in the company's core (non R&D) business and we believe that the worst may be behind us. We now have more comfort on the sustainability of positive trends in the core biz, with Glenmark being able to bring down debtor days, generate cash & pay down debt. We believe the recent underperformance in the stock and the signs of a recovery in Glenmark's core business have improved the risk reward in the stock for investors.
Valuation
Our target price for Glenmark Pharmaceuticals of Rs335 is based on 16x June-11E EPS for the base business. We are now more comfortable with the sustainability of the positive trends seen in Glenmark’s key markets. This along with the improvement in balance sheet (lower leverage, tighter working capital) lead us to use a slightly higher multiple of 16x (15x earlier), which is still at a c10-20% discount to what we use for sector leaders such as Sun Pharma, Cipla, Dr Reddy’s & Lupin. At 16x June '11E EPS we arrive at a value of Rs310/sh for the base business. Our target price also includes an option value of Rs25/sh for Glenmark's R&D deal with Sanofi for GRC-15300. Cumulatively we arrive at a target price of Rs335/sh.

India Investor Conference 2010 18 May 2010
Citigroup Global Markets 28
DIAL construction on track – GMR expects to complete construction of Delhi airport by July 2010. Company has done a capex of Rs90bn (vs. original plan of Rs98bn) so far. DIAL is finalizing the final cost audit, after which it will file with Airport Economic Regulatory Authority (AERA) for tariff determination.
GHIAL airport regulatory structure remains unclear – While DIAL’s tariff is to be decided as per original OMDA, GHIAL’s tariff is to be decided by newly constituted AERA. AERA is yet to decide whether Single-till or dual-till regulation will be applicable to determine tariffs of airports in country.
GMR Energy update – Temasek holdings has invested US$200mn in GMR Energy through compulsorily convertible securities. Mangalore power plant is being shifted to Kakinada and will sell power in merchant market from 1QFY11. EMCO (600MW) has achieved financial closure and BTG order has been placed with Shanghai Electric. CoD is expected by Aug, 2012.
Real Estate update – DIAL has monetized 45.08acres (out of total 250 acres) @Rs~869mn/acres so far. DIAL further plans to monetize ~60 acres in FY11, 55 acres in FY12, 50 acres in FY13. This development will be a mix of CBD and retail.
Statistical Abstract
Year to Net Profit Diluted EPS EPS growth EV/EBITDA P/E P/B P/CEPS ROE Yield31 Mar (RsM) (Rs) (%) (x) (x) (x) (x) (%) (%)2008A 2,101 0.6 na 38.8 105.4 3.6 57.0 na 0.02009A 2,795 0.8 33.0 28.1 79.3 3.4 33.1 4.4 0.02010E 2,805 0.8 0.4 21.7 79.0 2.8 23.6 3.9 0.02011E 1,972 0.5 -29.7 19.1 112.3 2.7 22.2 2.4 0.02012E 8,031 2.2 307.0 11.0 27.6 2.3 12.7 8.9 0.0
Source: Company data, Citi Investment Research and Analysis estimates
GMR Infrastructure (GMRI.BO)
Sell/Medium Risk 3MPrice (11 May 10) Rs60.40Target Price Rs53.00Expected share price return -12.3%Expected dividend yield 0.0%Expected total return -12.3%Market Cap Rs235,103M US$5,214M
Price Performance
20
40
60
80
100
May 09 Aug 09 Nov 09 Feb 10 May 10
INR
Source: dataCentral
Deepal Delivala +91-22-6631-9857 [email protected]
Company description
The GMR Group is a leading infrastructure developer in India with interests in airports, roads and power plants. The Government of India has been steadily opening up the infrastructure sector to private participation over the past decade or so. An early mover in the infrastructure space, it has captured attractive project opportunities. A prime example is the Hyderabad International Airport, which was among the first to be handed out to the private sector for development. GMR won this project on attractive terms, i.e. only a 4% revenue share to the government vs. the Delhi airport project's ~46%. According to Plan Documents, the government is aiming for infrastructure investment of US$494bn in the 11th Plan (FY07-12), representing 130% growth over the 10th Plan (FY02-07).

India Investor Conference 2010 18 May 2010
Citigroup Global Markets 29
GMR (GMRI.BO): Financial Summary
Fiscal year end 31-Mar 2008 2009 2010E 2011E 2012E
Valuation RatiosP/E adjusted (x) 105.4 79.3 79.0 112.3 27.6EV/EBITDA adjusted (x) 39.6 27.7 20.9 16.9 9.2P/BV (x) 3.6 3.4 2.8 2.7 2.3Dividend yield (%) 0.0 0.0 0.0 0.0 0.0Per Share Data (Rs)EPS adjusted 0.57 0.76 0.76 0.54 2.19EPS reported 0.57 0.76 0.76 0.54 2.19BVPS 16.68 17.65 21.27 22.71 26.73DPS 0.00 0.00 0.00 0.00 0.00
Profit & Loss (RsM)Net sales 23,645 40,404 42,524 45,712 67,665Operating expenses -18,748 -33,420 -33,859 -35,863 -46,068EBIT 4,897 6,983 8,665 9,848 21,597Net interest expense -1,687 -3,682 -4,967 -11,555 -14,154Non-operating/exceptionals 0 0 0 1 1Pre-tax profit 3,210 3,301 3,698 -1,706 7,444Tax -584 -530 -692 -363 -1,945Extraord./Min.Int./Pref.div. -526 23 -201 4,041 2,533Reported net income 2,101 2,795 2,805 1,972 8,031Adjusted earnings 2,101 2,795 2,805 1,972 8,031Adjusted EBITDA 6,683 10,882 15,250 17,858 31,075Growth Rates (%)Sales 37.9 70.9 5.2 7.5 48.0EBIT adjusted 14.6 42.6 24.1 13.7 119.3EBITDA adjusted 18.9 62.8 40.1 17.1 74.0EPS adjusted 20.4 33.0 0.4 -29.7 307.0
Cash Flow (RsM)Operating cash flow 6,242 2,082 7,704 9,796 17,969Depreciation/amortization 1,785 3,898 6,585 8,010 9,478Net working capital 2,076 -4,377 -1,929 -186 461Investing cash flow -98,023 -34,510 -69,162 -40,249 -28,640Capital expenditure -51,652 -70,397 -31,420 -40,305 -28,696Acquisitions/disposals -46,371 0 0 0 0Financing cash flow 87,726 48,149 74,587 75,314 52,079Borrowings 42,713 40,469 22,893 45,228 14,999Dividends paid 0 0 0 0 0Change in cash -4,056 15,720 13,130 44,860 41,408
Balance Sheet (RsM)Total assets 155,867 203,271 281,735 358,713 419,125Cash & cash equivalent 8,945 24,665 37,795 82,654 124,062Accounts receivable 0 0 0 0 0Net fixed assets 97,927 164,426 189,261 221,556 240,774Total liabilities 83,569 120,498 190,250 265,643 313,474Accounts payable 0 0 0 0 0Total Debt 79,769 120,238 143,131 188,359 203,359Shareholders' funds 72,298 82,772 91,486 93,070 105,650
Profitability/Solvency Ratios (%)EBITDA margin adjusted 28.3 26.9 35.9 39.1 45.9ROE adjusted 5.2 4.4 3.9 2.4 8.9ROIC adjusted 6.1 5.0 4.5 4.6 8.4Net debt to equity 98.0 115.5 115.1 113.6 75.1Total debt to capital 52.5 59.2 61.0 66.9 65.8
For further data queries on Citi’s full coverage universe please contact CIRA Data Services Asia Pacific ([email protected]) or +852-2501-2791
Investment Strategy
We rate GMR shares Sell/Medium Risk, with an NPV-based target price of Rs53. GMR is a leading infrastructure developer in India, having in its portfolio 3 airports (Hyderabad, Delhi and the Sabiha Gokcen International Airport in Turkey), 11 power plants, six roads and 50% stake in Intergen. We estimate airports and related real estate comprise 47% of GMR's value, other real estate 6%, power plants 24%, roads 10% and coal mines 3%. GMR also has ~Rs12.6bn cash on its books. We expect GMR's earnings to decline at a 16% CAGR over FY09E-11E on 12% CAGR in revenues due to higher depreciation and interest costs as new projects are commissioned. In India, GMR has plans to bid for road, hydropower and power transmission projects. It is looking to emerge as an infrastructure developer across geographies. We believe stock performance would largely depend on 2 factors, i.e. the realised value on the property development and liquidity conditions
Valuation
We have valued each of GMR's projects based on its equity cash flows, discounted using cost of equity of 14% for projects under development and arrive at a sum-of-the-parts target price of Rs53. Given the nature of the concession agreement and cash flows of the airports and associated real estate, comparison with global airports on valuation multiples may be misleading, and hence we prefer a DCF approach. We estimate airports and related real estate comprise 47% of GMR's value, other real estate 6%, power plants 24%, and roads 10% and coal mines 3%.

India Investor Conference 2010 18 May 2010
Citigroup Global Markets 30
Expanding Presence in Emerging Markets
Core soaps business on healthy growth path — GCPL’s core domestic soaps business has consistently gained market share, up from 6% in FY04 to ~10.5% in FY10 through its strong value-for-money proposition and distribution strengths. The company’s performance in FY10 was strong, with the soaps business registering ~17% Y/Y growth, above industry growth of ~8% Y/Y. With competitive intensity increasing in the soaps industry, pricing led growth appears limited. Additionally, industry operating margins are likely to be impacted as input cost pressures resurface, coupled with high A&P. To boost growth, GCPL has launched small SKUs (targeting rural markets) and launched variants in its strategy to gain state-wise market share (rather than a pan-Indian approach).
Well positioned in hair color — GCPL dominates the Indian hair color market, which is growing at 13-15%, with a ~34% market share, leveraged to a young and fashion-conscious urban population. Low penetration levels (less than 30%), growth in natural and premium segments and increasing salon distribution provide strong growth opportunity.
3x3 strategy for international operations — GCPL’s aim is to become a global player in its areas of expertise – 6 acquisitions in the past 3 years reflect this aspiration. Mgmt has outlined its global 3 by 3 strategy; i.e. its presence in three continents – Asia, Africa and Latin America in three business segments — personal wash, hair care and home care. Recently, the company announced the acquisitions of Megasari Group in Indonesia and Tura in Nigeria. These acquisitions expand GCPL’s product offering besides extending its emerging market footprint. While there is limited disclosures on financials for the recent inorganic expansion, management in a recent analyst meet did mention that these have been earnings accretive. Management disclosed that Megasari acquisition would result in~Rs500m accretion to profits in year 1.
Godrej Sara Lee — GCPL recently announced it has acquired Sara Lee’s 51% stake in Godrej Sara Lee (GSL) for around Euro 185m, a transaction multiple of 15x on FY10 earnings. GSL reported revenues of Rs9.65bn and PAT of Rs1.37bn in FY10. The acquisition would enable GCPL to exploit market leading products (Good Knight and Hit) and synergies in distribution, raw material procurement and media purchases. GPCL has also indicated that one of the immediate priorities will be to launch the household insecticides in Africa.
_______________________________________________________________
_______________________________________________________________
_______________________________________________________________
_______________________________________________________________
_______________________________________________________________
_______________________________________________________________
_______________________________________________________________
Godrej Consumer Products (GOCP.BO)
Non-Rated Price (11 May 10) Rs305.25 Market Cap Rs94,112M US$2,087M
Price Performance
140
200
260
320
May 09 Aug 09 Nov 09 Feb 10 May 10
INR
Source: dataCentral
Jamshed Dadabhoy +91-22-6631-9883 [email protected] Aditya Mathur +91-22-6631-9841 [email protected]
Company Description
GCPL is one of the fastest growing companies in India's FMCG sector, with leadership in the hair-color market and the No.2 position in soaps. Its product portfolio also includes toiletries, and household, baby and personal-care products. GCPL acquired Keyline Products, a manufacturer of cosmetic products and toiletries in the UK, in October 2005. In September 2006, it acquired Rapidol International, a market leader in the South African ethnic hair-color market. GCPL came into being in April 2001 when the consumer division of Godrej Soaps was de-merged. Godrej Soaps then became Godrej Industries and retained the industrial chemicals, medical diagnostics and estate operations. The group has close to eight decades of manufacturing experience in soaps and personal-care products.

India Investor Conference 2010 18 May 2010
Citigroup Global Markets 31
Godrej Consumer Products (GOCP.BO): Financial Summary
Fiscal year end FY06 FY07 FY08 FY09 FY10
Valuation RatiosP/E adjusted (x) 57.5 48.4 43.2 44.7 27.7P/E reported (x) 57.5 48.4 43.2 44.7 27.7P/BV (x) 88.6 57.1 40.1 13.8 nmDividend yield (%) 1.1 1.2 1.3 1.3 nmPer Share Data (Local Currency)EPS adjusted 5.30 6.30 7.05 6.83 11.02EPS reported 5.30 6.30 7.05 6.83 11.02BVPS 3.44 5.34 7.60 22.06 nmNAVps ordinary 3.44 5.34 7.60 22.06 nmDPS 3.46 3.70 4.00 4.00 nm
Profit & Loss (Local Currency, Millions)Net operating income (NOI) 6,997 9,532 11,026 13,930 20,412G&A expenses -5,690 -7,833 -8,967 -12,047 -16,575Other Operating items 0 0 0 0 0EBIT including associates 1,307 1,707 2,073 1,922 3,862Non-oper./net int./except. 22 -102 -106 205 337Pre-tax profit 1,321 1,585 1,875 2,092 4,199Tax -108 -195 -283 -360 -803Extraord./Min. Int./Pref. Div. 0 0 0 0 0Reported net income 1,213 1,440 1,592 1,733 3,396Adjusted earnings 1,213 1,440 1,592 1,733 3,396Adjusted EBIT 1,307 1,707 2,073 1,922 3,862Adjusted EBITDAGrowth Rates (%)NOI nm 36.2 15.7 26.3 46.5EBIT adjusted nm 30.6 21.5 -7.3 100.9EPS adjusted nm 18.8 11.9 -3.2 61.4
Cash Flow (Local Currency, Millions)Operating cash flow 1,375 1,095 1,490 1,517Depreciation/amortization 115 142 182 192Net working capital 88 -368 -278 -353Investing cash flow -1,368 -971 -660 -1,686Capital expenditure -166 -1,128 -648 -483Acquisitions/disposals -1,202 157 -13 -1,203Financing cash flow -286 87 -878 3,526Borrowings 625 1,001 135 819Dividends paid -891 -961 -985 -1,174Change in cash -279 212 -49 3,357
Balance Sheet (Local Currency, Millions)Total assets 3,425 5,653 6,903 11,785Cash & cash equivalent 273 475 426 3,858Net fixed assets 661 1,456 1,895 1,847Total liabilities 2,638 4,433 5,187 6,117Total Debt 687 1,736 1,871 2,776Shareholders' funds 787 1,220 1,716 5,668
Profitability/Solvency RatiosEBIT margin adjusted (%) 18.7 17.9 18.8 13.8 18.9ROE adjusted (%) nm 143.5 108.5 46.9 nmROA adjusted (%) nm 31.7 25.4 18.5 nmNet debt to equity (%) 52.6 103.4 84.2 -19.1 nmInterest coverage (x) 12.1 8.7 7.3 5.3 4.8
Source: Bloomberg
Recent Developments
GCPL (parent) recorded 17% Y/Y growth in sales and 54% Y/Y PAT growth in FY10. However, on a sequential basis, standalone sales growth moderated - GCPL sales rose 2% Y/Y. The slowdown in sales was primarily driven by a decline in soap sales, which were impacted by unfavorable base, channel inventory correction and lower pricing gains. Hair color division registering 19% sales growth in FY10, ahead of industry growth of 14%. During Q4FY10 international business registered 20% Y/Y sales growth but profitability declined. Recently, the company announced the acquisitions of Megasari Group in Indonesia, and increased stake in its Sara Lee JV.

India Investor Conference 2010 18 May 2010
Citigroup Global Markets 32
Conglomerate with Cement and VSF Exposure
A diversified conglomerate — Grasim and its 55% subsidiary UltraTech together control 49m tpa of cement capacity (~20% of India's total capacity). In addition, Grasim has 3 other divisions - viscose staple fibre (VSF), chemicals and textiles. It has exited the sponge iron business. The on-going restructuring gives an opportunity to invest directly in the group’s cement business. Grasim still keeps its presence in cement, though the market appears to be giving it a holding company discount.
Cement restructuring on schedule — Samruddhi is the proposed de-merged cement division of Grasim (25.7mtpa); 65% held by Grasim and 35% by Grasim shareholders. Grasim currently owns 54.8% of ULTC (23.1mtpa). After the merger (completion 3QCY10), Grasim would own 60.3% of ULTC (capacity: 49m tpa), Grasim shareholders 19.1% and the rest by minorities. From a market perspective, the consolidation level remains the same; both companies were already marketing cement jointly. Also, no cost savings likely; as all possible synergies were in any case being exploited.
Cement (74% of consolidated sales, 68% of EBITDA) — The company is working on new growth plans as it will need to set up 25m tpa over next 5 years to maintain market share. Grasim feels that cement demand growth in India should be in excess of 10%, but anticipates an emerging surplus scenario for the next 12-18 months. They also expect rising input prices to impact cement margins despite cost efficiencies (including captive power, 268MW, 80% of requirement). Cement prices have been firm in the early part of the calendar year due to supply shortages/high demand, but have begun to moderate/decline; we expect pressure from surplus in 2H FY11.
VSF & Chemicals (24% of sales, 29% of EBITDA) — Grasim is one of the lowest cost producers of VSF in the world and has a domestic market share of more than 90%. Its current capacity is 334ktpa. Grasim plans to set up an 80ktpa Greenfield project at Vilayat, Gujarat (capex Rs10bn) by FY13. EBITDA margins were robust (41%) in 3QFY10 but expected to be under pressure as pulp and sulphur prices are rising. Chemical prices are expected to be under pressure due to new capacity and cheap imports.
Good performance in 3Q FY10 — Both of Grasim’s its largest businesses - cement and VSF did well in the quarter. Grasim reported a standalone PAT of Rs 6bn (+81%) in 3Q. Overall EBITDA margin was 33% (vs 20% in 3Q FY09 and 35% in 2Q FY10). On a consolidated basis, PAT rose 56% to Rs7.15bn, EBITDA rose 19%, and EBITDA margin was 28.1%, vs 25.2% last year.
Grasim Industries (consolidated) – Statistical Abstract
YE 31 Mar Net Profit EPS EPS cons EPS cons growth P/E cons EV/EBITDA cons EV/tonne cons (Rs m) (Rs) (Rs) (%) (x) (x) (US$)FY07 14,987 163 215 89% 12.2 6.8 178FY08 20,019 218 315 47% 8.3 5.5 130FY09 16,480 180 239 -24% 11.0 6.3 137FY10E 18,515 202 284 19% 9.2 4.9 98FY11E 13,201 144 196 -31% 13.3 5.9 93FY12E 12,872 140 183 -7% 14.3 5.8 82
Source: Company Reports and Citi Investment Research and Analysis estimates
Price as on 11 May 2010. Rs/U$ rate at 45.
Grasim Industries (GRAS.BO)
Sell/Medium Risk 3MPrice (11 May 10) Rs2,615.10Target Price Rs2,470.00Expected share price return -5.5%Expected dividend yield 1.3%Expected total return -4.2%Market Cap Rs239,758M US$5,317M
Price Performance
1500
2000
2500
3000
May 09 Aug 09 Nov 09 Feb 10 May 10
INR
Source: dataCentral
Pradeep Mahtani +91-22-6631-9882 [email protected]
Raashi Chopra +91-22-6631-9862 [email protected]
Company description
Grasim is a diversified company with two main divisions - cement and VSF. Its other minor divisions include chemicals and textiles. Cement is its largest division, and accounted for 74% of cons. sales and 68% of EBITDA in 3QFY10. VSF is the other core business (capacity 334kt). Cement capacity is currently 25.7m tpa. Its subsidiary - UltraTech has a current capacity of 23.1m tpa. In Oct09, Grasim announced the demerger of its cement business to its subsidiary, Samruddhi – to be merged with UltraTech to get a combined capacity of 49mtpa. Grasim's domestic markets are well spread across regions, and it does not export cement. In early 1Q FY10 Grasim completed the sale of its sponge iron division.

India Investor Conference 2010 18 May 2010
Citigroup Global Markets 33
Grasim Industries (GRAS.BO): Financial Summary
Fiscal year end 31-Mar 2008 2009 2010E 2011E 2012E
Valuation RatiosP/E adjusted (x) 12.0 14.5 12.9 18.2 18.6EV/EBITDA adjusted (x) 6.7 8.2 6.9 8.2 7.8P/BV (x) 2.9 2.5 2.2 2.0 1.8Dividend yield (%) 1.1 1.1 1.3 0.9 0.8Per Share Data (Rs)EPS adjusted 218.37 179.76 201.97 144.00 140.41EPS reported 243.54 179.76 201.97 144.00 140.41BVPS 888.00 1,033.83 1,195.53 1,313.64 1,428.75DPS 30.00 30.00 35.00 22.50 22.00
Profit & Loss (RsM)Net sales 102,151 108,040 115,757 114,078 122,664Operating expenses -71,438 -84,140 -88,174 -94,295 -103,838EBIT 30,712 23,900 27,583 19,782 18,825Net interest expense -1,070 -1,421 -1,867 -1,447 -947Non-operating/exceptionals 0 0 0 0 0Pre-tax profit 29,642 22,478 25,716 18,335 17,878Tax -9,623 -5,999 -7,200 -5,134 -5,006Extraord./Min.Int./Pref.div. 2,307 0 0 0 0Reported net income 22,326 16,480 18,515 13,201 12,872Adjusted earnings 20,019 16,480 18,515 13,201 12,872Adjusted EBITDA 34,245 28,470 33,084 26,552 25,957Growth Rates (%)Sales 19.2 5.8 7.1 -1.5 7.5EBIT adjusted 33.5 -22.2 15.4 -28.3 -4.8EBITDA adjusted 30.8 -16.9 16.2 -19.7 -2.2EPS adjusted 33.6 -17.7 12.4 -28.7 -2.5
Cash Flow (RsM)Operating cash flow 20,910 19,532 20,461 19,638 18,004Depreciation/amortization 3,533 4,570 5,501 6,770 7,131Net working capital -1,598 -3,797 -4,532 -86 -1,217Investing cash flow -21,286 -17,818 -8,214 -2,112 -1,495Capital expenditure -28,026 -16,416 -11,010 -5,450 -5,000Acquisitions/disposals 1,271 -2,994 0 0 0Financing cash flow 486 -1,855 -5,031 -15,139 -13,320Borrowings 2,360 3,257 0 -10,000 -10,000Dividends paid 0 -3,164 -3,164 -3,691 -2,373Change in cash 111 -141 7,216 2,387 3,189
Balance Sheet (RsM)Total assets 141,204 160,147 175,992 177,925 181,594Cash & cash equivalent 1,275 1,134 8,350 10,737 13,926Accounts receivable 7,120 5,599 9,197 9,376 10,082Net fixed assets 70,540 83,078 88,586 87,267 85,135Total liabilities 59,796 65,371 66,392 57,497 50,614Accounts payable 11,866 12,492 11,217 11,616 12,400Total Debt 32,019 33,950 33,950 23,950 13,950Shareholders' funds 81,407 94,776 109,600 120,428 130,980
Profitability/Solvency Ratios (%)EBITDA margin adjusted 33.5 26.4 28.6 23.3 21.2ROE adjusted 27.9 18.7 18.1 11.5 10.2ROIC adjusted 30.9 20.3 20.5 14.1 13.4Net debt to equity 37.8 34.6 23.4 11.0 0.0Total debt to capital 28.2 26.4 23.7 16.6 9.6
For further data queries on Citi’s full coverage universe please contact CIRA Data Services Asia Pacific ([email protected]) or +852-2501-2791
Investment Strategy
We rate Grasim as Sell/Medium Risk (3M) with a target price of Rs2,470. Despite its diversified product base, cement has the biggest impact on Grasim's revenues and profits. We expect the substantial increase in domestic cement capacity to create oversupply and that pricing declines in the coming quarters will hurt the cement division's profits. The cement division's EBITDA margins are expected to fall yoy in FY11 and FY12, based on our estimates. Margins for the VSF division were strong in 3Q FY10, but expected to be under pressure going forward due to higher raw material prices. Grasim is setting up a new 80ktpa greenfield VSF plant in Gujarat at a capex of RS10bn by FY13.
Valuation
We value Grasim using SOTP. We value the cement division using EV/tonne, a common metric used for cement companies, and use EV/EBITDA for the other businesses. Our target price of Rs2,470 is based on Sep 10 EV/t of US$85 and assuming 5-7x for its other businesses (VSF/chemicals). Our TP implies a Sep10 EV/EBITDA of 5.1x and P/E of 10.3x. We take a 15% discount to the cement replacement cost of ~US$100/t bearing in mind: 1) the large cement capacity increases, which are likely to surpass demand and cause pricing pressure over the next several quarters, and 2) uncertain VSF outlook.

India Investor Conference 2010 18 May 2010
Citigroup Global Markets 34
Bangalore Airport Stake – GVK has acquired 29% stake in Bangalore Airport from L&T (17%) and Flughafen Zuerich AG (12%), valuing Bangalore airport at ~Rs40bn. GVK has got a board seat in Bangalore airport and has Right of First Refusal in case any other shareholder wants an exit. Management has indicated intent to increase its stake further according to press reports. According to the shareholders agreement; Siemens can sell 14% by May 2011 and completely exit by 2015. Other share holders in airport are: Siemens Project Ventures GmBH (40%), AAI (13%) and KSIIDC (13%) and Zurich airport (5%).
1600MW planned gas capacity expansion – GVK has issued LoIs for 800MW gas capacity expansion each at J2 and Gautami. GVK is starting off with limited construction at these sites. The company will go into full fledged construction after gas allocation.
MIAL Real Estate update – HDIL has completed construction of 20,000 tenements. The company is awaiting power and water approval. it expects to start rehabilitation after monsoons. Master plan for development of real estate is ready and once approval is obtained, MIAL will move quickly to monetize the project.
Other projects – Goindwal Sahib construction has started. Tokisud mine has achieved financial closure. Alaknanda is set to achieve major milestones before onset of monsoons and CoD is expected by October 2011. GVK has recently won 690MW Rattle hydro power project in J&K and Kota-Deoli toll road in Rajasthan.
Statistical Abstract
Year to Net Profit Diluted EPS EPS growth EV/EBITDA P/E P/B P/CEPS ROE Yield31 Mar (RsM) (Rs) (%) (x) (x) (x) (x) (%) (%)2007A 580 0.6 na na 70.4 6.9 29.5 na 0.12008A 1,355 1.0 56.0 44.5 45.1 2.8 28.7 9.7 0.02009E 1,340 1.0 -1.1 43.6 45.6 2.6 32.9 4.8 0.02010E 1,622 1.0 7.8 14.9 42.3 2.0 16.0 5.6 0.02011E 2,733 1.7 68.5 9.6 25.1 1.7 12.2 7.2 0.0
Source: Company data, Citi Investment Research and Analysis estimates
GVK Power and Infrastructure (GVKP.BO)
Hold/Medium Risk 2MPrice (11 May 10) Rs43.45Target Price Rs50.00Expected share price return 15.1%Expected dividend yield 0.0%Expected total return 15.1%Market Cap Rs68,617M US$1,522M
Price Performance
20
30
40
50
60
May 09 Aug 09 Nov 09 Feb 10 May 10
INR
Source: dataCentral
Deepal Delivala +91-22-6631-9857 [email protected]
Company description
GVKPIL is a leading infrastructure developer in India. Its portfolio of assets includes the Mumbai International Airport, a toll road, six power plants, one coal mine and one Special Economic Zone. With an increasing share of India's infrastructure capex now taking the public/private sector participation route, we expect opportunities for infrastructure developers to expand

India Investor Conference 2010 18 May 2010
Citigroup Global Markets 35
GVK (GVKP.BO): Financial Summary
Fiscal year end 31-Mar 2007 2008 2009E 2010E 2011E
Valuation RatiosP/E adjusted (x) 70.4 45.1 45.6 42.3 25.1EV/EBITDA adjusted (x) na 41.6 46.1 14.4 11.1P/BV (x) 6.9 2.8 2.6 2.0 1.7Dividend yield (%) 0.1 0.0 0.0 0.0 0.0Per Share Data (Rs)EPS adjusted 0.62 0.96 0.95 1.03 1.73EPS reported 0.62 0.96 0.77 1.03 1.73BVPS 6.34 15.55 16.52 22.24 25.78DPS 0.06 0.00 0.00 0.00 0.00
Profit & Loss (RsM)Net sales 3,986 4,700 5,138 16,182 21,847Operating expenses -2,785 -3,600 -4,084 -12,342 -15,422EBIT 1,201 1,099 1,053 3,840 6,426Net interest expense -627 -431 -334 -2,156 -3,262Non-operating/exceptionals 583 1,026 724 542 957Pre-tax profit 1,157 1,694 1,443 2,226 4,121Tax -250 -239 -100 -257 -547Extraord./Min.Int./Pref.div. -328 -101 -267 -347 -841Reported net income 580 1,355 1,076 1,622 2,733Adjusted earnings 580 1,355 1,340 1,622 2,733Adjusted EBITDA 2,007 1,875 1,833 6,508 9,335Growth Rates (%)Sales na 17.9 9.3 215.0 35.0EBIT adjusted na -8.5 -4.2 264.5 67.3EBITDA adjusted na -6.6 -2.2 255.0 43.4EPS adjusted na 56.0 -1.1 7.8 68.5
Cash Flow (RsM)Operating cash flow 1,963 1,353 3,466 4,977 5,812Depreciation/amortization 806 776 780 2,668 2,909Net working capital 552 -874 1,614 335 -672Investing cash flow -11,083 -9,419 -23,241 -6,311 -35,114Capital expenditure -9,432 -5,324 -27,095 -7,525 -33,596Acquisitions/disposals 0 0 0 0 0Financing cash flow 9,172 9,078 19,693 12,698 31,603Borrowings 7,479 -2,536 16,888 3,736 28,742Dividends paid 0 0 0 0 0Change in cash 52 1,012 -81 11,364 2,301
Balance Sheet (RsM)Total assets 27,595 37,728 59,536 73,282 108,615Cash & cash equivalent 631 1,643 1,562 12,926 15,227Accounts receivable 0 0 0 0 0Net fixed assets 21,227 25,776 52,091 56,949 87,636Total liabilities 18,910 15,857 33,663 34,837 63,734Accounts payable 0 0 0 0 0Total Debt 15,446 12,910 29,798 33,534 62,276Shareholders' funds 8,685 21,872 25,873 38,446 44,881
Profitability/Solvency Ratios (%)EBITDA margin adjusted 50.3 39.9 35.7 40.2 42.7ROE adjusted na 9.7 5.9 5.6 7.2ROIC adjusted na 3.3 2.3 6.4 8.0Net debt to equity 170.6 51.5 109.1 53.6 104.8Total debt to capital 64.0 37.1 53.5 46.6 58.1
For further data queries on Citi’s full coverage universe please contact CIRA Data Services Asia Pacific ([email protected]) or +852-2501-2791
Investment Strategy
We rate GVKPIL as Hold/Medium Risk, with an NPV-based target price of Rs50. GVK provides an EPS CAGR of 35% over FY09E-11E. The Mumbai Airport forms 48% of its value, power plants 30% and roads 13%. We expect GVKPIL's consolidated revenues to grow at a 106% CAGR and PAT at a 43% CAGR over FY09E-11E. GVK stock is up 85% YTD; factoring in the macro, market and company specific positives to a large extent and provides limited upside from current levels
Valuation
We value GVKPIL using a sum-of-the-parts approach, with each ‘part' valued on DCF as most projects generate predictable cash flow streams. As each individual project is highly geared and gearing changes rapidly as debt is paid, we have used an FCFE approach. Given the nature of the concession agreement and cash flows of the airport and associated real estate, comparison with global airports on valuation multiples may be misleading and hence we prefer a DCF approach. We do not value assets under development and not financially closed. We assume cost of equity of 14% for assets under development and 12% for operational projects. We value the operational assets at around Rs39 and the assets under development at Rs6.

India Investor Conference 2010 18 May 2010
Citigroup Global Markets 36
Construction business update — Current orderbook is Rs188bn, and HCC is the lowest bidder in Rs43.9bn worth of orders. HCC has made a foray into the metals segment and is now a part of the global supply chain for Aluminium Pichney for pot shell/ superstructure. It has received vendor approval from Rio Tinto Alcan. HCC intends to focus on more private sector projects as well as bid for international projects, especially in South Asia. The company expects to grow its OB to Rs240-250bn in FY11E (+28% YoY). AP irrigation orders: now form ~18% of OB vs 26% in FY09. HCC has received payments for receivables up to Jan 2010.
Infrastructure Development Business — The current portfolio has six road projects valued at Rs55bn. The company intends to create BOT asset portfolio of Rs150bn over 2010-2014 with a focus on road, hydropower, airport and port projects. The company intends to finalize a strategic partner for BOT projects as well as look to secure long-term funding for the road business.
Real estate — 1) 247 Park — ~88% of the project has been leased. The company intends to build a second phase of the tower with a total area of 1.55mn sqft and saleable area of .75mn sqft. 2) Lavasa- The development at Lavasa has picked up momentum with the company having advanced business plans by two years.
Karl Steiner AG (KSAG) acquisition — HCC acquired 66% stake in the second largest total services contractor in the Swiss Real Estate market. KSAG is a 95 year old business, specializing in turnkey development of new buildings and refurbishments, and offers services in all facets of real estate construction. This strategic acquisition facilitates HCC’s entry into the integrated building construction market in India, as well providing a presence for European expansion
Statistical Abstract
Year to Net Profit Diluted EPS EPS growth EV/EBITDA P/E P/B P/CEPS ROE Yield31 Mar (RsM) (Rs) (%) (x) (x) (x) (x) (%) (%)2008A 762 2.8 na 13.6 43.2 3.1 16.1 na 0.72009A 696 2.5 -8.6 12.1 47.3 3.1 13.7 12.5 0.72010E 965 3.0 18.2 11.8 40.0 2.0 18.7 5.7 0.72011E 1,224 3.8 26.9 10.0 31.5 1.9 14.2 7.7 0.72012E 1,460 4.5 19.2 9.0 26.4 1.8 12.6 8.6 0.7
Source: Company data, Citi Investment Research and Analysis estimates
HCC (HCNS.BO)
Sell/High Risk 3HPrice (11 May 10) Rs120.00Target Price Rs138.00Expected share price return 15.0%Expected dividend yield 0.7%Expected total return 15.7%Market Cap Rs36,391M US$807M
Price Performance
50
100
150
200
May 09 Aug 09 Nov 09 Feb 10 May 10
INR
Source: dataCentral
Deepal Delivala +91-22-6631-9857 [email protected]
Company description
HCC is an 80-year-old construction company where the major shareholders own a 48% stake. It has cash contracting skills across power (thermal, hydel, nuclear), roads, bridges, dams, barrages, industrial, buildings, water supply, sanitation, ports, harbors and other marine works

India Investor Conference 2010 18 May 2010
Citigroup Global Markets 37
HCC (HCNS.BO): Financial Summary
Fiscal year end 31-Mar 2008 2009 2010E 2011E 2012E
Valuation RatiosP/E adjusted (x) 43.2 47.3 40.0 31.5 26.4EV/EBITDA adjusted (x) 13.3 12.3 11.1 9.7 8.4P/BV (x) 3.1 3.1 2.0 1.9 1.8Dividend yield (%) 0.7 0.7 0.7 0.7 0.7Per Share Data (Rs)EPS adjusted 2.78 2.54 3.00 3.81 4.54EPS reported 3.97 4.57 2.26 3.81 4.54BVPS 39.18 39.22 59.85 63.65 68.31DPS 0.80 0.80 0.80 0.84 0.88
Profit & Loss (RsM)Net sales 30,828 33,137 36,592 43,307 52,126Operating expenses -28,123 -29,975 -33,018 -39,169 -46,957EBIT 2,704 3,162 3,574 4,138 5,169Net interest expense -1,524 -2,105 -2,162 -2,311 -2,990Non-operating/exceptionals -89 -30 39 0 0Pre-tax profit 1,091 1,027 1,450 1,827 2,179Tax -330 -330 -486 -603 -719Extraord./Min.Int./Pref.div. 326 557 -237 0 0Reported net income 1,088 1,253 727 1,224 1,460Adjusted earnings 762 696 965 1,224 1,460Adjusted EBITDA 3,666 4,314 4,903 5,630 6,776Growth Rates (%)Sales 30.8 7.5 10.4 18.4 20.4EBIT adjusted 99.4 16.9 13.0 15.8 24.9EBITDA adjusted 70.3 17.7 13.7 14.8 20.4EPS adjusted 1.5 -8.6 18.2 26.9 19.2
Cash Flow (RsM)Operating cash flow 462 -1,237 865 -1,997 59Depreciation/amortization 962 1,152 1,330 1,492 1,608Net working capital -1,865 -3,641 -1,192 -4,714 -3,008Investing cash flow -2,863 -3,393 -3,400 -2,455 -1,771Capital expenditure -2,194 -2,692 -1,800 -1,500 -1,501Acquisitions/disposals -669 -700 -1,600 -955 -270Financing cash flow 2,850 3,524 2,048 5,574 1,739Borrowings 2,938 4,769 -2,514 5,826 2,003Dividends paid -240 -240 -240 -252 -264Change in cash 449 -1,105 -487 1,122 27
Balance Sheet (RsM)Total assets 40,262 50,075 52,695 62,283 68,867Cash & cash equivalent 2,644 1,539 1,051 2,173 2,200Accounts receivable 45 47 52 62 74Net fixed assets 10,206 11,746 12,217 12,224 12,118Total liabilities 30,217 39,974 37,357 45,973 51,362Accounts payable 7,655 10,321 9,838 11,888 14,309Total Debt 18,449 23,218 20,704 26,531 28,534Shareholders' funds 10,041 10,049 15,337 16,310 17,505
Profitability/Solvency Ratios (%)EBITDA margin adjusted 11.9 13.0 13.4 13.0 13.0ROE adjusted 8.0 6.9 7.6 7.7 8.6ROIC adjusted 10.3 10.2 9.7 10.1 11.5Net debt to equity 157.4 215.7 128.1 149.3 150.4Total debt to capital 64.8 69.8 57.4 61.9 62.0
For further data queries on Citi’s full coverage universe please contact CIRA Data Services Asia Pacific ([email protected]) or +852-2501-2791
Investment Strategy
We rate HCC shares as Sell/High Risk (3H), with a target price of Rs138. We expect HCC's earnings to grow at 23% CAGR over FY10E-12E. Our Sell rating reflects: 1) Earnings risks given that 36% of orders in the OB are suspended/delayed, 2) Near-term risks to the construction business could weigh on near-term stock performance, and 3) Current valuations are already fair, in our view.
Valuation
Our Rs138 target price is based on a sum-of-the-parts (SOTP) valuation. While we expect HCC's earnings to grow at 23% CAGR over the FY10E-12E, its earnings could be at risk due to orders in the OB being suspended/delayed. Our 12x Mar-2011E target PE multiple for HCC's core business, resulting in a value of Rs46/share, is set at a discount to other mid-cap construction peers and large players like L&T, justified in our view given the risks to HCC's earnings if the near-term situation in AP doesn't improve. We value Lavasa at Rs66/share based on a 35% discount to NAV, and Vikhroli development and land bank at Rs19/share based on a 20% discount to NAV. The portfolio of BOT assets is valued in our SOTP at Rs8/share, based on a P/BV multiple of 1.2x.

India Investor Conference 2010 18 May 2010
Citigroup Global Markets 38
Focus on Large Deals Paying Off
FY11 revenue growth — With the improvement in macro, good revenue growth for FY11 is assumed for Offshore IT. HCLT has a significant exposure to Manufacturing, Hi-Tech and BFSI, demand outlook in these verticals is a key focus area. A scenario analysis of revenue growth based on pent up demand could be explored with the management.
Axon performance — A key focus area for investors could be the status of the Enterprise Application Services (primarily Axon) business. Axon is a cyclical business, so management comments around the revenue growth and margins should be worth exploring – given that SAP has seen weak license sales over last few quarters.
Margin levers — With the headwinds from rupee appreciation and wage inflation, margins would be under pressure for the sector. Margins have come down for HCLT in the last two quarters in large measure due to the restructuring exercise undertaken in the BPO business. Margin outlook for FY11 is an important issue to focus on.
Large deal strategy — HCLT got a first mover advantage by moving into uncontested market spaces (like infrastructure management, life sciences vertical etc.). Company has had good success in such deals – the US$2.5b of large deals signed in FY08-09 is proof of success of the strategy. Management commentary on its large deal strategy should be explored.
Supply side dynamics — Company’s view on supply side dynamics should be another area to discuss with focus on the following – (1) availability of talent (engineers) for next few years; (2) company’s initiatives on training; (3) right-skilling initiative – hiring of science graduates; (4) expectation for wage hikes in FY11E.
SEZ strategy — HCLT’s SEZ readiness, given the expectation of STPI sunset clause coming into effect by Apr’11 should be discussed. Expectations of the tax rate in FY11/12E etc. could be gauged.
Statistical Abstract
Year to Net Profit Diluted EPS
EPS growth
EV/EBITDA P/E P/B P/CEPS ROE Yield
30 Jun (RsM) (Rs) (%) (x) (x) (x) (x) (%) (%)2008A 10,323 15.2 na 15.0 25.6 4.9 19.8 na 2.32009A 11,788 17.5 15.3 10.6 22.2 4.6 16.1 21.6 1.82010E 11,832 17.2 -1.8 11.0 22.6 3.8 15.7 18.9 1.02011E 16,710 24.2 40.8 9.6 16.0 3.2 12.1 22.1 1.52012E 19,587 28.3 17.2 7.9 13.7 2.6 10.5 21.4 1.5
Source: Powered by dataCentral
HCL Technologies (HCLT.BO)
Buy/Medium Risk 1MPrice (11 May 10) Rs387.55Target Price Rs435.00Expected share price return 12.2%Expected dividend yield 1.5%Expected total return 13.8%Market Cap Rs262,565M US$5,854M
Price Performance
0
100
200
300
400
500
May 09 Aug 09 Nov 09 Feb 10 May 10
INR
Source: dataCentral
Surendra Goyal, CFA1 +91-22-6631-9870 [email protected]
Vishal Agarwal1 +91-22-6616-2742 [email protected]
Company description
HCLT is the fifth-largest Indian IT services company. Founded in 1991, HCLT focused on technology and R&D outsourcing before diversifying into enterprise applications. In the infrastructure business, it has been gradually shifting focus from domestic sales to global services. In BPO, it is one of the largest offshore service providers and boasts strong ties with British Telecom. The company leverages off its extensive offshore infrastructure and its global network to deliver solutions across verticals including Banking, Insurance, Retail, Consumer, Aerospace, Automotive, Semiconductors, Telecom and Life Sciences. HCLT has more than 350 clients across verticals and a workforce of more than 50,000.

India Investor Conference 2010 18 May 2010
Citigroup Global Markets 39
HCL Technologies (HCLT.BO): Financial Summary
Fiscal year end 30-Jun 2008 2009 2010E 2011E 2012E
Valuation RatiosP/E adjusted (x) 25.6 22.2 22.6 16.0 13.7EV/EBITDA adjusted (x) 14.7 11.1 10.5 9.1 7.4P/BV (x) 4.9 4.6 3.8 3.2 2.6Dividend yield (%) 2.3 1.8 1.0 1.5 1.5Per Share Data (Rs)EPS adjusted 15.16 17.48 17.17 24.17 28.33EPS reported 15.16 17.48 17.17 24.17 28.33BVPS 78.55 85.11 101.29 122.57 148.36DPS 9.00 7.00 4.00 6.00 6.00
Profit & Loss (RsM)Net sales 76,394 106,084 122,894 140,248 161,095Operating expenses -63,410 -88,106 -103,270 -118,041 -135,152EBIT 12,984 17,978 19,624 22,207 25,942Net interest expense -1,370 -3,674 -4,908 -1,302 523Non-operating/exceptionals -19 27 13 4 4Pre-tax profit 11,595 14,331 14,729 20,909 26,469Tax -1,272 -2,543 -2,898 -4,199 -6,883Extraord./Min.Int./Pref.div. 0 0 0 0 0Reported net income 10,323 11,788 11,832 16,710 19,587Adjusted earnings 10,323 11,788 11,832 16,710 19,587Adjusted EBITDA 16,017 22,471 24,861 27,591 31,930Growth Rates (%)Sales 26.6 38.9 15.8 14.1 14.9EBIT adjusted 31.6 38.5 9.2 13.2 16.8EBITDA adjusted 29.2 40.3 10.6 11.0 15.7EPS adjusted -17.7 15.3 -1.8 40.8 17.2
Cash Flow (RsM)Operating cash flow 16,953 20,356 18,385 21,248 23,156Depreciation/amortization 3,033 4,493 5,237 5,383 5,987Net working capital 2,227 401 -3,034 84 336Investing cash flow -5,435 -44,917 -6,082 -7,216 -8,016Capital expenditure -5,855 -7,038 -7,251 -7,216 -8,016Acquisitions/disposals -1,524 -35,740 2,931 0 0Financing cash flow -10,676 18,166 -7,596 -2,132 -307Borrowings 0 29,771 -1,884 0 0Dividends paid -6,797 -5,470 -3,151 -4,738 -4,738Change in cash 842 -6,395 4,707 11,901 14,833
Balance Sheet (RsM)Total assets 80,338 126,942 132,346 151,957 174,713Cash & cash equivalent 24,619 18,995 24,557 37,338 53,051Accounts receivable 18,940 27,083 29,409 34,406 39,421Net fixed assets 13,317 15,862 17,876 19,709 21,737Total liabilities 28,104 70,080 64,159 69,241 74,591Accounts payable 22,145 32,675 29,574 34,656 40,006Total Debt 0 29,771 27,887 27,887 27,887Shareholders' funds 52,234 56,859 68,187 82,716 100,122
Profitability/Solvency Ratios (%)EBITDA margin adjusted 21.0 21.2 20.2 19.7 19.8ROE adjusted 20.2 21.6 18.9 22.1 21.4ROIC adjusted 42.8 32.6 24.8 26.0 26.8Net debt to equity -47.1 19.0 4.9 -11.4 -25.1Total debt to capital 0.0 34.4 29.0 25.2 21.8
For further data queries on Citi’s full coverage universe please contact CIRA Data Services Asia Pacific ([email protected]) or +852-2501-2791
Investment Strategy
We rate HCLT shares Buy/Medium Risk (1M). HCLT has been at the forefront of pursuing large deals, announcing ~US$2.5bn of large deals in FY08-09. A significant presence across IT services, BPO services and IMS has helped HCLT qualify for multi-year outsourcing deals. IMS, R&D and BPO service offerings should enable it to post strong revenue growth, although BPO could be impacted in the near term as the company tries to restructure it. The Axon acquisition helps HCLT in filling up the gap in Enterprise Services, where HCLT was lagging its peers. With ERP showing signs of recovery, we expect Axon to start contributing to growth in the coming quarters.
Valuation
Our target price is Rs435 based on 18x FY11E EPS. This is higher than the mid-point of the 6-23x band that the stock has traded in over the past three-years. We believe a higher multiple is justified given improving macro and potential benefits arising out of the Axon acquisition. We believe PE remains the most appropriate valuation measure given HCLT's profitable track record.

India Investor Conference 2010 18 May 2010
Citigroup Global Markets 40
Growth, Returns and Quality
HDFC Bank is one of India’s premier new generation private sector banks —
The bank has consistently sustained a strong operating mix over its 15 years of existence, high growth, high profitability and low risk, while continuing to expand its distribution and franchise. We expect this positioning to continue.
High margins, driven by a strong liability franchise — HDBK generates high 4%-plus margin – a function of a strong liability franchise, which keeps its deposit costs well below peers. We see HDBK sustaining this relative advantage, though the sheer level of margins could induce pressures, and maintaining its deposit mix would be a challenge. A low interest rate environment could also challenge its deposit cost advantage.
Balance Sheet: Well positioned to leverage — HDBK’s balance-sheet is potentially at the start of a leverage cycle: it recently raised capital and its Tier 1 is at 13.3%, it is now seeking to widen its lending profile – growth is steady and broad based (infrastructure included), with a slight corporate bias as the retail book grows at a relatively slower pace than historically (faster than industry nevertheless).
Asset Quality: Well ahead of peers — HDBK’s asset quality is significantly better than industry levels - NPLs are declining, restructured assets are small and reducing and overall coverage levels are above 100%. In sum, asset quality appears to be improving decisively and with minimal impact to its balance sheet relative to peers.
Key role in the HDFC group — HDBK is the largest entity in the HDFC group in terms of assets, customers and visibility. It is the largest distribution arm of the group, and has played a key role in building the group’s market presence. This has enabled HDFC to generate group synergies and economies, though this could have been a constraint in some business segments. Over the longer term, potential reconfigurations in the group structure could present opportunities, or carry risks.
Statistical Abstract
Year Net profit EPS EPS Growth PE PB ROAE ROAA Div yieldMarch (Rs. M) Rs. (%) (x) (x) (%) (%) (%)FY08 15,900 46 29.4 42.7 6.0 18 1.4 0.4FY09 22,449 55 21.3 35.2 5.5 17 1.4 0.5FY10E 29,122 64 15.9 30.4 4.1 16 1.4 0.5FY11E 37,957 81 26.7 24.0 3.6 17 1.6 0.5FY12E 50,847 109 34.0 17.9 3.0 19 1.8 0.6
Source: Company and Citi Investment Research and Analysis estimates
HDFC Bank (HDBK.BO)
Hold/Low Risk 2LPrice (11 May 10) Rs1,947.15Target Price Rs2,050.00Expected share price return 5.3%Expected dividend yield 0.6%Expected total return 5.9%Market Cap Rs892,766M US$19,797M
Price Performance
1100125014001550170018502000
May 09 Aug 09 Nov 09 Feb 10 May 10
INR
Source: dataCentral
Aditya Narain, CFA +91-22-6631-9879 [email protected] Manish Chowdhary, CFA +91-22-6631-9853 [email protected] Pooja Kapur [email protected]
Company description
HDFC Bank, which began operations in 1994, is 24%-owned by HDFC - India's premier mortgage-finance institution. In 2000 HDFC Bank took over private-sector Times Bank. HDFC Bank has a network of more than 1,725 branches and more than 4,230 ATMs in 779 cities. HDFC Bank entered into an arrangement with its parent FY04 through which HDFC Bank sources mortgages for the parent. HDFC Bank pays HDFC for credit appraisal and operations and receives a fee for sourcing. In addition, HDFC Bank buys back 70% of mortgages at a price 125bp lower than the yield of the mortgages. HDFC Bank acquired Centurion Bank of Punjab in 2008. HDBK is the second-largest private sector bank in India, by a relatively large margin.

India Investor Conference 2010 18 May 2010
Citigroup Global Markets 41
HDFC Bank (HDBK.BO): Financial Summary
Fiscal year end 31-Mar 2008 2009 2010E 2011E 2012E
Valuation RatiosP/E adjusted (x) 42.7 35.2 30.4 24.0 17.9P/E reported (x) 42.7 35.2 30.4 24.0 17.9P/BV (x) 6.0 5.5 4.1 3.6 3.0P/Adjusted BV diluted (x) 6.3 5.7 4.2 3.7 3.1Dividend yield (%) 0.4 0.5 0.5 0.5 0.6Per Share Data (Rs)EPS adjusted 45.59 55.31 64.08 81.18 108.74EPS reported 45.59 55.31 64.08 81.18 108.74BVPS 324.39 353.73 474.82 546.64 646.42Tangible BVPS 324.39 353.73 474.82 546.64 646.42Adjusted BVPS diluted 310.38 340.91 458.57 527.93 624.30DPS 8.50 10.00 10.00 10.50 11.00
Profit & Loss (RsM)Net interest income 51,494 72,397 83,604 102,289 126,412Fees and commissions 17,145 24,573 30,716 37,781 46,471Other operating Income 4,901 8,613 12,808 11,869 13,241Total operating income 73,541 105,583 127,129 151,938 186,124Total operating expenses -37,456 -55,328 -62,442 -71,956 -84,528Oper. profit bef. provisions 36,085 50,255 64,686 79,982 101,596Bad debt provisions -11,376 -17,263 -22,480 -24,972 -27,905Non-operating/exceptionals -1,904 0 0 0 0Pre-tax profit 22,805 32,992 42,206 55,010 73,691Tax -6,905 -10,543 -13,084 -17,053 -22,844Extraord./Min. Int./Pref. Div. 0 0 0 0 0Attributable profit 15,900 22,449 29,122 37,957 50,847Adjusted earnings 15,900 22,449 29,122 37,957 50,847Growth Rates (%)EPS adjusted 29.4 21.3 15.9 26.7 34.0Oper. profit bef. prov. 31.9 39.3 28.7 23.6 27.0
Balance Sheet (RsM)Total assets 1,331,765 1,832,708 2,190,748 2,625,393 3,182,973Avg interest earning assets 1,079,843 1,526,852 1,948,229 2,348,992 2,851,941Customer loans 707,199 1,026,279 1,276,946 1,598,393 1,999,924Gross NPLs 9,068 19,287 30,779 44,323 56,925Liab. & shar. funds 1,331,765 1,832,708 2,190,748 2,625,393 3,182,973Total customer deposits 1,007,686 1,428,116 1,705,693 2,088,865 2,581,857Reserve for loan losses 10,413 18,021 28,929 42,328 54,843Shareholders' equity 114,972 150,472 214,420 246,853 291,912
Profitability/Solvency Ratios (%)ROE adjusted 17.7 16.9 16.0 16.5 18.9Net interest margin 4.8 4.7 4.3 4.4 4.4Cost/income ratio 50.9 52.4 49.1 47.4 45.4Cash cost/average assets 3.3 3.5 3.1 3.0 2.9NPLs/customer loans 1.3 1.9 2.4 2.8 2.8Reserve for loan losses/NPLs 114.8 93.4 94.0 95.5 96.3Bad debt prov./avg. cust. loans 1.8 2.0 2.0 1.7 1.6Loans/deposit ratio 70.2 71.9 74.9 76.5 77.5Tier 1 capital ratio 10.3 10.3 10.5 9.6 9.2Total capital ratio 13.6 14.7 14.6 13.3 12.5
For further data queries on Citi’s full coverage universe please contact CIRA Data Services Asia Pacific ([email protected]) or +852-2501-2791
Investment strategy
We rate HDFC Bank as Hold/Low Risk with a target of Rs2,050. HDBK has now been through a couple of business cycles, and has distinguished itself consistently. While we believe its relative value is most obvious in challenging times, its current valuations are close to the peak they will likely generate in this cycle, and we expect stock returns will be modest. We expect HDFC Bank to trade in the 3-4x P/BV band longer-term, the middle of its long-term trading band. Any valuation upside would depend on a sustained ROE improvement outlook (20%+), or a particularly favorable macro-environment, which we do not foresee near-term. We are positive on the bank's prospects and management's ability to deliver, and believe it stands out relative to peers in a challenging environment. In addition, its acquisition of Centurion Bank likely provides a platform for strong growth over a sustained period.
Valuation
Our target of Rs2,050 is based on an EVA model, assuming a loan-loss ratio of 100bp, a long-term cost/income ratio of 42% and spread of 325bp. We use the EVA model for the India banking universe as it dynamically adjusts the economic value of the business. As a secondary benchmark, we apply 3.5x 1 year forward P/BV for a fair value of Rs2,001. A 3.5x P/BV is a premium to almost all other Indian commercial banks, but is justified, we believe, by HDBK's structurally higher margin, de-risked earnings and balance sheet mix, as well as by gains in the consumer-lending franchise. This multiple is slightly above its median historical trading band, and about in the middle of its PBV multiples relative to peers, in previous cycles.

India Investor Conference 2010 18 May 2010
Citigroup Global Markets 42
India’s Leading Bike Manufacturer
Well Positioned to leverage off rural growth — Rural / semi urban sales account for ~55% of industry volumes and a similar proportion (we estimate) of HH’s volumes. That said, given that urban sales are expected to grow at a faster pace this fiscal, we expect HH to concede market share to rival Bajaj Auto, which could ensure that HH’s valuations are capped at current levels. HH's overall domestic market share (in bikes) has dipped to ~55% in 4QFY10, from 62% in 1QFY10.
Mgmt guides to ~12-15% industry volume growth — in FY11, and HH is expected to grow at the same pace (implying market share sustains at current levels). We factor vol. growth of ~12% – the lower end of guidance, as we think HH will continue to cede market share on account of industry mix shifts, and Bajaj’s renewed aggression in the executive segment.
Industry shift toward premium segment is an opportunity and challenge for
HH— The premium segment now accounts for ~18% of domestic bike volumes (4QFY10), vs ~15% in 1QFY10, and Bajaj Auto mgmt expects this segment to grow to 21% in FY11. Given HH’s limited market share in this segment (~20% in 4QFY10 vs ~26% in 1QFY10), we think this segment provides a growth opportunity for HH, but also requires greater focus from HH, whose relative positioning is weak vs. Bajaj Auto
Material cost is a concern — Material costs / bike have risen in 2HFY10, and we expect this trend to continue. Contribution / bike has also declined nominally, resulting in EBITDA / bike declining ~5% Q/Q in last quarter of FY10. We believe that as the competition n the market intensifies, the company will find it increasingly difficult to pass on the price hike to consumers.
Uttarakhand plant to buffer margins to certain extent — The company enjoys excise / income tax benefits on its Uttarakhand production facility at Hardwar. With management guiding at increased localization, we expect it to positively impact margins, and have factored these into our estimates.
We remain cautious on the 2-wheeler sector as a whole — There is a macro-micro disconnect between players' forecasts and overall industry growth. Our analysis indicates that for all main players' aspirations to be accommodated, the industry has to grow at 22-26%, which is far higher than the 10-15% industry growth expectation to which most players allude. We expect price driven competition to escalate from 2HFY11.
Statistical Abstract
Year to Net Profit Diluted EPS EPS growth EV/EBITDA P/E P/B P/CEPS ROE Yield31 Mar (RsM) (Rs) (%) (x) (x) (x) (x) (%) (%)2008A 9,679 48.5 na 28.1 39.0 12.7 33.5 na 1.02009A 12,818 64.2 32.4 22.1 29.5 9.9 25.8 37.8 1.12010E 22,318 111.8 74.1 13.6 16.9 10.9 15.6 61.4 5.82011E 25,866 129.5 15.9 12.0 14.6 7.2 13.6 59.4 1.92012E 27,448 137.4 6.1 11.3 13.8 5.4 12.7 44.6 2.1
Source: Company Reports and CIRA Estimates
Hero Honda (HROH.BO)
Hold/Low Risk 2LPrice (11 May 10) Rs1,891.65Target Price Rs2,002.00Expected share price return 5.8%Expected dividend yield 1.9%Expected total return 7.7%Market Cap Rs377,739M US$8,377M
Price Performance
100012001400160018002000
May 09 Aug 09 Nov 09 Feb 10 May 10
INR
Source: dataCentral
Jamshed Dadabhoy +91-22-6631-9883 [email protected] Arvind Sharma +91-22-6631-9852 [email protected]
Company description
Hero Honda is India's largest manufacturer of two-wheelers with ~44% market share. The company has benefited from the demand shift to motorcycles, as it focuses solely on this product segment. It has a strong product portfolio, and received technology and brand support from Honda Motors, Japan. With fuel efficiency and riding comfort as the main selling points, management has been able to address a wide market and post robust sales growth

India Investor Conference 2010 18 May 2010
Citigroup Global Markets 43
Hero Honda (HROH.BO): Financial Summary
Fiscal year end 31-Mar 2008 2009 2010E 2011E 2012E
Valuation RatiosP/E adjusted (x) 39.0 29.5 16.9 14.6 13.8EV/EBITDA adjusted (x) 26.4 20.3 12.1 10.5 9.5P/BV (x) 12.7 9.9 10.9 7.2 5.4Dividend yield (%) 1.0 1.1 5.8 1.9 2.1Per Share Data (Rs)EPS adjusted 48.47 64.18 111.76 129.52 137.45EPS reported 48.47 64.18 111.76 129.52 137.45BVPS 149.54 190.32 173.93 262.54 353.23DPS 19.00 20.00 110.00 35.00 40.00
Profit & Loss (RsM)Net sales 103,318 123,191 158,605 181,774 205,759Operating expenses -91,428 -107,901 -132,852 -152,341 -174,700EBIT 11,891 15,291 25,753 29,433 31,059Net interest expense -20 -25 -23 -30 -31Non-operating/exceptionals 2,232 2,549 2,587 2,929 3,282Pre-tax profit 14,103 17,815 28,317 32,332 34,310Tax -4,424 -4,997 -5,999 -6,466 -6,862Extraord./Min.Int./Pref.div. 0 0 0 0 0Reported net income 9,679 12,818 22,318 25,866 27,448Adjusted earnings 9,679 12,818 22,318 25,866 27,448Adjusted EBITDA 13,494 17,097 27,669 31,426 33,444Growth Rates (%)Sales 4.4 19.2 28.7 14.6 13.2EBIT adjusted 15.1 28.6 68.4 14.3 5.5EBITDA adjusted 15.0 26.7 61.8 13.6 6.4EPS adjusted 12.8 32.4 74.1 15.9 6.1
Cash Flow (RsM)Operating cash flow 14,831 16,751 20,287 29,724 29,899Depreciation/amortization 1,603 1,807 1,916 1,993 2,385Net working capital 3,549 2,126 -3,947 1,865 66Investing cash flow -10,218 -8,824 -16,672 -5,037 -22,635Capital expenditure -3,407 0 -2,000 -3,000 -3,000Acquisitions/disposals -5,929 -8,019 -13,767 -1,131 -18,729Financing cash flow -4,771 -9,202 -25,576 -8,171 -9,338Borrowings -332 -535 15 0 0Dividends paid -4,439 -8,667 -25,592 -8,171 -9,338Change in cash -158 -1,275 -21,962 16,516 -2,074
Balance Sheet (RsM)Total assets 50,523 60,765 76,402 77,846 98,450Cash & cash equivalent 1,311 2,196 2,000 2,000 2,000Accounts receivable 2,974 1,499 2,313 2,111 2,402Net fixed assets 15,487 16,943 17,028 18,035 18,653Total liabilities 20,821 22,757 41,668 25,417 27,909Accounts payable 7,561 7,030 7,892 9,062 10,386Total Debt 1,320 785 800 800 800Shareholders' funds 29,862 38,008 34,734 52,429 70,541
Profitability/Solvency Ratios (%)EBITDA margin adjusted 13.1 13.9 17.4 17.3 16.3ROE adjusted 35.5 37.8 61.4 59.4 44.6ROIC adjusted 116.4 nm na na nmNet debt to equity 0.0 -3.7 -3.5 -2.3 -1.7Total debt to capital 4.2 2.0 2.3 1.5 1.1
For further data queries on Citi’s full coverage universe please contact CIRA Data Services Asia Pacific ([email protected]) or +852-2501-2791
Investment Strategy
We rate Hero Honda shares Hold/Low Risk, given limited upside to our target price of Rs2,002. Moreover, cyclical headwinds - cost pressures from higher input costs and initial signs of resumption of competitive pressures - are beginning to emerge, as a result of which we think it will be difficult for the stock to re-rate meaningfully from current levels. Longer term, we believe Hero Honda will retain its competitive advantage in a challenging operating environment given its superior strategy, significant fiscal incentives and lower dependence on financing. We forecast strong 11% earnings CAGR for Hero Honda over FY10-FY12E driven by a richer product mix and fiscal incentives at its Uttarakhand plant. We forecast 10% EBITDA growth (core operating profits) over FY10-12E. The growth outlook for 2-wheelers remains stable over the next two years, in our view. The vehicle financing cycle is incrementally improving, which augurs well for the volume outlook for both Hero Honda and competition.
Valuation
Our target price of Rs2,002 is based on 15x Sep11E earnings, which we believe is well supported by a robust earnings CAGR of 11% over FY10-12E. While this is to a certain extent driven by tax breaks at the Uttarakhand facility, we derive comfort from our expectations that core EBITDA (operating profits) will grow at 10% CAGR over the same period. Our target multiple of 15x is at a c10% premium to HH's 5-year P/E multiple of 13.8x, which we think is justified given HH's earnings CAGR of 10% over FY10-12E. We have chosen the P/E valuation metric to value HH, given the company's high cash generation, reflecting its strong balance sheet (around Rs49bn in cash and liquid investments).

India Investor Conference 2010 18 May 2010
Citigroup Global Markets 44
Preferred Non-Ferrous Play
Low cost integrated aluminium producer — Hindalco is a low-cost integrated aluminum producer (capacity ~500ktpa) with access to captive power and bauxite. It has a copper smelting capacity of 500ktpa and in aluminum has a strong domestic market share with a dominant 60%-65% share in sheet products. It plans to triple its alumina and aluminum capacity by FY14 in stages, with priority given to projects such as Utkal Alumina (Orissa), Aditya Aluminium (Orissa) and Mahan (Madhya Pradesh).
Aluminium: near term support — Our global aluminium price forecasts are US$2,350/t for FY11 and US$2,416/t for FY12. Aluminium has short-term support from illiquid inventories and merchant premia. Price upside could also come from a power crunch or bauxite shortages, with power cost trends in China an important emerging trend. Longer-term challenges are large stockpiles and capacity build-up.
Copper: TC/RCs weak — TC/RC margins are likely to be under pressure as smelters have accepted a ~38% cut in contract TC/RC for 2010. Also spot TC/RCs are likely to remain under pressure due to the mis-match between smelting and mining capacity. Weakness in TC/RC margins should be compensated somewhat by rising sulphuric acid realizations.
Novelis — Novelis performed well in 3Q FY10 with EBITDA/t coming close to US$300. We believe that its profits are likely to be relatively resilient vs other aluminium producers as its conversion margins should remain relatively steady despite recent LME price weakness. While Novelis’ volumes could be impacted by the uncertain outlook in Europe, the can sheet business (> 50% of Novelis’ sales) should do relatively better than other sectors. Novelis is on track to realize annual cost savings of US$140m before its target of 2QFY11.
Strong standalone 4QFY10 — 4QFY10 adj PAT rose 367% to Rs5.5bn on a sharp jump in aluminium LME prices, richer product mix and better operational efficiencies. PAT would have been higher but for rupee appreciation (46 vs 50), higher coal costs and lower copper TC/RCs. EBITDA rose 166% to Rs8.4bn. Margins were 16% vs. 8% (14% in 3Q). FY10 adj PAT declined 13% to Rs18bn. Margins fell 160bps to 15%.
Coal issues sorted — The increase in coal costs during the last few months has been due to poor quality linkage coal and a price hike (~11%) by Coal India in mid-Oct 2009. The issue of the poor quality coal has been sorted out and Hindalco will now get coal for its Renukoot (UP) facility from one designated mine. Hindalco already has its own coal mine to meet the requirements of its Orissa smelter (~30% of its aluminium smelter capacity).
Hindalco Industries − Statistical Abstract
Year to Net Profit Diluted EPS EPS growth EV/EBITDA P/E P/B P/CEPS ROE Yield31 Mar (RsM) (Rs) (%) (x) (x) (x) (x) (%) (%)2008A 21,678 17.7 na 4.2 9.6 1.2 4.5 1.12009A 26,692 15.7 -11.2 8.8 10.8 1.8 5.1 16.1 0.12010E 9,775 5.1 -67.5 8.0 33.2 1.9 8.6 5.9 0.42011E 38,029 19.9 289.1 5.8 8.5 1.6 5.0 20.1 1.02012E 38,593 20.2 1.5 5.6 8.4 1.3 4.6 17.2 1.0
Source: Company Reports and CIRA Estimates
Hindalco Industries (HALC.BO)
Buy/Medium Risk 1MPrice (11 May 10) Rs169.70Target Price Rs217.00Expected share price return 27.9%Expected dividend yield 0.4%Expected total return 28.3%Market Cap Rs324,712M US$7,201M
Price Performance
0
40
80
120
160
200
May 09 Aug 09 Nov 09 Feb 10 May 10
INR
Source: dataCentral
Pradeep Mahtani +91-22-6631-9882 [email protected]
Raashi Chopra +91-22-6631-9862 [email protected]
Company description
Hindalco is a low-cost integrated aluminum producer (capacity ~500ktpa) with access to captive power and bauxite. It has a copper smelting capacity of 500k tpa and in aluminum has a strong domestic market share with a dominant 60%-65% share in sheet products. It plans to triple its alumina and aluminum capacity by FY14 in stages. It owns copper mines in Australia through its 51% subsidiary, Aditya Birla Minerals, which should meet 10%-15% of its ore requirement. Novelis is the world's leading aluminium rolled products producer (FY09 sales of 2.94m tonnes), and a leader in the can sheet market. Its key markets are North America and Europe (~70% of 9MFY10 shipments) with the rest sold in Asia and South America.

India Investor Conference 2010 18 May 2010
Citigroup Global Markets 45
Hindalco Industries (HALC.BO): Financial Summary
Fiscal year end 31-Mar 2008 2009 2010E 2011E 2012E
Valuation RatiosP/E adjusted (x) 9.6 10.8 33.2 8.5 8.4EV/EBITDA adjusted (x) 5.5 8.5 7.5 5.8 5.8P/BV (x) 1.2 1.8 1.9 1.6 1.3Dividend yield (%) 1.1 0.1 0.4 1.0 1.0Per Share Data (Rs)EPS adjusted 17.67 15.70 5.11 19.87 20.17EPS reported 17.67 15.70 5.11 19.87 20.17BVPS 140.94 93.23 89.42 108.06 127.03DPS 1.85 0.25 0.75 1.75 1.75
Profit & Loss (RsM)Net sales 600,128 656,252 594,058 683,838 697,674Operating expenses -546,874 -626,647 -554,503 -619,121 -625,300EBIT 53,254 29,604 39,555 64,717 72,374Net interest expense -18,491 -12,323 -11,708 -11,293 -18,120Non-operating/exceptionals 0 0 0 0 0Pre-tax profit 34,763 17,281 27,847 53,425 54,254Tax -11,889 8,046 -16,770 -14,794 -14,788Extraord./Min.Int./Pref.div. -1,196 1,365 -1,302 -601 -873Reported net income 21,678 26,692 9,775 38,029 38,593Adjusted earnings 21,678 26,692 9,775 38,029 38,593Adjusted EBITDA 78,137 59,982 67,362 91,968 103,869Growth Rates (%)Sales 210.7 9.4 -9.5 15.1 2.0EBIT adjusted 34.0 -44.4 33.6 63.6 11.8EBITDA adjusted 61.5 -23.2 12.3 36.5 12.9EPS adjusted -23.8 -11.2 -67.5 289.1 1.5
Cash Flow (RsM)Operating cash flow 53,999 45,812 32,542 75,131 77,999Depreciation/amortization 24,883 30,378 27,807 27,251 31,495Net working capital 6,863 18,053 4,633 -3,888 -11,535Investing cash flow -152,437 -23,672 -46,833 -105,062 -144,368Capital expenditure -27,507 -25,988 -48,486 -109,640 -148,880Acquisitions/disposals -133,910 -6,788 -500 -500 -500Financing cash flow 129,222 -67,303 3,310 33,662 76,002Borrowings 127,123 -91,954 -10,070 46,075 98,152Dividends paid -101 -3,532 -2,686 -1,119 -4,030Change in cash 35,354 -48,201 -10,981 3,731 9,633
Balance Sheet (RsM)Total assets 726,467 644,672 654,432 748,916 877,226Cash & cash equivalent 119,349 71,148 60,167 63,897 73,530Accounts receivable 67,174 66,733 61,713 65,462 63,674Net fixed assets 292,391 304,744 325,423 407,812 525,197Total liabilities 537,448 473,270 467,342 524,555 614,940Accounts payable 108,661 96,078 103,634 108,349 104,357Total Debt 323,524 283,098 273,028 319,103 417,254Shareholders' funds 189,019 171,402 187,090 224,362 262,285
Profitability/Solvency Ratios (%)EBITDA margin adjusted 13.0 9.1 11.3 13.4 14.9ROE adjusted 14.4 16.1 5.9 20.1 17.2ROIC adjusted 14.7 9.7 6.1 11.7 10.8Net debt to equity 108.0 123.7 113.8 113.7 131.0Total debt to capital 63.1 62.3 59.3 58.7 61.4
For further data queries on Citi’s full coverage universe please contact CIRA Data Services Asia Pacific ([email protected]) or +852-2501-2791
Investment Strategy
We rate Hindalco Buy/Medium Risk (1M). Our global aluminium price forecasts are $2,350/t for FY11 and $2,416/t for FY12 are based on our global price forecasts. Aluminium has short-term support from illiquid inventories and merchant premia. Longer-term challenges are large stockpiles and capacity build-up. Although our copper prices have been hiked in FY11, PAT does not benefit as we continue to expect TC/RC margins to remain sluggish at 13.8c/lb in FY11. FY12 should be better for Hindalco as we expect TC/RC margins to improve to 20c/lb. Novelis performed well in 3Q FY10 with EBITDA/t coming close to $300. We believe that its profits are likely to be relatively resilient vs other aluminium producers as its conversion margins should remain relatively steady despite recent LME price weakness. Hindalco's net debt to equity is expected to remain around 1.2x in FY10-11 but is likely to rise further based on plans to triple India-based capacity.
Valuation
Our target price of Rs217 is based on SOTP. To value Hindalco standalone we use a P/E of 8.5x on Jun11 EPS, at the higher end of its trading range (6-10x) over the past five years. We use P/E because stocks such as Hindalco are largely driven by commodity price trends, which translate into earnings momentum. The multiple appears justified given our outlook of improving aluminium prices and its position as a low-cost producer. We value Novelis and Hindalco's other businesses at 7.5x EV/EBITDA and estimate an EBITDA/t of $340 in FY11-12. The valuation is at the mid-point of average global multiples (6-9x). At our target price, Hindalco would trade at a consolidated EV/EBITDA of 7.3x and P/E of 10.9x.

India Investor Conference 2010 18 May 2010
Citigroup Global Markets 46
Fundamental Improvements Showing Through
2nd largest, and most diversified, Indian bank — ICICI Bank (ICBK) is India’s largest private sector bank, with an aggressively expanded asset base and spread, positioning itself as a dominant financial services player. While this has worked well in a growing environment, it has also caused a lot of hurt in a slower global economic/asset environment.
Fundamental improvements ahead — With the new management’s focus on a risk averse and “back to basics” strategic direction and execution, ICBK is well positioned for structural upside ahead – on margins, funding stability, balance-sheet balance, and approach to risk. Effectively, ICBK offers the largest and most sustainable opportunity to improving its operating, risk and return measures, in our view.
Quite a few things coming together…— There is continued progress on key counts: a) Asset quality deterioration continues to ease, loan loss coverage continues to rise; b) Deposit mix is now good in absolute terms –CASA at 40%+; c) Foreign subsidiaries appear stable –on returns, quality and funding; d) Fees are reviving in a stable manner; and e) While costs have increased in the quarter - operating cost levels are now low. Bottom line, ICBK is delivering fairly steadily –in-line with its commitments a year ago on key business and value measures.
...although there remains a fair distance to go — We believe there still remains more to do given: a) NIMs remain flat, lagging peers and market forecasts; b) Growth is not yet visible (while peers are on a dash); and c) Profitability remains modest with ROEs low compared to peers and improving only gradually.
Offshore risks easing – but value creation potential? — ICBK’s offshore asset book (25% of total) has been a source of write-downs, concerns and opacity. While we believe the worst is likely over, the scale of its exposure, returns on this portfolio, and the potential value/franchise such a large book creates remain questionable, and we believe it will drag on the overall business.
Statistical Abstract
Year to Net profit EPS EPS Growth PE PB ROAE ROAA Div Yield31 Mar (RsM) (Rs) (%) (x) (x) (%) (%) (%)FY08 41,574 37 7.2 24.8 2.2 12 1.1 1.2FY09 37,578 33 -9.7 27.5 2.1 8 1.0 1.2FY10E 40,246 36 6.9 25.7 2.0 8 1.1 1.3FY11E 48,833 43 21.3 21.2 1.9 9 1.3 1.4FY12E 65,090 58 33.3 15.9 1.7 11 1.6 1.4
Source: Company Data, Citi Investment Research and Analysis Estimates
ICICI Bank (ICBK.BO)
Hold/Medium Risk 2MPrice (11 May 10) Rs915.95Target Price Rs1,065.00Expected share price return 16.3%Expected dividend yield 1.3%Expected total return 17.6%Market Cap Rs1,021,293M US$22,648M
Price Performance
500
600
700
800
900
May 09 Aug 09 Nov 09 Feb 10 May 10
INR
Source: dataCentral
Aditya Narain, CFA +91-22-6631-9879 [email protected] Manish Chowdhary, CFA +91-22-6631-9853 [email protected] Pooja Kapur [email protected]
Company description
ICICI Bank was founded in 1994 by ICICI Ltd., which was then the country's leading development finance institution. It is a leader in retail lending, with more than 30% market share in all consumer-finance segments. ICICI Bank has international banking operations as its key focus area.

India Investor Conference 2010 18 May 2010
Citigroup Global Markets 47
ICICI Bank (ICBK.BO): Financial Summary
2008 2009 2010E 2011E 2012E
Valuation RatiosP/E adjusted (x) 24.8 27.5 25.7 21.2 15.9P/E reported (x) 24.8 27.5 25.7 21.2 15.9P/BV (x) 2.2 2.1 2.0 1.9 1.7P/Adjusted BV diluted (x) 2.2 2.1 2.0 1.9 1.7Dividend yield (%) 1.2 1.2 1.3 1.4 1.4Per Share Data (Rs)EPS adjusted 36.93 33.36 35.68 43.30 57.71EPS reported 36.93 33.36 35.68 43.30 57.71BVPS 417.64 444.92 462.99 491.33 533.68Tangible BVPS 417.64 444.92 462.99 491.33 533.68Adjusted BVPS diluted 412.82 439.79 457.65 485.66 527.53DPS 11.04 11.00 12.00 12.50 13.00
Profit & Loss (RsM)Net interest income 73,041 83,666 81,144 93,373 110,692Fees and commissions 56,053 56,259 46,964 55,418 67,610Other operating Income 32,735 24,919 27,812 26,644 28,910Total operating income 161,829 164,844 155,920 175,434 207,212Total operating expenses -81,542 -70,451 -58,598 -64,117 -71,200Oper. profit bef. provisions 80,288 94,393 97,322 111,317 136,012Bad debt provisions -28,423 -37,105 -43,869 -44,419 -46,843Non-operating/exceptionals -1,303 -6,118 0 0 0Pre-tax profit 50,561 51,170 53,453 66,899 89,170Tax -8,984 -13,588 -13,203 -18,063 -24,076Extraord./Min. Int./Pref. Div. -3 -4 -3 -3 -3Attributable profit 41,574 37,578 40,246 48,833 65,090Adjusted earnings 41,574 37,578 40,246 48,833 65,090Growth Rates (%)EPS adjusted 7.2 -9.7 6.9 21.3 33.3Oper. profit bef. prov. 35.9 17.6 3.1 14.4 22.2
Balance Sheet (RsM)Total assets 3,997,951 3,793,010 3,633,997 3,873,224 4,356,629Avg interest earning assets 3,505,124 3,637,413 3,475,885 3,561,376 3,931,042Customer loans 2,329,796 2,272,275 1,926,431 2,265,810 2,682,921Gross NPLs 75,795 96,492 93,429 117,194 142,275Liab. & shar. funds 3,997,951 3,793,010 3,633,997 3,873,224 4,356,629Total customer deposits 2,444,311 2,183,478 2,020,166 2,222,183 2,582,940Reserve for loan losses 54,764 63,166 90,974 127,258 161,358Shareholders' equity 468,202 498,830 519,684 551,274 598,495
Profitability/Solvency Ratios (%)ROE adjusted 11.7 7.8 8.0 9.2 11.4Net interest margin 2.1 2.3 2.3 2.6 2.8Cost/income ratio 50.4 42.7 37.6 36.5 34.4Cash cost/average assets 2.2 1.8 1.6 1.7 1.7NPLs/customer loans 3.3 4.2 4.8 5.2 5.3Reserve for loan losses/NPLs 72.3 65.5 97.4 108.6 113.4Bad debt prov./avg. cust. loans 1.3 1.6 2.1 2.1 1.9Loans/deposit ratio 95.3 104.1 95.4 102.0 103.9Tier 1 capital ratio 11.8 12.2 13.8 12.8 11.9Total capital ratio 14.0 15.9 18.0 16.6 15.4
For further data queries on Citi’s full coverage universe please contact CIRA Data Services Asia Pacific ([email protected]) or +852-2501-2791
Investment Strategy
We rate ICICI Bank as Hold/Medium Risk (2M). While we believe the business offers meaningful upside on fundamental operating improvements (margins, asset quality, business balance, and leverage on its franchise), there remains near-term pressures. These include low profitability, an asset book which remains under pressure (and is unlikely to start improving quickly), and a large international lending book that we believe is too large and diversified to offer a reasonable risk/return trade off. While management is making aggressive strategic moves in the right direction, it will take time to play out, and the stock appears to have quickly factored in rapid execution and returns. Its financial services subsidiaries, particularly insurance, also add meaningful value and complement its core banking business, but we believe value gains are probably more measured than stock market moves suggest at this point in time.
Valuation
Our target price of Rs1,065 is based on EVA which we believe adjusts better for the relatively dynamic cost of capital and better captures the long-term value of a business. We use: a) a long-term Cost-Income ratio of 35%; b) a long-term loan loss estimate of 110 bps; c) Rs201 as value of subsidiaries; and d) a Risk Free Rate of 8%. We also benchmark our valuation to a SOTP analysis. ICICI Bank's domestic banking is valued on 2.25x 1yr Fwd PBV and international business at 1.0x, translating into an overall PBV target multiple of 1.9x 1yr Fwd. Our target multiple is based on peaking of asset quality issues, stabilization of deposit franchise and expectations of a loan growth revival. The rest of the value is driven by its subsidiaries: life insurance at Rs127, general insurance at Rs15, AMC at Rs22, ICICI Securities at Rs21, primary dealer at Rs6 and venture fund at Rs11. The subsidiaries are valued based on industry benchmarks.

India Investor Conference 2010 18 May 2010
Citigroup Global Markets 48
Leveraging on Scale
Amongst market leaders — ICICI Prudential has been a leader amongst India’s private sector insurance companies from the day the sector opened. It has almost a 17% private sector share (6% overall), and has consistently been at the top of market share charts. While growth slowed significantly for the industry (and relatively more for ICICI) it is still the second largest private sector insurance player.
Economics: scale and asset management fees — ICICI’s profitability is leveraged to the economics of scale. Volumes bring efficiencies, which are reflected in expense ratios. Its products are also geared towards higher asset management fees – which gear it to higher asset returns, and persistency. It is also aggressive in the low-return group business – provides volume, leverages the group’s broader franchise, and could bring in individual business at a later point.
Growth is equity-linked, but recovery likely to lag the market — Growth in insurance has largely come from sale of unit-linked products that offer capital market linked upside. A slower-growth environment is consolidating the business – capital requirements are easing, profitability is rising, and is supporting a more balanced business approach than in its high growth years
Distribution – Time for consolidation? — ICICI-Pru is in the latter stages of its distribution growth; after expanding rapidly for a number of years, it now is in the process of consolidating the branch network, agency force while trying to achieve efficiencies in each of its channels. The challenge lies in execution, which could well increase as distribution goes into the hinterland.
Operating performance currently — 90% of business is unit linked, 60% of AUM are equity, persistency rates have dipped and are relatively modest at 65-70% (possibly distorted by short-term policy lapses), and the business is now profitable. Pru-ICICI’s renewal premium at over 50% of total premium is amongst the highest, suggests a more stable and predictable premium profile than most, and the opportunity to now leverage on its scale
_______________________________________________________________
_______________________________________________________________
_______________________________________________________________
_______________________________________________________________
_______________________________________________________________
__________________________________________________________________
__________________________________________________________________
__________________________________________________________________
__________________________________________________________________
ICICI Prudential Life Insurance
Non-Rated Price NA (Unlisted)
Aditya Narain, CFA +91-22-6631-9879 [email protected] Manish Chowdhary, CFA +91-22-6631-9853 [email protected] Pooja Kapur [email protected]
Company Description
ICICI Prudential Life Insurance company Ltd. is a 74:26 joint venture between ICICI Bank and Prudential of UK. Prudential has the right of first refusal to increase its stake to 49%, if regulations allow for it, at market determined valuations. It has a market share of about 17% amongst private sector players and continues to remain amongst the leaders in the private segment despite the slowdown in its growth.

India Investor Conference 2010 18 May 2010
Citigroup Global Markets 49
This page is left blank intentionally

India Investor Conference 2010 18 May 2010
Citigroup Global Markets 50
Baseline Known – How High Can the Bar Be Set?
FY11 revenue growth — Company guidance of 16-18% revenue growth (US$-terms) has already set the baseline. With analysts/investors expectations already at ~25% YoY – key question for management would be how high can revenues grow in FY11 given the pent up demand?
Outlook on margins — Infosys’ cost management abilities have been widely documented. Management has guided for a margin decline of ~150bps for FY11. With INR appreciation and attrition worries (company gave salary hikes in Oct’09 and again in Apr’10), the outlook on margins should be discussed with management.
Return of pricing power — With the return in demand, pricing discounts seem to be a thing of the past. However, with increased attrition, vendors are grappling with salary hikes across the board. Pricing is one of the key levers available to companies in order to manage their margins. A key question would be the timing of the return of pricing power for vendors.
Supply side dynamics — Company’s view on supply side dynamics should be another area to discuss with focus on the following – (1) availability of talent (engineers) for next few years; (2) company’s initiatives on training (3) right-skilling initiative – hiring of science graduates.
Use of cash — Infosys is sitting on a cash pile of ~US$3.5b. Possible usage of this cash in terms of M&A, special dividend, etc would be worth exploring.
SEZ strategy — Infosys’ SEZ readiness, given the expectation of STPI sunset clause coming into effect by Apr’11 should be discussed. Expectations of the tax rate in FY11/12E etc. could be gauged.
Statistical Abstract
Year to Net Profit Diluted EPS
EPS growth
EV/EBITDA P/E P/B P/CEPS ROE Yield
31 Mar (RsM) (Rs) (%) (x) (x) (x) (x) (%) (%)
2009A 59,880 104.4 na 20.3 25.5 8.4 22.6 na 0.9
2010A 62,660 109.3 4.7 18.2 24.4 6.6 21.3 30.3 0.9
2011E 70,290 123.0 12.6 15.8 21.6 5.4 19.1 27.4 1.2
2012E 82,027 143.6 16.7 13.0 18.5 4.4 16.4 26.1 1.4
2013E 95,556 167.3 16.5 10.8 15.9 3.7 14.1 25.1 1.6
Source: Powered by dataCentral
Infosys Technologies (INFY.BO)
Hold/Low Risk 2LPrice (11 May 10) Rs2,663.15Target Price Rs2,935.00Expected share price return 10.2%Expected dividend yield 1.2%Expected total return 11.4%Market Cap Rs1,528,183M US$34,073M
Price Performance
0500
10001500200025003000
May 09 Aug 09 Nov 09 Feb 10 May 10
INR
Source: dataCentral
Surendra Goyal, CFA1 +91-22-6631-9870 [email protected]
Vishal Agarwal1 +91-22-6616-2742 [email protected]
Company description
Infosys is the second-largest Indian IT services company with more than 110,000 professionals, and is a leader in the offshore services space. Infosys provides business consulting, application development & maintenance and engineering services to ~570 active clients across verticals such as Banking, Financial Services, Insurance, Retail, Manufacturing and Utilities in the Americas, Europe and Asia Pacific. Infosys also sells a core banking application, Finacle, which is used by leading banks in India, the Middle East, Africa and Europe. Its subsidiary, Infosys BPO, which employs ~18,000 people, is a provider of BPO services.

India Investor Conference 2010 18 May 2010
Citigroup Global Markets 51
Infosys Technologies (INFY.BO): Financial Summary
Fiscal year end 31-Mar 2009 2010 2011E 2012E 2013E
Valuation RatiosP/E adjusted (x) 25.5 24.4 21.6 18.5 15.9EV/EBITDA adjusted (x) 20.1 17.9 15.1 12.4 10.3P/BV (x) 8.4 6.6 5.4 4.4 3.7Dividend yield (%) 0.9 0.9 1.2 1.4 1.6Per Share Data (Rs)EPS adjusted 104.42 109.31 123.04 143.58 167.26EPS reported 104.42 109.31 123.04 143.58 167.26BVPS 318.71 403.77 495.91 603.60 729.00DPS 23.50 25.00 31.00 36.00 42.00
Profit & Loss (RsM)Net sales 216,930 227,420 264,970 311,517 363,923Operating expenses -152,590 -157,860 -183,933 -216,140 -252,987EBIT 64,340 69,560 81,038 95,376 110,936Net interest expense 4,730 9,910 11,273 14,368 16,935Non-operating/exceptionals 0 0 0 0 0Pre-tax profit 69,070 79,470 92,311 109,745 127,871Tax -9,190 -16,810 -22,021 -27,718 -32,315Extraord./Min.Int./Pref.div. 0 0 0 0 0Reported net income 59,880 62,660 70,290 82,027 95,556Adjusted earnings 59,880 62,660 70,290 82,027 95,556Adjusted EBITDA 71,950 78,610 90,249 105,930 123,000Growth Rates (%)Sales 30.0 4.8 16.5 17.6 16.8EBIT adjusted 38.7 8.1 16.5 17.7 16.3EBITDA adjusted 37.4 9.3 14.8 17.4 16.1EPS adjusted 28.5 4.7 12.6 16.7 16.5
Cash Flow (RsM)Operating cash flow 50,670 57,270 67,006 72,708 84,472Depreciation/amortization 7,610 9,050 9,211 10,554 12,065Net working capital -12,020 -1,470 -1,222 -5,504 -6,213Investing cash flow -13,380 -9,060 -16,505 -19,909 -22,633Capital expenditure -13,380 -9,060 -16,505 -19,909 -22,633Acquisitions/disposals 0 0 0 0 0Financing cash flow -15,290 -12,390 -20,016 -20,550 -23,975Borrowings 0 2,320 -2,320 0 0Dividends paid -13,456 -14,294 -17,696 -20,550 -23,975Change in cash 22,000 35,820 30,485 32,248 37,865
Balance Sheet (RsM)Total assets 221,260 277,360 331,319 403,402 484,542Cash & cash equivalent 96,950 105,560 147,318 193,934 248,734Accounts receivable 36,720 34,940 41,070 49,843 58,228Net fixed assets 53,540 53,550 60,844 70,200 80,768Total liabilities 38,720 46,870 48,236 58,842 68,401Accounts payable 20,040 23,430 28,377 34,708 40,256Total Debt 0 0 0 0 0Shareholders' funds 182,540 230,490 283,084 344,560 416,141
Profitability/Solvency Ratios (%)EBITDA margin adjusted 33.2 34.6 34.1 34.0 33.8ROE adjusted 37.4 30.3 27.4 26.1 25.1ROIC adjusted 73.1 62.0 65.5 66.5 66.9Net debt to equity -53.1 -45.8 -52.0 -56.3 -59.8Total debt to capital 0.0 0.0 0.0 0.0 0.0
For further data queries on Citi’s full coverage universe please contact CIRA Data Services Asia Pacific ([email protected]) or +852-2501-2791
Investment Strategy
We rate Infosys shares as Hold/Low Risk (2L) for valuation reasons. We are positive on the company's fundamentals. Offshore IT outsourcing has become a mainstream option, and we think that scale and scalability, along with an ability to move up the value chain, are key criteria for successful offshore vendors. In this respect, Infosys appears well positioned and continues to gain ground given its strong branding and industry-leading sales force. Unlike other high-growth firms in other industries, Infosys continues to generate solid FCF and its RoE of ~30% remains well above its cost of capital.
Valuation
Our Rs2,935 target price for Infosys is based on 22x the average of FY11-12E EPS. This is around the mid-point of the last three-year trading band of 11x-30x 12-month forward earnings and factors in some deceleration in growth. Our estimates continue to assume a certain PE premium to the market; this is justified, in our view, given the strong FCF and ROIC for Infosys vs. the overall market. We believe PE remains the most appropriate valuation measure given Infosys' profitability record and higher earnings visibility.

India Investor Conference 2010 18 May 2010
Citigroup Global Markets 52
Financing the Infrastructure Charge
Focused infrastructure development and financing entity — IDFC is at the forefront of financing, advising and policy formulation for one of India’s fastest growing segments. It has aggressively built up asset management and investment banking businesses, which broaden and stabilize its revenue stream, and generate synergies with its core infrastructure proposition.
Key lending thrust on Infrastructure assets — IDFC's focus is on infrastructure assets – direct and structured financing, technical and risk advisory, and directed and private type investments. These assets dominate its book, which is diversified across industries in this space, and will continue to be its focus. It is the most prominent financier in this space.
IDFC will be an ‘Infrastructure NBFC’ — IDFC has so far operated off a finco platform; primarily wholesale funded, with low reserve requirements, lending flexibility and low costs. It is now seeking to take on a new ‘infrastructure financier’ platform; this has been newly created by the regulator, should bolster funding options and costs, lend greater asset flexibility, and management suggests significantly higher growth levels.
Asset growth accelerating quickly, quality amongst the best — After a period of caution amidst the slowdown last year, IDFC's pace of loan growth accelerated to 22% YoY for FY10; a strong approval pipeline, likely capital boost and management guidance suggests a significant acceleration over the next 2-3 years. Strong asset quality, with high coverage levels, provides the backdrop and confidence for effective execution
Diversified earnings stream, with aggressive asset management initiatives — IDFC earnings stream has historically been margin and investment-gains driven. This has diversified in recent years through aggressive management initiatives in asset management, private equity, brokerage and investment banking and principal trading. This should potentially bolster growth and moderate its dependence on lending margins.
Statistical Abstract
Year Net profit EPS EPS Growth PE PB ROAE ROAA Div yieldMarch (Rs. M) Rs. (%) (x) (x) (%) (%) (%)FY08 7,422 6 36.8 25.9 3.7 17 3.1 0.7FY09 7,498 6 -5.6 27.5 3.3 13 2.5 0.7FY10E 11,253 9 50.0 18.3 2.9 17 3.4 0.8FY11E 13,348 10 18.6 15.4 2.5 17 3.4 0.9FY12E 15,910 12 19.2 12.9 2.1 18 3.3 0.9
Source: Company data, Citi Investment Research and Analysis estimates
Infrastructure Development Finance (IDFC.BO)
Sell/Medium Risk 3MPrice (11 May 10) Rs159.05Target Price Rs141.00Expected share price return -11.3%Expected dividend yield 0.8%Expected total return -10.5%Market Cap Rs207,924M US$4,611M
Price Performance
80100120140160180
May 09 Aug 09 Nov 09 Feb 10 May 10
INR
Source: dataCentral
Manish Chowdhary, CFA +91-22-6631-9853 [email protected] Aditya Narain, CFA +91-22-6631-9879 [email protected] Pooja Kapur [email protected]
Company description
IDFC was established in 1997 as a specialized Infrastructure financier / advisor and to encourage private sector investments in the infrastructure sector. It has been actively associated with the government in policy formulation, and has probably the foremost set of skills in this space. It enjoys a central positioning as amongst the forerunners on the policy advisory space in infrastructure and is seen as the referred investor, lender and advisor. Though IDFC has diversified its product offerings to include non-fund based products, asset management and private equity along with debt finance and syndication opportunities; the lending business remains its key operational focus.

India Investor Conference 2010 18 May 2010
Citigroup Global Markets 53
Infrastructure Development Finance (IDFC.BO): Financial
Summary
2008 2009 2010E 2011E 2012E
Valuation RatiosP/E adjusted (x) 25.9 27.5 18.3 15.4 12.9P/E reported (x) 25.9 27.5 18.3 15.4 12.9P/BV (x) 3.7 3.3 2.9 2.5 2.1P/Adjusted BV diluted (x) 3.7 3.3 2.9 2.5 2.1Dividend yield (%) 0.8 0.8 0.8 0.9 0.9Per Share Data (Rs)EPS adjusted 6.13 5.79 8.69 10.31 12.28EPS reported 6.13 5.79 8.69 10.31 12.28BVPS 43.21 47.68 54.85 63.51 74.16Tangible BVPS 43.21 47.68 54.85 63.51 74.16Adjusted BVPS diluted 43.21 47.68 54.85 63.51 74.16DPS 1.20 1.20 1.30 1.40 1.40
Profit & Loss (RsM)Net interest income 5,811 7,645 10,221 12,283 14,871Fees and commissions 4,013 4,287 5,931 7,315 8,680Other operating Income 3,413 3,624 4,120 4,863 5,607Total operating income 13,236 15,556 20,272 24,462 29,158Total operating expenses -2,532 -3,665 -4,430 -5,272 -6,389Oper. profit bef. provisions 10,704 11,891 15,843 19,189 22,769Bad debt provisions -700 -1,532 -551 -922 -992Non-operating/exceptionals 46 13 13 13 13Pre-tax profit 10,050 10,372 15,305 18,281 21,790Tax -2,480 -2,782 -4,052 -4,932 -5,880Extraord./Min. Int./Pref. Div. -148 -92 0 0 0Attributable profit 7,422 7,498 11,253 13,348 15,910Adjusted earnings 7,422 7,498 11,253 13,348 15,910Growth Rates (%)EPS adjusted 36.8 -5.6 50.0 18.6 19.2Oper. profit bef. prov. 68.9 11.1 33.2 21.1 18.7
Balance Sheet (RsM)Total assets 289,411 307,865 359,266 436,317 519,615Avg interest earning assets 221,917 274,560 302,509 361,083 434,649Customer loans 199,334 206,194 247,791 309,163 370,692Gross NPLs 275 351 581 888 1,191Liab. & shar. funds 289,411 307,865 359,266 436,317 519,615Total customer deposits 0 0 0 0 0Reserve for loan losses 283 231 381 652 985Shareholders' equity 55,933 61,759 71,041 82,268 96,057
Profitability/Solvency Ratios (%)ROE adjusted 17.4 12.7 16.9 17.4 17.8Net interest margin 2.6 2.8 3.4 3.4 3.4Cost/income ratio 19.1 23.6 21.9 21.6 21.9Cash cost/average assets 1.1 1.2 1.3 1.3 1.3NPLs/customer loans 0.1 0.2 0.2 0.3 0.3Reserve for loan losses/NPLs 102.8 66.0 65.5 73.4 82.7Bad debt prov./avg. cust. loans 0.4 0.8 0.2 0.3 0.3Loans/deposit ratio na na na na naTier 1 capital ratio 19.5 19.5 19.1 18.1 17.7Total capital ratio 22.2 21.9 21.2 19.7 19.2
For further data queries on Citi’s full coverage universe please contact CIRA Data Services Asia Pacific ([email protected]) or +852-2501-2791
Investment Strategy
We rate IDFC shares Sell/Medium Risk (3M) with Rs141 target price. IDFC appears well positioned to benefit from India's large infrastructure opportunity. We believe IDFC has a quality management team, is one of the few pure plays on infrastructure financial services, and offers long-term growth potential. However, it faces significant challenges - regulatory, competitive, and capital markets related. IDFC's key challenges come from: a) Wholesale funding - borrowing costs are exposed to sharp hikes in interest rates and tightness in market liquidity; b) Competition - from larger scale and lower funding cost banks; c) Finance company platform - limits leverage relative to banks (higher capital adequacy requirement of 15% relative to banks); d) Business model - relatively higher portfolio concentrations as against banks; and e) Capital market-related revenues - over 50% of IDFC's revenues are linked to capital markets.
Valuation
We value IDFC at Rs141 based on our sum-of-the-parts methodology. We value IDFC's core lending business at Rs110 per share; we prefer a P/BV multiple of 2.5x 1yr-Fwd, given its sub-15% core ROE. This reflects IDFC's premium positioning in the infrastructure segment, strong management, long track record of low asset risks and relatively high growth profile. However, its target multiple is constrained by its lack of retail asset, liability and distribution franchises relative to premier private bank franchises. We value the asset management at Rs15 per share sub-divided into Rs6 for the private equity segment (8% of AUMs) and Rs9 for the Stanchart AMC business (5% of AUMs). We value IDFC's stake in SSKI at Rs7 per share based on 15x 1yr Fwd profits. Finally, we also add Rs8 for IDFC's unrealized investment gains including the NSE.

India Investor Conference 2010 18 May 2010
Citigroup Global Markets 54
Leading road developer − IRB Infrastructure Developers (“IRB”), incorporated in 1998, is one of the leading infrastructure companies in India, focusing on the development of roads and highways. IRB designs, builds and operates roads and highways. IRB manages one of the largest road portfolios in India – with a total length of ~1150kms. It has a market share of ~7.22% in the Golden Quadrilateral.
Integrated business model − IRB’s development business involves developing roads and highways on a BOT (Built-Operate-Transfer) basis. It has an in-house construction business which undertakes the construction of the road projects. Similarly, the operation and maintenance activities, including toll collection, pertaining to BOT projects are also executed within the IRB group.
IRB has a portfolio of 16 road assets − 10 roads are operational and 6 are under development. The company has its presence in the states of Maharashtra, Gujarat, Punjab, Rajasthan and Goa. About 33% of IRB's revenues in Q4FY10 were from Mumbai-Pune Expressway; 39% from Surat-Dahisar expressway; and 14% from Bharuch-Surat expressway. More project wins will reduce the dependence on the Mumbai-Pune Expressway.
_______________________________________________________________
_______________________________________________________________
_______________________________________________________________
_______________________________________________________________
_______________________________________________________________
_______________________________________________________________
_______________________________________________________________
_______________________________________________________________
_______________________________________________________________
_______________________________________________________________
_______________________________________________________________
_______________________________________________________________
_______________________________________________________________
__________________________________________________________________
__________________________________________________________________
__________________________________________________________________
__________________________________________________________________
IRB Infrastructure Developers (IRBI.BO)
Non-Rated Price (11 May 10) Rs272.6 Market Cap US$1992.7m
Price Performance
100
150
200
250
300
11 May 11 Sep 11 Jan 11 May
INR
Source: dataCentral
Deepal Delivala +91-22-6631-9857 [email protected]
Company Description
IRB Infrastructure Developers Ltd. was incorporated to fund the capital requirements of the IRB Group initiatives in the infrastructure sector. The company undertakes development of various infrastructure projects in the road sector through several Special Purpose Vehicles.
The company, along with its subsidiaries, has constructed or operated and maintained around 1200 kms of road length so far and is one of the major road developers in India.

India Investor Conference 2010 18 May 2010
Citigroup Global Markets 55
IRB (IRBI.BO): Financial Summary
Figure 1. IRB – Consolidated P&L (Rsmn)
FY07 FY08 FY09Total Income 3,057 7,327 9,919 Total direct expenses (1,078) (2,589) (4,682)Total Personnel Expenses (148) (341) (425)Total Admin expenses (177) (278) (438) Total Expenses (1,403) (3,208) (5,545)EBITDA 1,654 4,119 4,374 EBITDA Margin % 54% 56% 44% Depreciation (526) (1,016) (1,144)EBIT 1,128 3,103 3,230 EBIT Margin % 37% 42% 33% Total finance charges (877) (1,958) (1,377)Total other income 194 520 296 Profit Before Tax 445 1,666 2,149 Total tax (148) (400) (378)Effective tax rate 33% 24% 18% Profit after Tax 298 1,266 1,772 Less: Minority interest (72) (126) (13)PAT after Minority interest 225 1,139 1,758 % Growth 405% 54%
Source: IRB Annual Report
Figure 2. IRB – Consolidated BS (Rsmn)
FY07 FY08 FY09Share capital 2,473 3,324 3,324 Reserves and Surplus 1,303 12,883 13,977 Minority interest 1,118 281 599 Total Loan funds 25,180 20,212 24,859 Deferred Tax liability 26 182 Total Liability 30,073 36,727 42,940 Gross Block 21,193 22,188 24,601 Less Depreciation 2,326 3,340 4,440 Net Block 18,868 18,848 20,161 CWIP 5,552 8,889 14,545 Investments 413 1,985 1,108 Net Current assets (ex. Cash) 1,349 1,768 2,968 Cash and bank balances 3,703 5,221 4,147 Misc Expenses W/off 181 16 10 DTA 6 Total Assets 30,073 36,727 42,940
Source: IRB Annual Report
Recent Developments
The company has emerged as the preferred bidder for the construction of a six-lane road in Karnataka on BOT basis. The estimated cost of the project is Rs12bn and the length is 114 km.

India Investor Conference 2010 18 May 2010
Citigroup Global Markets 56
Cigarette Business Continues to Deliver
Cigarette pricing remains strong — Since Feb 2010, ITC has increased cigarette prices by a weighted average of ~15% – sufficient to a) absorb ~17% excise duty hike, b) ~15% increase in tobacco leaf costs and c) VAT increases in states like Karnataka, Gujarat, AP (increased to 15-20% from 12.5%). Effective price hike for consumers will be slightly <15%, as they will be absorbed by dealers through lower coinage benefits.
Volumes to grow in FY11? — Mgmt expects cigarette volumes to be flat/slightly positive Y/Y, reflecting the impact of price hikes. Checks with the trade reveal that price hikes have been absorbed relatively easily. Growth rates might be higher if ITC introduces a brand in the new <60mm filter cigarette segment (lower tax slab). This would aid the underlying volume growth; however, could impact the mix.
Other FMCG losses better than expected in FY10 — Non cigarette FMCG EBIT losses in this category at ~Rs3.5bn for FY10 were better than the target outlined by the
management at the commencement of the fiscal. We believe that this is driven by biscuits
portfolio breakeven (despite higher input costs) and better contribution from retailing.
FY11 could be a challenge on account of escalating competitive pressures in personal care products.
Cyclical business' contribution should improve — Some green shoots are visible in the hotels business- we expect improvement from 2HFY11 onwards, driven by economic recovery, which should result in better occupancies and REVPARS. Paper business profitability is expected to grow ~12-15%, driven by price growth. On the agri business, mgmt decision to focus on higher profitability products resulted in EBIT margins increasing to 11% in FY09 (vs. 5.2% in FY08). Mgmt noted that the margin trend remains favorable – margins are now ~12-13%, bolstered by higher leaf tobacco prices (~40% of revenues, vs. ~20% in FY08).
Statistical Abstract
Year to Net Profit Diluted EPS EPS growth EV/EBITDA P/E P/B P/CEPS ROE Yield31 Mar (RsM) (Rs) (%) (x) (x) (x) (x) (%) (%)2008A 31,201 8.3 na 22.3 31.3 8.1 27.4 na 1.42009A 32,636 8.6 4.4 20.2 30.0 7.1 25.6 25.3 1.42010E 40,043 10.6 22.7 16.3 24.4 6.2 21.2 27.2 1.82011E 48,129 12.8 20.2 13.6 20.3 5.4 17.9 28.4 2.12012E 55,354 14.7 15.0 11.8 17.7 4.7 15.7 28.4 2.4
Source: Company Reports and CIRA Estimates
ITC (ITC.BO)
Buy/Low Risk 1LPrice (11 May 10) Rs259.00Target Price Rs302.00Expected share price return 16.6%Expected dividend yield 1.8%Expected total return 18.4%Market Cap Rs988,908M US$21,929M
Price Performance
180
205
230
255
280
May 09 Aug 09 Nov 09 Feb 10 May 10
INR
Source: dataCentral
Jamshed Dadabhoy +91-22-6631-9883 [email protected] Aditya Mathur +91-22-6631-9841 [email protected]
Company description
ITC is the leading cigarette manufacturer and marketer in India with about 74% market share by volumes. The group is ~32% owned by BAT (British American Tobacco). The company's cigarette portfolio carries strong brands such as Wills, Gold Flake, India Kings and Scissors, and two of BAT's global brands, Benson & Hedges and State Express 555. Besides tobacco, ITC operates in four other business divisions, namely a) agri / marine products, b) hotels, c) paper & packaging and d) IT. However, ~65% of its revenues and 88% of its profits are from the cigarette business (in FY09). The group has made significant investments in the hotels, paperboard and processed foods (biscuits, ready-to-eat foods, confectioneries) businesses.

India Investor Conference 2010 18 May 2010
Citigroup Global Markets 57
ITC (ITC.BO): Financial Summary
Fiscal year end 31-Mar 2008 2009 2010E 2011E 2012E
Valuation RatiosP/E adjusted (x) 31.3 30.0 24.4 20.3 17.7EV/EBITDA adjusted (x) 22.0 19.9 16.1 13.4 11.7P/BV (x) 8.1 7.1 6.2 5.4 4.7Dividend yield (%) 1.4 1.4 1.8 2.1 2.4Per Share Data (Rs)EPS adjusted 8.28 8.65 10.61 12.75 14.67EPS reported 8.28 8.65 10.61 12.75 14.67BVPS 32.00 36.39 41.68 48.03 55.33DPS 3.50 3.70 4.56 5.48 6.31
Profit & Loss (RsM)Net sales 139,475 153,881 174,268 205,803 235,716Operating expenses -99,747 -110,557 -120,170 -140,388 -160,441EBIT 39,728 43,324 54,098 65,415 75,275Net interest expense -120 -183 -414 -413 -313Non-operating/exceptionals 6,109 5,117 5,904 6,618 7,410Pre-tax profit 45,718 48,257 59,587 71,620 82,372Tax -14,517 -15,622 -19,545 -23,491 -27,018Extraord./Min.Int./Pref.div. 0 0 0 0 0Reported net income 31,201 32,636 40,043 48,129 55,354Adjusted earnings 31,201 32,636 40,043 48,129 55,354Adjusted EBITDA 44,113 48,818 60,148 72,011 82,354Growth Rates (%)Sales 12.8 10.3 13.2 18.1 14.5EBIT adjusted 10.3 9.1 24.9 20.9 15.1EBITDA adjusted 11.3 10.7 23.2 19.7 14.4EPS adjusted 15.4 4.4 22.7 20.2 15.0
Cash Flow (RsM)Operating cash flow 31,460 37,281 38,781 46,200 54,571Depreciation/amortization 4,385 5,494 6,050 6,596 7,079Net working capital -4,848 -4,070 -7,312 -8,525 -7,862Investing cash flow -19,900 -16,429 -15,000 -15,000 -12,000Capital expenditure -21,232 -17,397 -15,000 -15,000 -12,000Acquisitions/disposals 1,332 968 0 0 0Financing cash flow -14,860 -16,231 -16,744 -26,152 -27,777Borrowings 136 -369 3,350 -2,000 0Dividends paid -15,432 -16,299 -20,094 -24,152 -27,777Change in cash -3,299 4,621 7,036 5,049 14,794
Balance Sheet (RsM)Total assets 172,495 194,848 224,588 256,318 293,203Cash & cash equivalent 5,703 10,324 17,360 22,409 37,203Accounts receivable 7,369 6,687 8,641 11,165 12,672Net fixed assets 72,957 84,860 93,810 102,213 107,134Total liabilities 51,918 57,498 67,289 75,041 84,349Accounts payable 27,870 29,645 32,204 37,755 43,277Total Debt 2,144 1,776 5,125 3,125 3,125Shareholders' funds 120,577 137,351 157,300 181,277 208,854
Profitability/Solvency Ratios (%)EBITDA margin adjusted 31.6 31.7 34.5 35.0 34.9ROE adjusted 27.7 25.3 27.2 28.4 28.4ROIC adjusted 25.8 23.5 25.3 26.7 27.4Net debt to equity -3.0 -6.2 -7.8 -10.6 -16.3Total debt to capital 1.7 1.3 3.2 1.7 1.5
For further data queries on Citi’s full coverage universe please contact CIR Data Services Asia Pacific ([email protected]) or +852-2501-2791
Investment Strategy
We have a Buy rating. Cigarette business remains strong on the back of a robust pricing environment, good volumes and better mix. ITC has been successful in passing the higher excise duty increases, resulting in strong margins. Positive cigarette volume growth despite aggressive pricing action should enable the stock's recent re-rating to sustain. Over the next few years, ITC's overall revenue streams should become far more balanced as the non-tobacco FMCG business attains critical mass (currently 13% of revenues). We forecast a strong 18% EPS growth CAGR over FY10-12E.
Valuation
Our target price of Rs302 is based on 22x SeptFY11E earnings. ITC's stock has experienced a gradual re-rating, as concerns pertaining to cigarette volume decline (post the excise/VAT imposition) were unfounded, with cigarette volumes declining only ~1-3% in FY08/09, thus underscoring its resilience and defensive attributes. Moreover, while earnings have been volatile over the past few years on account of the different growth trajectories and life cycles of other businesses. In FY11E also, the company has taken price increases that should not only make up for the excise increases, but also add to the margins. Our target P/E multiple is above the last three-year historical trading average (~21x). We expect uncertainty on cigarette volumes to recede as the multiple taxes (VAT, sales tax, etc) coalesce to a uniform GST. This, coupled with lower losses in the non cigarette FMCG business, should enable the stock to re-rate. We also note that from an absolute P/E perspective, ITC is close to peak valuations (~25-26x). From a relative P/E perspective, however, ITC appears relatively cheap - trading at ~1.3x, vs. a peak of ~1.7x.

India Investor Conference 2010 18 May 2010
Citigroup Global Markets 58
Roads segment to be the growth driver — The company's subsidiary − IVRCL Assets and Holdings (prev. IVR Prime Urban developers Ltd) − will focus on developing infrastructure and real estate assets. IVR Assets and Holdings has a portfolio of 8 road assets. It is looking to bid for more road assets and would also bid for power transmission projects on BOT basis. IVR A&H Ltd is qualified for Rs160-180bn worth of projects in the road segment − targeting at least Rs50-60bn worth of projects in the next 1-1.5 years
AP forms ~17% of OB − a risk, but factored in — Concerns of a slowdown in AP irrigation projects have played out; the company’s Q3 revenue and PAT were below our and street expectations – and the stock had reacted on the back of this. Currently AP irrigation projects form ~17% of the Order Book. IVRCL stopped execution on most of these projects and has net receivables of ~Rs700m. We believe that the risk of AP projects is factored in the current stock price and any positive development in AP could be a catalyst for the stock
Fund-raising at subsidiary level — IVR Assets and Holdings has taken an enabling resolution to raise upto Rs10bn. The company plans to do a QIP in about 6mths-1 year. The funds raised will be used to invest in new road/power assets and to pay down IVRCL's debt.
Statistical Abstract
Year to Net Profit Diluted EPS EPS growth EV/EBITDA P/E P/B P/CEPS ROE Yield31 Mar (RsM) (Rs) (%) (x) (x) (x) (x) (%) (%)2008A 2,104 7.8 na 13.6 22.0 2.8 19.0 na 0.42009A 2,260 8.4 7.4 12.9 20.4 2.5 16.9 13.2 0.42010E 2,102 7.8 -7.0 11.8 22.0 2.4 17.1 11.5 0.42011E 2,642 9.8 25.7 10.6 17.5 2.1 13.9 13.4 0.42012E 3,655 13.5 38.4 8.3 12.6 1.8 10.5 16.2 0.5
Source: Company, Citi Investment Research and Analysis estimates
IVRCL (IVRC.BO)
Buy/Medium Risk 1MPrice (11 May 10) Rs171.15Target Price Rs187.00Expected share price return 9.3%Expected dividend yield 0.4%Expected total return 9.7%Market Cap Rs45,699M US$1,013M
Price Performance
50
100
150
200
May 09 Aug 09 Nov 09 Feb 10 May 10
INR
Source: dataCentral
Deepal Delivala +91-22-6631-9857 [email protected]
Company description
IVRCL is an established construction company with strong pre-qualifications and skill sets in the water supply sector. The company has diversified its revenue base by increasing its presence in roads, buildings, power T&D, real estate and solid liquid separation.

India Investor Conference 2010 18 May 2010
Citigroup Global Markets 59
IVRCL (IVRC.BO): Financial Summary
Fiscal year end 31-Mar 2008 2009 2010E 2011E 2012E
Valuation RatiosP/E adjusted (x) 22.0 20.4 22.0 17.5 12.6EV/EBITDA adjusted (x) 13.5 12.6 11.6 10.1 8.1P/BV (x) 2.8 2.5 2.4 2.1 1.8Dividend yield (%) 0.4 0.4 0.4 0.4 0.5Per Share Data (Rs)EPS adjusted 7.79 8.37 7.79 9.79 13.54EPS reported 7.79 8.37 7.79 9.79 13.54BVPS 61.82 69.82 71.11 80.42 93.58DPS 0.70 0.70 0.75 0.75 0.80
Profit & Loss (RsM)Net sales 36,606 48,819 52,200 63,308 80,069Operating expenses -33,320 -45,074 -47,841 -57,987 -72,983EBIT 3,286 3,745 4,359 5,321 7,086Net interest expense -478 -1,306 -1,474 -1,648 -1,910Non-operating/exceptionals 44 299 299 329 362Pre-tax profit 2,852 2,738 3,184 4,003 5,538Tax -749 -478 -1,083 -1,361 -1,883Extraord./Min.Int./Pref.div. 0 0 0 0 0Reported net income 2,104 2,260 2,102 2,642 3,655Adjusted earnings 2,104 2,260 2,102 2,642 3,655Adjusted EBITDA 3,614 4,218 4,959 6,014 7,847Growth Rates (%)Sales 56.0 33.4 6.9 21.3 26.5EBIT adjusted 57.6 14.0 16.4 22.1 33.2EBITDA adjusted 57.0 16.7 17.6 21.3 30.5EPS adjusted 48.7 7.4 -7.0 25.7 38.4
Cash Flow (RsM)Operating cash flow -4,117 -1,225 -2,378 -397 -2,525Depreciation/amortization 328 473 600 693 760Net working capital -6,596 -3,973 -4,962 -3,732 -6,940Investing cash flow -2,206 -2,654 -700 -750 -750Capital expenditure -1,626 -2,171 -700 -750 -750Acquisitions/disposals 0 0 0 0 0Financing cash flow 5,856 3,117 3,638 772 3,757Borrowings 5,117 3,302 5,405 1,000 4,000Dividends paid -211 -219 -228 -228 -243Change in cash -467 -763 560 -375 482
Balance Sheet (RsM)Total assets 35,944 47,430 52,636 59,193 70,098Cash & cash equivalent 1,772 1,009 1,569 1,194 1,677Accounts receivable 6,585 11,430 14,301 17,345 21,937Net fixed assets 3,704 5,402 5,503 5,560 5,550Total liabilities 19,913 29,324 34,196 38,338 45,831Accounts payable 8,893 10,406 11,053 13,357 16,834Total Debt 10,678 13,980 19,385 20,385 24,385Shareholders' funds 16,031 18,106 18,440 20,855 24,267
Profitability/Solvency Ratios (%)EBITDA margin adjusted 9.9 8.6 9.5 9.5 9.8ROE adjusted 14.4 13.2 11.5 13.4 16.2ROIC adjusted 14.2 13.2 10.8 11.4 13.0Net debt to equity 55.6 71.6 96.6 92.0 93.6Total debt to capital 40.0 43.6 51.2 49.4 50.1
For further data queries on Citi’s full coverage universe please contact CIRA Data Services Asia Pacific ([email protected]) or +852-2501-2791
Investment Strategy
We rate IVRCL shares as Buy/Medium Risk with a target price of Rs187.IVRCL appears well positioned to benefit from the planned ~US$494bn infrastructure outlay by the government of India over the next five years. AP irrigation project risk appears factored in to the estimates and in the stock price performance. We expect earnings growth of 32% over the next two years.
Valuation
We value IVRCL shares at Rs187 based on a sum-of-the-parts (SOTP) methodology given its broad business profile. We value the core construction business at Rs132 based on 13.5x Mar-11E, a discount to our target multiple for Larsen and Toubro, justified in our view given increased risks of execution on its AP irrigation projects. We value the HDO stake at Rs11 (applying a holding company discount of 20%) and the IVR Prime Urban stake at Rs45 based on current market cap and applying a 30% holding company discount.

India Investor Conference 2010 18 May 2010
Citigroup Global Markets 60
Strong Volumes; Richer Product Mix; Coking Coal Integration
Well positioned — Positives in favour of JSW Steel (JSTL) − 1) It has been able to raise prices to more than off-set cost hikes; 2) we expect iron ore prices to fall from current levels − making integration less important; 3) strong volumes; 4) better product mix; 5) 15% captive coking coal by FY11, >40% by FY13; 6) lower costs with iron ore beneficiation.
Steel outlook — We expect HRC prices to average $825/t in FY11 vs current $790/t, to partly compensate for the expected rise in coal prices through FY11. Global iron ore prices are at $160/t but expected to average $130/t in FY11. Our FY12 estimate: HRC $800/t, iron ore $125/t, coking coal $225/t. We thus believe that there is downside risk to iron ore vs. steel, while coking coal should rise before coming off.
Capacity addition, richer product mix — JSTL is expected to enhance its crude steel capacity from 7.8mtpa to 11mtpa by FY11. FY10 sales volumes rose 67% to 5.7mt. JSTL is targeting production of 7mt in FY11 (+17%) and 6.8mt of sales (+18%). Value addition will get a boost in FY11, as the hot strip mill (completed in Mar10) will help convert semis to HRC. Semis should account for 2-3% of sales volumes in FY11 vs. 22% in FY10. JSTL feels that 4Q margins ($190/t) should be maintained in FY11.
Coal integrating faster than ore — JSTL expects to soon acquire coking coal assets in the US (123mt) for ~$100m. It hopes to reach 1mtpa in Sep10-Sep11 and ramp up to 3mtpa by year 3 (FOB $95-120/t). Coal is expected from Rohne (Jharkhand) by FY13 at a delivered cost of ~$80/t. Captive iron ore from India should be 16-17% in FY12-13 (15% now). JSTL expects to sell 250kt of ore from Chile in FY11 and 1mt in FY12 (FOB cost $57/t).
4Q EBITDA grows 4x — JSTL’s adj 4Q FY10 PAT was Rs6.2bn vs. a loss of Rs659m. Highlights: 1) Avg. realization Rs34,000/t, +6% QoQ, +12% YoY; 2) Sales volume: 1.52m tonnes, +43% YoY; 3) EBITDA margin was 25% vs. 9% in 4QFY09; 4) EBITDA/t: $189 vs. $64 in 4QFY09 and $170 in 3QFY10.
US EBITDA positive in 4QFY10 — The US operations reported an EBITDA of $2.3mn in 4Q after several loss-making quarters. JSTL is targeting utilization of 40% for plates in FY11 (19% in FY10) and 35% for pipes (13% in FY11) and expects to cover a large portion of its interest/depreciation expenses.
Balance sheet — Consolidated gross debt was Rs162bn as on Mar10. Net LT debt equity was 1.49x (cons and 1.07x (standalone).The Board has decided to issue convertible warrants to promoters to raise ~$500m at Rs1,210/sh.
JSW Steel (Consolidated) – Statistical Abstract
YE 31 Mar Net Profit EPS EPS growth P/E EV/EBITDA ROE (Rsm) (Rs) (%) (x) (x) (%)FY06 5,615 33.7 -42% 35.5 14.2 13%FY07 12,463 74.1 119% 16.2 8.7 23%FY08 15,184 79.4 7% 15.1 9.6 20%FY09 11,254 58.4 -26% 20.6 11.3 15%FY10E 12,619 65.7 13% 18.2 9.0 13%FY11E 23,996 126.5 93% 9.5 7.0 21%FY12E 34,652 183.5 45% 6.5 4.6 24%
Source: Company data, Citi Investment Research and Analysis estimates.
Data in the financial summary is standalone.
JSW Steel (JSTL.BO)
Buy/Medium Risk 1MPrice (11 May 10) Rs1,199.35Target Price Rs1,450.00Expected share price return 20.9%Expected dividend yield 1.2%Expected total return 22.1%Market Cap Rs224,337M US$4,975M
Price Performance
200400600800
100012001400
May 09 Aug 09 Nov 09 Feb 10 May 10
INR
Source: dataCentral
Pradeep Mahtani +91-22-6631-9882 [email protected]
Raashi Chopra +91-22-6631-9862 [email protected]
Company description
JSTL is one of India's largest integrated steel producers with crude steel capacity of 7.8m tpa. Of this, 1.6m tpa use the Corex process and the rest use blast furnace technology. The company has plans to enhance capacity to 11mtpa by end FY11. JSTL manufactures flat steel products ranging from slabs to high-end colour-coated steel products and long steel products. JSTL completed expansion of a hot strip mill in March10 and will commission another 1.5mtpa by FY12 to enhance its product mix reduce sale of semis. In FY08, it acquired plate (1m tpa) and pipe (0.5m tpa) capacity in the US, near main consumption centres of oil and gas production. To expand its market presence in the UK and Europe, JSTL acquired a Service Centre in the UK.

India Investor Conference 2010 18 May 2010
Citigroup Global Markets 61
JSW Steel (JSTL.BO): Financial Summary
Fiscal year end 31-Mar 2008 2009 2010E 2011E 2012E
Valuation RatiosP/E adjusted (x) 14.3 20.2 14.5 9.4 6.7EV/EBITDA adjusted (x) 8.1 10.3 7.4 5.9 4.4P/BV (x) 3.0 2.9 2.4 1.9 1.6Dividend yield (%) 1.2 0.1 0.8 1.2 1.7Per Share Data (Rs)EPS adjusted 84.07 59.47 82.94 127.51 177.76EPS reported 84.07 59.47 82.94 127.51 177.76BVPS 394.99 410.07 505.35 616.48 770.84DPS 14.00 1.00 9.50 14.00 20.00
Profit & Loss (RsM)Net sales 113,089 139,527 181,423 247,689 321,309Operating expenses -85,592 -117,900 -148,986 -202,722 -258,933EBIT 27,497 21,627 32,437 44,967 62,376Net interest expense -4,404 -7,973 -8,627 -9,926 -13,713Non-operating/exceptionals 0 0 0 0 0Pre-tax profit 23,093 13,654 23,810 35,041 48,663Tax -7,027 -2,191 -7,970 -10,863 -15,085Extraord./Min.Int./Pref.div. -340 -339 -326 -326 -326Reported net income 15,726 11,124 15,514 23,852 33,251Adjusted earnings 15,726 11,124 15,514 23,852 33,251Adjusted EBITDA 34,369 29,903 43,671 58,054 79,502Growth Rates (%)Sales 32.2 23.4 30.0 36.5 29.7EBIT adjusted 23.3 -21.4 50.0 38.6 38.7EBITDA adjusted 26.0 -13.0 46.0 32.9 36.9EPS adjusted 14.6 -29.3 39.5 53.7 39.4
Cash Flow (RsM)Operating cash flow 35,519 40,561 42,422 33,957 70,266Depreciation/amortization 6,872 8,277 11,234 13,087 17,126Net working capital 5,644 20,706 -1,692 -18,379 1,640Investing cash flow -56,364 -58,349 -27,689 -68,389 -16,150Capital expenditure -52,657 -55,835 -28,630 -69,450 -16,050Acquisitions/disposals -7,358 -3,266 0 0 -1,000Financing cash flow 20,859 18,595 -10,485 34,969 -62,103Borrowings 23,811 28,882 -1,300 47,300 -45,000Dividends paid -326 -3,404 -558 -2,406 -3,390Change in cash 14 807 4,249 537 -7,988
Balance Sheet (RsM)Total assets 205,775 282,103 300,205 374,054 380,650Cash & cash equivalent 3,392 4,200 8,448 8,985 997Accounts receivable 3,374 3,981 5,468 8,822 11,444Net fixed assets 165,679 223,285 240,681 297,044 295,969Total liabilities 129,002 202,510 202,791 255,853 233,574Accounts payable 33,343 69,453 64,667 62,636 78,385Total Debt 75,465 112,726 111,426 158,726 113,726Shareholders' funds 76,773 79,593 97,414 118,202 147,076
Profitability/Solvency Ratios (%)EBITDA margin adjusted 30.4 21.4 24.1 23.4 24.7ROE adjusted 24.8 14.8 18.1 22.7 25.6ROIC adjusted 15.8 11.2 12.2 13.8 16.7Net debt to equity 93.9 136.4 105.7 126.7 76.6Total debt to capital 49.6 58.6 53.4 57.3 43.6
For further data queries on Citi’s full coverage universe please contact CIRA Data Services Asia Pacific ([email protected]) or +852-2501-2791
Investment Strategy
We rate JSTL Buy/Medium Risk (1M). We expect HRC prices to average $825/t in FY11 vs $790/t now, to partly compensate for expected rises in coal prices through FY11. Global iron ore prices are at $155-160/t but should average $130/t in FY11. Our FY12 estimate: HRC $800/t, iron ore $120/t, coking coal $225/t. We see downside risk to iron ore vs steel, while coking coal should rise before coming off. JSTL is our preferred play and we believe it offers upside: 1) It has been able to raise prices to more than off-set cost hikes; 2) we expect iron ore prices to fall from current levels − making integration less important; 3) strong volumes +18-38% in FY11-12; 4) better product mix; 5) 15% captive coking coal by FY11, >40% by FY13; 6) lower costs with iron ore beneficiation; 7) undemanding valuations: 6.1x Jun11 EV/EBITDA. We expect JSTL to report $186/t of EBITDA in FY11- FY12. Net D/E at ~1.7x should decline to 1x by FY12, or earlier if it raises fresh equity. The Board has decided to issue convertible warrants to promoters to raise ~$500m.
Valuation
EV/EBITDA is our preferred valuation metric for JSTL due to its high debt equity levels. Our TP of Rs1,450 is based on SOTP. We continue to value the standalone business at 6.5x EV/EBITDA (roll forward to Jun11 from Mar11) − in-line with its 3yr avg and captures more recent valuation trends − giving a value of Rs1,437/share. We value the other businesses (mainly US pipe and plate operations) at 3x EV/sales. We use 3x EV/sales as utilization levels at its US business are quite low at 30-35% in FY11-12. This gives a value of Rs13/share − resulting in a net TP of Rs1,450/share. At our TP, JSTL would trade at a June11 EV/EBITDA of 7x and P/E of 10.3x.

India Investor Conference 2010 18 May 2010
Citigroup Global Markets 62
Steady on the Growth Path
Healthy Outlook — We rate Jubilant one of the superior Indian outsourcing plays, given its integrated business model with presence across the pharma and chemicals value chain. It is one of the few CRAMS companies to emerge relatively unscathed from the recent downturn while prospects remain healthy. The easing RM situation in radiopharma biz along with a new CRAMS contract & product launches should drive earnings momentum going forward.
Growing Share of Pharma Biz Augurs Well — Focus on high growth CRAMS and research services segment has led to the share of higher margin P&LS segment going up to 89% of sales in FY10 from 79% in FY10. We expect this trend to continue with P&LS likely to contribute 91% of revenues in FY11E. This not only improves profitability but also lowers the commodity element in Jubilant’s business model.
Cash Generation to Fund Future Capex — Jubilant plans to incur to ~Rs7.5bn of capex over the next two years towards raising capacity in its Fine Chemicals & Exclusive Synthesis (debottlenecking & new capacity) and API businesses. The company has indicated that it would generate positive cash flows at the operating level post the said capital expenditure. We estimate that Jubilant would generate OCF of cRs13bn over FY11-12E.
Key Catalysts/ Things to Watch Out For — 1) APP demerger, expected to be completed by 3QFY11; 2) Resolution of raw material shortage in radiopharma biz, expected in 2QFY11; and 3) New long contracts on the CRAMS segment.
Statistical Abstract
Year to Net Profit Diluted EPS EPS growth EV/EBITDA P/E P/B P/CEPS ROE Yield31 Mar (RsM) (Rs) (%) (x) (x) (x) (x) (%) (%)2008A 2,965 16.3 na 14.6 22.3 4.3 13.1 na 0.42009A 2,241 13.1 -19.7 15.1 27.8 4.2 13.9 22.5 0.42010E 4,543 24.9 90.2 11.5 14.6 2.8 12.2 25.5 0.52011E 5,374 30.8 23.6 9.4 11.8 2.3 8.5 23.6 0.52012E 6,079 38.3 24.1 8.0 9.5 1.9 7.0 22.0 0.5
Source: Company Reports and Citi Investment Research and Analysis estimates
Jubilant Organosys (JUBO.BO)
Buy/Medium Risk 1M Price (11 May 10) Rs343.30 Target Price Rs465.00 Expected share price return 35.5% Expected dividend yield 0.6% Expected total return 36.0% Market Cap Rs54,540M US$1,209M
Price Performance
0
100
200
300
400
May 09 Aug 09 Nov 09 Feb 10 May 10
INR
Source: dataCentral
Prashant Nair, CFA +91-22-6631-9855 [email protected] Akshay Rai [email protected]
Company description
Jubilant Organosys is the largest specialty chemicals company in India, with a high degree of vertical integration, and global scale and reach in almost all its key products. The company has established itself as a serious player from fine chemicals to advanced intermediates and APIs. More recently, it has forayed into formulations and regulatory services through acquisitions in Belgium (PSI n.v. and PSI supply) and the US (Trigyn Laboratories). It has set up wholly owned subsidiaries to tap into the high-potential areas of bioinformatics, medicinal chemistry services and clinical services.

India Investor Conference 2010 18 May 2010
Citigroup Global Markets 63
Jubilant Organosys (JUBO.BO): Financial Summary
Fiscal year end 31-Mar 2008 2009 2010E 2011E 2012E
Valuation RatiosP/E adjusted (x) 21.0 26.2 13.8 11.1 9.0EV/EBITDA adjusted (x) 15.3 16.8 11.0 9.3 7.8P/BV (x) 4.0 4.0 2.7 2.2 1.8Dividend yield (%) 0.4 0.4 0.6 0.6 0.6Per Share Data (Rs)EPS adjusted 16.33 13.11 24.94 30.84 38.28EPS reported 22.06 16.57 23.14 30.84 38.28BVPS 85.37 85.88 128.42 158.98 188.99DPS 1.49 1.51 2.00 2.00 2.00
Profit & Loss (RsM)Net sales 24,889 35,423 37,987 43,034 49,967Operating expenses -21,421 -32,159 -31,173 -35,911 -41,514EBIT 3,468 3,264 6,814 7,123 8,453Net interest expense -337 -1,070 -1,505 -1,026 -1,163Non-operating/exceptionals 1,430 772 -130 121 130Pre-tax profit 4,561 2,966 5,179 6,218 7,419Tax -573 -267 -959 -839 -1,336Extraord./Min.Int./Pref.div. 16 133 -5 -5 -5Reported net income 4,005 2,832 4,215 5,374 6,079Adjusted earnings 2,965 2,241 4,543 5,374 6,079Adjusted EBITDA 4,507 4,896 8,061 9,190 10,675Growth Rates (%)Sales 37.5 42.3 7.2 13.3 16.1EBIT adjusted 81.3 -5.9 108.8 4.5 18.7EBITDA adjusted 77.7 8.6 64.6 14.0 16.2EPS adjusted 82.8 -19.7 90.2 23.6 24.1
Cash Flow (RsM)Operating cash flow 2,444 3,867 5,284 6,093 6,925Depreciation/amortization 1,039 1,632 1,247 2,067 2,223Net working capital -1,851 -556 -182 -1,447 -1,827Investing cash flow -11,394 -20,307 -2,500 -4,000 -3,500Capital expenditure -5,135 -6,678 -2,500 -4,000 -3,500Acquisitions/disposals 0 0 0 0 0Financing cash flow 5,928 12,517 -6,389 -2,141 -3,065Borrowings 6,123 15,198 -9,896 -1,776 -2,700Dividends paid -209 -258 -365 -365 -365Change in cash -3,021 -3,923 -3,605 -48 359
Balance Sheet (RsM)Total assets 41,825 64,867 63,255 67,354 72,033Cash & cash equivalent 5,238 3,817 211 163 522Accounts receivable 4,258 5,044 5,252 5,953 6,916Net fixed assets 23,971 42,481 43,734 45,667 46,944Total liabilities 29,066 51,875 42,537 41,780 41,688Accounts payable 3,718 7,365 7,352 8,334 9,405Total Debt 21,085 38,781 28,886 27,266 25,514Shareholders' funds 12,759 12,992 20,717 25,575 30,345
Profitability/Solvency Ratios (%)EBITDA margin adjusted 18.1 13.8 21.2 21.4 21.4ROE adjusted 27.5 17.8 27.5 23.6 22.0ROIC adjusted 10.9 7.2 11.3 11.5 12.3Net debt to equity 124.2 269.1 138.4 106.0 82.4Total debt to capital 62.3 74.9 58.2 51.6 45.7
For further data queries on Citi’s full coverage universe please contact CIRA Data Services Asia Pacific ([email protected]) or +852-2501-2791
Investment Strategy
We rate Jubilant Buy/Medium Risk (1M) with a target price of Rs465. Jubilant is among the top Indian pharma outsourcing plays under our coverage. It is a story of continuous forward integration with a business model that spans pharma & life sciences, industrial chemicals and performance chemicals. Its strong presence in acetyls & pyridines builds a high degree of integration into its business and allows it to offer services across the value chain. Besides a natural cost advantage, this allows the company to leverage its customer relationships in strong areas to scale up new businesses, thus providing an edge in an increasingly competitive industry. Jubilant's P&LS biz is in the midst of a high growth phase not only raising profitability levels but also improve earnings quality by reducing Jubilant's exposure to the more volatile non-P&LS businesses.
Valuation
We use sum-of-the-parts to value Jubilant in view of the diversified nature of its business and earnings streams. We value both its businesses using P/E, but different target multiples are applied given the differences in growth profiles and operating parameters. We arrive at a one-year target price of Rs465 based on the following factors: We ascribe a value of Rs455/sh to Jubilant's pharma biz at 15x June 11E EPS. Our target multiple is at a discount to the target multiple used for Piramal, given Jubilant's higher leverage and lower return ratios and liquidity. We value Jubilant's APP biz at Rs10/share based on 6x Jun 11E EPS. We believe the lower multiple is justified given that this is a commodity business with lower operating margins (c10 -14%) and growth rates vis-à-vis Jubilant's pharma biz.

India Investor Conference 2010 18 May 2010
Citigroup Global Markets 64
Bank to the Fore
Wealth management platform —Kotak Mahindra Bank (KTKM) is strategically positioned as India’s leading capital markets and wealth management player, with a banking platform. This platform seeks to capture its strong capital markets business, aggressive financial services offerings, consumer focused asset lending, with defined upper end segmentation. A strong capital markets environment, broad economic growth and effective execution, has driven KTKM’s significant expansion over the last five years.
Lending business: critical mass achieved, growth push has begun — Kotak's banking platform has reached critical scale, and is highly profitable with enough capital to leverage. The recent growth push has continued, and appears to be sustainable as management targets strong 25%-30% p.a. distribution expansion for the next three years. While the focus has shifted to corporate, it has not yet affected profitability (NIMs remain well above industry at 630bps, although helped by easy liquidity conditions) and reflects management's sharp focus on returns. Some caveats: a) Structurally, NIMs should be under pressure with increased growth levels; b) Deposit mix is still wholesale biased; and c) Asset quality improvements are somewhat delayed (relative to expectations).
Retail liabilities should gain — While Kotak's liability franchise build-out has been focused, deliberate, and fairly cost focused, its gains have been more in mix than scale. We believe this current market environment (liquidity and capital markets biased flows) provides it the opportunity to accelerate without undue risk. It is the right environment to build, although the gains will be more back-ended.
Capital Market segments, lower profitability but can bounce back fast — While growth and profitability in brokerage and investment banking is currently low, the bounce-back can be sharp (although market linked). Financial services segments are doing relatively better: life insurance profitability is looking up and so is growth, asset management has had a strong run (can moderate medium-term) and wealth management platform has been laid – although given regulatory and distribution flux in these segments, profitability is likely to improve only gradually.
Statistical Abstract
Year to Net Profit EPS EPS Growth PE PB ROAE ROAA Div YieldMar 31 (RsM) (Rs) (%) (x) (x) (%) (%) (%)FY08 9,912 29 74.5 25.3 4.4 22 2.9 0.1FY09 6,524 19 -35.9 39.5 4.0 11 1.6 0.1FY10E 10,544 31 61.6 24.4 3.4 15 2.4 0.1FY11E 12,324 36 16.9 20.9 3.0 15 2.4 0.1FY12E 14,238 41 15.5 18.1 2.6 15 2.4 0.1
Source: Company Data, Citi Investment Research and Analysis Estimates
Kotak Mahindra Bank (KTKM.BO)
Sell/High Risk 3HPrice (11 May 10) Rs745.30Target Price Rs700.00Expected share price return -6.1%Expected dividend yield 0.1%Expected total return -6.0%Market Cap Rs259,556M US$5,756M
Price Performance
400
500
600
700
800
May 09 Aug 09 Nov 09 Feb 10 May 10
INR
Source: dataCentral
Aditya Narain, CFA +91-22-6631-9879 [email protected] Manish Chowdhary, CFA +91-22-6631-9853 [email protected] Pooja Kapur [email protected]
Company description
KTKM is a private-sector bank in which Mr. Uday Kotak, the major shareholder, and his associates have a 52% stake. Main businesses of the bank are consumer lending, retail broking, investment banking, asset management, and rapidly growing life insurance. Its focus is to develop a niche wealth management platform.

India Investor Conference 2010 18 May 2010
Citigroup Global Markets 65
Kotak Mahindra Bank (KTKM.BO): Financial Summary
2008 2009 2010E 2011E 2012E
Valuation RatiosP/E adjusted (x) 25.3 39.5 24.4 20.9 18.1P/E reported (x) 25.3 39.5 24.4 20.9 18.1P/BV (x) 4.4 4.0 3.4 3.0 2.6P/Adjusted BV diluted (x) 4.4 4.0 3.4 3.0 2.6Dividend yield (%) 0.1 0.1 0.1 0.1 0.1Per Share Data (Rs)EPS adjusted 29.47 18.87 30.51 35.66 41.20EPS reported 29.47 18.87 30.51 35.66 41.20BVPS 168.97 187.15 216.94 251.79 292.10Tangible BVPS 168.97 187.15 216.94 251.79 292.10Adjusted BVPS diluted 168.50 186.63 216.34 251.10 291.30DPS 0.75 0.75 0.80 0.90 1.00
Profit & Loss (RsM)Net interest income 18,319 23,741 26,493 28,464 32,760Fees and commissions 14,385 6,747 15,272 17,664 20,926Other operating Income 14,297 10,684 9,245 13,717 17,164Total operating income 47,002 41,173 51,009 59,844 70,850Total operating expenses -29,292 -27,713 -31,131 -36,565 -43,176Oper. profit bef. provisions 17,709 13,460 19,878 23,279 27,674Bad debt provisions -3,630 -3,298 -3,998 -4,714 -6,120Non-operating/exceptionals 0 0 0 0 0Pre-tax profit 14,079 10,162 15,880 18,565 21,554Tax -4,492 -3,635 -5,284 -6,189 -7,264Extraord./Min. Int./Pref. Div. 325 -3 -52 -52 -52Attributable profit 9,912 6,524 10,544 12,324 14,238Adjusted earnings 9,912 6,524 10,544 12,324 14,238Growth Rates (%)EPS adjusted 74.5 -35.9 61.6 16.9 15.5Oper. profit bef. prov. 90.2 -24.0 47.7 17.1 18.9
Balance Sheet (RsM)Total assets 405,972 405,540 458,724 548,230 639,612Avg interest earning assets 321,898 363,418 373,359 437,717 517,579Customer loans 222,785 226,483 263,439 329,302 391,435Gross NPLs 4,347 6,886 9,774 13,036 16,514Liab. & shar. funds 405,972 405,540 458,724 548,230 639,612Total customer deposits 136,919 156,449 171,950 210,547 247,035Reserve for loan losses 2,938 5,223 7,818 10,557 14,053Shareholders' equity 58,239 64,504 74,772 86,786 100,680
Profitability/Solvency Ratios (%)ROE adjusted 21.9 10.6 15.1 15.3 15.2Net interest margin 5.7 6.5 7.1 6.5 6.3Cost/income ratio 62.3 67.3 61.0 61.1 60.9Cash cost/average assets 8.5 6.8 7.2 7.3 7.3NPLs/customer loans 2.0 3.0 3.7 4.0 4.2Reserve for loan losses/NPLs 67.6 75.9 80.0 81.0 85.1Bad debt prov./avg. cust. loans 1.9 1.5 1.6 1.6 1.7Loans/deposit ratio 162.7 144.8 153.2 156.4 158.5Tier 1 capital ratio 14.5 14.9 13.2 11.3 10.0Total capital ratio 18.7 19.5 17.5 15.5 13.9
For further data queries on Citi’s full coverage universe please contact CIRA Data Services Asia Pacific ([email protected]) or +852-2501-2791
Investment Strategy
We rate KTKM as Sell/High Risk (3H). In our view, KTKM is a play on the financial-services market in India. It is backed by a management team that has a track record of managing market and credit risk well and of being conservative in its approach. We believe the current economic and market environment plays to KTKM's business mix and model through: 1) Capitals markets and broking related revenue, 2) Its financial services diversifications - Insurance, Asset Management and Wealth management, all have the same capital markets tailwinds; and 3) Banking platform gains on easier funding, and lesser asset quality pressures. While all these augur well for the business, we believe over the last 18 months Kotak has moderated its leverage and risks to the market and economic environment – and to that extent, will be less of a beneficiary of the rising capital markets tide.
Valuation
Our target price of Rs700 is based on our valuation of KTKM's different businesses via SOTP methodology. This values the banking business at Rs323 per share at 2.5x PBV 1-year fwd, the vehicle loan financing business at Rs53 per share at 1.5x 1Yr Fwd P/BV, the investment banking and broking business at 15x 1-year Fwd PE or Rs160, the insurance subsidiary at Rs92 at 14x 1Yr Fwd NBAP, and we attribute Rs76 to the AMC business (5% of AUM for MF, and 8% for Portfolio and alternative assets). Our target multiples are in-line with the best of breed private sector banks and other financial services business, however they are not near peak multiples in the historical India scenario, this as we believe the business' leverage to capital markets has reduced and the near-term challenges will cap growth at well below historical peak growth levels.

India Investor Conference 2010 18 May 2010
Citigroup Global Markets 66
Our expectations for FY11E guidance — We expect L&T to guide for sales growth of 15-20%, order inflow growth of 15-20% and flat EBITDA margins. We believe more than the order inflow growth guidance investors would be focussing on the sales guidance for FY11E given the low base effect of FY10E. Sales growth guidance of lower than 15% could be disappointing
What went wrong in 9mFY10? — L&T’s sales growth in 9mFY10 was disappointing on account of: (1) Rs30bn of fertilizer orders due in 1QFY10 coming only in 2QFY10 and 3QFY10; (2) Rs86bn of ONGC orders due in 1QFY10 coming only in 2QFY10 and 4QFY10; (3) Delays in financial closure of 5 road projects totalling to Rs55bn leading to revenue loss in 9mFY10
Big strides in BTG — Boiler capacity came online by Oct09 and turbine capacity will come online by Sep10. The company has won Rs66bn of BTG orders from APPDC/JPA and is in the fray for Rs60bn Koradi order, Rs90bn Bara-Karchana order and Rs210bn NTPC-DVC order. We believe that in the next 2-3 years the BTG venture will be a game changer and a significant value creator.
Management comments in the press about FY11E — According to the Financial Express, management is optimistic that execution will be better from here and the delays in the past will not be there either this year or next year. Further, in terms of prices of key inputs, the management is in a position to pass on most of the escalation to its customers. According to CNBC, management believes hydrocarbon margins were doing okay, since the company planned for these projects by doing most of the engineering beforehand. Further, many of these orders have price escalations for raw materials.
Statistical Abstract
Year to Net Profit Diluted EPS EPS growth EV/EBITDA P/E P/B P/CEPS ROE Yield31 Mar (RsM) (Rs) (%) (x) (x) (x) (x) (%) (%)2008A 20,123 34.4 na 33.0 44.8 9.5 37.8 na 0.52009A 27,092 46.3 34.4 24.7 33.4 7.3 23.9 31.7 0.72010E 29,822 49.4 6.8 22.0 31.2 5.3 20.4 27.7 0.82011E 38,023 63.0 27.5 17.7 24.5 4.5 21.7 20.0 0.92012E 46,484 77.0 22.3 14.5 20.0 3.9 17.9 21.0 1.1
Source: Company data, Citi Investment Research and Analysis estimates
Larsen & Toubro (LART.BO)
Buy/Low Risk 1LPrice (11 May 10) Rs1,543.20Target Price Rs1,875.00Expected share price return 21.5%Expected dividend yield 0.8%Expected total return 22.3%Market Cap Rs927,938M US$20,577M
Price Performance
400
800
1200
1600
May 09 Aug 09 Nov 09 Feb 10 May 10
INR
Source: dataCentral
Venkatesh Balasubramaniam +91-22-6631-9864 [email protected]
Company description
L&T is a diversified conglomerate with market leadership in engineering and construction (E&C) and electrical-equipment businesses in India. L&T Information Technology is its 100% subsidiary in software services. L&T demerged its cement business into a separate company, selling it to Grasim.

India Investor Conference 2010 18 May 2010
Citigroup Global Markets 67
L&T (LART.BO): Financial Summary
Fiscal year end 31-Mar 2008 2009 2010E 2011E 2012E
Valuation RatiosP/E adjusted (x) 44.8 33.4 31.2 24.5 20.0EV/EBITDA adjusted (x) 31.6 23.2 19.7 15.6 12.4P/BV (x) 9.5 7.3 5.3 4.5 3.9Dividend yield (%) 0.5 0.7 0.8 0.9 1.1Per Share Data (Rs)EPS adjusted 34.42 46.25 49.39 62.97 76.99EPS reported 37.17 59.44 68.80 62.97 76.99BVPS 162.92 212.30 293.65 340.17 398.48DPS 8.47 10.50 12.50 14.50 16.50
Profit & Loss (RsM)Net sales 248,547 336,466 361,703 434,572 517,141Operating expenses -222,288 -300,957 -321,107 -385,933 -459,038EBIT 26,259 35,509 40,596 48,639 58,103Net interest expense -991 -3,502 -5,184 -4,397 -2,380Non-operating/exceptionals 4,080 7,398 7,879 10,953 11,755Pre-tax profit 29,348 39,404 43,291 55,195 67,479Tax -9,225 -12,312 -13,469 -17,173 -20,994Extraord./Min.Int./Pref.div. 1,611 7,725 11,718 0 0Reported net income 21,734 34,817 41,541 38,023 46,484Adjusted earnings 20,123 27,092 29,822 38,023 46,484Adjusted EBITDA 28,375 38,568 44,735 53,640 63,735Growth Rates (%)Sales 41.4 35.4 7.5 20.1 19.0EBIT adjusted 66.0 35.2 14.3 19.8 19.5EBITDA adjusted 61.9 35.9 16.0 19.9 18.8EPS adjusted 45.3 34.4 6.8 27.5 22.3
Cash Flow (RsM)Operating cash flow 21,940 6,097 55,192 55,798 68,963Depreciation/amortization 2,116 3,060 4,139 5,000 5,632Net working capital -2,123 -31,651 9,507 12,770 16,842Investing cash flow -54,522 -31,979 -29,714 -18,214 -15,714Capital expenditure -16,344 -18,565 -17,214 -8,214 -8,214Acquisitions/disposals -38,178 -13,415 -12,500 -10,000 -7,500Financing cash flow 31,283 23,991 19,337 -41,160 -35,098Borrowings 15,062 29,720 9,364 -31,000 -23,537Dividends paid -5,716 -7,168 -8,759 -10,160 -11,562Change in cash -1,300 -1,892 44,815 -3,576 18,151
Balance Sheet (RsM)Total assets 268,553 368,818 460,136 512,109 588,054Cash & cash equivalent 9,645 7,753 52,567 48,991 67,142Accounts receivable 73,650 100,555 110,259 132,473 157,642Net fixed assets 35,275 50,292 63,266 66,379 68,860Total liabilities 173,292 244,469 284,274 308,385 349,407Accounts payable 80,785 98,000 105,351 126,575 150,625Total Debt 35,840 65,560 74,924 43,924 20,388Shareholders' funds 95,261 124,348 175,862 203,725 238,647
Profitability/Solvency Ratios (%)EBITDA margin adjusted 11.4 11.5 12.4 12.3 12.3ROE adjusted 26.4 24.7 19.9 20.0 21.0ROIC adjusted 38.1 30.4 26.7 31.9 42.7Net debt to equity 27.5 46.5 12.7 -2.5 -19.6Total debt to capital 27.3 34.5 29.9 17.7 7.9
For further data queries on Citi’s full coverage universe please contact CIRA Data Services Asia Pacific ([email protected]) or +852-2501-2791
Investment Strategy
We rate L&T Buy/ Low (1L) risk. With earnings CAGR of 19% over FY09-12E for the core business, and spawning new businesses such as railways and power equipment, we believe L&T is fundamentally one of the best proxies for India's infrastructure build-out. L&T's Rs911bn order backlog and forecast stable margins provide good earnings visibility. Its thrust of process and hydrocarbons and India's infrastructure spending should augur well for the order pipeline. We are positive on management efforts to improve product mix by raising the share of high-technology products for process industries, defense, nuclear, and aerospace applications; and engineering and embedded services. These segments have better growth potential and margins than the projects business
Valuation
Our Rs1,875 target price is based on sum-of-the-parts (SOTP). We use 23x Sep11E earnings for the parent, at par with BHEL. We also believe that the parent's numbers do not capture the value inherent in subsidiaries, which we value at Rs266, with L&T Infotech at Rs73 (12x Sep11E EPS, in-line with second-tier peers), L&T Finance at Rs18 (1.0x Sep11E P/BV), 51% stake in L&T-MHI JV at Rs36, and L&T IDPL at Rs64.

India Investor Conference 2010 18 May 2010
Citigroup Global Markets 68
Steady Volumes
Sedate revenue growth, despite healthy volumes — Price cuts on Parachute and Saffola have kept revenue growth depressed, despite organic volume growth of 14% Y/Y. Management noted that if volume growth decelerates, it would attempt to spur volumes by cutting prices and sacrificing margins. They believe re-gaining margins is far easier than re-gaining lost volumes.
20% Y/Y international business growth likely — International business (~23% of revenues) growth moderated sequentially, owing to the adverse impact of rupee appreciation. Supply chain initiatives should aid operating margin improvement by 2-3% (from ~11% currently) over the medium term.
EBITDA margins of ~13.5-14% in FY11 — Despite a sharp expansion in gross margins, the EBITDA margin expansion was more muted given the aggressive ad spends and increase in other SG&A. Going forward, while mgmt expects ~8-10% increase in copra prices in FY11E, guided that A&P to sales should be ~12% in FY11 (13.2% in FY10).
Kaya strategy needs reworking — Mgmt expects to consolidate Indian operations, given the fact that same clinic growth is -13% for Indian operations & -5% overall. Increasing focus on footfalls and consumer retention/acquisition should result in double digit growth in FY11. Mgmt noted that Kaya (~7% of revenues) break even will now be delayed to FY12, rather FY10/11 as envisaged before. Kaya Life, the holistic weight management offering has been withdrawn- a non recurring provision of Rs57m was made in 4Q results.
Other updates — a) Management plans to focus on rural India- increase contribution from 25% of sales to 30% in 2-3 yrs. Distribution initiatives & smaller SKUs are likely to spur growth. b) Tax rates are likely to be <20% going forward, as both the production from Paonta Sahib and international contribution increase.
Statistical Abstract
Year to Net Profit Diluted EPS EPS growth EV/EBITDA P/E P/B P/CEPS ROE Yield31 Mar (RsM) (Rs) (%) (x) (x) (x) (x) (%) (%)2008A 1,585 2.6 na 27.4 41.3 20.8 32.7 na 0.62009A 1,969 3.2 24.2 23.0 33.3 14.4 29.2 49.1 0.62010E 2,415 4.0 22.7 18.2 27.1 10.3 22.4 42.4 0.62011E 2,800 4.6 16.0 16.6 23.4 7.5 18.9 37.1 0.62012E 3,537 5.8 26.3 13.5 18.5 5.6 15.4 34.6 0.7
Source: Company Reports and CIRA Estimates
Marico (MRCO.BO)
Sell/Low Risk 3LPrice (11 May 10) Rs107.50Target Price Rs104.00Expected share price return -3.3%Expected dividend yield 0.6%Expected total return -2.7%Market Cap Rs65,504M US$1,453M
Price Performance
60
80
100
120
May 09 Aug 09 Nov 09 Feb 10 May 10
INR
Source: dataCentral
Jamshed Dadabhoy +91-22-6631-9883 [email protected] Aditya Mathur +91-22-6631-9841 [email protected]
Company description
Marico is a leading consumer-goods company in India with offerings in the hair- care, skin-care, and health and wellness segments. It is a market leader in the coconut-oil category, and dominates most of the other categories in which it operates. Marico acquired two soap brands in the Bangladesh market, Camelia and Aromatic, in 2006 - marking its entry into the global FMCG market. Marico has strengthened its product portfolio through acquisitions in the domestic market. Marico exports to Bangladesh, Bhutan, and the Middle East. In 2006, Marico entered the Rs50bn Indian soap market with the acquisition of Manjal herbal bath soap. Marico acquired Enaleni in end 2008.

India Investor Conference 2010 18 May 2010
Citigroup Global Markets 69
Marico (MRCO.BO): Financial Summary
Fiscal year end 31-Mar 2008 2009 2010E 2011E 2012E
Valuation RatiosP/E adjusted (x) 41.3 33.3 27.1 23.4 18.5EV/EBITDA adjusted (x) 27.3 22.8 18.2 16.2 13.1P/BV (x) 20.8 14.4 10.3 7.5 5.6Dividend yield (%) 0.6 0.6 0.6 0.6 0.7Per Share Data (Rs)EPS adjusted 2.60 3.23 3.96 4.60 5.81EPS reported 2.78 3.10 3.80 4.60 5.81BVPS 5.17 7.45 10.48 14.32 19.26DPS 0.66 0.66 0.66 0.66 0.74
Profit & Loss (RsM)Net sales 19,050 23,884 26,608 30,538 35,134Operating expenses -16,896 -21,271 -23,457 -27,048 -30,891EBIT 2,155 2,613 3,151 3,489 4,242Net interest expense -305 -357 -257 -270 -213Non-operating/exceptionals 96 122 183 281 392Pre-tax profit 1,945 2,378 3,077 3,500 4,421Tax -360 -409 -643 -700 -884Extraord./Min.Int./Pref.div. 105 -81 -117 0 0Reported net income 1,691 1,887 2,317 2,800 3,537Adjusted earnings 1,585 1,969 2,415 2,800 3,537Adjusted EBITDA 2,463 2,971 3,751 4,148 4,949Growth Rates (%)Sales 22.4 25.4 11.4 14.8 15.0EBIT adjusted 47.1 21.3 20.6 10.8 21.6EBITDA adjusted 24.0 20.6 26.2 10.6 19.3EPS adjusted 60.3 24.2 22.7 16.0 26.3
Cash Flow (RsM)Operating cash flow 843 1,596 2,086 3,368 3,492Depreciation/amortization 309 358 601 658 707Net working capital -828 -1,064 -1,080 -91 -751Investing cash flow -1,227 -1,017 -2,192 -800 -800Capital expenditure -1,227 -896 -1,486 -800 -800Acquisitions/disposals 0 -121 -706 0 0Financing cash flow 601 -328 243 -1,067 -1,677Borrowings 1,070 170 709 -600 -1,150Dividends paid -467 -467 -467 -467 -527Change in cash 323 169 38 1,501 1,016
Balance Sheet (RsM)Total assets 9,678 11,442 15,106 16,760 19,126Cash & cash equivalent 753 922 960 2,461 3,477Accounts receivable 862 1,108 1,507 1,506 1,733Net fixed assets 2,573 3,111 3,997 4,138 4,232Total liabilities 6,531 6,908 8,595 7,916 7,272Accounts payable 2,203 2,465 2,999 3,254 3,721Total Debt 3,579 3,750 4,459 3,859 2,709Shareholders' funds 3,147 4,535 6,511 8,844 11,854
Profitability/Solvency Ratios (%)EBITDA margin adjusted 12.9 12.4 14.1 13.6 14.1ROE adjusted 62.5 51.3 44.2 37.1 34.6ROIC adjusted 42.8 35.7 30.8 30.1 34.9Net debt to equity 89.8 62.4 53.7 15.8 -6.5Total debt to capital 53.2 45.3 40.6 30.4 18.6
For further data queries on Citi’s full coverage universe please contact CIR Data Services Asia Pacific ([email protected]) or +852-2501-2791
Investment Strategy
We rate Marico to Sell / Low Risk (3L). Shares have run up sharply, which we reckon discounts a fair degree of positives. Marico dominates the hair-oil segment and has a strong presence in the branded edible-oil (safflower oil) segment. However, growth in the core business is entering a slower trajectory in the absence of strong pricing. Marico also has skin-care clinics (under the Kaya brand), a business that is fast expanding but with slowing same store sales in the current environment, given its discretionary nature. Over the years, Marico has re-rated as its dependency on a single product (Parachute coconut oil) has declined, and the company has positioned itself on the health and wellness planks.
Valuation
Marico's earnings growth has been steady; therefore, we believe P/E is best suited to value the company. Our target price of Rs104 is based on 20x Sept11E EPS, in line with its trailing 5-year average P/E. Marico offers healthy earnings growth (a two-year CAGR of 20%, a 3 year CAGR of 21%). If Marico can demonstrate strong profit growth in the Kaya subsidiary over the next 2 years, the stock could re-rate. Conversely, a de-rating is also possible if Kaya's business / profitability trajectory isn't as expected. We ascribe a lower multiple than the 23-24x it traded at from mid CY06-Jan08, as growth rates in that period were heightened by inorganic initiatives and also very strong growth in the core hair oils business, which we don't anticipate will recur in the next 12-18 months.

India Investor Conference 2010 18 May 2010
Citigroup Global Markets 70
Well Positioned to Benefit From India’s Long-Term Growth
Domestic Volume growth story remains intact — We expect passenger cars to grow at least 15% in FY11, given macro tailwinds. Despite accelerating competition, we expect MSIL should benefit from overall industry volume growth. MSIL has ceded 360 bps in market share between 1Q-4QFY10, but management believes that with the lower cost of ownership that its vehicles provide combined with wide sales and service network, it can negate the pricing tactics of the competition and regain lost market share.
Export trends are also encouraging — Exports for FY10 more than doubled compared with FY09 numbers. While a low base pushed the YoY figures, A-Star exports and shipment of Ritz to South Asia have aided strong export numbers. We believe that broad basing the exports from the EU zone is a positive trend.
A wide dealership network to aid country-wide growth— A wide dealership and after-sales service network has been a key strength of MSIL. MSIL has raised its dealership network by c18% (from 680 in FY09 to 802 in FY10) and as per our discussions with management, this number could grow to c1,000 dealers in the next two years. Management is optimistic that with this wide network, it could grow rural demand (~18% of sales) significantly in FY11.
Capacity constraints necessitate additional facility — The current capacity is ~1mn vehicles/year. Management said that with operational rationalization and de-bottlenecking this can be raised to c1.2mn units/year. With the favorable response to the Eeco (MPV launched in January) and pressure to retain customers, additional capacity is required. The new facility of ~250,000 vehicles/year at Manesar was scheduled for April FY13 but management hinted that it may be expedited to 4QFY12.
We remain wary on margins — Spiraling commodity costs + the cost of conversion to Euro 4 has adversely impacted margins in 4Q. All models (except the Maruti 800 and Gypsy) are on Euro 4 norms. We are concerned on margins, given that escalating competition has rendered it difficult to fully pass through cost pressures in the near term.
Statistical Abstract
Year to Net Profit Diluted EPS EPS growth EV/EBITDA P/E P/B P/CEPS ROE Yield31 Mar (RsM) (Rs) (%) (x) (x) (x) (x) (%) (%)2008A 17,308 59.9 na 16.0 21.2 4.4 16.0 na 0.42009A 12,188 42.2 -29.6 26.0 30.1 3.9 19.1 13.7 0.32010E 24,536 84.9 101.3 10.6 15.0 3.2 11.3 23.4 0.42011E 28,948 100.2 18.0 9.7 12.7 2.6 9.7 22.3 0.52012E 35,359 122.4 22.1 7.9 10.4 2.1 8.1 22.1 0.5
Source: Company Reports and CIRA Estimates
Maruti Suzuki India (MRTI.BO)
Buy/Low Risk 1LPrice (11 May 10) Rs1,270.50Target Price Rs1,707.00Expected share price return 34.4%Expected dividend yield 0.4%Expected total return 34.8%Market Cap Rs367,060M US$8,140M
Price Performance
800
1000
1200
1400
1600
1800
May 09 Aug 09 Nov 09 Feb 10 May 10
INR
Source: dataCentral
Jamshed Dadabhoy +91-22-6631-9883 [email protected] Arvind Sharma +91-22-6631-9852 [email protected]
Company description
Maruti is a subsidiary of Suzuki Motor Corp (holds a 54% equity stake). With its early-mover advantage in the Indian market, Maruti is a dominant player in the domestic passenger car market with a c.50% market share. It is re-positioning itself to become a global production hub of Suzuki over the medium term

India Investor Conference 2010 18 May 2010
Citigroup Global Markets 71
Maruti Suzuki India (MRTI.BO): Financial Summary
Fiscal year end 31-Mar 2008 2009 2010E 2011E 2012E
Valuation RatiosP/E adjusted (x) 21.2 30.1 15.0 12.7 10.4EV/EBITDA adjusted (x) 14.6 22.7 9.6 8.2 6.3P/BV (x) 4.4 3.9 3.2 2.6 2.1Dividend yield (%) 0.4 0.3 0.4 0.5 0.5Per Share Data (Rs)EPS adjusted 59.91 42.19 84.93 100.20 122.39EPS reported 59.91 42.19 84.93 100.20 122.39BVPS 291.28 323.45 401.95 495.12 610.49DPS 5.00 3.50 5.50 6.00 6.00
Profit & Loss (RsM)Net sales 179,362 204,554 271,014 322,641 387,350Operating expenses -162,612 -197,270 -245,633 -293,550 -350,612EBIT 16,751 7,284 25,381 29,091 36,738Net interest expense -596 -510 -270 -150 -150Non-operating/exceptionals 8,876 9,985 10,449 13,013 14,657Pre-tax profit 25,030 16,759 35,560 41,954 51,245Tax -7,722 -4,571 -11,024 -13,006 -15,886Extraord./Min.Int./Pref.div. 0 0 0 0 0Reported net income 17,308 12,188 24,536 28,948 35,359Adjusted earnings 17,308 12,188 24,536 28,948 35,359Adjusted EBITDA 22,432 14,349 33,462 38,077 46,691Growth Rates (%)Sales 22.4 14.0 32.5 19.0 20.1EBIT adjusted -2.6 -56.5 248.5 14.6 26.3EBITDA adjusted 12.7 -36.0 133.2 13.8 22.6EPS adjusted 10.8 -29.6 101.3 18.0 22.1
Cash Flow (RsM)Operating cash flow 22,750 17,040 32,741 32,779 42,933Depreciation/amortization 5,682 7,065 8,081 8,986 9,953Net working capital -266 -2,063 123 -5,155 -2,379Investing cash flow -34,739 4,016 -45,725 -29,359 -42,476Capital expenditure -17,024 -16,058 -18,000 -20,000 -15,000Acquisitions/disposals -17,715 20,074 -27,725 -9,359 -27,476Financing cash flow 1,001 -4,906 -520 -1,528 -1,528Borrowings 2,694 -2,013 1,339 500 500Dividends paid -1,691 -1,183 -1,859 -2,028 -2,028Change in cash -10,988 16,150 -13,505 1,892 -1,071
Balance Sheet (RsM)Total assets 123,044 135,965 163,558 189,344 225,668Cash & cash equivalent 3,240 19,390 5,885 7,777 6,706Accounts receivable 6,555 9,189 11,880 13,259 15,918Net fixed assets 40,328 49,321 59,240 70,254 75,301Total liabilities 38,890 42,516 47,432 46,298 49,291Accounts payable 8,549 4,553 11,138 8,839 10,612Total Debt 9,002 6,989 8,328 8,828 9,328Shareholders' funds 84,154 93,449 116,126 143,046 176,377
Profitability/Solvency Ratios (%)EBITDA margin adjusted 12.5 7.0 12.3 11.8 12.1ROE adjusted 22.7 13.7 23.4 22.3 22.1ROIC adjusted 23.6 5.5 23.6 21.3 23.7Net debt to equity 6.8 -13.3 2.1 0.7 1.5Total debt to capital 9.7 7.0 6.7 5.8 5.0
For further data queries on Citi’s full coverage universe please contact CIRA Data Services Asia Pacific ([email protected]) or +852-2501-2791
Investment Strategy
We rate Maruti shares Buy. Over FY10-12E, we expect the Indian car market to resume growth at the trend rate of 12-15%, driven by a) low penetration levels, b) resumption of financing, and c) a decline of c10% in the overall cost of ownership. Maruti is best positioned to benefit from this growth, in our view, given its dominance in the domestic car market. The company's rising penetration in the diesel car market gives it a more balanced product mix than two years ago, while export initiatives will reduce its dependence on the domestic car market. We estimate earnings and cash earnings CAGRs of 43% and 33%, respectively, over FY09-12E, driven by unit sales CAGR of 17% and margin expansion.
Valuation
Our target price for Maruti of Rs1,707 is based on 13x Mar FY11e cash earnings (CEPS = PAT + depreciation). At 13x (earlier 13.5x) we value MSIL at 30% over its historical average of 10x. We have cut it from 13.5x to 13x as market multiples have also declined commensurately over the last 4 months and we think that MSIL's relative premium to the broader Sensex should continue with recent past levels. We estimate cash earnings CAGR of 33% over FY09-FY12E, which should support valuations, in our view. On our target multiple, Maruti would trade at FY11E P/E of around 17x (broad market is ~15.5-16x). We prefer price/cash earnings as a valuation metric for the automobile sector, given the industry's high capital intensity (both in terms of capacity and product development). Moreover, MSIL's depreciation policy is per IFRS standards, and is thus more aggressive than those of peers.

India Investor Conference 2010 18 May 2010
Citigroup Global Markets 72
Clean Insurance Play
Best Proxy for investment in Insurance business — Max India is a proxy for the insurance and healthcare sectors in India. It is a holding company for stakes in Max New York Life (74% stake) and Max Healthcare (70% Stake).
Max Insurance – Strong mix, and back in the hunt — A JV with New York Life for Insurance business has had a rollercoaster ride. A strong start followed with some disappointments, but bounced back to a 5% + market share, and has maintained it through the slowdown last year. Its operating parameters – on product mix, agency efficiency, and profit focus, are amongst the best in the industry, and Max should sustain some of these advantages.
Distribution Mix — MNYL primarily runs an agency-driven business; though is widening to a multi-channel distribution approach. It however has the distinction of having the most productive agent force in the industry, given training inputs and agency management, though a competitive market environment will continue to pressure its strengths.
Growing Healthcare Presence — Max India has a presence in the growing healthcare sector through a 70% stake in Max Healthcare. It has network of three tertiary care hospitals, 5 secondary care centers and nine clinics, in the NCR region with ~750 operational beds. Other major holders in the company are Warburg Pincus (20%) and IFC, Washington (4%).
Expansion Plans — Max Healthcare plans to add six new tertiary care facilities, with a capacity of 1,700 beds over the next two years. Four of the new projects are planned in the NCR region including a 260 bed hospital at Patparganj, a 300-bed hospital in Shalimar Bagh and a 90 bed oncology facility at Saket. Max also has a long-term project of setting up a 300 bed multispecialty hospital at Noida. Outside the NCR, Max is setting up three hospitals at Dehradun (150 beds), Mohali (300 beds) & Bathinda (300 beds).
Max India (MAXI.BO)
Non-Rated Price (11 May 10) Rs174.10 Market Cap Rs40,456M US$897M
Price Performance
100
150
200
250
300
May 09 Aug 09 Nov 09 Feb 10 May 10
INR
Source: dataCentral
Prashant Nair, CFA +91-22-6631-9855 [email protected] Manish Chowdhary, CFA +91-22-6631-9853 [email protected]
Company Description
Max India Ltd. is a diversified conglomerate with several service oriented businesses including Life Insurance (Max New York Life Insurance), Healthcare (Max Healthcare) and Clinical Research (Neeman Medical International). Max India's other businesses include speciality plastic products for the packaging industry and healthcare staffing.

India Investor Conference 2010 18 May 2010
Citigroup Global Markets 73
Max India (MAXI.BO): Financial Summary
Fiscal year end FY05 FY06 FY07 FY08 FY09
Valuation RatiosP/E adjusted (x) -18.7 9.7 -65.3 -79.0 -17.6P/E reported (x) -18.7 9.7 -65.3 -79.0 -17.6P/BV (x) 13.6 4.9 5.4 2.6 3.1Dividend yield (%) 0.0 0.0 0.0 0.0 0.0Per Share Data (Local Currency)EPS adjusted -9.69 18.71 -2.77 -2.29 -10.28EPS reported -9.69 18.71 -2.77 -2.29 -10.28BVPS 13.31 36.96 33.50 69.62 59.28NAVps ordinary 13.31 36.96 33.50 69.62 59.28DPS 0.00 0.00 0.00 0.00 0.00
Profit & Loss (Local Currency, Millions)Net operating income (NOI) 1,272 15,278 18,194 32,440 45,077G&A expenses -8,161 -11,675 -20,179 -36,007 -48,953Other Operating items 0 0 0 0 0EBIT including associates -1,309 3,603 -552 -317 -574Non-oper./net int./except. 192 -48 -60 -502 -2,726Pre-tax profit -1,134 3,528 -568 -802 -3,306Tax -33 -397 -157 -167 238Extraord./Min. Int./Pref. Div. 0 0 228 480 884Reported net income -1,167 3,131 -497 -489 -2,184Adjusted earnings -1,167 3,131 -497 -489 -2,184Adjusted EBIT -1,309 3,603 -552 -317 -574Adjusted EBITDAGrowth Rates (%)EBITDA N/A 1,101.2 19.1 78.3 39.0EBIT adjusted 92.2 -375.1 -115.3 -42.5 80.9EPS adjusted -37.3 -293.1 -114.8 -17.3 348.0
Cash Flow (Local Currency, Millions)Operating cash flow 466 2,736 7,291 15,919 17,623Depreciation/amortization 343 360 471 660 970Net working capital -274 -178 171 32 -1,262Investing cash flow -3,192 -4,947 -9,704 -29,263 -15,569Capital expenditure -688 -1,106 -2,412 -1,881 -3,011Acquisitions/disposals -2,504 -3,841 -7,292 -27,382 -12,558Financing cash flow 2,750 2,408 2,662 13,081 -90Borrowings 1,268 36 1,192 -11 -338Dividends paid 0 0 0 0 0Change in cash 24 197 249 -263 1,964
Balance Sheet (Local Currency, Millions)Total assets 11,862 21,444 32,537 64,489 78,949Cash & cash equivalent 265 5,624 5,363 3,825 4,211Net fixed assets 2,282 3,543 5,348 6,222 8,266Total liabilities 9,709 14,042 25,322 44,825 60,522Total Debt 3,039 3,822 5,590 5,522 3,474Shareholders' funds 2,153 7,401 7,215 19,664 18,427
Profitability/Solvency RatiosEBIT margin adjusted (%) -103.0 23.6 -3.0 -1.0 -1.3ROE adjusted (%) -62.5 75.8 -8.0 -4.6 -16.0ROA adjusted (%) -11.6 18.8 -1.8 -1.0 -3.2Net debt to equity (%) 128.8 -24.3 3.2 8.6 -4.0Interest coverage (x) -39.7 9.1 -3.5 -1.9 2.4
Source: Bloomberg
Recent Developments
The company announced its 3QFY10 results in January 2010. Consolidated revenues stood at Rs17.3bn and Rs59bn for 3QFY10 and 9mFY10 respectively. The company reported a loss of Rs940m in 3QFY10 and Rs3.5bn for 9mFY10. Max had Rs89.5bn worth of assets under management as of 31 Dec ’09.
In December 2009, Max India announced that it had garnered a high value investment of the$115 million (about Rs 540 crore) from the private equity arm of global investment bank Goldman Sachs. The investment will be through Fully & Compulsory Convertible Debentures (FCD) carrying a coupon rate of 12% per annum. These FCDs will be converted into equity shares of Max India in 15 months at Rs. 216.75 per share.
Source: Max India Press Release

India Investor Conference 2010 18 May 2010
Citigroup Global Markets 74
Is the PV Strategy Working?
Outlook for optical media business — Optical media business has seen some improvement in the recent past. However, the migration to higher value formats remains to be seen. Improvement in this segment could provide Moser Baer with some cash to fund other growth businesses. Outlook in this business is one of the key issues to focus on.
PV business outlook challenging — Globally, pricing of solar cells/modules continues to be under pressure given the demand supply imbalances. Moser Baer, which had aggressive investment plans for PV in the past, has scaled back its plans significantly. The ramp up plans for the PV business is a key issue to focus on.
Scalability/profitability in home entertainment business — Management is once again focusing on the home entertainment division now that the content costs have cooled off. Scalability/profitability in this business is another important area of focus on.
Profitability and source of funds — While Moser has aggressive ramp up plans over the next few years, profitability and funding of the same remains a key focus area. Any further capital raising could be another question for the management given the high debt-equity that the company has.
Statistical Abstract
Year to Net Profit Diluted EPS EPS growth EV/EBITDA P/E P/B P/CEPS ROE Yield31 Mar (RsM) (Rs) (%) (x) (x) (x) (x) (%) (%)2007A 788 4.7 na 5.1 14.7 0.6 2.6 na 1.52008A -2,023 -12.1 -357.5 7.8 -5.7 0.5 4.7 -9.5 1.52009E -4,305 -25.6 112.8 10.2 -2.7 0.5 5.6 -19.7 0.02010E 352 2.1 -108.2 4.6 32.8 0.5 1.5 1.6 1.52011E 2,950 17.6 738.0 3.8 3.9 0.5 1.1 12.6 1.5
Source: Powered by dataCentral
Moser Baer India (MOSR.BO)
Sell/High Risk 3HPrice (11 May 10) Rs68.70Target Price Rs99.00Expected share price return 44.1%Expected dividend yield 1.5%Expected total return 45.6%Market Cap Rs11,563M US$258M
Price Performance
020406080
100120
May 09 Aug 09 Nov 09 Feb 10 May 10
INR
Source: dataCentral
Surendra Goyal, CFA1 +91-22-6631-9870 [email protected]
Vishal Agarwal1 +91-22-6616-2742 [email protected]
Company description
Moser Baer has interests in optical media, home entertainment, and solar energy. It is the world's second-largest manufacturer of optical storage media with a significant market share – with most of the largest OEMs among its customers. Photovoltaic cells and module (PV) is a new business for which Moser has aggressive ramp up plans. It has also forayed into home entertainment with an eye on increased penetration in the VCD/DVD market in India, which should help ASPs for its optical discs.

India Investor Conference 2010 18 May 2010
Citigroup Global Markets 75
Moser Baer India (MOSR.BO): Financial Summary
Fiscal year end 31-Mar 2007 2008 2009E 2010E 2011E
Valuation RatiosP/E adjusted (x) 14.7 -5.7 -2.7 32.8 3.9EV/EBITDA adjusted (x) 5.2 8.3 10.5 4.4 3.7P/BV (x) 0.6 0.5 0.5 0.5 0.5Dividend yield (%) 1.5 1.5 0.0 1.5 1.5Per Share Data (Rs)EPS adjusted 4.68 -12.05 -25.65 2.10 17.57EPS reported 4.68 -12.05 -25.65 2.10 17.57BVPS 122.29 131.10 129.93 130.88 147.30DPS 1.00 1.00 0.00 1.00 1.00
Profit & Loss (RsM)Net sales 19,840 20,700 27,111 45,159 58,416Operating expenses -18,460 -21,649 -30,003 -42,410 -52,628EBIT 1,380 -949 -2,891 2,749 5,787Net interest expense -497 -1,006 -1,547 -2,386 -2,746Non-operating/exceptionals 7 -45 0 0 0Pre-tax profit 890 -2,000 -4,439 363 3,041Tax -102 -23 133 -11 -91Extraord./Min.Int./Pref.div. 0 0 0 0 0Reported net income 788 -2,023 -4,305 352 2,950Adjusted earnings 788 -2,023 -4,305 352 2,950Adjusted EBITDA 4,963 3,509 3,465 9,840 12,889Growth Rates (%)Sales 19.2 4.3 31.0 66.6 29.4EBIT adjusted 425.1 -168.8 -204.6 195.1 110.5EBITDA adjusted 44.7 -29.3 -1.3 184.0 31.0EPS adjusted 1,311.4 -357.5 -112.8 108.2 738.0
Cash Flow (RsM)Operating cash flow 5,641 1,911 4,439 8,020 12,582Depreciation/amortization 3,582 4,458 6,356 7,092 7,101Net working capital 685 -1,533 841 -1,809 -215Investing cash flow -6,335 -11,210 -16,082 -8,544 -11,866Capital expenditure -6,598 -9,410 -17,082 -9,744 -13,066Acquisitions/disposals 0 0 0 0 0Financing cash flow 491 14,812 9,563 221 -139Borrowings 1,948 13,340 8,000 4,000 4,000Dividends paid -196 -197 0 -193 -193Change in cash -203 5,513 -2,080 -303 578
Balance Sheet (RsM)Total assets 43,559 59,788 69,545 77,945 88,017Cash & cash equivalent 2,697 8,210 6,130 5,828 6,405Accounts receivable 3,342 3,768 4,457 7,423 9,603Net fixed assets 28,811 33,490 44,216 46,869 52,833Total liabilities 23,076 37,780 47,733 55,974 63,288Accounts payable 4,485 5,846 7,800 12,040 15,355Total Debt 18,502 31,842 39,842 43,842 47,842Shareholders' funds 20,483 22,008 21,812 21,971 24,728
Profitability/Solvency Ratios (%)EBITDA margin adjusted 25.0 17.0 12.8 21.8 22.1ROE adjusted 3.9 -9.5 -19.7 1.6 12.6ROIC adjusted 3.7 -2.5 -5.9 5.1 9.6Net debt to equity 77.2 107.4 154.6 173.0 167.6Total debt to capital 47.5 59.1 64.6 66.6 65.9
For further data queries on Citi’s full coverage universe please contact CIRA Data Services Asia Pacific ([email protected]) or +852-2501-2791
Investment Strategy
We rate Moser Baer Sell/High Risk (3H). Despite a significant market share in the optical media business, Moser Baer has suffered a reduction in profitability due to a sharp price reduction of optical media and price escalation in its key raw material - polycarbonate (PC). We expect this business to grow ~7% YoY over FY08-11E in volume terms, with profitability improving over a longer term as PC prices ease. PV is a relatively new business. Government incentives should continue to drive demand globally, but pricing and profitability are difficult to forecast, with margins likely to face pressure from higher solar-grade silicon prices, competition from Chinese/European players and low entry barriers.
Valuation
Our target price is derived from a SOTP methodology. We value the optical media business at 0.7x FY10E EV/Capital employed. Over FY05-07 (prior to its venture in the PV business), Moser Baer traded at an average EV/Capital employed of 1.0x (in a 0.8-1.3x range). We believe that it will continue to trade towards the lower end as the optical media business has not improved over the past few quarters. We value the PV business at 1.8x FY10E EV/Sales, a premium to established global cell and module PV players, despite Moser's limited operating history in this segment. We apply a premium because Moser has some capacity on thin film technology, where multiples are much higher than for cell and module PV makers. We value the home entertainment business at 1.0x FY10E EV/Sales, given its decent growth phase.

India Investor Conference 2010 18 May 2010
Citigroup Global Markets 76
Steady Momentum at the Port — While FY10E volumes were slightly lower than our expectations; the port business is clearly seeing a recovery and cargo mix is getting more balanced lending the business more resilience. MPSEZ is doing ~3-3.5mmt per month and FY10 throughput was ~40mn tons.
Capacity expansion plan on track — The progress on coal terminal is better than expected and expected completion date is Oct 2010. MPSEZ is adding another 15mtpa at Mundra; and new terminals at Dahej, Hazira & Mormugao will add ~40-45mmt of additional capacity.
SEZ update — MPSEZ is in advanced stages to acquire/notify 6000 acres. MPSEZ has sold ~20 acres of land in Q3FY10 for Rs90-95mn. With this; the cumulative land sales for 9MFY10 is ~160 acres vs. our FY10E estimate of 375 acres. SEZ transactions tend to be lumpy and our recent discussions with management suggest that the company is in advanced discussions with large potential clients
India’s port capacity addition program remains behind schedule — This benefits MPSEZ. Government-controlled major ports would have a capacity to handle 743 mmt of cargo by March 31, 2012, compared with a target of 1.02 bn tones (73% of target). As a result, privately owned and more efficient ports like MPSEZ would find it easier to attract traffic.
Statistical Abstract
Year to Net Profit Diluted EPS EPS growth EV/EBITDA P/E P/B P/CEPS ROE Yield31 Mar (RsM) (Rs) (%) (x) (x) (x) (x) (%) (%)2008A 1,776 4.4 na 55.0 158.8 10.8 89.8 na 0.22009A 4,434 11.1 149.7 38.4 63.6 9.6 47.1 16.6 0.42010E 6,909 17.2 55.8 32.9 40.8 8.1 33.6 21.5 0.42011E 12,097 30.2 75.1 19.5 23.3 6.4 20.3 30.7 0.92012E 20,219 50.5 67.1 12.1 13.9 4.7 12.8 39.0 1.4
Source: Company data, Citi Investment Research and Analysis estimates
Mundra Port & Special Economic Zone (MPSE.BO)
Hold/Medium Risk 2MPrice (11 May 10) Rs703.70Target Price Rs659.00Expected share price return -6.4%Expected dividend yield 0.4%Expected total return -5.9%Market Cap Rs281,958M US$6,253M
Price Performance
200
400
600
800
May 09 Aug 09 Nov 09 Feb 10 May 10
INR
Source: dataCentral
Deepal Delivala +91-22-6631-9857 [email protected]
Company description
Mundra Port (MPSEZ) is a private port located in Gujarat, one of India's most industrialized, investor-friendly and commercially successful states. MPSEZ provides a convenient international trade gateway to Europe, Africa, America and the Middle East. Gujarat ports have good road connectivity to Delhi and Mumbai. MPSEZ has 2 bulk cargo terminals and 2 container cargo terminals with an effective handling capacity of 50-55mtpa per year. It also has a SPM terminal for crude imports. Cargo growth at Mundra Port has outpaced growth at major ports in India. MPSEZ is developing a ~32000-acre SEZ near Mundra Port that should support volume growth

India Investor Conference 2010 18 May 2010
Citigroup Global Markets 77
MPSEZ (MPSE.BO): Financial Summary
Fiscal year end 31-Mar 2008 2009 2010E 2011E 2012E
Valuation RatiosP/E adjusted (x) 158.8 63.6 40.8 23.3 13.9EV/EBITDA adjusted (x) 53.8 37.6 32.2 19.0 11.5P/BV (x) 10.8 9.6 8.1 6.4 4.7Dividend yield (%) 0.2 0.4 0.4 0.9 1.4Per Share Data (Rs)EPS adjusted 4.43 11.07 17.24 30.19 50.46EPS reported 5.33 11.51 17.24 30.19 50.46BVPS 65.20 73.51 86.77 109.98 148.79DPS 1.50 3.00 3.00 6.04 10.09
Profit & Loss (RsM)Net sales 8,182 11,351 13,376 20,839 31,864Operating expenses -3,834 -5,107 -5,932 -7,604 -9,480EBIT 4,348 6,244 7,444 13,236 22,384Net interest expense -1,062 -1,330 -735 -1,239 -2,165Non-operating/exceptionals 24 49 200 100 0Pre-tax profit 3,310 4,963 6,909 12,097 20,219Tax -1,534 -529 0 0 0Extraord./Min.Int./Pref.div. 358 177 0 0 0Reported net income 2,134 4,611 6,909 12,097 20,219Adjusted earnings 1,776 4,434 6,909 12,097 20,219Adjusted EBITDA 5,354 7,616 8,936 15,013 24,224Growth Rates (%)Sales 40.7 38.7 17.8 55.8 52.9EBIT adjusted 85.9 43.6 19.2 77.8 69.1EBITDA adjusted 70.2 42.3 17.3 68.0 61.4EPS adjusted -6.0 149.7 55.8 75.1 67.1
Cash Flow (RsM)Operating cash flow 5,386 7,612 7,494 14,421 23,172Depreciation/amortization 1,006 1,372 1,493 1,777 1,840Net working capital 388 1,127 151 -102 -185Investing cash flow -19,506 -7,226 -3,994 -10,900 -3,040Capital expenditure -9,469 -13,735 -470 -10,078 -3,040Acquisitions/disposals -10,037 6,509 -3,524 -823 0Financing cash flow 22,087 1,849 -110 8,338 -8,043Borrowings 6,245 4,063 2,000 12,000 -1,856Dividends paid -601 -1,202 -1,382 -2,419 -4,044Change in cash 8,327 2,411 3,389 11,859 12,089
Balance Sheet (RsM)Total assets 57,283 64,946 70,037 91,582 105,643Cash & cash equivalent 8,896 11,307 14,696 26,555 38,644Accounts receivable 2,963 2,116 2,492 2,688 2,903Net fixed assets 32,477 44,840 43,817 52,117 53,317Total liabilities 31,158 35,494 35,272 47,515 46,027Accounts payable 2,554 3,079 2,431 2,892 3,479Total Debt 19,067 23,130 25,130 37,130 35,273Shareholders' funds 26,125 29,453 34,766 44,068 59,617
Profitability/Solvency Ratios (%)EBITDA margin adjusted 65.4 67.1 66.8 72.0 76.0ROE adjusted 10.6 16.0 21.5 30.7 39.0ROIC adjusted 9.1 14.1 16.3 26.9 41.3Net debt to equity 38.9 40.1 30.0 24.0 -5.7Total debt to capital 42.2 44.0 42.0 45.7 37.2
For further data queries on Citi’s full coverage universe please contact CIRA Data Services Asia Pacific ([email protected]) or +852-2501-2791
Investment Strategy
We rate Mundra Port Hold/Medium Risk with a Rs659 target price. The company has strong growth and returns, low gearing and a strong balance sheet. Over FY10-12E, we expect compound growth of 37% in cargo volumes, 54% in revenues and 71% in profits. We expect margins to expand by 921bps over FY10-12E and ROE to improve to 39% from 16% in FY09. Capex is well funded, and net D/E of 0.3x gives headroom to leverage further.
Port business is clearly seeing a recovery and cargo mix is getting more balanced lending the business more resilience. MPSEZ is currently doing ~3-3.5mmt per month and expects FY10E volumes of ~42-44mmt. The progress at the coal terminal has been better than expected with expected project completion in Oct ‘10. MPSEZ is adding another 15mtpa at Mundra, and new terminals at Dahej, Hazira & Mormugao will add ~40-45mmt of additional capacity
We believe positive news flow on SEZ land transactions will be the driver for stock price.
Valuation
Our target price for MPSEZ is Rs659. Mundra Port is valued at Rs549/share on a discounted cash flow to equity basis, using a cost of equity of 12%. The SEZ is valued at Rs101/share, using a cost of equity of 14% and then assigning a 20% discount to the calculated NAV (consistent with how we value the smaller Indian real estate companies). We value the investments in subsidiaries at book value (a combined Rs9/share).

India Investor Conference 2010 18 May 2010
Citigroup Global Markets 78
Low-Cost Integrated Aluminium Producer
Competitive edge — Nalco is one of the lowest-cost alumina and aluminum producers globally. Its competitive advantage stems from good quality bauxite, low-cost captive power, own railway wagons and captive port facilities. Its smelter capacity has been expanded to 460k tpa in Dec09 (from 345ktpa) and power capacity is expected to reach 1,200MW by July10 (enhanced to 1,080MW in Dec10 from 960MW). Alumina capacity should rise to 2.1m tpa from 1.58m tpa by Dec10. Nalco sells surplus alumina in international market and is India's largest alumina exporter.
Aluminium: near term support — Our global aluminium price forecasts have been revised to US$2,350/t for FY11 and US$2,416/t for FY12. Aluminium has short-term support from illiquid inventories and merchant premia. Price upside could also come from a power crunch or bauxite shortages, with power cost trends in China an important emerging trend. Longer-term challenges are large stockpiles and capacity build-up.
Coal issues better — In FY10, the proportion of linkage coal fell to ~84% and Nalco was adversely impacted by poor quality linkage coal, high cost of imported and e-auction coal. Nalco is hopeful that the percentage of linkage coal will increase to atleast 90% and its power and fuel costs come down yoy (benefited also by the completion of the captive power plant expansion).
Long term expansion plans — Nalco plans to enhance its alumina capacity to 2.28mt by 2012 and subsequently by another 700kt (4 years completion). The company has greenfield expansion plans in Indonesia – 500ktpa smelter; Orissa – 500ktpa smelter; Andhra Pradesh – bauxite + alumina refinery (1.4mtpa). The Indonesian smelter will source alumina from the Andhra Pradesh refinery and the Orissa smelter will use Nalco’s surplus alumina.
Strong balance sheet — Cash balance is in excess of Rs40bn (Rs62/share). The expansion capex has been funded through internal accruals and Nalco has zero debt. Planned capex in FY11 and FY12 is ~Rs11bn pa. It does not expect to raise debt for its medium term domestic expansion plans.
_______________________________________________________________
_______________________________________________________________
_______________________________________________________________
_______________________________________________________________
_______________________________________________________________
_______________________________________________________________
_______________________________________________________________
National Aluminium (NALU.BO)
Sell/Medium Risk 3MPrice (11 May 10) Rs411.30Target Price Rs296.00Expected share price return -28.0%Expected dividend yield 1.1%Expected total return -26.9%Market Cap Rs265,005M US$5,877M
Price Performance
250300350400450500550
May 09 Aug 09 Nov 09 Feb 10 May 10
INR
Source: dataCentral
Pradeep Mahtani +91-22-6631-9882 [email protected]
Raashi Chopra +91-22-6631-9862 [email protected]
Company description
Nalco has smelter capacity of 460ktpa. It has bauxite deposits to meet more than 50 years of expanded alumina capacity (2.1m tpa from 1.58m tpa by Dec10). Good quality bauxite, open cast mines and low bauxite transport costs make it one of the world's lowest cost alumina producers. It sells surplus alumina in international markets, and is India's largest alumina exporter. Its thermal power capacity (1,200MW by July10; 1,080MW now) meets in-house requirements at about a third of grid cost, and any surplus power is sold to the grid. Low costs for power, alumina and labor make it one of the lowest-cost aluminum producers globally.

India Investor Conference 2010 18 May 2010
Citigroup Global Markets 79
National Aluminium (NALU.BO): Financial Summary
Fiscal year end 31-Mar 2008 2009 2010E 2011E 2012E
Valuation RatiosP/E adjusted (x) 16.0 21.0 24.3 16.8 14.0EV/EBITDA adjusted (x) 8.3 10.4 11.8 8.6 7.0P/BV (x) 3.0 2.7 2.5 2.3 2.0Dividend yield (%) 1.5 1.2 1.1 1.3 1.3Per Share Data (Rs)EPS adjusted 25.72 19.53 16.89 24.48 29.22EPS reported 25.72 19.53 16.89 24.48 29.22BVPS 137.74 151.63 163.25 181.30 204.08DPS 6.00 5.00 4.50 5.50 5.50
Profit & Loss (RsM)Net sales 49,888 50,945 49,079 59,465 64,481Operating expenses -24,953 -31,772 -32,724 -35,764 -36,196EBIT 24,935 19,173 16,355 23,701 28,284Net interest expense -15 -40 -20 -20 -20Non-operating/exceptionals 0 0 0 0 0Pre-tax profit 24,920 19,134 16,335 23,681 28,264Tax -8,351 -6,549 -5,456 -7,910 -9,440Extraord./Min.Int./Pref.div. 0 0 0 0 0Reported net income 16,569 12,585 10,879 15,772 18,824Adjusted earnings 16,569 12,585 10,879 15,772 18,824Adjusted EBITDA 27,746 21,898 19,937 27,635 32,437Growth Rates (%)Sales -16.0 2.1 -3.7 21.2 8.4EBIT adjusted -31.3 -23.1 -14.7 44.9 19.3EBITDA adjusted -29.7 -21.1 -9.0 38.6 17.4EPS adjusted -30.6 -24.0 -13.6 45.0 19.4
Cash Flow (RsM)Operating cash flow 19,019 19,382 12,724 19,187 22,311Depreciation/amortization 2,811 2,724 3,581 3,933 4,153Net working capital 300 3,608 -865 -299 286Investing cash flow -14,291 -14,171 -21,744 -7,119 -3,136Capital expenditure -15,441 -12,953 -25,000 -10,300 -7,500Acquisitions/disposals 0 0 0 0 0Financing cash flow -5,279 -3,877 -1,151 -3,412 -4,166Borrowings 0 0 0 0 0Dividends paid -5,277 -3,769 -1,131 -3,392 -4,146Change in cash -550 1,335 -10,170 8,655 15,008
Balance Sheet (RsM)Total assets 110,228 123,244 136,462 153,323 172,614Cash & cash equivalent 35,165 28,690 18,521 27,176 42,184Accounts receivable 607 265 440 532 576Net fixed assets 58,664 68,997 90,415 96,782 100,130Total liabilities 21,483 25,546 31,276 36,512 41,125Accounts payable 4,357 4,554 4,657 5,198 5,419Total Debt 0 0 0 0 0Shareholders' funds 88,745 97,698 105,185 116,811 131,489
Profitability/Solvency Ratios (%)EBITDA margin adjusted 55.6 43.0 40.6 46.5 50.3ROE adjusted 20.0 13.5 10.7 14.2 15.2ROIC adjusted 30.5 19.8 13.8 16.9 19.2Net debt to equity -39.6 -29.4 -17.6 -23.3 -32.1Total debt to capital 0.0 0.0 0.0 0.0 0.0
For further data queries on Citi’s full coverage universe please contact CIRA Data Services Asia Pacific ([email protected]) or +852-2501-2791
Investment Strategy
We rate Nalco shares Sell/Medium Risk (3M).
Valuation
We use P/E to value Nalco as it is driven largely by commodity price trends, which translate into earnings momentum. Our target price of Rs296 is based on 11.3x core PE (Rs239), to which we add cash per share of Rs56. Our target multiple of 11.3x (March-2011E) earnings is the average of Nalco's five-year trading range. In the past six years, the stock has largely traded in a P/E range of 7x-11x. There have been periods when the 12-month rolling forward P/E multiples have crossed this band, as seen during Jun-2007-Oct-2008, and also since the beginning of FY10. A mean PE multiple appears justified based on our use of higher LME price estimates. Based on our target price of Rs296, Nalco's FY11E EV/EBITDA equates to 5.6x and a PE of 12.1x.

India Investor Conference 2010 18 May 2010
Citigroup Global Markets 80
India’s Largest Iron Ore Producer
Fundamentally strong — NMDC is India's largest iron ore producer (28.5mt in FY09) with 1,204mt of reserves and resources (incl 163mt from 51% in Deposit 13). It has 70%+ margins. Positives:1) Strong ore prices, 2) rich ore - Fe >64%, 3) established rail links and infrastructure, 4) exposure to rising domestic steel production, 5) at least 25 years of mine life, 6) volume growth (8% CAGR in past four years), 6) cash-rich balance sheet ($2.7bn).
Iron ore outlook — The global iron ore industry has moved from annual benchmark pricing to quarterly pricing. We expect contract prices to double in 1QFY11 ($125/t) vs FY10 and rise further in 2Q ($139/t) but see downside thereafter ($120/t) on 1) rising Chinese domestic production − price elastic; 2) steel use intensity peaking in China; 3) margin compression for steel industry pressurizing prices.
Growth plans — NMDC has an iron ore production target of 50m tonnes by 2015. Other businesses (diamond, wind power) are less than 1% of sales. Future plans include a 3m tpa steel plant in Chhattisgarh, pellet plants, and diversification into coal, gold, magnesite and limestone. As a Navratna company, the Board has enhanced power to incur capital expenditure without reference to the government.
NMDC vs Sesa Goa — 85% of NMDC's ore is sold domestically, 90% of sales are on contract − insulating it to some extent from the global ore price volatility and export duties. On the other hand, ~95% of Sesa Goa's ore is exported, and >80% is sold on a spot basis. NMDC's ore grade is superior (vs. ~59.5% for Sesa Goa). NMDC benefits as its domestic customers bear the freight costs and mining royalties.
Management concerns — 1) Lower iron ore prices; 2) Delays in obtaining mining leases or lower offtake; 3) Inability to pass on higher royalties; 4) Increase in export duties; 5) Increase in rail freight for exported ore; and 6) Disruption due to the Maoist insurgency.
_______________________________________________________________
_______________________________________________________________
_______________________________________________________________
_______________________________________________________________
_______________________________________________________________
_______________________________________________________________
_______________________________________________________________
NMDC (NMDC.BO)
Non-Rated Price (11 May 10) Rs291.20 Market Cap Rs1,154,525M US$25,602M
Price Performance
100
200
300
400
500
600
May 09 Aug 09 Nov 09 Feb 10 May 10
INR
Source: dataCentral
Raashi Chopra +91-22-6631-9862 [email protected]
Pradeep Mahtani +91-22-6631-9882 [email protected]
Company Description
NMDC is India's largest iron ore producer with reserves and resources of ~1.2bn tonnes (incl 163mt from 51% in Deposit 13 – a JV with the Chhattisgarh Mineral Development Corporation). Its three open pit iron ore mines are in the states of Chhattisgarh (87% of reserves) and Karnataka (13%). Its ore is very rich with Fe content >64%, and is suitable for the BF furnace steel making process and gas-based sponge iron production process. NMDC sold 85% of its ore in the domestic market in FY09. Its key customers include RINL, JSW Steel, Essar Steel, Ispat Industries, KIOCL and smaller Chhattisgarh based companies. Exports (15%) are largely to South Korea, Japan and China. ~90% of NMDC’s sales are on contract basis. NMDC also operates one of the largest diamond mines in Asia at Panna in Madhya Pradesh. It owns wind power capacity (10.5MW) in Karnataka.

India Investor Conference 2010 18 May 2010
Citigroup Global Markets 81
NMDC (NMDC.BO): Financial Summary
Figure 1. Profit and Loss Statement (Rs m)
FY05 FY06 FY07 FY08 FY09Net sales 22,300 37,109 41,858 57,113 75,640Operating expenses 10,473 10,271 9,623 13,746 17,268Operating profit 11,827 26,838 32,236 43,367 58,372Operating profit margin (%) 53% 72% 77% 76% 77%Other income 1,053 1,999 3,547 6,705 8,840EBITDA 12,879 28,838 35,783 50,073 67,213Depreciation 638 1,137 800 600 736EBIT 12,241 27,701 34,982 49,473 66,477Interest expenses 0 0 0 0 0PBT 12,241 27,701 34,982 49,473 66,477Total Tax 4,865 9,546 11,869 16,864 22,963PAT 7,376 18,154.8 23,113 32,608 43,514Extraordinary items 179 123 89 -99 210Reported PAT 7,554 18,278 23,202 32,510 43,724
Source: Company Reports
Figure 2. Balance Sheet (Rs m)
FY05 FY06 FY07 FY08 FY09Fixed assets 5,689 5,863 6,179 6,799 9,949Gross Block 11,768 12,597 13,042 14,214 16,692Less: Depreciation 6,393 7,295 7,993 8,533 9,225Net Block 5,374 5,302 5,049 5,681 7,466CWIP 315 562 1,130 1,118 2,483Investments 740 740 744 833 715Current assets 28,048 37,533 55,254 82,827 117,710Inventories 1,171 1,266 1,267 1,661 3,025Debtors 1,847 3,161 2,833 4,877 10,272Cash and Bank balance 19,048 31,095 48,492 71,988 97,397Other current assets 5 797 842 1,863 2,984Loans and advances 5,976 1,215 1,820 2,438 4,033Current liabilities 8,666 4,105 4,170 7,748 11,648Creditors 1,573 1,763 1,482 2,324 3,894Other current liabilities 856 923 1,198 1,861 952Provision for taxation 4,860 5 0 0 0Provision for dividend 1,145 1,270 1,314 2,505 5,474Other provisions 233 143 175 1,058 1,328Miscellaneous Expenditure 348 300 268 246 222Overall capital employed 26,158 40,331 58,275 82,957 116,950Shareholders' funds 26,035 40,145 58,009 82,897 116,369Share capital 1,322 1,322 1,322 1,322 3,965Reserves and surplus 24,714 38,823 56,688 81,575 112,404Loan funds 2 2 0 0 0Deferred tax liability 121 185 266 60 580Total sources of Funds 26,158 40,331 58,275 82,957 116,950
Source: Company Reports
Figure 3. Cashflow Statement (Rs m)
FY05 FY06 FY07 FY08 FY09Cash flow from operations 8,144 15,694 20,522 24,759 27,783Cash flow from investments 1,103 396 2,171 5,169 4,908Cash flow from financing -1,115 -4,044 -5,295 -6,432 -7,283Net cash flow 8,132 12,046 17,397 23,496 25,409
Source: Company Reports
Recent Developments
The government raised the export duty on iron ore lumps from 10% to 15% in end April 2010. NMDC exports ~ 15% of its volumes and lumps account for two-thirds of its exports.

India Investor Conference 2010 18 May 2010
Citigroup Global Markets 82
Coming Out of Its Shell
Stable operations, looking for growth — Oil India (OIL), which has predominantly focused on North-East Indian onshore blocks, has gradually gained exposure to domestic offshore through NELP blocks, as well as blocks abroad. Although the strategic shift to reinvest cash flows from the pre-NELP blocks is in the right direction, it may take time to show results.
Small in size, but good operating track record — OIL’s 2P reserves at 974mmboe pegs it at ~1/10th the size of ONGC, although its proportion of crude oil at 60% of reserves is higher than ONGC’s 53%. Although volume growth (boe) of 5% over FY10E-12E should remain moderate, it is slightly better than ONGC.
Cash is now 37% of market cap — Slower-than-expected capex and steady operating results led to cash on the books of Rs101.5bn (Rs423/share) as of December 2009. OIL has been on the lookout for a producing asset, and the nature and prudence of any imminent acquisition will therefore be a key determinant of shareholder value. Until then, cash will provide downside support to valuations, in our view.
Government policy remains key — OIL seems slightly better placed operationally vs. ONGC in terms of delivering production growth (albeit modest) and valuation support from cash. However, the key driver of the stock remains the same, i.e. the direction of any subsidy reforms. Implementation of a transparent subsidy mechanism and likely action on any concrete recommendations in the soon-to-be-submitted Kirit Parikh Committee report remain key for a constructive stance on OIL.
Key risks — Upside risks include a favourable subsidy regime and higher crude prices. Downside risks include sharp increase in crude price leading to higher subsidy burden on upstream companies and rupee appreciation.
Statistical Abstract
Year to Net Profit Diluted EPS EPS growth EV/EBITDA P/E P/B P/CEPS ROE Yield31 Mar (RsM) (Rs) (%) (x) (x) (x) (x) (%) (%)2008A 17,889 83.6 na 8.6 13.6 3.1 9.8 24.2 2.42009A 21,617 101.0 20.8 6.3 11.2 2.6 7.6 25.0 2.72010E 26,937 112.0 10.9 4.9 10.1 2.0 7.0 23.3 3.42011E 29,967 124.6 11.2 3.6 9.1 1.7 6.3 20.4 3.72012E 30,926 128.6 3.2 3.5 8.8 1.6 6.3 18.7 3.9
Source: dataCentral, CIRA Estimates
Oil India (OILI.BO)
Hold/Low Risk 2LPrice (11 May 10) Rs1,132.85Target Price Rs1,165.00Expected share price return 2.8%Expected dividend yield 3.4%Expected total return 6.2%Market Cap Rs272,399M US$6,041M
Price Performance
900
1000
1100
1200
1300
May 09 Aug 09 Nov 09 Feb 10 May 10
INR
Source: dataCentral
Rahul Singh +91-22-6631-9863 [email protected]
Saurabh Handa +91-22-6631-9858 [email protected]
Garima Mishra [email protected]
Company description
OIL is a public-sector E&P company engaged in exploration and production of crude oil and natural gas. Even though the company has most of its assets concentrated in Northeastern India, it is looking to diversify its business by concentrating on its NELP blocks, as well as acreages abroad. Post-IPO, the government (including HPCL, BPCL and IOC) holds 87.3% of the company.

India Investor Conference 2010 18 May 2010
Citigroup Global Markets 83
Oil India (OILI.BO): Financial Summary
Fiscal year end 31-Mar 2008 2009 2010E 2011E 2012E
Valuation RatiosP/E adjusted (x) 13.6 11.2 10.1 9.1 8.8EV/EBITDA adjusted (x) 8.3 6.2 4.8 3.8 3.7P/BV (x) 3.1 2.6 2.0 1.7 1.6Dividend yield (%) 2.4 2.7 3.4 3.7 3.9Per Share Data (Rs)EPS adjusted 83.59 101.01 112.02 124.63 128.61EPS reported 83.59 101.01 112.02 124.63 128.61BVPS 370.69 436.02 571.82 647.77 726.15DPS 27.50 30.50 38.09 42.37 43.73
Profit & Loss (RsM)Net sales 62,372 73,842 84,625 94,663 97,805Operating expenses -40,466 -47,375 -52,992 -58,269 -60,485EBIT 21,907 26,467 31,633 36,394 37,320Net interest expense -344 -87 -100 -100 -100Non-operating/exceptionals 5,582 7,537 9,280 9,110 9,637Pre-tax profit 27,145 33,916 40,813 45,404 46,857Tax -9,245 -12,253 -13,876 -15,437 -15,931Extraord./Min.Int./Pref.div. -11 -46 0 0 0Reported net income 17,889 21,617 26,937 29,967 30,926Adjusted earnings 17,889 21,617 26,937 29,967 30,926Adjusted EBITDA 28,849 36,944 43,359 49,510 49,769Growth Rates (%)Sales 12.6 18.4 14.6 11.9 3.3EBIT adjusted 7.9 20.8 19.5 15.1 2.5EBITDA adjusted 7.3 28.1 17.4 14.2 0.5EPS adjusted 9.1 20.8 10.9 11.2 3.2
Cash Flow (RsM)Operating cash flow 35,445 41,571 38,735 42,313 43,134Depreciation/amortization 6,942 10,477 11,726 13,116 12,449Net working capital 10,613 9,477 73 -770 -241Investing cash flow -8,485 -8,999 -16,900 -17,387 -16,000Capital expenditure -7,673 -8,999 -16,900 -17,387 -16,000Acquisitions/disposals 0 0 0 0 0Financing cash flow -12,530 -8,337 17,236 -11,705 -12,079Borrowings -6,391 -1,184 0 0 0Dividends paid -6,761 -7,498 -10,521 -11,705 -12,079Change in cash 14,431 24,236 39,071 13,221 15,054
Balance Sheet (RsM)Total assets 107,286 133,801 178,471 197,195 216,186Cash & cash equivalent 42,808 60,700 92,571 97,681 105,735Accounts receivable 6,110 4,047 4,638 5,189 5,361Net fixed assets 40,633 45,361 57,736 70,118 80,669Total liabilities 27,956 40,491 40,973 41,436 41,581Accounts payable 2,518 3,403 3,900 4,363 4,508Total Debt 1,749 565 565 565 565Shareholders' funds 79,330 93,310 137,498 155,759 174,606
Profitability/Solvency Ratios (%)EBITDA margin adjusted 46.3 50.0 51.2 52.3 50.9ROE adjusted 24.2 25.0 23.3 20.4 18.7ROIC adjusted 25.6 27.8 29.7 28.9 25.3Net debt to equity -51.8 -64.4 -66.9 -62.4 -60.2Total debt to capital 2.2 0.6 0.4 0.4 0.3
For further data queries on Citi’s full coverage universe please contact CIRA Data Services Asia Pacific ([email protected]) or +852-2501-2791
Investment Strategy
We rate OIL shares as Hold/Low Risk (2L), with an Rs1,165 target price. OIL has established reserves on Onshore Assam Basin with adequate reserve life and reasonable production growth, which generates strong and stable cash flows, adding on to the already strong balance sheet. Despite the new subsidy mechanism of the upstream companies sharing losses on only petrol/diesel, we believe that OIL's leverage to crude beyond US$65/bbl is going to be limited. OIL, which has predominantly focused on North-east Indian onshore blocks, has gradually gained exposure to domestic offshore through NELP blocks as well as abroad. Though the strategic shift to reinvest cash flows from the pre-NELP blocks is in the right direction, it will take time to show results, especially given lack of prior experience.
Valuation
Our target price of Rs1,165 comprises (i) Business valued at PER of 7.5x FY11E core EPS (@$65 net crude), and (ii) cash at Rs385/share (Mar-10E). The core PER is at a 15% discount to ONGC's current multiple of 9.0x. We believe a lower multiple vs. ONGC is warranted on account of (i) OIL's smaller size, (ii) still-to-be-tested track record outside the North East, and (iii) risk pertaining to use of OIL's significant cash balance, in addition to ONGC's relatively higher leverage to crude prices (thru OVL) and natural gas deregulation. Further re-rating from here would be dependent on higher net crude realizations i.e. significant price reforms in auto fuels, revision in gas prices, and any positive news flow from new exploration programs.

India Investor Conference 2010 18 May 2010
Citigroup Global Markets 84
Government Policy Is Key
Potential gas price hike could be positive — The government is considering raising ONGC’s APM gas price from ~US$1.9/mmbtu to US$4.2/mmbtu, aligning it with RIL’s KG gas price. The Supreme Court upholding the governments right to decide gas prices in the RIL-RNRL gas dispute judgment improves the probability of the price hike going through, which would be positive for ONGC.
Government policy remains uncertain — The Finance Ministry has agreed to compensate OMCs for Rs260bn vs. Rs315bn of losses on LPG/Kero in FY10, indicating there would not be any additional burden on upstream companies apart from auto fuel losses. However, there is no clarity yet on the subsidy-sharing formula for next year, especially since the government has not made any allocations towards subsidy in the budget.
Higher DD&A and falling production pose structural risks — ONGC’s DD&A costs (4-qtr moving avg.) have doubled to US$8.4/boe in 3QFY10 from FY06 levels, indicating that new production is coming at higher costs. Besides, ONGC’s crude production has declined from an average quarterly rate of 6.8MMT in FY09 to 6.6MMT in 9MFY10, raising concerns over ability to replace aging fields.
Upside risks — Partial deregulation and/or implementation of a transparent slab-based subsidy sharing structure (as recommended by the Kirit Parekh committee report) remains an upside risk.
Statistical Abstract
Year to Net Profit Diluted EPS EPS growth EV/EBITDA P/E P/B P/CEPS ROE Yield31 Mar (RsM) (Rs) (%) (x) (x) (x) (x) (%) (%)2008A 198,723 92.9 na 4.9 11.1 2.9 6.5 27.7 3.12009A 197,954 92.6 -0.4 4.7 11.2 2.4 6.3 23.4 3.12010E 233,660 109.2 18.0 4.3 9.5 2.1 5.5 23.6 3.52011E 268,529 125.5 14.9 3.2 8.2 1.8 4.9 23.5 4.02012E 257,550 120.4 -4.1 3.0 8.6 1.6 4.8 19.7 3.8
Source: dataCentral, CIRA Estimates
ONGC (ONGC.BO)
Sell/Medium Risk 3MPrice (11 May 10) Rs1,032.95Target Price Rs1,130.00Expected share price return 9.4%Expected dividend yield 3.1%Expected total return 12.5%Market Cap Rs2,209,349M US$48,993M
Price Performance
600
800
1000
1200
Sep 06 Dec 06 Mar 07 Jun 07 Sep 07
INR
Source: dataCentral
Rahul Singh +91-22-6631-9863 [email protected]
Saurabh Handa +91-22-6631-9858 [email protected]
Garima Mishra [email protected]
Company description
ONGC is India's largest E&P company. Through its subsidiary ONGC Videsh, the company has invested in overseas crude equity. It has ventured downstream, picking up a majority stake in Mangalore Refineries, and it intends to set up a petro-products retailing network.

India Investor Conference 2010 18 May 2010
Citigroup Global Markets 85
ONGC (ONGC.BO): Financial Summary
Fiscal year end 31-Mar 2008 2009 2010E 2011E 2012E
Valuation RatiosP/E adjusted (x) 11.1 11.2 9.5 8.2 8.6EV/EBITDA adjusted (x) 5.0 4.9 4.2 3.4 3.2P/BV (x) 2.9 2.4 2.1 1.8 1.6Dividend yield (%) 3.1 3.1 3.5 4.0 3.8Per Share Data (Rs)EPS adjusted 92.91 92.55 109.25 125.55 120.42EPS reported 92.91 92.55 109.25 125.55 120.42BVPS 361.94 428.14 496.10 573.05 646.85DPS 32.00 32.00 36.05 41.43 39.74
Profit & Loss (RsM)Net sales 1,018,349 1,094,129 1,053,537 1,169,133 1,220,700Operating expenses -752,396 -831,428 -740,653 -803,367 -871,384EBIT 265,953 262,701 312,883 365,766 349,316Net interest expense -2,153 -2,385 -2,328 -2,276 -2,230Non-operating/exceptionals 45,431 51,478 49,561 49,640 49,019Pre-tax profit 309,232 311,794 360,117 413,129 396,104Tax -106,999 -110,093 -124,240 -142,530 -136,656Extraord./Min.Int./Pref.div. -3,509 -3,747 -2,217 -2,070 -1,898Reported net income 198,723 197,954 233,660 268,529 257,550Adjusted earnings 198,723 197,954 233,660 268,529 257,550Adjusted EBITDA 404,831 417,005 479,132 546,637 549,711Growth Rates (%)Sales 18.0 7.4 -3.7 11.0 4.4EBIT adjusted 18.6 -1.2 19.1 16.9 -4.5EBITDA adjusted 17.7 3.0 14.9 14.1 0.6EPS adjusted 11.8 -0.4 18.0 14.9 -4.1
Cash Flow (RsM)Operating cash flow 350,302 347,454 451,972 463,488 460,478Depreciation/amortization 138,878 154,304 166,248 180,871 200,396Net working capital 15,289 -4,285 50,446 16,094 4,711Investing cash flow -194,948 -183,064 -215,231 -233,231 -243,231Capital expenditure -174,701 -169,833 -202,000 -220,000 -230,000Acquisitions/disposals -7,015 0 0 0 0Financing cash flow -79,428 -79,072 -92,537 -102,719 -98,438Borrowings -666 -307 -3,554 -203 -183Dividends paid -80,457 -80,461 -90,679 -104,211 -99,950Change in cash 75,926 85,318 144,203 127,538 118,809
Balance Sheet (RsM)Total assets 1,246,846 1,484,867 1,675,510 1,878,825 2,058,944Cash & cash equivalent 270,880 179,621 453,055 571,448 676,698Accounts receivable 70,469 71,814 72,160 80,078 83,610Net fixed assets 280,312 350,178 212,779 212,023 206,391Total liabilities 461,271 555,025 596,573 633,078 653,278Accounts payable 98,444 117,772 100,738 111,064 123,614Total Debt 9,445 8,953 3,255 2,930 2,637Shareholders' funds 785,575 929,842 1,078,937 1,245,747 1,405,666
Profitability/Solvency Ratios (%)EBITDA margin adjusted 39.8 38.1 45.5 46.8 45.0ROE adjusted 27.7 23.4 23.6 23.5 19.7ROIC adjusted 21.1 16.4 18.0 21.2 19.0Net debt to equity -33.3 -18.4 -41.7 -45.6 -48.0Total debt to capital 1.2 1.0 0.3 0.2 0.2
For further data queries on Citi’s full coverage universe please contact CIRA Data Services Asia Pacific ([email protected]) or +852-2501-2791
Investment Strategy
We rate ONGC as Sell/Medium Risk, with a Rs1,130 target price. Despite the new subsidy mechanism of the upstream companies sharing losses on only petrol/diesel, we believe ONGC's leverage to crude beyond US$65/bbl is going to be limited. Besides, growth from new fields is going to come at incrementally higher costs, implying that upside from new fields could be limited.
Valuation
Our target price of Rs1,130 is based on 9x Mar-11E P/E, at the mid-point of ONGC's historical median band of 6-11x. We continue to value ONGC on traditional valuation parameters as against NAV/SOTP approach due to it being a going concern. Given that its existing fields face declining or mature production profiles, it would be incorrect to value the new discoveries (say KG gas) separately in an SOTP since the new fields would anyway be required to compensate for the decline in mature fields. In terms of asset valuation, ONGC's current EV/boe of ~US$5 (on 2P reserves) is unlikely to get further re-rated given: (i) limited benefit from higher crude, (ii) subsidized gas prices, and (iii) higher F&D costs of incremental production going forward.

India Investor Conference 2010 18 May 2010
Citigroup Global Markets 86
Medtech Play
Global Medical Devices business — Opto Circuits is the only Indian firm on the global medical devices space. Over the years it has strengthened its position in the patient monitoring (non-invasive) segment through a series of acquisitions. Its stents business, diversified geographical presence (56 countries worldwide) and established front ends in regulated markets (US/EU) are central to the business.
Non Invasive Segment: Steady Growth — Non-invasive devices account for ~75% of Opto’s overall revenues, growing at a steady pace. Opto’s non-invasive portfolio includes pulse oximeters, patient monitoring systems, digital thermometer and sensors. The company added gas benches to its portfolio through its recent acquisition of Criticare Systems in the US. Its entry into the replacement market and the recent patent expiry of a key sensor, should boost growth rates in this segment over the medium term.
Ramping Up Presence in Invasive Segment — Invasive devices account for ~25% of Opto’s revenues, albeit growing at a faster rate than the non-invasive segment. Opto’s invasive devices portfolio includes stents, catheters and orthopedic prosthetics. Stents accounts for ~90% of its revenues in this segment. Opto markets stents in India, Europe & emerging markets and is in the process of obtaining US FDA approval for its marquee product DIOR (~20% of stent sales).
Things to Watch Out For — 1) US FDA approval for its drug eluting balloon DIOR; 2) New product launches in regulated markets, especially in the invasive segment; 4) Long term contracts, tie-ups in the non-invasive segment; 4) Acquisition related news flow given the company’s inorganic growth strategy
_______________________________________________________________
_______________________________________________________________
_______________________________________________________________
_______________________________________________________________
_______________________________________________________________
_______________________________________________________________
_______________________________________________________________
Opto Circuits (OPTO.BO)
Non-Rated Price (11 May 10) Rs217.20 Market Cap Rs39,726M US$881M
Price Performance
100
150
200
250
300
May 09 Aug 09 Nov 09 Feb 10 May 10
INR
Source: dataCentral
Prashant Nair, CFA +91-22-6631-9855 [email protected] Akshay Rai [email protected]
Company Description
Established in 1992, Opto Circuits is one of India’s largest medical device manufacturers. The company manufactures a wide array of non-invasive devices including pulse oximeters, sensors, fluid warmers and cholesterol monitors. In 2006, the company entered the invasive segment through the acquisition of Germany based, stents manufacturer, Eurocor. The company has historically pursued an inorganic growth path, making as many as seven acquisitions between 2001-09. Recently it acquired US based, Criticare Systems to expand its portfolio of patient monitoring products.

India Investor Conference 2010 18 May 2010
Citigroup Global Markets 87
Opto Circuits (OPTO.BO): Financial Summary
Fiscal year end FY05 FY06 FY07 FY08 FY09
Valuation RatiosP/E adjusted (x) 155.3 79.4 48.2 50.0 18.3P/E reported (x) 155.3 79.4 48.2 50.0 18.3P/BV (x) 54.8 36.5 16.6 10.7 7.0Dividend yield (%) 0.2 0.3 0.9 1.3 1.8Per Share Data (Local Currency)EPS adjusted 1.45 2.83 4.66 4.49 12.25EPS reported 1.45 2.83 4.66 4.49 12.25BVPS 4.10 6.15 13.52 20.90 31.99NAVps ordinary 4.10 6.15 13.52 20.90 31.99DPS 0.46 0.78 1.96 2.94 4.00
Profit & Loss (Local Currency, Millions)Net operating income (NOI) 1,336 1,398 2,516 4,681 8,185G&A expenses -1,099 -977 -1,698 -3,362 -5,714Other Operating items 0 0 0 0 0EBIT including associates 237 421 818 1,319 2,471Non-oper./net int./except. -32 -28 -38 -46 -557Pre-tax profit 204 396 764 1,352 2,168Tax -7 -10 -32 -38 -75Extraord./Min. Int./Pref. Div. 0 0 0 -7 -6Reported net income 198 386 733 1,307 2,087Adjusted earnings 198 386 733 1,307 2,087Adjusted EBIT 237 421 818 1,319 2,471Adjusted EBITDAGrowth Rates (%)NOI N/A 4.6 80.0 86.1 74.9EBIT adjusted 41.4 77.9 94.3 61.3 87.4EPS adjusted 44.8 95.6 64.9 -3.6 172.5
Cash Flow (Local Currency, Millions)Operating cash flow N/A -35 101 320 636Depreciation/amortization N/A 23 24 81 449Net working capital N/A -397 -681 -1,074 -1,918Investing cash flow N/A -244 -330 -525 -4,196Capital expenditure N/A -35 -100 -107 -729Acquisitions/disposals N/A -210 -230 -418 -3,467Financing cash flow N/A 279 512 505 3,787Borrowings N/A #VALUE! -130 367 4,367Dividends paid N/A -144 -366 -320 -755Change in cash N/A -1 283 301 228
Balance Sheet (Local Currency, Millions)Total assets 11,862 21,444 32,537 64,489 78,949Cash & cash equivalent 265 5,624 5,363 3,825 4,211Net fixed assets 2,282 3,543 5,348 6,222 8,266Total liabilities 771 1,498 1,660 2,918 9,091Total Debt 350 775 666 1,012 5,379Shareholders' funds 626 841 2,198 3,425 5,300
Profitability/Solvency RatiosEBIT margin adjusted (%) 17.7 30.1 32.5 28.2 30.2ROE adjusted (%) 39.4 55.2 49.4 44.7 46.5ROA adjusted (%) 15.8 20.7 23.6 24.0 19.1Net debt to equity (%) 128.8 -24.3 3.2 8.6 -4.0Interest coverage (x) 35.0 44.2 25.8 34.3 33.0
Source: Bloomberg
Recent Developments
The company reported its 3QFY10 results in January 2010. Consolidate revenues were at Rs2.6bn in 3QFY10 (vs. Rs2.1bn in 3QFY09) and Rs7.4bn for 9mFY10 (vs. Rs6.1bn in 9mFY09). Reported PAT was at Rs657m and 1.92bn for 3QFY10 and 9mFY10 respectively (vs. Rs526m & Rs1.54bn in corresponding periods of FY09)
In April 2010, Opto acquired Kolkata based N.S.Remedies for a consideration of US$1.5m in an all cash deal. N.S.Remedies owned an advanced facility for stent manufacturing and R&D. The acquisition provides Opto with an ability to manufacture stainless steel and cobalt chromium stents in India. The company also has necessary CE approvals on its stents.

India Investor Conference 2010 18 May 2010
Citigroup Global Markets 88
Well Positioned to Benefit from Cyclical Upturn
Demand on a cyclical upturn — PRIL is well positioned to benefit from the ongoing recovery in urban consumption – which had declined significantly in FY09, and has shown some signs of recovery over the past year. Same store sales (SSS) growth in both value and lifestyle retailing has been steadily rising- now at ~13-14% (7-8% in 1Q). We forecast a healthy 26% revenue CAGR over FY09-11E. Overall retail footprint at ~11m sq ft is expected to increase by 2-2.5m sq ft per annum over the next 2-3 years, as per management.
Margin expansion is a key focus going ahead — Pantaloon's EBITDA margin should continue to expand as management's strategy of outsourcing non-core operations to subsidiaries continues, resulting in lower employee costs, and improving operating leverage. However, gross margin decline sequentially needs to be explored, esp. as GMs will drive profitability going forward.
Restructuring update — Value formats (Big Bazaar & Food Bazaar) have been moved to a 100% subsidiary, Future Value Retail. Management indicated that the financial services business (Future Capital & Future Generali) divestment may take another few months. We think that the broad restructuring intention is a positive as businesses that are non core or in investment mode wouldn't strain PRIL's balance sheet and opens a possibility for value unlocking in future.
Home Solutions merger — PRIL board recently approved the merger of Home Solutions (HS) with itself. Transaction implies a valuation of Rs14.9bn, which prima facie is expensive. HS's FY09 sales, EBITDA, PAT were Rs10.7bn (incl. Rs4bn inter company sales), -Rs364m & -Rs57m respectively. Mgmt indicated that HS is now EBITDA positive and will break even at PAT level in FY11E.
Balance sheet concerns have peaked — Mgmt expects a reduction in the inventory levels from current ~Rs1900/sq ft to Rs1600/sq ft over the medium term, resulting from the recent supply chain initiatives. Recent funding and restructuring lowers the debt-equity ratio (currently ~1.2x). Mgmt may need to infuse another ~Rs10bn to fund expansion over next 3 years.
Statistical Abstract
Year to Net Profit Diluted EPS EPS growth EV/EBITDA P/E P/B P/CEPS ROE Yield30 Jun (RsM) (Rs) (%) (x) (x) (x) (x) (%) (%)2008A 1,260 7.9 na 18.9 50.3 3.4 30.3 na 0.22009A 1,406 7.4 -6.6 14.4 53.9 3.3 27.0 6.8 0.22010E 2,308 11.2 51.6 11.6 35.5 2.8 20.1 8.9 0.22011E 3,348 16.2 45.1 9.2 24.5 2.5 14.4 10.9 0.32012E 3,902 18.9 16.5 8.2 21.0 2.3 11.8 11.5 0.4
Source: Company Reports and CIRA Estimates
Pantaloon Retail (PART.BO)
Buy/Medium Risk 1MPrice (11 May 10) Rs398.05Target Price Rs456.00Expected share price return 14.6%Expected dividend yield 0.2%Expected total return 14.8%Market Cap Rs80,175M US$1,778M
Price Performance
200
250
300
350
400
450
May 09 Aug 09 Nov 09 Feb 10 May 10
INR
Source: dataCentral
Jamshed Dadabhoy +91-22-6631-9883 [email protected] Aditya Mathur +91-22-6631-9841 [email protected]
Company description
Pantaloon is the largest organized modern-format retailer in India, with a presence in apparel, general merchandise, home products and food retailing. It has retail space of about 12m sq. ft. with plans to double space by FY14/15. Pantaloon retails fashion apparel and accessories through its Pantaloon stores, and general merchandise and food through discount department stores Big Bazaar and Food Bazaar. It has a presence in retail property management services through Central Malls, managing retail space for concessionary fees and a share of sales. It has recently launched Home Town for home interiors, which it plans to expand aggressively. Pantaloon also has interests in media, logistics, brand management and e-tailing, through subsidiaries.

India Investor Conference 2010 18 May 2010
Citigroup Global Markets 89
Pantaloon Retail (PART.BO): Financial Summary
Fiscal year end 30-Jun 2008 2009 2010E 2011E 2012E
Valuation RatiosP/E adjusted (x) 50.3 53.9 35.5 24.5 21.0EV/EBITDA adjusted (x) 20.0 14.5 11.4 9.3 8.2P/BV (x) 3.4 3.3 2.8 2.5 2.3Dividend yield (%) 0.2 0.2 0.2 0.3 0.4Per Share Data (Rs)EPS adjusted 7.91 7.39 11.20 16.24 18.93EPS reported 7.91 7.39 11.20 16.24 18.93BVPS 115.92 119.41 141.52 156.14 173.19DPS 0.67 0.61 0.95 1.38 1.61
Profit & Loss (RsM)Net sales 50,489 63,417 80,429 100,519 120,405Operating expenses -46,718 -58,133 -73,315 -91,038 -108,848EBIT 3,771 5,284 7,115 9,481 11,557Net interest expense -1,853 -3,182 -3,765 -4,647 -5,930Non-operating/exceptionals 38 61 121 201 241Pre-tax profit 1,956 2,162 3,471 5,034 5,867Tax -697 -757 -1,163 -1,687 -1,965Extraord./Min.Int./Pref.div. 0 0 0 0 0Reported net income 1,260 1,406 2,308 3,348 3,902Adjusted earnings 1,260 1,406 2,308 3,348 3,902Adjusted EBITDA 4,605 6,684 8,887 11,813 14,621Growth Rates (%)Sales 56.0 25.6 26.8 25.0 19.8EBIT adjusted 111.0 40.1 34.6 33.3 21.9EBITDA adjusted 113.6 45.1 33.0 32.9 23.8EPS adjusted -3.3 -6.6 51.6 45.1 16.5
Cash Flow (RsM)Operating cash flow -4,216 -628 -1,042 2,864 4,800Depreciation/amortization 834 1,401 1,773 2,332 3,065Net working capital -6,429 -3,917 -5,122 -2,816 -2,167Investing cash flow -11,410 -8,927 -9,124 -12,825 -15,864Capital expenditure -8,065 -5,252 -9,124 -12,825 -15,864Acquisitions/disposals -3,345 -3,675 0 0 0Financing cash flow 15,207 9,438 9,872 9,961 11,064Borrowings 8,922 6,586 5,734 10,294 11,452Dividends paid -125 -135 -230 -333 -388Change in cash -419 -118 -293 0 0
Balance Sheet (RsM)Total assets 47,439 61,508 75,074 90,077 106,642Cash & cash equivalent 1,211 1,093 800 800 800Accounts receivable 1,132 1,773 1,983 2,479 2,969Net fixed assets 15,288 19,140 26,491 36,984 49,783Total liabilities 28,973 38,783 45,904 57,892 70,944Accounts payable 3,104 3,854 4,900 6,076 7,245Total Debt 21,918 28,504 34,238 44,532 55,984Shareholders' funds 18,466 22,724 29,170 32,185 35,698
Profitability/Solvency Ratios (%)EBITDA margin adjusted 9.1 10.5 11.0 11.8 12.1ROE adjusted 8.6 6.8 8.9 10.9 11.5ROIC adjusted 11.3 11.9 12.3 12.7 12.7Net debt to equity 112.1 120.6 114.6 135.9 154.6Total debt to capital 54.3 55.6 54.0 58.0 61.1
For further data queries on Citi’s full coverage universe please contact CIR Data Services Asia Pacific ([email protected]) or +852-2501-2791
Investment Strategy
We rate Pantaloon Retail (India) Buy/Medium Risk (1M). The sequential improvements in same-store sales trends in both value and lifestyle retailing have been encouraging and are signs of improving discretionary consumption. Concerns relating to paucity of capital have abated as fresh infusion of capital will lower high gearing ratios and aid PRIL's expansion plans. Operationally, PRIL will benefit from management's strategy of outsourcing non-core operations, lower employee costs and lower rentals rates. Improving operating leverage and cost efficiencies should lead to healthy margin expansion of ~120bps and strong net profit growth of ~48% over FY09-11E, on our estimates.
Valuation
Our Rs456 target price is based on a sum of the parts approach. We value Pantaloon at 25x June11E PE, which gives us Rs395/share. Our target multiple is set at around a c30% premium to the average for the regional peer group, to reflect the higher earnings growth profile for Pantaloon and its dominant positioning in India. Home Solutions is valued at Rs16/share (based on 1x June EV/sales), and Future Capital is valued at Rs25/share (current market price, with 20% holding company discount). We add Rs19/share for Future Logistics, at the valuation of the recent transaction by Li & Fung.

India Investor Conference 2010 18 May 2010
Citigroup Global Markets 90
A Quality Retail and Hotel-Asset Play
Good momentum at High Street Phoenix (HSP) — The opening of luxury mall, Palladium, has been received well, and 95% of it is leased. 4QFY10 captures the mall operational at 70% (vs. 45-50% when it went live in October 2009), but the full impact in rentals should reflect in 1QFY11. Many new stores at Palladium are kicking the revenue sharing bit (vs. the standard minimum guarantee rentals), e.g. FCUK, DIESEL, and more are likely to be added to this list.
HSP Ph IV and renewals coming up — While applications have been made seeking additional FSI, currently Ph-IV plans include 0.25msf of commercial and retail area. If approval comes through, incremental construction would come above the planned structure to use additional FSI. Renewals for 0.2msf are due in the next 1.5 yrs, with 75% anchor tenants where rentals expected to rise to ~Rs130/sf vs. the current Rs70/sf.
Progress on Market Cities — Largely on track (but for Kurla where 35% leased at Rs95/sf avg), with anchors in place for all. Handover of space to retailers for fit-outs to happen by June 2010 in Kurla and Pune. Leasing is encouraging in Pune (64% at Rs60/sf avg), Bangalore (32% at Rs60/sf avg) & Chennai. Also, Kurla’s office block (0.9msf) was launched to the investor community and discussions are underway.
Update on other SPVs — 1) Shangri-La soft launch expected in January 2011, will commence operations with 200 of 414 rooms. Balance of rooms to be thrown open in a phased manner in 5-6 months of launch; 2) EWDPL’s Treasure Bazaar at Nanded (0.25msf) opened in January 2010; and 3) BARE’s first mall Phoenix United, Lucknow (0.36msf) to get operational in May 2010.
Maintain Buy — We believe High Street Phoenix earnings momentum will continue to drive near-term investor interest in Phoenix Mills. With retail footfalls picking up, we expect a good response to upcoming malls starting 2HFY11. Stock triggers include: 1) Faster revival in retail sales growth; and 2) Potential FSI increase in Phase-IV. Moreover, valuations look attractive at ~35% discount to NAV of Rs324.
Statistical Abstract
Year to Net Profit Diluted EPS EPS growth P/E P/B ROE Yield31 Mar (RsM) (Rs) (%) (x) (x) (%) (%)2008A 428 3.2 na 66.7 2.2 na 0.52009A 766 5.3 67.8 39.7 2.0 5.5 0.52010E 838 5.8 9.4 36.3 1.9 5.4 0.02011E 1,286 8.9 53.4 23.7 1.8 7.7 0.52012E 1,896 13.1 47.5 16.1 1.6 10.4 0.6
Source: Company Reports and CIRA Estimates
Phoenix Mills Limited (PHOE.BO)
Buy/Medium Risk 1MPrice (11 May 10) Rs210.20Target Price Rs265.00Expected share price return 26.1%Expected dividend yield 0.0%Expected total return 26.1%Market Cap Rs30,447M US$675M
Price Performance
50
100
150
200
250
May 09 Aug 09 Nov 09 Feb 10 May 10
INR
Source: dataCentral
Ashish Jagnani +91-22-6631-9861 [email protected]
Vidhi Sodhani +91-22-6631-9854 [email protected]
Company description
Phoenix Mills is a leading Indian developer of large-format retail-led mixed use developments. The company is controlled/managed by Ruia Group (owns a 66% stake).
High Street Phoenix (HSP), the first consumption centre developed by the Group, has become a destination in Mumbai (still under expansion), covering >3.0 msf of space housing retail, entertainment, commercial and resi complexes with car parking.
Over the years, PML has spread its wings across Tier I, II, III cities in India, by entering into JVs with established regional players and bringing in strategic investors to support the growth of its asset-heavy model. Currently, it plans to develop ~29msf, having an economic interest of ~10.9msf, with a focus on retail malls and hotels.

India Investor Conference 2010 18 May 2010
Citigroup Global Markets 91
Phoenix Mills (PHOE.BO): Financial Summary
Fiscal year end 31-Mar 2008 2009 2010E 2011E 2012E
Valuation RatiosP/E adjusted (x) 66.7 39.7 36.3 23.7 16.1P/E reported (x) 66.7 39.7 36.3 23.7 16.1P/BV (x) 2.2 2.0 1.9 1.8 1.6Dividend yield (%) 0.5 0.5 0.0 0.5 0.6Per Share Data (Rs)EPS adjusted 3.15 5.29 5.79 8.88 13.09EPS reported 3.15 5.29 5.79 8.88 13.09BVPS 94.68 104.58 110.36 119.24 132.33NAVps ordinary na na na na naDPS 1.00 1.00 0.00 1.00 1.25
Profit & Loss (RsM)Net operating income (NOI) 501 602 993 1,701 1,850G&A expenses 0 0 0 0 0Other Operating items -76 -93 -117 -201 259EBIT including associates 425 508 877 1,500 2,109Non-oper./net int./except. 196 448 212 213 253Pre-tax profit 620 957 1,089 1,713 2,362Tax -192 -190 -250 -427 -464Extraord./Min. Int./Pref. Div. 0 -1 -1 -1 -1Reported net income 428 766 838 1,286 1,896Adjusted earnings 428 766 838 1,286 1,896Adjusted EBIT 425 508 877 1,500 1,632Adjusted EBITDA 501 602 993 1,701 1,850Growth Rates (%)NOI -30.1 20.2 65.0 71.2 8.8EBIT adjusted -34.0 19.7 72.4 71.1 8.8EPS adjusted -90.4 67.8 9.4 53.4 47.5
Cash Flow (RsM)Operating cash flow 233 514 1,929 1,213 2,452Depreciation/amortization 76 93 117 200 218Net working capital -109 71 443 -919 -667Investing cash flow -13,846 -2,027 -2,649 -3,302 -2,193Capital expenditure -12,890 -2,561 -2,251 -2,476 -1,650Acquisitions/disposals 0 0 0 0 0Financing cash flow 13,561 3,402 613 2,146 -865Borrowings -1,460 3,386 613 2,290 -684Dividends paid -94 -167 0 -145 -181Change in cash -52 1,888 -108 57 -606
Balance Sheet (RsM)Total assets 18,968 24,300 26,525 31,046 32,615Cash & cash equivalent 22 1,910 1,802 1,857 1,250Net fixed assets 8,326 13,423 15,558 17,833 19,265Total liabilities 5,311 7,034 7,890 10,625 9,475Total Debt 3,048 5,452 6,064 8,354 7,671Shareholders' funds 13,658 17,266 18,635 20,421 23,139
Profitability/Solvency RatiosEBIT margin adjusted (%) 51.7 51.0 67.7 71.1 71.1ROE adjusted (%) 6.2 5.5 5.4 7.7 10.4ROA adjusted (%) 3.6 3.5 3.3 4.5 6.0Net debt to equity (%) 22.2 20.5 22.9 31.8 27.7Interest coverage (x) 11.3 11.0 13.6 17.0 20.1
For further data queries on Citi’s full coverage universe please contact CIRA Data Services Asia Pacific
([email protected]) or +852-2501-2791
Investment Strategy
We rate Phoenix Mills as Buy/Medium Risk (1M), with a target price of Rs265. It differentiates itself by: 1) Its prime-location assets across key cities; 2) Unique asset-holding associate/subsidiary ownership model; 3) Steady cash flows; 4) Near-term execution visibility; and 5) A de-leveraged balance sheet. It has plans to develop ~29msf, having an economic interest of ~10.9msf. Taking HSP as a benchmark, Phoenix is looking to create similar value through its ‘Market City' projects, positioned as consumption centres. Most will be in operation over the next 1-2 years and risks are shared with other partners, and we see this as a big opportunity. Additionally, likely NAV upside from increased FSI in HSP Phase IV and the revenue-sharing model are potential stock re-rating catalysts.
Valuation
Our target price of Rs265 is at an 18% discount to our March 2010E NAV of Rs324. This is based on a combination of rental yield for HSP and NAV-method for under-development assets. Assumptions: 1) Rs164/sh for HSP using a rental yield model with 10% cap-rate, 4% terminal growth; and Phase IV land (0.25msf) valued at Rs8000/sf; 2) 3.8 msf economic interest in Market City projects (ex-hotels); 3) 5.1 msf economic interest in EWPDL & BARE project; and 4) Rs15-20mn capital cost per room for ~1,000 rooms following its 75% stake in the hospitality venture. This apart, we have factored: a) Total consolidated debt of Rs8.55bn adjusted for Rs2.2bn of cash; b) Cost of capital of 13%; and c) A tax rate of 25%.

India Investor Conference 2010 18 May 2010
Citigroup Global Markets 92
Franchise, Positioning and Momentum
Second largest government bank; premium positioning — Punjab National Bank (PNB) is India’s second largest government bank, with a premium position and predominance in India’s northern geographic belt. This is also amongst the most lucrative and faster growing banking pockets.
Strong deposit franchise, superior return profile — PNB has a large and well diversified deposit franchise, with a strong low cost deposit base in the northern part of the country. This drives its funding cost advantage and supports higher margins. This, along with its strong technology platform and fee growth, powers its superior returns (18%-22% ROEs).
Strong growth momentum with relatively cleaner balance sheet — PNB has retained its strong growth and earnings momentum, and has also been able to maintain healthy asset quality. In particular, PNB has maintained: a) Well above industry NIMs (could come down, but should remain high); b) Robust fee income growth; and c) Aggressive provisioning, improving coverage levels to about 80%, amongst the highest relative to peers.
Asset quality holding up well, despite challenges — PNB's loan book has relatively higher concentration in real estate, SME and agriculture, which would suggest a higher risk profile, but it has managed these risks well so far. Its NPLs remain below 2%, with high coverage levels. However, its relatively high restructured assets (6.5% of loans and rising recently) suggest some caution in the near term.
Key risks — Higher-than-expected deterioration in asset quality, sharp drop in NIMs, and deterioration in deposit mix, could lead to near-term dislocation in momentum.
Statistical Abstract
Year to Net Profit EPS EPS Growth PE PB ROAE ROAA Div yieldMar 31 (RsM) (Rs) (%) (x) (x) (%) (%) (%)FY08 20,488 65 33.0 15.7 2.6 18 1.1 1.3FY09 30,909 98 50.9 10.4 2.2 23 1.4 2.0FY10E 38,720 123 25.3 8.3 1.8 24 1.5 2.0FY11E 43,084 137 11.3 7.4 1.5 22 1.4 2.1FY12E 51,235 162 18.9 6.3 1.3 22 1.4 2.2
Source: Company Data, Citi Investment Research and Analysis Estimates
Punjab National Bank (PNBK.BO)
Sell/Medium Risk 3MPrice (11 May 10) Rs1,017.05Target Price Rs950.00Expected share price return -6.6%Expected dividend yield 2.0%Expected total return -4.6%Market Cap Rs320,678M US$7,111M
Price Performance
500
700
900
1100
May 09 Aug 09 Nov 09 Feb 10 May 10
INR
Source: dataCentral
Manish Chowdhary, CFA +91-22-6631-9853 [email protected] Aditya Narain, CFA +91-22-6631-9879 [email protected] Pooja Kapur [email protected]
Company description
Punjab National Bank (PNB) was established in 1943 and nationalized in the first round of nationalization in 1969. The bank is headquartered in Delhi, and the government has a 57.8% stake. PNB is among the top five banks in the country, with a 5% share of deposits and advances of the banking system. PNB has the second-largest branch network in the country with 4,894 branches.

India Investor Conference 2010 18 May 2010
Citigroup Global Markets 93
Punjab National Bank (PNBK.BO): Financial Summary
2008 2009 2010E 2011E 2012E
Valuation RatiosP/E adjusted (x) 15.7 10.4 8.3 7.4 6.3P/E reported (x) 15.7 10.4 8.3 7.4 6.3P/BV (x) 2.6 2.2 1.8 1.5 1.3P/Adjusted BV diluted (x) 3.0 2.4 2.0 1.6 1.3Dividend yield (%) 1.3 2.0 2.0 2.1 2.2Per Share Data (Rs)EPS adjusted 64.98 98.03 122.80 136.64 162.49EPS reported 64.98 98.03 122.80 136.64 162.49BVPS 390.68 464.75 564.25 676.43 813.29Tangible BVPS 390.68 464.75 564.25 676.43 813.29Adjusted BVPS diluted 341.98 416.74 516.24 628.42 765.28DPS 13.00 20.00 20.00 21.00 22.00
Profit & Loss (RsM)Net interest income 55,342 70,309 86,598 100,690 117,783Fees and commissions 11,062 13,766 15,418 17,269 19,341Other operating Income 8,913 15,430 16,277 14,137 15,521Total operating income 75,317 99,505 118,294 132,095 152,645Total operating expenses -35,255 -42,062 -49,794 -55,249 -61,303Oper. profit bef. provisions 40,062 57,443 68,500 76,845 91,342Bad debt provisions -4,156 -8,853 -9,208 -11,041 -13,372Non-operating/exceptionals -2,947 -922 -1,500 -1,500 -1,500Pre-tax profit 32,959 47,669 57,791 64,305 76,470Tax -12,472 -16,760 -19,071 -21,221 -25,235Extraord./Min. Int./Pref. Div. 0 0 0 0 0Attributable profit 20,488 30,909 38,720 43,084 51,235Adjusted earnings 20,488 30,909 38,720 43,084 51,235Growth Rates (%)EPS adjusted 33.0 50.9 25.3 11.3 18.9Oper. profit bef. prov. 13.4 43.4 19.2 12.2 18.9
Balance Sheet (RsM)Total assets 1,990,204 2,469,186 2,844,005 3,308,129 3,893,789Avg interest earning assets 1,774,641 2,185,174 2,606,284 3,020,958 3,541,189Customer loans 1,226,422 1,578,464 1,828,718 2,162,869 2,571,690Gross NPLs 33,193 27,675 35,659 37,129 41,497Liab. & shar. funds 1,990,204 2,469,186 2,844,005 3,308,129 3,893,789Total customer deposits 1,664,572 2,097,605 2,429,760 2,846,054 3,374,844Reserve for loan losses 31,407 31,434 33,724 35,850 39,940Shareholders' equity 123,183 146,536 177,910 213,280 256,434
Profitability/Solvency Ratios (%)ROE adjusted 18.0 22.9 23.9 22.0 21.8Net interest margin 3.1 3.2 3.3 3.3 3.3Cost/income ratio 46.8 42.3 42.1 41.8 40.2Cash cost/average assets 2.0 1.9 1.9 1.8 1.7NPLs/customer loans 2.7 1.8 1.9 1.7 1.6Reserve for loan losses/NPLs 94.6 113.6 94.6 96.6 96.2Bad debt prov./avg. cust. loans 0.4 0.6 0.5 0.6 0.6Loans/deposit ratio 73.7 75.3 75.3 76.0 76.2Tier 1 capital ratio 8.5 9.0 9.6 9.9 10.2Total capital ratio 13.0 14.0 15.0 14.9 14.7
For further data queries on Citi’s full coverage universe please contact CIRA Data Services Asia Pacific ([email protected]) or +852-2501-2791
Investment Strategy
We rate PNB shares as Sell/Medium Risk (3M). It is one of India's largest government-owned banks, with good profitability (ROEs of 18%-20%) and relatively high net interest margins. We believe: a) PNB has been able to maintain its growth along with its higher-than-industry NIMs, and while we expect NIMs to drift downwards, they are likely to remain significantly above industry; b) PNB has shown significant growth in fee income, led by its strong technology platform and greater management focus; and c) PNB's asset quality has held up reasonably well despite its greater mid-market and agricultural focus. However, we expect the positives are likely to be offset by: a) Its aggressive loan growth stance especially in the mid-market segments which increases its leverage to the broader economy; b) Higher sensitivity to a rising interest rate environment as yields on investment book have reduced sharply − which could hurt NIMs if funding costs rise; and c) Historically peak valuation multiples.
Valuation
Our target price for PNB of Rs950 is based on CIRA's EVA model, which captures the long-term value of the business, and is a standard valuation measure for the CIRA India Banking coverage. Our target price assumes: a) Risk-free rate of 8.0% in line with our assumptions for other banks; b) Longer term loan loss provisions of 100bps in-line with sector averages, c) Loan spreads of 200bps, in-line with industry levels, and d) Long-term fee income growth of 9%. We also benchmark our valuation multiples at 1.5x 1Yr Fwd P/BV (Rs994) –at par with SBI due to its strong deposit franchise which acts as a cushion against a rising interest rate environment. We use EVA as our preferred valuation methodology as we believe it better captures the long-term value of the business.

India Investor Conference 2010 18 May 2010
Citigroup Global Markets 94
Foray Into Affordable Housing – An Inherent Trigger?
Snippets from FY10 results — Consolidated net profit came in at Rs1.45bn (flat vs. FY09), while revenues closed at Rs4.8bn (up 8% YoY). While EBITDA margins improved ~500 bps to 35%, net margin dropped by 200bps on the back of increased finance charge. The Board has recommended a dividend of 20% (Rs1.00/share).
Operational pick up seems to be coming through — On sales volume in FY10, the company did not give any specific number, but said that its projects launched are 63% sold. Construction-wise, these projects are 75% complete (vs. 68% in Q3FY10). For Provident Housing it is 70% sold and 18% completed.
Foraying into entry level housing — The company has tied up with Homex to build entry level low cost housing (Rs0.5-0.8m to Rs1.2-1.5m). Homex is said to be the technology leader in this segment, with cost effective and technology driven methodology in place enabling fast execution, along with ~35-40% margins. The JV is looking to build 10,000 homes in the first project in Chennai, of which 3,000 will be launched in Ph-1. While finer details of the JV terms are unavailable, it is known that this MoU with Homex is not exclusive.
Leverage level at 0.54 — Total debt stood at Rs8.0bn as at the close of FY10, of which Rs3.1bn needs to be repaid/refinanced in FY11. Management mentioned that while it is looking at funding a portion of the same from its internal accrual, most of it would be refinanced. Net-net at the end of FY11, debt should remain around the same levels (Rs7.5-8.0bn).
Plans for FY11— In the premium Purva brand, the company is looking to launch 12msf of resi, of which 6msf is still in the planning stage. In the affordable segment (i.e. Provident Housing), it is bringing to market another 6msf. Lastly, the two projects in the pipeline in its Homex JV- Chennai launch will be ~2msf, which will be followed by Bangalore. In FY11, ~1.75msf is being targeted to be delivered by Puravankara.
A pure play on IT recovery — The Bangalore residential market constitutes 66% of its landbank. While we can see the IT sector getting back in growth mode, recovery in the base market is trickling in, albeit slowly. We see likely risks in the form of: 1) Diversification into infra/construction could dilute focus/resources from core business; 2) Pressure on earnings due to affordable sub; and 3) Slower than expected ramp-up on execution.
Statistical Abstract
Year to Net Profit Diluted EPS EPS growth P/E P/B ROE Yield31 Mar (RsM) (Rs) (%) (x) (x) (%) (%)2007A 1,291 6.7 na 15.4 9.0 na 0.72008A 2,400 11.2 67.2 9.2 1.8 33.5 1.92009E 1,670 7.8 -30.4 13.2 1.6 13.0 1.02010E 1,147 5.4 -31.3 19.2 1.5 8.2 1.02011E 1,353 6.3 18.0 16.3 1.4 9.0 1.0
Source: Company Reports and CIRA Estimates
Puravankara Projects (PPRO.BO)
Sell/High Risk 3HPrice (11 May 10) Rs103.40Target Price Rs38.00Expected share price return -63.2%Expected dividend yield 1.0%Expected total return -62.2%Market Cap Rs22,068M US$489M
Price Performance
50
100
150
May 09 Aug 09 Nov 09 Feb 10 May 10
INR
Source: dataCentral
Ashish Jagnani +91-22-6631-9861 [email protected]
Vidhi Sodhani +91-22-6631-9854 [email protected]
Company description
Puravankara Projects is a leading developer in Bangalore. Its founder, Mr. Ravi Puravankara, has over three decades of experience in the construction and development business. Puravankara was incorporated in 1986. It has selfconstructed most of its properties developed in Bangalore. Though Puravankara remains focused on Bangalore, it is also expanding to other regions in South India. These expansions are spread over locations such as Chennai, Coimbatore, Mysore, Cochin and Hyderabad, and to Colombo in Sri Lanka.

India Investor Conference 2010 18 May 2010
Citigroup Global Markets 95
Puravankara Projects (PPRO.BO): Financial Summary
Fiscal year end 31-Mar 2007 2008 2009E 2010E 2011E
Valuation RatiosP/E adjusted (x) 15.4 9.2 13.2 19.2 16.3P/E reported (x) 15.4 9.2 13.2 19.2 16.3P/BV (x) 9.0 1.8 1.6 1.5 1.4Dividend yield (%) 0.7 1.9 1.0 1.0 1.0Per Share Data (Rs)EPS adjusted 6.72 11.24 7.82 5.37 6.34EPS reported 6.72 11.24 7.82 5.37 6.34BVPS 11.55 56.80 63.63 68.00 73.34NAVps ordinary na na na na naDPS 0.71 2.00 1.00 1.00 1.00
Profit & Loss (RsM)Net operating income (NOI) 1,558 2,349 1,874 1,543 1,880G&A expenses -198 -216 -191 -171 -216Other Operating items 115 236 21 -65 -68EBIT including associates 1,476 2,369 1,704 1,308 1,596Non-oper./net int./except. -12 98 -5 -4 -4Pre-tax profit 1,463 2,467 1,700 1,304 1,592Tax -172 -67 -29 -156 -239Extraord./Min. Int./Pref. Div. 0 0 0 0 0Reported net income 1,291 2,400 1,670 1,147 1,353Adjusted earnings 1,291 2,400 1,670 1,147 1,353Adjusted EBIT 1,336 2,075 1,625 1,308 1,596Adjusted EBITDA 1,361 2,133 1,683 1,373 1,664Growth Rates (%)NOI 57.1 50.7 -20.2 -17.6 21.8EBIT adjusted 49.9 55.3 -21.7 -19.5 22.0EPS adjusted 75.6 67.2 -30.4 -31.3 18.0
Cash Flow (RsM)Operating cash flow -5,584 -6,691 -1,352 -345 69Depreciation/amortization 25 59 59 65 68Net working capital -5,968 -9,072 -3,090 -1,557 -1,353Investing cash flow -379 -677 -298 -125 -230Capital expenditure -239 -161 -85 -70 -115Acquisitions/disposals 0 0 0 0 0Financing cash flow 5,892 7,344 1,613 437 237Borrowings 5,139 -237 1,826 650 450Dividends paid -137 -427 -213 -213 -213Change in cash -71 -24 -38 -33 75
Balance Sheet (RsM)Total assets 14,073 23,394 27,996 30,409 33,732Cash & cash equivalent 374 350 312 279 354Net fixed assets 389 497 523 528 575Total liabilities 11,856 11,267 14,412 15,892 18,074Total Debt 6,761 6,524 8,350 9,000 9,450Shareholders' funds 2,218 12,127 13,584 14,517 15,657
Profitability/Solvency RatiosEBIT margin adjusted (%) 32.0 36.7 33.8 31.4 30.7ROE adjusted (%) 77.5 33.5 13.0 8.2 9.0ROA adjusted (%) 12.0 12.8 6.5 3.9 4.2Net debt to equity (%) 288.0 50.9 59.2 60.1 58.1Interest coverage (x) 110.9 na 357.0 323.5 435.7
For further data queries on Citi’s full coverage universe please contact CIRA Data Services Asia Pacific
([email protected]) or +852-2501-2791
Investment Strategy
We rate Puravankara as Sell/High Risk (3H), with a target price of Rs38. Puravankara's residential-heavy model has a quality land-bank of ~114m sq ft. Its clear development titles, with landbank almost entirely paid for, and in-house construction capabilities differentiate it from other developers. Puravankara's focus on South India, in the larger markets of Bangalore and Chennai, is in our view an advantage over developers with a National Capital Region (NCR) bias. However, macro conditions are deteriorating and we expect a slowdown in Puravankara's presales volumes given its residential-heavy model, with a bias toward Bangalore (66% of landbank). We see downside risks for the stock, hence our Sell rating.
Valuation
Our target price of Rs38 is based on a 50% discount to our NAV of Rs76. We ascribe the discount to capture: 1) Puravankara's concentration risk in Bangalore; 2) The company's residential-heavy business model, exposing its business to demand/pricing risks; 3) Possible execution delays; and 4) Lower investor preference for tier-two players with low stock liquidity.
Our NAV estimate of Rs76 is based on the following assumptions: 1) 18-24 months delay in project execution; 2) Development volume of ~108m sq ft (as ~6m sq ft is already/to be recognized as revenue till FY09); 3) An average cost of capital of 18% given tight credit/volatile capital markets; and 4) A tax rate of 26%.

India Investor Conference 2010 18 May 2010
Citigroup Global Markets 96
Turning a Corner
Turning a Corner — We expect Ranbaxy’s global presence, wide product basket and an impressive pipeline of patent challenges / settlements with innovator companies to hold it in good stead in the long term. Key valuation overhangs have been addressed, in our view, with the improvement in core biz and Ranbaxy’s ability to monetize its FTF opportunities despite the FDA issues. The impact of FDA action on its facilities is also well understood and built into estimates. While it is difficult to estimate a timeline for resolution, we do not expect things to worsen from here.
Steady Progress on FDA issues — Ranbaxy has met the FDA to resolve the warning letter at Gloversville and is in process of submitting a corrective action plan for the same. The corrective action plan has been implemented at Dewas and the plant is awaiting a re-inspection. At Paonta, implementation of the corrective plan is underway. At this point, we believe that the risk is more on delay of resolution rather than escalation of issues.
FTF Pipeline: Half Full or Half Empty? — We believe Ranbaxy’s inability to get approval for Flomax, but still secure a share of upside from the alternate generic launch, highlights two things: a) It is not a given that Ranbaxy will be able to get FDA approval for every FTF filing on time, despite the success on Valtrex & Imitrex; b) There are options beyond a launch that Ranbaxy can explore to monetize the FTFs. While the former is disappointing, we believe the latter is as a positive.
Key Issues / Things to Watch Out For — 1) Resolution of the import alert at Dewas & the warning letter at Gloversville. The clearance of AIP at Paonta could take longer; 2) Ranbaxy's ability to monetize its FTF pipeline; and 3) Moves to exploit synergies with Daiichi.
Statistical Abstract
Year to Net Profit Diluted EPS EPS growth EV/EBITDA P/E P/B P/CEPS ROE Yield31 Mar (RsM) (Rs) (%) (x) (x) (x) (x) (%) (%)2007A 4,745 11.9 na 25.1 38.7 6.6 18.5 na 1.92008A 5,878 14.0 17.9 46.0 32.8 4.5 -27.6 -26.6 0.02009E 910 2.2 -84.5 18.7 nm 3.9 17.8 17.7 0.02010E 4,025 9.6 342.3 8.5 48.0 2.9 8.3 35.3 1.92011E 9,772 23.2 142.8 3.8 19.8 1.8 4.0 51.7 1.9
Source: datacentral, Citi Investment Research and Analysis estimates
Ranbaxy (RANB.BO)
Buy/Medium Risk 1M Price (11 May 10) Rs458.25 Target Price Rs620.00 Expected share price return 35.3% Expected dividend yield 0.0% Expected total return 35.3% Market Cap Rs192,771M US$4,275M
Price Performance
0100200300400500600
May 09 Aug 09 Nov 09 Feb 10 May 10
INR
Source: dataCentral
Prashant Nair, CFA +91-22-6631-9855 [email protected] Akshay Rai [email protected]
Company description
Ranbaxy is a leading Indian pharmaceutical company with a strong export business complementing its domestic business. It has a vision of becoming a leading generics pharmaceutical company in the global market and, in the long term, a research-led pharmaceutical company. The company already has a presence in several countries, and has developed a complex business model, perhaps the first of its kind in a developing country. It was recently acquired by Daiichi Sankyo, which now holds a c64% stake in the company.

India Investor Conference 2010 18 May 2010
Citigroup Global Markets 97
Ranbaxy (RANB.BO): Financial Summary
Fiscal year end 31-Dec 2007 2008 2009E 2010E 2011E
Valuation RatiosP/E adjusted (x) 38.7 32.8 nm 47.9 19.7EV/EBITDA adjusted (x) 22.7 26.0 43.0 24.0 13.3P/BV (x) 6.5 4.5 3.8 2.9 1.8Dividend yield (%) 1.9 0.0 0.0 1.9 1.9Per Share Data (Rs)EPS adjusted 11.86 13.98 2.17 9.58 23.25EPS reported 19.35 -22.44 19.57 48.94 107.42BVPS 70.05 102.20 119.18 157.96 257.35DPS 8.50 0.00 0.00 8.50 8.50
Profit & Loss (RsM)Net sales 69,822 70,852 80,017 103,968 144,112Operating expenses -62,859 -68,303 -71,309 -80,714 -90,028EBIT 6,964 2,549 8,708 23,254 54,084Net interest expense -1,412 -2,055 -693 -786 -418Non-operating/exceptionals 4,434 -15,494 3,165 3,080 2,490Pre-tax profit 9,985 -15,000 11,179 25,547 56,156Tax -2,118 5,651 -2,870 -4,970 -10,996Extraord./Min.Int./Pref.div. -124 -84 -84 -4 -4Reported net income 7,744 -9,434 8,225 20,573 45,156Adjusted earnings 4,745 5,878 910 4,025 9,772Adjusted EBITDA 10,086 8,363 4,800 8,263 12,740Growth Rates (%)Sales 13.9 1.5 12.9 29.9 38.6EBIT adjusted 1.5 -15.1 -63.2 151.3 81.2EBITDA adjusted 15.8 -17.1 -42.6 72.2 54.2EPS adjusted 11.7 17.9 -84.5 342.3 142.8
Cash Flow (RsM)Operating cash flow 11,992 -8,318 13,077 29,082 53,600Depreciation/amortization 2,183 2,452 2,627 2,804 2,849Net working capital 573 -2,387 1,447 4,914 5,174Investing cash flow -4,364 -5,555 -14,241 -17,375 -31,475Capital expenditure -5,227 -5,749 -4,850 -3,600 -3,563Acquisitions/disposals 639 -745 -9,569 -13,000 -27,000Financing cash flow -392 26,885 -6,698 -4,360 -18,741Borrowings 4,333 -4,698 -6,005 0 -14,750Dividends paid -3,642 -2,620 0 -3,573 -3,573Change in cash 7,236 13,012 -7,862 7,347 3,384
Balance Sheet (RsM)Total assets 92,782 121,961 120,097 140,733 172,721Cash & cash equivalent 4,379 23,956 9,656 12,021 12,180Accounts receivable 14,931 13,310 16,048 17,694 19,633Net fixed assets 45,619 49,607 51,830 52,626 53,339Total liabilities 64,178 78,323 69,237 73,569 63,770Accounts payable 8,615 8,303 8,383 9,243 10,255Total Debt 41,416 43,114 37,109 37,109 22,359Shareholders' funds 28,604 43,637 50,860 67,164 108,951
Profitability/Solvency Ratios (%)EBITDA margin adjusted 14.4 11.8 6.0 7.9 8.8ROE adjusted 17.6 16.6 2.0 6.9 11.2ROIC adjusted 7.6 16.9 -1.0 0.7 -1.6Net debt to equity 129.5 43.9 54.0 37.4 9.3Total debt to capital 59.1 49.7 42.2 35.6 17.0
For further data queries on Citi’s full coverage universe please contact CIRA Data Services Asia Pacific ([email protected]) or +852-2501-2791
Investment Strategy
We rate Ranbaxy Buy/Medium Risk with a target price of Rs620. The timely approval & launch of Valtrex (generic valacyclovir) in the US market with exclusivity and trends in the last two quarters indicate that the worst is behind for Ranbaxy. There has been tangible improvement in emerging markets, which were severe pressure at the beginning of the year and signs that Daiichi sees a key role for Ranbaxy in its future strategy. The impact of the US FDA action on its facilities (Dewas & Paonta Sahib) is also well understood and built into estimates and valuations. With the approval for Valtrex coming through on time, we also have more comfort on Ranbaxy’s ability to successfully change sites and get approvals in time for its other FTF opportunities, reinforcing our positive stance on the stock.
Valuation
We have a target price of Rs620 for Ranbaxy, comprising Rs435 for the base generics business and Rs185 for the company's patent challenge pipeline. We use EV/Sales to value the core business as we believe Ranbaxy's current profitability is skewed downwards by the unabsorbed overheads at Paonta Sahib & Dewas as well as the high legal & consultancy charges being incurred towards resolving the FDA issues at these plants. We value the core generics business (excluding exclusivity upsides) at 2.4x Mar 11E recurring sales, which is at a 10% discount to the median of the band in which it has traded over the past 8-9 years. We believe this discount is warranted given the uncertainty in its business following issues with the US FDA. We value the company's patent challenge pipeline using a probability-adjusted NPV approach and applying a discount rate of 15%.

India Investor Conference 2010 18 May 2010
Citigroup Global Markets 98
Large, Leveraged, Leader
India’s leading retail financial services company – Reliance Capital (RCap) is characterized by: a) Presence in high growth and fundamentally under-penetrated markets; b) Market leadership; and c) Strong and aggressive management. This has, and will likely continue to, drive a heady business and valuation mix. Conversely, in a slower economy/market, with competitive and cost pressures, and a finance company platform, valuations could hurt a little more.
Retail financial services – characterized by structural under penetration — India's retail financial services space has seen strong growth rates, driven by: a) High domestic savings propensity; b) Under-penetration; and c) Favorable demographics. We believe the underlying shift towards more transparent, liquid and sophisticated savings and risk instruments should continue to support relatively strong growth in financial services.
Most businesses are young and each has significant LT growth potential — RCap’s businesses are still in the early stages of growth, especially the broking, consumer finance, and asset reconstruction segments. While the asset management and life insurance businesses are relatively more mature, these segments are still growing and could have significant potential for future long-term growth.
Largest non-bank distribution network and growing rapidly — RCap has built the largest non-banking distribution network in the country. While the pace of growth has slowed, it provides an opportunity to leverage on the existing network to drive further penetration and market share gains. Moreover, RCap can leverage the distribution network of its group companies and its customer franchise for additional cross-sell opportunities.
Strong capital base – An advantage in a tight liquidity/funding environment, RCap is also well capitalized, which has been key to its aggressive growth, especially in the insurance segments which require large and timely capital infusions. It has relatively low leverage, leaving significant room for continued aggressive expansion. Also, during times of low systemic liquidity and higher interest rates (as currently) a large capital base can be a relative competitive advantage.
Capital market sensitivity is high — RCap's businesses offer secular growth; but almost all (representing about 90% of earnings and valuations) are inherently leveraged to equity markets (for growth, returns and valuations). We see the cyclicality as likely to be more dominating than the secular growth.
Statistical Abstract
Year to Net Profit EPS EPS Growth PE PB ROAE ROAA Div YieldMar 31 (RsM) (Rs) (%) (x) (x) (%) (%) (%)FY08 10,057 41 36.4 17.2 2.6 17 7.8 0.8FY09 10,145 41 0.9 17.0 2.3 14 5.1 0.9FY10E 10,551 43 4.0 16.4 2.1 13 4.5 1.0FY11E 11,176 45 5.9 15.5 1.9 13 4.1 1.0FY12E 11,725 48 4.9 14.8 1.7 12 3.7 1.1
Source: Company Data, Citi Investment Research and Analysis Estimates
Reliance Capital (RLCP.BO)
Sell/Medium Risk 3MPrice (11 May 10) Rs702.65Target Price Rs821.00Expected share price return 16.8%Expected dividend yield 1.0%Expected total return 17.8%Market Cap Rs172,594M US$3,827M
Price Performance
400
600
800
1000
1200
May 09 Aug 09 Nov 09 Feb 10 May 10
INR
Source: dataCentral
Manish Chowdhary, CFA +91-22-6631-9853 [email protected] Aditya Narain, CFA +91-22-6631-9879 [email protected] Pooja Kapur [email protected]
Company description
Reliance Capital (RCap) is India's largest, diversified retail financial services company with a presence in asset management, life insurance, non-life insurance, brokerage, consumer finance and distressed assets. It is part of the Anil Dhirubhai Ambani (ADA) group, which holds a 53% stake in the company. RCap has leveraged its strong brand and large capital base, and has aggressively built a large distribution network in the country. It is among the market leaders in all its business segments.

India Investor Conference 2010 18 May 2010
Citigroup Global Markets 99
Reliance Capital (RLCP.BO): Financial Summary
2008 2009 2010E 2011E 2012E
Valuation RatiosP/E adjusted (x) 17.2 17.0 16.4 15.5 14.8P/E reported (x) 17.2 17.0 16.4 15.5 14.8P/BV (x) 2.6 2.3 2.1 1.9 1.7P/Adjusted BV diluted (x) 2.6 2.3 2.1 1.9 1.7Dividend yield (%) 0.8 0.9 1.0 1.0 1.1Per Share Data (Rs)EPS adjusted 40.85 41.21 42.86 45.40 47.63EPS reported 40.85 41.21 42.86 45.40 47.63BVPS 268.35 302.12 336.96 374.33 413.35Tangible BVPS 268.35 302.12 336.96 374.33 413.35Adjusted BVPS diluted 268.35 302.12 336.96 374.33 413.35DPS 5.49 6.50 7.00 7.00 7.50
Profit & Loss (RsM)Net interest income 5,050 1,781 6,368 7,327 8,530Fees and commissions 5,672 8,272 11,710 13,846 17,504Other operating Income 34,331 36,932 33,506 39,123 45,817Total operating income 45,053 46,985 51,585 60,295 71,852Total operating expenses -32,732 -33,634 -37,095 -45,229 -55,944Oper. profit bef. provisions 12,321 13,351 14,490 15,066 15,907Bad debt provisions -163 -1,314 -1,287 -1,082 -1,237Non-operating/exceptionals 0 0 0 0 0Pre-tax profit 12,158 12,038 13,203 13,985 14,670Tax -2,089 -1,881 -2,641 -2,797 -2,934Extraord./Min. Int./Pref. Div. -12 -12 -12 -12 -12Attributable profit 10,057 10,145 10,551 11,176 11,725Adjusted earnings 10,057 10,145 10,551 11,176 11,725Growth Rates (%)EPS adjusted 36.4 0.9 4.0 5.9 4.9Oper. profit bef. prov. 51.8 8.4 8.5 4.0 5.6
Balance Sheet (RsM)Total assets 184,202 213,001 256,375 293,855 346,155Avg interest earning assets 121,083 186,485 218,741 255,409 296,400Customer loans 102,803 105,800 123,160 134,966 156,555Gross NPLs 0 0 0 0 0Liab. & shar. funds 184,202 213,001 256,375 293,855 346,155Total customer deposits 0 0 0 0 0Reserve for loan losses 0 0 0 0 0Shareholders' equity 66,057 74,370 82,945 92,145 101,751
Profitability/Solvency Ratios (%)ROE adjusted 16.9 14.4 13.4 12.8 12.1Net interest margin 4.2 1.0 2.9 2.9 2.9Cost/income ratio 72.7 71.6 71.9 75.0 77.9Cash cost/average assets 25.3 16.9 15.8 16.4 17.5NPLs/customer loans 0.0 0.0 0.0 0.0 0.0Reserve for loan losses/NPLs na na na na naBad debt prov./avg. cust. loans 0.2 1.3 1.1 0.8 0.8Loans/deposit ratio na na na na naTier 1 capital ratio na na na na naTotal capital ratio na na na na na
For further data queries on Citi’s full coverage universe please contact CIRA Data Services Asia Pacific ([email protected]) or +852-2501-2791
Investment Strategy
We rate RCap as Sell/Medium Risk (3M). Its key strengths are: a) A presence in under-penetrated, secular growth businesses; b) Strong business growth led by supportive capital markets; and c) Market leadership in most segments, driven by its large distribution network, product focus and strong and aggressive management. However, almost all its businesses and earnings are inherently linked to capital markets. RCap is also significantly exposed to slower economic growth, higher interest rates and weaker asset quality, which could pressure growth and expected returns. Moreover, we believe its profitability will be under pressure medium-term due a likely higher cost distribution build-out and increasing competitive intensity. While parts of RCap's businesses are likely to grow significantly (especially asset management and broking) in the current environment, and profitability is showing signs of stabilization, we expect its insurance and consumer finance segments to continue on a moderate growth path.
Valuation
Our Rs821 target price is based on a SOTP methodology due to its diverse businesses. We value the AMC business at Rs237/sh (5.0% of AUMs), the life insurance business at Rs417/sh (14x 1-year forward NBAP, at par with peers), the non-life insurance business at Rs4/sh (10x 1-year forward economic profits), the retail broking business at Rs53/sh (15x 1-year forward earnings), and the consumer finance business at Rs92/sh (1.25x 1-year forward book value). We also estimate unrealized gains at 25% of the costs of its listed equity investments to factor in the sharp rise in equity markets.

India Investor Conference 2010 18 May 2010
Citigroup Global Markets 100
Wireless Turnaround Is Key
GSM traffic needs to be sustained — GSM traffic of new entrants (focusing on the urban scheme-hunting subs) could be more prone to swings given the likely high contribution from multi-SIM users. This was witnessed in 4Q when the tariff cuts initiated by the incumbents in October 2009 led to a revenue market share recovery for incumbents in their strong circles. Vodafone gained 70-190bps revenue share in Delhi/Mumbai, despite heavy presence of multi-SIM (150%-165% SIM penetration), and even Idea gained 50-130bps across MP/Kerala.
Global business should be supported by economic recovery — Resumption of corporate spending and new contract sign-ups post the economic recovery support global business. Besides the sharp tariff cuts in long-distance are also likely to generate usage elasticity (witnessed in the case of other incumbents in 4Q).
B/S under focus, FY10/11E capex lowered sharply — Net Debt (ex-equip. payables) declined by Rs22bn in 3QFY10 to Rs189bn, as the company reduced current assets (ex-cash) by Rs17bn during the quarter. Debtors declined Rs7bn and loans & advances by Rs10bn. Capex in 3QFY10 was Rs13bn (9M-Rs32bn) and the company’s lowered FY10E guidance of Rs45bn is well shy of our Rs71bn estimate and provides some cushion for 3G. FY11E capex guidance at Rs30bn further signifies the focus on sweating the existing assets.
High 3G bidding is a risk though — 3G bidding has touched Rs144bn for a pan-India license. While we except RCOM to be selective, any aggressive bidding carries risk of deteriorating the B/S further.
TRAI recos on spectrum is positive but license fees on towercos a negative – TRAI recommendations on spectrum allotment based on coverage versus auction (as was expected) benefits RCOM (and other new entrants on 4.4MHz) which, based on the sub linked spectrum criteria are eligible for 6.2MHz.
Statistical Abstract
Year to Net Profit Diluted EPS EPS growth EV/EBITDA P/E P/B P/CEPS ROE Yield31 Mar (RsM) (Rs) (%) (x) (x) (x) (x) (%) (%)2008A 55,097 26.7 na 4.2 5.5 1.0 3.7 na 0.52009A 61,477 29.8 11.6 4.8 4.9 0.7 3.0 17.2 0.72010E 38,699 18.7 -37.1 6.9 7.8 0.7 4.0 8.8 1.02011E 37,226 18.0 -3.8 6.6 8.2 0.6 3.8 7.8 1.42012E 43,224 20.9 16.1 5.9 7.0 0.6 3.4 8.5 1.4
Source: Company data, Citi Investment Research and Analysis Estimates
Reliance Communications (RLCM.BO)
Sell/Medium Risk 3MPrice (11 May 10) Rs147.05Target Price Rs160.00Expected share price return 8.8%Expected dividend yield 1.0%Expected total return 9.8%Market Cap Rs303,515M US$6,731M
Price Performance (RIC: RLCM.BO)
100150200250300350400
May 09 Aug 09 Nov 09 Feb 10 May 10
INR
Source: dataCentral
Rahul Singh +91-22-6631-9863 [email protected]
Company description
RCOM is an integrated player in the Indian telecoms sector. It was listed on the Indian stock exchanges following the de-merger of Reliance Industries. RCOM is the second-largest player in the mobile segment, has an 80,000km-long India-wide optic-fiber network, and owns the FLAG submarine cable network. RCOM has three business units: 1) Wireless, which includes a nationwide wireless network on CDMA and GSM; 2) Global Business comprising wholesale voice and data; and 3) Broadband for both retail and enterprise.

India Investor Conference 2010 18 May 2010
Citigroup Global Markets 101
Reliance Communications (RLCM): Financial Summary
Fiscal year end 31-Mar 2008 2009 2010E 2011E 2012E
Valuation RatiosP/E adjusted (x) 5.5 4.9 7.8 8.2 7.0EV/EBITDA adjusted (x) 5.4 6.1 7.6 7.0 6.3P/BV (x) 1.0 0.7 0.7 0.6 0.6Dividend yield (%) 0.5 0.7 1.0 1.4 1.4Per Share Data (Rs)EPS adjusted 26.69 29.79 18.75 18.04 20.94EPS reported 26.69 29.79 18.75 18.04 20.94BVPS 140.63 204.85 221.91 237.69 256.39DPS 0.75 1.00 1.50 2.00 2.00
Profit & Loss (RsM)Net sales 190,678 229,411 231,475 262,418 289,254Operating expenses -136,743 -175,924 -184,652 -211,858 -231,788EBIT 53,935 53,487 46,824 50,560 57,466Net interest expense 3,998 7,867 -5,655 -9,197 -8,900Non-operating/exceptionals 0 0 0 0 0Pre-tax profit 57,933 61,354 41,169 41,363 48,566Tax -2,836 123 -2,470 -4,136 -5,342Extraord./Min.Int./Pref.div. 0 0 0 0 0Reported net income 55,097 61,477 38,699 37,226 43,224Adjusted earnings 55,097 61,477 38,699 37,226 43,224Adjusted EBITDA 81,989 92,875 84,302 93,078 102,807Growth Rates (%)Sales 31.8 20.3 0.9 13.4 10.2EBIT adjusted 65.7 -0.8 -12.5 8.0 13.7EBITDA adjusted 43.3 13.3 -9.2 10.4 10.5EPS adjusted 70.8 11.6 -37.1 -3.8 16.1
Cash Flow (RsM)Operating cash flow 106,390 59,756 58,574 91,340 81,358Depreciation/amortization 28,054 39,388 37,478 42,518 45,342Net working capital 2,563 -33,243 -29,463 2,398 -16,108Investing cash flow -212,034 -255,510 -72,410 -68,475 -57,017Capital expenditure -212,034 -255,510 -72,410 -68,475 -57,017Acquisitions/disposals 0 0 0 0 0Financing cash flow 86,190 138,951 -6,965 -13,841 -13,544Borrowings 83,834 133,406 8,378 0 0Dividends paid -1,742 -2,322 -3,483 -4,644 -4,644Change in cash -19,454 -56,804 -20,801 9,023 10,797
Balance Sheet (RsM)Total assets 774,593 1,022,070 1,028,590 1,070,236 1,096,226Cash & cash equivalent 117,431 109,724 88,923 97,946 108,743Accounts receivable 27,224 39,618 38,579 43,736 48,209Net fixed assets 523,126 727,053 761,984 787,941 799,617Total liabilities 460,021 592,718 564,021 573,085 560,495Accounts payable 156,213 159,718 122,645 131,709 119,119Total Debt 258,217 391,623 400,000 400,000 400,000Shareholders' funds 314,573 429,352 464,568 497,151 535,731
Profitability/Solvency Ratios (%)EBITDA margin adjusted 43.0 40.5 36.4 35.5 35.5ROE adjusted 22.3 17.2 8.8 7.8 8.5ROIC adjusted 13.2 8.6 5.7 5.6 6.1Net debt to equity 44.8 65.7 67.0 60.8 54.4Total debt to capital 45.1 47.7 46.3 44.6 42.7
For further data queries on Citi’s full coverage universe please contact CIRA Data Services Asia Pacific ([email protected]) or +852-2501-2791
Investment Strategy
We rate RCOM as Sell/Medium Risk (3M). While RCOM was able to show early signs of success in its GSM foray in 1Q, traffic growth has slowed down post other new launches, especially DoCoMo. Recent tariff cuts make it susceptible to EBITDA and earnings decline as incumbents have matched the tariffs and leave RCOM's B/S exposed, especially given high leverage (Net Debt/EBITDA of 3.7x FY10E). Besides RCOM's sub base is more susceptible to churn/traffic migration given high proportion of "scheme-hunting subs" and new entrants focus on the same set of subs. While Reliance Infratel has been signing up new tenants, its dependence on start-ups for tenancy raises question marks on their viability given the worsening competitive scenario.
Valuation
Our target price of Rs160 comprises (i) core business value of Rs120 based on 6.0x FY11E EV/EBITDA, at 10% discount to Bharti's implied target multiple (ex- towerco), plus (ii) Infratel value accretion of Rs40 based on long-term tenancy of 2.3. We believe some discount to Bharti is justified on account of the inherent risks of dual network, higher leverage, stretched FCF breakeven, and lack of clarity and consistency on accounting policies (especially related to finance income). Our towerco net value accretion of Rs40 is based on the following assumptions: 1) Long-term tenancy of 2.3 with captive tenancy of 1.6; 2) Capex recovery of 13%, 3) WACC of 11.3% and terminal growth rate of 3%; 4) Please note that the incremental value accretion to RCOM is calculated after netting off the contribution from the captive tenancy. Thus, it only reflects the value of the external revenues.

India Investor Conference 2010 18 May 2010
Citigroup Global Markets 102
E&P Promise + Bottoming Refining + Positive Court Verdict
Positive court verdict; PSC to determine new agreement — The Supreme Court in the RIL-RNRL gas dispute ruled that: (i) the Production Sharing Contract (PSC) between RIL and the government should play a vital role in arriving at the renegotiated agreement, thus implying that (ii) the government has a right to approve gas price. This effectively over-rules the earlier High Court ruling and is positive for RIL, removing the overhang on its gas volumes and pricing.
E&P promise — E&P is valued at Rs460/share in our RIL SOTP, implying a 40% premium to NAV (D6+NEC+CBM) hence building in healthy optionality. Some of this “exploration option” has been vindicated by the newer discoveries (D3, CYD5, KG-D4) and the intensive exploration calendar, i.e. 30 wells over the next 3-4 years on its portfolio (D6, D3, D9, MN-D4, NEC-25, CYD5). However, the gestation from discovery to production is relatively long.
Refining back from brink — Our GRM of $8.6/$9.5 in FY11E/12E, factors in steady recovery from $7.5 in 4QFY10, with some help from Cairn crude and captive gas. In contrast, petchem (14% EBITDA decline in FY11E) could have upside if the imminent downturn is less severe than expected due to capacity delays and/or Chinese/Indian demand. While the stock is factoring in stable macro and demand recovery in the developed world, petchem provides a cushion.
Acquisitions — The shale gas JV with Atlas is a better strategic fit, though it is not big enough to swing the needle and requires peak cash sink of only US$1.8bn as against RIL’s FCF of US$10bn over FY11E-12E. In addition, expectations of sustained global recovery have pushed asset prices higher. With the stock pricing in moderate refining recovery in FY11/12E and meaningful exploration upside, risk/reward appears to remain balanced. Maintain Hold.
Statistical Abstract
Year to Net Profit Diluted EPS EPS growth EV/EBITDA P/E P/B P/CEPS ROE Yield31 Mar (RsM) (Rs) (%) (x) (x) (x) (x) (%) (%)2008A 152,606 52.5 na 16.7 20.3 3.9 12.8 27.1 0.62009A 156,367 47.6 -9.3 16.0 22.4 2.8 16.8 15.2 0.62010E 162,360 49.7 4.3 13.1 21.5 2.5 13.1 12.3 0.72011E 220,113 67.3 35.6 9.4 15.9 2.2 9.6 15.0 0.72012E 255,293 78.1 16.0 8.3 13.7 2.0 8.4 15.2 0.9
Source: dataCentral, CIRA Estimates
Reliance Industries (RELI.BO)
Hold/Low Risk 2LPrice (11 May 10) Rs1,067.20Target Price Rs1,150.00Expected share price return 7.8%Expected dividend yield 0.7%Expected total return 8.4%Market Cap Rs3,490,144M US$77,395M
Price Performance
800
900
1000
1100
1200
Sep 06 Dec 06 Mar 07 Jun 07 Sep 07
INR
Source: dataCentral
Rahul Singh +91-22-6631-9863 [email protected]
Saurabh Handa +91-22-6631-9858 [email protected]
Garima Mishra [email protected]
Company description
Reliance Industries is a conglomerate with interests in upstream oil & gas (E&P), refining, and petrochemicals. It has commissioned a super-size refinery project through RPL (now merged with itself) and has also commenced gas production at its large gas find in the D6 block in KG basin. RIL is foraying into organized retailing and has plans to undertake SEZ projects over the medium to long term.

India Investor Conference 2010 18 May 2010
Citigroup Global Markets 103
Reliance Industries (RELI.BO): Financial Summary
Fiscal year end 31-Mar 2008 2009 2010E 2011E 2012E
Valuation RatiosP/E adjusted (x) 20.3 22.4 21.5 15.9 13.7EV/EBITDA adjusted (x) 16.0 15.5 12.4 8.8 7.6P/BV (x) 3.9 2.8 2.5 2.2 2.0Dividend yield (%) 0.6 0.6 0.7 0.7 0.9Per Share Data (Rs)EPS adjusted 52.50 47.59 49.65 67.31 78.07EPS reported 66.94 47.59 49.65 67.31 78.07BVPS 274.41 384.63 419.48 478.76 546.78DPS 6.50 6.50 7.00 8.00 10.00
Profit & Loss (RsM)Net sales 1,334,430 1,418,470 1,924,610 2,252,746 2,281,395Operating expenses -1,159,711 -1,233,593 -1,723,770 -1,970,627 -1,976,677EBIT 174,719 184,877 200,840 282,118 304,717Net interest expense -10,774 -17,450 -19,970 -24,475 -20,952Non-operating/exceptionals 66,156 20,180 24,600 17,530 30,046Pre-tax profit 230,101 187,607 205,470 275,173 313,812Tax -35,519 -31,240 -43,110 -55,061 -58,519Extraord./Min.Int./Pref.div. 0 0 0 0 0Reported net income 194,583 156,367 162,360 220,113 255,293Adjusted earnings 152,606 156,367 162,360 220,113 255,293Adjusted EBITDA 223,190 236,830 305,810 423,887 465,772Growth Rates (%)Sales 19.5 6.3 35.7 17.0 1.3EBIT adjusted 13.1 5.8 8.6 40.5 8.0EBITDA adjusted 10.1 6.1 29.1 38.6 9.9EPS adjusted 27.8 -9.3 4.3 35.6 16.0
Cash Flow (RsM)Operating cash flow 199,875 389,107 296,383 346,682 431,990Depreciation/amortization 48,471 51,953 104,970 141,768 161,054Net working capital -43,180 180,787 29,053 -15,199 15,644Investing cash flow -229,608 -866,494 -65,091 -148,500 -147,000Capital expenditure -185,480 -896,927 -65,091 -148,500 -147,000Acquisitions/disposals -45,604 15,485 0 0 0Financing cash flow 65,267 655,505 -79,359 -55,055 -178,220Borrowings 98,795 329,060 -113,871 -26,156 -150,000Dividends paid -21,666 -22,118 -26,219 -29,964 -37,455Change in cash 35,534 178,118 151,933 143,127 106,771
Balance Sheet (RsM)Total assets 1,498,390 2,457,057 2,510,060 2,746,090 2,832,819Cash & cash equivalent 71,765 231,659 134,620 212,877 305,650Accounts receivable 62,276 45,714 116,600 150,128 152,037Net fixed assets 848,895 1,693,869 1,653,990 1,660,722 1,646,668Total liabilities 683,903 1,193,327 1,138,350 1,180,552 1,044,844Accounts payable 183,360 147,824 368,490 416,306 413,293Total Debt 364,521 738,821 624,950 598,794 448,794Shareholders' funds 814,486 1,263,730 1,371,710 1,565,538 1,787,975
Profitability/Solvency Ratios (%)EBITDA margin adjusted 16.7 16.7 15.9 18.8 20.4ROE adjusted 21.2 15.2 12.3 15.0 15.2ROIC adjusted 16.1 11.8 9.2 12.4 13.1Net debt to equity 35.9 40.1 35.7 24.7 8.0Total debt to capital 30.9 36.9 31.3 27.7 20.1
For further data queries on Citi’s full coverage universe please contact CIRA Data Services Asia Pacific ([email protected]) or +852-2501-2791
Investment Strategy
We rate RIL as Hold/Low Risk (2L) with a target price of Rs1,150. We believe that the stock is pricing in a moderate but sustained refining recovery and meaningful exploration upside. While a 40% premium to NAV looks justified for the E&P business, present stock valuations leave little room for disappointment, esp. given the long-gestation from discovery to production. While petchem could surprise on the upside, on the refining side, the stock is factoring in stable macro and demand recovery in the developed world. While acquisitions such as the Atlas JV could be value accretive, these are unlikely to be large enough to swing the needle for RIL.
Valuation
Our target price of Rs1,150 is based on an average of a sum-of-the-parts value (Rs1,043/share) and a P/E value (Rs1,203/share) and explicitly includes the NPV of the shale gas JV with Atlas Energy of Rs30/share. Our SOTP is derived by: 1) Valuing RIL's core petchem and downstream oil business on an EV/EBITDA of 7.0x mid-FY12E; this also captures the expected recovery in global refining; 2) Valuing total E&P assets including oil & gas prospects and other blocks at Rs460/share based on 8x mid-FY12E EV/EBITDA; 3) Valuing investments in the organized retail business, SEZ, etc. at Rs44/share, based on book value of investments so far; and 4) Valuing treasury stock (post stock sale) at target price. For the P/E valuation, we ascribe a 15x mid-FY12E multiple, in line with the market multiple. We believe RPL and KG gas commencement will lead to the market now focusing on FY11/12 earnings (which capture the impact of both), prompting us to give equal weightage to a multiple-based methodology as well as an SOTP while deducing our target price.

India Investor Conference 2010 18 May 2010
Citigroup Global Markets 104
Recent Supreme Court judgment — The Supreme Court of India has directed both parties in the RIL-RNRL dispute to re-negotiate gas supply agreement, keeping in mind production sharing contract and has upheld the right of government of India to allocate gas and decide price.
Judgment increases uncertainty — While R-Infra /R-power expect the final allocation by the government to be in its favor, we believe the judgment increases uncertainty surrounding R-Power’s gas-based expansion plan.
Promoter warrant conversion — The promoters have raised their stake to 42.73% by converting a part of warrants. R-Infra would use Rs18bn infusion from this conversion in partially funding the capex requirement of various infrastructure projects it is executing.
Other projects remain on track — Reliance cementation (subsidiary of R-Infra) has raised Rs18bn debt for cement plant. R-cementation is targeting cement capacity of 10mn tons. Mumbai Metro One is scheduled for test run in July-August 2010. Delhi Airport Express is scheduled to achieve CoD before common-wealth games in October 2010.
Statistical Abstract
Year to Net Profit Diluted EPS EPS growth EV/EBITDA P/E P/B P/CEPS ROE Yield31 Mar (RsM) (Rs) (%) (x) (x) (x) (x) (%) (%)2007A 7,503 31.8 na 46.9 31.7 2.7 22.9 na 0.52008A 9,913 42.1 32.1 52.0 24.0 2.2 18.2 11.0 0.62009E 10,665 47.1 11.9 37.9 21.4 2.0 16.5 10.2 0.72010E 12,558 55.5 17.7 29.8 18.2 1.9 15.1 10.6 0.82011E 14,739 65.1 17.4 26.5 15.5 1.7 13.1 11.4 0.9
Source: Citi Investment Research and Analysis estimates
Reliance Infrastructure (RLIN.BO)
Buy/Medium Risk 1MPrice (12 May 10) Rs1,000.55Target Price Rs1,535.00Expected share price return 53.4%Expected dividend yield 0.7%Expected total return 54.1%Market Cap Rs245,005M US$5,448M
Price Performance
500
700
900
1100
1300
1500
May 09 Aug 09 Nov 09 Feb 10 May 10
INR
Source: dataCentral
Venkatesh Balasubramaniam +91-22-6631-9864 [email protected]
Company description
Reliance Energy (RELE) became Reliance Infrastructure (R-Infra) as it has forayed aggressively into the infrastructure business over the past 2.5 years: Projects include: 1) EPC player with Rs90.5bn order book; 2) Power transmission infrastructure developer including the Western Region Strengthening System (WRSS), the only 100%-owned power transmission project developed by a private player; 3) Metro rail project developer with 12km VAG corridor in Mumbai and 22.7 km airport link in Delhi; 4) 562km of highway projects; 5) L1 bidder to construct the 25-km-long bridge over sea link (MTHL) in Mumbai. RI is also constructing a 100-storey corporate park in Hyderabad with plans to set up SEZs in Noida and Mumbai and is in advanced stages of bidding for several metro, airports, highway and energy distribution projects

India Investor Conference 2010 18 May 2010
Citigroup Global Markets 105
Reliance Infrastructure (RLIN.BO): Financial Summary
Fiscal year end 31-Mar 2007 2008 2009E 2010E 2011E
Valuation RatiosP/E adjusted (x) 31.7 24.0 21.4 18.2 15.5EV/EBITDA adjusted (x) 49.7 45.2 27.8 19.7 17.2P/BV (x) 2.7 2.2 2.0 1.9 1.7Dividend yield (%) 0.5 0.6 0.7 0.8 0.9Per Share Data (Rs)EPS adjusted 31.84 42.07 47.10 55.46 65.09EPS reported 34.01 46.03 50.29 55.46 65.09BVPS 378.06 468.69 499.81 545.90 600.46DPS 5.30 6.30 7.00 8.00 9.00
Profit & Loss (RsM)Net sales 57,100 63,643 96,749 128,322 151,160Operating expenses -54,526 -60,407 -91,376 -120,494 -142,396EBIT 2,574 3,235 5,373 7,828 8,764Net interest expense -2,503 -3,088 -3,305 -4,766 -4,766Non-operating/exceptionals 8,653 11,370 9,866 11,540 13,140Pre-tax profit 8,724 11,517 11,934 14,602 17,138Tax -1,221 -1,604 -1,269 -2,044 -2,399Extraord./Min.Int./Pref.div. 511 933 723 0 0Reported net income 8,015 10,846 11,389 12,558 14,739Adjusted earnings 7,503 9,913 10,665 12,558 14,739Adjusted EBITDA 4,975 5,465 7,822 10,411 11,471Growth Rates (%)Sales 41.6 11.5 52.0 32.6 17.8EBIT adjusted -35.5 25.7 66.1 45.7 12.0EBITDA adjusted -33.5 9.8 43.1 33.1 10.2EPS adjusted 2.7 32.1 11.9 17.7 17.4
Cash Flow (RsM)Operating cash flow -39,441 34,301 30,308 11,513 17,078Depreciation/amortization 2,401 2,229 2,449 2,583 2,707Net working capital -50,129 21,053 16,471 -3,628 -368Investing cash flow -18,441 -59,618 -35,677 -3,000 -3,000Capital expenditure -5,250 -8,093 -3,500 -3,000 -3,000Acquisitions/disposals -13,191 -51,525 -32,177 0 0Financing cash flow 23,112 4,434 14,811 -2,097 -2,360Borrowings 15,914 -8,694 23,431 0 0Dividends paid -1,417 -1,728 -1,855 -2,120 -2,385Change in cash -34,770 -20,883 9,442 6,416 11,718
Balance Sheet (RsM)Total assets 177,327 196,786 227,889 238,675 252,177Cash & cash equivalent 21,759 876 10,318 16,734 28,451Accounts receivable 10,564 13,514 30,884 32,418 32,097Net fixed assets 24,064 29,928 30,979 31,396 31,689Total liabilities 90,914 86,353 114,708 115,055 116,204Accounts payable 11,607 11,069 17,127 15,553 15,158Total Debt 58,583 49,889 73,320 73,320 73,320Shareholders' funds 86,413 110,433 113,181 123,619 135,974
Profitability/Solvency Ratios (%)EBITDA margin adjusted 8.7 8.6 8.1 8.1 7.6ROE adjusted 9.5 10.1 9.5 10.6 11.4ROIC adjusted 1.7 1.6 4.8 7.4 7.8Net debt to equity 42.6 44.4 55.7 45.8 33.0Total debt to capital 40.4 31.1 39.3 37.2 35.0
For further data queries on Citi’s full coverage universe please contact CIRA Data Services Asia Pacific ([email protected]) or +852-2501-2791
Investment Strategy
We rate R-Infra Buy/Medium Risk (1M) given that upside to our Rs1,535 target price. Our assumptions about the sales growth in the EPC business, equity IRRs in the road projects, equity IRRs in transmission projects, and equity IRRs in the metro projects are conservative vis-à-vis management expectations. We believe our assumptions adequately factor in: 1) executions risks, 2) capital risks, 3) interest-rate risks, and 4) de-rating of sectors in which RI operates given market conditions. Recently, the company: 1) successfully IPOed Reliance Power; 2) initiated a share buy back programme; and 3) re-named and restructured RELE as R-Infra. In addition, recent disclosures and seriousness evident in the recent analyst meet for R-Infra/ R-Power has forced a re-examination. Interaction with senior/ middle / junior management has given us confidence to undertake a detailed valuation exercise of each of its entities. We see Reliance Infrastructure as "An Infrastructure Goliath in the Making".
Valuation
Our 12-month SOTP target price for R-Infra of Rs1,535 is composed of: 1) EPC + Power business using an EV/EBITDA multiple of 10x Sep10; 2) We value the projects in Reliance Infra Ventures using a discounted cash flow (DCF) methodology; ) We value the Delhi distribution business at a P/Equity Base of 2.0x; and 3) We value the projects in Reliance Power at a 20% discount to discounted cash flow (DCF) value.

India Investor Conference 2010 18 May 2010
Citigroup Global Markets 106
Diverse geography and fuel mix — Reliance Power’s projects have diverse geographic location, fuel type, fuel source and off-take, and each project is planned to be strategically located near an available fuel supply or load centre.. Projects include eight coal-fired projects (19,940MW) to be fueled by reserves from captive mines and supplies from India and abroad, two gas-fired project (7,500MW) to be fueled primarily by reserves from the Krishna Godavari Basin (the "KG Basin") off the east coast of India, and five hydroelectric projects (4,620MW).
Has won 3 out of 4 UMPP bids so far — Reliance Power has won three out of four ultra mega power projects announced so far. The projects are: (1) 4000MW coal fired project at Sasan in Madhya Pradesh; (2) 4000MW imported coal based project at Krishnapattnam in Andhra Pradesh; and (3) 4000MW coal fired project at Tilaiya, Jharkhand.
Implementation Status — 1) Sasan UMPP (4000MW) – financially closed , first two units to be commissioned before 2012 2) Krishnapatnam UMPP (4000MW) – land has been fully acquired, the first unit is expected to be commissioned by March 2013; 3) Tilaiya UMPP (4000MW) - the company has won this UMPP at a levelized tariff of Rs1.77/Kwh; 4) Rosa Phase 1 (600MW) – 300MW has been commissioned in December 2010; 5) Rosa Phase 2 (600MW) – PPA signed, financial closure has taken place and coal linkage has been awarded; 6) Butibori (300MW) – Coal linkage and all clearances are in place, the project size is likely to be increased to 600MW; and 7) Chitrangi (6X660MW) – pre-sold 1241MW @ Rs2.45/Kwh
_______________________________________________________________
_______________________________________________________________
_______________________________________________________________
_______________________________________________________________
_______________________________________________________________
_______________________________________________________________
_______________________________________________________________
_______________________________________________________________
_______________________________________________________________
_______________________________________________________________
_______________________________________________________________
__________________________________________________________________
__________________________________________________________________
__________________________________________________________________
__________________________________________________________________
Reliance Power (RPOL.BO)
Non-Rated Price (11 May 10) 144.15 Market Cap US$7664.5
Price Performance
0
100
200
300
11 May 11 Sep 11 Jan 11 May
INR
Source: dataCentral
Venkatesh Balasubramaniam +91-22-6631-9864 [email protected]
Company Description
Reliance Power on its own and through subsidiaries is currently developing 16 medium and large sized power projects with a combined planned installed capacity of 32,080 MW, one of the largest portfolios of power generation assets under development in India.

India Investor Conference 2010 18 May 2010
Citigroup Global Markets 107
Reliance Power (Power): Financial Summary
Figure 1. Reliance Power – Consolidated Balance Sheet
Rs. Million FY08 FY09Gross fixed assets 10,326 49,732 Less: Cumulative depreciation 17 73 Net fixed assets 10,310 49,659 Investments 131,234 103,172 Cash & bank balance 4,270 216 Inventories - - Receivables 602 1,809 Expenses paid in advance 79 187 Total assets 146,494 155,044 Net worth 135,334 137,792 Issued equity capital 22600 23968Minority interest reserves - - Reserves & surplus 112,735 113,824 Total borrowings 4,483 13,325 Current liabilities & provisions 6,677 3,927 Total liabilities 146,494 155,044
Source: CMIE Prowess
Figure 2. Reliance Power – Consolidated Income Statement
Rs. Million FY08 FY09Total income 1,329 3,604 -Dividends 1,128 2,849 -Treasury operations 200 609 -Other income 1 146 Total expenses 293 925 EBITDA 1,036 2,679 Fee based financial service expenses 60 46 Depreciation - 2 Amortization 0 - PBT 975 2,631 Provision for direct taxes 62 125 PAT 913 2,506 Prior period & extraordinary expenses 59 61 Reported PAT 854 2,445
Source: CMIE Prowess
Recent Developments
The Supreme Court of India has ordered re-negotiation of gas supply agreement for Dadri power plant and has upheld the right of government to allocate gas from KG D6 and determine price
Rosa 1 (300MW) has achieved CoD in December 2010

India Investor Conference 2010 18 May 2010
Citigroup Global Markets 108
Road to Returns
On the fast lane — Shriram is India's largest organized pre-owned commercial-vehicle (CV) financier with 1) Strong loan growth (24% pa in FY09-12E); 2) A robust return profile (24-28% ROE); 3) A biz model that is unique and has scale; and 4) Cyclical upside from an improving CV cycle (32% CV sales growth YTD).
Business model is unique, and has scale — The following factors differentiate Shriram: a) Regulatory arbitrage – preferred access to funding, demand for its loans (priority sector); b) Low-cost distribution network and operations; and c) Operating and regulatory flexibility. Few regulatory barriers to entry exist, but scale, asset quality management, asset concentration and now widening of asset mix/distribution channels will likely keep it a one-of-a-kind lender in India.
Better than a bank? — Management is not interested in converting Shriram to a bank even if given the option. This, along with Shriram's higher growth and return profile, operating/regulatory flexibility and uniqueness appear a good trade-off against the liability franchise value and regulatory protection that a banking license brings. We believe it is the scale, sweet spot in the market, regulatory arbitrage and management record that make Shriram attractive.
Value more cyclical than volume? — Shriram has been a low-beta stock, but its a) Asset/growth concentration; b) Asset-side-only value (no retail liability franchise); c) Wholesale funding (rate/liquidity sensitive) – a current risk; and d) Finco platform could result in greater stock cyclicality. We believe the business itself, asset and funding expansion and returns will remain strong and more predictable.
Key risks — Asset quality, wholesale funding, execution and regulatory changes.
Statistical Abstract
Year Net profit EPS EPS Growth PE PB ROAE ROAA Div yieldMarch (Rs. M) Rs. (%) (x) (x) (%) (%) (%)FY08 3,898 20 76.9 26.9 6.1 27 2.7 0.9FY09 6,124 30 49.6 18.0 4.8 30 2.8 0.9FY10E 8,557 40 33.2 13.5 3.2 28 3.3 1.1FY11E 10,988 49 22.8 11.0 2.5 26 3.7 1.3FY12E 12,776 57 16.3 9.5 2.1 24 3.6 1.5
Source: Company data, Citi Investment Research and Analysis estimates
Shriram Transport Finance (SRTR.BO)
Buy/Medium Risk 1MPrice (11 May 10) Rs542.45Target Price Rs615.00Expected share price return 13.4%Expected dividend yield 1.1%Expected total return 14.5%Market Cap Rs122,332M US$2,713M
Price Performance
200
300
400
500
600
May 09 Aug 09 Nov 09 Feb 10 May 10
INR
Source: dataCentral
Manish Chowdhary, CFA +91-22-6631-9853 [email protected] Aditya Narain, CFA +91-22-6631-9879 [email protected] Pooja Kapur [email protected]
Company description
Shriram Transport is the largest organized player in the pre-owned commercial vehicle (CV) financing segment in India. Shriram was started in 1979 by 3 entrepreneurs and focuses primarily on financing of CVs. Subsequently it diversified into financing of 3-wheelers and tractors, and into providing working capital, engine replacement and tire loans to truck operators. Shriram has built a strong distribution network with 482 branches, more than 12,000 employees and tie-ups with over 500 local financiers across the country. It has a wide presence in South India.

India Investor Conference 2010 18 May 2010
Citigroup Global Markets 109
Shriram Transport Finance (SRTR.BO): Financial Summary
2008 2009 2010E 2011E 2012E
Valuation RatiosP/E adjusted (x) 26.9 18.0 13.5 11.0 9.5P/E reported (x) 26.9 18.0 13.5 11.0 9.5P/BV (x) 6.1 4.8 3.2 2.5 2.1P/Adjusted BV diluted (x) 6.6 5.1 3.3 2.6 2.1Dividend yield (%) 0.9 0.9 1.1 1.3 1.5Per Share Data (Rs)EPS adjusted 20.13 30.12 40.10 49.23 57.24EPS reported 20.13 30.12 40.10 49.23 57.24BVPS 89.41 113.82 172.02 213.07 260.95Tangible BVPS 89.41 113.82 172.02 213.07 260.95Adjusted BVPS diluted 82.73 106.57 166.77 206.27 255.02DPS 5.07 5.00 6.00 7.00 8.00
Profit & Loss (RsM)Net interest income 11,863 17,098 22,340 27,445 32,362Fees and commissions 8 10 303 757 1,135Other operating Income 253 427 273 121 133Total operating income 12,124 17,535 22,917 28,323 33,630Total operating expenses -3,599 -5,271 -5,703 -6,958 -8,309Oper. profit bef. provisions 8,525 12,264 17,214 21,365 25,322Bad debt provisions -2,461 -3,049 -4,443 -4,964 -6,253Non-operating/exceptionals -6 -8 0 0 0Pre-tax profit 6,058 9,206 12,771 16,401 19,068Tax -2,160 -3,082 -4,214 -5,412 -6,293Extraord./Min. Int./Pref. Div. 0 0 0 0 0Attributable profit 3,898 6,124 8,557 10,988 12,776Adjusted earnings 3,898 6,124 8,557 10,988 12,776Growth Rates (%)EPS adjusted 76.9 49.6 33.2 22.8 16.3Oper. profit bef. prov. 87.1 43.9 40.4 24.1 18.5
Balance Sheet (RsM)Total assets 182,686 249,897 265,807 321,318 379,000Avg interest earning assets 141,170 212,549 254,919 292,893 351,912Customer loans 150,727 179,031 230,642 287,262 343,517Gross NPLs 2,384 3,843 5,035 7,997 11,022Liab. & shar. funds 182,686 249,897 265,807 321,318 379,000Total customer deposits 34 49 56 65 71Reserve for loan losses 1,029 2,368 3,862 6,480 9,700Shareholders' equity 18,164 23,166 38,394 47,555 58,242
Profitability/Solvency Ratios (%)ROE adjusted 26.9 29.6 27.8 25.6 24.2Net interest margin 8.4 8.0 8.8 9.4 9.2Cost/income ratio 29.7 30.1 24.9 24.6 24.7Cash cost/average assets 2.5 2.4 2.2 2.4 2.4NPLs/customer loans 1.6 2.1 2.2 2.8 3.2Reserve for loan losses/NPLs 43.2 61.6 76.7 81.0 88.0Bad debt prov./avg. cust. loans 2.1 1.8 2.2 1.9 2.0Loans/deposit ratio nm nm nm nm nmTier 1 capital ratio 9.4 11.9 15.4 15.3 15.8Total capital ratio 12.7 16.4 19.5 19.0 19.1
For further data queries on Citi’s full coverage universe please contact CIRA Data Services Asia Pacific ([email protected]) or +852-2501-2791
Investment Strategy
We rate Shriram Transport Buy/Medium Risk (1M). The following factors support our view: a) The turnaround in the Indian CV sales cycle (32% yoy new CV sales growth in Apr 09–Feb 10) and its linkage to the industrial production cycle (IP growth rose sharply to 16.7% yoy in Jan 10); b) Healthy demand for financing of used vehicles as CVs financed during the last growth cycle (FY03-07) come up for refinancing; c) Improving asset quality outlook for the industry as economic activity has picked up smartly and the prospects remain healthy (we estimate 8.4% GDP growth in FY11E); and d) A robust return profile for Shriram, with ROEs of 24-28% over FY10-12E.
Valuation
We value Shriram at Rs615 per share based on our EVA model, which captures the long-term value of the business and is a standard valuation measure for the CIRA India Banking coverage. Our EVA model assumes: a) a risk-free rate of 8% (in-line with current secondary market yields); b) longer term loan loss provisions of 200bps given the company's relatively higher asset risk profile; c) loan spreads of 800bps due to its relatively higher yielding asset profile; and d) long-term fee income growth of 10%. Our target price is also benchmarked off a 2.5x 1Yr Fwd P/BV, which is at the mid-point of our target multiples for private-sector banks (1.4-3.5x). We believe Shriram can trade towards the higher end of private banks during a strong economic growth and asset quality cycle due to its higher loan growth, superior ROE profile and relatively niche lending segment with high entry barriers for larger players.

India Investor Conference 2010 18 May 2010
Citigroup Global Markets 110
Largest and Most Leveraged to the Economy
Scale, capital and breadth of business raise economy leverage — SBI's breadth and scale of business – across assets, liabilities, financial services, market segments – makes it the most levered play to the Indian economy. While its higher risk appetite, closer government association and more aggressive pricing and growth could lead to some pressures, its leverage to a strong and up-swinging economy should be significant.
Deposit franchise has the mix, and the momentum — SBI's strategy and its execution has been most impressive on the liability side; there is strong growth momentum and market share gains, its deposit mix has been improving with CASA at an impressive 43%, and with an impressive technology and branch distribution roll out, deposit gains could well be a long term driving force.
Margin and asset quality strains; Reversal to averages needed — SBIs aggressive market share and presence gains have had its costs; margins are now lower than industry averages, asset quality also lags the industry. Both also remain below its normal levels. Management is focused on reverting to means; though given the breadth of SBI’s exposure, this will require a mix of improved loan-deposit pricing, and a more robust economic environment.
Broader exposure to the financial services — SBI is also the only Government bank which offers broader exposure to the financial services space; its strong presence in the Life Insurance business, AMC and capital markets. This broad-based presence – backed by a significant brand franchise, widening distribution and strong technology positions SBI strongly to capture the significant growth opportunity in the Indian markets, at the broadest level.
Statistical Abstract
Year Net profit EPS EPS Growth PE PB ROAE ROAA Div yieldMarch (Rs. M) Rs. (%) (x) (x) (%) (%) (%)FY08 67,291 116 34.7 19.7 2.9 17 1.0 0.9FY09 91,212 144 23.9 15.9 2.5 17 1.1 1.2FY10E 102,387 161 12.0 14.2 2.2 17 1.0 1.2FY11E 110,765 174 8.2 13.1 1.9 16 1.0 1.3FY12E 159,033 250 43.6 9.1 1.6 20 1.2 1.3
Source: Company data, Citi Investment Research and Analysis estimates
State Bank of India (SBI.BO)
Buy/Low Risk 1LPrice (11 May 10) Rs2,286.90Target Price Rs2,515.00Expected share price return 10.0%Expected dividend yield 1.3%Expected total return 11.3%Market Cap Rs1,451,913M US$32,197M
Price Performance
1200
1500
1800
2100
2400
May 09 Aug 09 Nov 09 Feb 10 May 10
INR
Source: dataCentral
Aditya Narain, CFA +91-22-6631-9879 [email protected] Manish Chowdhary, CFA +91-22-6631-9853 [email protected] Pooja Kapur [email protected]
Company description
SBI is India's largest bank with around 16% market share in deposits and loans, over 10,000 branches and more than 90m customers. Together with its seven associate banks (ownership ranging from 75% to 100%), the SBI group has more than 20% market share in deposits and loans, and has over 14,000 branches. SBI has the largest overseas presence among Indian banks, with 54 offices in 28 countries. The Government of India owns 59.73% of the bank. SBI is a banker to most state governments, and has a dominant share of government fee business.

India Investor Conference 2010 18 May 2010
Citigroup Global Markets 111
State Bank of India (SBI.BO): Financial Summary
2008 2009 2010E 2011E 2012E
Valuation RatiosP/E adjusted (x) 19.7 15.9 14.2 13.1 9.1P/E reported (x) 19.7 15.9 14.2 13.1 9.1P/BV (x) 2.9 2.5 2.2 1.9 1.6P/Adjusted BV diluted (x) 3.5 3.0 2.6 2.2 2.0Dividend yield (%) 0.9 1.3 1.3 1.3 1.4Per Share Data (Rs)EPS adjusted 116.24 144.05 161.27 174.47 250.49EPS reported 116.24 144.05 161.27 174.47 250.49BVPS 776.48 912.73 1,039.20 1,177.67 1,390.96Tangible BVPS 776.48 912.73 1,039.20 1,177.67 1,390.96Adjusted BVPS diluted 658.91 762.28 866.22 1,028.27 1,149.30DPS 21.50 29.00 29.00 30.00 31.00
Profit & Loss (RsM)Net interest income 170,212 208,730 235,988 283,404 334,092Fees and commissions 66,070 87,965 103,273 120,546 138,140Other operating Income 27,915 38,943 39,888 31,173 34,186Total operating income 264,197 335,638 379,149 435,124 506,418Total operating expenses -126,086 -156,486 -189,944 -212,150 -236,991Oper. profit bef. provisions 138,111 179,152 189,204 222,974 269,427Bad debt provisions -20,009 -24,750 -37,050 -57,023 -45,839Non-operating/exceptionals -13,712 -12,596 2,000 0 0Pre-tax profit 104,389 141,806 154,154 165,951 223,588Tax -37,098 -50,594 -51,767 -55,186 -64,555Extraord./Min. Int./Pref. Div. 0 0 0 0 0Attributable profit 67,291 91,212 102,387 110,765 159,033Adjusted earnings 67,291 91,212 102,387 110,765 159,033Growth Rates (%)EPS adjusted 34.7 23.9 12.0 8.2 43.6Oper. profit bef. prov. 29.8 29.7 5.6 17.8 20.8
Balance Sheet (RsM)Total assets 7,215,263 9,644,320 10,798,309 12,454,366 14,506,887Avg interest earning assets 6,101,618 8,026,789 9,854,418 11,259,163 13,098,790Customer loans 4,244,341 5,509,818 6,522,377 7,727,886 9,170,106Gross NPLs 128,373 155,893 187,340 185,617 229,985Liab. & shar. funds 7,215,263 9,644,320 10,798,309 12,454,366 14,506,887Total customer deposits 5,374,039 7,420,731 8,370,686 9,817,401 11,602,871Reserve for loan losses 76,659 84,786 103,190 121,192 112,788Shareholders' equity 490,327 579,477 659,770 747,679 883,094
Profitability/Solvency Ratios (%)ROE adjusted 16.8 17.1 16.5 15.7 19.5Net interest margin 2.8 2.6 2.4 2.5 2.6Cost/income ratio 47.7 46.6 50.1 48.8 46.8Cash cost/average assets 2.0 1.9 1.9 1.8 1.8NPLs/customer loans 3.0 2.8 2.9 2.4 2.5Reserve for loan losses/NPLs 59.7 54.4 55.1 65.3 49.0Bad debt prov./avg. cust. loans 0.5 0.5 0.6 0.8 0.5Loans/deposit ratio 79.0 74.2 77.9 78.7 79.0Tier 1 capital ratio 9.1 9.4 8.6 8.3 8.4Total capital ratio 13.5 14.3 12.7 12.2 11.9
For further data queries on Citi’s full coverage universe please contact CIRA Data Services Asia Pacific ([email protected]) or +852-2501-2791
Investment Strategy
We rate SBI Buy/Low Risk (1L). SBI has aggressively restructured in terms of manpower, technology and business focus. It should be a significant beneficiary of the expected increase in loan demand in India, spread across the consumer sector and in the industrial segment. SBI has also invested aggressively in its technology platform, Financial Services ventures, its five subsidiary banks, and has aggressively restructured itself to lead and participate in the strong economic and business environment. We expect SBI to generate ROEs in the 15-17% level, and be more aggressive in leveraging capital that it is in the process of raising.
Valuation
Our target price of Rs2,515 is based on our EVA model, in which we assume a risk-free rate of 8.0%, in line with the market level. Our longer term loan loss assumption is 100bps pa. Our target price for SBI includes a subsidiary valuation of Rs672: Life Insurance at Rs207 per share, associate banks at 1.2x 1Yr Fwd PBV (Rs405), value for SBI's Asset management business (Rs23, 5% of assets) and incorporates capital markets subsidiary at Rs36 based on 10x 1Yr Fwd PE. We also use a sum of parts valuation which values SBI at Rs2,485 per share. In this valuation, we benchmark the parent off a 1.5x 1Yr Fwd P/BV, and factor in Rs672 for its subsidiary businesses. We base our target price on EVA, as we believe it better adjusts for the relatively dynamic cost of capital and better captures the long-term value of the business.

India Investor Conference 2010 18 May 2010
Citigroup Global Markets 112
Levered to Power and Telecom Capex
Global player in both the verticals — Sterlite Technologies is a global provider of transmission solutions for the telecom and power verticals with revenue of US$540m and EBITDA of US$90m in FY10. Revenue mix is 63% power and 37% telecom, although EBITDA is split equally. It currently has an order book of US$550m, although it consists primarily of longer tender based power orders.
Telecom business — Includes optical fiber and telecom cables with capacity of 12m km of fiber (currently 5th globally) and the company targets to ramp up capacity to 20m km fiber by FY12. The telecom segment generated US$201m revenues with US$44m EBITDA in FY10. Sterlite has a 45% share in this segment in India, 8% share in Africa, and 7% in China. The geographical mix is dominated towards India which accounts for 63% of revenues followed by China (19%) and ME (7%).
Robust fundamentals for telecom — The primary demand for fiber in India is expected to come from the wireless backhaul connectivity i.e. connecting each cell site to the backend through fiber v/s microwave in order to increase capacity. We estimate that only ~10% of industry’s ~300k towers are currently connected to the BSC via fiber. While intra-city fiber for B’band/enterprise connectivity would help, WiMax launch could dampen demand for the last mile connectivity.
Power business — Includes bare overhead transmission conductors with 160k MT capacity and the company targets to ramp up capacity to 200k MT by FY11. India constitutes 85% of the overall revenues followed by Africa (8%) and Middle East (5%). Sterlite has a 25% share in India and 14% in Africa.
Power capex expected to continue — Major investments are underway into grid infrastructure as the T&D capacity added in the past has been much lower than the generation capacity (50%). The Government has target of US$85bn in the 11th plan for the T&D spend (conductor spend accounts for 10% of generation capex).
_______________________________________________________________
_______________________________________________________________
_______________________________________________________________
_______________________________________________________________
_______________________________________________________________
_______________________________________________________________
_______________________________________________________________
Sterlite Technologies (STTE.BO)
Non-Rated Price (11 May 10) Rs.96.25 Market Cap Rs34,219M US$759M
Price Performance (STTE.BO)
020406080
100120
12 May 12 Sep 12 Jan 12 May
INR
Source: dataCentral
Rahul Singh +91-22-6631-9863 [email protected]
Company Description
Sterlite Technologies is a leading global provider of transmission solutions for the power and telecom industries. It is among the top three global manufacturers of power conductors and among the top five global manufacturers of optical fibers and cables. It was formed by the demerger of the erstwhile telecom division of Sterlite Industries (India) with effect from 1 July 2000 to enable a sharper focus on each of the businesses. Sterlite Optical Technologies subsequently acquired Sterlite Industries’ power transmission business in 2006. Anil Agarwal is the promoter with a 50% stake.

India Investor Conference 2010 18 May 2010
Citigroup Global Markets 113
Sterlite Technologies (STTE.BO): Financial Summary
Fiscal year end FY06 FY07 FY08 FY09
Valuation RatiosP/E adjusted (x) NM 85.0 30.7 35.2P/E reported (x) NM 85.0 30.7 35.2P/BV (x) 10.3 8.7 5.9 5.2Dividend yield (%) 0.0 0.1 0.2 0.3Per Share Data (Local Currency)EPS adjusted 0.07 1.16 3.21 2.80EPS reported 0.07 1.16 3.21 2.80BVPS 9.60 11.28 16.74 19.09NAVps ordinary 9.60 11.28 16.74 19.09DPS 0.00 0.10 0.20 0.25
Profit & Loss (Local Currency, Millions)Net operating income (NOI) 3,542 5,713 16,858 22,892G&A expenses -3,448 -5,431 -15,160 -20,967Other Operating items 0 0 0 0EBIT including associates 94 472 1,698 1,925Non-oper./net int./except. -74 -180 -394 -478Pre-tax profit 20 291 1,303 1,099Tax 1 33 -297 -193Extraord./Min. Int./Pref. Div. 0 0 0 -2Reported net income 21 325 1,007 905Adjusted earnings 21 325 1,007 905Adjusted EBIT 94 472 1,698 1,925Adjusted EBITDAGrowth Rates (%)NOI 269.6 61.3 195.1 35.8EBIT adjusted -111.8 400.0 259.9 13.4EPS adjusted -105.6 1,476.0 177.1 -12.7
Cash Flow (Local Currency, Millions)Operating cash flow 347 -490 212 4,015Depreciation/amortization 347 335 372 404Net working capital -27 -970 -1,415 2,383Investing cash flow -85 -561 -1,342 -2,237Capital expenditure -92 -55 -1,206 -1,451Acquisitions/disposals -510 -746 -1,002 -787Financing cash flow -100 1,454 1,021 -1,782Borrowings NA 1,118 NA -1,702Dividends paid 0 0 -53 -80Change in cash 162 404 -109 -5
Balance Sheet (Local Currency, Millions)Total assets 6,491 8,008 15,650 16,769Cash & cash equivalent 171 1,067 925 1,740Net fixed assets 3,498 3,208 5,594 6,561Total liabilities 3,802 4,691 10,231 10,583Total Debt 1,689 3,019 6,437 5,034Shareholders' funds 2,689 3,316 5,419 6,186
Profitability/Solvency RatiosEBIT margin adjusted (%) 2.7 8.3 10.1 8.4ROE adjusted (%) 0.8 10.8 NA 15.7ROA adjusted (%) 0.3 4.5 NA 5.6Net debt to equity (%) 56.4 58.9 101.7 53.3Interest coverage (x) -136.7 -14.1 5.7 10.0
Source: Bloomberg
Recent Developments
Sterlite plans to build an east-west interconnection transmission project costing US$173m. It plans to invest Rs3.1bn by FY12 to expand capacity in both the fiber optic and power segments.

India Investor Conference 2010 18 May 2010
Citigroup Global Markets 114
Strong Franchise
Robust Business — We expect Sun's strong Indian franchise, niche US biz and improving visibility on its patent challenge pipeline to drive long-term growth. Its strong balance sheet, good return ratios & high cash generation should hold it in good stead & support premium valuations. We believe that the FDA issues are well understood and estimates/valuations now reflect most negatives.
Strong Domestic Franchise — Sales from India account for c57% of Sun's recurring sales. Sun’s dominance in chronic segments is a key strength, leading to superior growth & profitability vis-à-vis its peers. We expect Sun to be a key beneficiary of rising growth rates & changing disease mix in India. Besides, the high proportion of sales from India limits Sun’s exposure to rupee appreciation as compared to most of its peers.
Progress at Caraco — Caraco has submitted a work plan to the FDA in Oct 09 and provided some additional details & clarifications on Jan 10. Post implementation of the plan, the FDA would likely reinspect the plant and, if satisfied, allow Caraco to resume manufacturing & sales from the facility. In the meanwhile, it has transferred some products to alternate manufacturing sites in a bid to resume marketing these even as it addresses the issues at the plant. Sun however indicated that it is difficult to provide a timeline for resolution.
Key catalysts/Things to Watch Out For — (1) Progress /resolution on Taro acquisition in Israel; (2) Court verdict on the Protonix patent litigation against Pfizer; (3) Potential launch of Effexor-XR in the US with some period of exclusivity; (4) Resolution of FDA issues at Caraco should also boost the stock, though this could take some time.
Statistical Abstract
Year to Net Profit Diluted EPS EPS growth EV/EBITDA P/E P/B P/CEPS ROE Yield31 Mar (RsM) (Rs) (%) (x) (x) (x) (x) (%) (%)2008A 9,895 47.8 na 20.6 32.6 6.5 20.4 na 0.72009A 12,431 60.0 25.6 16.5 26.0 4.6 16.6 30.2 0.92010E 13,052 63.0 5.0 18.6 24.7 3.8 18.1 21.1 0.82011E 15,782 76.2 20.9 20.9 20.5 3.3 18.6 17.4 0.82012E 18,557 89.6 17.6 17.5 17.4 2.9 15.9 17.7 0.9
Source: dataCentral
Sun Pharmaceuticals (SUN.BO)
Buy/Low Risk 1L Price (11 May 10) Rs1,534.05 Target Price Rs1,600.00 Expected share price return 4.3% Expected dividend yield 0.8% Expected total return 5.1% Market Cap Rs317,727M US$7,046M
Price Performance
800100012001400160018002000
May 09 Aug 09 Nov 09 Feb 10 May 10
INR
Source: dataCentral
Prashant Nair, CFA +91-22-6631-9855 [email protected] Akshay Rai [email protected]
Company description
Sun Pharma is one of the fastest-growing companies in India's domestic pharmaceutical market, growing at about 2x the industry rate. It has followed a strategy of being the first to enter niche, high-growth segments (both organic and through acquisitions). It has a presence in the CNS, pain management, ophthalmology, cardiovascular and respiratory segments. Sun is facing stiff competition in its traditional strongholds, but has managed to sustain growth and is focusing on new therapeutic areas. Sun is looking to export its top formulation products to drive growth, and has set up marketing and distribution infrastructure in various markets. It is also filing for ANDA approvals through its US subsidiary Caraco and is looking to conclude its second key acquisition in the US (Taro Pharma).

India Investor Conference 2010 18 May 2010
Citigroup Global Markets 115
Sun Pharmaceuticals (SUN.BO): Financial Summary
Fiscal year end 31-Mar 2008 2009 2010E 2011E 2012E
Valuation RatiosP/E adjusted (x) 32.1 25.6 24.3 20.1 17.1EV/EBITDA adjusted (x) 19.8 15.8 17.4 18.2 14.7P/BV (x) 6.4 4.5 3.8 3.3 2.8Dividend yield (%) 0.7 0.9 0.8 0.8 0.9Per Share Data (Rs)EPS adjusted 47.78 60.02 63.02 76.20 89.60EPS reported 71.80 87.77 78.81 76.20 89.60BVPS 241.02 340.17 405.31 468.21 542.17DPS 10.50 13.75 12.15 11.82 13.91
Profit & Loss (RsM)Net sales 33,565 42,723 42,398 45,084 52,976Operating expenses -19,022 -25,316 -27,675 -31,708 -36,696EBIT 14,543 17,407 14,723 13,376 16,280Net interest expense 1,146 1,217 1,792 2,461 2,750Non-operating/exceptionals 305 868 1,184 1,167 978Pre-tax profit 15,994 19,492 17,699 17,005 20,008Tax -485 -712 -926 -680 -800Extraord./Min.Int./Pref.div. -640 -603 -452 -543 -651Reported net income 14,869 18,177 16,321 15,782 18,557Adjusted earnings 9,895 12,431 13,052 15,782 18,557Adjusted EBITDA 15,512 18,640 16,213 14,987 18,002Growth Rates (%)Sales 57.3 27.3 -0.8 6.3 17.5EBIT adjusted 145.4 19.7 -15.4 -9.1 21.7EBITDA adjusted 130.2 20.2 -13.0 -7.6 20.1EPS adjusted 26.2 25.6 5.0 20.9 17.6
Cash Flow (RsM)Operating cash flow 5,048 18,828 15,145 11,488 13,849Depreciation/amortization 969 1,233 1,490 1,611 1,722Net working capital -9,340 31 -1,326 -3,986 -4,331Investing cash flow -6,060 -15,919 -23,613 -10,539 -250Capital expenditure -1,995 -6,101 -4,000 -3,000 -3,000Acquisitions/disposals -5,242 -11,035 -21,405 -10,000 0Financing cash flow 661 -2,862 -4,619 -2,755 -3,241Borrowings 768 353 -1,789 0 0Dividends paid -18 -3,215 -2,831 -2,755 -3,241Change in cash -352 1,570 -13,087 -1,806 10,357
Balance Sheet (RsM)Total assets 59,701 81,407 93,503 107,629 124,808Cash & cash equivalent 17,290 23,235 10,148 8,342 18,699Accounts receivable 14,177 8,811 9,622 11,449 13,445Net fixed assets 11,040 16,196 18,706 20,096 21,374Total liabilities 7,901 8,987 7,140 7,696 8,909Accounts payable 3,722 3,767 4,211 4,843 5,570Total Debt 1,436 1,789 0 0 0Shareholders' funds 51,800 72,420 86,363 99,932 115,899
Profitability/Solvency Ratios (%)EBITDA margin adjusted 46.2 43.6 38.2 33.2 34.0ROE adjusted 25.5 20.7 16.9 17.4 17.7ROIC adjusted 49.1 46.2 33.8 27.9 30.4Net debt to equity -30.6 -29.6 -11.8 -8.3 -16.1Total debt to capital 2.7 2.4 0.0 0.0 0.0
For further data queries on Citi’s full coverage universe please contact CIRA Data Services Asia Pacific ([email protected]) or +852-2501-2791
Investment Strategy
We rate Sun Pharma shares Buy / Low Risk (1L), with a target price of Rs1,600. We expect Sun's strong Indian franchise, niche US biz and improving visibility on its patent challenge pipeline to drive steady long-term growth. Our earlier downgrade was on the back of several concerns related to FDA issues at the company's US plant and lack of visibility on core v/s non-core earnings. The stock has underperformed the Sensex/ CIR India Pharma by 7%/13% since the escalation of FDA issues at Caraco. The impact of the same is now built into estimates, and we have more clarity on sustainable earnings (two of the key concerns behind our downgrade). We believe valuations now reflect most negatives and risk/reward is favorable - leading us to our positive view.
Valuation
Our target price of Rs1,600 is based on a sum-of-the-parts approach, valuing its base business using a P/E and ascribing an option value for its patent challenge pipeline. We value frontline pharma stocks such as Cipla and Piramal Healthcare at 18x 12m forward earnings. However, we believe Sun deserves a premium to these stocks, given its consistent track record, high profitability and return rations, as well as the potential upside from the deployment of idle cash in the business, and consequently value it at 20x 12-month forward earnings. At 20x March-2011E EPS we arrive at a value of Rs1,540/share for Sun's core business. We also ascribe an option value of Rs60/sh to Sun's patent challenge pipeline.

India Investor Conference 2010 18 May 2010
Citigroup Global Markets 116
Sustained Growth Momentum the Key Challenge
FY11 revenue growth — Infosys’ guidance of 16-18% revenue growth (US$-terms) has already set the baseline for the sector. With analysts/investors expectations at 20%-plus YoY growth – key question for management would be how high can revenues grow in FY11?
BFSI outlook — TCS has been a big beneficiary of the return of spends in the BFSI space. Given the maturity of clients in this space and the large exposure of TCS, management expectations from this vertical could be explored.
Outlook on margins — Management aspires to maintain EBIT margins at ~27% levels. With INR appreciation and attrition worries (company gave salary hikes in Apr’10), the levers available could be discussed.
Return of pricing power — With the return in demand, pricing discounts seem to be a thing of the past. However, with increased attrition, vendors are grappling with salary hikes across the board. Pricing is one of the key levers available to companies in order to manage their margins. A key question would be the timing of the return of pricing power for vendors.
Supply side dynamics — Company’s view on supply side dynamics should be another area to discuss with focus on following – (1) availability of talent (engineers) for next few years; (2) company’s initiatives on training (3) right-skilling initiative – hiring of science graduates.
Mergers & Acquisitions — TCS has been active in the M&A space in the past. Whether the management perceives any gaps in the services/industry/geographical portfolio and corresponding inorganic activity could be discussed.
SEZ strategy — TCS’ SEZ readiness, given the expectation of STPI sunset clause coming into effect by Apr’11 should be discussed. Expectations of the tax rate in FY11/12E etc. could be gauged.
Statistical Abstract
Year to Net Profit Diluted EPS EPS growth EV/EBITDA P/E P/B P/CEPS ROE Yield31 Mar (RsM) (Rs) (%) (x) (x) (x) (x) (%) (%)2009A 51,721 26.4 na 20.5 28.6 9.4 25.7 na 0.92010A 68,729 35.1 32.9 17.0 21.5 7.1 19.5 37.6 2.62011E 75,873 38.8 10.4 15.2 19.5 5.6 17.4 32.2 1.52012E 83,494 42.7 10.0 12.7 17.7 4.6 15.8 28.5 1.52013E 93,790 47.9 12.3 11.1 15.8 3.7 14.1 26.1 1.5
Source: Powered by dataCentral
Tata Consultancy Services (TCS.BO)
Hold/Low Risk 2LPrice (11 May 10) Rs755.20Target Price Rs855.00Expected share price return 13.2%Expected dividend yield 1.5%Expected total return 14.7%Market Cap Rs1,478,093M US$32,956M
Price Performance
0
200
400
600
800
1000
May 09 Aug 09 Nov 09 Feb 10 May 10
INR
Source: dataCentral
Surendra Goyal, CFA1 +91-22-6631-9870 [email protected]
Vishal Agarwal1 +91-22-6616-2742 [email protected]
Company description
TCS is the largest and among the oldest IT companies in India. It is a part of the diversified Tata Group, one of the largest corporate groups in Asia, with more than 160,000 employees, including subsidiaries. It provides a comprehensive range of IT services to industries such as Banking & Financial Services, Insurance, Manufacturing, Telecom, Retail and Transportation. It has more than 900 active clients. The company started with data processing work in 1968, and was the first to provide offshore services in 1974. Over the past three decades, it has come a long way with deep technical and project management expertise in handling complex client projects and strong offshore processes.

India Investor Conference 2010 18 May 2010
Citigroup Global Markets 117
Tata Consultancy Services (TCS.BO): Financial Summary
Fiscal year end 31-Mar 2009 2010 2011E 2012E 2013E
Valuation RatiosP/E adjusted (x) 28.6 21.5 19.5 17.7 15.8EV/EBITDA adjusted (x) 20.2 16.7 14.5 12.2 10.5P/BV (x) 9.4 7.1 5.6 4.6 3.7Dividend yield (%) 0.9 2.6 1.5 1.5 1.5Per Share Data (Rs)EPS adjusted 26.42 35.11 38.76 42.65 47.91EPS reported 26.42 35.11 38.76 42.65 47.91BVPS 79.97 107.03 133.78 165.43 202.34DPS 7.00 20.00 11.00 11.00 11.00
Profit & Loss (RsM)Net sales 278,129 300,289 339,987 396,181 451,037Operating expenses -212,114 -220,698 -252,083 -295,450 -338,734EBIT 66,015 79,591 87,904 100,731 112,303Net interest expense -4,673 2,255 3,845 8,673 12,298Non-operating/exceptionals -6 -10 0 0 0Pre-tax profit 61,336 81,836 91,749 109,404 124,601Tax -9,011 -12,089 -15,076 -25,110 -30,011Extraord./Min.Int./Pref.div. -604 -1,018 -800 -800 -800Reported net income 51,721 68,729 75,873 83,494 93,790Adjusted earnings 51,721 68,729 75,873 83,494 93,790Adjusted EBITDA 71,781 86,800 96,904 110,918 123,579Growth Rates (%)Sales 21.7 8.0 13.2 16.5 13.8EBIT adjusted 23.0 20.6 10.4 14.6 11.5EBITDA adjusted 20.9 20.9 11.6 14.5 11.4EPS adjusted 3.0 32.9 10.4 10.0 12.3
Cash Flow (RsM)Operating cash flow 71,458 30,303 101,333 75,975 83,968Depreciation/amortization 5,766 7,209 9,000 10,188 11,276Net working capital 8,694 -44,398 19,505 -9,834 -9,600Investing cash flow -12,673 -53,876 -33,347 -16,654 -10,037Capital expenditure -7,495 -11,421 -20,519 -17,000 -17,317Acquisitions/disposals 11,907 -16,382 3,845 8,673 12,298Financing cash flow -18,995 -14,183 -23,512 -21,533 -21,533Borrowings -1,788 621 0 0 0Dividends paid -13,703 -39,151 -21,533 -21,533 -21,533Change in cash 39,791 -37,756 44,474 37,787 52,399
Balance Sheet (RsM)Total assets 226,858 274,546 340,637 413,275 495,955Cash & cash equivalent 13,440 10,249 70,596 115,911 172,528Accounts receivable 60,463 58,098 78,197 91,122 103,739Net fixed assets 37,494 41,706 53,225 60,038 66,078Total liabilities 67,215 60,978 74,707 85,384 95,807Accounts payable 0 0 0 0 0Total Debt 7,913 3,417 3,383 3,383 3,383Shareholders' funds 159,643 213,568 265,929 327,891 400,148
Profitability/Solvency Ratios (%)EBITDA margin adjusted 25.8 28.9 28.5 28.0 27.4ROE adjusted 37.0 37.6 32.2 28.5 26.1ROIC adjusted 49.1 42.8 42.4 43.0 42.8Net debt to equity -3.5 -3.2 -25.3 -34.3 -42.3Total debt to capital 4.7 1.6 1.3 1.0 0.8
For further data queries on Citi’s full coverage universe please contact CIRA Data Services Asia Pacific ([email protected]) or +852-2501-2791
Investment Strategy
We rate TCS Hold/Low Risk (2L). The stock has outperformed the Indian markets by more than 100% since the beginning of 2009. The company has benefitted significantly from the return of spends in the BFSI segment and we are worried that this might taper off. We may see good growth in FY11 due to pent up demand, however, we are concerned that expectations are running ahead of reality. Its earlier valuation discount vs. Infosys has virtually ceased to exist.
Valuation
Our target price of Rs855 is based on 21x the average of FY11E-12E EPS. Given that businesses are bottoming and we estimate TCS' earnings will grow at an ~11% CAGR over FY10E-13E, we believe the stock should trade closer to the higher end of its historical three-year trading range of 7-27x 12-month forward earnings. We believe P/E remains the most appropriate valuation measure given TCS' past profitability and future earnings visibility.

India Investor Conference 2010 18 May 2010
Citigroup Global Markets 118
Domestic Business and JLR Well Positioned
MHCVs and LCVs drive domestic business — The macro outlook in India for MHCVs appears relatively healthy, for now. Freight rates (spot market) have risen by ~8-10%, whilst contractual rates are expected to be revised upward to offset fuel cost hikes The LCV segment also benefits from overall economic growth and last – mile – demand. TTMT has a market share of ~ 60% in this segment – driven primarily by the ACE and its 207/407 range of products.
A3 segment encouraging in Passenger Vehicles — TTMT's market share in the A2 segment remains fairly lackluster, averaging around 10% (vs ~12.5% in FY09). We don’t expect this to meaningfully change, given impending competition within the segment. Within A3 however, the Indigo Manza's acceptance is encouraging, improving TTMT's market share in this segment has to ~24-26%, far better than the 16% it averaged in 1HFY10, and superior to the 1HFY09 avg of 22%. We think TTMT's gains within A3 segment are sustainable, with no new launch expected from key competitor Hyundai in FY11.
Cost pressure outlook is mixed, reflecting global uncertainties — We estimate 230bps margin compression in the parent business (EBITDA forecast at 10.5% in FY11), primarily on account of a) excise rate hike, and b) cost pressures, primarily rubber. The outlook on steel costs has markedly improved after China has begun to clamp down on the property sector. We note there could be upside risk to our estimates, especially in 2H as contractual steel prices are revised downward with a lag. Operating leverage benefits in areas like a) SGA, b) power and fuel, & c) freight expenses could also provide upside surprises.
JLR: product mix could positively surprise, macro overhangs continue — The launch of the new XJ in May – and the consequent uptick in mix and profitability has yet to be fully priced in. We forecast ~20,000 units of XJ sales in FY11. Directionally, we are sanguine on metal costs / vehicle as we note that with a blended realization exceeding £30,000 per vehicle, the metal cost / or unit is probably ~2-3% of selling price. Deteriorating consumer confidence in the Eurozone on account of sovereign risks emanating from Portugal, Italy, Greece and Spain are a macro risk that cannot be wished away – that said, per JD Power estimates, these 4 countries accounted for ~20% of LR and ~7% of J sales in pan - Europe (including Russia and UK) in CY09.
Capital structure: Deleveraging underway, more required — We forecast gross debt-equity to decline to ~2.8x (end FY10) from 5.9x (end FY09). This reflects a) recent bond conversion (around $345m); b) ~Rs10-11bn on value unlocking in Telcon; and c) ~$520m raised through GDS. Embedded risks in TTMT's balance sheet stem are net worth fluctuations on account of FX translations and economic gains / losses on account of the pension liabilities / assets.
Statistical Abstract
Year to Net Profit Diluted EPS EPS growth EV/EBITDA P/E P/B P/CEPS ROE Yield31 Mar (RsM) (Rs) (%) (x) (x) (x) (x) (%) (%)2008A 15,561 36.5 na 14.2 21.9 3.9 12.4 na 1.92009A 9,042 17.6 -51.8 23.4 45.5 3.4 21.9 10.0 0.82010E 31,102 54.5 210.0 6.3 14.7 4.5 6.6 27.7 1.12011E 48,865 85.7 57.1 5.8 9.3 3.1 5.3 39.5 1.12012E 59,856 104.9 22.5 5.2 7.6 2.3 4.5 34.9 1.5
Source: Company Reports and CIRA Estimates
Note – Above data is for TTMT parent operations till FY09 and for consolidated operations for FY10-12
Tata Motors (TAMO.BO)
Buy/Medium Risk 1MPrice (11 May 10) Rs799.50Target Price Rs947.00Expected share price return 18.4%Expected dividend yield 1.1%Expected total return 19.6%Market Cap Rs418,638M US$9,283M
Price Performance
200
400
600
800
May 09 Aug 09 Nov 09 Feb 10 May 10
INR
Source: dataCentral
Jamshed Dadabhoy +91-22-6631-9883 [email protected] Arvind Sharma +91-22-6631-9852 [email protected]
Company description
Tata Motors is India’s largest truck company with 63%/59% market share in heavy / light trucks respectively. It has a presence in the passenger car space straddling the A1-A3 segments. The company has acquired a 100% stake in Jaguar and Land Rover, which we estimate will account for ~54% of FY10E consolidated revenues.

India Investor Conference 2010 18 May 2010
Citigroup Global Markets 119
Tata Motors (TAMO.BO): Financial Summary
Fiscal year end 31-Mar 2008 2009 2010E 2011E 2012E
Valuation RatiosP/E adjusted (x) 21.9 45.5 14.7 9.3 7.6EV/EBITDA adjusted (x) 15.2 23.9 7.6 6.9 6.2P/BV (x) 3.9 3.4 4.5 3.1 2.3Dividend yield (%) 1.9 0.8 1.1 1.1 1.5Per Share Data (Rs)EPS adjusted 36.53 17.59 54.53 85.68 104.95EPS reported 47.63 19.48 54.53 85.68 104.95BVPS 203.34 237.92 179.13 255.00 346.72DPS 15.00 6.06 8.96 8.83 11.91
Profit & Loss (RsM)Net sales 283,776 256,297 883,678 1,001,584 1,126,593Operating expenses -264,468 -248,030 -844,415 -926,266 -1,039,021EBIT 19,308 8,267 39,263 75,318 87,572Net interest expense -2,824 -6,737 -19,297 -19,779 -20,608Non-operating/exceptionals 9,281 8,607 18,731 870 2,596Pre-tax profit 25,765 10,138 38,698 56,409 69,560Tax -5,476 -125 -7,838 -8,369 -10,910Extraord./Min.Int./Pref.div. 0 0 242 825 1,207Reported net income 20,289 10,013 31,102 48,865 59,856Adjusted earnings 15,561 9,042 31,102 48,865 59,856Adjusted EBITDA 26,475 17,013 77,020 113,160 128,627Growth Rates (%)Sales 4.0 -9.7 244.8 13.3 12.5EBIT adjusted -21.6 -57.2 374.9 91.8 16.3EBITDA adjusted -15.6 -35.7 352.7 46.9 13.7EPS adjusted -16.1 -51.8 210.0 57.1 22.5
Cash Flow (RsM)Operating cash flow 69,655 12,468 99,972 51,189 58,757Depreciation/amortization 7,167 8,745 37,757 37,842 41,055Net working capital 46,275 -3,844 31,112 -35,518 -42,154Investing cash flow -72,076 -130,794 -72,476 -66,399 -66,398Capital expenditure -47,744 -50,216 -72,476 -66,400 -66,400Acquisitions/disposals 0 0 0 1 2Financing cash flow 12,122 104,386 -69,016 14,386 6,436Borrowings 22,714 68,850 -60,607 19,979 13,979Dividends paid -6,597 -3,457 0 0 0Change in cash 15,706 -12,555 -21,456 -823 -1,203
Balance Sheet (RsM)Total assets 257,524 372,612 735,898 792,148 845,465Cash & cash equivalent 23,973 11,418 20,000 20,000 20,000Accounts receivable 11,307 15,552 53,097 61,155 68,636Net fixed assets 104,523 145,993 392,052 420,610 445,955Total liabilities 179,129 250,310 629,488 641,639 641,435Accounts payable 83,917 87,313 245,095 236,862 220,729Total Debt 38,805 111,656 289,131 309,110 323,089Shareholders' funds 78,395 122,302 106,437 150,535 204,055
Profitability/Solvency Ratios (%)EBITDA margin adjusted 9.3 6.6 8.7 11.3 11.4ROE adjusted 21.2 9.0 27.7 39.5 34.9ROIC adjusted 14.2 6.8 10.5 13.6 13.8Net debt to equity 18.9 82.0 252.9 192.1 148.5Total debt to capital 33.1 47.7 73.1 67.2 61.3
For further data queries on Citi’s full coverage universe please contact CIRA Data Services Asia Pacific ([email protected]) or +852-2501-2791
Investment Strategy
We rate Tata Motors shares Buy / Medium Risk (1M). From a thematic stance, TAMO is a key beneficiary of a revival in the domestic investment cycle (the value ascribed to the domestic business exceeds the value ascribed to JLR). Our view is predicated on: 1) a bottoming out of the global macro-economic environment which should result in premium car / SUV sales registering modest growth in FY11/12E; 2) stable liquidity and credit conditions should ensure that TTMT is able to secure funding for its businesses and refinancing of its debt (essential given its high level of indebtedness); 3) increasing clarity on JLR financials would remove the overhang on the share price and could even result in a further re-rating.
Valuation
Our Rs947 target price for Tata Motors is based on a sum-of-the-parts valuation. We value Tata Motors' core business at Rs759/share (on a diluted share count of 570m shares), based on 9x Sep 11E EV/EBITDA. We value subsidiaries and investments at Rs83/share (incorporating a 20% holding company discount). We attribute around Rs104/share to JLR - we value this at 4.5x Sep 11E EV/EBITDA, which equates to around Rs492/share and then deduct the total net debt which amounts to around Rs388/share. At our target price, TTMT would trade at a consolidated price-to-book value of 3.7x / 2.7x (FY11/12E), which appears reasonable when juxtaposed against ROEs of 39.5%, 34.9% in FY11E/12E respectively. On a P/E basis, the stock would trade at ~11x and 9x FY11E/12E P/E.

India Investor Conference 2010 18 May 2010
Citigroup Global Markets 120
A Tale of Two Markets
Indian business is resilient — In India, TSL is among the lowest cost producers as it has 100% captive iron ore and 50% captive coking coal. The price hikes (HRC ~17% since Dec 09) should help raise EBITDA/t rise from $325 in FY10 to $420 in FY11. Volume growth should be 9% in FY11 and 7% in FY12. Indian capacity will be enhanced 44% to 9.8mtpa by 3Q FY12.
Steel view — We expect HRC prices to average $825/t in FY11 vs current $790/t, to partly compensate for the expected rise in coal prices through FY11. Global iron ore prices are at $160/t but expected to average $130/t in FY11. Our FY12 estimate: HRC $800/t, iron ore $120/t, coking coal $225/t. We thus believe that there is downside risk to iron ore vs. steel, while coking coal should rise before coming off.
Tata Steel expects further improvement at Tata Steel Europe (TSE) — 3Q EBITDA/t was $38/t. Management is positive on TSE as it expects further savings from Supply Chain Transformation (annual benefits of $100m), mothballing of Teesside and lower staff costs (loss of 1,600 jobs) and benefits from ongoing rationalization and restructuring. They remain cautious on the construction sector. Recent economic uncertainty in Europe and FX trends has led us to be more cautious due to the possibility of price rollbacks, FX translation losses and pressure on utilization levels.
Greenfield expansion — TSL is in the process of rehabilitating and resettling the inhabitants at Orissa and is hopeful of starting construction work by year-end. Capex on the first phase (3mtpa) is expected to be $4.2bn and is expected to be commissioned by 2014 (~40 months from commencement).
Raw material integration for TSE — TSL has formed a coking coal JV (35%) with Riversdale Mining, Australia− with offtake rights to 40%. Coking coal from these mines should be available in ~2 years at an estimated cost of $85/t. ~1mt should be available in the first year and eventually be ramped up to ~1.7mt (of which TSL should get 40%). Iron ore from the New Millennium project in Canada is expected in ~2 years at a cost of ~$45/t. 1.5-2mt to be available in the first year and ramped up to 4mt.
Focus on reducing leverage — Cons. gross debt as of Dec09 was $12.9bn and net debt $10.4bn; net D/E was 1.9x and net debt/EBITDA was ~5.5x (annualized). TSL aims to reduce the net debt to $9bn over the next 12-18 months through internal accruals/equity issue/sale of non-core assets. With an improvement in EBITDA, TSL hopes to reduce net debt/EBITDA to 3-3.5x.
Tata Steel (Consolidated) – Statistical Abstract
YE 31 Mar PAT PAT growth EPS EPS growth P/E EV/EBITDA ROE (Rs bn) (%) (Rs) (%) (x) (x) (%)FY07 41.8 12% 71.9 7% 8.1 5.7 29%FY08 75.8 82% 103.4 44% 5.6 5.0 36%FY09 79.0 4% 106.3 3% 5.5 5.0 18%FY10E -23.3 - (26.9) - - 12.9 -FY11E 54.7 - 61.7 - 9.4 6.2 17%FY12E 54.9 0% 61.9 0% 9.4 6.3 15%
Source: Company Reports and CIRA Estimates.
Note - FY10E PAT differs from the Financial Summary as the Financial Summary adjusts for preference dividend in PAT
calculations.
Tata Steel (TISC.BO)
Hold/Medium Risk 2MPrice (11 May 10) Rs581.85Target Price Rs590.00Expected share price return 1.4%Expected dividend yield 1.7%Expected total return 3.1%Market Cap Rs516,226M US$11,448M
Price Performance
200
300
400
500
600
700
May 09 Aug 09 Nov 09 Feb 10 May 10
INR
Source: dataCentral
Pradeep Mahtani +91-22-6631-9882 [email protected]
Raashi Chopra +91-22-6631-9862 [email protected]
Company description
Tata Steel Ltd (TSL) has a crude-steel capacity of 6.8mtpa, of which ~50% is rolled into flat products and the rest sold as long products. It sells ferro alloys, tubes, bearings and some mineral products. Corus, TSL's 100% subsidiary, is a Northern European Steel long and flat steel producer with around 17.3m tpa of crude steel capacity and production bases in the UK and the Netherlands. TSL has a presence in Asia through NatSteel (100%-owned) and Tata Steel Thailand (67.9%-owned). Adding the Asia-based capacities takes its total steel capacity to ~26mtpa. Of its steel capacity, 26% is in India, 66% in the UK/Europe and the rest in SE Asia. The crude steel capacity in India will likely be hiked by a further 44% to 9.8mtpa by 2011, taking India's share of total capacity to 34%.

India Investor Conference 2010 18 May 2010
Citigroup Global Markets 121
Tata Steel (TISC.BO): Financial Summary
Fiscal year end 31-Mar 2008 2009 2010E 2011E 2012E
Valuation RatiosP/E adjusted (x) 5.6 5.5 nm 9.4 9.4EV/EBITDA adjusted (x) 4.3 5.9 13.5 6.0 6.2P/BV (x) 1.5 1.9 1.9 1.6 1.4Dividend yield (%) 2.7 2.7 0.3 1.7 1.9Per Share Data (Rs)EPS adjusted 103.40 106.29 -26.87 61.69 61.87EPS reported 103.40 106.29 -26.87 61.69 61.87BVPS 392.75 304.35 310.99 360.98 409.98DPS 16.00 16.00 2.00 10.00 11.00
Profit & Loss (RsM)Net sales 1,315,336 1,473,293 1,023,655 1,199,471 1,189,270Operating expenses -1,174,123 -1,332,013 -993,461 -1,079,093 -1,071,684EBIT 141,213 141,280 30,194 120,378 117,586Net interest expense -40,854 -32,902 -31,501 -30,570 -34,878Non-operating/exceptionals 0 0 0 0 0Pre-tax profit 100,359 108,378 -1,308 89,808 82,709Tax -24,823 -30,440 -23,000 -35,923 -28,948Extraord./Min.Int./Pref.div. 25 -261 460 857 1,147Reported net income 75,561 77,676 -23,847 54,742 54,908Adjusted earnings 75,561 77,676 -23,847 54,742 54,908Adjusted EBITDA 182,583 183,933 75,811 166,927 169,372Growth Rates (%)Sales 421.7 12.0 -30.5 17.2 -0.9EBIT adjusted 110.0 0.0 -78.6 298.7 -2.3EBITDA adjusted 136.0 0.7 -58.8 120.2 1.5EPS adjusted 43.7 2.8 -125.3 329.6 0.3
Cash Flow (RsM)Operating cash flow 133,937 156,299 115,862 32,236 49,397Depreciation/amortization 41,370 42,654 45,617 46,550 51,786Net working capital -22,227 2,254 102,020 -73,385 -43,665Investing cash flow -461,985 -107,567 -56,609 -48,002 -35,851Capital expenditure -79,967 -83,608 -60,034 -54,253 -46,832Acquisitions/disposals -387,765 -30,074 0 0 0Financing cash flow 205,426 -27,540 -36,995 -64,095 -10,085Borrowings 170,072 20,521 -16,935 -31,449 35,175Dividends paid -9,478 -12,266 -13,306 -2,077 -10,383Change in cash -66,561 19,165 22,259 -79,861 3,461
Balance Sheet (RsM)Total assets 1,250,124 1,216,061 1,145,130 1,184,104 1,244,840Cash & cash equivalent 53,656 95,461 117,436 37,575 41,036Accounts receivable 186,978 130,316 78,527 115,018 130,331Net fixed assets 419,663 453,056 497,599 539,494 568,135Total liabilities 900,057 929,969 860,149 854,421 871,418Accounts payable 256,579 218,149 182,435 184,991 169,460Total Debt 536,247 599,005 582,070 550,621 585,796Shareholders' funds 350,067 286,092 284,981 329,683 373,422
Profitability/Solvency Ratios (%)EBITDA margin adjusted 13.9 12.5 7.4 13.9 14.2ROE adjusted 34.9 30.5 -9.6 18.4 16.1ROIC adjusted 22.3 13.1 0.9 10.4 9.8Net debt to equity 137.9 176.0 163.0 155.6 145.9Total debt to capital 60.5 67.7 67.1 62.5 61.1
For further data queries on Citi’s full coverage universe please contact CIRA Data Services Asia Pacific ([email protected]) or +852-2501-2791
Investment Strategy
We rate TSL Hold/Medium Risk (2M). TSL India's combination of raw material security, operating efficiencies, focus on high value products and branding helps it earn EBITDA margins >40%. Most of its capacity increases are in India where it should maintain raw material security (100% ore, 50- 55% coking coal). Volumes should grow in India by 9% in FY11. Domestic steel prices have been hiked since Dec09: flat products ~17-20% and longs ~ 14%. We base our estimates on an avg international steel price of $825/t in FY11 and $800/t in FY12 and assume that avg domestic prices for TSL will rise 12% in FY11 and fall 5% in FY12. Corus' EBITDA/t improved in 3Q to $38 due lower raw material costs, higher utilization (81%) and better prices. FY11 could be better, as prices have been raised in the past few months, but recent economic uncertainty in Europe and FX trends has led us to be more cautious than previously − possibility of price rollbacks, FX translation losses, pressure on utilization levels.
Valuation
We value TSL using SOTP. We use EV/EBITDA as our preferred valuation metric for TSL largely due to its high leverage. For TSL India, we use a target EV/EBITDA of 7x on June11 earnings. This is at a premium to the target multiple of 6.5x that we assign to JSW Steel's domestic business. We use a premium as TSL India earns a higher EBITDA margin, has better raw material integration and a better product mix. Corus and its other non-Indian businesses are valued at a 50% discount (3.5x EV/EBITDA) to TSL India to account for the higher levels of uncertainty in demand outlook outside of India. We arrive at our TP of Rs590. At our TP, TSL would trade at a June11 EV/EBITDA of 6.2x and P/E of 9.6x.

India Investor Conference 2010 18 May 2010
Citigroup Global Markets 122
Core Challenging; Satyam the Big Unknown
Status on core business — The best case scenario in the BT business is stable revenues going forward while the recent stake sale by AT&T raises questions about the future. The outlook on business thus remains challenging and could be a key discussion area for investors.
Understanding cross currency impact — Cross currency movements (especially EUR/GBP against USD) in the recent past have been unfavorable. TechM has 57% of revenues from Europe and consequently gets impacted negatively. Impact of cross currency movements on financials is another key issue to understand.
Focus on Satyam financials — There have been a lot of press on Satyam’s unknown financials. Though the revenues seem to be in the US$1-1.3b range, the margin expectation is all over the place. The timeline for audited numbers (by Jun’10 as of now) should be discussed.
Attrition of staff at Satyam — With the improvement in the macro and consequently the job market opening up, there could be significant attrition at Satyam. Management commentary on the same and the steps being taken to stem this should be understood.
SEZ strategy — TechM’s SEZ readiness, given the expectation of STPI sunset clause coming into effect by Apr’11 should be discussed. Expectations of the tax rate in FY11/12E etc. could be gauged.
Statistical Abstract
Year to Net Profit Diluted EPS EPS growth EV/EBITDA P/E P/B P/CEPS ROE Yield31 Mar (RsM) (Rs) (%) (x) (x) (x) (x) (%) (%)2008A 3,300 25.2 na 11.5 28.1 6.8 28.1 na 0.82009A 10,146 78.1 210.2 7.8 9.1 4.4 9.1 63.4 0.62010E 6,596 50.5 -35.3 7.8 14.0 3.3 14.0 29.0 0.02011E 7,640 58.3 15.4 10.2 12.1 2.6 12.1 25.9 0.62012E 8,110 61.9 6.2 8.8 11.4 2.2 11.4 22.1 0.8
Source: Powered by dataCentral
Tech Mahindra (TEML.BO)
Sell/Medium Risk 3MPrice (11 May 10) Rs708.20Target Price Rs900.00Expected share price return 27.1%Expected dividend yield 0.6%Expected total return 27.6%Market Cap Rs87,090M US$1,942M
Price Performance
0200400600800
10001200
May 09 Aug 09 Nov 09 Feb 10 May 10
INR
Source: dataCentral
Surendra Goyal, CFA1 +91-22-6631-9870 [email protected]
Vishal Agarwal1 +91-22-6616-2742 [email protected]
Company description
One of India's top 10 IT Services providers focusing on the telecom space, Tech Mahindra (TechM) services Telecom Service Providers (TSPs), Telecom Equipment Manufacturers (TEMs), Independent Software Vendors (ISVs) and Systems Integrators (SIs). It was formed in 1986 as a JV between M&M and British Telecom (BT). Key clients include BT, AT&T, Alcatel, Alltel, Convergys, Motorola, O2 and Vodafone. TechM is headquartered at Pune with development centers across India and a few centers in the UK. TechM is the only Indian player among the top 10 BSS vendors worldwide, as ranked by Gartner Dataquest.

India Investor Conference 2010 18 May 2010
Citigroup Global Markets 123
Tech Mahindra (TEML.BO): Financial Summary
Fiscal year end 31-Mar 2008 2009 2010E 2011E 2012E
Valuation RatiosP/E adjusted (x) 28.1 9.1 14.0 12.1 11.4EV/EBITDA adjusted (x) 11.5 7.4 7.5 7.0 5.9P/BV (x) 6.8 4.4 3.3 2.6 2.2Dividend yield (%) 0.8 0.6 0.0 0.6 0.8Per Share Data (Rs)EPS adjusted 25.19 78.14 50.52 58.29 61.88EPS reported 25.19 78.14 50.52 58.29 61.88BVPS 103.78 159.84 212.74 269.83 328.70DPS 5.50 4.00 0.00 4.00 6.00
Profit & Loss (RsM)Net sales 37,661 44,647 46,333 50,400 55,676Operating expenses -30,199 -33,592 -36,392 -40,456 -44,784EBIT 7,462 11,055 9,941 9,944 10,892Net interest expense 982 -403 -2,175 -1,012 -589Non-operating/exceptionals 0 0 0 0 0Pre-tax profit 8,444 10,652 7,767 8,932 10,303Tax -748 -1,179 -1,085 -1,292 -2,193Extraord./Min.Int./Pref.div. -4,396 673 -85 0 0Reported net income 3,300 10,146 6,596 7,640 8,110Adjusted earnings 3,300 10,146 6,596 7,640 8,110Adjusted EBITDA 7,462 11,055 9,941 9,944 10,892Growth Rates (%)Sales 28.6 18.5 3.8 8.8 10.5EBIT adjusted 8.9 48.2 -10.1 0.0 9.5EBITDA adjusted 8.9 48.2 -10.1 0.0 9.5EPS adjusted 156.6 210.2 -35.3 15.4 6.2
Cash Flow (RsM)Operating cash flow 281 12,606 -22,392 6,070 7,625Depreciation/amortization 0 0 0 0 0Net working capital -1,990 2,218 -28,851 -1,543 -470Investing cash flow -1,327 -1,999 -2,604 -2,035 -2,369Capital expenditure -2,371 -1,621 -2,741 -2,062 -2,384Acquisitions/disposals 0 0 0 0 0Financing cash flow 212 -3,585 14,442 -5,596 -5,894Borrowings 130 -300 14,442 -5,000 -5,000Dividends paid -818 -592 0 -596 -894Change in cash -834 7,022 -10,554 -1,561 -639
Balance Sheet (RsM)Total assets 22,251 28,432 50,776 52,706 55,977Cash & cash equivalent 1,609 9,728 447 246 1,082Accounts receivable 10,965 9,022 9,901 11,047 12,203Net fixed assets 5,996 6,520 7,988 8,690 9,599Total liabilities 9,568 8,888 24,635 19,522 15,577Accounts payable 0 0 0 0 0Total Debt 300 0 14,442 9,442 4,442Shareholders' funds 12,683 19,544 26,140 33,184 40,400
Profitability/Solvency Ratios (%)EBITDA margin adjusted 19.8 24.8 21.5 19.7 19.6ROE adjusted 30.3 63.4 29.0 25.9 22.1ROIC adjusted 69.9 93.2 84.5 70.6 61.8Net debt to equity -10.3 -49.8 53.5 27.7 8.3Total debt to capital 2.3 0.0 35.6 22.2 9.9
For further data queries on Citi’s full coverage universe please contact CIRA Data Services Asia Pacific ([email protected]) or +852-2501-2791
Investment Strategy
We rate TechM Sell/Medium Risk (3M) based on a fundamental 12-month view. With high exposure to the telecom domain, TechM is likely to be affected by deteriorating fundamental trends in the telecom vertical. Satyam acquisition will help in diversifying vertical exposure and add size; however, we still await Satyam's financials (expected in Jun'10). TechM is not really cheap on valuations, based on our analysis, considering its muted growth prospects.
Valuation
TechM's organic business still carries higher domain (telecom) and client concentration (BT) risk. Given the risks and challenges at BT, TechM will continue to struggle in the near term, in our view. The standalone business is valued at 8x Sep'11E EV/EBITDA, which is at a ~15% discount to more diversified players like HCLT. For Satyam, we use TechM's share of Satyam's Enterprise value based on the current market price of Satyam, given Satyam's financials are still awaited. We believe that this valuation measure is most appropriate as there are only limited disclosures for Satyam.

India Investor Conference 2010 18 May 2010
Citigroup Global Markets 124
Metamorphosis complete — Thermax’s recent foray into the supercritical space completes the metamorphosis from executing small-sized captive power plants to supercritical utility range of boilers. We believe that the business will significantly change and with its relatively small base compared to BHEL, incremental order inflows could significantly improve revenues and the earnings outlook.
Update on super-critical technology JV with Babcock and Wilcox — Thermax will own 51% in the JV. A new facility is being planned with a capacity of 3000MW. Thermax expects revenues of Rs30bn in sales in five years; the JV will have initial capitalization of Rs7.6bn and Thermax will invest Rs1.75bn as equity in the venture (from internal accruals) (Source: Bloomberg). The JV will bid for the upcoming 800MW NTPC orders
Current business outlook: Positive but peppered with caution — Outlook has definitely improved given improved liquidity. Customer enquiries and offtake has picked up. Most segments have returned to normal levels of investments - power generation, ferrous metals, cement, sugar, and refineries have shown pick up in investments. Textile & Hospitality segments are still lagging. Management however mentioned that one needs to watch out for impact of the European problems on the global economy. As of now, company expects a good order inflow growth in FY11E
Margin Outlook — Price competition has abated as most of the players have orders now compared to a year ago. However, pricing is still not at the peak of 2008 levels – is still off by about 200bps. Most of the orders are on a fixed price basis, but the company has provided for contingencies. Management believes that it can improve margins going forward unless steel prices increase.
Statistical Abstract
Year to Net Profit Diluted EPS EPS growth EV/EBITDA P/E P/B P/CEPS ROE Yield31 Mar (RsM) (Rs) (%) (x) (x) (x) (x) (%) (%)2008A 2,787 23.4 na 19.4 29.1 10.7 25.8 na 0.92009A 3,554 29.8 27.5 15.6 22.8 8.2 25.0 33.1 0.72010E 2,510 21.1 -29.4 20.2 32.3 8.1 69.4 7.6 0.72011E 3,835 32.2 52.8 13.5 21.1 6.3 18.8 33.5 0.92012E 4,693 39.4 22.4 10.6 17.3 4.9 15.6 31.8 1.2
Source: Company data, Citi Investment Research and Analysis estimates
Thermax (THMX.BO)
Buy/Medium Risk 1MPrice (11 May 10) Rs680.25Target Price Rs787.00Expected share price return 15.7%Expected dividend yield 0.7%Expected total return 16.4%Market Cap Rs81,056M US$1,797M
Price Performance
200
400
600
800
May 09 Aug 09 Nov 09 Feb 10 May 10
INR
Source: dataCentral
Deepal Delivala +91-22-6631-9857 [email protected]
Company description
Thermax specializes in energy and environment engineering solutions. It offers products and services in heating, cooling, waste heat recovery, captive power, water treatment and recycling, waste management and performance chemicals

India Investor Conference 2010 18 May 2010
Citigroup Global Markets 125
Thermax (THMX.BO): Financial Summary
Fiscal year end 31-Mar 2008 2009 2010E 2011E 2012E
Valuation RatiosP/E adjusted (x) 29.1 22.8 32.3 21.1 17.3EV/EBITDA adjusted (x) 18.3 14.8 20.4 13.3 10.4P/BV (x) 10.7 8.2 8.1 6.3 4.9Dividend yield (%) 0.9 0.7 0.7 0.9 1.2Per Share Data (Rs)EPS adjusted 23.39 29.82 21.06 32.18 39.39EPS reported 24.40 24.25 6.33 32.18 39.39BVPS 63.41 83.28 83.53 108.69 138.72DPS 6.00 5.00 5.00 6.00 8.00
Profit & Loss (RsM)Net sales 34,815 34,603 29,651 47,198 61,914Operating expenses -30,923 -29,791 -26,239 -41,770 -54,985EBIT 3,893 4,812 3,412 5,428 6,929Net interest expense -17 -38 -18 -18 -18Non-operating/exceptionals 439 404 408 400 200Pre-tax profit 4,315 5,178 3,802 5,810 7,111Tax -1,528 -1,624 -1,293 -1,975 -2,418Extraord./Min.Int./Pref.div. 121 -664 -1,755 0 0Reported net income 2,907 2,889 755 3,835 4,693Adjusted earnings 2,787 3,554 2,510 3,835 4,693Adjusted EBITDA 4,125 5,163 3,825 5,900 7,431Growth Rates (%)Sales 49.6 -0.6 -14.3 59.2 31.2EBIT adjusted 44.5 23.6 -29.1 59.1 27.6EBITDA adjusted 42.8 25.2 -25.9 54.2 25.9EPS adjusted 39.9 27.5 -29.4 52.8 22.4
Cash Flow (RsM)Operating cash flow 2,667 1,393 -544 2,814 3,116Depreciation/amortization 232 351 413 472 502Net working capital -538 -1,874 -1,712 -1,492 -2,078Investing cash flow -1,788 2,204 -1,000 -1,375 -1,375Capital expenditure -1,928 -1,954 -1,000 -500 -500Acquisitions/disposals 140 4,158 0 -875 -875Financing cash flow -1,271 -481 -766 -836 -1,115Borrowings -22 41 -41 0 0Dividends paid -1,115 -697 -697 -836 -1,115Change in cash -392 3,116 -2,310 603 626
Balance Sheet (RsM)Total assets 20,278 23,847 19,996 26,876 32,871Cash & cash equivalent 580 3,696 1,386 1,989 2,615Accounts receivable 5,305 5,719 5,362 8,534 11,195Net fixed assets 3,485 5,088 5,675 5,703 5,701Total liabilities 12,722 13,924 10,043 13,925 16,342Accounts payable 4,552 4,199 3,327 5,421 7,167Total Debt 0 41 0 0 0Shareholders' funds 7,556 9,923 9,953 12,951 16,529
Profitability/Solvency Ratios (%)EBITDA margin adjusted 11.8 14.9 12.9 12.5 12.0ROE adjusted 41.4 40.7 25.3 33.5 31.8ROIC adjusted 122.4 59.5 26.6 35.1 37.0Net debt to equity -7.7 -36.8 -13.9 -15.4 -15.8Total debt to capital 0.0 0.4 0.0 0.0 0.0
For further data queries on Citi’s full coverage universe please contact CIRA Data Services Asia Pacific ([email protected]) or +852-2501-2791
Investment Strategy
We have a Buy/Medium Risk rating on Thermax. Order inflow is strong; order book is up 36% YoY with 65-75% executable in FY11E. There is a strong pipeline of orders, with a reasonable chance of strong order wins in the near future. We expect OB to grow at 31%, revenues to grow at 45% and earnings to grow at 37% over FY10E-12E. We expect (unlevered) ROEs of 32-34%. Our est. do not capture any upside from the foray in to super-critical space.
Valuation
Our Rs787 target price is based on PE of 22x Sept11E. We believe that 1) the structural change in the business, 2) the broader economic revival; 3) the strong outlook (compared to a year ago) should drive a re-rating. Our target multiple is 1) at a premium to Thermax's historical avg. PE (16x), given the strong outlook 2) at a discount to BHEL (23x) despite Thermax's superior earnings outlook and RoE (EPS CAGR of 37% vs 22% for BHEL, RoEs of 32-34% vs BHEL RoE's of 29-31%); given BHEL's larger size and market share. 3) the target multiple is also at a discount to ABB (24x) given ABB's superior earnings outlook (39% CAGR).

India Investor Conference 2010 18 May 2010
Citigroup Global Markets 126
High Return Profile
Amongst the larger banks, consistent improvement in delivery — Union has distinguished itself over the past 3-4 years with its strong management focus, superior return profile and consistent delivery in earnings growth and profitability. Union’s NIMs have bounced back to over 330bps, loan growth has been steady (though lower than industry levels) and asset quality is well under control. Union is amongst only a select few large government banks with such a track record.
Early leader in technology, leveraging it well — Union was amongst the earliest movers in implementation of technology and has remained the leader in terms of leveraging its platform. This has been showing up in high and consistent fee income growth of over 30% p.a. and has also contained costs meaningfully.
Superior return profile — Union’s strong return profile is a mix of: a) Above industry NIMs at over 330bps (albeit with relatively higher interest rate sensitivity); b) Strong fee income profile and growth; c) Low cost income ratio of around 40% recently; and d) Contained loan loss charges (though there has been some increases recently as the impact of slowdown is showing through with a lag). It has consistently maintained a 20% ROE over the last few years; rare amongst Indian Banks.
Deposit franchise modest, asset risks higher, needs capital for growth — Union’s deposit mix is modest relative to the larger government bank peers (32% CASA) and is wholesale dependent, which increases interest rate sensitivity. Asset quality has been relatively strong, but is showing signs of higher slippages recently - NPLs are up and coverage levels declined to 74% (from 90%+ earlier). While absolute levels are still comfortable (2.2% of loans), further slippages from agriculture and restructured loans (4% of loans) could cause concerns. Union’s capital adequacy is also relatively lower (Tier 1 of 7.91%) and will require additional capital infusion from the government for it to sustain a high growth path.
Statistical Abstract
Year Net profit EPS EPS Growth PE PB ROAE ROAA Div yieldMarch (Rs. M) Rs. (%) (x) (x) (%) (%) (%)FY08 13,870 27 64.1 10.6 2.0 22 1.2 1.3FY09 17,266 34 24.5 8.5 1.7 22 1.2 1.6FY10E 19,435 38 12.6 7.6 1.4 20 1.1 1.6FY11E 23,563 47 21.2 6.3 1.2 21 1.2 1.8FY12E 27,123 54 15.1 5.4 1.0 20 1.2 1.8
Source: Company data, Citi Investment Research and Analysis estimates
Union Bank of India (UNBK.BO)
Sell/Low Risk 3LPrice (11 May 10) Rs292.20Target Price Rs275.00Expected share price return -5.9%Expected dividend yield 1.7%Expected total return -4.2%Market Cap Rs147,595M US$3,273M
Price Performance
150
200
250
300
350
May 09 Aug 09 Nov 09 Feb 10 May 10
INR
Source: dataCentral
Manish Chowdhary, CFA +91-22-6631-9853 [email protected] Aditya Narain, CFA +91-22-6631-9879 [email protected] Pooja Kapur [email protected]
Company description
Union Bank is the seventh largest bank in India and sixth largest government bank, with a large balance sheet size and diversified distribution network. It currently has 2,821 branches and 2,127 ATMs spread across the country. Its business is distributed across the country with a slight concentration in Western India. Union Bank listed in 2002. A follow-on offer was transacted in February 2006, with the government holding a 55% stake in the bank.

India Investor Conference 2010 18 May 2010
Citigroup Global Markets 127
Union Bank of India (UNBK.BO): Financial Summary
2008 2009 2010E 2011E 2012E
Valuation RatiosP/E adjusted (x) 10.6 8.5 7.6 6.3 5.4P/E reported (x) 10.6 8.5 7.6 6.3 5.4P/BV (x) 2.0 1.7 1.4 1.2 1.0P/Adjusted BV diluted (x) 2.6 2.1 1.7 1.4 1.1Dividend yield (%) 1.4 1.7 1.7 1.9 1.9Per Share Data (Rs)EPS adjusted 27.46 34.18 38.48 46.65 53.70EPS reported 27.46 34.18 38.48 46.65 53.70BVPS 145.47 173.04 205.94 246.51 294.14Tangible BVPS 145.47 173.04 205.94 246.51 294.14Adjusted BVPS diluted 111.33 139.66 172.56 213.14 260.76DPS 4.00 5.00 5.00 5.50 5.50
Profit & Loss (RsM)Net interest income 28,537 38,136 38,250 48,834 56,491Fees and commissions 3,010 3,133 3,697 4,140 4,637Other operating Income 10,187 11,693 16,273 15,279 17,031Total operating income 41,733 52,961 58,220 68,254 78,159Total operating expenses -15,930 -22,141 -24,012 -26,863 -29,833Oper. profit bef. provisions 25,803 30,820 34,207 41,390 48,326Bad debt provisions -6,652 -6,266 -5,442 -6,728 -8,578Non-operating/exceptionals -547 -989 -1,000 -1,000 -1,000Pre-tax profit 18,604 23,566 27,765 33,662 38,748Tax -4,734 -6,300 -8,329 -10,099 -11,624Extraord./Min. Int./Pref. Div. 0 0 0 0 0Attributable profit 13,870 17,266 19,435 23,563 27,123Adjusted earnings 13,870 17,266 19,435 23,563 27,123Growth Rates (%)EPS adjusted 64.1 24.5 12.6 21.2 15.1Oper. profit bef. prov. 19.7 19.4 11.0 21.0 16.8
Balance Sheet (RsM)Total assets 1,239,919 1,609,755 1,826,216 2,117,546 2,456,541Avg interest earning assets 1,102,470 1,388,503 1,680,514 1,929,314 2,241,614Customer loans 762,110 986,256 1,128,149 1,325,136 1,570,225Gross NPLs 16,578 19,235 20,642 21,735 24,630Liab. & shar. funds 1,239,919 1,609,755 1,826,216 2,117,546 2,456,541Total customer deposits 1,038,586 1,387,028 1,578,539 1,840,551 2,146,121Reserve for loan losses 19,441 20,914 18,005 19,679 22,010Shareholders' equity 73,477 87,404 104,023 124,519 148,574
Profitability/Solvency Ratios (%)ROE adjusted 22.1 21.5 20.3 20.6 19.9Net interest margin 2.6 2.7 2.3 2.5 2.5Cost/income ratio 38.2 41.8 41.2 39.4 38.2Cash cost/average assets 1.4 1.6 1.4 1.4 1.3NPLs/customer loans 2.2 2.0 1.8 1.6 1.6Reserve for loan losses/NPLs 117.3 108.7 87.2 90.5 89.4Bad debt prov./avg. cust. loans 0.9 0.7 0.5 0.5 0.6Loans/deposit ratio 73.4 71.1 71.5 72.0 73.2Tier 1 capital ratio 7.5 8.2 7.6 8.0 8.4Total capital ratio 12.5 13.3 11.8 11.9 11.5
For further data queries on Citi’s full coverage universe please contact CIRA Data Services Asia Pacific ([email protected]) or +852-2501-2791
Investment Strategy
We rate Union Bank Sell/Low Risk. Union has key strengths with its large balance sheet and distribution, low operating costs (as a proportion of assets) below industry average, good technology ahead of its peer group in implementation, and a clean balance sheet with low gross and net NPLs (improving above industry levels). However, the risks to Union lie in: 1) Its low balance sheet liquidity, and the need to grow term deposits rapidly to fund loan growth; 2) Its relatively lower capital cushion, which is likely to moderate asset growth in a higher growth environment; 3) Its NIMs have been impacted recently due to dependence on bulk deposits induced by the highly volatile interest rate environment. We believe Union's current valuations are pricing in most of the upside and leave little room for outperformance.
Valuation
Our target price of Rs275 is based on our EVA model, which we believe captures the long-term value of the business and is a standard valuation measure for our India banking coverage. We also benchmark our target price on a 1.3x 1Yr Fwd PBV, which translates to a fair value of Rs293. We believe Union should trade at a 10% discount to the larger banks like SBI and PNB, due to: 1) its lower capital cushion which is likely to cap upside in a higher growth environment; 2) its modest deposit mix, which increases dependence on wholesale funding; and 3) sharp increase in restructured assets. Additionally, Union's NIMs have come under pressure and could remain subdued as its high cost bulk deposits are likely to re-price with a lag.

India Investor Conference 2010 18 May 2010
Citigroup Global Markets 128
Strong Domestic Volume Growth; Cost Pressures Peak Out
Volume growth remains strong — Domestic volume growth is likely to remain strong at around 10-15% Y/Y, driven by rising disposable incomes, favorable demographics and shift in consumption patterns. Further, benefits of some pricing action and mix shift would aid revenue growth going forward.
Input cost pressures abate — Concerns on input costs are baked into expectations and estimates and the probability of negative surprises is now limited. Encouragingly, input costs have dipped ~10% over the last 3-4 months – mgmt notes that input costs continue to decline. UNSP is also expanding on grain based capacity to control the volatility of wet goods per case. Additionally, UNSP has demonstrated the ability to pare discretionary cost items (especially advertising costs), which buffers EBITDA.
Capital structure remains healthy — Consolidated gearing has declined to ~1.26x vs. ~2.9x at the end of last fiscal, as a large part of dollar debt has been paid down (post QIP + treasury stock sale). From a debt servicing perspective, debt to EBITDA is now at 4.1x v/s 6.4x as of end FY09.
W&M's Branded shift? — Our discussions with management reveal that W&M's business strategy could change, with the company moving away from being a bulk scotch manufacturer to a branded spirits marketer. Details are yet unavailable as mgmt has yet to crystallise plans, but in essence, the guidance of around £55-60m EBITDA in FY11/12e could decline to around £30-35m. That said, we believe a branded shift would prove to be a positive over the long term.
Statistical Abstract
Year to Net Profit Diluted EPS EPS growth EV/EBITDA P/E P/B P/CEPS ROE Yield31 Mar (RsM) (Rs) (%) (x) (x) (x) (x) (%) (%)2008A 1,174 13.3 na 16.9 92.7 5.2 31.4 na 0.12009A 3,830 37.2 180.7 21.8 33.0 5.3 -40.1 -18.3 0.22010E 4,218 35.0 -6.0 16.2 35.1 3.2 28.0 12.1 0.22011E 6,571 54.5 55.8 12.2 22.6 2.9 19.3 13.5 0.32012E 8,552 70.9 30.1 10.5 17.3 2.5 15.3 15.3 0.4
Source: Company Reports and CIRA Estimates
United Spirits (UNSP.BO)
Buy/Medium Risk 1MPrice (11 May 10) Rs1,228.50Target Price Rs1,452.00Expected share price return 18.2%Expected dividend yield 0.2%Expected total return 18.4%Market Cap Rs154,293M US$3,422M
Price Performance
650
900
1150
1400
May 09 Aug 09 Nov 09 Feb 10 May 10
INR
Source: dataCentral
Jamshed Dadabhoy +91-22-6631-9883 [email protected] Aditya Mathur +91-22-6631-9841 [email protected]
Company description
United Spirits is the largest player in India's branded spirits market with more than 55% market share. It pursues an inorganic growth strategy, acquiring second-largest Indian liquor manufacturer Shaw Wallace and scotch manufacturer Whyte & Mackay. While the Shaw Wallace acquisition enhanced its competitive position, raising its market share in branded spirits market, Whyte & Mackay gave it access to scotch inventory to drive the next leg of its India growth strategy. UNSP also acquired French winemaker Bouvet Ladubay - the wine arm of champagne major Taittinger and plans to introduce its products to the Indian market. UNSP also owns the Bangalore IPL cricket team ‘Royal Challengers' in a 100%-owned subsidiary.

India Investor Conference 2010 18 May 2010
Citigroup Global Markets 129
United Spirits (UNSP.BO): Financial Summary
Fiscal year end 31-Mar 2008 2009 2010E 2011E 2012E
Valuation RatiosP/E adjusted (x) 92.7 33.0 35.1 22.6 17.3EV/EBITDA adjusted (x) 19.7 21.5 14.7 11.7 10.0P/BV (x) 5.2 5.3 3.2 2.9 2.5Dividend yield (%) 0.1 0.2 0.2 0.3 0.4Per Share Data (Rs)EPS adjusted 13.25 37.19 34.96 54.46 70.87EPS reported 30.72 -39.66 34.96 54.46 70.87BVPS 234.52 231.64 379.67 429.98 495.46DPS 1.50 2.09 2.27 3.54 4.61
Profit & Loss (RsM)Net sales 46,275 54,681 63,423 72,017 80,877Operating expenses -37,374 -45,753 -50,683 -56,431 -62,848EBIT 8,901 8,927 12,740 15,586 18,029Net interest expense -5,448 -7,176 -6,419 -5,434 -4,776Non-operating/exceptionals 1,063 1,038 710 800 1,000Pre-tax profit 4,516 2,790 7,030 10,952 14,254Tax -2,661 -916 -2,812 -4,381 -5,701Extraord./Min.Int./Pref.div. 865 -5,959 0 0 0Reported net income 2,721 -4,084 4,218 6,571 8,552Adjusted earnings 1,174 3,830 4,218 6,571 8,552Adjusted EBITDA 9,642 9,853 13,813 16,696 19,187Growth Rates (%)Sales 58.2 18.2 16.0 13.6 12.3EBIT adjusted 121.4 0.3 42.7 22.3 15.7EBITDA adjusted 121.3 2.2 40.2 20.9 14.9EPS adjusted -49.0 180.7 -6.0 55.8 30.1
Cash Flow (RsM)Operating cash flow -8,361 -7,040 -4,158 5,350 8,926Depreciation/amortization 741 926 1,073 1,109 1,158Net working capital -9,990 -3,540 -9,449 -2,330 -784Investing cash flow -48,724 -5,182 6,241 -800 -1,300Capital expenditure -6,713 -6,321 -800 -800 -1,300Acquisitions/disposals -42,011 1,139 7,041 0 0Financing cash flow 55,588 17,233 -1,573 -7,050 -7,626Borrowings 51,240 7,564 -18,820 -6,058 -6,483Dividends paid -159 -252 -321 -500 -651Change in cash -340 -948 510 -2,500 0
Balance Sheet (RsM)Total assets 101,986 118,418 118,404 120,297 123,520Cash & cash equivalent 5,438 4,490 5,000 2,500 2,500Accounts receivable 8,370 8,880 10,850 12,466 12,358Net fixed assets 11,163 16,558 16,285 15,976 16,118Total liabilities 79,221 94,500 72,528 68,350 63,671Accounts payable 9,256 9,256 9,514 10,610 11,831Total Debt 66,041 73,605 54,784 48,726 42,243Shareholders' funds 22,765 23,919 45,876 51,948 59,849
Profitability/Solvency Ratios (%)EBITDA margin adjusted 20.8 18.0 21.8 23.2 23.7ROE adjusted 6.8 17.2 12.1 13.5 15.3ROIC adjusted 11.9 9.7 11.3 11.9 12.8Net debt to equity 266.2 289.0 108.5 89.0 66.4Total debt to capital 74.4 75.5 54.4 48.4 41.4
For further data queries on Citi’s full coverage universe please contact CIR Data Services Asia Pacific ([email protected]) or +852-2501-2791
Investment Strategy
We rate United Spirits shares Buy. The company is well positioned to benefit from India's organized liquor market that is growing at a rate of 10-15% (driven by rising disposable incomes, favorable demographics and shift in consumption patterns). Concerns on high input costs are now baked into expectations as well as estimates. UNSP will focus on de-leveraging balance sheet, which allays concerns on gearing and interest costs. Whyte & Mackay acquisition remains a long-term strategic fit and should significantly enhance UNSP's plans to expand its presence in the Indian premium whisky segments and provide UNSP access to the European market. UNSP is well positioned to enhance the value of Whyte & Mackay's inventory of scotch whiskey, by providing access to a ready and fast growing market for premium whisky.
Valuation
Our target price of Rs1452 is based on a two-part methodology. We value the domestic operations at 15x FY11E EV/EBITDA. The multiple is at 25% premium to international peers. We think this is merited, given that: a) volume growth in India continues at mid teen levels vs. nominal growth in developed markets, b) With UNSP's strong market positioning in a high growth market is attractive, & c) India's demographic story is attractive from a long term consumption story. We value the W&M EBITDA at 9x (~25% discount to the global majors). We think this discount is merited, because of W&M's status as a bulk scotch manufacturer. Over the longer term, W&M could re-rate, especially as management focuses on building the branded business. The bulk scotch inventory also provides the company with a real option of selling down part of the stock and reducing debt levels.

India Investor Conference 2010 18 May 2010
Citigroup Global Markets 130
Margin Concerns Overdone?
FY11 revenue growth — Infosys’ guidance of 16-18% revenue growth (US$-terms) has already set the baseline for the sector. With analysts/investors expectations at 20%-plus YoY growth – key question for management would be how high can revenues grow in FY11?
Outlook on margins — Management has improved EBIT margins by more than 300bps in the last six quarters (in IT Services business). With INR appreciation and attrition worries (company gave salary hikes in Feb’10), the outlook on margins and levers available could be discussed.
Return of pricing power — With the return in demand, pricing discounts seem to be a thing of the past. However, with increased attrition, vendors are grappling with salary hikes across the board. Pricing is one of the key levers available to companies in order to manage their margins. A key question would be the timing of the return of pricing power for vendors.
Supply side dynamics — Company’s view on supply side dynamics should be another area to discuss with focus on the following – (1) availability of talent (engineers) for next few years; (2) company’s initiatives on training; (3) right-skilling initiative – hiring of science graduates.
Mergers & Acquisitions — Wipro has been fairly active in the M&A space with its “string of pearls” strategy in the past. Whether the management perceives any gaps in the services/industry/geographical portfolio and corresponding inorganic activity could be discussed.
SEZ strategy — Wipro’ SEZ readiness, given the expectation of STPI sunset clause coming into effect by Apr’11 should be discussed. Expectations of the tax rate in FY11/12E etc. could be gauged.
Statistical Abstract
Year to Net Profit Diluted EPS EPS growth EV/EBITDA P/E P/B P/CEPS ROE Yield31 Mar (RsM) (Rs) (%) (x) (x) (x) (x) (%) (%)2008A 32,239 22.1 na 23.5 30.1 7.5 25.4 na 0.92009A 38,763 26.5 19.9 18.6 25.1 6.6 20.6 28.0 0.62010E 45,389 30.9 16.5 16.1 21.6 5.2 18.0 27.3 0.72011E 52,585 35.8 15.8 13.6 18.6 4.3 15.6 25.5 1.22012E 58,702 40.0 11.6 11.3 16.7 3.6 14.0 23.5 1.3
Source: Powered by dataCentral
Wipro (WIPR.BO)
Buy/Low Risk 1LPrice (11 May 10) Rs667.15Target Price Rs810.00Expected share price return 21.4%Expected dividend yield 1.2%Expected total return 22.6%Market Cap Rs979,606M US$21,842M
Price Performance
0
200
400
600
800
May 09 Aug 09 Nov 09 Feb 10 May 10
INR
Source: dataCentral
Surendra Goyal, CFA1 +91-22-6631-9870 [email protected]
Vishal Agarwal1 +91-22-6616-2742 [email protected]
Company description
Wipro is a leading Indian company with business interests in IT and BPO services exports, domestic hardware, consumer lighting and consumer care. It has one of the widest ranges of services, including systems integration, IT-enabled services, package implementation, software application development & maintenance and R&D services. Wipro is the first P-CMM Level 5 and SEI-CMM Level 5 certified IT services company in the world. It has more than 800 clients spanning the BFSI, Manufacturing, Retail, Utilities and Telecom verticals. Its IT services exports team has ~65,000 employees and BPO operation has more than 23,000 employees.

India Investor Conference 2010 18 May 2010
Citigroup Global Markets 131
Wipro (WIPR.BO): Financial Summary
Fiscal year end 31-Mar 2008 2009 2010E 2011E 2012E
Valuation RatiosP/E adjusted (x) 30.1 25.1 21.6 18.6 16.7EV/EBITDA adjusted (x) 23.9 18.6 15.8 13.3 11.0P/BV (x) 7.5 6.6 5.2 4.3 3.6Dividend yield (%) 0.9 0.6 0.7 1.2 1.3Per Share Data (Rs)EPS adjusted 22.14 26.54 30.91 35.79 39.95EPS reported 22.14 26.54 30.91 35.79 39.95BVPS 89.20 101.18 127.43 155.44 186.71DPS 6.00 4.00 5.00 8.00 9.00
Profit & Loss (RsM)Net sales 197,427 256,892 271,281 311,609 361,052Operating expenses -163,715 -213,443 -220,044 -252,884 -292,072EBIT 33,712 43,449 51,237 58,725 68,980Net interest expense 2,167 1,086 2,252 3,597 5,527Non-operating/exceptionals 257 362 454 362 362Pre-tax profit 36,136 44,897 53,943 62,684 74,869Tax -3,873 -6,035 -8,399 -10,029 -16,097Extraord./Min.Int./Pref.div. -24 -99 -156 -70 -70Reported net income 32,239 38,763 45,389 52,585 58,702Adjusted earnings 32,239 38,763 45,389 52,585 58,702Adjusted EBITDA 39,672 52,046 60,326 68,949 80,087Growth Rates (%)Sales 32.1 30.1 5.6 14.9 15.9EBIT adjusted 12.9 28.9 17.9 14.6 17.5EBITDA adjusted 16.5 31.2 15.9 14.3 16.2EPS adjusted 9.7 19.9 16.5 15.8 11.6
Cash Flow (RsM)Operating cash flow 44,767 61,356 50,307 56,279 61,986Depreciation/amortization 5,960 8,597 9,089 10,224 11,108Net working capital 8,789 13,430 -2,747 -3,403 -2,367Investing cash flow -53,670 -35,991 -7,211 -13,652 -14,910Capital expenditure -19,241 -18,569 -11,464 -16,848 -20,437Acquisitions/disposals -36,067 -8,200 1,230 0 0Financing cash flow 10,944 -13,684 -8,418 -11,662 -13,120Borrowings 13,663 5,159 -602 0 0Dividends paid -9,872 -6,836 -8,589 -13,753 -15,472Change in cash 2,042 11,681 34,678 30,965 33,956
Balance Sheet (RsM)Total assets 223,299 284,136 317,907 369,719 428,650Cash & cash equivalent 54,078 65,660 100,182 131,077 164,963Accounts receivable 38,908 48,612 44,594 51,223 59,351Net fixed assets 39,822 49,794 52,169 58,794 68,123Total liabilities 93,818 136,755 131,838 142,727 156,076Accounts payable 13,082 35,768 35,267 40,509 46,937Total Debt 44,055 56,892 54,928 54,928 54,928Shareholders' funds 129,481 147,381 186,069 226,992 272,574
Profitability/Solvency Ratios (%)EBITDA margin adjusted 20.1 20.3 22.2 22.1 22.2ROE adjusted 27.9 28.0 27.3 25.5 23.5ROIC adjusted 34.4 28.5 30.1 33.0 33.4Net debt to equity -7.7 -5.9 -24.3 -33.5 -40.4Total debt to capital 25.4 27.9 22.8 19.5 16.8
For further data queries on Citi’s full coverage universe please contact CIRA Data Services Asia Pacific ([email protected]) or +852-2501-2791
Investment Strategy
We rate Wipro shares Buy/Low Risk (1L). As one of the top three Indian IT services firms, Wipro looks well positioned to benefit from growing demand for offshore IT services. Apart from economies of scale in offshore delivery, one of Wipro's key strengths is its full-service model. This includes a strong position in the infrastructure/R&D services business, which offers significant long-term growth potential. It has strong exposure to the BPO segment, which should offer above-average growth in the long term. Wipro's management has actively pursued acquisitions to strengthen its service portfolio.
Valuation
Our Rs810 target price is based on 23x FY11E EPS. Our target multiple is derived from a P/E-band analysis of Wipro's historical trading pattern and peer group valuations. Wipro has traded at 8-31x over the past 3 years. Given that revenue visibility is improving with business environment stabilizing, we believe Wipro should trade higher than the mid-point of the band. We think Wipro will continue to trade at a marginal discount to Infosys. P/E is the most appropriate valuation measure, in our view, given Wipro's profitability and earnings visibility.

India Investor Conference 2010 18 May 2010
Citigroup Global Markets 132
High Tenancy = Profitability
Background — It is among the largest independent towerco in India. The tower portfolio also enjoys a high tenancy at >2x. The company plans to increase its tower portfolio over the next 3 years. Quippo Infrastructure, GIC, IDFC private equity and Oman Investment fund together hold a 46% stake in the company, while Tata holds the remaining 54% stake.
3G/WiMax launch will help increase tenancy — The expected 3G/WiMax launch in the next 9-12 months will help towercos with increased tenancy visibility. However, the physical tenancy increase will be higher than that reflected in the revenues given lower rentals for adding only additional BTS to an existing 2G cell site.
TRAI recommendations further help tenancy visibility — The TRAI recommendations which came out last week, if accepted by the DoT, will also help increase tenancy as it links the spectrum allotment to coverage. Besides the recommendations also put a high cost to the spectrum which could deter any significant M&A. However, the recommendations also include a 6% license fee on the tower revenues which if implemented will be a negative.
Inorganic growth has helped achieve scale — Quippo-WWTL has undertaken the inorganic route to grow its tower portfolio by combining its tower portfolio with Tata’s Mumbai/Maharashtra’s towers. It acquired 2535 towers with 2.15x tenancy for Rs13.2bn imputing an EV/Tower of US$116k, higher than some of the previous transactions given high tenancy. The transaction has helped it complete its footprint in Mumbai/Maharashtra where it did not previously have a significant presence.
_______________________________________________________________
_______________________________________________________________
_______________________________________________________________
_______________________________________________________________
_______________________________________________________________
_______________________________________________________________
_______________________________________________________________
WTTIL (Tata Quippo)
Non-Rated Price (11 May 09) Unlisted Market Cap Unlisted
Rahul Singh +91-22-6631-9863 [email protected]
Company Description
Quippo Infra, IDFC private equity, Oman Investment fund and GIC together hold a 46% stake while Tata’s hold the remaining 54% stake in the company. TTSL’s towers have helped it gain higher-than-industry average tenancy (currently over 2x). It has taken the inorganic route to increase its tower portfolio– acquiring Tata’s towers in Mumbai/Maharashtra. Uninor has signed up with Quippo for its primary roll-out needs which helps increase tenancy visibility especially if TRAI’s recos are accepted by the DoT.
Recent Developments
Quippo announced its amalgamation with SREI Infrastructure Finance, a non-banking finance company (NBFC) which is into financing of infrastructure-related segments, in February 2010.

India Investor Conference 2010 18 May 2010
Citigroup Global Markets 133
This page is left blank intentionally

India Investor Conference 2010 18 May 2010
Citigroup Global Markets 134
Structural Value
Structural and cyclical play — Yes is India's youngest private sector bank, and we see it positioned as a 1) Structural play given growing Indian banking opportunity, strong management and execution capability, scarcity value of new private banks; and 2) Cyclical play on liquidity, asset quality and economic growth. If the environment improves on a strong growth trajectory, Yes Bank should be a large beneficiary; else, it could be vulnerable.
Wholesale bank with capital market support — Yes as a wholesale bank has excelled in corporate and advisory businesses, expanded focused asset book, and kept risks low. Yes is now seeking to focus significantly on expanding its retail footprint as also to build on, and expand investment banking, and other capital markets businesses.
Economic outlook should reduce incremental asset deterioration — Yes Bank's loan book is relatively more mid-market and hence perceived to be more vulnerable to an economic downturn. Conversely, a stable environment and its own strong risk management systems (relatively low loan restructuring of 0.4% of assets) should ease the pace of asset deterioration.
Strong NIMs, fees could surprise — Yes Bank's NIMs are above industry levels (320bps now) and have shown significant improvement. Management has shown significant flexibility in maintaining NIMs through interest rate cycles, a tighter liquidity environment and its own predominantly wholesale funded balance sheet could lead to pressure on NIMs in the medium term. Capital market related fees could however surprise on the upside as it has a good track record of debt syndication and placement activities during the previous market cycle.
Value drivers — Derisking, retail and transaction banking — We believe franchise and value enhancement will be driven by more balance in a) Deposits – low cost retail from wholesale, b) Fees – transaction banking and retail from advisory, and c) Assets – more diversified mix from current mid market corporate bias.
Risks — Key risks include a) Tighter liquidity or interest rates; b) Reversal in asset quality; c) Likely volatility in fees; and d) Portfolio concentration.
Statistical Abstract
Year Net profit EPS EPS Growth PE PB ROAE ROAA Div yieldMarch (Rs. M) Rs. (%) (x) (x) (%) (%) (%)FY08 2,000 7 102.5 39.7 6.2 19 1.4 0.0FY09 3,038 10 47.6 26.9 5.0 21 1.5 0.0FY10E 4,758 16 56.3 17.2 3.9 26 1.7 0.0FY11E 6,193 19 19.7 14.4 2.5 21 1.6 0.0FY12E 8,139 23 21.7 11.8 2.0 19 1.6 0.0
Source: Company data, Citi Investment Research and Analysis estimates
Yes Bank (YESB.BO)
Buy/Medium Risk 1MPrice (11 May 10) Rs275.55Target Price Rs330.00Expected share price return 19.8%Expected dividend yield 0.0%Expected total return 19.8%Market Cap Rs93,821M US$2,081M
Price Performance
50100150200250300
May 09 Aug 09 Nov 09 Feb 10 May 10
INR
Source: dataCentral
Manish Chowdhary, CFA +91-22-6631-9853 [email protected] Aditya Narain, CFA +91-22-6631-9879 [email protected] Pooja Kapur [email protected]
Company description
Yes Bank was started in FY05 by Mr. Rana Kapoor and is the newest private-sector bank in India. It has grown rapidly since inception and what it lacks in size it makes up with strong growth, quality management, and a rapidly building franchise. The bank has 132 branches and management suggests a target of over 250 branches by Dec 2010. In FY09, the bank grew its loans by 32% to Rs124bn and net profits by 52% to Rs3bn.

India Investor Conference 2010 18 May 2010
Citigroup Global Markets 135
Yes Bank (YESB.BO): Financial Summary
2008 2009 2010E 2011E 2012E
Valuation RatiosP/E adjusted (x) 39.7 26.9 17.2 14.4 11.8P/E reported (x) 39.7 26.9 17.2 14.4 11.8P/BV (x) 6.2 5.0 3.9 2.5 2.0P/Adjusted BV diluted (x) 6.2 5.0 3.9 2.5 2.0Dividend yield (%) 0.0 0.0 0.0 0.0 0.0Per Share Data (Rs)EPS adjusted 6.95 10.25 16.02 19.18 23.34EPS reported 6.95 10.25 16.02 19.18 23.34BVPS 44.59 54.69 70.71 111.34 134.69Tangible BVPS 44.59 54.69 70.71 111.34 134.69Adjusted BVPS diluted 44.59 54.69 70.71 111.34 134.69DPS 0.00 0.00 0.00 0.00 0.00
Profit & Loss (RsM)Net interest income 3,367 5,112 7,646 10,829 14,141Fees and commissions 2,051 2,258 3,274 4,256 5,533Other operating Income 1,556 2,092 2,348 1,811 2,076Total operating income 6,974 9,462 13,268 16,896 21,749Total operating expenses -3,412 -4,185 -4,889 -6,230 -7,942Oper. profit bef. provisions 3,562 5,277 8,379 10,666 13,807Bad debt provisions -204 -836 -1,227 -1,323 -1,559Non-operating/exceptionals -293 219 -50 -100 -100Pre-tax profit 3,065 4,660 7,102 9,243 12,148Tax -1,065 -1,621 -2,344 -3,050 -4,009Extraord./Min. Int./Pref. Div. 0 0 0 0 0Attributable profit 2,000 3,038 4,758 6,193 8,139Adjusted earnings 2,000 3,038 4,758 6,193 8,139Growth Rates (%)EPS adjusted 102.5 47.6 56.3 19.7 21.7Oper. profit bef. prov. 99.5 48.1 58.8 27.3 29.4
Balance Sheet (RsM)Total assets 169,824 229,008 332,309 442,241 571,333Avg interest earning assets 129,515 182,858 260,899 364,859 480,713Customer loans 94,324 124,469 208,450 286,335 375,679Gross NPLs 106 849 786 2,152 3,450Liab. & shar. funds 169,824 229,008 332,309 442,241 571,333Total customer deposits 132,732 161,694 252,488 330,756 434,991Reserve for loan losses 21 438 655 1,514 2,396Shareholders' equity 13,189 16,242 21,001 38,819 46,959
Profitability/Solvency Ratios (%)ROE adjusted 19.0 20.6 25.6 20.7 19.0Net interest margin 2.6 2.8 2.9 3.0 2.9Cost/income ratio 48.9 44.2 36.8 36.9 36.5Cash cost/average assets 2.4 2.1 1.7 1.6 1.6NPLs/customer loans 0.1 0.7 0.4 0.8 0.9Reserve for loan losses/NPLs 20.0 51.5 83.3 70.4 69.4Bad debt prov./avg. cust. loans 0.3 0.8 0.7 0.5 0.5Loans/deposit ratio 71.1 77.0 82.6 86.6 86.4Tier 1 capital ratio 8.5 9.5 6.2 8.6 8.0Total capital ratio 13.6 16.6 11.1 12.9 11.8
For further data queries on Citi’s full coverage universe please contact CIRA Data Services Asia Pacific ([email protected]) or +852-2501-2791
Investment Strategy
We rate Yes Bank Buy/Medium Risk (1M). Yes Bank has shown aggressive growth, strong execution skills, a focused asset portfolio, strong treasury and advisory income businesses with relatively low NPLs so far. Yes Bank is highly leveraged to a strong economy with its consistently high growth and strong quality. Yes has shown little evidence of longer-term asset quality concerns despite a challenging asset quality environment and its own relatively concentrated mid-market exposure. We believe a stable/rising economic growth environment, low interest/easing liquidity regime, and strong capital markets are key ingredients to support Yes Bank. Our Buy rating on Yes Bank is based on: a) its relatively higher loan growth outlook; b) easing pressures on its mid-market loan segment; c) NIM expansion due to excess liquidity conditions and its own wholesale funded balance sheet; and d) a bounce back in capital-market related fee incomes.
Valuation
We value Yes Bank at Rs330 per share based on our EVA model. We also benchmark our valuations at 3x 1yr Fwd PBV, translating into a fair value of Rs334 per share. Our benchmark PBV multiple for Yes Bank is at a 10% discount to best-of-breed private banks like HDFC Bank, reflecting its much weaker liability franchise and a more concentrated mid-market asset exposure. However, we believe that in the early stages of an economic rebound, Yes Bank can also trade at premiums to peers given its smaller size and greater ability to access and leverage incremental capital quickly. We prefer to value banks on the EVA model as we believe it better captures the longer-term value of the business.

India Investor Conference 2010 18 May 2010
Citigroup Global Markets 136

India Investor Conference 2010 18 May 2010
Citigroup Global Markets 137
Appendix A-1 Analyst Certification
The research analyst(s) primarily responsible for the preparation and content of all or any identified portion of this research report hereby certifies that, with respect to each issuer or security or any identified portion of the report with respect to an issuer or security that the research analyst covers in this research report, all of the views expressed in this research report accurately reflect their personal views about those issuer(s) or securities. The research analyst(s) also certify that no part of their compensation was, is, or will be, directly or indirectly, related to the specific recommendation(s) or view(s) expressed by that research analyst in this research report.
IMPORTANT DISCLOSURES
A member of the household of Aditya Narain, CFA, Analyst, holds a long position in the securities of Reliance Capital.
Citigroup Global Markets Inc. or its affiliates beneficially owns 1% or more of any class of common equity securities of Aban Offshore, CESC, GVK Power and Infrastructure, Hindustan Construction, Infrastructure Development Finance, IRB Infrastructure Developers, IVRCL Infra & Projects, JSW Steel, Jubilant Organosys, Kotak Mahindra Bank, Larsen & Toubro, Max India, Moser Baer India, OPTO Circuits (India) Ltd, Punjab National Bank, Puravankara Projects, Ranbaxy, Reliance Infrastructure, Sun Pharmaceuticals, Tata Motors, Tech Mahindra, Thermax, Tata Steel. This position reflects information available as of the prior business day.
Within the past 12 months, Citigroup Global Markets Inc. or its affiliates has acted as manager or co-manager of an offering of securities of Aban Offshore, DB Corp, Essar Oil, Glenmark Pharmaceuticals, Grasim Industries, Hindalco Industries, HCL Technologies, JSW Steel, Larsen & Toubro, National Aluminium, NMDC, Oil India, Oil & Natural Gas, Punjab National Bank, Puravankara Projects, Reliance Industries, State Bank of India, Shriram Transport Finance, Tata Motors, Tech Mahindra, Tata Steel, Union Bank Of India, Yes Bank.
Citigroup Global Markets Inc. or its affiliates has received compensation for investment banking services provided within the past 12 months from Aban Offshore, DB Corp, DLF, Essar Oil, Glenmark Pharmaceuticals, Hindalco Industries, HCL Technologies, HDFC Bank, ICICI Bank, Infrastructure Development Finance, JSW Steel, Jubilant Organosys, Larsen & Toubro, Moser Baer India, National Aluminium, NMDC, Oil India, Punjab National Bank, Reliance Industries, Reliance Capital, State Bank of India, Shriram Transport Finance, Tata Motors, Tata Consultancy Services, Tech Mahindra, Tata Steel, Union Bank Of India.
Citigroup Global Markets Inc. or its affiliates expects to receive or intends to seek, within the next three months, compensation for investment banking services from Glenmark Pharmaceuticals, JSW Steel, Larsen & Toubro, National Aluminium, NMDC, Oil India, Punjab National Bank, State Bank of India, Tata Motors, Tata Consultancy Services, Union Bank Of India.
Citigroup Global Markets Inc. or an affiliate received compensation for products and services other than investment banking services from Aban Offshore, Aditya Birla Nuvo Ltd, Ambuja Cements, Apollo Hospitals, Cairn India, CESC, DLF, Edelweiss Capital, Glenmark Pharmaceuticals, GMR Infrastructure, Grasim Industries, Hindalco Industries, HCL Technologies, Hindustan Construction, HDFC Bank, Hero Honda, ICICI Bank, Infrastructure Development Finance, Infosys Technologies, IVRCL Infra & Projects, JSW Steel, Jubilant Organosys, Kotak Mahindra Bank, Larsen & Toubro, Max India, Moser Baer India, Maruti Suzuki India, National Aluminium, NMDC, Oil India, Oil & Natural Gas, Phoenix Mills, Punjab National Bank, Ranbaxy, Reliance Industries, Reliance Communications, Reliance Capital, Reliance Infrastructure, State Bank of India, Shriram Transport Finance, Sun Pharmaceuticals, Tata Motors, Tata Consultancy Services, Tech Mahindra, Thermax, Tata Steel, Union Bank Of India, Wipro, Yes Bank in the past 12 months.
Citigroup Global Markets Inc. currently has, or had within the past 12 months, the following as investment banking client(s): Tata Steel, CESC, GVK Power and Infrastructure, Glenmark Pharmaceuticals, DB Corp, Essar Oil, Oil India, Aban Offshore, DLF, Hindalco Industries, HCL Technologies, HDFC Bank, ICICI Bank, Infrastructure Development Finance, IVRCL Infra & Projects, JSW Steel, Jubilant Organosys, Larsen & Toubro, Moser Baer India, National Aluminium, NMDC, Punjab National Bank, Reliance Industries, Reliance Capital, State Bank of India, Shriram Transport Finance, Tata Motors, Tata Consultancy Services, Tech Mahindra, Union Bank Of India.
Citigroup Global Markets Inc. currently has, or had within the past 12 months, the following as clients, and the services provided were non-investment-banking, securities-related: Aban Offshore, Aditya Birla Nuvo Ltd, Apollo Hospitals, Cairn India, DLF, Edelweiss Capital, Glenmark Pharmaceuticals, GMR Infrastructure, Grasim Industries, Hindalco Industries, HCL Technologies, HDFC Bank, Hero Honda, ICICI Bank, Infrastructure Development Finance, Infosys Technologies, JSW Steel, Jubilant Organosys, Kotak Mahindra Bank, Larsen & Toubro, Max India, Moser Baer India, Maruti Suzuki India, National Aluminium, NMDC, Oil India, Oil & Natural Gas, Phoenix Mills, Punjab National Bank, Ranbaxy, Reliance Industries, Reliance Communications, Reliance Capital, Reliance Infrastructure, State Bank of India, Sun Pharmaceuticals, Tata Motors, Tata Consultancy Services, Tech Mahindra, Thermax, Tata Steel, Union Bank Of India, Wipro, Yes Bank.
Citigroup Global Markets Inc. currently has, or had within the past 12 months, the following as clients, and the services provided were non-investment-banking, non-securities-related: Aban Offshore, Aditya Birla Nuvo Ltd, Ambuja Cements, Apollo Hospitals, Cairn India, CESC, DLF, Edelweiss Capital, Glenmark Pharmaceuticals, GMR Infrastructure, Grasim Industries, Hindalco Industries, HCL Technologies, Hindustan Construction, HDFC Bank, Hero Honda, ICICI Bank, Infrastructure Development Finance, Infosys Technologies, IVRCL Infra & Projects, JSW Steel, Jubilant Organosys, Kotak Mahindra Bank, Larsen & Toubro, Max India, Moser Baer India, Maruti Suzuki India, National Aluminium, NMDC, Oil India, Oil & Natural Gas, Punjab National Bank, Ranbaxy, Reliance Industries, Reliance Communications, Reliance Capital, Reliance Infrastructure, State Bank of India, Shriram Transport Finance, Sun Pharmaceuticals, Tata Motors, Tata Consultancy Services, Tech Mahindra, Thermax, Tata Steel, Union Bank Of India, Wipro, Yes Bank.
Citigroup Global Markets Inc. or an affiliate received compensation in the past 12 months from Glenmark Pharmaceuticals.
Rohini Malkani has in the past worked with the India government or its divisions in her personal capacity.
Analysts' compensation is determined based upon activities and services intended to benefit the investor clients of Citigroup Global Markets Inc. and its affiliates ("the Firm"). Like all Firm employees, analysts receive compensation that is impacted by overall firm profitability which includes investment banking revenues.
The Firm is a market maker in the publicly traded equity securities of Infosys Technologies.
For important disclosures (including copies of historical disclosures) regarding the companies that are the subject of this Citi Investment Research & Analysis product ("the Product"), please contact Citi Investment Research & Analysis, 388 Greenwich Street, 28th Floor, New York, NY, 10013, Attention: Legal/Compliance. In addition, the same important disclosures, with the exception of the Valuation and Risk assessments and historical disclosures, are contained on the Firm's disclosure website at

India Investor Conference 2010 18 May 2010
Citigroup Global Markets 138
www.citigroupgeo.com. Valuation and Risk assessments can be found in the text of the most recent research note/report regarding the subject company. Historical disclosures (for up to the past three years) will be provided upon request.
Citi Investment Research & Analysis Ratings Distribution Data current as of 31 Mar 2010 Buy Hold SellCiti Investment Research & Analysis Global Fundamental Coverage 51% 36% 14%
% of companies in each rating category that are investment banking clients 48% 46% 39%Guide to Citi Investment Research & Analysis (CIRA) Fundamental Research Investment Ratings: CIRA's stock recommendations include a risk rating and an investment rating. Risk ratings, which take into account both price volatility and fundamental criteria, are: Low (L), Medium (M), High (H), and Speculative (S). Investment ratings are a function of CIRA's expectation of total return (forecast price appreciation and dividend yield within the next 12 months) and risk rating.
For securities in emerging markets (Asia Pacific, Emerging Europe/Middle East/Africa, and Latin America), investment ratings are:Buy (1) (expected total return of 15% or more for Low-Risk stocks, 20% or more for Medium-Risk stocks, 30% or more for High-Risk stocks, and 40% or more for Speculative stocks); Hold (2) (5%-15% for Low-Risk stocks, 10%-20% for Medium-Risk stocks, 15%-30% for High-Risk stocks, and 20%-40% for Speculative stocks); and Sell (3) (5% or less for Low-Risk stocks, 10% or less for Medium-Risk stocks, 15% or less for High-Risk stocks, and 20% or less for Speculative stocks).
Investment ratings are determined by the ranges described above at the time of initiation of coverage, a change in investment and/or risk rating, or a change in target price (subject to limited management discretion). At other times, the expected total returns may fall outside of these ranges because of market price movements and/or other short-term volatility or trading patterns. Such interim deviations from specified ranges will be permitted but will become subject to review by Research Management. Your decision to buy or sell a security should be based upon your personal investment objectives and should be made only after evaluating the stock's expected performance and risk. Guide to Citi Investment Research & Analysis (CIRA) Corporate Bond Research Credit Opinions and Investment Ratings: CIRA's corporate bond research issuer publications include a fundamental credit opinion of Improving, Stable or Deteriorating and a complementary risk rating of Low (L), Medium (M), High (H) or Speculative (S) regarding the credit risk of the company featured in the report. The fundamental credit opinion reflects the CIRA analyst's opinion of the direction of credit fundamentals of the issuer without respect to securities market vagaries. The fundamental credit opinion is not geared to, but should be viewed in the context of debt ratings issued by major public debt ratings companies such as Moody's Investors Service, Standard and Poor's, and Fitch Ratings. CBR risk ratings are approximately equivalent to the following matrix: Low Risk Triple A to Low Double A; Low to Medium Risk High Single A through High Triple B; Medium to High Risk Mid Triple B through High Double B; High to Speculative Risk Mid Double B and Below. The risk rating element illustrates the analyst's opinion of the relative likelihood of loss of principal when a fixed income security issued by a company is held to maturity, based upon both fundamental and market risk factors. Certain reports published by CIRA will also include investment ratings on specific issues of companies under coverage which have been assigned fundamental credit opinions and risk ratings. Investment ratings are a function of CIRA's expectations for total return, relative return (to publicly available Citigroup bond indices performance), and risk rating. These investment ratings are: Buy/Overweight the bond is expected to outperform the relevant Citigroup bond market sector index (Broad Investment Grade, High Yield Market or Emerging Market), performances of which are updated monthly and can be viewed at https://fidirect.citigroup.com/ using the "Indexes" tab; Hold/Neutral Weight the bond is expected to perform in line with the relevant Citigroup bond market sector index; or Sell/Underweight the bond is expected to underperform the relevant sector of the Citigroup indexes.
NON-US RESEARCH ANALYST DISCLOSURES Non-US research analysts who have prepared this report (i.e., all research analysts listed below other than those identified as employed by Citigroup Global Markets Inc.) are not registered/qualified as research analysts with FINRA. Such research analysts may not be associated persons of the member organization and therefore may not be subject to the NYSE Rule 472 and NASD Rule 2711 restrictions on communications with a subject company, public appearances and trading securities held by a research analyst account. The legal entities employing the authors of this report are listed below:
Citigroup Global Markets India Private Limited Aditya Narain, CFA,Venkatesh Balasubramaniam,Rahul Singh,Manish Chowdhary, CFA,Garima Mishra,Pooja Kapur,Saurabh Handa,Surendra Goyal, CFA,Vidhi Sodhani,Ashish Jagnani,Raashi Chopra, CFA,Prashant Nair, CFA,Aditya Mathur,Akshay Rai,Deepal Delivala,Pradeep Mahtani,Arvind Sharma,Jamshed Dadabhoy,Vishal Agarwal,Rohini Malkani,Anushka Shah
OTHER DISCLOSURES
Citigroup Global Markets Inc. and/or its affiliates has a significant financial interest in relation to DLF, HDFC Bank, ICICI Bank, Infrastructure Development Finance, Jubilant Organosys, OPTO Circuits (India) Ltd, Reliance Industries, Reliance Infrastructure, State Bank of India, Sun Pharmaceuticals, Tata Motors, Tata Steel, Union Bank Of India, Wipro. (For an explanation of the determination of significant financial interest, please refer to the policy for managing conflicts of interest which can be found at www.citigroupgeo.com.)
Citigroup Global Markets Inc. or its affiliates beneficially owns 10% or more of any class of common equity securities of OPTO Circuits (India) Ltd.
Citigroup Global Markets Inc. or its affiliates beneficially owns 5% or more of any class of common equity securities of IVRCL Infra & Projects.
Citigroup Global Markets Inc. or its affiliates beneficially owns 2% or more of any class of common equity securities of Jubilant Organosys, Max India, Moser Baer India, Puravankara Projects, Sun Pharmaceuticals, Tata Motors.
For securities recommended in the Product in which the Firm is not a market maker, the Firm is a liquidity provider in the issuers' financial instruments and may act as principal in connection with such transactions. The Firm is a regular issuer of traded financial instruments linked to securities that may have been recommended in the Product. The Firm regularly trades in the securities of the issuer(s) discussed in the Product. The Firm may engage in securities transactions in a manner inconsistent with the Product and, with respect to securities covered by the Product, will buy or sell from customers on a principal basis.
Securities recommended, offered, or sold by the Firm: (i) are not insured by the Federal Deposit Insurance Corporation; (ii) are not deposits or other obligations of any insured depository institution (including Citibank); and (iii) are subject to investment risks, including the possible loss of the principal amount invested. Although information has been obtained from and is based upon sources that the Firm believes to be reliable, we do not guarantee its accuracy and it may be incomplete and condensed. Note, however, that the Firm has taken all reasonable steps to determine the accuracy and completeness of the disclosures made in the Important Disclosures section of the Product. The Firm's research department has received assistance from the subject company(ies) referred to in this Product including, but not limited to, discussions with management of the subject company(ies). Firm policy prohibits research analysts from sending draft research to subject companies. However, it should be presumed that the author of the Product has had discussions with the subject company to ensure factual accuracy prior to publication. All opinions, projections and

India Investor Conference 2010 18 May 2010
Citigroup Global Markets 139
estimates constitute the judgment of the author as of the date of the Product and these, plus any other information contained in the Product, are subject to change without notice. Prices and availability of financial instruments also are subject to change without notice. Notwithstanding other departments within the Firm advising the companies discussed in this Product, information obtained in such role is not used in the preparation of the Product. Although Citi Investment Research & Analysis (CIRA) does not set a predetermined frequency for publication, if the Product is a fundamental research report, it is the intention of CIRA to provide research coverage of the/those issuer(s) mentioned therein, including in response to news affecting this issuer, subject to applicable quiet periods and capacity constraints. The Product is for informational purposes only and is not intended as an offer or solicitation for the purchase or sale of a security. Any decision to purchase securities mentioned in the Product must take into account existing public information on such security or any registered prospectus.
Investing in non-U.S. securities, including ADRs, may entail certain risks. The securities of non-U.S. issuers may not be registered with, nor be subject to the reporting requirements of the U.S. Securities and Exchange Commission. There may be limited information available on foreign securities. Foreign companies are generally not subject to uniform audit and reporting standards, practices and requirements comparable to those in the U.S. Securities of some foreign companies may be less liquid and their prices more volatile than securities of comparable U.S. companies. In addition, exchange rate movements may have an adverse effect on the value of an investment in a foreign stock and its corresponding dividend payment for U.S. investors. Net dividends to ADR investors are estimated, using withholding tax rates conventions, deemed accurate, but investors are urged to consult their tax advisor for exact dividend computations. Investors who have received the Product from the Firm may be prohibited in certain states or other jurisdictions from purchasing securities mentioned in the Product from the Firm. Please ask your Financial Consultant for additional details. Citigroup Global Markets Inc. takes responsibility for the Product in the United States. Any orders by US investors resulting from the information contained in the Product may be placed only through Citigroup Global Markets Inc.
Important Disclosures for Morgan Stanley Smith Barney LLC Customers: Morgan Stanley & Co. Incorporated (Morgan Stanley) research reports may be available about the companies that are the subject of this Citi Investment Research & Analysis (CIRA) research report. Ask your Financial Advisor or use smithbarney.com to view any available Morgan Stanley research reports in addition to CIRA research reports. Important disclosure regarding the relationship between the companies that are the subject of this CIRA research report and Morgan Stanley Smith Barney LLC and its affiliates are available at the Morgan Stanley Smith Barney disclosure website at www.morganstanleysmithbarney.com/researchdisclosures. The required disclosures provided by Morgan Stanley and Citigroup Global Markets, Inc. on Morgan Stanley and CIRA research relate in part to the separate businesses of Citigroup Global Markets, Inc. and Morgan Stanley that now form Morgan Stanley Smith Barney LLC, rather than to Morgan Stanley Smith Barney LLC in its entirety. For Morgan Stanley and Citigroup Global Markets, Inc. specific disclosures, you may refer to www.morganstanley.com/researchdisclosures and https://www.citigroupgeo.com/geopublic/Disclosures/index_a.html. This CIRA research report has been reviewed and approved on behalf of Morgan Stanley Smith Barney LLC. This review and approval was conducted by the same person who reviewed this research report on behalf of CIRA. This could create a conflict of interest.
The Citigroup legal entity that takes responsibility for the production of the Product is the legal entity which the first named author is employed by. The Product is made available in Australia through Citigroup Global Markets Australia Pty Ltd. (ABN 64 003 114 832 and AFSL No. 240992), participant of the ASX Group and regulated by the Australian Securities & Investments Commission. Citigroup Centre, 2 Park Street, Sydney, NSW 2000. The Product is made available in Australia to Private Banking wholesale clients through Citigroup Pty Limited (ABN 88 004 325 080 and AFSL 238098). Citigroup Pty Limited provides all financial product advice to Australian Private Banking wholesale clients through bankers and relationship managers. If there is any doubt about the suitability of investments held in Citigroup Private Bank accounts, investors should contact the Citigroup Private Bank in Australia. Citigroup companies may compensate affiliates and their representatives for providing products and services to clients. The Product is made available in Brazil by Citigroup Global Markets Brasil - CCTVM SA, which is regulated by CVM - Comissão de Valores Mobiliários, BACEN - Brazilian Central Bank, APIMEC - Associação dos Analistas e Profissionais de Investimento do Mercado de Capitais and ANBID - Associação Nacional dos Bancos de Investimento. Av. Paulista, 1111 - 11º andar - CEP. 01311920 - São Paulo - SP. If the Product is being made available in certain provinces of Canada by Citigroup Global Markets (Canada) Inc. ("CGM Canada"), CGM Canada has approved the Product. Citigroup Place, 123 Front Street West, Suite 1100, Toronto, Ontario M5J 2M3. The Product is made available in France by Citigroup Global Markets Limited, which is authorised and regulated by Financial Services Authority. 1-5 Rue Paul Cézanne, 8ème, Paris, France. The Product may not be distributed to private clients in Germany. The Product is distributed in Germany by Citigroup Global Markets Deutschland AG & Co. KGaA, which is regulated by Bundesanstalt fuer Finanzdienstleistungsaufsicht (BaFin). Frankfurt am Main, Reuterweg 16, 60323 Frankfurt am Main. If the Product is made available in Hong Kong by, or on behalf of, Citigroup Global Markets Asia Ltd., it is attributable to Citigroup Global Markets Asia Ltd., Citibank Tower, Citibank Plaza, 3 Garden Road, Hong Kong. Citigroup Global Markets Asia Ltd. is regulated by Hong Kong Securities and Futures Commission. If the Product is made available in Hong Kong by The Citigroup Private Bank to its clients, it is attributable to Citibank N.A., Citibank Tower, Citibank Plaza, 3 Garden Road, Hong Kong. The Citigroup Private Bank and Citibank N.A. is regulated by the Hong Kong Monetary Authority. The Product is made available in India by Citigroup Global Markets India Private Limited, which is regulated by Securities and Exchange Board of India. Bakhtawar, Nariman Point, Mumbai 400-021. The Product is made available in Indonesia through PT Citigroup Securities Indonesia. 5/F, Citibank Tower, Bapindo Plaza, Jl. Jend. Sudirman Kav. 54-55, Jakarta 12190. Neither this Product nor any copy hereof may be distributed in Indonesia or to any Indonesian citizens wherever they are domiciled or to Indonesian residents except in compliance with applicable capital market laws and regulations. This Product is not an offer of securities in Indonesia. The securities referred to in this Product have not been registered with the Capital Market and Financial Institutions Supervisory Agency (BAPEPAM-LK) pursuant to relevant capital market laws and regulations, and may not be offered or sold within the territory of the Republic of Indonesia or to Indonesian citizens through a public offering or in circumstances which constitute an offer within the meaning of the Indonesian capital market laws and regulations. The Product is made available in Israel through Citibank NA, regulated by the Bank of Israel and the Israeli Securities Authority. Citibank, N.A, Platinum Building, 21 Ha'arba'ah St, Tel Aviv, Israel. The Product is made available in Italy by Citigroup Global Markets Limited, which is authorised and regulated by Financial Services Authority. Foro Buonaparte 16, Milan, 20121, Italy. The Product is made available in Japan by Citigroup Global Markets Japan Inc. ("CGMJ"), which is regulated by Financial Services Agency, Securities and Exchange Surveillance Commission, Japan Securities Dealers Association, Tokyo Stock Exchange and Osaka Securities Exchange. Shin-Marunouchi Building, 1-5-1 Marunouchi, Chiyoda-ku, Tokyo 100-6520 Japan. If the Product was distributed by Nikko Cordial Securities Inc. it is being so distributed under license. In the event that an error is found in an CGMJ research report, a revised version will be posted on the Firm's Global Equities Online (GEO) website. If you have questions regarding GEO, please call (81 3) 6270-3019 for help. The Product is made available in Korea by Citigroup Global Markets Korea Securities Ltd., which is regulated by Financial Services Commission and the Financial Supervisory Service. Hungkuk Life Insurance Building, 226 Shinmunno 1-GA, Jongno-Gu, Seoul, 110-061. The Product is made available in Malaysia by Citigroup Global Markets Malaysia Sdn Bhd, which is regulated by Malaysia Securities Commission. Menara Citibank, 165 Jalan Ampang, Kuala Lumpur, 50450. The Product is made available in Mexico by Acciones y Valores Banamex, S.A. De C. V., Casa de Bolsa, Integrante del Grupo Financiero Banamex ("Accival") which is a wholly owned subsidiary of Citigroup Inc. and is regulated by Comision Nacional Bancaria y de Valores. Reforma 398, Col. Juarez, 06600 Mexico, D.F. In New Zealand the Product is made available through Citigroup Global Markets New Zealand Ltd. (Company Number 604457), a Participant of the New Zealand Exchange Limited and regulated by the New Zealand Securities Commission. Level 19, Mobile on the Park, 157 Lambton Quay, Wellington. The Product is made available in Pakistan by Citibank N.A. Pakistan branch, which is regulated by the State Bank of Pakistan and Securities Exchange Commission, Pakistan. AWT Plaza, 1.1. Chundrigar Road, P.O. Box 4889, Karachi-74200. The Product is made available in Poland by Dom Maklerski Banku Handlowego SA an indirect subsidiary of Citigroup Inc., which is regulated by Komisja Nadzoru Finansowego. Dom Maklerski Banku Handlowego S.A. ul. Chalubinskiego 8, 00-630 Warszawa. The Product is made available in the

India Investor Conference 2010 18 May 2010
Citigroup Global Markets 140
Russian Federation through ZAO Citibank, which is licensed to carry out banking activities in the Russian Federation in accordance with the general banking license issued by the Central Bank of the Russian Federation and brokerage activities in accordance with the license issued by the Federal Service for Financial Markets. Neither the Product nor any information contained in the Product shall be considered as advertising the securities mentioned in this report within the territory of the Russian Federation or outside the Russian Federation. The Product does not constitute an appraisal within the meaning of the Federal Law of the Russian Federation of 29 July 1998 No. 135-FZ (as amended) On Appraisal Activities in the Russian Federation. 8-10 Gasheka Street, 125047 Moscow. The Product is made available in Singapore through Citigroup Global Markets Singapore Pte. Ltd., a Capital Markets Services Licence holder, and regulated by Monetary Authority of Singapore. 1 Temasek Avenue, #39-02 Millenia Tower, Singapore 039192. The Product is made available by The Citigroup Private Bank in Singapore through Citibank, N.A., Singapore branch, a licensed bank in Singapore that is regulated by Monetary Authority of Singapore. Citigroup Global Markets (Pty) Ltd. is incorporated in the Republic of South Africa (company registration number 2000/025866/07) and its registered office is at 145 West Street, Sandton, 2196, Saxonwold. Citigroup Global Markets (Pty) Ltd. is regulated by JSE Securities Exchange South Africa, South African Reserve Bank and the Financial Services Board. The investments and services contained herein are not available to private customers in South Africa. The Product is made available in Spain by Citigroup Global Markets Limited, which is authorised and regulated by Financial Services Authority. 29 Jose Ortega Y Gassef, 4th Floor, Madrid, 28006, Spain. The Product is made available in Taiwan through Citigroup Global Markets Taiwan Securities Company Ltd., which is regulated by Securities & Futures Bureau. No portion of the report may be reproduced or quoted in Taiwan by the press or any other person. No. 1, Songzhi Road, Taipei 110, Taiwan. The Product is made available in Thailand through Citicorp Securities (Thailand) Ltd., which is regulated by the Securities and Exchange Commission of Thailand. 18/F, 22/F and 29/F, 82 North Sathorn Road, Silom, Bangrak, Bangkok 10500, Thailand. The Product is made available in Turkey through Citibank AS which is regulated by Capital Markets Board. Tekfen Tower, Eski Buyukdere Caddesi # 209 Kat 2B, 23294 Levent, Istanbul, Turkey. In the U.A.E, these materials (the "Materials") are communicated by Citigroup Global Markets Limited, DIFC branch ("CGML"), an entity registered in the Dubai International Financial Center ("DIFC") and licensed and regulated by the Dubai Financial Services Authority ("DFSA" to Professional Clients and Market Counterparties only and should not be relied upon or distributed to Retail Clients. A distribution of the different CIRA ratings distribution, in percentage terms for Investments in each sector covered is made available on request. Financial products and/or services to which the Materials relate will only be made available to Professional Clients and Market Counterparties. The Product is made available in United Kingdom by Citigroup Global Markets Limited, which is authorised and regulated by Financial Services Authority. This material may relate to investments or services of a person outside of the UK or to other matters which are not regulated by the FSA and further details as to where this may be the case are available upon request in respect of this material. Citigroup Centre, Canada Square, Canary Wharf, London, E14 5LB. The Product is made available in United States by Citigroup Global Markets Inc, which is regulated by FINRA and the US Securities and Exchange Commission. 388 Greenwich Street, New York, NY 10013. Unless specified to the contrary, within EU Member States, the Product is made available by Citigroup Global Markets Limited, which is regulated by Financial Services Authority. Many European regulators require that a firm must establish, implement and make available a policy for managing conflicts of interest arising as a result of publication or distribution of investment research. The policy applicable to CIRA's Products can be found at www.citigroupgeo.com. Compensation of equity research analysts is determined by equity research management and Citigroup's senior management and is not linked to specific transactions or recommendations. The Product may have been distributed simultaneously, in multiple formats, to the Firm's worldwide institutional and retail customers. The Product is not to be construed as providing investment services in any jurisdiction where the provision of such services would not be permitted. Subject to the nature and contents of the Product, the investments described therein are subject to fluctuations in price and/or value and investors may get back less than originally invested. Certain high-volatility investments can be subject to sudden and large falls in value that could equal or exceed the amount invested. Certain investments contained in the Product may have tax implications for private customers whereby levels and basis of taxation may be subject to change. If in doubt, investors should seek advice from a tax adviser. The Product does not purport to identify the nature of the specific market or other risks associated with a particular transaction. Advice in the Product is general and should not be construed as personal advice given it has been prepared without taking account of the objectives, financial situation or needs of any particular investor. Accordingly, investors should, before acting on the advice, consider the appropriateness of the advice, having regard to their objectives, financial situation and needs. Prior to acquiring any financial product, it is the client's responsibility to obtain the relevant offer document for the product and consider it before making a decision as to whether to purchase the product.
© 2010 Citigroup Global Markets Inc. Citi Investment Research & Analysis is a division and service mark of Citigroup Global Markets Inc. and its affiliates and is used and registered throughout the world. Citi and Citi with Arc Design are trademarks and service marks of Citigroup Inc and its affiliates and are used and registered throughout the world. All rights reserved. Any unauthorized use, duplication, redistribution or disclosure is prohibited by law and will result in prosecution. Where included in this report, MSCI sourced information is the exclusive property of Morgan Stanley Capital International Inc. (MSCI). Without prior written permission of MSCI, this information and any other MSCI intellectual property may not be reproduced, redisseminated or used to create any financial products, including any indices. This information is provided on an "as is" basis. The user assumes the entire risk of any use made of this information. MSCI, its affiliates and any third party involved in, or related to, computing or compiling the information hereby expressly disclaim all warranties of originality, accuracy, completeness, merchantability or fitness for a particular purpose with respect to any of this information. Without limiting any of the foregoing, in no event shall MSCI, any of its affiliates or any third party involved in, or related to, computing or compiling the information have any liability for any damages of any kind. MSCI, Morgan Stanley Capital International and the MSCI indexes are services marks of MSCI and its affiliates. The information contained in the Product is intended solely for the recipient and may not be further distributed by the recipient. The Firm accepts no liability whatsoever for the actions of third parties. The Product may provide the addresses of, or contain hyperlinks to, websites. Except to the extent to which the Product refers to website material of the Firm, the Firm has not reviewed the linked site. Equally, except to the extent to which the Product refers to website material of the Firm, the Firm takes no responsibility for, and makes no representations or warranties whatsoever as to, the data and information contained therein. Such address or hyperlink (including addresses or hyperlinks to website material of the Firm) is provided solely for your convenience and information and the content of the linked site does not in anyway form part of this document. Accessing such website or following such link through the Product or the website of the Firm shall be at your own risk and the Firm shall have no liability arising out of, or in connection with, any such referenced website.
ADDITIONAL INFORMATION IS AVAILABLE UPON REQUEST