Should milk be a factor in a New Zealand asset pricing model?
79
1 | Page Should milk be a factor in a New Zealand asset pricing model? By Mohd Jamil Bin Jelani A research exercise forming a part of the requirement for the degree of Master of Commerce in Finance At the University of Canterbury June 2016
-
Upload
khangminh22 -
Category
Documents
-
view
1 -
download
0
Transcript of Should milk be a factor in a New Zealand asset pricing model?

1 | P a g e
Should milk be a factor in a New Zealand asset
pricing model?
By
Mohd Jamil Bin Jelani
A research exercise forming a part of the requirement for the degree of
Master of Commerce in Finance
At the
University of Canterbury
June 2016

2 | P a g e
Acknowledgements
I would like to express my greater gratitude to my supervisor Dr. Alan Stent whose
expertise, understanding, generous guidance, unwavering support, and mentorship
made it possible for me to work on a topic that was of my keen interest. It was a
pleasure working with him.
I am very grateful to my family for the encouragement which helped me in the
completion of this paper. My beloved and supportive wife Marria and my lovely children
Dannie and Nadia Eva, who serves as my inspiration to pursue this undertaking,
without you, none of this would indeed be possible.
My appreciation and thanks also go to my lecturers, colleague, friends and people who
have willingly helped me out with their abilities.

3 | P a g e
Abstract
In New Zealand, Milk plays a significant role in determining the economic progress of
the country. Since its incorporation in 2001 Fonterra has been the leading dairy
company. It currently accounts for 95% exports of milk produced in New Zealand.
Fonterra is a cooperative, and its stock can only be held by and traded among its
farmer members. For this reason, the fluctuation in milk prices has a strong direct
impact on farmers’ incomes, but just an indirect impact on the incomes of outside (non-
farmer) investors. The Fonterra Shareholder Market is a private market and is not
included in the NZX50. The aim of this project is to explore whether milk price is an
additional factor that investors are exposed to in additional to other market risks that
are measured by the NZX50. An augmented market model is used to explore the
sensitivity between company return, the NZX50, and milk prices. A cointegration test
is also conducted to examine the relationship between market return and milk return.
The project finds some evidence that there was a milk price effect in the period before
2013 when the Fonterra Shareholders’ Fund was created. The Fonterra Shareholders’
Fund provides exposure to milk price risk on the NZX. The effect is a small adjustment
to the usual CAPM beta. There is no evidence of the effect after 2013.

4 | P a g e
Table of Contents
Acknowledgements 2
Abstract 3
List of Figures 7
List of Tables 8
Abbreviations 9
Chapter 1: Introduction
1.1 Overview 11
1.2 Research Questions 12
1.3 To Whom will this study be of interest? 12
1.4 Dissertation Structure 13
Chapter 2: Literature Review
2.1 Asset Models
2.1.1 Capital Asset Pricing Model 15
2.1.2 Three Factor Model 17
2.1.3 Arbitrage Pricing Theory 18
2.2 Economic factors
2.2.1 Oil effect 19
2.3 Milk as an Additional Factor 19
Chapter 3: Milk, Fonterra and the New Zealand economy
3.1 Introduction 22
3.2 Fonterra 22
3.2.1 Trading among Farmers 24
3.2.1.1 The Fonterra Shareholder’ Fund (FSF) 24
3.2.1.2 The Fonterra Shareholders’ Market (FSM) 25

5 | P a g e
3.3 Other Co-Operatives
3.3.1 Westland Co-Operative Dairy Company Limited 25
3.3.2 Tatua Co-Operative Dairy Company 26
3.4 Milk Today 26
Chapter 4: Methodology
4.1 Cointegration Analysis 28
4.2 CAPM Market Model 28
4.3 The period since 2013 30
Chapter 5: Data
5.1 Milk prices 33
5.2 The Market index 33
5.3 Company returns 33
Chapter 6: Results
6.1 Cointegration Analysis 36
6.1.1 Granger Causality test 37
6.2 CAPM Market Model January 2005 to December 2012
6.2.1 Estimates of milk price coefficients 38
6.2.2 Patterns in milk price coefficients 39
6.2.3 Size of milk price effect 41
6.3 The period since 2013 41

6 | P a g e
Chapter 7: Conclusions
7.0 Conclusions 45
7.1 Future research 46
References 49
Appendices
Appendix 1: ADF test for unit roots 58
Appendix 2: Unit Root test on Residuals 61
Appendix 3: Granger Causality test 63
Appendix 4: Result from fitting the CAPM market model, 2005-2012 67
Appendix 5: Result from fitting the CAPM market model, 2013-2016 74
7 | P a g e
List of Figures
Figure 1 Relationship between betas and expected return 15
Figure 2 Portfolio Opportunities and CAPM Model 16

8 | P a g e
List of Tables
Table 1 Companies Categorised by Industry 34
Table 2 ADF test for Unit Roots 36
Table 3 ADF test for Unit Roots on Residuals from Regressing 37
Table 4 Result of Granger Causality Regressing Tests 37
Table 5 Milk coefficient over 2005 to 2012 38
Table 6 Company with significant milk coefficients, 2005-2012 39
Table 7 Regression of milk coefficients on industry grouping
2005-2012 40
Table 8 Estimated adjustment to be the usual CAPM beta
2005-2012 41
Table 9 Company with significant milk coefficients, 2013-2016 42
Table 10 Milk coefficient over 2013 to 2016 42
Table 11 Regression of milk coefficients on industry grouping
2013-2016 43
9 | P a g e
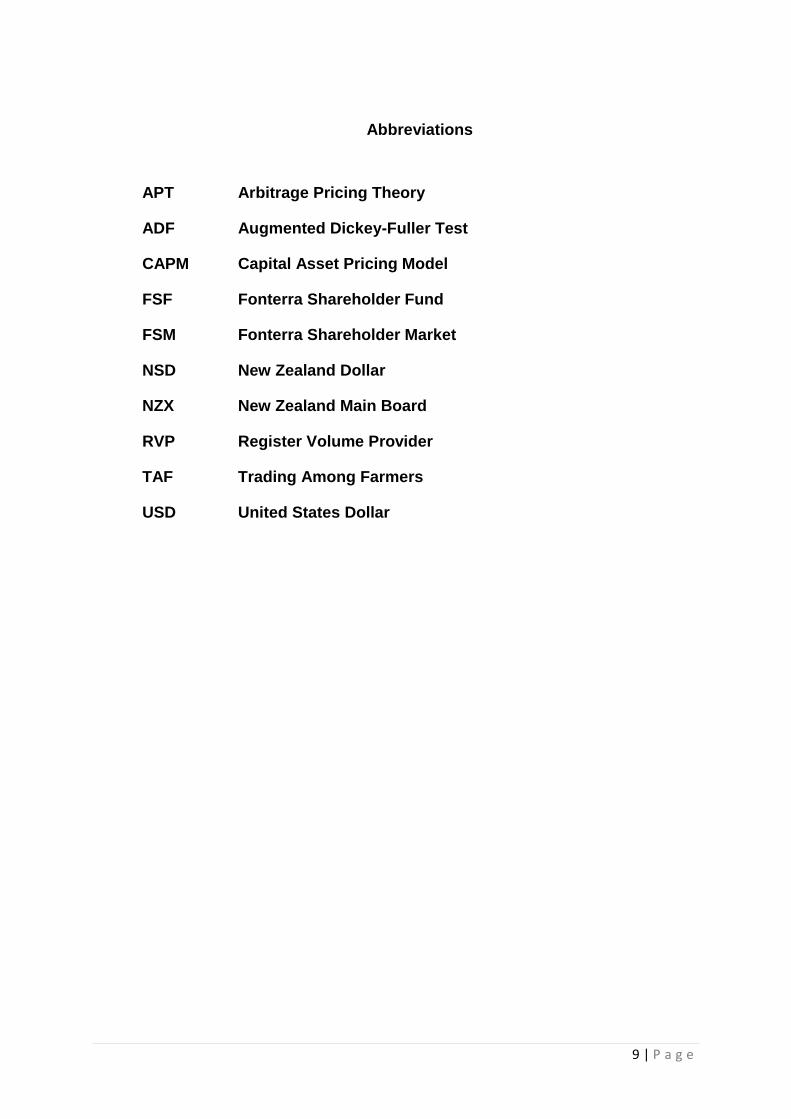
Abbreviations
APT Arbitrage Pricing Theory
ADF Augmented Dickey-Fuller Test
CAPM Capital Asset Pricing Model
FSF Fonterra Shareholder Fund
FSM Fonterra Shareholder Market
NSD New Zealand Dollar
NZX New Zealand Main Board
RVP Register Volume Provider
TAF Trading Among Farmers
USD United States Dollar

10 | P a g e
Chapter One:
Introduction
11 | P a g e
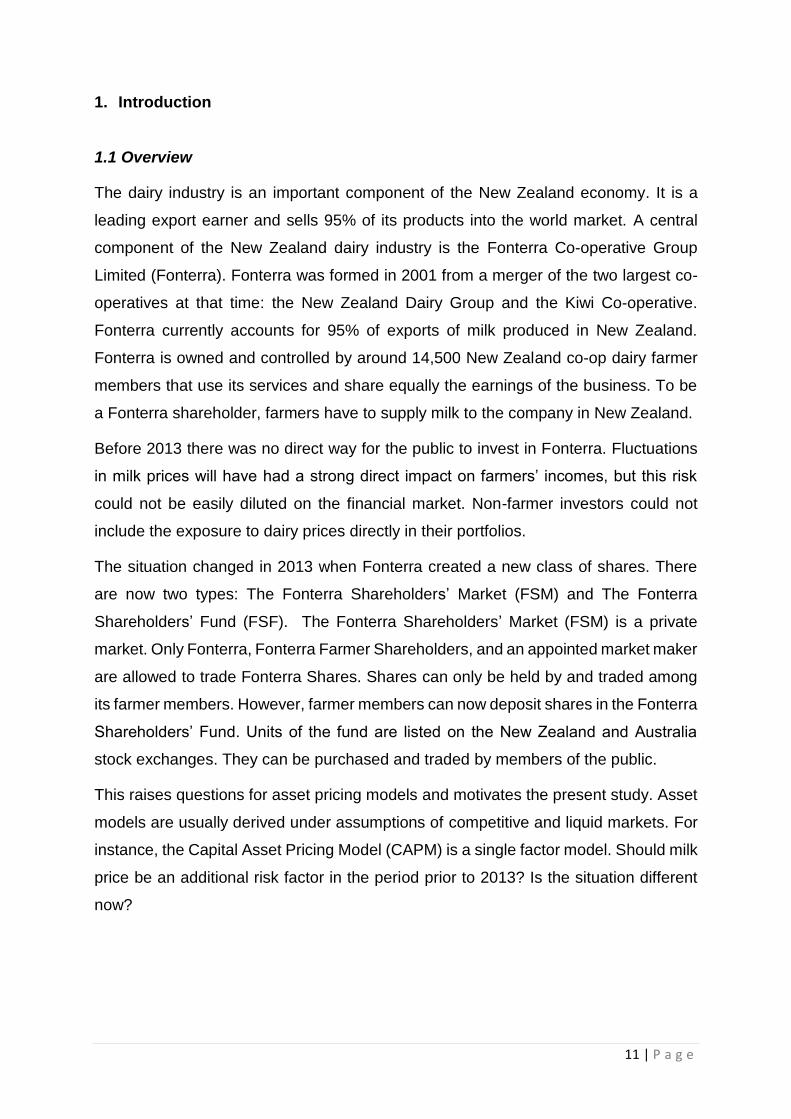
1. Introduction
1.1 Overview
The dairy industry is an important component of the New Zealand economy. It is a
leading export earner and sells 95% of its products into the world market. A central
component of the New Zealand dairy industry is the Fonterra Co-operative Group
Limited (Fonterra). Fonterra was formed in 2001 from a merger of the two largest co-
operatives at that time: the New Zealand Dairy Group and the Kiwi Co-operative.
Fonterra currently accounts for 95% of exports of milk produced in New Zealand.
Fonterra is owned and controlled by around 14,500 New Zealand co-op dairy farmer
members that use its services and share equally the earnings of the business. To be
a Fonterra shareholder, farmers have to supply milk to the company in New Zealand.
Before 2013 there was no direct way for the public to invest in Fonterra. Fluctuations
in milk prices will have had a strong direct impact on farmers’ incomes, but this risk
could not be easily diluted on the financial market. Non-farmer investors could not
include the exposure to dairy prices directly in their portfolios.
The situation changed in 2013 when Fonterra created a new class of shares. There
are now two types: The Fonterra Shareholders’ Market (FSM) and The Fonterra
Shareholders’ Fund (FSF). The Fonterra Shareholders’ Market (FSM) is a private
market. Only Fonterra, Fonterra Farmer Shareholders, and an appointed market maker
are allowed to trade Fonterra Shares. Shares can only be held by and traded among
its farmer members. However, farmer members can now deposit shares in the Fonterra
Shareholders’ Fund. Units of the fund are listed on the New Zealand and Australia
stock exchanges. They can be purchased and traded by members of the public.
This raises questions for asset pricing models and motivates the present study. Asset
models are usually derived under assumptions of competitive and liquid markets. For
instance, the Capital Asset Pricing Model (CAPM) is a single factor model. Should milk
price be an additional risk factor in the period prior to 2013? Is the situation different
now?

12 | P a g e
1.2 Research Questions
This study uses the framework of the Capital Asset Pricing Model to investigate milk
price risk in the context of the New Zealand dairy industry, with co-operative farmers
who have a non-marketable investment risk. It also explores the effects of milk prices
on asset prices over the period 2005 to 2016. Specific questions are:
1. What are the characteristics that would make the risk of an asset greater or
lower in the presence of milk price risk?
2. Does milk price risk have an observable price in New Zealand, or is it completely
diversified?
3. Is there evidence of a milk price effect on assets in New Zealand?
4. Is there evidence of a change in the effect of milk price risk following the change
to Fonterra’s capital structure in 2013?
1.3 To whom will this study be of interest?
This study will be of interest to students of the Capital Asset Pricing Model and its
extensions. The CAPM has known shortcomings and many effects additional to market
risk have been documented in the literature. This study investigates a milk price effect
that can be associated with a particular market imperfection.
The study will also be of interest to financial analysts when forming investors’ portfolios
and calculating the cost of capital for publicly listed companies. Financial analysts need
to understand the effects of this market imperfection even if it is small, and whether it
is ongoing.
This research will also be an interest to other countries that might have similar market
imperfections. For instance, cooperatives include the Arla Cooperatives in the
European Union, Friesland Campina Cooperative in the Netherlands, Foremost Farms
Cooperative in the U.S, Began Cooperative in Australia and Amul Cooperative in India.

13 | P a g e
1.4 Dissertation structure
The organisation of this dissertation is as follows. Chapter 2 is a literature review.
Chapter 3 examines the role of Milk and of Fonterra in the New Zealand economy.
Chapter 4 presents the methodology used in the study. Chapter 5 outlines the data.
Chapter 6 presents the results. Chapter 7 concludes.

14 | P a g e
Chapter Two:
Literature Review

15 | P a g e
2. Literature Review
2.1 Asset Models
2.1.1 Capital Asset pricing model
The Capital Asset pricing model (CAPM) was developed simultaneously by William
Sharpe (1964) and Treynor (1961), and was developed further by Mossin (1966), John
Linter (1965) and Black (1972). It argues that the expected return on a security
depends only on the sensitivity of its return to the market return. It is a single factor
model where the stock return is explained solely by the market return. Specifically,
expected return on a stock is determined by the risk-free rate of return, the stock’s
beta, and the expected market return.
Essentially, it states an asset is expected to earn a risk-free rate of return plus a
compensation for bearing risk. Figure 1 describes the relationship between beta and
expected return, and it is the Security Market Line.
Figure 1: Relationship between beta and expected return
Source: Business Finance Online
CAPM can be used to evaluate active fund manager performance as it builds on the
model of portfolio choice developed by Harry Markowiz (1959). It assumes that the
risk-return profile of a portfolio can be optimised i.e. an optimal portfolio displays the
lowest possible level of risk for its level of return. It is the set of portfolios each with the

16 | P a g e
feature that no other portfolio exists with a higher expected return but with the same
standard deviation of return. The optimal portfolio must comprise every asset, with
each asset value-weighted to achieve the above. All such optimal portfolios, i.e., one
for each level of return, comprise the efficient frontier.
Because remaining risk, which is unsystematic risk is diversifiable, the total risk of a
portfolio which the market will price, can be measured as beta. Figure 2 describes the
portfolio opportunities and the CAPM model. The diagram is taken from the Wikipedia
website.
Figure 2: Portfolio opportunities and the CAPM model
Criticism of the CAPM has emerged over time and the empirical record is poor. There
is evidence that market return alone is not sufficient to describe expected return, and
there are other variables. A list follows.
Market capitalization by Banz (1981). He finds that the shares of firms with large
market capitalization have lower average return than low market capitalization stock
and large firms tend to have lower return even after controlling Earning /Price ratio.
Leverage by Bhandari (1988). He included leverage as a function of average return
as high leverage will increase the riskiness of firm equity and beta coefficient.
The book-to-market ratio by Chan, Hamao and Lakonishok (1991). They find that
book to market equity has a direct impact on the relationship with expected return.

17 | P a g e
Winner/Loser stock by DeBondt and Thaler (1985). They find that stocks that had a
good return over the past three to five years have much lower average returns than
‘losers’ over the next three to five years.
Momentum by Jegadeesh (1990, 1993) and Titman (1993). They find that stock return
exhibits a short-term momentum, and momentum is strong for firms with poor recent
performance.
There is a study on CAPM anomalies in New Zealand by Gillan (1990). Gillian
investigates the price-earning (P/E) ratio and small firm effects on the New Zealand
Stock Exchange (NZSE). He applies the method developed by Banz (1981) and
Reinganum (1981), to 200 securities on the NZSE over the period of 1977 to 1984. He
found evidence for a small firm effect, but not for a P/E effect on the NZSE.
2.1.2 Three factor model
In contrast with the CAPM that uses only one variable to explain return on stocks,
Fama and French (1992) propose a model which controls size and book-to-market
ratio as well as beta. They used three variables to describe the return on stocks. It
starts with the observation that two classes of stocks do better than the market, i.e.
Small Caps stock and stocks with a low Price-to-Book ratios, and then adds these two
factors to the CAPM. This three factor model explains portfolios of returns better than
the one factor CAPM.
The new factors are calculated with combinations of portfolios composed by ranking
stocks available from historical market data. In summary, the Fama-French three-
factor model viewed both size and value as risk factors, for which one is rewarded with
extra return.

18 | P a g e
2.1.3 Arbitrage Pricing theory
The Arbitrage Pricing Theory (APT) was developed by Ross (1976). It offers a testable
alternative to the CAPM. It hypothesises that stock return is affected by a range of
exogenous variables. It is influenced by systematic risk in the economy which affects
all stocks to some degree. APT includes multiple factors that represent the
fundamental risks in asset return and thus the prices of securities.
The APT is derived under the usual assumption of a perfectly competitive and
frictionless capital market. In equilibrium all portfolios that can be selected from among
the set of assets under consideration and that satisfy the condition of using no wealth
and having no risk, must earn no return on average. These portfolios are called
arbitrage portfolios.
Kazi M.H. (2008) applied APT on six a priori proxy variables to identify the systematic
risk factors for the Australian stock market. Initially, 15 relevant macro-variables were
considered to be the proxy. Through a variable selection process, the initial fifteen
variables were reduced to six. Although not all variables are significantly influential,
the linear combination of these six variables is observed to be cointegrated. He found
that in the long-run 5 variables: bank interest rate, dividend yield, corporate profitability,
industrial production and global market movements significantly influence the Australia
stock market returns, but in the short-run it will be affected by only 3 variables: its own
performance, interest rates and global stock market movements.
2.2 Economic factors
An effect on asset prices might be present in an economy with a dominant resource,
such as oil or a commodity. Oil is a common example.

19 | P a g e
2.2.1 Oil effect
Over recent years, the impact and role of oil on stock prices and the financial market
have been studied, among other variables, by a number of researchers. Bopp & Lady
(1991), Farmer (1993), Moosa & Al-Loughani (1994), and Foster (1996), have
analysed how forward and future prices effect oil related contracts. Strong (1991)
examined how investors use oil equity portfolios to hedge the risk of oil price. Chen,
Roll and Ross (1986), Hamao (1989), Al-Mudhaf and Goodwin (1993), Kaneko and
Lee (1995), and Jones and Kaul (1996) investigated whether oil price has an influence
in determining the price of equities in U.S, Canada, Japan and U.K markets.
Chen et al. implemented a multi-factor asset pricing model test using a macroeconomic
set of variables and including the possibility that return series from oil prices could
constitute an economic pricing factor. They found no evidence in a sample of U.S.
equities to suggest that such a factor exists. Hamao applying the same approach as
Chen et al. to the Japanese market, obtained a similar result.
However, Kaneko and Lee discovered that an oil price change factor is important in a
recent sample of Japanese equity data. Jones and Kaul is a most comprehensive study
on the impact of oil price changes in Canada, Japan, the U.K and U.S. They found that
oil price changes have an unfavourable effect on output and real stock returns in all
the four countries.
2.3 Milk as an additional factor
Milk is an important commodity in the New Zealand economy and is a possible
additional economic factor for an asset pricing model. The role of Fonterra which is a
co-operative owned by around 14,500 New Zealand dairy farmers, is also significant.
Until 2003 when the Fonterra Shareholders’ Fund was created, investors could not
include the exposure to dairy prices directly in their portfolios. One of the assumptions
of the CAPM model is that investments are publicly traded assets; i.e. all assets are
perfectly marketable (liquid). The dairy assets of the New Zealand farmers were not
liquid and not part of the investment set in the CAPM. Mayers (1972, 1973) treated the
similar issue of personal capital. He extended the CAPM for the case where there are
two kinds of assets: marketable (perfectly liquid) and nonmarketable (perfectly
20 | P a g e
nonliquid). The extended model shows that the linear form of the risk-expected return
relationship is similar to the original CAPM model, but an asset’s beta now depends
on the covariance with non-marketable assets as well as with the market index. Fama
and Schwert (1977) reviewed Mayers (1973) extended model and argued that the
effect on the risk measure beta will be small for the case of human capital and not have
important effects. However, the effect for a significant asset like milk might be different.
This is an empirical issue which motivates the present study.
Many researchers have continuing interest in studying the role and impact of oil and
other commodities on the financial market and stock prices. To my knowledge, there
has been no research in studying the role of milk.
21 | P a g e
Chapter Three:
Milk, Fonterra and the
New Zealand Economy

22 | P a g e
3. Milk, Fonterra and the New Zealand Economy
3.1 Introduction
Since the early 1800s, the New Zealand dairy industry has gone from farmers keeping
a few domestic cows in the bush to being a world leader (Hugh and Frank,2012). In
2009, the New Zealand dairy industry had export sales of more than NZD13.7 billion
making it a leading export earner and selling 95% of its dairy products abroad, which
is a greater proportion than any other country (Dairying Today,2015). As at 2015 New
Zealand is one of the major exporters of whole milk powder (WMP) capturing almost
65% of the world market. (IndexMundi,2016).
The dairy industry has always played a significant role in the New Zealand economy.
It had contributed an amount of NZD18.1 billion in 2014, being 25% of New Zealand
export earnings. It has fed more than 100 million people worldwide. It represents
approximately one-third of international dairy trade each year.
In New Zealand farmers receive no subsidies, which has encouraged a focus on low-
cost, high productivity farming system. The dairy processing facilities in New Zealand
are mostly co-operatively-owned by farmers, with the main co-operatives being
Fonterra, Westland and Tatua.
3.2 Fonterra
The first co-operative company in New Zealand was established in Otago in 1871, to
benefit from the pooled resources. By 1930s most dairy factories in New Zealand were
owned by co-operatives, and more than 400 begin selling their products overseas;
however this became difficult, so in 1923 to control all dairy exports the New Zealand
government established the Dairy Export Produce Control Board.
With the Dairy Board, farmers are able to access new markets and able to gain better
returns for their production, and make the milk industry grow and prosper. As a result,
to become more efficient, aided by improved technologies in transport and

23 | P a g e
refrigeration, co-operatives began joining forces. By the 1960s, a total of 400 co-
operatives had merged to 168 co-operatives.
In the 1960s, the New Zealand Milk industry started to diversify their markets and
product ranges. By the 1980s they had 19 overseas subsidiaries and associated
companies. In 1995 it had increased to 80. The New Zealand Dairy Board become the
world's largest dedicated dairy marketing network.
In 1996, the industry then consolidated further to only 12 dairy companies. When the
Government transferred the Dairy Board's assets to them, the competing dairy co-
operatives were forced to work together for the first time. By the end of 2000, two major
companies - New Zealand Dairy Group and Kiwi Co-operative Dairies - represented
more than 95 percent of the industry. Two smaller co-operatives, Westland and Tatua,
held the remaining 5 per cent.
In 2001, the two largest co-operatives, New Zealand Dairy Group and Kiwi Co-
operative, merged to form Fonterra. It is a leading multinational dairy company, owned
by around 14,500 New Zealand dairy farmers and is responsible for approximately
30% of world dairy exports and it is the world’s largest exporter of dairy products. The
Fonterra Group's global supply chain stretches from Fonterra’s shareholders' farms in
New Zealand through to consumers in more than 100 countries and markets over 2
million tonnes of product annually. This makes the Fonterra Group the world's leader
in large scale milk procurement, processing and management, with some of the world's
best-known dairy brands including Anchor, Anlene and Anmum.
As a co-operative, Fonterra is owned and controlled by the co-op members that use
its services and share equally the earnings of the business. In order to be Fonterra
shareholders, farmers have to supply milk to the company in New Zealand. Fonterra
shareholders hold one share for each kilogramme of milk solids they supply to the co-
operative, with the exception of a limited number of shareholders supplying milk under
contact arrangements.
There are two different types of shares at Fonterra, The Fonterra Shareholders’ Market
and The Fonterra Shareholders’ Fund.
24 | P a g e
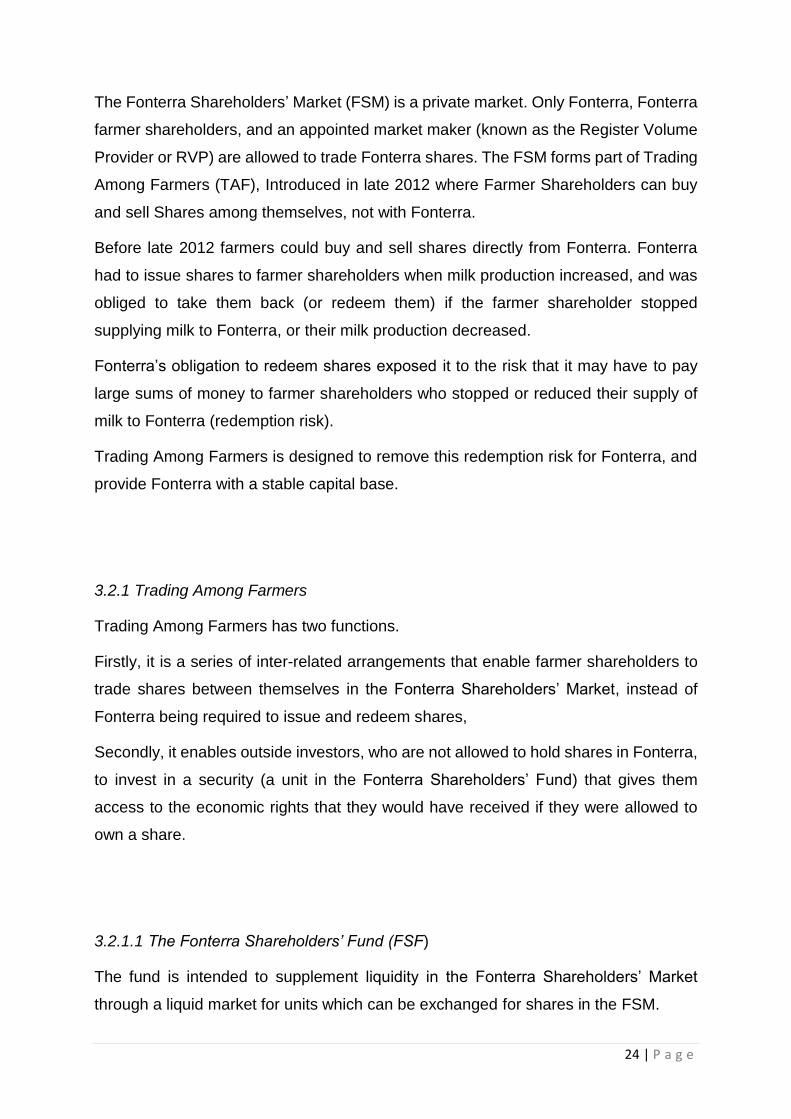
The Fonterra Shareholders’ Market (FSM) is a private market. Only Fonterra, Fonterra
farmer shareholders, and an appointed market maker (known as the Register Volume
Provider or RVP) are allowed to trade Fonterra shares. The FSM forms part of Trading
Among Farmers (TAF), Introduced in late 2012 where Farmer Shareholders can buy
and sell Shares among themselves, not with Fonterra.
Before late 2012 farmers could buy and sell shares directly from Fonterra. Fonterra
had to issue shares to farmer shareholders when milk production increased, and was
obliged to take them back (or redeem them) if the farmer shareholder stopped
supplying milk to Fonterra, or their milk production decreased.
Fonterra’s obligation to redeem shares exposed it to the risk that it may have to pay
large sums of money to farmer shareholders who stopped or reduced their supply of
milk to Fonterra (redemption risk).
Trading Among Farmers is designed to remove this redemption risk for Fonterra, and
provide Fonterra with a stable capital base.
3.2.1 Trading Among Farmers
Trading Among Farmers has two functions.
Firstly, it is a series of inter-related arrangements that enable farmer shareholders to
trade shares between themselves in the Fonterra Shareholders’ Market, instead of
Fonterra being required to issue and redeem shares,
Secondly, it enables outside investors, who are not allowed to hold shares in Fonterra,
to invest in a security (a unit in the Fonterra Shareholders’ Fund) that gives them
access to the economic rights that they would have received if they were allowed to
own a share.
3.2.1.1 The Fonterra Shareholders’ Fund (FSF)
The fund is intended to supplement liquidity in the Fonterra Shareholders’ Market
through a liquid market for units which can be exchanged for shares in the FSM.

25 | P a g e
FSF is a unit trust formed under the Unit Trusts Act. It is managed by a Manager and
has a Trustee. Units can be exchanged for shares of FSM (and vice versa) by Farmer
Shareholders, Fonterra and the Registered Volume Provider on a one-for-one basis.
Other investors cannot exchange units for shares in FSM. Units of FSF are listed on
the NZX Main Board and on the ASX and can be freely bought and sold, in the same
way as any other listed security.
3.2.1.2 Fonterra Shareholders’ Market (FSM)
The Fonterra Shareholders’ Market is operated by the NZX. It is regulated and
monitored by NZX and the Financial Markets Authority, in the same way as other
markets are operated by NZX. Farmer shareholders, Fonterra and the Register
Volume Provider (RVP) can buy or sell shares in the Fonterra Shareholders’ Market,
and buy or sell units of FSF on the NZX Main Board or ASX. They can effectively
exchange shares of FSM for units of FSF and vice versa and therefore can shift
between the two markets. The intended result is that shares (FSM) and units (FSF)
should trade at very similar prices. This is referred to as the convergence of prices for
shares and units. Although there are two separate markets, they have been designed
to work together.
3.3 Other Co-operatives
3.3.1 Westland Co-operative Dairy Company Limited.
Westland is an independent co-operative dairy company in New Zealand, owned by
over 425 farmer shareholders that supply milk for processing locally. In 2001, following
the deregulation of the New Zealand dairy industry Westland Milk Products
shareholders voted not to join Fonterra and remain independent.
Westland sourced their milk from farms as far Karamea in the north and as far as Haast
to the south of the West Coast and from farms throughout Canterbury. Their major
processing factory is located in the town of Hokitika, and their main milk concentration
plant and warehouse located near the small town of Rolleston outside Christchurch.

26 | P a g e
3.3.2 Tatua Co-operative Dairy Company
Tatua is an independent small co-operative dairy company in the small rural locality of
Tatuanui in the North Island of New Zealand. Tatua co-operative is owned by 112
farmer shareholders, all within a 12-kilometre radius of the processing factory.
The co-operative has maintained a strong independence by becoming the only New
Zealand dairy co-operative that remains and has never been part of any merger
throughout its history
In the 2001 mega-merger for the New Zealand dairy industry - which formed Fonterra
- Tatua shareholders decided to remain independent. Tatua, despite being the
smallest dairy company in New Zealand, often records the highest payout for milk
solids to its farmer shareholders, one of the main factors why Tatua decided to remain
independent. Their high pay-out is mainly due to their focus on value-added milk
products as compared to the traditional, mass-produced, of commodity-based milk
products such as milk powder, butter and cheese. It is also due to a small catchment
area which reduces processing costs.
3.4 Milk today
The increases in the global supply of milk, coupled with a relatively static demand of
milk and dairy products, has seen average dairy prices fall around 50% since early
2014. The price fall affects the incomes of farmers and the New Zealand economy as
well. The falling of dairy export has a direct impact on the economy by affecting the
dairy manufacturers and farmers. Dairy manufacturers receive less income from export
sales and, therefore, reduce incomes to farmers by reducing the farm gate prices.
These falling incomes will reduce consumption by the farmer in rural areas, and the
farm will try to reduce operational and capital expenses which will reduce revenue and
profits of companies that supply the dairy sector. Overall the reduced incomes will
eventually translate into lower spending and investment throughout the economy.

27 | P a g e
Chapter Four:
Methodology

28 | P a g e
4. Methodology
4.1 Cointegration Analysis
The study first investigates the relationship between the market index and milk prices
measured in NZD. The NZX50 is used as the market index. The two series, the market
index and milk prices, are tested for cointegration over the period December 2004 to
January 2016. The logarithms of the series are used. They are first tested and found
to be random walks, integrated of order one. Such series are cointegrated when there
is a long-run linear relationship between them. If there is a linear relationship the
difference between the series is not a random walk, but reverts to a common trend. On
the other hand if the market index and milk prices are cointegrated then they are a
common factor. Milk would not be an additional risk factor that general investors in
New Zealand are exposed to in additional to other market risks.
A Granger causality test is also conducted to investigate the impact that changes in
milk prices have on the stock index. If the market index and milk prices are not
cointegrated it is still possible that milk prices influence the index: milk price might have
a partial or delayed effect.
4.2 CAPM market model
After the cointergration analysis, a market model is fitted for all NZX companies,
individually. This model regresses the monthly return for each company on the market
index and the milk price variable over the period January 2005 to December 2012
𝑟𝑎 = 𝛼 + 𝛽𝑎𝑟𝑀 + 𝛾𝑟𝑃 + 𝜀 (3)
where
ra is the return on asset a,
𝑟𝑀 is the return on the market index,
and 𝑟𝑃 is the log ratio of the monthly milk price variable, 𝑙𝑛(𝑃𝑡/𝑃𝑡−1).

29 | P a g e
This period lies completely in the time before Fonterra Shareholder Fund (FSF) shares
were introduced. It is kept short as parameters like beta will change over time.
There are two reasons why Equation (3) is fitted to companies individually, rather than
to portfolios of companies as is done by, for instance, Fama and French (1996) and
Gillan (1990). Firstly, milk price is not a factor that varies from one company to the
next. In each month the milk price variable takes the same value for every company.
Forming portfolios of companies would not help isolating a milk price effect. The
second reason for fitting Equation (3) to companies individually, is that it allows the
market beta to vary from one company to the next. In this way, the various factors like
the size effect and the book-to-market effect, which have been found to be risk factors,
are taken into account.
The specification of Equation (3) starts with the capital asset pricing model (CAPM). In
the CAPM the expected return on a security depends on the sensitivity of its return to
the market return.
E(𝑟𝑎) =𝑟𝑓 + 𝛽𝑎(E(𝑟𝑀) − 𝑟𝑓) (4)
where
𝑟𝑓 is the Risk free rate,
𝛽𝑎 is the Beta of the security,
and 𝑟𝑀 is the market return.
In New Zealand over the period 2005 to 2012 there are two different groups of
investors. Firstly there are farmer investors who can invest in any shares traded on the
NZX, and also shares in Fonterra. Secondly, other investors (non-farmer) who can
trade in shares listed on the main board only. Until 2013 these investors could not
include exposure to dairy prices directly in their portfolios.
The situation is like looking at the return on non-marketable human capital that is held
by an individual. This issue has been explored by Mayers (1972). Mayers extends the
two-parameter model of CAPM to include nonmarketable assets such as human
capital. The New Zealand dairy farmers are like an individual with a non-marketable

30 | P a g e
asset. Mayers shows that when an investor is constrained to hold non-marketable
assets that have risky rates of return (rH) the CAPM take the following form:
𝐸(𝑟𝑎) = 𝑟𝑓 + 𝜆[𝑉𝑀cov(𝑟𝑎,𝑟𝑀)+cov(𝑟𝑎,𝑟𝐻)] (5)
Where
𝜆 =𝐸(𝑟𝑀)−𝑟𝑓
𝑉𝑀 𝜎𝑀2 +cov(𝑟𝑀,𝑟𝐻)]
(6)
𝑉𝑀 is the current value of all marketable assets,
and 𝑟𝐻 is the total return on all nonmarketable assets.
In the above formula covariance is still the measure of risk but we now need to consider
the covariance between an asset 𝑎 and the non-marketable asset as well as with the
market index. The log ratio of milk prices is like 𝑟𝐻 the return on dairy assets. If the
return on another marketable asset 𝑟𝑎 is more sensitive to milk prices than the market
return 𝑟𝑀 is, then its beta will be larger than the usual CAPM. If the return on another
marketable asset is less sensitive to milk prices than the market return is, then its beta
will be smaller than the usual CAPM.
The relationship between an asset and the milk price will be the source in determining
the sign of the coefficient of the milk price variable in Equation (3). An asset which is
more sensitive to milk prices than the market return is will result in a positive sign for
𝛾 in Equation (3). An asset which is less sensitive will give a negative sign for 𝛾.
4.3 The period since 2013
As Fonterra Shareholder Fund (FSF) shares were only listed in January 2013, whereas
prior to being listed farmers could only trade their milk shares among themselves, the
market model is fitted for the period since 2013 separately and a Chow test conducted

31 | P a g e
to investigate if there is any difference in coefficients between the two periods. While
a different reaction before and after Fonterra shares were listed is an interesting
question, it is noted that the period since 2013 is very short, and the test will not be
very powerful.

32 | P a g e
Chapter Five:
Data

33 | P a g e
5. Data
5.1 Milk prices
Monthly milk prices were download from Global Dairy Trade, an auction platform set
up by Fonterra to trade commodity dairy products. The Oceania milk power price was
used which is representative of Fonterra’s price (Understanding Dairy Markets (2016),
International Dairy Product Prices).
The price is quoted in USD. It was converted to NZD using the exchange rate
downloaded from the Reserve Bank of New Zealand.
5.2 The Market index
The NZX50 is used as the market index. Monthly observations were downloaded from
Yahoo Finance.
5.3 Company returns
Prices for company stocks were downloaded from Yahoo Finance. There were 116
companies with sufficient data for analysis over the period analysed. These are listed
in Table 1. Companies were categorised by industry based on information from PwC
Appreciating Value New Zealand, March 2015. The industries are also indicated in
Table 1. Company returns were measured as the log-ratio of prices, 𝑙𝑛(𝑃𝑡/𝑃𝑡−1).

34 | P a g e
Table 1:Companies Categorised by Industry
Agriculture Health care Retail
A2 Milk EBOS Group SmartMIDZ Hallenstein Glasson Hdg
Sanford Fisher & Paykel Hlthcr Marlin Global Limited Michael Hill Intl
Allied Farmers Limited Metlifecare Smart MOZY Restaurant Brands NZ
Fonterra Shareholder Pacific Edge Ltd SmartOZZY Warehouse Group
PGG Wrightson Limited Ryman Healthcare Rubicon Limited Ordina Briscoe Group Limited
Seeka Kiwifruit Indust Abano Healthcare Group The City of London Ind The Colonial Motor Cor
T&G Global Limited Ord BLIS Technologies Limi SmartTENZ Kathmandu Holdings Lim
Green Cross Health Lim Veritas Investments Kircaldie & Stains
Construction Pacific Brands Limited
Fletcher Building Indusrial Prodn Media telecom Pumpkin Patch Limited
Nuplex Industries Skellerup Holdings Sky Network Television Smiths City Group Limi
Steel And Tube Holdings Mercer Group Limited Spark New Zealand
Downer EDI Limited Ord Methven Limited Ordina APN News & Media Limit Services
Tenon Limited Ordinary Scott Technology Limit Telstra Corporation AWF Madison Group Limi
Sealegs Corporation TeamTalk Limited Ordin Cleanaway Waste Manage
Consumer Wellington Drive Techn Opus International Cor
Cavalier Corporation Mining Trade Me Group Limited
Comvita Limited Ordina Information Tech New Talisman Gold Mi TRS Investments Limite
Delegat Group Limited Finzsoft Solutions Lim New Zealand Oil & Gas Tourism leisure
Promisia Integrative Rakon Limited Ordinary OceanaGold Corporation Sky City Entm Gp
SeaDragon Limited Ordi Smartpay Holdings Limi Pan Pacific Petroleum Millennium & Copthor
Trilogy International Templeton Emerging M Tourism Holdings Limit
VMob Group Limited Ord Ports
Financial Xero Limited Ordinary Auckland Intl Airport Transport
ANZ Banking Group Port Of Tauranga Air New Zealand
NZX Investment Marsden Maritime Holdi Freightways
Tower Coats Group South Port New Zealand Mainfreight
Westpac Banking Corp NZ Hellaby Holdings
AMP Limited Ordinary Infratil Property Utilities
ASB Capital Limited Australian Foundation Argosy Property Contact Energy
Heartland Bank Limited Aorere Resources Limit Goodman Property Trust New Zealand Refining
Pyne Gould Corporation Bethunes Investments Kiwi Property Group Trustpower
Turners Limited Ordina The Bankers Investment Precinct Properties NZ Vector Ltd
Barramundi Limited O Property For Industry Chorus Limited (NS)
SmartFONZ Vital Healthcare Pr Tst
Henderson Far East Ind Augusta Capital Limite
JPMorgan Japanese Indu CDL Investments New
Kingfish Limited Ordin NPT Limited Ordinary

35 | P a g e
Chapter Six:
Results

36 | P a g e
6. Results
6.1 Cointegration Analysis
This section reports the results of the cointegration analysis performed on the two
series, the NZX50 and milk prices measured in NZD. The logarithms of both series
were used. Cointegration exists when there is a long-run linear relationship between
two series both integrated of the same order, one. An augmented Dickey–Fuller test
(ADF) developed by Dickey and Fuller (1979, 1981) is used to test whether they have
unit roots. The augmented Dickey–Fuller (ADF) statistic, used in this test, is a negative
number. The more negative it is, the stronger the rejection of the hypothesis that there
is a unit root at some level of confidence. The statistical output of the tests are
contained in Appendix 1, and the results summarised in Table 2.
Table 2: ADF test for unit roots
Z value 5% Critical value
NZX50 -1.751 -3.446
Milk Price in NZD -2.279 -3.446
From the table, it is seen that both NZX50 and Milk prices have Z values higher than
the 5% Critical value. The tests fail to reject null hypotheses of unit roots. So NZX50
and Milk prices are each not stationary, and the conclusion is that they are integrated
of order one. The series might be cointegrated.
To test whether the series are cointegrated the procedure in Engle and Granger (1987)
is followed. The logarithm of the market index is regressed on the logarithm of the milk
price variable and the residuals tested for stationarity using the ADF test. If the
residuals have a unit root they are not stationary and the conclusion is that the two
series are not cointegrated. The results from this procedure are in Appendix 2 and the
unit root test on the residuals is summarised in Table 3.
37 | P a g e
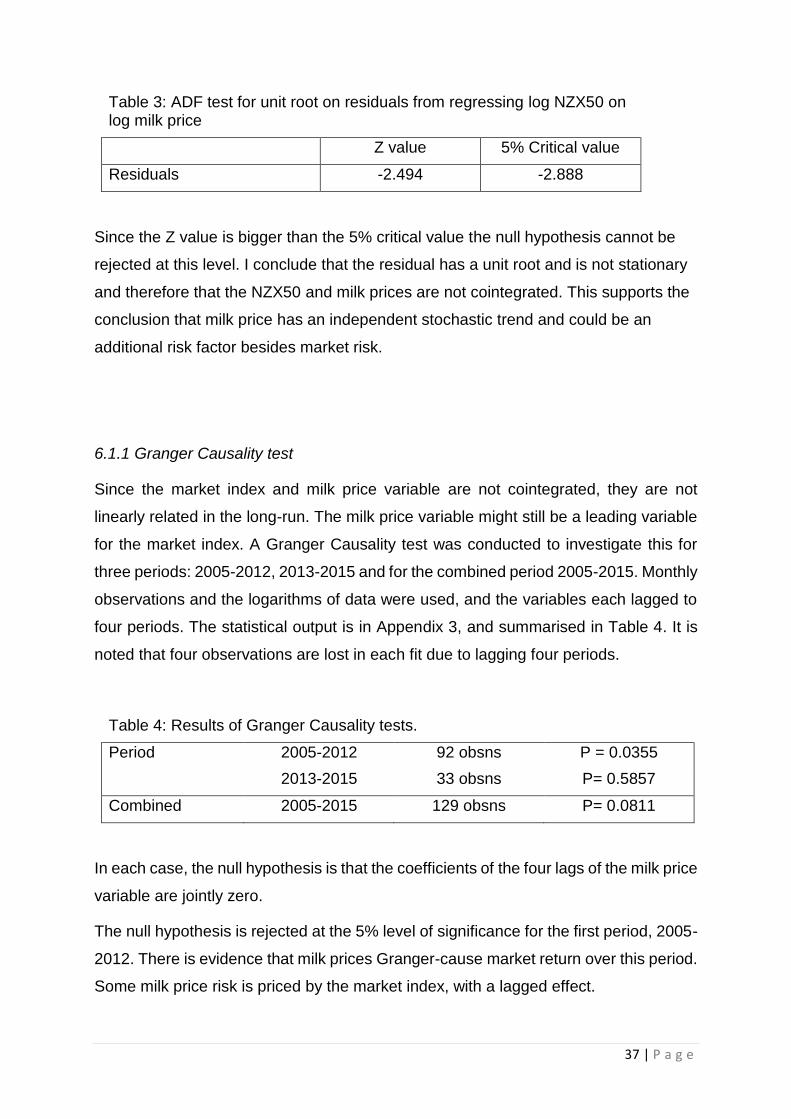
Table 3: ADF test for unit root on residuals from regressing log NZX50 on log milk price
Z value 5% Critical value
Residuals -2.494 -2.888
Since the Z value is bigger than the 5% critical value the null hypothesis cannot be
rejected at this level. I conclude that the residual has a unit root and is not stationary
and therefore that the NZX50 and milk prices are not cointegrated. This supports the
conclusion that milk price has an independent stochastic trend and could be an
additional risk factor besides market risk.
6.1.1 Granger Causality test
Since the market index and milk price variable are not cointegrated, they are not
linearly related in the long-run. The milk price variable might still be a leading variable
for the market index. A Granger Causality test was conducted to investigate this for
three periods: 2005-2012, 2013-2015 and for the combined period 2005-2015. Monthly
observations and the logarithms of data were used, and the variables each lagged to
four periods. The statistical output is in Appendix 3, and summarised in Table 4. It is
noted that four observations are lost in each fit due to lagging four periods.
Table 4: Results of Granger Causality tests.
Period 2005-2012 92 obsns P = 0.0355
2013-2015 33 obsns P= 0.5857
Combined 2005-2015 129 obsns P= 0.0811
In each case, the null hypothesis is that the coefficients of the four lags of the milk price
variable are jointly zero.
The null hypothesis is rejected at the 5% level of significance for the first period, 2005-
2012. There is evidence that milk prices Granger-cause market return over this period.
Some milk price risk is priced by the market index, with a lagged effect.

38 | P a g e
It is interesting that the null hypothesis cannot be rejected for the second period, 2013-
2015. This period is very short, and the test, therefore, does not have much power.
When the two periods are combined, the null hypothesis cannot be rejected at the 5%
level of significance. There is some evidence that the relationship between the market
index and milk prices has changed with the introduction of Fonterra Shareholder Fund
(FSF) shares to the NZX.
6.2 CAPM market model January 2005 to December 2012
6.2.1 Estimates of milk price coefficients
The results from fitting Equation (3) on page 28 to 115 companies on the NZX using
monthly return from January 2005 to December 2012 are presented in Appendix 4. Not
all these companies were present for the whole period, but were fitted for the period
they were available. The main variable of interest is the estimated coefficient of the
milk variable. This is summarised in Table 5, and the cases where the coefficient is
significantly different from zero are listed in table 6, it shows that all the estimated
coefficients were small. The range was -0.475 to 0.342.
Table 5: Milk coefficient estimated over 2005 to 2012
Negative Positive
Milk coefficient 58 Cases 57 Cases
Significant at:
5% level 2 Cases 5 Cases
10% level 6 Cases 6 Cases

39 | P a g e
Table 6: Companies with significant milk coefficients Company Industry Coef. t
Positive at 5% level Fletcher Building Construction 0.156 2.298 Sanford Agriculture 0.158 2.395 JPMorgan Japanese Investment 0.342 2.027 Kircaldie & Stains Retail 0.172 2.601 Opus Int. Corb. Services 0.196 2.043 10% level Henderson Far East Investment 0.353 1.742
Negative at 5% level Spark New Zealand Telecom -0.200 -2.428 Pan Pacific Petroleum Mining -0.475 -2.550 10% level Air New Zealand Transport -0.215 -1.894 EBOS Group Healthcare -0.111 -1.893 Kiwi Property Group Property -0.089 -1.940
Green Cross Health Healthcare -0.367 -1.813
The number of significant cases is not much different from random in 115 fits. However
for many companies the economic effect of milk prices would be very small and
statistical significance from zero would not be expected anyway. Some significant
cases might be explained using Mayers’ extension to the CAPM. For example, Fletcher
Building has a positive milk coefficient with t=2.298. Farmers’ building activity might be
more sensitive to dairy farmer incomes than other investors’. The EBOS milk
coefficient is negative with t=-1.893. This company has interests in animal care. Animal
costs might be fixed and farmers’ activity less sensitive to dairy farmer incomes than
others investors’.
6.2.2 Patterns in milk price coefficients
The study also looked for patterns in the estimated milk coefficients. According to
Fisher:
The most impressive kind of econometric result is not that of goodness of fit
but that of a striking and plausible pattern in the point estimates obtained by
treating similar problems in a similar way. (Fisher, 1962)

40 | P a g e
The estimated coefficients were regressed on dummy variables for the 17 industry
groupings in Table 1. Because the coefficients are estimated, weighted least squares
was used. The reciprocals of standard errors of the estimated milk coefficients were
used for weights so that companies with large standard errors have smaller influences
on the results. The results are presented in table 7.
There is a plausible Pattern. The regression is significant at the 10% level, and almost
at the 5% level. Industries where there would be an elastic income effect, such as
Construction, Consumer, Retail and Services have positive effects. Industries where
income effects are probability inelastic, such as Financial, HealthCare, Media,
Property, Transport and Utilities have negative effects.
Table 7: Regression of milk coefficients on industry groupings, 2005-2012
Industry Effect t
Agriculture 0.100 2.043
Construction 0.067 1.334
Consumer 0.117 1.613
Financial -0.014 -0.404
Health Care -0.053 -1.327
Industrial Prodn 0.048 0.829
Information Tech -0.024 -0.380
Investment 0.001 0.059
Media telecom -0.077 -2.061
Mining -0.071 -0.762
Ports 0.030 0.771
Property -0.051 -2.519
Retail 0.036 1.196
Services 0.104 1.282
Tourism Leisure 0.029 0.570
Transport -0.036 -0.804
Utilities -0.011 -0.347
R-Squared=0.217 P=0.059

41 | P a g e
6.2.3 Size of milk price effect
To assess the economic significance of a milk effect, it is necessary to go back to
Mayers’ CAPM formula given in Equations (5) and (6) on page 30. Mayers’ formula
gives an adjustment to the quantity of risk given by the usual CAPM beta. The
adjustment depends on the current value of all marketable assets, 𝑉𝑀 and the total
return to dairy farmers (all non-marketable assets), 𝑟𝐻 . Estimating 𝑟𝐻/𝑉𝑀 by the
contribution to NZ GDP which is about 2.8% (Stuff, 2011), the adjustment to the usual
CAPM beta is calculated for a range of parameters for the first period in Table 8.
For typical values observed for beta and the milk coefficient the adjustment is in all
cases less than four percentage points. This is consistent with Fama’s and Schwert’s
(1977) observation that “the model that includes human capital leads to estimates of
risk for marketable assets indistinguishable from those of the simpler models.”
6.3 The period since 2013
The results from fitting Equation (3) on page 28 to the period January 2013 to 1 April
2016 to 116 companies are presented in Appendix 5. These are the companies for
which data was available for this period. The estimated coefficients of the milk variable
are summarised in Table 9, and the cases with coefficients that are significantly
different from zero are listed in Table 10.
β = 0.8
β = 1.5
Table 8: Estimated adjustment to be the usual CAPM beta, 2005-2012
-0.3 0.3
Milk Coefficient, σ
-0.033 0.029
-0.035 0.028

42 | P a g e
Table 9: Companies with significant milk coefficients Company Industry Coef. t
Positive at 5% level EBOS Group Healthcare 0.211 2.778 Madison Group Services 0.199 2.508
Xero Limited
Information Technology 0.522 2.411
10% level Marsden Maritime Ports 0.088 1.724 SmartTENZ Investment 0.026 1.727
Negative at 5% level Smiths City Group Retail -0.133 -2.165 Veritas Investments Investment -0.307 -1.968
10% level Tower Financial -0.213 -1.808 Chorus Limited Utilities -0.280 -1.880
Rakon Limited
Information Technology -0.342 -1.914
Table 10: Milk coefficient estimated over 2013 to 2016
Negative Positive
Milk coefficient 64 Cases 52 Cases
Significant at:
5% level 2 Cases 3 Cases
10% level 5 Cases 5 Cases
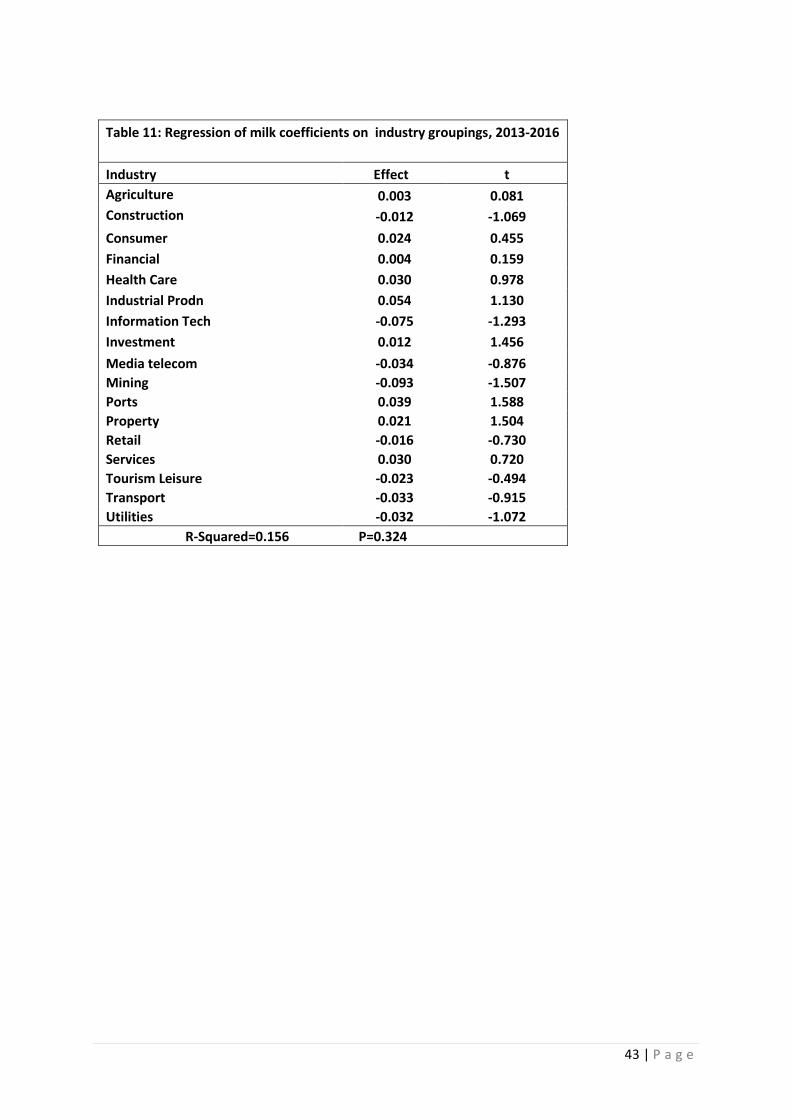
There is again some significant cases that might be expected at random in 116
regressions. However, a weighted regression of milk coefficients on industry groupings
in Table 11, no longer has the patterns observed in Table 7 for the first period.
Therefore there is some evidence that a change has taken place since 2013. However,
because the second period is short, the tests here are not very powerful. In fact the
Chow test to test constancy of the milk coefficients between the two periods found no
significant differences in all cases where the companies were present in both periods.
43 | P a g e
Table 11: Regression of milk coefficients on industry groupings, 2013-2016
Industry Effect t
Agriculture 0.003 0.081
Construction -0.012 -1.069
Consumer 0.024 0.455
Financial 0.004 0.159
Health Care 0.030 0.978
Industrial Prodn 0.054 1.130
Information Tech -0.075 -1.293
Investment 0.012 1.456
Media telecom -0.034 -0.876
Mining -0.093 -1.507
Ports 0.039 1.588
Property 0.021 1.504
Retail -0.016 -0.730
Services 0.030 0.720
Tourism Leisure -0.023 -0.494
Transport -0.033 -0.915
Utilities -0.032 -1.072
R-Squared=0.156 P=0.324

44 | P a g e
Chapter Seven:
Conclusions

45 | P a g e
7.0 Conclusions
This study was motivated by the importance of milk prices to the New Zealand
economy, and possible market imperfections due to the largest dairy company,
Fonterra, being a cooperative. Before 2013 exposure to milk price risk mainly affected
farmers. The study investigated whether milk price was an additional factor that
investors in New Zealand are exposed to in addition to other market risks that are
measured by the NZX50.
Some evidence of a small milk price effect was found over the period 2005 to 2012.
There was also some evidence of a change when the Fonterra Shareholders’ Fund
was created in 2013, but there is insufficient data since 2013 for powerful statistical
tests. Below are the findings to the four specific questions that were posed.
1. What are the characteristics that would make the risk of an asset greater or lower
in the presence of milk price risk?
The study adopted Mayers’ (1972) extension of the CAPM to nonmarketable assets.
In Mayers’ formula, the covariance is still the measure of risk, but we now need to
consider the covariance with total return on nonmarketable assets. Applying Mayers’
formula indicated that if the return on another marketable asset is more sensitive to
milk prices than it is to the market return, its beta will be larger than the usual CAPM
beta, and if the return on another marketable asset is less sensitive to milk prices than
the average market return, its beta will be smaller than the usual CAPM.
2. Does milk price risk have an observable price in New Zealand, or is it completely
diversified?
From the cointegration analysis reported in chapter 6.1, the conclusion is that milk price
risk has not been completely diversified away. ADF tests supported the conclusion that
the market index and the milk price variables are both integrated of order one, and
from the Engle and Granger procedure the conclusion was that they are not
cointegrated. Milk price has an independent stochastic trend. Milk price could be an
additional risk factor beside market risk. Fitting the CAPM market model in chapter 6.2
to the period 2005-2012 showed several cases of significant coefficients for the milk

46 | P a g e
price variable. All the estimated coefficients were small. The range was -0.475 to 0.342.
The adjustment to the usual CAPM beta was estimated to be less than four percentage
points. The conclusion is that milk price risk did have an observable price over this
period but that its economic significance is small.
3. Is there evidence of a milk price effect on assets in New Zealand?
Referring to chapter 6.2.2 on the study of patterns in milk price coefficients over the
period 2005-2012 the results did show evidence of a milk price effect on assets.
Industries where there would be an elastic income effect, such as Construction,
Consumer, Retail, and Services have a positive milk price effect. Industries where
income effects would be inelastic, such as Financial, HealthCare, Media, Property,
Transport and Utilities have a negative milk price effect.
4. Is there evidence of a change in the effect of milk price risk following the change to
Fonterra’s capital structure in 2013?
There is evidence of a change in the milk price risk following the creation of the
Fonterra Shareholders’ Fund in 2013, though the small period available since 2013
limited the power of the statistical tests. A Granger Causality test conducted for three
periods, 2005-2012, 2013-2015 and for the combined period 2005-2015, indicated that
a causal relationship between the NZX50 and milk prices in the first period, changes.
Also, the patterns by industry observed for the estimated milk price effects over 2005-
2012, were not observed for the period 2013-2016.
.
7.1 Future research
The period since the creation of the Fonterra Shareholders’ Fund limited the power of
the statistical tests in this study. Future research might investigate Granger Causality
and fit the CAPM market model over a longer period since the change.
The milk price variable in this study was measured in NZD, whereas the original
variable is measured in USD. Since the returns to dairy farmers come mainly from

47 | P a g e
overseas earnings, future research might investigate whether the effect found for milk
prices might be influence by the exchange rate.

48 | P a g e
References

49 | P a g e
References
Al-Mudhaf, A., & Goodwin, T. H. (1993). Oli shocks and oil stocks: Evidence from the
1970s. Applied Economics, 25, 181-190.
Banz, R. W. (1981). The Relationship between Return and Market Value of Common
Stocks. Journal of Financial Economic, 9, 3-18.
Basu, S. (1983). The Relationship between Earnings yield, Market Value, and Return
for NYSE Common Stock: Future Evidence. Journal of Financial Economic, 12, 129-
156.
Bernanke B. S. (2016 February 19). The relationship between stock and oil prices.
Retrieved from
http://www.brookings.edu/blogs/ben-bernanke/posts/2016/02/19-stocks-and-oil-
prices
Bhandari, L. C. (1988). Debt/Equity Ratio and Expected Common Stock Return:
Empirical Evidence. Journal of Finance, 43, 507-528.
Bialkowski, J., & Koeman. J. (2015). Cross-hedging on the International Milk-derived
Product Market. Retrieved from
http://papers.ssrn.com/sol3/papers.cfm?abstract_id=2639958
Black, F. (1972). Capital Market Equilibrium with Restricted Borrowing. The Journal of
Business, 45(3), 444-455.
Blanco, B. (2012). The use of CAPM and Fama and French Three Factor Model:
portfolios selection. Public and Municipal Finance, 1(2), 61-70.

50 | P a g e
Bopp, A. E., & Lady, G. M.(1991). A comparison of petroleum futures versus spot
prices as predictors of prices in the future. Energy Economics, 13, 274-281.
Chan, L., Y. Hamao and J. Lakonishok. (1991). Fundamentals and stock returns in
Japan, Journal of Finance, 46, 1739-1789.
Chen, N. F., Roll, R., & Ross, S. A. (1986). Economic forces and stock market. Journal
of Business, 59, 383-403.
CLAL News (2016). Comparison among corn, SMP and crude oil prices.
Retrieved from
http://www.clal.it/en/?section=conf_mais
Craigs (2012). Fonterra Shareholders’ Fund. Retrieved from
https://www.craigsip.com/~/media/Files/Investment%20Banking/Fonterra-IPO-
Summary-Oct12.ashx
Dairy News (2011). Maize and pasture means more milk. Retrieved from
http://ruralnewsgroup.co.nz/dairy-news/dairy-management/maize-and-pasture-
means-more-milk
Dairying Today (2015). New Zealand Diary Industry Today. Retrieved from
http://www.dcanz.com/about-nz-dairy-industry/dairying-today
DeBondt, Werner, F. M., Richard, H. Thaler. (1995). Does the stock market overreact?
Journal of Finance, 40, 793-808.

51 | P a g e
Engle, R. F. and Granger, C.W.J. (1987). Co-Integration and Error Correction:
Representation, Estimation and Testing. Econometrica, 55(2), 251-276.
Faff, R. W., Brailsford, T. J. (1999). Oil price risk and Australian stock market. Journal
of Energy and Development, 4, 69-87.
Fama, E. F., & French, K. R. (1992). The Cross-Section of Expected Stock Returns.
The Journal of Finance, 47(2), 427-465.
Fama, E. F. (1996). Multifactor Portfolio Efficiency and Multifactor Asset Pricing. The
Journal of Financial and Quantitative Analysis, 31(4), 441-465.
Fama, E. F., & French, K. R. (1996). Multifactor Explanations of Asset Pricing
Anomalies. The Journal of Finance, 51(1), 55-84.
Fama, E. F., & French, K. R. (2004). The Capital Asset Pricing Model: Theory and
Evidence. Journal of Economic Perspectives, 18(3), 25-46.
Fama, E. F., & Schwert, G. W. (1977). Human Capital and Capital Market equilibrium.
Journal of Financial Economics, 4(1), 95-125.
Farmer, R.D. (1993). Forward markets and changes in macroeconomic performance:
the case of oil. Journal of Macroeconomics, 15, 521-552.
Fisher, F.M. (1962). A Priori Information and Time Series Analysis: Essays in
Economic Theory and Measurement, North-Holland Publishing Company, Amsterdam.

52 | P a g e
Fonterra Company Overview Homepage (2014). Retrieved from
http://www.fonterra.com/nz/en/About/Company+Overview
Foster, A. (1996). Price discovery in oil markets: a time-varying analysis of the 1990-
91 gulf conflict, Energy Economics, 18, 231-246.
Gillan S. L. (1990). An Investigation into CAPM Anomalies in New Zealand: The Small
Firm and Price-Earnings Ratio Effects. Asia Pacific Journal of Management, 7, 63-78.
Govett Quilliam (2015). Trading Among Farmers (TAF). Retrieved from
http://www.thelawyers.co.nz/uploaded_files/NEW---Trading-Among-Farmers-TAF-
2015.pdf
Hamao, Y. (1989). An empirical examination of the arbitrage pricing theory: using
Japanese data, Japan and the World Economy, 1, 45-61.
Harri, A., Nalley, L., & Hudson, D. (2009). The Relationship between Oil, Exchange
Rate, and Commodity Prices. Journal of Agricultural and Economics, 41(2), 501-510.
Harry Markowitz. (1959). Portfolio Selection efficient diversification of Investments.
USA. John Wiley and Sons, Inc.
Hugh, S. and Frank, S. (2012). 'Dairying and dairy products - Beginnings of New
Zealand’s dairy industry', Te Ara - the Encyclopedia of New Zealand. Retrieved from
http://www.TeAra.govt.nz/en/dairying-and-dairy-products/page-1

53 | P a g e
IndexMundi (2016). Dairy WMP export. Retrieved from
http://www.indexmundi.com/agriculture/?country=nz&commodity=powdered-whole-
milk&graph=exports
Jegadeesh, N., & Titman, S. (1993). Returns to Buying Winners and Selling
Losers:Implcations for Stock Market Efficency. The Journal of Finance, 48(1), 65-91.
Jones, C,. & Kaul, G. (1996). Oil and the stock markets. Journal of Finance, 51, 463-
491.
Kaneko, T., & Lee, B. S. (1995). Relative importance of economic factors in the U.S.
and Japanese stock markets. Journal of the Japanese and International Economies,
9, 290-307.
Kazi, M. H. (2008). Systematic risk factors for Australian stock market return: a
cointegration analysis. The Australasian Accounting, Business and Finance Journal,
2(4), 89-101.
Lim, C., & Chan, F. (2013). An Empirical Modelling of New Zealand Hospitality and
Tourism Stock Returns. Hindawi Publishing Corporation, 3. Retrieved from
http://dx.doi.org/1.1155/2013/289718
Lintner, J. (1965). The Valuation of Risk Assets and the selection of Risky Investments
in Stock Portfolio and Capital Budgets. Review of Economics and Statistic.
Mayers, D. (1973). Nonmarketable Assets and the Determination of Capital Asset
Prices in the Absence of a Riskless asset. The Journal of Business, 46(2), 258-267.

54 | P a g e
Moosa, I. A., & Al-Loughani, N. E. (1994). Unbiasedness and time varying risk premia
in the crude oil futures markets. Energy Economics, 16, 99-105.
Mossin. J. (1966). Equilibrium in a Capital Asset Model. Econometrica.
Progressive Dairyman (2013), Cheap Corn, cheap milk? Retrieved from
http://www.progressivedairy.com/news/industry-news/cheap-corn-cheap-milk
Reinganum, M. R. (1981). Misspecification of Capital Asset Pricing: Empirical
Anomalies Based on Earnings , Yields and Market Value. Journal of Financial
Economics, 9, 19-46.
Ross, S. A. (1976). The arbitrage theory of capital asset pricing, Journal of Economic
Theory, 13, 341-360.
Siegel, S. (1956). Nonparametric statistics for the Behavioural Sciences. Tokyo:
McGraw-Hill.
Strong, J. S. (1991). Using oil share portfolios to hedge oil price risk. Quarterly Review
of Economics and Business, 3, 48-63.
Stuff (2011). Dairy’s $3.6b contribution to NZ economy. Retrieved from
http://www.stuff.co.nz/business/farming/4508171/Dairys-3-6b-contribution-to-NZ-
economy
Te Kete Ipurangi (2011). Ministry of Education New Zealand. Case study 5: Fonterra.
Retrieved from
http://asia-knowledge.tki.org.nz/Business-case-studies/Case-study-5-Fonterra
55 | P a g e
The Treasury New Zealand (2014). Half year and Fiscal update 2014. Retrieved from
http://www.treasury.govt.nz/budget/forecasts/hyefu2014
Tuck School of Business at Dartmouth. (2003). Understanding Risk and Return, the
CAPM, and the Fama-French Three-Factor Model. Dartmouth.U.S.A.
Understanding Dairy Markets (2016). International Dairy Product Prices, International
26% Whole Milk Power price. Retrieved from
http://future.aae.wisc.edu/tab/prices.html#30
Ziliak, S. T., and McCloskey, D. N. (2011). The Cult of Statistical Significance: How the
Standard error Cost Us Jobs, Justice, and Lives. U.S.A: The University Michigan
Press.

56 | P a g e
Appendices

57 | P a g e
Appendix 1
ADF test for unit roots
58 | P a g e
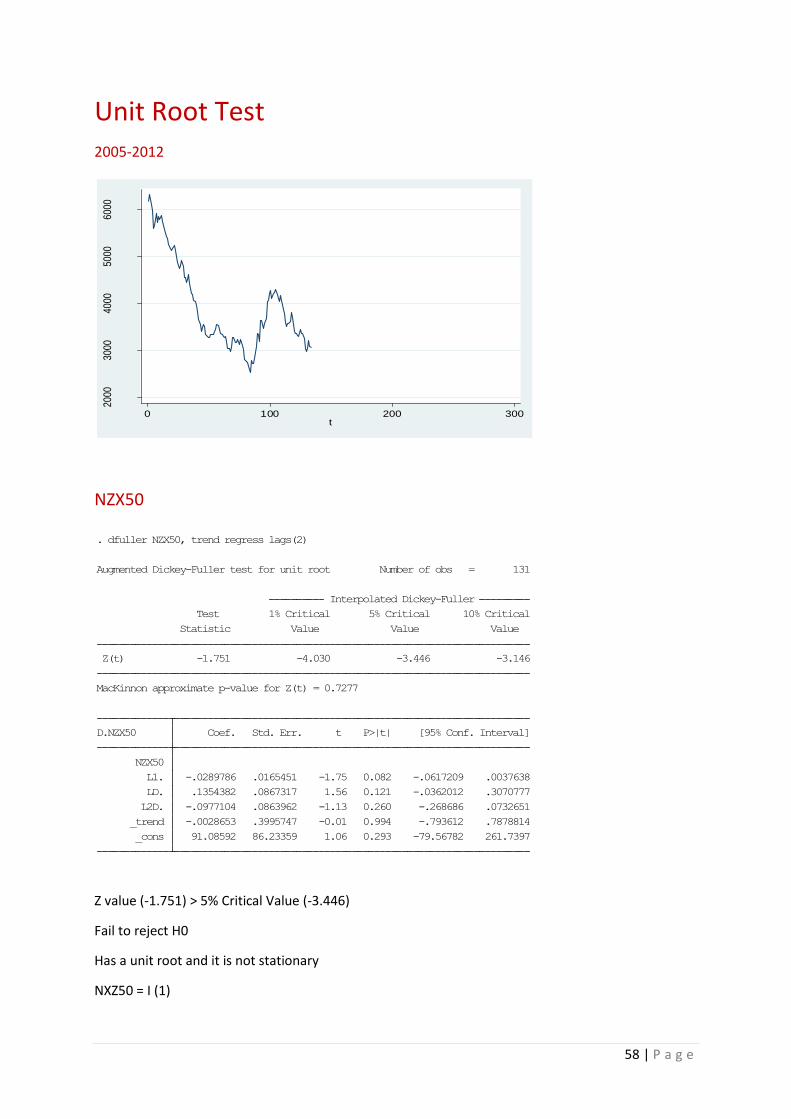
Unit Root Test 2005-2012
NZX50
Z value (-1.751) > 5% Critical Value (-3.446)
Fail to reject H0
Has a unit root and it is not stationary
NXZ50 = I (1)
_cons 91.08592 86.23359 1.06 0.293 -79.56782 261.7397
_trend -.0028653 .3995747 -0.01 0.994 -.793612 .7878814
L2D. -.0977104 .0863962 -1.13 0.260 -.268686 .0732651
LD. .1354382 .0867317 1.56 0.121 -.0362012 .3070777
L1. -.0289786 .0165451 -1.75 0.082 -.0617209 .0037638
NZX50
D.NZX50 Coef. Std. Err. t P>|t| [95% Conf. Interval]
MacKinnon approximate p-value for Z(t) = 0.7277
Z(t) -1.751 -4.030 -3.446 -3.146
Statistic Value Value Value
Test 1% Critical 5% Critical 10% Critical
Interpolated Dickey-Fuller
Augmented Dickey-Fuller test for unit root Number of obs = 131
. dfuller NZX50, trend regress lags(2)
2000
3000
4000
5000
6000
NZ
X5
0
0 100 200 300t
59 | P a g e
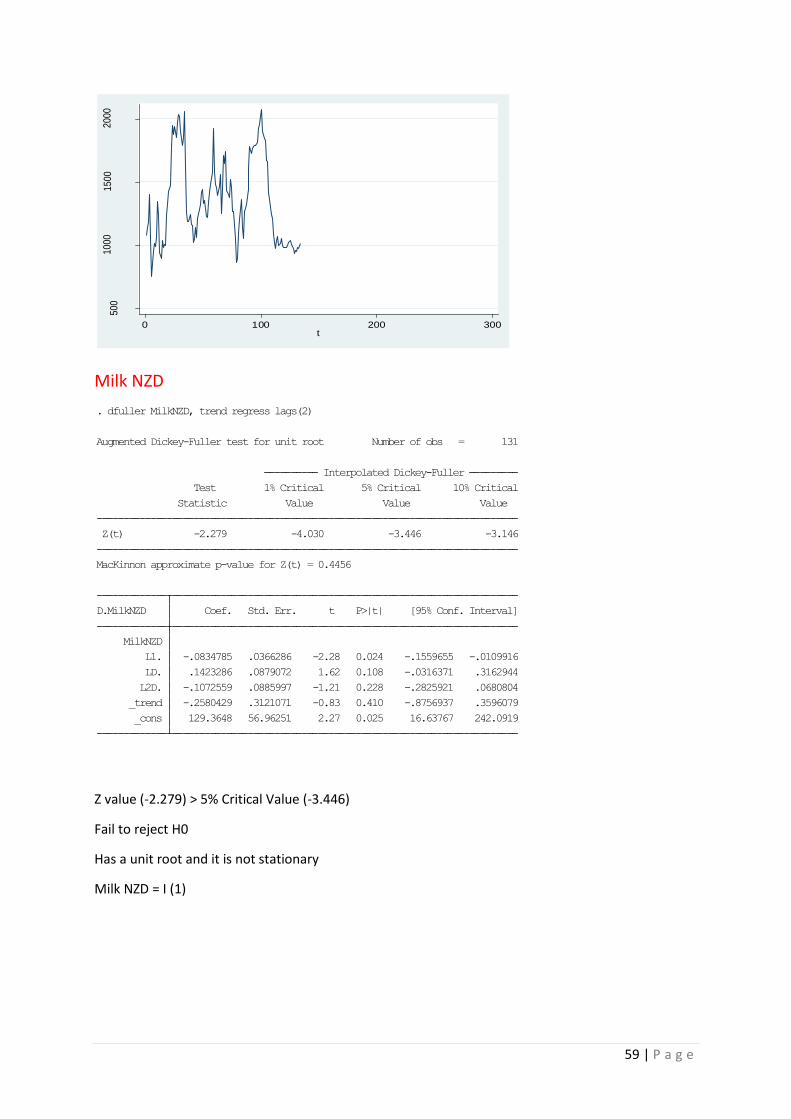
Milk NZD
Z value (-2.279) > 5% Critical Value (-3.446)
Fail to reject H0
Has a unit root and it is not stationary
Milk NZD = I (1)
50
01
00
01
50
02
00
0
Milk
NZ
D
0 100 200 300t
_cons 129.3648 56.96251 2.27 0.025 16.63767 242.0919
_trend -.2580429 .3121071 -0.83 0.410 -.8756937 .3596079
L2D. -.1072559 .0885997 -1.21 0.228 -.2825921 .0680804
LD. .1423286 .0879072 1.62 0.108 -.0316371 .3162944
L1. -.0834785 .0366286 -2.28 0.024 -.1559655 -.0109916
MilkNZD
D.MilkNZD Coef. Std. Err. t P>|t| [95% Conf. Interval]
MacKinnon approximate p-value for Z(t) = 0.4456
Z(t) -2.279 -4.030 -3.446 -3.146
Statistic Value Value Value
Test 1% Critical 5% Critical 10% Critical
Interpolated Dickey-Fuller
Augmented Dickey-Fuller test for unit root Number of obs = 131
. dfuller MilkNZD, trend regress lags(2)
60 | P a g e
Appendix 2
Unit Root test on Residuals

61 | P a g e
2005-2012
The Z value (-2.494) > 5% Critical Value (-2.888)
Fail to reject H0
Residual has a unit root
Series (NZX50 and Milk NZD) are Not Cointegrated
MacKinnon approximate p-value for Z(t) = 0.1169
Z(t) -2.494 -3.499 -2.888 -2.578
Statistic Value Value Value
Test 1% Critical 5% Critical 10% Critical
Interpolated Dickey-Fuller
Dickey-Fuller test for unit root Number of obs = 133
. dfuller resid
. //ADF resid
.
(138 missing values generated)
. predict double resid, residuals
. //Residual test
.
_cons 3768.54 335.7532 11.22 0.000 3104.387 4432.693
MilkNZD .1163806 .2417308 0.48 0.631 -.3617869 .594548
NZX50 Coef. Std. Err. t P>|t| [95% Conf. Interval]
Total 117231643 133 881440.922 Root MSE = 941.57
Adj R-squared = -0.0058
Residual 117026145 132 886561.708 R-squared = 0.0018
Model 205497.205 1 205497.205 Prob > F = 0.6310
F(1, 132) = 0.23
Source SS df MS Number of obs = 134
. regress NZX50 MilkNZD
.

62 | P a g e
Appendix 3
Granger Causality test

63 | P a g e
4 lagged
2005-2012
end of do-file
.
Prob > F = 0.0355
F( 4, 83) = 2.71
( 4) L4.MilkNZD = 0
( 3) L3.MilkNZD = 0
( 2) L2.MilkNZD = 0
( 1) L.MilkNZD = 0
. test L1.MilkNZD L2.MilkNZD L3.MilkNZD L4.MilkNZD
. **test L.MilkNZD
.
_cons .0009517 .0037773 0.25 0.802 -.0065612 .0084646
L4. .0462625 .0559154 0.83 0.410 -.0649511 .157476
L3. .089821 .0551824 1.63 0.107 -.0199345 .1995765
L2. .104827 .0545147 1.92 0.058 -.0036005 .2132546
L1. .0433989 .0533778 0.81 0.419 -.0627674 .1495653
MilkNZD
L4. .0503281 .1058668 0.48 0.636 -.1602367 .260893
L3. .1316599 .1072658 1.23 0.223 -.0816875 .3450072
L2. -.2045503 .1068104 -1.92 0.059 -.4169919 .0078913
L1. .0791699 .1089651 0.73 0.470 -.1375573 .2958971
Marketreturn
Marketreturn Coef. Std. Err. t P>|t| [95% Conf. Interval]
Total .129368531 91 .001421632 Root MSE = .03587
Adj R-squared = 0.0948
Residual .106813256 83 .001286907 R-squared = 0.1743
Model .022555275 8 .002819409 Prob > F = 0.0362
F(8, 83) = 2.19
Source SS df MS Number of obs = 92
. regress Marketreturn L(1/4).Marketreturn L(1/4).MilkNZD
. **regress Marketreturn L.Marketreturn L.MilkNZD
. //Do MilkNZD Granger-cause Marketreturn
.
delta: 1 unit
time variable: time, 1 to 97
. tsset time
. gen time=_n
.
. set more off

64 | P a g e
2013-2015
.
end of do-file
.
Prob > F = 0.5857
F( 4, 24) = 0.72
( 4) L4.MilkNZD = 0
( 3) L3.MilkNZD = 0
( 2) L2.MilkNZD = 0
( 1) L.MilkNZD = 0
. test L1.MilkNZD L2.MilkNZD L3.MilkNZD L4.MilkNZD
. **test L.MilkNZD
.
_cons .0226619 .0057535 3.94 0.001 .0107872 .0345366
L4. .0400264 .0354256 1.13 0.270 -.0330885 .1131413
L3. .0268894 .0319677 0.84 0.409 -.0390886 .0928674
L2. .0298207 .0349672 0.85 0.402 -.042348 .1019895
L1. .0178114 .0356773 0.50 0.622 -.0558229 .0914457
MilkNZD
L4. -.4353458 .1713257 -2.54 0.018 -.7889446 -.081747
L3. -.1543161 .1679407 -0.92 0.367 -.5009287 .1922965
L2. -.4389006 .1718179 -2.55 0.017 -.7935152 -.084286
L1. -.1627366 .1730625 -0.94 0.356 -.51992 .1944469
Marketreturn
Marketreturn Coef. Std. Err. t P>|t| [95% Conf. Interval]
Total .017111545 32 .000534736 Root MSE = .02159
Adj R-squared = 0.1281
Residual .011189945 24 .000466248 R-squared = 0.3461
Model .0059216 8 .0007402 Prob > F = 0.1809
F(8, 24) = 1.59
Source SS df MS Number of obs = 33
. regress Marketreturn L(1/4).Marketreturn L(1/4).MilkNZD
. **regress Marketreturn L.Marketreturn L.MilkNZD
. //Do MilkNZD Granger-cause Marketreturn
.
delta: 1 unit
time variable: time, 1 to 38
. tsset time
. gen time=_n
.
. set more off

65 | P a g e
2005-2015
.
end of do-file
.
Prob > F = 0.0811
F( 4, 120) = 2.13
( 4) L4.MilkNZD = 0
( 3) L3.MilkNZD = 0
( 2) L2.MilkNZD = 0
( 1) L.MilkNZD = 0
. test L1.MilkNZD L2.MilkNZD L3.MilkNZD L4.MilkNZD
. **test L.MilkNZD
.
_cons .0039437 .0030487 1.29 0.198 -.0020925 .00998
L4. .0347619 .0347604 1.00 0.319 -.0340612 .103585
L3. .0485517 .0343838 1.41 0.161 -.0195258 .1166292
L2. .0602322 .0357189 1.69 0.094 -.0104888 .1309532
L1. .0402016 .0355828 1.13 0.261 -.0302499 .1106531
MilkNZD
L4. .019708 .0890694 0.22 0.825 -.1566433 .1960593
L3. .1306639 .0901435 1.45 0.150 -.0478139 .3091417
L2. -.1934952 .0894666 -2.16 0.033 -.3706328 -.0163575
L1. .1137083 .0903746 1.26 0.211 -.0652271 .2926437
Marketreturn
Marketreturn Coef. Std. Err. t P>|t| [95% Conf. Interval]
Total .150653161 128 .001176978 Root MSE = .03318
Adj R-squared = 0.0644
Residual .132143634 120 .001101197 R-squared = 0.1229
Model .018509527 8 .002313691 Prob > F = 0.0407
F(8, 120) = 2.10
Source SS df MS Number of obs = 129
. regress Marketreturn L(1/4).Marketreturn L(1/4).MilkNZD
. **regress Marketreturn L.Marketreturn L.MilkNZD
. //Do MilkNZD Granger-cause Marketreturn
.
delta: 1 unit
time variable: time, 1 to 134
. tsset time
. gen time=_n
.
. set more off

66 | P a g e
Appendix 4
Result from fitting the CAPM market model,
2005-2012

67 | P a g e
Result from fitting the CAPM market model, 2005-2012 Beta Constant Beta Milk Coef P Value # 0f Obs
Auckland Intl Airport 0.005 0.8619 0.073 0.000000 97 (0.0050) (0.1363) (0.0704) Air New Zealand -0.0026 1.3211 -0.2152 0.000000 97 (0.0081) (0.2201) (0.1136) ANZ Banking Group 0.0035 0.7946 -0.0913 0.000011 97 (0.0058) (0.1562) (0.0806) Argosy Property 0.0089 0.7493 -0.0739 0.000434 51 (0.0058) (0.1819) (0.0694) A2 Milk -0.0018 1.5649 -0.3127 0.044859 97 (0.0234) (0.6344) (0.3276)
Contact Energy -0.0021 1.0429 -0.0299 0.000000 97 (0.0043) (0.1170) (0.0604) Coats Group -0.0125 1.4208 0.0354 0.000000 96 (0.0071) (0.1902) (0.0982) EBOS Group 0.0065 0.7714 -0.1107 0.000000 97 (0.0042) (0.1132) (0.0585) Fletcher Building 0.0019 1.3998 0.1555 0.000000 97 (0.0048) (0.1311) (0.0677) Fisher & Paykel Hlthcr -0.0021 0.5604 0.0503 0.004513 97 (0.0063) (0.1717) (0.0887) Freightways 0.004 0.8204 0.0025 0.000000 97 (0.0043) (0.1159) (0.0599)
Goodman Property Trust 0 0.699 -0.0883 0.000002 72 (0.0048) (0.1270) (0.0603) Hellaby Holdings -0.0092 1.7965 -0.2045 0.000003 97 (0.0123) (0.3334) (0.1722) Hallenstein Glasson Hdg 0.0033 1.0716 -0.037 0.000000 97 (0.0058) (0.1558) (0.0805) Infratil 0.0021 1.1498 0.036 0.000000 97 (0.0043) (0.1160) (0.0599) Kiwi Property Group 0.0026 0.6302 -0.0893 0.000006 51 (0.0038) (0.1206) (0.0460) Mainfreight 0.0158 1.1284 -0.0118 0.000000 97 (0.0065) (0.1761) (0.0909) Metlifecare -0.0029 1.0466 0.1183 0.000018 97
(0.0082) (0.2216) (0.1144) Michael Hill Intl 0.0029 1.0013 0.0954 0.000004 97 (0.0072) (0.1942) (0.1003) Nuplex Industries -0.0151 1.44 0.0972 0.000633 96 (0.0137) (0.3695) (0.1908)
@ SE in parentheses. continued
68 | P a g e
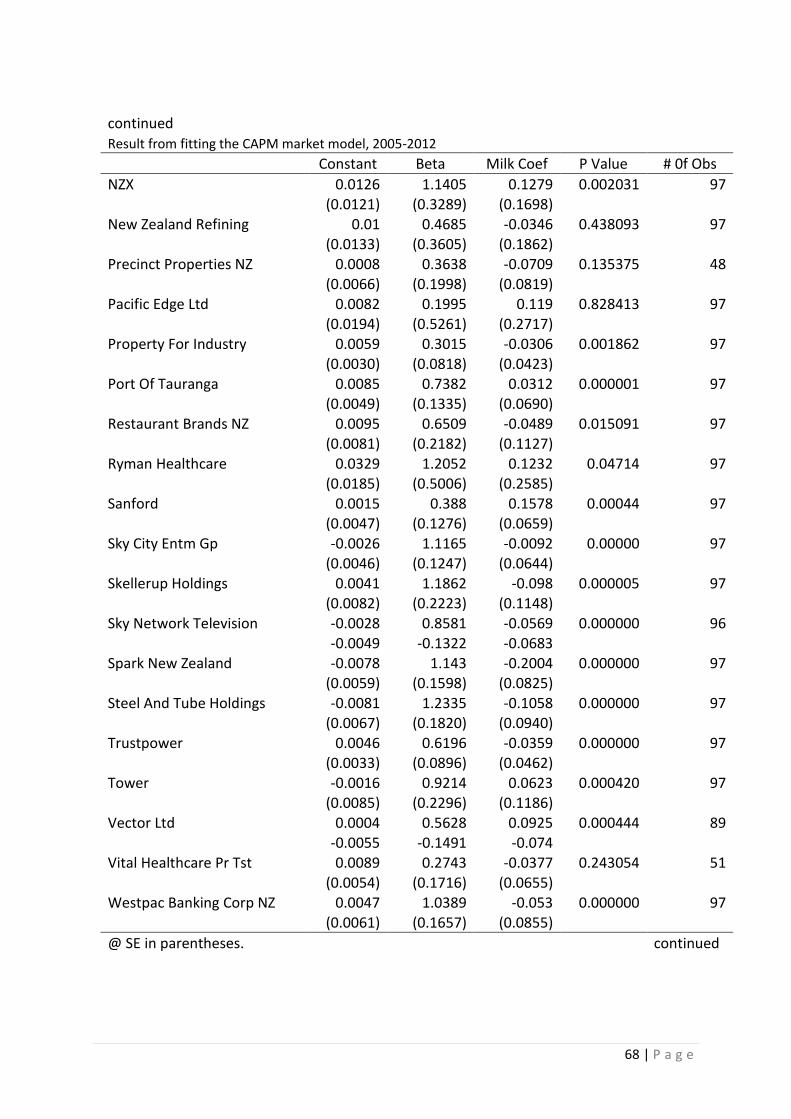
continued Result from fitting the CAPM market model, 2005-2012 Constant Beta Milk Coef P Value # 0f Obs
NZX 0.0126 1.1405 0.1279 0.002031 97 (0.0121) (0.3289) (0.1698) New Zealand Refining 0.01 0.4685 -0.0346 0.438093 97 (0.0133) (0.3605) (0.1862) Precinct Properties NZ 0.0008 0.3638 -0.0709 0.135375 48 (0.0066) (0.1998) (0.0819) Pacific Edge Ltd 0.0082 0.1995 0.119 0.828413 97 (0.0194) (0.5261) (0.2717) Property For Industry 0.0059 0.3015 -0.0306 0.001862 97
(0.0030) (0.0818) (0.0423) Port Of Tauranga 0.0085 0.7382 0.0312 0.000001 97 (0.0049) (0.1335) (0.0690) Restaurant Brands NZ 0.0095 0.6509 -0.0489 0.015091 97 (0.0081) (0.2182) (0.1127) Ryman Healthcare 0.0329 1.2052 0.1232 0.04714 97 (0.0185) (0.5006) (0.2585) Sanford 0.0015 0.388 0.1578 0.00044 97 (0.0047) (0.1276) (0.0659) Sky City Entm Gp -0.0026 1.1165 -0.0092 0.00000 97 (0.0046) (0.1247) (0.0644) Skellerup Holdings 0.0041 1.1862 -0.098 0.000005 97 (0.0082) (0.2223) (0.1148)
Sky Network Television -0.0028 0.8581 -0.0569 0.000000 96 -0.0049 -0.1322 -0.0683 Spark New Zealand -0.0078 1.143 -0.2004 0.000000 97 (0.0059) (0.1598) (0.0825) Steel And Tube Holdings -0.0081 1.2335 -0.1058 0.000000 97 (0.0067) (0.1820) (0.0940) Trustpower 0.0046 0.6196 -0.0359 0.000000 97 (0.0033) (0.0896) (0.0462) Tower -0.0016 0.9214 0.0623 0.000420 97 (0.0085) (0.2296) (0.1186) Vector Ltd 0.0004 0.5628 0.0925 0.000444 89 -0.0055 -0.1491 -0.074 Vital Healthcare Pr Tst 0.0089 0.2743 -0.0377 0.243054 51
(0.0054) (0.1716) (0.0655) Westpac Banking Corp NZ 0.0047 1.0389 -0.053 0.000000 97 (0.0061) (0.1657) (0.0855)
@ SE in parentheses. continued

69 | P a g e
continued Result from fitting the CAPM market model, 2005-2012 Constant Beta Milk Coef P Value # 0f Obs
Warehouse Group 0.0008 0.686 -0.0247 0.010492 97 (0.0081) (0.2205) (0.1138) Abano Healthcare Group 0.0169 0.9738 -0.1757 0.000362 97 (0.0088) (0.2386) (0.1232) Australian Foundation 0.001 0.7023 -0.0712 0.038138 58 (0.0104) (0.2707) (0.1476) Allied Farmers Limited -0.0948 1.3707 -0.2117 0.222653 97 (0.0292) (0.7909) (0.4084) AMP Limited Ordinary -0.0035 1.115 -0.0911 0.000000 97 (0.0058) (0.1578) (0.0815)
Aorere Resources Limit -0.005 1.9796 0.11 0.002450 95 (0.0208) (0.5741) (0.3043) APN News & Media Limit -0.029 1.2305 0.0493 0.000467 97 (0.0113) (0.3054) (0.1577) ASB Capital Limited -0.0024 0.642 0.092 0.001043 55 (0.0070) (0.1738) (0.0932) Augusta Capital Limite -0.0027 0.8911 -0.0143 0.000000 73 (0.0048) (0.1288) (0.0604) AWF Madison Group Limi 0.0094 0.1193 -0.1601 0.611116 90 (0.0122) (0.3324) (0.1651) Briscoe Group Limited 0.0087 1.0466 -0.0794 0.000000 97 (0.0060) (0.1617) (0.0835) Bethunes Investments 0.0024 0.6658 0.4146 0.304999 88
(0.0267) (0.6949) (0.3724) The Bankers Investment 0.0024 0.8048 -0.0256 0.000000 97 (0.0032) (0.0856) (0.0442) BLIS Technologies Limi -0.0188 -0.4256 0.1162 0.753922 97 (0.0224) (0.6062) (0.3130) Barramundi Limited O -0.0017 0.8212 -0.2689 0.146553 75 (0.0181) (0.4839) (0.2269) Cavalier Corporation -0.0103 1.4479 0.1103 0.000001 97 (0.0095) (0.2580) (0.1332) CDL Investments New 0.0039 0.6409 -0.0398 0.002517 97 (0.0066) (0.1781) (0.0920) The Colonial Motor Cor 0.0064 0.2171 0.0147 0.348681 97 (0.0056) (0.1525) (0.0787)
Chorus Limited (NS) -0.0446 2.1533 -0.2534 0.046094 14 (0.0250) (0.8555) (0.4065) Comvita Limited Ordina 0.0032 0.996 0.2444 0.001388 97 (0.0114) (0.3073) (0.1587) Cleanaway Waste Manage -0.088 14.7374 6.8065 0.487232 37 (0.6060) (15.8868) (9.9478)
@ SE in parentheses. continued

70 | P a g e
continued Result from fitting the CAPM market model, 2005-2012 Constant Beta Milk Coef P Value # 0f Obs
Delegat Group Limited 0.0032 0.3612 0.206 0.081094 84 (0.0096) (0.2566) (0.1259) Downer EDI Limited Ord -0.0009 0.5654 0.4752 0.825477 73 (0.0720) (1.8099) (0.9432) Finzsoft Solutions Lim -0.0171 0.0878 0.075 0.956879 81 (0.0222) (0.5622) (0.3188) SmartFONZ -0.0019 0.9062 0.0215 0.000000 94 (0.0024) (0.0636) (0.0335) Green Cross Health Lim -0.006 0.6733 -0.367 0.070123 97 (0.0145) (0.3921) (0.2025)
Heartland Bank Limited -0.0051 0.0879 0.108 0.390882 95 (0.0063) (0.1701) (0.0889) Henderson Far East Ind 0.0001 0.9976 0.3527 0.015467 73 (0.0162) (0.4318) (0.2024) JPMorgan Japanese Indu -0.0083 0.8257 0.3418 0.003888 97 (0.0121) (0.3265) (0.1686) Kingfish Limited Ordin 0.0009 0.3922 -0.2091 0.359690 97 (0.0136) (0.3672) (0.1896) Kathmandu Holdings Lim 0.0011 1.2977 0.0862 0.136169 41 (0.0200) (0.6523) (0.2655) Kircaldie & Stains 0.0023 0.1781 0.1715 0.010278 97 (0.0047) (0.1277) (0.0659) Millennium & Copthor 0.0098 0.3281 0.1013 0.319347 97
(0.0098) (0.2649) (0.1368) SmartMIDZ -0.0018 0.8183 0.0307 0.000000 97 (0.0025) (0.0685) (0.0354) Mercer Group Limited -0.0104 0.1227 -0.0798 0.941718 93 (0.0196) (0.5198) (0.2804) Marlin Global Limited -0.0039 0.1255 -0.3457 0.457727 62 (0.0218) (0.5491) (0.2766) Marsden Maritime Holdi -0.0019 0.3729 -0.0248 0.078033 97 (0.0060) (0.1617) (0.0835) Methven Limited Ordina -0.0006 0.9322 0.0947 0.000030 97 (0.0074) (0.2015) (0.1041) Smart MOZY -0.0015 1.1524 -0.0638 0.000000 97 -0.0045 -0.1228 -0.0634
NPT Limited Ordinary 0.0079 0.5187 0.042 0.110044 51 (0.0079) (0.2480) (0.0947) New Talisman Gold Mi -0.0251 0.7365 0.2459 0.269840 97 (0.0210) (0.5679) (0.2933)
@ SE in parentheses. continued
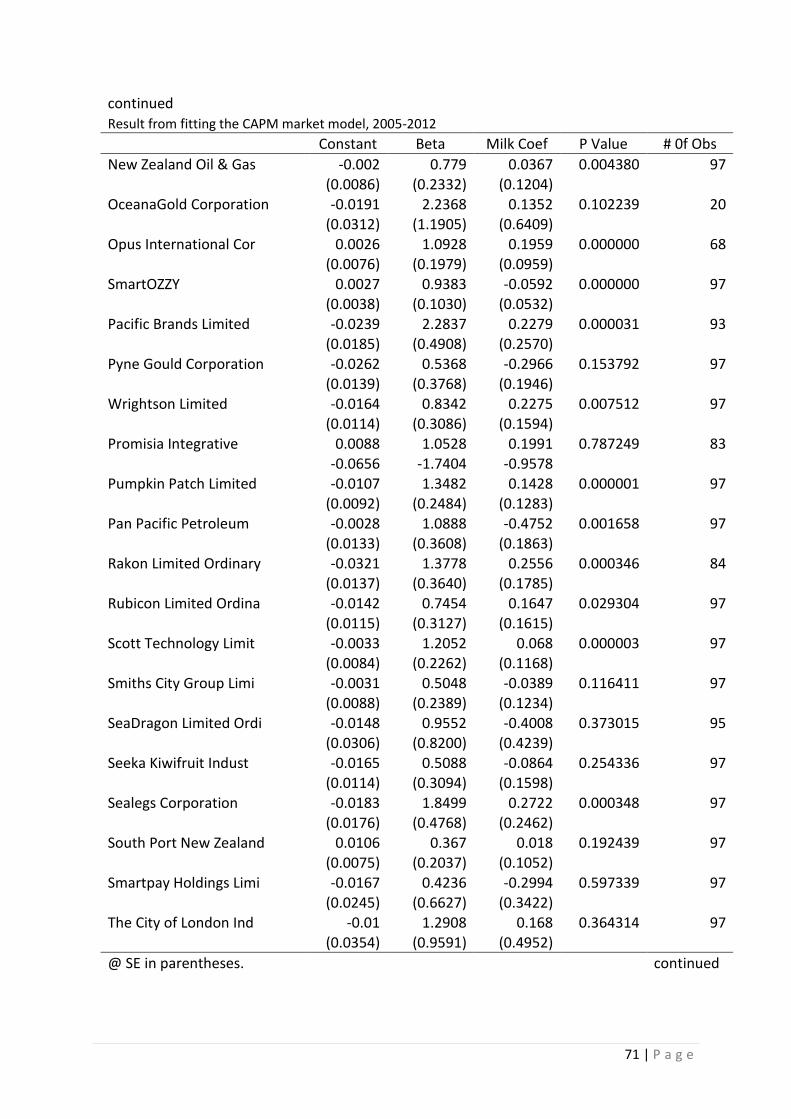
71 | P a g e
continued Result from fitting the CAPM market model, 2005-2012 Constant Beta Milk Coef P Value # 0f Obs
New Zealand Oil & Gas -0.002 0.779 0.0367 0.004380 97 (0.0086) (0.2332) (0.1204) OceanaGold Corporation -0.0191 2.2368 0.1352 0.102239 20 (0.0312) (1.1905) (0.6409) Opus International Cor 0.0026 1.0928 0.1959 0.000000 68 (0.0076) (0.1979) (0.0959) SmartOZZY 0.0027 0.9383 -0.0592 0.000000 97 (0.0038) (0.1030) (0.0532) Pacific Brands Limited -0.0239 2.2837 0.2279 0.000031 93 (0.0185) (0.4908) (0.2570)
Pyne Gould Corporation -0.0262 0.5368 -0.2966 0.153792 97 (0.0139) (0.3768) (0.1946) Wrightson Limited -0.0164 0.8342 0.2275 0.007512 97 (0.0114) (0.3086) (0.1594) Promisia Integrative 0.0088 1.0528 0.1991 0.787249 83 -0.0656 -1.7404 -0.9578 Pumpkin Patch Limited -0.0107 1.3482 0.1428 0.000001 97 (0.0092) (0.2484) (0.1283) Pan Pacific Petroleum -0.0028 1.0888 -0.4752 0.001658 97 (0.0133) (0.3608) (0.1863) Rakon Limited Ordinary -0.0321 1.3778 0.2556 0.000346 84 (0.0137) (0.3640) (0.1785) Rubicon Limited Ordina -0.0142 0.7454 0.1647 0.029304 97
(0.0115) (0.3127) (0.1615) Scott Technology Limit -0.0033 1.2052 0.068 0.000003 97 (0.0084) (0.2262) (0.1168) Smiths City Group Limi -0.0031 0.5048 -0.0389 0.116411 97 (0.0088) (0.2389) (0.1234) SeaDragon Limited Ordi -0.0148 0.9552 -0.4008 0.373015 95 (0.0306) (0.8200) (0.4239) Seeka Kiwifruit Indust -0.0165 0.5088 -0.0864 0.254336 97 (0.0114) (0.3094) (0.1598) Sealegs Corporation -0.0183 1.8499 0.2722 0.000348 97 (0.0176) (0.4768) (0.2462) South Port New Zealand 0.0106 0.367 0.018 0.192439 97 (0.0075) (0.2037) (0.1052)
Smartpay Holdings Limi -0.0167 0.4236 -0.2994 0.597339 97 (0.0245) (0.6627) (0.3422) The City of London Ind -0.01 1.2908 0.168 0.364314 97 (0.0354) (0.9591) (0.4952)
@ SE in parentheses. continued
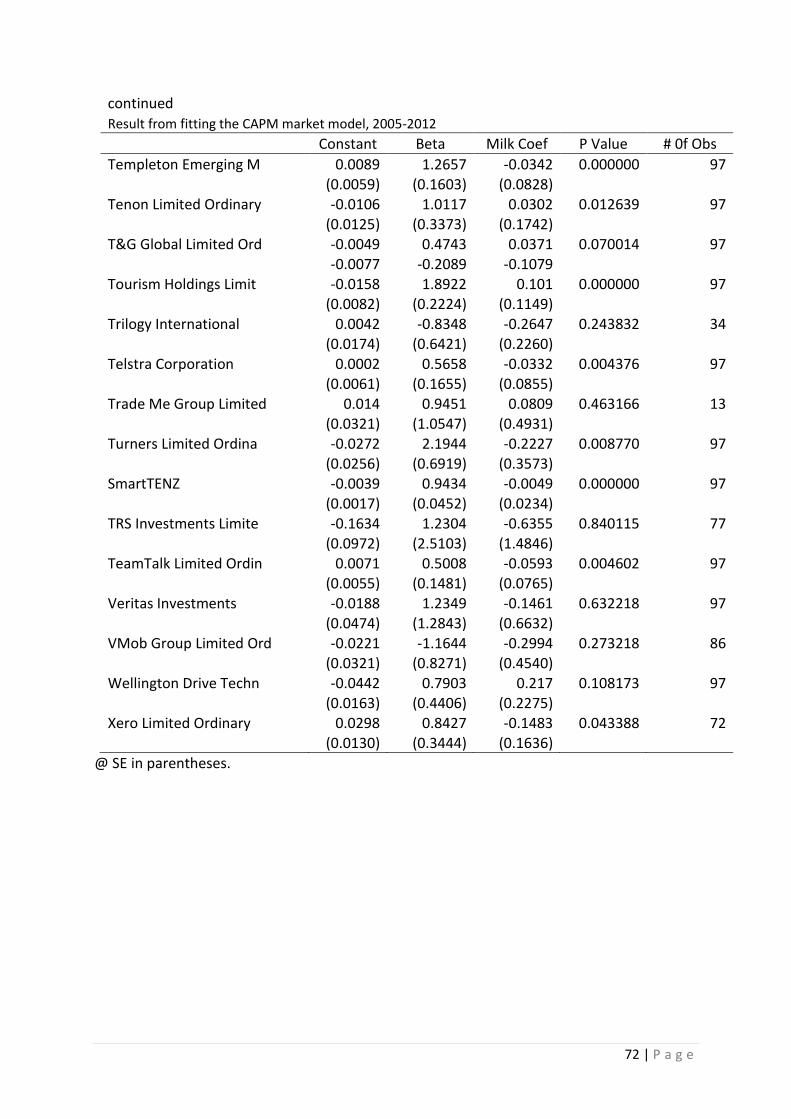
72 | P a g e
continued Result from fitting the CAPM market model, 2005-2012 Constant Beta Milk Coef P Value # 0f Obs
Templeton Emerging M 0.0089 1.2657 -0.0342 0.000000 97 (0.0059) (0.1603) (0.0828) Tenon Limited Ordinary -0.0106 1.0117 0.0302 0.012639 97 (0.0125) (0.3373) (0.1742) T&G Global Limited Ord -0.0049 0.4743 0.0371 0.070014 97 -0.0077 -0.2089 -0.1079 Tourism Holdings Limit -0.0158 1.8922 0.101 0.000000 97 (0.0082) (0.2224) (0.1149) Trilogy International 0.0042 -0.8348 -0.2647 0.243832 34 (0.0174) (0.6421) (0.2260)
Telstra Corporation 0.0002 0.5658 -0.0332 0.004376 97 (0.0061) (0.1655) (0.0855) Trade Me Group Limited 0.014 0.9451 0.0809 0.463166 13 (0.0321) (1.0547) (0.4931) Turners Limited Ordina -0.0272 2.1944 -0.2227 0.008770 97 (0.0256) (0.6919) (0.3573) SmartTENZ -0.0039 0.9434 -0.0049 0.000000 97 (0.0017) (0.0452) (0.0234) TRS Investments Limite -0.1634 1.2304 -0.6355 0.840115 77 (0.0972) (2.5103) (1.4846) TeamTalk Limited Ordin 0.0071 0.5008 -0.0593 0.004602 97 (0.0055) (0.1481) (0.0765) Veritas Investments -0.0188 1.2349 -0.1461 0.632218 97
(0.0474) (1.2843) (0.6632) VMob Group Limited Ord -0.0221 -1.1644 -0.2994 0.273218 86 (0.0321) (0.8271) (0.4540) Wellington Drive Techn -0.0442 0.7903 0.217 0.108173 97 (0.0163) (0.4406) (0.2275) Xero Limited Ordinary 0.0298 0.8427 -0.1483 0.043388 72 (0.0130) (0.3444) (0.1636)
@ SE in parentheses.

73 | P a g e
Appendix 5
Result from fitting the CAPM market model,
2013-2016

74 | P a g e
Result from fitting the CAPM market model, 2013-2016
Constant Beta Milk Coef P Value # of Obs
Auckland Intl Airport 0.0112 1.1041 0.0024 0.000007 40
(0.0057) (0.1970) (0.0447)
Air New Zealand 0.01 1.3936 -0.0024 0.006581 40
(0.0122) (0.4222) (0.0957)
ANZ Banking Group -0.0159 1.1532 0.0227 0.003985 40
(0.0097) (0.3377) (0.0765)
Argosy Property 0.0059 0.4475 0.0298 0.009503 40
(0.0045) (0.1549) (0.0351)
A2 Milk 0.0208 0.9768 0.1433 0.333586 40
(0.0248) (0.8615) (0.1952)
Contact Energy -0.0082 0.8885 -0.1057 0.056920 40
(0.0110) (0.3826) (0.0867)
Coats Group -0.0083 0.5977 0.0024 0.484383 40
(0.0146) (0.5084) (0.1152)
EBOS Group 0.0235 0.2573 0.2113 0.013741 40
(0.0097) (0.3357) (0.0761)
Fletcher Building -0.0176 1.5381 -0.0017 0.000002 40
(0.0074) (0.2583) (0.0585)
Fisher & Paykel Hlthcr 0.0317 0.378 -0.014 0.524321 40
(0.0096) (0.3342) (0.0757)
Freightways 0.0054 0.7251 0.028 0.023997 40
(0.0078) (0.2716) (0.0616)
Goodman Property Trust 0.0058 0.5463 0.0533 0.002383 40
(0.0050) (0.1727) (0.0391)
Hellaby Holdings 0.0007 -0.021 0.0171 0.961448 40
(0.0079) (0.2741) (0.0621)
Hallenstein Glasson Hdg -0.0153 0.7303 -0.003 0.249196 40
(0.0127) (0.4416) (0.1001)
Infratil 0.0026 0.7519 -0.0871 0.022421 40
(0.0080) (0.2765) (0.0627)
Kiwi Property Group 0.0052 0.4197 0.0205 0.123852 40
(0.0063) (0.2183) (0.0495)
Mainfreight 0.0025 0.4984 -0.0828 0.047265 40
(0.0065) (0.2245) (0.0509)
Metlifecare -0.0016 1.1939 -0.0594 0.007273 40
(0.0104) (0.3603) (0.0817)
Michael Hill Intl -0.0104 0.8331 0.0912 0.011361 40
(0.0092) (0.3204) (0.0726)
Nuplex Industries -0.001 1.4756 -0.0793 0.003751 40
(0.0119) (0.4146) (0.0940)
@ SE in parentheses. continued

75 | P a g e
continued
Result from fitting the CAPM market model, 2013-2016
Constant Beta Milk Coef P Value # of Obs
NZX -0.0017 0.2143 -0.0115 0.650206 40
(0.0067) (0.2329) (0.0528)
New Zealand Refining 0.0081 0.0618 0.0018 0.990393 40
(0.0136) (0.4727) (0.1071)
Precinct Properties NZ 0.0088 0.1911 0.0291 0.382353 40
(0.0053) (0.1827) (0.0414)
Pacific Edge Ltd -0.0251 2.4275 -0.2238 0.093333 40
(0.0323) (1.1210) (0.2541)
Property For Industry 0.0082 0.2612 -0.0154 0.172276 40
(0.0040) (0.1381) (0.0313)
Port Of Tauranga 0.0065 0.4621 0.0589 0.022784 40
(0.0058) (0.2029) (0.0460)
Restaurant Brands NZ 0.0084 0.9024 -0.0027 0.000818 40
(0.0064) (0.2229) (0.0505)
Ryman Healthcare 0.0037 1.0673 0.0619 0.002050 40
(0.0089) (0.3089) (0.0700)
Sanford 0.014 -0.1299 0.0141 0.891979 40
(0.0083) (0.2869) (0.0650)
Sky City Entm Gp -0.0058 1.2675 0.0128 0.000063 40
(0.0075) (0.2616) (0.0593)
Skellerup Holdings -0.0002 0.3015 0.1214 0.162902 40
(0.0101) (0.3490) (0.0791)
Sky Network Television -0.0118 1.2735 0.0501 0.001382 40
(0.0099) (0.3452) (0.0782)
Spark New Zealand 0.0042 1.0195 -0.0937 0.006233 40
(0.0089) (0.3097) (0.0702)
Steel And Tube Holdings -0.0016 0.5708 -0.06 0.329493 40
(0.0114) (0.3975) (0.0901)
Trustpower -0.0032 0.4322 -0.0536 0.117809 40
(0.0063) (0.2192) (0.0497)
Tower -0.0056 0.2612 -0.2128 0.197764 40
(0.0150) (0.5192) (0.1177)
Vector Ltd 0.0105 0.0707 0.0353 0.703038 40
(0.0064) (0.2230) (0.0505)
Vital Healthcare Pr Tst 0.0159 0.1493 0.0624 0.186926 40
(0.0053) (0.1852) (0.0420)
Westpac Banking Corp NZ -0.0129 1.3357 0.0247 0.000279 40
(0.0089) (0.3089) (0.0700)
@ SE in parentheses. continued
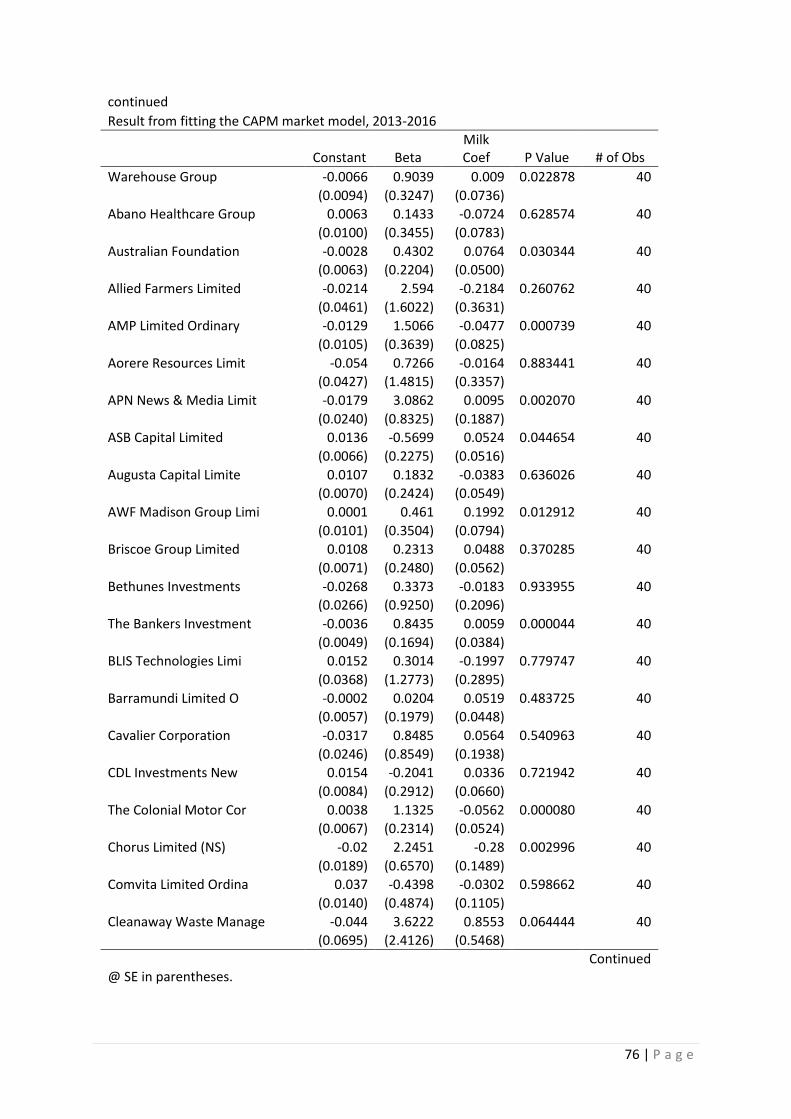
76 | P a g e
continued
Result from fitting the CAPM market model, 2013-2016
Constant Beta Milk Coef P Value # of Obs
Warehouse Group -0.0066 0.9039 0.009 0.022878 40
(0.0094) (0.3247) (0.0736)
Abano Healthcare Group 0.0063 0.1433 -0.0724 0.628574 40
(0.0100) (0.3455) (0.0783)
Australian Foundation -0.0028 0.4302 0.0764 0.030344 40
(0.0063) (0.2204) (0.0500)
Allied Farmers Limited -0.0214 2.594 -0.2184 0.260762 40
(0.0461) (1.6022) (0.3631)
AMP Limited Ordinary -0.0129 1.5066 -0.0477 0.000739 40
(0.0105) (0.3639) (0.0825)
Aorere Resources Limit -0.054 0.7266 -0.0164 0.883441 40
(0.0427) (1.4815) (0.3357)
APN News & Media Limit -0.0179 3.0862 0.0095 0.002070 40
(0.0240) (0.8325) (0.1887)
ASB Capital Limited 0.0136 -0.5699 0.0524 0.044654 40
(0.0066) (0.2275) (0.0516)
Augusta Capital Limite 0.0107 0.1832 -0.0383 0.636026 40
(0.0070) (0.2424) (0.0549)
AWF Madison Group Limi 0.0001 0.461 0.1992 0.012912 40
(0.0101) (0.3504) (0.0794)
Briscoe Group Limited 0.0108 0.2313 0.0488 0.370285 40
(0.0071) (0.2480) (0.0562)
Bethunes Investments -0.0268 0.3373 -0.0183 0.933955 40
(0.0266) (0.9250) (0.2096)
The Bankers Investment -0.0036 0.8435 0.0059 0.000044 40
(0.0049) (0.1694) (0.0384)
BLIS Technologies Limi 0.0152 0.3014 -0.1997 0.779747 40
(0.0368) (1.2773) (0.2895)
Barramundi Limited O -0.0002 0.0204 0.0519 0.483725 40
(0.0057) (0.1979) (0.0448)
Cavalier Corporation -0.0317 0.8485 0.0564 0.540963 40
(0.0246) (0.8549) (0.1938)
CDL Investments New 0.0154 -0.2041 0.0336 0.721942 40
(0.0084) (0.2912) (0.0660)
The Colonial Motor Cor 0.0038 1.1325 -0.0562 0.000080 40
(0.0067) (0.2314) (0.0524)
Chorus Limited (NS) -0.02 2.2451 -0.28 0.002996 40
(0.0189) (0.6570) (0.1489)
Comvita Limited Ordina 0.037 -0.4398 -0.0302 0.598662 40
(0.0140) (0.4874) (0.1105)
Cleanaway Waste Manage -0.044 3.6222 0.8553 0.064444 40
(0.0695) (2.4126) (0.5468)
@ SE in parentheses. Continued
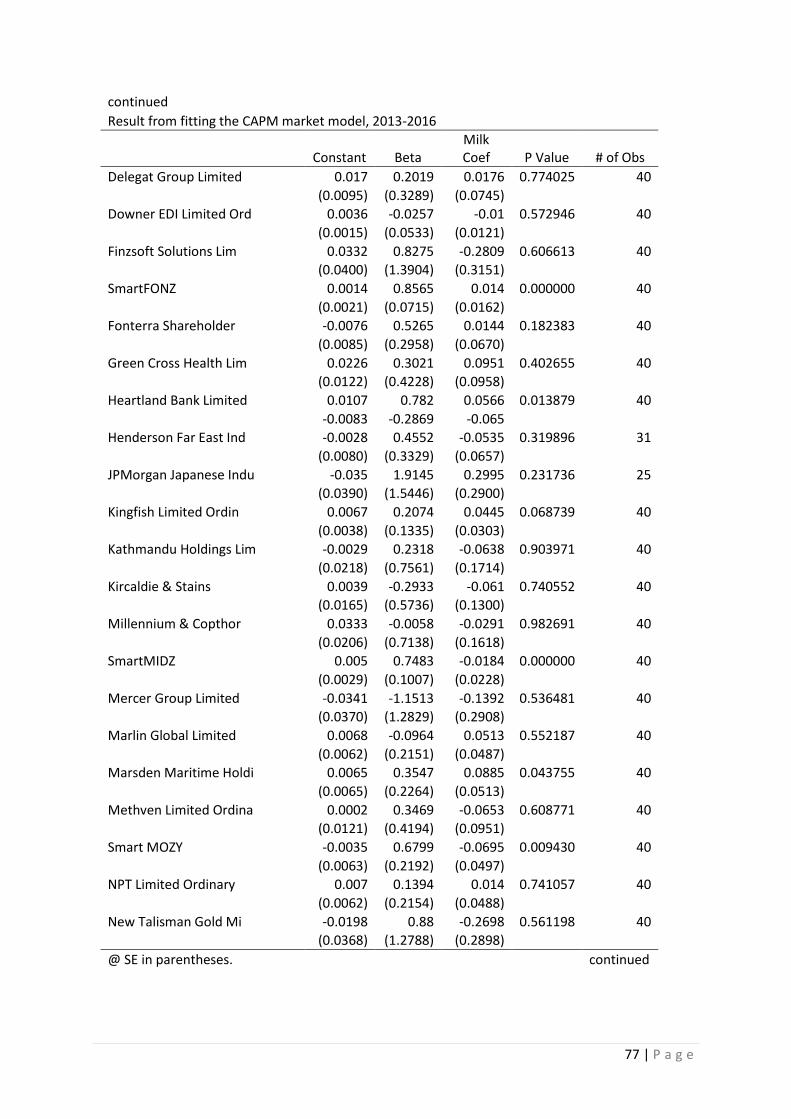
77 | P a g e
continued
Result from fitting the CAPM market model, 2013-2016
Constant Beta Milk Coef P Value # of Obs
Delegat Group Limited 0.017 0.2019 0.0176 0.774025 40
(0.0095) (0.3289) (0.0745)
Downer EDI Limited Ord 0.0036 -0.0257 -0.01 0.572946 40
(0.0015) (0.0533) (0.0121)
Finzsoft Solutions Lim 0.0332 0.8275 -0.2809 0.606613 40
(0.0400) (1.3904) (0.3151)
SmartFONZ 0.0014 0.8565 0.014 0.000000 40
(0.0021) (0.0715) (0.0162)
Fonterra Shareholder -0.0076 0.5265 0.0144 0.182383 40
(0.0085) (0.2958) (0.0670)
Green Cross Health Lim 0.0226 0.3021 0.0951 0.402655 40
(0.0122) (0.4228) (0.0958)
Heartland Bank Limited 0.0107 0.782 0.0566 0.013879 40
-0.0083 -0.2869 -0.065
Henderson Far East Ind -0.0028 0.4552 -0.0535 0.319896 31
(0.0080) (0.3329) (0.0657)
JPMorgan Japanese Indu -0.035 1.9145 0.2995 0.231736 25
(0.0390) (1.5446) (0.2900)
Kingfish Limited Ordin 0.0067 0.2074 0.0445 0.068739 40
(0.0038) (0.1335) (0.0303)
Kathmandu Holdings Lim -0.0029 0.2318 -0.0638 0.903971 40
(0.0218) (0.7561) (0.1714)
Kircaldie & Stains 0.0039 -0.2933 -0.061 0.740552 40
(0.0165) (0.5736) (0.1300)
Millennium & Copthor 0.0333 -0.0058 -0.0291 0.982691 40
(0.0206) (0.7138) (0.1618)
SmartMIDZ 0.005 0.7483 -0.0184 0.000000 40
(0.0029) (0.1007) (0.0228)
Mercer Group Limited -0.0341 -1.1513 -0.1392 0.536481 40
(0.0370) (1.2829) (0.2908)
Marlin Global Limited 0.0068 -0.0964 0.0513 0.552187 40
(0.0062) (0.2151) (0.0487)
Marsden Maritime Holdi 0.0065 0.3547 0.0885 0.043755 40
(0.0065) (0.2264) (0.0513)
Methven Limited Ordina 0.0002 0.3469 -0.0653 0.608771 40
(0.0121) (0.4194) (0.0951)
Smart MOZY -0.0035 0.6799 -0.0695 0.009430 40
(0.0063) (0.2192) (0.0497)
NPT Limited Ordinary 0.007 0.1394 0.014 0.741057 40
(0.0062) (0.2154) (0.0488)
New Talisman Gold Mi -0.0198 0.88 -0.2698 0.561198 40
(0.0368) (1.2788) (0.2898)
@ SE in parentheses. continued

78 | P a g e
continued
Result from fitting the CAPM market model, 2013-2016
Constant Beta Milk Coef P Value # of Obs
New Zealand Oil & Gas -0.0193 0.5804 -0.0914 0.116799 40
(0.0089) (0.3106) (0.0704)
OceanaGold Corporation 0.007 -0.0335 -0.1486 0.853391 40
(0.0349) (1.2102) (0.2743)
Opus International Cor -0.0088 0.3293 -0.0442 0.478065 40
(0.0085) (0.2944) (0.0667)
SmartOZZY -0.0083 0.724 -0.0248 0.004702 40
(0.0060) (0.2081) (0.0472)
Pacific Brands Limited 0.0225 -0.7384 -0.0766 0.459396 40
(0.0204) (0.7087) (0.1606)
Pyne Gould Corporation -0.0035 0.1534 -0.1364 0.566422 40
(0.0164) (0.5691) (0.1290)
Wrightson Limited -0.0079 1.1379 -0.1783 0.051188 40
(0.0147) (0.5109) (0.1158)
Promisia Integrative 0.0309 -1.9236 0.4066 0.128489 40
(0.0339) (1.1759) (0.2665)
Pumpkin Patch Limited -0.0841 1.1018 -0.0231 0.516816 40
(0.0279) (0.9670) (0.2192)
Pan Pacific Petroleum -0.0474 1.0185 0.0005 0.482827 40
(0.0248) (0.8617) (0.1953)
Rakon Limited Ordinary -0.0445 2.6076 -0.3421 0.003761 40
(0.0227) (0.7886) (0.1787)
Rubicon Limited Ordina -0.0182 1.0774 -0.1377 0.149181 40
(0.0168) (0.5846) (0.1325)
Scott Technology Limit -0.0162 0.9131 0.0696 0.066903 40
(0.0125) (0.4337) (0.0983)
Smiths City Group Limi 0.0029 -0.1912 -0.1331 0.059311 40
(0.0078) (0.2713) (0.0615)
SeaDragon Limited Ordi -0.0168 0.1642 0.0681 0.930871 40
(0.0288) (1.0004) (0.2267)
Seeka Kiwifruit Indust 0.0457 -0.183 -0.0242 0.922517 40
(0.0169) (0.5852) (0.1326)
Sealegs Corporation -0.0036 -0.2857 0.2924 0.450916 40
(0.0295) (1.0253) (0.2324)
South Port New Zealand 0.0173 -0.1372 -0.0027 0.889209 40
(0.0086) (0.2969) (0.0673)
Smartpay Holdings Limi -0.0228 0.7731 0.024 0.587305 40
(0.0228) (0.7929) (0.1797)
The City of London Ind -0.0431 3.9239 -0.1463 0.385258 40
(0.0818) (2.8417) (0.6440)
@ SE in parentheses. continued
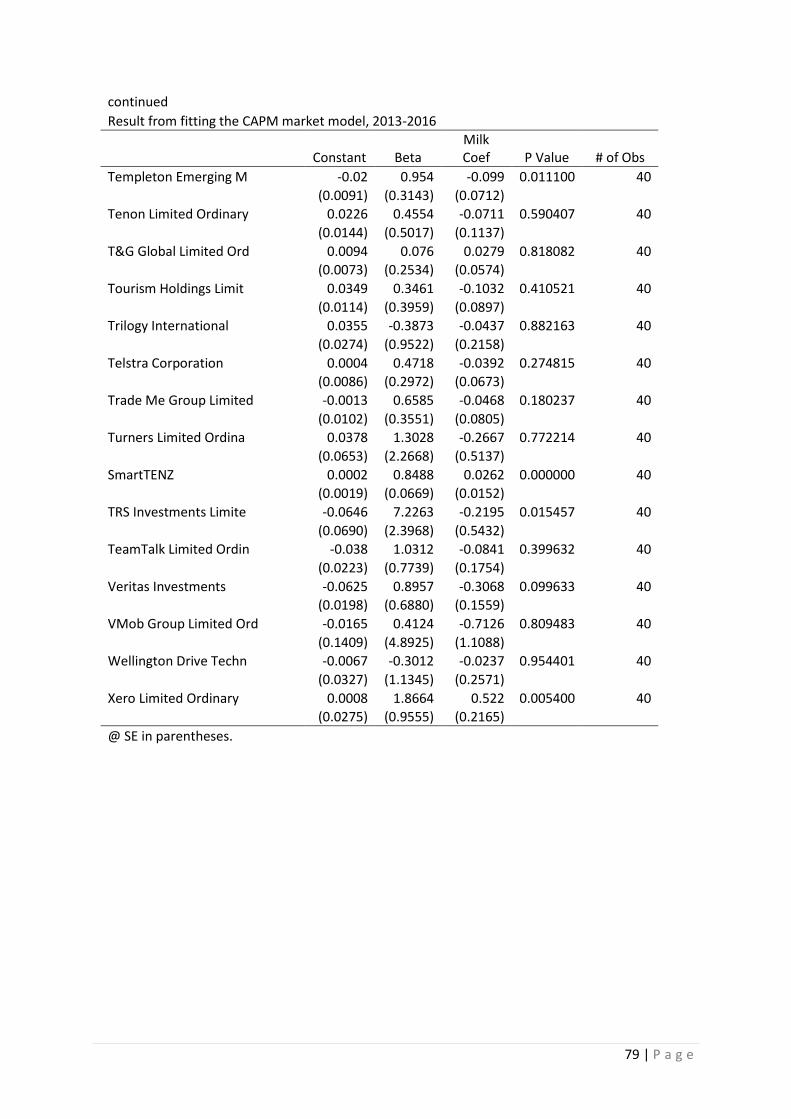
79 | P a g e
continued
Result from fitting the CAPM market model, 2013-2016
Constant Beta Milk Coef P Value # of Obs
Templeton Emerging M -0.02 0.954 -0.099 0.011100 40
(0.0091) (0.3143) (0.0712)
Tenon Limited Ordinary 0.0226 0.4554 -0.0711 0.590407 40
(0.0144) (0.5017) (0.1137)
T&G Global Limited Ord 0.0094 0.076 0.0279 0.818082 40
(0.0073) (0.2534) (0.0574)
Tourism Holdings Limit 0.0349 0.3461 -0.1032 0.410521 40
(0.0114) (0.3959) (0.0897)
Trilogy International 0.0355 -0.3873 -0.0437 0.882163 40
(0.0274) (0.9522) (0.2158)
Telstra Corporation 0.0004 0.4718 -0.0392 0.274815 40
(0.0086) (0.2972) (0.0673)
Trade Me Group Limited -0.0013 0.6585 -0.0468 0.180237 40
(0.0102) (0.3551) (0.0805)
Turners Limited Ordina 0.0378 1.3028 -0.2667 0.772214 40
(0.0653) (2.2668) (0.5137)
SmartTENZ 0.0002 0.8488 0.0262 0.000000 40
(0.0019) (0.0669) (0.0152)
TRS Investments Limite -0.0646 7.2263 -0.2195 0.015457 40
(0.0690) (2.3968) (0.5432)
TeamTalk Limited Ordin -0.038 1.0312 -0.0841 0.399632 40
(0.0223) (0.7739) (0.1754)
Veritas Investments -0.0625 0.8957 -0.3068 0.099633 40
(0.0198) (0.6880) (0.1559)
VMob Group Limited Ord -0.0165 0.4124 -0.7126 0.809483 40
(0.1409) (4.8925) (1.1088)
Wellington Drive Techn -0.0067 -0.3012 -0.0237 0.954401 40
(0.0327) (1.1345) (0.2571)
Xero Limited Ordinary 0.0008 1.8664 0.522 0.005400 40
(0.0275) (0.9555) (0.2165)
@ SE in parentheses.