Short-term forecasting of Taiwanese earthquakes using a universal model of fusion-fission processes
7
Short-Term Forecasting of Taiwanese Earthquakes Using a Universal Model of Fusion-Fission Processes Siew Ann Cheong 1,6 , Teck Liang Tan 1 , Chien-Chih Chen 2 , Wu-Lung Chang 2 , Zheng Liu 1 , Lock Yue Chew 1,6 , Peter M. A. Sloot 3,4,6 & Neil F. Johnson 5 1 Division of Physics and Applied Physics, School of Physical and Mathematical Sciences, Nanyang Technological University, 21 Nanyang Link, Singapore 637371, Republic of Singapore, 2 Department of Earth Sciences and Institute of Geophysics, National Central University, 300 Jhongda Road, Jhongli, 32001 Taiwan, 3 Computational Science, University of Amsterdam, Science Park 904, Amsterdam, The Netherlands, 4 National Research Institute ITMO, Kronverkskiy 49, 197101 St. Petersburg, Russian Federation, 5 Department of Physics, University of Miami, Coral Gables, FL 33124, United States of America, 6 Complexity Program, Nanyang Technological University, 60 Nanyang View, Singapore 639673, Republic of Singapore. Predicting how large an earthquake can be, where and when it will strike remains an elusive goal in spite of the ever-increasing volume of data collected by earth scientists. In this paper, we introduce a universal model of fusion-fission processes that can be used to predict earthquakes starting from catalog data. We show how the equilibrium dynamics of this model very naturally explains the Gutenberg-Richter law. Using the high-resolution earthquake catalog of Taiwan between Jan 1994 and Feb 2009, we illustrate how out-of-equilibrium spatio-temporal signatures in the time interval between earthquakes and the integrated energy released by earthquakes can be used to reliably determine the times, magnitudes, and locations of large earthquakes, as well as the maximum numbers of large aftershocks that would follow. U rbanization is accelerating in developing countries 1 , where the primary concern is building fast to meet growing demands for residential and commercial spaces. Many of these new or growing cities are in seismically active parts of the world, thus exposing more and more people to earthquake hazards. This danger is demonstrated clearly in the M-8.0 Wenchuan earthquake on May 12, 2008, where 69,195 people died, 18,392 people went missing 2 ; and the M-7.0 Haiti earthquake on Jan 12, 2010, where 230,000 died 3 , and 280,000 residential/commercial buildings were destroyed 4 . It will take a long time before building codes and practices in these countries catch up to those in developed countries like Japan and the United States. Until buildings become earthquake-proof, the biggest difference we as scientists can make for these people may be to predict earthquakes more reliably. But can earthquakes really be predicted on firm scientific grounds? The prevailing mood now appears to be resignation, i.e. either it cannot be done, or we simply do not understand enough to predict earthquakes in the foreseeable future 5,6 . To understand why, in the words of Wyss 7 , ‘‘earthquake prediction research is not progres- sing faster’’, let us consider the dichotomy between long-term (decades to centuries) time-independent risk assessment and medium-term (years) time-dependent risk assessment (generally accepted 8 ) and short-term (days to months) probabilistic forecasting and deterministic prediction (always controversial 9 ). As pointed out by Geller 10 , this distrust of short-term forecasting or prediction stems from the fact that claims of highly convoluted earthquake precursors frequently revolve around the study of one or two anecdotal large earthquakes. In such retrospective studies, it is easy to be lured into ‘tuning’ the precursors to produce apparently significant predictions. Naturally, such precursors cannot be expected to work a second time. A convincing precursor must therefore be structurally simple, and testable against easy-to-understand null hypotheses to establish statistical significance. Clearly, realistic models of earthquake processes will settle the earthquake prediction debate. At present, earthquakes are understood to be the products of interactions between tectonic plates at the largest length scales and longest time scales. However, such macroscopic models of tectonic plates naturally average over earthquakes, and hence cannot be used make predictions on them. A generally accepted microscopic model of the highly hierarchical and highly heterogeneous lithospheric earthquake fault system does not exist. Fortunately, the suggestion by Keilis-Borok that the lithosphere is a nonlinear system 11,12 both explains why earthquake prediction OPEN SUBJECT AREAS: SEISMOLOGY COMPUTATIONAL SCIENCE SCIENTIFIC DATA Received 26 September 2013 Accepted 4 December 2013 Published 10 January 2014 Correspondence and requests for materials should be addressed to P.M.A.S. (p.m.a. [email protected]) SCIENTIFIC REPORTS | 4 : 3624 | DOI: 10.1038/srep03624 1
Transcript of Short-term forecasting of Taiwanese earthquakes using a universal model of fusion-fission processes

Short-Term Forecasting of TaiwaneseEarthquakes Using a Universal Model ofFusion-Fission ProcessesSiew Ann Cheong1,6, Teck Liang Tan1, Chien-Chih Chen2, Wu-Lung Chang2, Zheng Liu1, Lock Yue Chew1,6,Peter M. A. Sloot3,4,6 & Neil F. Johnson5
1Division of Physics and Applied Physics, School of Physical and Mathematical Sciences, Nanyang Technological University, 21Nanyang Link, Singapore 637371, Republic of Singapore, 2Department of Earth Sciences and Institute of Geophysics, NationalCentral University, 300 Jhongda Road, Jhongli, 32001 Taiwan, 3Computational Science, University of Amsterdam, Science Park904, Amsterdam, The Netherlands, 4National Research Institute ITMO, Kronverkskiy 49, 197101 St. Petersburg, RussianFederation, 5Department of Physics, University of Miami, Coral Gables, FL 33124, United States of America, 6Complexity Program,Nanyang Technological University, 60 Nanyang View, Singapore 639673, Republic of Singapore.
Predicting how large an earthquake can be, where and when it will strike remains an elusive goal in spite ofthe ever-increasing volume of data collected by earth scientists. In this paper, we introduce a universal modelof fusion-fission processes that can be used to predict earthquakes starting from catalog data. We show howthe equilibrium dynamics of this model very naturally explains the Gutenberg-Richter law. Using thehigh-resolution earthquake catalog of Taiwan between Jan 1994 and Feb 2009, we illustrate howout-of-equilibrium spatio-temporal signatures in the time interval between earthquakes and the integratedenergy released by earthquakes can be used to reliably determine the times, magnitudes, and locations oflarge earthquakes, as well as the maximum numbers of large aftershocks that would follow.
Urbanization is accelerating in developing countries1, where the primary concern is building fast to meetgrowing demands for residential and commercial spaces. Many of these new or growing cities are inseismically active parts of the world, thus exposing more and more people to earthquake hazards. This
danger is demonstrated clearly in the M-8.0 Wenchuan earthquake on May 12, 2008, where 69,195 people died,18,392 people went missing2; and the M-7.0 Haiti earthquake on Jan 12, 2010, where 230,000 died3, and 280,000residential/commercial buildings were destroyed4. It will take a long time before building codes and practices inthese countries catch up to those in developed countries like Japan and the United States. Until buildings becomeearthquake-proof, the biggest difference we as scientists can make for these people may be to predict earthquakesmore reliably.
But can earthquakes really be predicted on firm scientific grounds? The prevailing mood now appears to beresignation, i.e. either it cannot be done, or we simply do not understand enough to predict earthquakes in theforeseeable future5,6. To understand why, in the words of Wyss7, ‘‘earthquake prediction research is not progres-sing faster’’, let us consider the dichotomy between long-term (decades to centuries) time-independent riskassessment and medium-term (years) time-dependent risk assessment (generally accepted8) and short-term(days to months) probabilistic forecasting and deterministic prediction (always controversial9). As pointed outby Geller10, this distrust of short-term forecasting or prediction stems from the fact that claims of highlyconvoluted earthquake precursors frequently revolve around the study of one or two anecdotal large earthquakes.In such retrospective studies, it is easy to be lured into ‘tuning’ the precursors to produce apparently significantpredictions. Naturally, such precursors cannot be expected to work a second time. A convincing precursor musttherefore be structurally simple, and testable against easy-to-understand null hypotheses to establish statisticalsignificance.
Clearly, realistic models of earthquake processes will settle the earthquake prediction debate. At present,earthquakes are understood to be the products of interactions between tectonic plates at the largest length scalesand longest time scales. However, such macroscopic models of tectonic plates naturally average over earthquakes,and hence cannot be used make predictions on them. A generally accepted microscopic model of the highlyhierarchical and highly heterogeneous lithospheric earthquake fault system does not exist. Fortunately, thesuggestion by Keilis-Borok that the lithosphere is a nonlinear system11,12 both explains why earthquake prediction
OPEN
SUBJECT AREAS:SEISMOLOGY
COMPUTATIONAL SCIENCE
SCIENTIFIC DATA
Received26 September 2013
Accepted4 December 2013
Published10 January 2014
Correspondence andrequests for materials
should be addressed toP.M.A.S. (p.m.a.
SCIENTIFIC REPORTS | 4 : 3624 | DOI: 10.1038/srep03624 1

is so difficult, and points out the way to do so without first building arealistic microscopic model. Essentially, in a nonlinear system, linearforcing frequently produces little or no change to the state of thesystem, until a critical point is reached. At this critical point, the stateof the nonlinear system changes abruptly and irreversibly. From thispoint of view, earthquakes are critical transitions in the state of thelithosphere.
Although they are abrupt, critical transitions fall into a smallnumber of universal classes that do not depend on microscopicdetails. In a recent series of papers and reviews13–17, Scheffer et al.demonstrated how we could exploit critical slowing down and crit-ical fluctuations to forecast critical transitions. In fact, the patterninformatics approach to earthquake forecasting18–20 is related to thecoarsening feature that precedes a critical transition. In this paper, weadopt a different approach based on the same principle of universal-ity. As we coarse grain microscopic models near their critical points,we obtain universal mesoscopic models that capture essential fea-tures of the physics with fewer parameters.
Universal mesoscopic model. At the mesoscopic level, it is notunreasonable to assume that the fault plane is made up ofnumerous elements (e.g. asperities) that normally slip past eachother21, dissipating the energy of the collisions between tectonicplates (see Figure 1). Sometimes, these elements get stuck, buildingup large compressive or shear stresses. Decades of research on forcenetworks and jamming in granular media tell us that stronginteractions between elements could result in smaller clusters ofstressed elements coalescing into larger clusters22,23. When twostressed elements finally slip past each other, the delicate balanceof forces within the cluster is destroyed, which then disintegratesvery rapidly into the individual elements, releasing the stressenergy in the form of an earthquake. Whatever the microscopicmodel of stress buildup and cascading failure may be, weinevitably end up with a mesoscopic model of fusion and fissionprocesses.
To turn this qualitative picture into quantitative understanding,we make use of the analogy between this network picture and thesoup-of-groups (SOG) model developed by Johnson and co-work-ers24,25 for understanding the size distributions of attacks made byterrorist and insurgent organizations. In this model, members of aterrorist or insurgent organization actively form groups, and these
groups merge to form larger groups, for the purpose of initiatinglarger attacks on their adversary. At the same time, such groupsare also under the pressure to disband, to avoid detection or limitthe effectiveness of pursuit by the police or the army. To demonstratehow such a statistical model of fusion-fission processes can help uspredict large earthquakes, let us first show the Gutenberg-Richter law
F mwMð Þ~10a{bM ,
where F(m . M) is the frequency of earthquakes with magnitudes mlarger than a given magnitude M26, very naturally emerges from theequilibrium dynamics of this SOG earthquake model.
We start from the master equations
Lns
Lt~
nz
N2
Xs{1
k~1
knk s{kð Þns{k{n{sns
N{
2nzsns
N2
X?
k~1
knk,
Ln1
Lt~
n{
N
X?
k~2
k2nk{2nzn1
N2
X?
k~1
knk
of the fusion-fission processes. In these equations, nk is the numberof clusters with k objects, and N is the total number of objects inthe SOG system. The two independent parameters in this modelare n1, the coalescence or fusion rate, and n2, the fragmentation orfission rate, assumed to be independent of cluster size. Solving thismodel, Johnson et al. found a power-law equilibrium size distri-bution
ns* s{a
with a universal exponent a which depends only on the dimen-sionality d of the model25. For infinite dimensions, which is the
case for terrorism or insurgency, a~52
25. For lower dimensions,
av
52
27. In particular, for a (d 5 2)-dimensional SOG model, the
exponent is a *v 227.In the Gutenberg-Richter law, the exponent b is very close to 1. If
we rewrite the Gutenberg-Richter law
F ewEð Þ* E{1
as a cumulative distribution, where e 5 10m and E 5 10M are theenergy released by magnitude-m and magnitude-M earthquakesrespectively, the underlying probability distribution for earthquakeenergies must be
p eð Þ* e{2:
Therefore, a two-dimensional SOG model where the energy ereleased by an earthquake is proportional to the size s of a clusterof crustal elements that disintegrated, very naturally explains theGutenberg-Richter law.
For some time, there was hope that the universal theory of self-organized criticality (SOC) would explain all empirical earthquakelaws28, but interest is waning as no success appears to be forthcoming.The greatest difference between the SOC and SOG models is in thelatter allowing us to understand out-of-equilibrium dynamics pre-ceding large earthquakes. Within this model, we understand that theSOG cluster of a large earthquake takes time to build up. As thecluster grows in size, the finite SOG system falls out of equilibrium,and we have progressive suppression of earthquakes from the largestto the smallest (see Section S1 of SI). The SOG earthquake modeltherefore predicts fewer smaller earthquakes (quiescence) before alarge earthquake, leading to longer and longer time intervals betweensmaller earthquakes (see Section S2 of SI). This suppression featurealso means that the rate at which energy is released by smaller earth-quakes become smaller and smaller (see Section S3 of SI). Finally,because the network of asperities lies on a nearly two-dimensional
Figure 1 | Schematic figure showing the fault plane, and the distributionof asperity distributed across it. Following dynamics of the soup-of-group
(SOG) model, smaller clusters of asperities can coalesce to form larger
clusters at a rate of n1, or they can fragment into individual asperities at a
rate of n2.
www.nature.com/scientificreports
SCIENTIFIC REPORTS | 4 : 3624 | DOI: 10.1038/srep03624 2

fault plane, the giant SOG cluster must also be spatially localized (seeSection S4 of SI). In this paper we discuss how these precursor sig-natures can be used for forecasting purposes, using the high-resolu-tion Taiwan earthquake catalog between Jan 1994 and Feb 2009 forstatistical verification, and the 1999 M-7.3 Chi-Chi earthquake as aspecific example for illustration purposes.
ResultsTime interval SOG signature. In Figure 2, we show the reportedtime intervals between successive earthquakes for the 1995 M-7.2Kobe earthquake and the 1999 M-7.3 Chi-Chi earthquake. Theexpected precursor signature shown in Figure S2 shows up veryclearly for these two very large earthquakes. In Section S5 of SI, wealso fit the empirical time intervals to the mean field theory, toestimate the average growth rate of the giant clusters, thenucleation time, as well as the time of the largest possibleearthquake. Based on the nonlinear fits, we find the Kobe and Chi-Chi SOG clusters growing at fractional rates (relative to themaximum cluster size) of 4.6 3 1026/day and 1.0 3 1023/dayrespectively. This suggests that the Kobe and Chi-Chi earthquakestook 593 years and 2.7 years respectively to build up.
Integrated energy SOG signature. Although the time intervalsignature appears universal, it is not sufficiently sensitive forforecasting purposes due to strong fluctuations in the timeintervals. The signal-to-noise ratio is not improved even withspatial localization, an aspect of the SOG earthquake modeldiscussed in Section S4 of SI. We therefore focused on makingpredictions based on the integrated nonlinear energy signature.
In Figure 3(a), we show the integrated nonlinear energy leading upto the Sep 20, 1999 M-7.3 Chi-Chi earthquake. In this figure, the mostpronounced feature is the rapid energy release by the Chi-Chi earth-quake and its aftershocks. Long before the Chi-Chi earthquake, wealso find the linear growth in integrated nonlinear energy expectedfrom the equilibrium SOG model. Just before the Chi-Chi earth-quake, this growth in integrated nonlinear energy slows down.When we subtract the empirical integrated nonlinear energy fromthe fitted mean-field linear growth, we find the nonlinear energydeficit precursor shown in Figure 3(b).
The final nonlinear energy deficit is two orders of magnitudelarger than the nonlinear energy released by the Chi-Chi earthquake,which is only equivalent to 3.7 M-6.0 earthquakes. Therefore, the
Chi-Chi earthquake alone could not have accounted for the finalnonlinear energy deficit. To properly account for this missing non-linear energy, we considered all aftershocks of Chi-Chi. Since after-shocks are hard to identify29–31, we used the Baiesi and Paczuskimethod32 to identify 1097 M . 3 earthquakes most correlated toChi-Chi (for details see Section S6). Adding up the energy releasedby Chi-Chi and its Baiesi-Paczuski aftershocks, we find fromFigure 3(c) that the energy deficit associated with Chi-Chi was recov-ered after about four months. This suggests that the nonlinear energydeficit is quantitatively meaningful, and can be used to roughlyforecast the maximum number of aftershocks above a certain size,and also when the aftershock sequence will end.
‘Forecasting’ the Chi-Chi earthquake. Finally, we demonstrate theforecasting potential of the integrated nonlinear energy precursor. InFigure 4, we show the nonlinear energy deficits of all cells in the formof a color map, with zero deficits shown in green, moderate deficitsshown in yellow, and large deficits shown in orange and red. It is clearfrom Figure 4 that the cluster of cells with positive nonlinear energydeficits is growing with time up till the Chi-Chi earthquake, whoseepicenter lies within the SOG cluster. Movie S1 shows how thecellular integrated nonlinear energy signature evolves over the 55weeks between Sep 1, 1998 and Sep 20, 1999. In Section S7 of SIwe show how particular anomalies in the cellular forecasting schemecan be exploited to more precisely forecast the epicenter of the‘impending’ large earthquake.
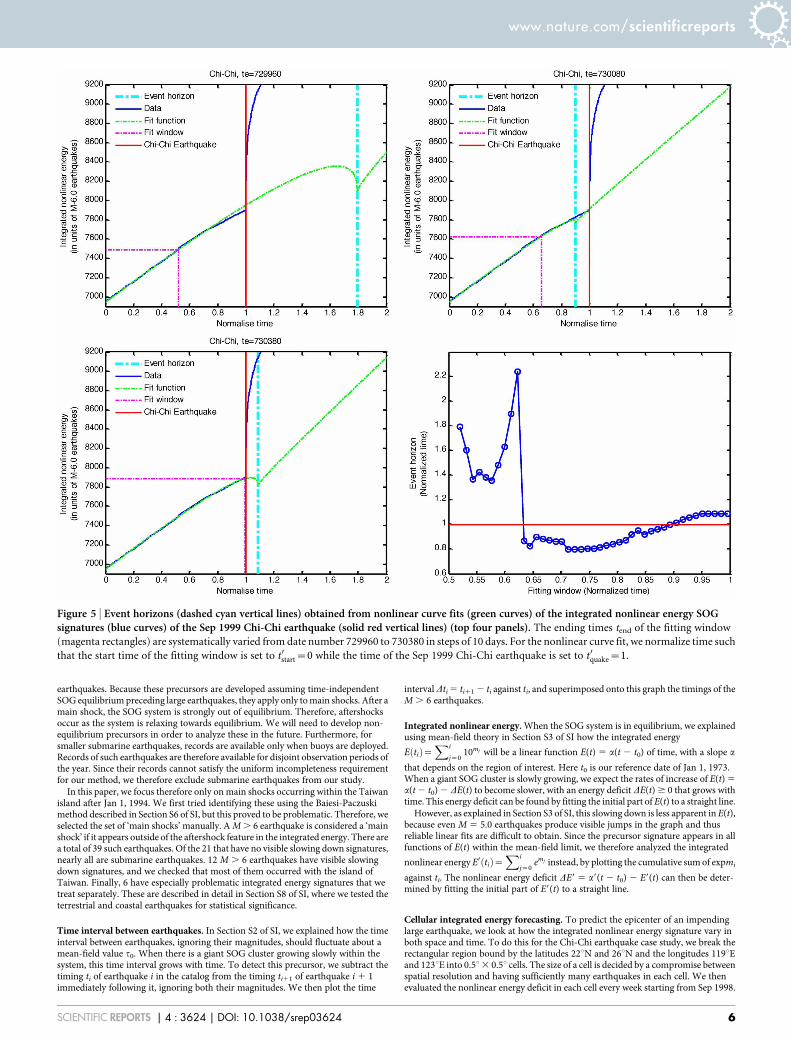
In Figure 5, we illustrate how the timing of the Chi-Chi earthquakecan be ‘forecasted’, by fitting the integrated nonlinear energy to itsmean-field formula in larger and larger time windows with the samestarting time. When the ending time of the fitting window is far fromthe Chi-Chi earthquake (in the linear growth regime), the eventhorizon occurs far into the future. When the ending time approachesthe Chi-Chi earthquake, the event horizon occurs in between the twotimes. Finally, once the ending time is within 40 days of the actualearthquake, the event horizon stops changing at a time about amonth after the Chi-Chi earthquake. The whole ‘real-time forecast-ing’ sequence is shown in Movie S2.
DiscussionIn computing the time interval and integrated energy signatures, weincluded earthquakes with magnitudes down to M 5 0.0 for theTaiwan earthquake catalog (and down to M 5 1.5 for the Japan
Figure 2 | Time interval between successive earthquakes as a function of time, showing SOG signature for two large earthquakes indicated by redvertical lines: (a) Jan 16, 1995 M-7.2 Kobe earthquake, and (b) Sep 20, 1999 M-7.3 Chi-Chi earthquake. These plots are created using earthquake catalogs
with earthquakes down to (a) M 5 1.5, and (b) M 5 0.0.
www.nature.com/scientificreports
SCIENTIFIC REPORTS | 4 : 3624 | DOI: 10.1038/srep03624 3

earthquake catalog to plot Figure 2(a)). Earth scientists worry aboutusing these small earthquakes for prediction, because many suchearthquakes frequently went undetected. Fortunately, both SOG pre-cursor signatures are not sensitive to the completeness of the earth-quake catalog at these small magnitudes, provided that the fraction ofmissing small earthquakes is temporally homogeneous (i.e. samefraction of small earthquakes missed at different times). So long asthis is satisfied, we do not even need the missing fraction to bespatially homogeneous (i.e. same fraction of small earthquakesmissed in different places) to make plausible predictions. Eventhough the integrated energy precursor is already visible from thesufficiently many M . 3 earthquakes, we go down to even smallerearthquakes to improve our signal-to-noise level.
In Figure 3(b), we see that up until the Jul 17, 1998 M-6.2 earth-quake in Chiayi County, 42 km south of the Sep 20, 1999 M-7.3 Chi-Chi epicenter, the nonlinear energy deficit did not exceed 10 M-6.0earthquakes. Shortly after the Chiayi earthquake, the nonlinearenergy deficit grew consistently, eventually reaching nearly 100 M-6.0 earthquakes before the Chi-Chi earthquake struck. Based on thissignature, we can start to tell of an imminent earthquake at the end ofJan 1999. At the end of Jun 1999, the nonlinear energy deficit wouldhave been growing continuously for five months, reaching an equi-valent of about 60 M-6.0 earthquakes. If planners could have takenheed at this point, there would still be three months left to makepreparations.
From the Chi-Chi case study, we see that the growth of the largeSOG cluster can be tracked, for us to estimate the likely epicenter. Inparticular, Movie S1 very clearly shows two smaller SOG clusters, onealong the east coast of Taiwan, and the other in the middle of Taiwan,merging into a giant cluster. Shortly after the fusion event, the Chi-Chi earthquake occurred. Geographically, Chi-Chi is close to thefocal point between the Ryukyu arc and the Luzon arc, if we extra-polate these inland. This suggests that the fusion event that led toChi-Chi is the result of interactions between these two tectonic faultsystems.
In fact, the anomalies discussed in Section S7 of SI suggests anorthward migrating sequence of earthquakes after the Jul 17,1998 M-6.2 earthquake in Chiayi County: (1) a M-5.51 earthquakeon Nov 17, 1998 in Pintung County, (2) a M-5.10 earthquake on Jul 7,1999 in Chiayi County, and then finally (3) the M-7.30 Chi-Chiearthquake on Sep 20, 1999. The line joining these three earthquakeslies close to the extension of the Luzon arc inland into Taiwan.
Thus far we have illustrated the power of the SOG model forearthquake prediction, using the M-7.30 Chi-Chi earthquake as a
case study. We have shown how all the expected precursors (increas-ing time interval between earthquakes, decreasing rate of energyreleased, and spatial localization) consistent with a growing SOGcluster have all been found prior to Chi-Chi. Naturally, a single casestudy invites skepticism, but we are confident the positive SOG pre-cursor seen for Chi-Chi is not a fluke.
To demonstrate that the SOG earthquake model produces statist-ically significant precursors, we test the integrated energy precursorsystematically for other M . 6 main shocks in Section S8 of SI. Intime intervals devoid of large M . 6 earthquakes, we find that fortime windows between 10 days and 50 days, the distribution ofenergy deficits is centered around zero deficit, with a standard devi-ation not exceeding 20 M-6.0 earthquakes. Using an energy deficit of20 M-6.0 earthquakes as the cutoff, we find a true positive rate of noless than 5/12 5 0.42 for the 12 M . 6 main shocks tested. At thiscutoff, the false positive rate is 234/3468 5 0.067 for a 50-day timewindow.
In Section S9 of SI, we also tested the time interval signature andintegrated energy signature against a synthetic earthquake cataloggenerated using the spatio-temporal epidemic-type activationsequence (STETAS) model33. None of the M . 6 earthquakes in thissynthetic catalog are accompanied by statistically significant precur-sors. We expect the same null outcome if we had tested the precur-sors against the Taiwan earthquake catalog reshuffled in space or intime.
From the Chi-Chi case study, we see that an impending largeearthquake can be detected as early as several months before. Bymonitoring the SOG energy deficit shown in Figure 3(b), we canarrive at a rough estimate on the size of the impending earthquake,i.e. small earthquakes are the most likely to occur if the energy deficitis small, and a large earthquake is more likely to occur if the energydeficit is large, instead of having the energy released through a seriesof only small earthquakes.
In itself, the SOG earthquake model does not provide a goodprediction on where the epicenter of the impending earthquake willbe: it can be anywhere within the giant SOG cluster whose growth canbe detected using the cellular precursor map shown in Figure 4.However, anomalies within the giant SOG cluster in the cellularprecursor map point to the likely epicenter. Moreover, from a phys-ical point of view it is reasonable to expect the future epicenter to beclose to where two smaller clusters merged.
Finally, through fitting the integrated energy signature to its meanfield theory in Sections S3 and S5 of SI, we can very accuratelydetermine the event horizon up to several months before the large
Figure 3 | Integrated nonlinear energy released by M , 6.0 earthquakes (a), and deviation from linear growth (b) as a function of time, in the period
leading up to the Sep 20, 1999 M-7.3 Chi-Chi earthquake. In (a), the green linear fit was performed on the integrated nonlinear energy between 20 Apr
1997 and 2 Sep 1998, and extrapolated to 15 Jan 2000. The integrated energy deviation shown in (b) is then obtained by subtracting the empirical
integrated nonlinear energy from the mean-field linear growth. In both plots, red vertical lines mark M . 6.0 earthquakes. The nonlinear curve fit shown
in Section S5 of SI gives us a fractional growth rate of 1.7 3 1024/day for the Chi-Chi SOG cluster. We believe this estimate is more reliable than the one
obtained from a nonlinear curve fit to the time interval SOG signature, which is one order of magnitude larger, even though no meaningful confidence
intervals could be extracted from both fits. In (c), we show the integrated energy released by the aftershocks of Chi-Chi as a function of time after the main
M-7.3 event.
www.nature.com/scientificreports
SCIENTIFIC REPORTS | 4 : 3624 | DOI: 10.1038/srep03624 4

earthquake. In the Chi-Chi case study, the timing of the earthquakefalls within the one-month range within which the event horizonfluctuated. Therefore, even though we cannot predict the large earth-quake down to the day, there is still great potential for using thisprediction for pre-crisis management and evacuation. In fact, thisgrowing fitting window prediction method can be made automaticand real-time, i.e. as a smaller earthquake is added to the catalog, wecan redo the nonlinear fitting to obtain a new event horizon. In thisway, at any point in time we always have a most up-to-date predic-tion of when an earthquake of the largest magnitude can occur.
MethodsData. For this study we used the high-resolution earthquake catalog of Taiwan fromJan 1973 to Feb 2009. From 1973 to 1993, we are confident that records of earthquakeswith M . 3 are complete. After Nov 10, 1993, earthquakes with magnitudes down toM 5 0.0 began to appear in the earthquake catalog, but we are only confident thatrecords of earthquakes with M . 2.0 are complete. For our case study and systematictest, we use the catalog starting Jan 1, 1994. In our analysis, we can eliminateearthquake magnitudes that are incomplete in the catalog. We chose not to, becausethey contain useful information. More importantly, as highlighted in the Discussionsection, the SOG precursors are not sensitive to incompleteness in the catalog.
When we systematically examine all 86 M . 6 earthquakes in the Taiwan catalog,we find that it is difficult to extract SOG precursor signatures for most large
Figure 4 | SOG energy deficits of cells for week 1 (top left), week 20 (top right), week 40 (bottom left), and week 55 (bottom right). In this figure,
the epicenter of the Sep 1999 Chi-Chi earthquake is marked with a ‘1’. Energy deficits close to zero are green, moderate energy deficits are yellow, and
large energy deficits are orange and red. In week 55, two of the cells have energy deficits so large that they appear deep red in the plot. The deep blue cells
contain too few earthquakes for the energy deficit to be estimated. See Supplementary Section S7 for discussions on the anomalous blue cells within the
SOG cluster seen in weeks 20 and 55, and Movie S1 for the entire week-to-week time evolution.
www.nature.com/scientificreports
SCIENTIFIC REPORTS | 4 : 3624 | DOI: 10.1038/srep03624 5
earthquakes. Because these precursors are developed assuming time-independentSOG equilibrium preceding large earthquakes, they apply only to main shocks. After amain shock, the SOG system is strongly out of equilibrium. Therefore, aftershocksoccur as the system is relaxing towards equilibrium. We will need to develop non-equilibrium precursors in order to analyze these in the future. Furthermore, forsmaller submarine earthquakes, records are available only when buoys are deployed.Records of such earthquakes are therefore available for disjoint observation periods ofthe year. Since their records cannot satisfy the uniform incompleteness requirementfor our method, we therefore exclude submarine earthquakes from our study.
In this paper, we focus therefore only on main shocks occurring within the Taiwanisland after Jan 1, 1994. We first tried identifying these using the Baiesi-Paczuskimethod described in Section S6 of SI, but this proved to be problematic. Therefore, weselected the set of ‘main shocks’ manually. A M . 6 earthquake is considered a ‘mainshock’ if it appears outside of the aftershock feature in the integrated energy. There area total of 39 such earthquakes. Of the 21 that have no visible slowing down signatures,nearly all are submarine earthquakes. 12 M . 6 earthquakes have visible slowingdown signatures, and we checked that most of them occurred with the island ofTaiwan. Finally, 6 have especially problematic integrated energy signatures that wetreat separately. These are described in detail in Section S8 of SI, where we tested theterrestrial and coastal earthquakes for statistical significance.
Time interval between earthquakes. In Section S2 of SI, we explained how the timeinterval between earthquakes, ignoring their magnitudes, should fluctuate about amean-field value t0. When there is a giant SOG cluster growing slowly within thesystem, this time interval grows with time. To detect this precursor, we subtract thetiming ti of earthquake i in the catalog from the timing ti11 of earthquake i 1 1immediately following it, ignoring both their magnitudes. We then plot the time
interval Dti 5 ti11 2 ti against ti, and superimposed onto this graph the timings of theM . 6 earthquakes.
Integrated nonlinear energy. When the SOG system is in equilibrium, we explainedusing mean-field theory in Section S3 of SI how the integrated energy
E tið Þ~Xi
j~010mj will be a linear function E(t) 5 a(t 2 t0) of time, with a slope a
that depends on the region of interest. Here t0 is our reference date of Jan 1, 1973.When a giant SOG cluster is slowly growing, we expect the rates of increase of E(t) 5
a(t 2 t0) 2 DE(t) to become slower, with an energy deficit DE(t) $ 0 that grows withtime. This energy deficit can be found by fitting the initial part of E(t) to a straight line.
However, as explained in Section S3 of SI, this slowing down is less apparent in E(t),because even M 5 5.0 earthquakes produce visible jumps in the graph and thusreliable linear fits are difficult to obtain. Since the precursor signature appears in allfunctions of E(t) within the mean-field limit, we therefore analyzed the integrated
nonlinear energy E0 tið Þ~Xi
j~0emj instead, by plotting the cumulative sum of expmi
against ti. The nonlinear energy deficit DE9 5 a9(t 2 t0) 2 E9(t) can then be deter-mined by fitting the initial part of E9(t) to a straight line.
Cellular integrated energy forecasting. To predict the epicenter of an impendinglarge earthquake, we look at how the integrated nonlinear energy signature vary inboth space and time. To do this for the Chi-Chi earthquake case study, we break therectangular region bound by the latitudes 22uN and 26uN and the longitudes 119uEand 123uE into 0.5u3 0.5u cells. The size of a cell is decided by a compromise betweenspatial resolution and having sufficiently many earthquakes in each cell. We thenevaluated the nonlinear energy deficit in each cell every week starting from Sep 1998.
Figure 5 | Event horizons (dashed cyan vertical lines) obtained from nonlinear curve fits (green curves) of the integrated nonlinear energy SOGsignatures (blue curves) of the Sep 1999 Chi-Chi earthquake (solid red vertical lines) (top four panels). The ending times tend of the fitting window
(magenta rectangles) are systematically varied from date number 729960 to 730380 in steps of 10 days. For the nonlinear curve fit, we normalize time such
that the start time of the fitting window is set to t0start~0 while the time of the Sep 1999 Chi-Chi earthquake is set to t0quake~1.
www.nature.com/scientificreports
SCIENTIFIC REPORTS | 4 : 3624 | DOI: 10.1038/srep03624 6

Real-time prediction of event horizon. To predict the timing of the impendingearthquake, we fit the empirical integrated energy to the deterministic mean fieldtheory in Section S3 of SI, using the procedure outlined in Section S5 of SI. Thenonlinear fit gives us the event horizon, which is time of the largest possibleearthquake. To mimic conditions of a real-time forecast, we begin with a 460-daywindow starting Apr 20, 1997, and enlarge it 10 days at a time. We fit only theintegrated energy within each time window to the mean field theory, to obtain theassociated event horizon. We then compare the slow time evolution of the eventhorizon against the expected behavior described in Section S10 of SI.
In practice, because of jumps in the empirical integrated energy curve caused bymoderate earthquakes, the event horizon fluctuates. If the jump is too large, thenonlinear curve fitting function in MATLAB can give an event horizon before thestart of the time window or within the fitting time window. Therefore, during thenonlinear curve fitting we have to restrict the event horizon to occur after the end ofthe fitting time window.
1. Atkins (2012) Future Proofing Cities. Report available at http://www.futureproofingcities.com/. Accessed September 25, 2013.
2. Sina.com (July 21, 2008) As of July 21, 69197 perished, 18222 missing in Sichuanearthquake (article in Chinese). URL: http://news.sina.com.cn/c/2008-07-21/170415971186.shtml. Accessed September 25, 2013.
3. BBC (February 11, 2010) Haiti quake death toll rises to 230,000. URL: http://news.bbc.co.uk/2/hi/americas/8507531.stm. Accessed September 25, 2013.
4. The Age (February 5, 2010) Haitians angry over slow aid. URL: http://www.theage.com.au/world/haitians-angry-over-slow-aid-20100204-ng2g.html. AccessedSeptember 25, 2013.
5. Geller, R. J. Earthquake prediction: a critical review. Geophys. J. Int. 131, 425–450(1997).
6. Geller, R. J., Jackson, D. D., Kagan, Y. Y. & Mulargia, F. Enhanced: earthquakescannot be predicted. Science 275, 1616–1620 (1997).
7. Wyss, M. Why is earthquake prediction research not progressing faster?Tectonophysics 338, 217–223 (2001).
8. Jordan, T. H. & Jones, L. M. Operational earthquake forecasting: some thoughtson why and how. Seismol. Res. Lett. 81, 571–574 (2010).
9. Main, I. Is the reliable prediction of individual earthquakes a realistic scientificgoal? Nature 397(1), (1999).
10. Geller, R. J. Earthquake prediction: is this debate necessary? Nature 397(1),(1999).
11. Keilis-Borok, V. I. The lithosphere of the Earth as a nonlinear system withimplications for earthquake prediction. Rev. Geophys. 28, 19–34 (1990).
12. Keilis-Borok, V. I. Earthquake prediction: state-of-the-art and emergingpossibilities. Annu. Rev. Earth Pl. Sc. 30, 1–33 (2002).
13. Scheffer, M. et al. Early-warning signals for critical transitions. Nature 461, 53–59(2009).
14. Hirota, M., Holmgren, M., van Nes, E. H. & Scheffer, M. Global resilience oftropical forest and savanna to critical transitions. Science 334, 232–235 (2011).
15. Veraart, A. J. et al. Recovery rates reflect distance to a tipping point in a livingsystem. Nature 481, 357–360 (2012).
16. Scheffer, M., Hirota, M., Holmgren, M., van Nes, E. H. & Chapin, F. S. Thresholdsfor boreal biome transitions. Proc. Natl. Acad. Sci. USA 109, 21384–21389 (2012).
17. Scheffer, M. et al. Anticipating critical transitions. Science 338, 344–348 (2012).18. Rundle, J. B., Tiampo, K. F., Klein, W. & Martins, J. S. S. Self-organization in leaky
threshold systems: The influence of near mean field dynamics and its implicationsfor earthquakes, neurobiology and forecasting. Proc. Natl. Acad. Sci. USA 99,2514–2521 (2002).
19. Tiampo, K. F., Rundle, J. B., McGinnis, S., Gross, S. J. & Klein, W. Mean-fieldthreshold systems and phase dynamics: An application to earthquake faultsystems. Europhys. Lett. 60, 481–487 (2002).
20. Rundle, J. B., Turcotte, D. L., Shcherbakov, R., Klein, W. & Sammis, C. Statisticalphysics approach to understanding the multiscale dynamics of earthquake faultsystems. Rev. Geophys. 41(4), 1019 (2003).
21. Aki, K. Higher-order interrelations between seismogenic structures andearthquake processes. Tectonophysics 211, 1–12 (1992).
22. Luding, S. & Hermann, H. J. Cluster-growth in freely cooling granular media.Chaos 9, 673–681 (1999).
23. Aranson, I. S. et al. Electrostatically driven granular media: phase transitions andcoarsening. Phys. Rev. Lett. 84, 3306–3309 (2000).
24. Bohorquez, J. C., Gourley, S., Dixon, A. R., Spagat, M. & Johnson, N. F. Commonecology quantifies human insurgency. Nature 462, 911–914 (2009).
25. Johnson, N. F., Ashkenazi, J., Zhao, Z. & Quiroga, L. Equivalent dynamicalcomplexity in a many-body quantum and collective human system. AIP Adv. 1,012114 (2011).
26. Gutenberg, B. & Richter, C. F. Frequency of earthquakes in California. B. Seismol.Soc. Am. 34(4), 185–188 (1944).
27. Stauffer, D. & Aharony, A. Introduction to Percolation Theory (Taylor and Francis,London) (1994).
28. Turcotte, D. L. Self-organized criticality. Rep. Prog. Phys. 62(10), 1377–1429(1999).
29. Davis, S. D. & Frohlich, C. Single-link cluster analysis, synthetic earthquakecatalogues, and aftershock identification. Geophys. J. Int. 104, 289–306 (1991).
30. Molchan, G. M. & Dmitrieva, O. E. Aftershock identification: methods and newapproaches. Geophys. J. Int. 109, 501–516 (1992).
31. Bottiglieri, M., Lippiello, E., Godano, C. & de Arcangelis, L. Identification andspatiotemporal organization of aftershocks. J. Geophys. Res. 114, B03303 (2009).
32. Baiesi, M. & Paczuski, M. Scale-free networks of earthquakes and aftershocks.Phys. Rev. E 69, 066106 (2004).
33. Ogata, Y. Space-time point-process models for earthquake occurrences. Ann. I.Stat. Math. 50, 379–402 (1998).
AcknowledgmentsP.M.A.S. acknowledges a grant from the ‘‘Leading Scientist Program’’ of the Government ofthe Russian Federation, under contract 11.G34.31.0019. P.M.A.S. also acknowledges thesupport from the FET-Proactive grant TOPDRIM, number FP7-ICT-318121.
Author contributionsS.A.C., C.C.C., W.L.C., L.Y.C., P.M.A.S. and N.F.J. conceived the study. C.C.C. and W.L.C.contributed the data. S.A.C., T.L.T. and Z.L. performed the data analyses. S.A.C. wrote themanuscript and supplementary text. S.A.C. and T.L.T. prepared the figures in themanuscript and supplementary text. All authors reviewed the manuscript.
Additional informationSupplementary information accompanies this paper at http://www.nature.com/scientificreports
Competing financial interests: The authors declare no competing financial interests.
How to cite this article: Cheong, S.A. et al. Short-Term Forecasting of TaiwaneseEarthquakes Using a Universal Model of Fusion-Fission Processes. Sci. Rep. 4, 3624;DOI:10.1038/srep03624 (2014).
This work is licensed under a Creative Commons Attribution-NonCommercial-ShareAlike 3.0 Unported license. To view a copy of this license,
visit http://creativecommons.org/licenses/by-nc-sa/3.0
www.nature.com/scientificreports
SCIENTIFIC REPORTS | 4 : 3624 | DOI: 10.1038/srep03624 7