Shopper Segmentation Using Multivariate Risk Analysis ... - IGI Global
15
DOI: 10.4018/IJABIM.20210101.oa4 International Journal of Asian Business and Information Management Volume 12 • Issue 1 • January-March 2021 60 Shopper Segmentation Using Multivariate Risk Analysis for Innovative Marketing Strategies G. Somasekhar, MITS School of Business, India K. Srinivasa Krishna, MITS School of Business, India Ashok Kumar Reddy, Hero Moto Corp Limited, Hyderabad, India T. Kishore Kumar, NITTE School of Management, Bangalore, India G. Somasekhar, MITS School of Business, India & Madanapalle Institute of Technology and Science, India ABSTRACT Shopper buying behaviour is essential for the retailers to segment the shoppers in accordance to their disruptive attitude and perception for better innovative strategies which may lead to higher profits. The major purpose of this study to categorize the shoppers into distinct groups based on their risk-based perception for the organized retail outlets in Bangladesh. Seven hundred eighty-five respondents were responding on 21 variables related to store which influence their buying behaviour. In the present study, the shoppers were classified into three segments such as value seekers and disruptive to please shoppers, quality and style-driven shoppers, sensory-driven, and not interested shoppers by using innovative k-means cluster analysis. The results of the study help to retailers in understanding the various disruptive segments of shoppers in relation to their importance for store attributes affected by their demographic characteristics and guide the retailers to take necessary actions regard redesign of retail mix to provide innovative value to the shoppers. KeywoRdS Behaviour, Innovate Marketing Strategies, Organized Retailing, Segmentation, Shoppers, Store Attributes INTRodUCTIoN According to Bangladesh Bureau of Statistics, the Bangladesh Retail Industry has emerged as one of the dynamic and fast-paced industries due to the entry of several fresh players. It accounts for over 7.3 percent of the country’s Gross Domestic Product (GDP) and around 8 percent of the employment. Bangladesh is the world’s 15th largest global destination in the retail landscape. Bangladesh’s retail market expected to grow nearly double to US$ 35.6 billion by 2021 from US$ 8.8 billion in 2015 driven by income growth, urbanization and attitudinal shifts. The Bangladesh retail market categorized into organized(modern) and unorganized (traditional) retail market and the total market is expected to grow at 12 percent per annum by 2020. In the Bangladesh retail market, the large portion of the market dominated by unorganized as Kirana stores (mom-and-pop stores)over organized retail market, but This article, originally published under IGI Global’s copyright on January 1, 2021 will proceed with publication as an Open Access article starting on February 5, 2021 in the gold Open Access journal, International Journal of Asian Business and Information Management (con- verted to gold Open Access January 1, 2021), and will be distributed under the terms of the Creative Commons Attribution License (http:// creativecommons.org/licenses/by/4.0/) which permits unrestricted use, distribution, and production in any medium, provided the author of the original work and original publication source are properly credited.
-
Upload
khangminh22 -
Category
Documents
-
view
1 -
download
0
Transcript of Shopper Segmentation Using Multivariate Risk Analysis ... - IGI Global
DOI: 10.4018/IJABIM.20210101.oa4
International Journal of Asian Business and Information ManagementVolume 12 • Issue 1 • January-March 2021
This article published as an Open Access article distributed under the terms of the Creative Commons Attribution License(http://creativecommons.org/licenses/by/4.0/) which permits unrestricted use, distribution, and production in any medium,
provided the author of the original work and original publication source are properly credited.
60
Shopper Segmentation Using Multivariate Risk Analysis for Innovative Marketing StrategiesG. Somasekhar, MITS School of Business, India
K. Srinivasa Krishna, MITS School of Business, India
Ashok Kumar Reddy, Hero Moto Corp Limited, Hyderabad, India
T. Kishore Kumar, NITTE School of Management, Bangalore, India
G. Somasekhar, MITS School of Business, India & Madanapalle Institute of Technology and Science, India
ABSTRACT
Shopper buying behaviour is essential for the retailers to segment the shoppers in accordance to their disruptive attitude and perception for better innovative strategies which may lead to higher profits. The major purpose of this study to categorize the shoppers into distinct groups based on their risk-based perception for the organized retail outlets in Bangladesh. Seven hundred eighty-five respondents were responding on 21 variables related to store which influence their buying behaviour. In the present study, the shoppers were classified into three segments such as value seekers and disruptive to please shoppers, quality and style-driven shoppers, sensory-driven, and not interested shoppers by using innovative k-means cluster analysis. The results of the study help to retailers in understanding the various disruptive segments of shoppers in relation to their importance for store attributes affected by their demographic characteristics and guide the retailers to take necessary actions regard redesign of retail mix to provide innovative value to the shoppers.
KeywoRdSBehaviour, Innovate Marketing Strategies, Organized Retailing, Segmentation, Shoppers, Store Attributes
INTRodUCTIoN
According to Bangladesh Bureau of Statistics, the Bangladesh Retail Industry has emerged as one of the dynamic and fast-paced industries due to the entry of several fresh players. It accounts for over 7.3 percent of the country’s Gross Domestic Product (GDP) and around 8 percent of the employment. Bangladesh is the world’s 15th largest global destination in the retail landscape. Bangladesh’s retail market expected to grow nearly double to US$ 35.6 billion by 2021 from US$ 8.8 billion in 2015 driven by income growth, urbanization and attitudinal shifts. The Bangladesh retail market categorized into organized(modern) and unorganized (traditional) retail market and the total market is expected to grow at 12 percent per annum by 2020. In the Bangladesh retail market, the large portion of the market dominated by unorganized as Kirana stores (mom-and-pop stores)over organized retail market, but
This article, originally published under IGI Global’s copyright on January 1, 2021 will proceed with publication as an Open Access article starting on February 5, 2021 in the gold Open Access journal, International Journal of Asian Business and Information Management (con-verted to gold Open Access January 1, 2021), and will be distributed under the terms of the Creative Commons Attribution License (http://creativecommons.org/licenses/by/4.0/) which permits unrestricted use, distribution, and production in any medium, provided the author of
the original work and original publication source are properly credited.
International Journal of Asian Business and Information ManagementVolume 12 • Issue 1 • January-March 2021
61
modern retail penetration would expand slowly at 1 percent compare to traditional retail penetration per annum.. The government has started more FDI in food retail and textile sector and positive thing is that the government has initiated improved methods to attract it in all sectors. GDP growth, improved ease of doing business, and better clarity regarding foreign direct investment regulations puts Bangaladesh in second place. Bangaladesh remains a challenging and complex market for foreign retailers, where understanding dynamics of 29 states are important due to states have historically had the power to opt in or out of FDI reforms (Kearney, A.T, 2016).
Domestic and foreign retail players have been showing tremendous growth rate since last decade and these players are offering more benefits to people across Bangaladesh. At the same time, the people are gradually changing their mindsets towards more quality conscious and preferring shopping in a better environment (Goswami &Mishra, 2008). Hence, this gives rise to new areas of study in retailing like ‘Shopper Buying Behaviour’, the retailers can use it for making shopper targeting strategy. The Shopper is an individual who visits the retail outlet to purchase merchandise unlike the consumer who uses the product. Many researchers have studied the consumer buying behaviour, but shopper behaviour is still a less explored area. Shopper plays a critical role in retailing while developing a target market strategy.
Establishment of a retail outlet involves huge investment, mostly on fixed assets like land and buildings, fixtures and fitting etc. Specifically store design cost is high in retailing and for retailers to get more returns they should use the space available optimally. This could be achieved by understanding the shopper attitudes and perceptions. Normally, many people they visit the store and come out of the store without making any purchase, thus it is essential for the retailers to convert these visitors into potential buyers. Retailers have adopted various strategies like improvement in store merchandise, ambience, facilities and other attributes to influence the buying behaviour of the shoppers including visitors. Apart from this it is also essential for the retailers to segment the shoppers in accordance to their attitude and perception for better strategies which may lead to higher profits. The major purpose of this study to categorize the shoppers into distinct groups based on their perception of organized retail outlets in Bangladesh.
Therefore, the objectives of the paper are to understand shopper segmentation and relative importance of several factors with respect of shopping behaviour based on clusters. Besides this the paper examines shopper segments based on socio-demographic variables. This paper opens with an extensive discussion of shopping behaviour and shoppers’ segmentation. This is followed by formulation of hypothesis and scope of the study. Subsequently, we present the research methodology of our quantitative research and followed by empirical analysis using factor and cluster analysis has been explained. The segments based on clustering were identified and profiled based on (Neha Purushottam, 2011).Finally, the paper ends with limitations and scope for future research.
ReVIew oF LITeRATURe
Shopping BehaviourThe research on shopping behaviour was initiated by Dodge and Summer, 1969. Store choice is dependent on consumers’ socioeconomic characteristics, personality and past purchase experience. Afterwards Kotler (1973), Mattson (1982), Malhotra (1983), Lumpkin et al. (1985), Davies (1995) contributed a lot towards the research on shopping behaviour and most of these researches were focused on a qualitative basis.(McGoldrick&Betts, 1995) Eight factors extracted through quantitative analysis (factor analysis) that influence shopping behaviour in the UK. However, till 2003 there was not much research done on shopping behaviour in Bangaladesh.
(Sinha &Banerjee, 2004)gives deeper insight on Indian shoppers’ behaviour, studied forty-three variables on modern formats of retailing were choice based on seven constructs such as proximity, merchandise, ambience, service, patronized and other two constructs.(Swoboda et al., 2009) Retailer
International Journal of Asian Business and Information ManagementVolume 12 • Issue 1 • January-March 2021
62
attributes have played a vital role to build retail brand equity differ between customers with high involvement and those with low involvement.(Ghosh, Tripathi &Kumar, 2010) the study reveals that Younger generation has more interested to visit organized retail rather than traditional retail outlets and tier 2 and tier 3 cities estimate a store on convenience and merchandise mix, store atmospherics and services.
(Deepika Jamb & Ravi Kiran, 2012) Consumers’ choice for modern retail formats vary as per their income level varies positively and store attributes like parking facility, trained sales personnel and complete security; product attributes like improved quality, variety of brands and assortment of merchandise. The study also highlighted on retailers’ perspective; according to the study retention strategies, promotional strategies, growth and improvement strategies, pricing strategies and competitive strategies are the most important contributors to the growth of organized retailing and play a significant role in enhancing the sales of retail formats. (Chui, K.T et.al., 2013) used K-means clustering to identify eight segments of household electronic appliances. (Wilhelmus Hary Susiloa, 2016) conducted a survey on 140 post graduate and Ph.D students to examine the impact of behavioural segmentation on consumer loyalty by using confirmatory factor analysis and structural equation modelling. The study reveals that behavioural segmentation, price, purchasing, communication marketing 3.0 and consumer loyalty were fit to the model. (Mohammad Anisur Rahman et.al., 2018) study concentrated on online shopping consumer behaviour in Dhaka city, Bangladesh. The study reveals that male and female shoppers’ behaviour were responded the same kind of opinion on various parameters. Hence, it is to notice that online shoppers are shop online due to save time, and for available varieties of products and services. Most of the online shoppers are keenly looking on security towards payment system, and there is a mixed opinion provided by respondents on overall online shopping satisfaction.(Vijay Victor, et.al., 2018) considered 27 attributes and these reduced to seven factors by using exploratory factor analysis namely as buying strategy, awareness of dynamic pricing, fair price perceptions, shopping experience, privacy concerns, intentions for self-protection and reprisal intentions. factors influence on consumer behaviour in a dynamic price situation.
Shoppers’ Segmentation(Quinn, Hines & Bennison, 2007) their study brings out that Market segmentation and customer segmentation are frequently used interchangeably in the sense that customer segmentation is usually related to the classification of potential or current customers.(McGoldrich, 2002) highlights that the mutually beneficial relationships between companies and consumers are affected by consumer heterogeneity. This is the reason marketers are frequently trying to develop and implement activities which are most suitable to the company’s target customer group. According to (Kotler et al., 2008) Segmentation recognizes that potential customers are characterized by a heterogeneity in their profiles, which eventually drives to a differentiation in their buying preferences, attitudes and behaviour and these differentiations may be embedded in their own characteristics like person variables, such as demographic and/or psychographic characteristics, product usage, level of patronage or other situational variables, like purchasing motives and usage occasions. Therefore, marketers may try different segmentation variations before deciding for the ones to adopt.
(Wind, 1978) the study reveals that the two approaches significantly contributed to segment a market, the “a priori segmentation”, which is based on a pre-selection of criteria according to which the customers can be split into segments, and the “post hoc” or “cluster-based segmentation” which is based on a person-by-variable interrelation.(Wedel & Kamakura, 2000) says that a priori and the post hoc segmentations are most widely accepted approaches in logic. The study initially proposed different shopper types based on shopping orientation studied on Chicago housewives comprised four types of shoppers: economic, personalizing, ethical, and apathetic. Since then, the shopping orientation approach has gained a growing appreciation, as it becomes more and more clear that the simultaneous assessment of brand and store-choice criteria and other personal variables and characteristics will enhance the understanding of shopping behaviour (Baltas & Papastathopoulou, 2003).
International Journal of Asian Business and Information ManagementVolume 12 • Issue 1 • January-March 2021
63
(Stone 1954; Lumpkin 1985; Hawkins et al. 1989; Darden and Dorsch, 1990) In these literatures, the construct is defined as shopping or shopper’s style, encompassing interests, opinions, attitudes, shopping preferences, activities and behaviours prior, during and after the shopping process. (Bloch et al., 1986 &Yavas, 2001) studies highlights that Demographic and psychographic techniques are the common bases for segmentation. Behaviour or use related segmentation, which categorizes consumers in terms of usage characteristics, usage rate, awareness or brand loyalty, have also been very popular and effective.(Yavas, 2003) studied on shopper segments by using multi-attribute approach in United States of America. The study considers relative strengths and weakness of 24 mall attributes, viewed as two shopper segments i.e. those shoppers who prefer to shop and who favour a competitor mall. The results reveal that there were significant differences for both importance and performance ratings across these two shopper segments.(Jin & Kim, 2003) the study focused on shopping motives in patronizing discount stores for segment Korean shoppers and results reveals that four segments labelled as leisurely motivated shoppers, socially-motivated shoppers, utilitarian shoppers and shopping apathetic shoppers.
(Ruiz et al, 2004) studied on “Another trip to the mall: a segmentation study of customers based on their activities”. The study identified four segments, namely, recreational shoppers, full experience shoppers, traditional shoppers and mission shoppers.(Martinez & Montaner, 2006) revealed three types of deal-proneness: in store promotion proneness, store flyers proneness and coupon proneness. The consumers who respond to in-store promotions are characterized by their price conscious and attach less importance to the product quality. They enjoy planning and shopping; when they do their shopping they usually buy impulsively, they enjoy brand switching frequently and they feel attracted by new products. In addition, they consider they have enough storage space for their extra purchase.
(Sandeep Mangaraj & Ben Senauer, 2001) worked on “A Segmentation Analysis of U.S. Grocery store shopper” post-hoc segmentation analysis using K-means clustering algorithm towards U. S. Supermarket shoppers. The results were identified, three segments namely time-pressed convenience seekers, sophisticates and Middle Americans.(Jayesh P Aagja et al., 2011) study highlights on developing linkages between service convenience on one side, and satisfaction/behavioural intentions on the other. The paper identified four customer segments based on their service convenience stores, namely Aspirers, Fatalists, Balance-oriented and Pre-purchase convenience seekers. Statistically insignificant differences were observed amongst these clusters based on demographics.
(Irini D. Rigopoulou et al., 2008) the study found that “situational” as well as “individual” store-choice criteria do merit attention as the basis for segmenting retail customers. These criteria, together with satisfaction, can be seen as a conceptual platform based on which retail customers can be effectively segmented. The study reveals that the customers fall into two different segments, namely the “fastidious” and the “easy-going” customers and these segments should give special attention by retailing managers to obtain higher levels of satisfaction.(Neha, 2011) studied customer demographics and their store attribute preferences in selecting a store. The study used 22 item scales developed by (Swinyard & Rinne, 1995) and reduced to five factors by conducting factor analysis and the study has been classified shoppers into five segments as sensory driven shoppers; not interested shoppers; quality and style driven shoppers; value seeker shoppers; and difficult to please shoppers.(Cagatan Taskin &Gul Gokay Emel, 2008) used Kohonen’s self-organising map neural network to segment online shoppers. The study classified three clusters based on internet related life style characteristics, such as online shopping lovers, social and suspicious online shoppers. According to (Shweta Pandey et.al., 2015) conducted a survey on 432 shoppers to segment online shoppers in Bangaladesh based on their lifestyles. The study found three significant segments such as mature traditionalists, offer enthusiasts and technology mavericks. (Sanjeev, P et.al., 2016) study highlights on segmenting young Bangaladesh impulsive shoppers, a cross sectional study was conducted on 448 young shoppers of age between 18-35 in four metropolitan cities such as Chennai, Delhi, Kolkata and Mumbai. The study was segmenting the young shoppers based on altitudinal, behavioural and situational factors. The researchers identified and classified five significant shopper segments such
International Journal of Asian Business and Information ManagementVolume 12 • Issue 1 • January-March 2021
64
as Aesthetic, need fulfilment, pleasant seekers, socialising and value seeker shoppers based on antecedent factors. Hence the study discovered that youth market is not performing homogeneous thoughts on their impulse buying behaviour. (Lavrijssen, A.H., 2016) thesis entitled ‘Segmentation Based on Consumer Shopping Behaviour’ focused on to identify different consumer segments based on shopping motivation and orientation, purchase environment preference and personality traits and demographics. The study extracted ten factors by using exploratory factor analysis and six clusters identified based on ten shopping behaviour factors. The six clusters constitute low standard shopping avoiders, Impulsive hedonics, balanced comparison shoppers, insecure brand loyal, task-oriented shoppers and recreational brand shoppers. (Almir, P et.al, 2018) study conducted on organic food buyers, 202 respondents considered based snow ball sampling technique to segment organic food buyers. The researchers analysed four clusters or segments named as enthusiastic social seekers, enthusiastic moralists, hostile seldom shoppers, and hostile heavy shoppers.
HyPoTHeSIS oF THe STUdy
The literature reviews gave deeper insights into attributes affecting shopping behaviour, shopper segments and for identifying the gap. Moreover, the literature helped for developing hypotheses based on the understanding shopping behaviour and shopper segmentation in the retail environment in Bangladesh. The following hypotheses were evolved.
H1: Shoppers’ segments are different among them, but similar within each segment in terms of their shopping behaviour.
H2: The demographic profile of the quality and style driven shoppers; value seekers and difficult to please shoppers; sensory driven and not interested shoppersare significantly different.
MeTHdoLoGy
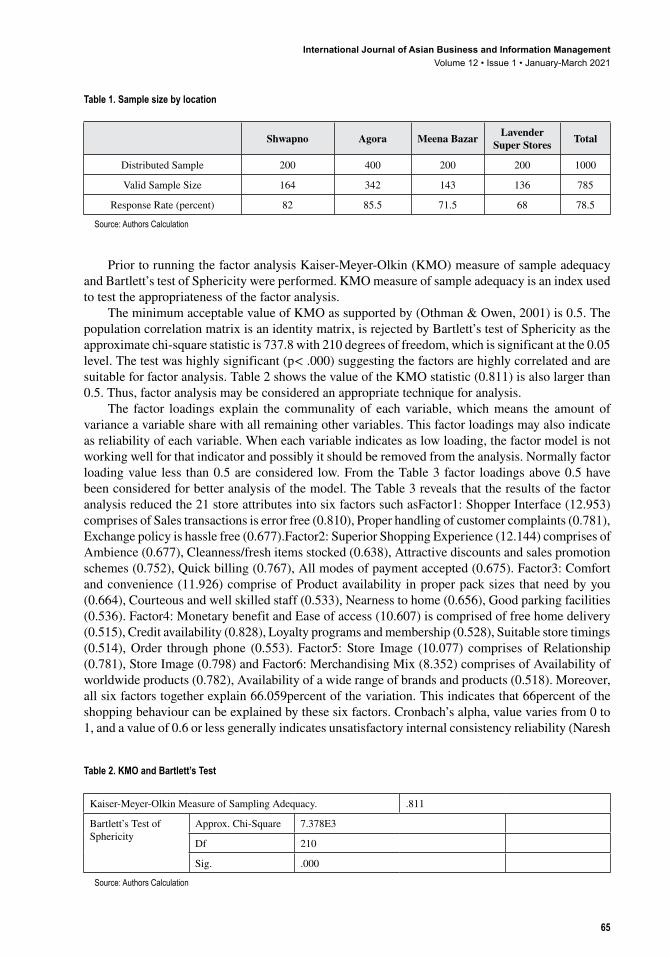
The present study is basically empirical in nature. The population of the study is confined to supermarket retail shoppers in Dhaka, Bangladesh. Many of the regions are basically backward in development and drought affected area in Bangladesh. Even though the backward region, but some of the cities in Bangladesh are showing significant changes in retailing with respect of organized format. In the present study, these five towns have considered as a sample areaand purposive sampling method has adopted for collecting data. Twenty-one attributes extracted from previous studies and Structured questionnaire have finalized by conducting a pilot study on 50 shoppers in Tirupati region. The respondents were requested to rank their responses on a five-point Likert scale ranging from “not at all important” (1) to “Extremely important (5). The research covered distinct groups of shoppers from the retail supermarkets. 200 shoppers covered foreach selected area and totally 1000 shoppers covered for all selected areas. The table 1 explains total sample and response rate as follows.
Finally, after the scrutiny 785 usable questionnaires have considered for analysing the shopping behaviour and shopper segments. Further the collected data was analysed by using various statistical tools like factor analysis, reliability analysis, cluster analysis, ANOVA and Chi-square test.
ReSULTS ANd dISCUSSIoNS
Factor Analysis The factor analysis was performed on the explanatory variables with the primary goal of data reduction. The principal component method, using varimax rotation, reduced the twenty-one explanatory variables to six factors having Eigen values greater than 1. For the purpose of interpretation, each factor was composed of variables that loaded 0.5 or higher on that factor.
International Journal of Asian Business and Information ManagementVolume 12 • Issue 1 • January-March 2021
65
Prior to running the factor analysis Kaiser-Meyer-Olkin (KMO) measure of sample adequacy and Bartlett’s test of Sphericity were performed. KMO measure of sample adequacy is an index used to test the appropriateness of the factor analysis.
The minimum acceptable value of KMO as supported by (Othman & Owen, 2001) is 0.5. The population correlation matrix is an identity matrix, is rejected by Bartlett’s test of Sphericity as the approximate chi-square statistic is 737.8 with 210 degrees of freedom, which is significant at the 0.05 level. The test was highly significant (p< .000) suggesting the factors are highly correlated and are suitable for factor analysis. Table 2 shows the value of the KMO statistic (0.811) is also larger than 0.5. Thus, factor analysis may be considered an appropriate technique for analysis.
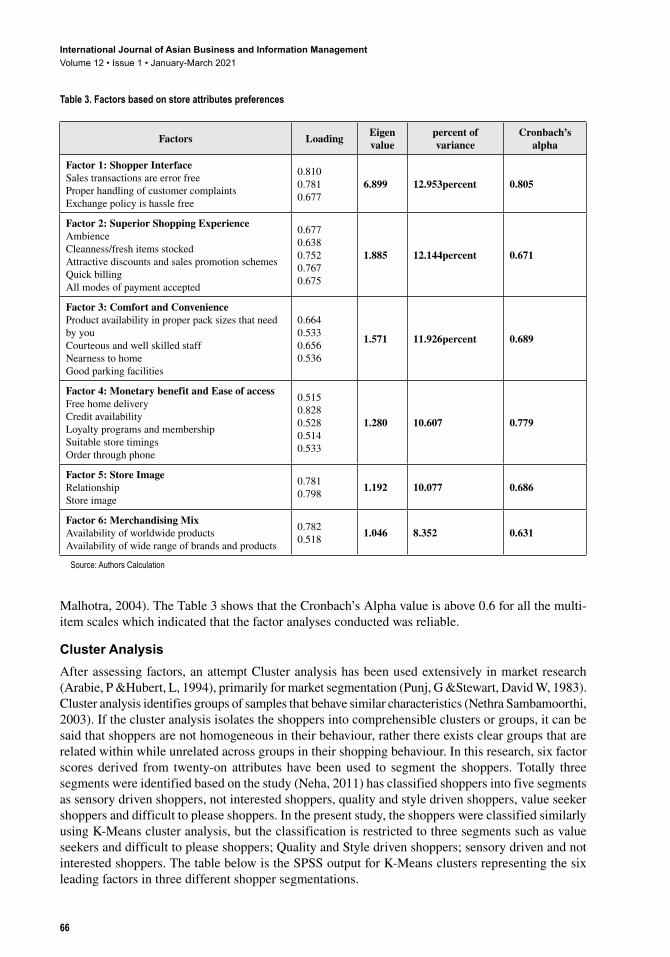
The factor loadings explain the communality of each variable, which means the amount of variance a variable share with all remaining other variables. This factor loadings may also indicate as reliability of each variable. When each variable indicates as low loading, the factor model is not working well for that indicator and possibly it should be removed from the analysis. Normally factor loading value less than 0.5 are considered low. From the Table 3 factor loadings above 0.5 have been considered for better analysis of the model. The Table 3 reveals that the results of the factor analysis reduced the 21 store attributes into six factors such asFactor1: Shopper Interface (12.953) comprises of Sales transactions is error free (0.810), Proper handling of customer complaints (0.781), Exchange policy is hassle free (0.677).Factor2: Superior Shopping Experience (12.144) comprises of Ambience (0.677), Cleanness/fresh items stocked (0.638), Attractive discounts and sales promotion schemes (0.752), Quick billing (0.767), All modes of payment accepted (0.675). Factor3: Comfort and convenience (11.926) comprise of Product availability in proper pack sizes that need by you (0.664), Courteous and well skilled staff (0.533), Nearness to home (0.656), Good parking facilities (0.536). Factor4: Monetary benefit and Ease of access (10.607) is comprised of free home delivery (0.515), Credit availability (0.828), Loyalty programs and membership (0.528), Suitable store timings (0.514), Order through phone (0.553). Factor5: Store Image (10.077) comprises of Relationship (0.781), Store Image (0.798) and Factor6: Merchandising Mix (8.352) comprises of Availability of worldwide products (0.782), Availability of a wide range of brands and products (0.518). Moreover, all six factors together explain 66.059percent of the variation. This indicates that 66percent of the shopping behaviour can be explained by these six factors. Cronbach’s alpha, value varies from 0 to 1, and a value of 0.6 or less generally indicates unsatisfactory internal consistency reliability (Naresh
Table 1. Sample size by location
Shwapno Agora Meena Bazar Lavender Super Stores Total
Distributed Sample 200 400 200 200 1000
Valid Sample Size 164 342 143 136 785
Response Rate (percent) 82 85.5 71.5 68 78.5
Source: Authors Calculation
Table 2. KMO and Bartlett’s Test
Kaiser-Meyer-Olkin Measure of Sampling Adequacy. .811
Bartlett’s Test of Sphericity
Approx. Chi-Square 7.378E3
Df 210
Sig. .000
Source: Authors Calculation
International Journal of Asian Business and Information ManagementVolume 12 • Issue 1 • January-March 2021
66
Malhotra, 2004). The Table 3 shows that the Cronbach’s Alpha value is above 0.6 for all the multi-item scales which indicated that the factor analyses conducted was reliable.
Cluster AnalysisAfter assessing factors, an attempt Cluster analysis has been used extensively in market research (Arabie, P &Hubert, L, 1994), primarily for market segmentation (Punj, G &Stewart, David W, 1983).Cluster analysis identifies groups of samples that behave similar characteristics (Nethra Sambamoorthi, 2003). If the cluster analysis isolates the shoppers into comprehensible clusters or groups, it can be said that shoppers are not homogeneous in their behaviour, rather there exists clear groups that are related within while unrelated across groups in their shopping behaviour. In this research, six factor scores derived from twenty-on attributes have been used to segment the shoppers. Totally three segments were identified based on the study (Neha, 2011) has classified shoppers into five segments as sensory driven shoppers, not interested shoppers, quality and style driven shoppers, value seeker shoppers and difficult to please shoppers. In the present study, the shoppers were classified similarly using K-Means cluster analysis, but the classification is restricted to three segments such as value seekers and difficult to please shoppers; Quality and Style driven shoppers; sensory driven and not interested shoppers. The table below is the SPSS output for K-Means clusters representing the six leading factors in three different shopper segmentations.
Table 3. Factors based on store attributes preferences
Factors Loading Eigen value
percent of variance
Cronbach’s alpha
Factor 1: Shopper InterfaceSales transactions are error free Proper handling of customer complaints Exchange policy is hassle free
0.810 0.781 0.677
6.899 12.953percent 0.805
Factor 2: Superior Shopping Experience Ambience Cleanness/fresh items stocked Attractive discounts and sales promotion schemes Quick billing All modes of payment accepted
0.677 0.638 0.752 0.767 0.675
1.885 12.144percent 0.671
Factor 3: Comfort and ConvenienceProduct availability in proper pack sizes that need by you Courteous and well skilled staff Nearness to home Good parking facilities
0.664 0.533 0.656 0.536
1.571 11.926percent 0.689
Factor 4: Monetary benefit and Ease of access Free home delivery Credit availability Loyalty programs and membership Suitable store timings Order through phone
0.515 0.828 0.528 0.514 0.533
1.280 10.607 0.779
Factor 5: Store ImageRelationship Store image
0.781 0.798 1.192 10.077 0.686
Factor 6: Merchandising Mix Availability of worldwide products Availability of wide range of brands and products
0.782 0.518 1.046 8.352 0.631
Source: Authors Calculation
International Journal of Asian Business and Information ManagementVolume 12 • Issue 1 • January-March 2021
67
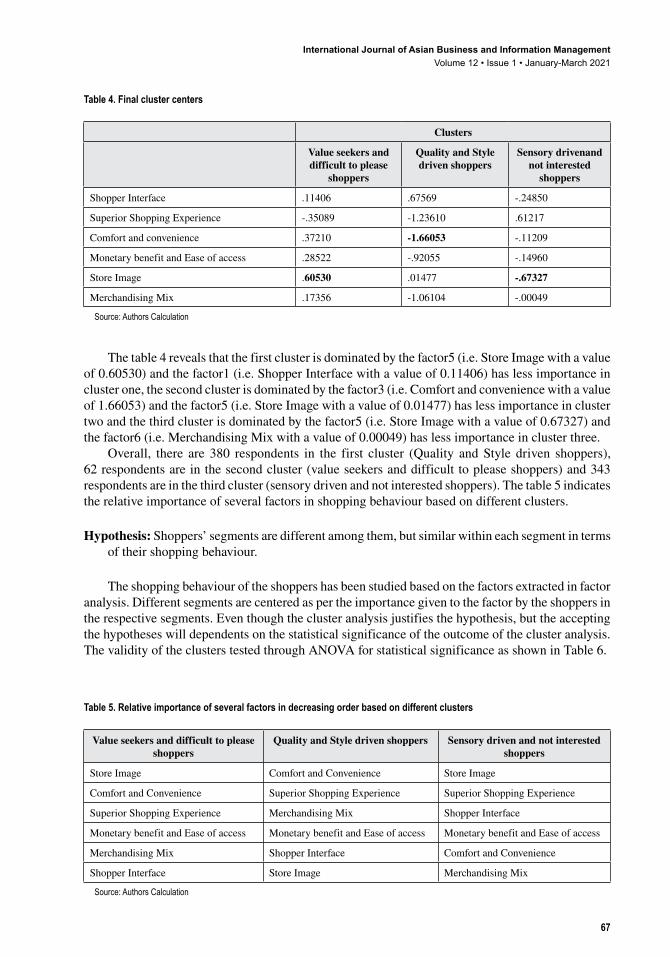
The table 4 reveals that the first cluster is dominated by the factor5 (i.e. Store Image with a value of 0.60530) and the factor1 (i.e. Shopper Interface with a value of 0.11406) has less importance in cluster one, the second cluster is dominated by the factor3 (i.e. Comfort and convenience with a value of 1.66053) and the factor5 (i.e. Store Image with a value of 0.01477) has less importance in cluster two and the third cluster is dominated by the factor5 (i.e. Store Image with a value of 0.67327) and the factor6 (i.e. Merchandising Mix with a value of 0.00049) has less importance in cluster three.
Overall, there are 380 respondents in the first cluster (Quality and Style driven shoppers), 62 respondents are in the second cluster (value seekers and difficult to please shoppers) and 343 respondents are in the third cluster (sensory driven and not interested shoppers). The table 5 indicates the relative importance of several factors in shopping behaviour based on different clusters.
Hypothesis: Shoppers’ segments are different among them, but similar within each segment in terms of their shopping behaviour.
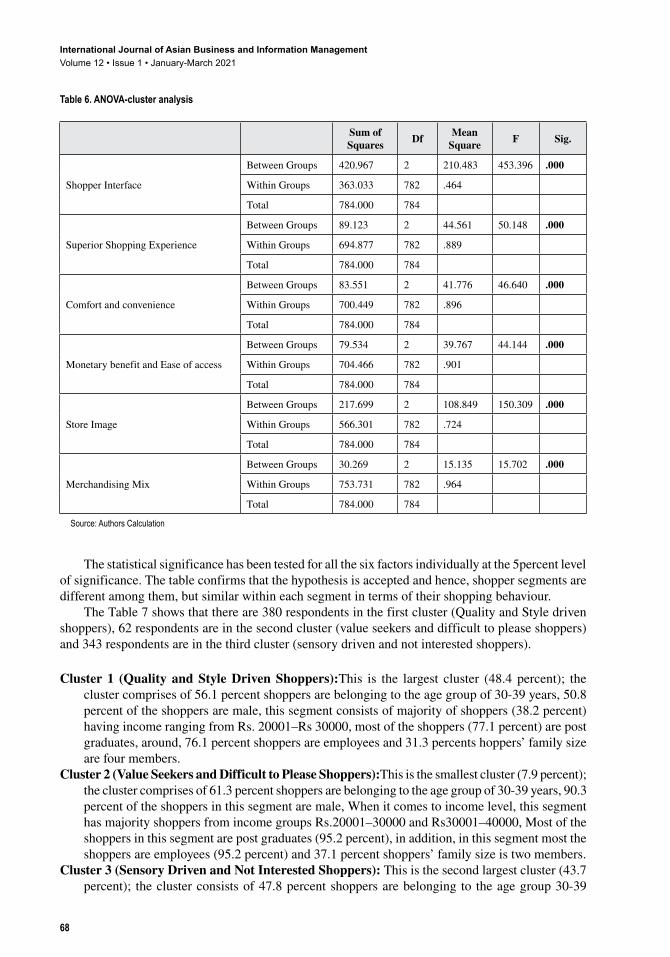
The shopping behaviour of the shoppers has been studied based on the factors extracted in factor analysis. Different segments are centered as per the importance given to the factor by the shoppers in the respective segments. Even though the cluster analysis justifies the hypothesis, but the accepting the hypotheses will dependents on the statistical significance of the outcome of the cluster analysis. The validity of the clusters tested through ANOVA for statistical significance as shown in Table 6.
Table 4. Final cluster centers
Clusters
Value seekers and difficult to please
shoppers
Quality and Style driven shoppers
Sensory drivenand not interested
shoppers
Shopper Interface .11406 .67569 -.24850
Superior Shopping Experience -.35089 -1.23610 .61217
Comfort and convenience .37210 -1.66053 -.11209
Monetary benefit and Ease of access .28522 -.92055 -.14960
Store Image .60530 .01477 -.67327
Merchandising Mix .17356 -1.06104 -.00049
Source: Authors Calculation
Table 5. Relative importance of several factors in decreasing order based on different clusters
Value seekers and difficult to please shoppers
Quality and Style driven shoppers Sensory driven and not interested shoppers
Store Image Comfort and Convenience Store Image
Comfort and Convenience Superior Shopping Experience Superior Shopping Experience
Superior Shopping Experience Merchandising Mix Shopper Interface
Monetary benefit and Ease of access Monetary benefit and Ease of access Monetary benefit and Ease of access
Merchandising Mix Shopper Interface Comfort and Convenience
Shopper Interface Store Image Merchandising Mix
Source: Authors Calculation
International Journal of Asian Business and Information ManagementVolume 12 • Issue 1 • January-March 2021
68
The statistical significance has been tested for all the six factors individually at the 5percent level of significance. The table confirms that the hypothesis is accepted and hence, shopper segments are different among them, but similar within each segment in terms of their shopping behaviour.
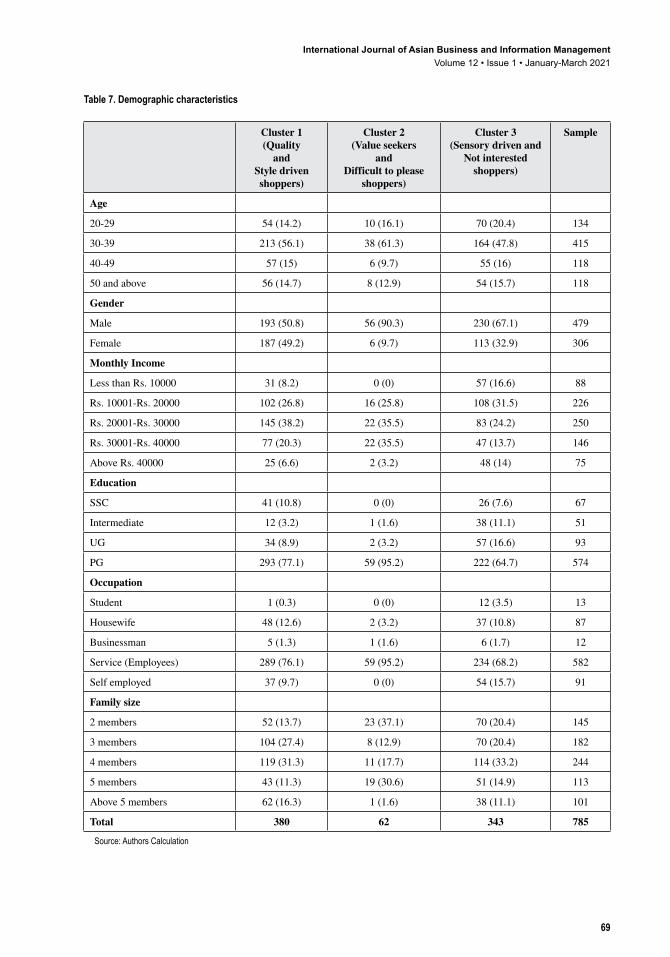
The Table 7 shows that there are 380 respondents in the first cluster (Quality and Style driven shoppers), 62 respondents are in the second cluster (value seekers and difficult to please shoppers) and 343 respondents are in the third cluster (sensory driven and not interested shoppers).
Cluster 1 (Quality and Style Driven Shoppers):This is the largest cluster (48.4 percent); the cluster comprises of 56.1 percent shoppers are belonging to the age group of 30-39 years, 50.8 percent of the shoppers are male, this segment consists of majority of shoppers (38.2 percent) having income ranging from Rs. 20001–Rs 30000, most of the shoppers (77.1 percent) are post graduates, around, 76.1 percent shoppers are employees and 31.3 percents hoppers’ family size are four members.
Cluster 2 (Value Seekers and Difficult to Please Shoppers):This is the smallest cluster (7.9 percent); the cluster comprises of 61.3 percent shoppers are belonging to the age group of 30-39 years, 90.3 percent of the shoppers in this segment are male, When it comes to income level, this segment has majority shoppers from income groups Rs.20001–30000 and Rs30001–40000, Most of the shoppers in this segment are post graduates (95.2 percent), in addition, in this segment most the shoppers are employees (95.2 percent) and 37.1 percent shoppers’ family size is two members.
Cluster 3 (Sensory Driven and Not Interested Shoppers): This is the second largest cluster (43.7 percent); the cluster consists of 47.8 percent shoppers are belonging to the age group 30-39
Table 6. ANOVA-cluster analysis
Sum of Squares Df Mean
Square F Sig.
Shopper Interface
Between Groups 420.967 2 210.483 453.396 .000
Within Groups 363.033 782 .464
Total 784.000 784
Superior Shopping Experience
Between Groups 89.123 2 44.561 50.148 .000
Within Groups 694.877 782 .889
Total 784.000 784
Comfort and convenience
Between Groups 83.551 2 41.776 46.640 .000
Within Groups 700.449 782 .896
Total 784.000 784
Monetary benefit and Ease of access
Between Groups 79.534 2 39.767 44.144 .000
Within Groups 704.466 782 .901
Total 784.000 784
Store Image
Between Groups 217.699 2 108.849 150.309 .000
Within Groups 566.301 782 .724
Total 784.000 784
Merchandising Mix
Between Groups 30.269 2 15.135 15.702 .000
Within Groups 753.731 782 .964
Total 784.000 784
Source: Authors Calculation
International Journal of Asian Business and Information ManagementVolume 12 • Issue 1 • January-March 2021
69
Table 7. Demographic characteristics
Cluster 1 (Quality
and Style driven shoppers)
Cluster 2 (Value seekers
and Difficult to please
shoppers)
Cluster 3 (Sensory driven and
Not interested shoppers)
Sample
Age
20-29 54 (14.2) 10 (16.1) 70 (20.4) 134
30-39 213 (56.1) 38 (61.3) 164 (47.8) 415
40-49 57 (15) 6 (9.7) 55 (16) 118
50 and above 56 (14.7) 8 (12.9) 54 (15.7) 118
Gender
Male 193 (50.8) 56 (90.3) 230 (67.1) 479
Female 187 (49.2) 6 (9.7) 113 (32.9) 306
Monthly Income
Less than Rs. 10000 31 (8.2) 0 (0) 57 (16.6) 88
Rs. 10001-Rs. 20000 102 (26.8) 16 (25.8) 108 (31.5) 226
Rs. 20001-Rs. 30000 145 (38.2) 22 (35.5) 83 (24.2) 250
Rs. 30001-Rs. 40000 77 (20.3) 22 (35.5) 47 (13.7) 146
Above Rs. 40000 25 (6.6) 2 (3.2) 48 (14) 75
Education
SSC 41 (10.8) 0 (0) 26 (7.6) 67
Intermediate 12 (3.2) 1 (1.6) 38 (11.1) 51
UG 34 (8.9) 2 (3.2) 57 (16.6) 93
PG 293 (77.1) 59 (95.2) 222 (64.7) 574
Occupation
Student 1 (0.3) 0 (0) 12 (3.5) 13
Housewife 48 (12.6) 2 (3.2) 37 (10.8) 87
Businessman 5 (1.3) 1 (1.6) 6 (1.7) 12
Service (Employees) 289 (76.1) 59 (95.2) 234 (68.2) 582
Self employed 37 (9.7) 0 (0) 54 (15.7) 91
Family size
2 members 52 (13.7) 23 (37.1) 70 (20.4) 145
3 members 104 (27.4) 8 (12.9) 70 (20.4) 182
4 members 119 (31.3) 11 (17.7) 114 (33.2) 244
5 members 43 (11.3) 19 (30.6) 51 (14.9) 113
Above 5 members 62 (16.3) 1 (1.6) 38 (11.1) 101
Total 380 62 343 785
Source: Authors Calculation
International Journal of Asian Business and Information ManagementVolume 12 • Issue 1 • January-March 2021
70
years, most of the shoppers are male (67.1 percent), majority of the shoppers (31.5 percent) belongs to the income group of Rs.10001–20000, Most of the shoppers are post graduates (64.7 percent), around 68.2 percent of the shoppers are employees and 33.2 percent shoppers’ family size are two members.
Inall three clusters majority of the respondents are 30-39 years age group, male shoppers, post graduates and, employees. Hence, these groups are influence more to form each cluster.
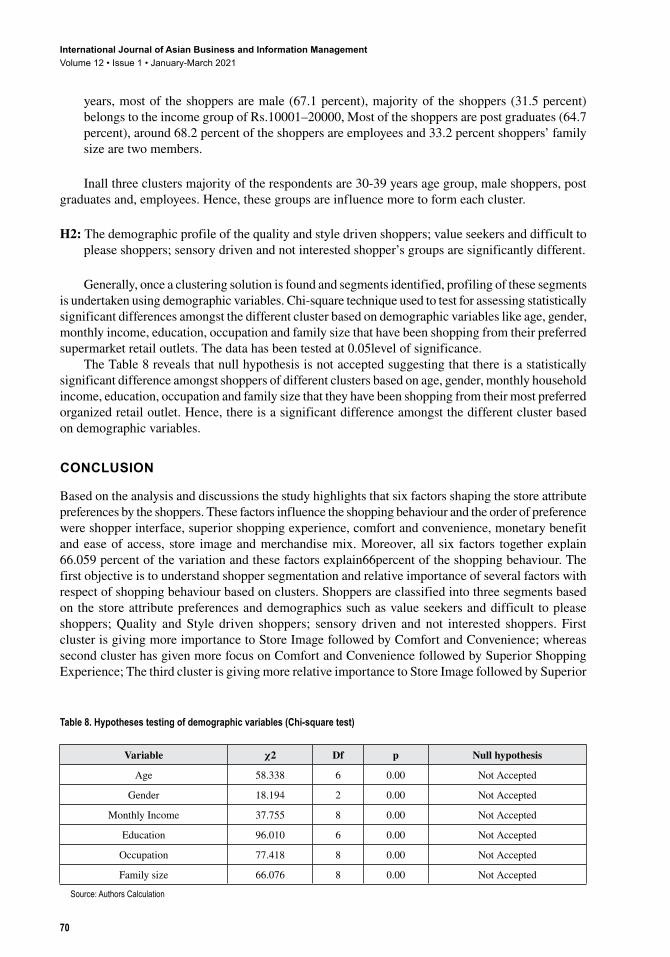
H2: The demographic profile of the quality and style driven shoppers; value seekers and difficult to please shoppers; sensory driven and not interested shopper’s groups are significantly different.
Generally, once a clustering solution is found and segments identified, profiling of these segments is undertaken using demographic variables. Chi-square technique used to test for assessing statistically significant differences amongst the different cluster based on demographic variables like age, gender, monthly income, education, occupation and family size that have been shopping from their preferred supermarket retail outlets. The data has been tested at 0.05level of significance.
The Table 8 reveals that null hypothesis is not accepted suggesting that there is a statistically significant difference amongst shoppers of different clusters based on age, gender, monthly household income, education, occupation and family size that they have been shopping from their most preferred organized retail outlet. Hence, there is a significant difference amongst the different cluster based on demographic variables.
CoNCLUSIoN
Based on the analysis and discussions the study highlights that six factors shaping the store attribute preferences by the shoppers. These factors influence the shopping behaviour and the order of preference were shopper interface, superior shopping experience, comfort and convenience, monetary benefit and ease of access, store image and merchandise mix. Moreover, all six factors together explain 66.059 percent of the variation and these factors explain66percent of the shopping behaviour. The first objective is to understand shopper segmentation and relative importance of several factors with respect of shopping behaviour based on clusters. Shoppers are classified into three segments based on the store attribute preferences and demographics such as value seekers and difficult to please shoppers; Quality and Style driven shoppers; sensory driven and not interested shoppers. First cluster is giving more importance to Store Image followed by Comfort and Convenience; whereas second cluster has given more focus on Comfort and Convenience followed by Superior Shopping Experience; The third cluster is giving more relative importance to Store Image followed by Superior
Table 8. Hypotheses testing of demographic variables (Chi-square test)
Variable χ2 Df p Null hypothesis
Age 58.338 6 0.00 Not Accepted
Gender 18.194 2 0.00 Not Accepted
Monthly Income 37.755 8 0.00 Not Accepted
Education 96.010 6 0.00 Not Accepted
Occupation 77.418 8 0.00 Not Accepted
Family size 66.076 8 0.00 Not Accepted
Source: Authors Calculation
International Journal of Asian Business and Information ManagementVolume 12 • Issue 1 • January-March 2021
71
Shopping Experience factors. The result also concludes that shopper segments are different among them, but similar within each segment in terms of their shopping behaviour. The second objective is to examine shopper segments based on socio-demographic variables. As a result of the study there is a significant difference amongst the different cluster based on demographic variables. Further, the retailers must understand the nature and behaviour of shopper segments for to take necessary actions regarding redesign of retail mix to provide greater value to the shoppers.
LIMITATIoNS ANd FUTURe ReSeARCH
The study is confined to shoppers of supermarkets; thus, the results might not apply for hypermarkets, discount stores, franchises, specialty stores, etc. Future research may cover all these formats individually and it can provide a rich picture of the shoppers in Bangladesh. The future research may attempt to cover the shoppers of all stores proportionately to conduct a comparative study between different formats as well as different towns. The data collected and presented views of shoppers from Dhaka city only. Future research can be extended to cover more cities and covering all districts across Bangladesh. Hence, it can provide better understanding and accurate analysis on shopper is possible in Bangladesh.
International Journal of Asian Business and Information ManagementVolume 12 • Issue 1 • January-March 2021
72
ReFeReNCeS
Arabie, P., & Hubert, L. (1994). Cluster Analysis in Marketing Research. In Advanced Methods in Marketing Research. Oxford: Blackwell and Co.
Baltas, G., & Papastathopoulou, P. (2003). Shopper characteristics, product and store choice criteria: A survey in the Greek grocery sector. International Journal of Retail & Distribution Management, 31(10), 498–507. doi:10.1108/09590550310497021
Bangaladesh Brand Equity Foundation. (2017). Retrieved from https://www.ibef.org/download/Retail-January-2017.pdf
Bloch Peter, H., Sherrell Daniel, L., & Ridgeway Nancy, M. (1986). Consumersearch an extended framework. The Journal of Consumer Research, 13(1), 119–126. doi:10.1086/209052
Chui, K. T., Tsang, K. F., Chung, S. H., & Yeung, L. F. (2013). Appliance signature identification solution using K-means clustering. IECON 2013-39th Annual Conference of the IEEE Industrial Electronics Society, 8420-8425. doi:10.1109/IECON.2013.6700545
Darden, W. R., & Dorsch, M. J. (1990). An action strategy approach to examining shopping behaviour. Journal of Business Research, 21(3), 289–308. doi:10.1016/0148-2963(90)90034-B
Davies, J.D., Foxall, G.R., & Pallister, J.G. (2002). Beyond the intentions-behaviour mythology: An integrated model of recycling behaviour. Marketing Theory, 2, 29–113. doi:10.1177/1470593102002001645
Dodge, R. H., & Summer, H. H. (1969). Choosing between retail stores. Journal of Retailing, 45(3), 11–21.
Ghosh, P., Tripathi, V., & Kumar, A. (2010). Customer expectations of store attributes: A study of organized retail outlets in Bangaladesh. Journal of Retail & Leisure Property, 9(1), 75–87. doi:10.1057/rlp.2009.27
Goswami, P., & Mishra, M. (2008). Would Bangaladeshn consumers move from kirana stores to organized retailers when shopping for groceries. Asia Pacific Journal of Marketing, 21(1), 127–143. doi:10.1108/13555850910926281
Hawkins, D. I., Rest, R. J., & Coney, K. A. (1989). Consumer Behaviour: Implications for Marketing Strategy. Irwin.
Irini, D., & Rigopoulou Rodoula, H., Tsiotsou, & Kehagias. (2008). Shopping orientation-defined segments based on store-choice criteria and satisfaction: An empirical investigation. Journal of Marketing Management, 24(9), 979–995. doi:10.1362/026725708X382000
Jamb, & Kiran. (2012). Emerging Trends of Organized Retailing in Bangaladesh: A Shared Vision of Consumers and Retailers Perspective. Middle East Journal of Scientific Research, 11(4), 481–490. idosi.org/mejsr/mejsr11(4) 12/12.pdf
Jasola, M. (2007). Emerging Trends in Retail Sector. Journal of IMS Group, 4(2), 22–28.
Jayesh, P. (2011). Validating Service Convenience Scale and Profiling Customers: A Study in the Bangaladeshn Retail Context. Vikalpa, 36(4), 25–49. doi:10.1177/0256090920110403
Jin, B., & Kim, J. (2003). A typology of Korean discount shoppers: Shopping motives, store attributes, and outcomes. International Journal of Service Industry Management, 14(4), 396–419. doi:10.1108/09564230310489240
Kamakura, W. A., & Russell, G. J. (1989). A probabilistic choice model for market segmentation and elasticity structure. JMR, Journal of Marketing Research, 26(4), 379–390. doi:10.1177/002224378902600401
Kearney, A. T. (2010). Global Retail Expansion at a Crossroads. Retrieved from https://www.atkearney.in/consumer-products-retail/global-retail-development-index/past-report
Kotler, P. (1973). Atmospherics as a marketing tool. Journal of Retailing, 49(4), 48–64.
Kotler, P., Armstrong, G., Wong, V., & Saunders, J. (2008). Principles of Marketing (5th European ed.). Prentice–Hall.
International Journal of Asian Business and Information ManagementVolume 12 • Issue 1 • January-March 2021
73
Lavrijssen, A. H. (2016). Segmentation Based on Consumer Shopping Behaviour: From shopping avoiders to impulsive hedonics. Retrieved fromhttps://www.centerdata.nl/en/publications/segmentation-based-on-consumer-shopping-behavior-from-shopping-avoiders-to-impulsive
Lumpkin, J. R. (1985). Shopping orientation segmentation of the elderly consumer. Journal of the Academy of Marketing Science, 13(2), 271–289. doi:10.1007/BF02729720
Malhotra, N. K. (1983). A threshold model of store choice. Journal of Retailing, 59(2), 3–21.
Malhotra, N. K. (2004). Marketing Research-An Applied Orientation (4th ed.). Pearson Education.
Mangaraj, S. & Senauer. (2001). A Segmentation Analysis of U.S. Grocery Store Shoppers (Working Paper01-08).
Martinez, E., & Montaner, T. (2006). The effect of consumer psychographic variables on deal proneness. Journal of Retailing and Consumer Services, 13(3), 157–168. doi:10.1016/j.jretconser.2005.08.001
Mattson, B. E. (1982). Situational influences on store choice. Journal of Retailing, 58(3), 46–58.
McGoldrich, P. (2002). Retail Marketing. McGraw-Hill.
McGoldrick, P. J., & Betts, E. J. (1996). Consumer behaviour and the retail “sales” Modelling the development of an attitude problem. European Journal of Marketing, 30(8), 40–58. doi:10.1108/03090569610130098
Othman & Owen. (2001). Adopting and Measuring Customer Service Quality (SQ) in Islamic Banks: A Case Study in Kuwait Finance House. International Journal of Islamic Financial Services, 3(1), 1-26.
Pandey, S., Chawla, D., & Venkatesh, U. (2015). Online Shopper Segmentation Based on Lifestyles: An Exploratory Study in Bangaladesh. Journal of Internet Commerce, 14(1), 21–41. doi:10.1080/15332861.2015.1006516
Pestek, A., Agic, E., & Cinjarevic, M. (2018). Segmentation of organic food buyers: An emergent market perspective. British Food Journal, 120(2), 269–289. doi:10.1108/BFJ-04-2017-0215
Prashar, S., Parsad, C., & Vijay, T. S. (2016). Segmenting Young Bangaladeshn Impulsive Shoppers. Journal of International Consumer Marketing, 29(1), 35–47. doi:10.1080/08961530.2016.1219897
PTI. (2016, March 28). 30 percent growth in AP tourist arrivals. The Hindu Business Line. Retrieved from https://www.thehindubusinessline.com/news/national/30-growth-in-ap-tourist-arrivals/article8405886.ece
Punj, G., & David, W. (1983). Cluster Analysis in Marketing Research: Review and Suggestions for Application. JMR, Journal of Marketing Research, 20(2), 134–148. doi:10.1177/002224378302000204
Purushottam, N. (2011). Store Attributes Preference in Selecting a Store: A study of Large-Scale Retail Stores in South Africa. Journal of Business and Behavioural Sciences, 23(3), 66–81. http://hdl.handle.net/10500/5654
Quinn, L., Hines, T., & Bennison, D. (2007). Making sense of market segmentation: A fashion retailing case. European Journal of Marketing, 41(5/6), 439–465. doi:10.1108/03090560710737552
Rahman, Islam, Esha, Sultana, & Chakravorty. (2018). Consumer buying behaviour towards online shopping: An empirical study on Dhaka city, Bangladesh. Cogent Business and Management, 5, 1–22. doi:10.1080/23311975.2018.1514940
Rinne, H., & Swinyard, W. R. (1995). Segmenting the discount store market: The domination of the difficult discounter core. International Review of Retail, Distribution and Consumer Research, 5(2), 123–145. doi:10.1080/09593969500000010
Ruiz, J., Chebat, J., & Hansen, P. (2004). Another trip to the mall: A segmentation study of customers based on their activities. Journal of Retailing and Consumer Services, 11(6), 333–350. doi:10.1016/j.jretconser.2003.12.002
Shankarlal, C. B. (2006). Land and People of Bangaladeshn States and Union Territories (2nd ed.). Gyan Publishing House.
Sinha, P. K., & Banerjee, A. (2004). Store choice behaviour in an evolving market. International Journal of Retail & Distribution Management, 32(10), 482–494. doi:10.1108/09590550410558626
International Journal of Asian Business and Information ManagementVolume 12 • Issue 1 • January-March 2021
74
Smith, W. R. (1956). Product Differentiation and Marketing Segmentation as alternative Marketing Strategy. Journal of Marketing, 21(1), 3–8. doi:10.1177/002224295602100102
Socio-Economic Survey. (2016-17). Planning Department, Government of Andhra Pradesh. Retrieved from http://www.ap.gov.in/wp-content/uploads/2017/03/SOCIO-ECONOMIC-SURVEY-2016-17.pdf
Stone, G. P. (1954). City shoppers and urban identification: Observations on the social psychology of city life. American Journal of Sociology, 60(1), 36–45. doi:10.1086/221483
Susiloa, W. H. (2016). An Impact of Behavioural Segmentation to Increase Consumer Loyalty: Empirical Study in Higher Education of Postgraduate Institutions at Jakarta. Procedia: Social and Behavioral Sciences, 229, 183–195. doi:10.1016/j.sbspro.2016.07.128
Swoboda, B., Haelsig, F., Klein, H. S., & Morschett, D. (2009). Moderating role on involvement in building retail brand. International Journal of Retail & Distribution Management, 37(11), 952–974. doi:10.1108/09590550910999370
Taskin, & Emel. (2008). Segmentation of Online Shoppers by Means of an Integrated Data Mining Approach: A Case Study. The Journal of Industrial Relations and Human Resources, 10(3), 74–88.
Victor, Thoppan, Nathan, & Maria. (2018). Factors Influencing Consumer Behaviour and Prospective Purchase Decisions in a Dynamic Pricing Environment-An Exploratory Factor Analysis Approach. Social Sciences, 153(7), 1-14. doi:10.3390/socsci7090153
Wedel, M., & Kamakura, W. A. (2000). Market segmentation conceptual and methodological foundations. Kluwer Academic Publishers. doi:10.1007/978-1-4615-4651-1
Wind, Y. (1978). Issues and advances in segmentation research. JMR, Journal of Marketing Research, 15(3), 317–337. doi:10.1177/002224377801500302
Yavas, U. (2001). Patronage motives and product purchase patterns: A correspondence analysis. Marketing Intelligence & Planning, 19(2), 97–103. doi:10.1108/02634500110385336
Yavas, U. (2003). A multi-attribute approach to understanding shopper segments. International Journal of Retail & Distribution Management, 31(11), 541–548. doi:10.1108/09590550310503276