THE FUTURE SHOPPER REPORT 2022 - Gorilla Group
103
6 TH EDITION THE FUTURE SHOPPER REPORT 2022 A deep dive into 18 international markets and 31,000+ consumers. A global report offering an unparalleled view into the world of online commerce and consumer shopping behavior to help businesses win online.
-
Upload
khangminh22 -
Category
Documents
-
view
3 -
download
0
Transcript of THE FUTURE SHOPPER REPORT 2022 - Gorilla Group

6TH EDITION
THE FUTURE SHOPPER REPORT 2022
A deep dive into 18 international markets and 31,000+ consumers. A global report offering an unparalleled view into the world of online commerce and consumer shopping behavior to help businesses win online.
2
METHODOLOGY
The research was conducted by Censuswide, with 31,040 online shoppers who shop online at least once a month in the following markets: 2,000 respondents in each of the following markets: UK, US, France, China, Japan, Australia, Argentina, Colombia, Spain, Brazil, Mexico and India and 1,000 respondents in each of the following markets: Germany, South Africa, UAE, Netherlands, Thailand and Indonesia. The research was run between 25.03.2022 – 07.04.2022. Censuswide abide by and employ members of the Market Research Society which is based on the ESOMAR principles.
HUGH FLETCHERGLOBAL MARKETING DIRECTOR AND THOUGHT LEADERSHIP LEAD
INTRODUCTIONWelcome to the 6th edition of Wunderman Thompson Commerce’s “Future Shopper” report – an unparalleled, broad-spectrum view into the shopping behaviors of the world’s consumers.
This year, the Future Shopper report is bigger than ever, covering 31,000+ consumers across 18 countries and 5 different continents.
As most of the world tentatively begins its exit from two years of COVID-19 related lockdowns and restrictions, there has never been a better time to take stock of the lasting impact this has had on consumer shopping habits, and for businesses to understand how this will affect them, their products and their services.
Are these changes, accelerated by COVID-19, lasting or temporary? Has the landscape of retail been partially or fully redrawn? And, more importantly, what needs to be done, as a consequence?
At Wunderman Thompson Commerce, we believe in listening to what consumers say to help define what strategies are best for our clients. What you’ll find in this report is a very clear set of messages – more online, but still omni-channel; renewed focus on service, particularly around delivery and returns; the ongoing power of marketplaces, and a thirst for more retail innovation.
Without further ado, let’s jump into the findings and start to understand more about the Future Shopper.

3
CONTENTS
02 INTRODUCTION
04 THE HEADLINES YOU NEED TO KNOW
07 THE FUTURE SHOPPER 2022 CONDENSED
09 SECTION 1: CHANGING CONSUMERS, CHANGING BEHAVIORS
23 SECTION 2: THE CUSTOMER JOURNEY
37 SECTION 3: GETTING THE EXPERIENCE RIGHT!
59 SECTION 4: MARK ETPLACES
69 SECTION 5: SOCIAL COMMERCE
79 SECTION 6: DIFFERENCE ACROSS SECTORS
83 SECTION 7: SUSTAINABILITY
89 SECTION 8: NEW CHANNELS, TECHNOLOGIES, AND THE FUTURE
99 CONCLUSION
101 HOW WE CAN HELP

4
THE FUTURE SHOPPER 2022:THE HEADLINES YOU NEED TO KNOW

5
THE HEADLINES YOU NEED TO KNOW
ONLINE SHOPPING GROWING
Online shopping continues to grow – with over half of all spending now online, consumers are more comfortable with technology, and demanding digital products and services.
Is your business ready for a world where online is the main channel and your customers are digitally minded?
THINK OMNI-CHANNEL
But it’s not just online, it’s omni-channel – consumers are using more channels for inspiration, search and purchase than ever before, and craving seamlessly integrated experiences across physical and digital.
Do you have a balanced channel strategy which enables consumers to interact and shop with you through whichever channel they want, whenever they want, wherever they are?
MARKETPLACES ARE WINNING
Marketplaces are currently providing the best online experience to consumers and are the most used channels across the 3 key stages of the purchase process – inspiration, search and purchase.
Do you have a robust, scalable marketplace strategy, whilst also ensuring that your other channels are not cannibalized?
POOR EXPERIENCES ARE UNACCEPTABLE ONLINE
Whatever the channel, consumers are increasingly intolerant of poor experience – and expect lightning-fast delivery, easy returns and availability.
Are you service-led and reaching the high expectations that your consumers have when it comes to the online shopping experience?
01 02 03 04

6
SOCIAL COMMERCE ON THE RISE
Another channel rising in importance is social commerce – with many consumers already claiming to be buying through social platforms, and more intending to in the future.
Do you have a social commerce strategy, and is it still fit for purpose in light of ongoing industry developments?
SUSTAINABILITY IS VITAL, BUT NOT AT THE EXPENSE OF SERVICE
Sustainability is a key factor in online purchase decision making. Consumers like to have sustainable options and want brands and retailers to have purpose beyond pure business. But consumers want it all… sustainability without compromising great service.
What is your sustainability practice, and how can it dovetail with the investments you need to make in delivering a best-in-class service across delivery, returns and availability?
CONSUMERS CRAVE RETAIL INNOVATIONS
Innovation is a key requirement for consumers. They want and expect innovative retail experiences – be that cashless payment, new store formats or voice.
Do you have a clear view on the innovations your consumers crave and that your online and physical stores can embrace?
CONSUMERS ARE BEING REDEFINED
We must redefine what a consumer actually is – we are no longer marketing and selling just to humans, but to their avatars in gaming and the metaverse, and ultimately to consumers that may not even be alive.
Are you prepared for the future, multi-dimensional consumer and for how this will change the way you sell and market your products and services?
05 06 07 08
THE HEADLINES YOU NEED TO KNOW

7
2. WFH IS CHANGING CONSUMER BEHAVIOR
60% of shoppers said they want their future work habits to include more working from home (WFH).
62% of global consumers said they have discovered new brands and retailers as a consequence of working from home more.
3. DIGITAL AND INSTANTLY DOWNLOADABLE PRODUCTS ARE INCREASINGLY BEING DEMANDED
49% of global shoppers said they would prefer their online purchases to be digital and instantly downloadable.
38% of everything bought online is a digital product or service.
4. CONSUMERS WANT OMNI-CHANNEL EXPERIENCES
60% of global shoppers said they prefer to shop with a retailer or brand that has both digital and physical stores.
36% of global consumers are still frightened about shopping in-store, down from 41% in 2021.
Direct-to-consumer (DTC) brands must work harder to stop attrition and improve experience. From inspiration 14%, search 15% and purchase 7%.
5. BUT THE NUMBER ONE CHANNEL IS MARKETPLACES
34% of global shoppers get their inspiration from marketplaces – ahead of search engines in second position (31%).
36% of global shoppers start their search on marketplaces – ahead of search engines in second position (30%).
35% of all online shopping globally is via marketplaces – down from 42% last year, but still ahead of supermarkets and grocers at 17%.
However, it’s not all good news, as marketplaces are losing some ground, as the number of channels proliferate.
THE FUTURE SHOPPER 2022 CONDENSED1. ONLINE SHOPPING HAS INCREASED, AND WILL CONTINUE TO RISE
57% of spending is currently online.
54% – the percentage consumers predict they will spend online in a post-COVID-19 world.
60% of global shoppers said they will increase their usage of digital shopping channels in the future.
72% of consumers said they are more comfortable using technology than before the COVID-19 outbreak – up from 60% last year.

8
6. CONSUMERS ARE DEMANDING AND INTOLERANT; MORE NEEDS TO BE DONE TO IMPROVE THE ONLINE SHOPPING EXPERIENCE
62% of global shoppers wish that online shopping was more entertaining.
58% of shoppers said they would not shop with a retailer, brand or marketplace that does not meet their expectations.
No. 1! Across every criteria we asked, marketplaces were seen as offering the best experience. 8. SERVICE IS KEY – DELIVERY IS
A MAJOR BATTLEGROUND
No. 1! – the number one thing consumers would change about online shopping is “faster delivery”.
24% of consumers expect their online orders to be delivered in less than 2 hours.
70% of consumers said they wished that retailers and brands offered similar services to Amazon Prime.7. WHEN IT COMES TO THE
CONSUMER JOURNEY, SPEED IS OF THE ESSENCE
80% of global consumers want to get from inspiration to purchase as quickly as possible. It’s what we call “Compressed Commerce”.
64% of global consumers are excited by the prospect of buying everything through one retailer.
9. DON’T FORGET TO PLAN FOR RETURNS
23% of everything that global shoppers order online is returned.
39% of global shoppers admitted to over-ordering with the intent of returning unwanted items.
10. SOCIAL COMMERCE IS ON THE RISE – BUT WE NEED TO NAIL “IN-APP” PURCHASING
65% of global shoppers said they have already bought through social media platforms – up from 44% in 2021.
56% of global consumers said they do not want to leave a social media platform to complete a transaction.
53% of consumers intend to spend more through social media platforms in the future.
46% of global consumers said they have already used livestream commerce to purchase products on online.
11. SUSTAINABILITY IS A GROWING CONSIDERATION FOR ONLINE SHOPPERS, YET CONSUMER CONFLICT PREVAILS
65% of global consumers said ethics and morals play an important role in their online purchase decision making.
61% of global shoppers said that they like to shop with brands and retailers who have a purpose which goes beyond just selling products and services.
43% of consumers claim to have opted for environmentally friendly delivery options (for example Amazon Day Delivery).
12. CONSUMERS WANT INNOVATIVE RETAIL EXPERIENCES
64% of global consumers said they wished brands and retailers would be more innovative in how they use digital technology to improve their experiences.
50% said they liked the idea of being able to make payments using parts of their body such as their face, palms and eyes.
62% of consumers said that they spend money within games.
60% of consumers would be interested in buying the same products for themselves and for their avatars.
29% of global consumers claim to have made a purchase via the metaverse.
47% of global shoppers said they would be interested in spending from beyond the grave.

9
One thing is clear, consumer shopping habits have changed over the last few years, accelerated by the pandemic. In this section, we look at some of these changes, quantifying them where possible.
SECTION 1:CHANGING CONSUMERS, CHANGING BEHAVIORS
10
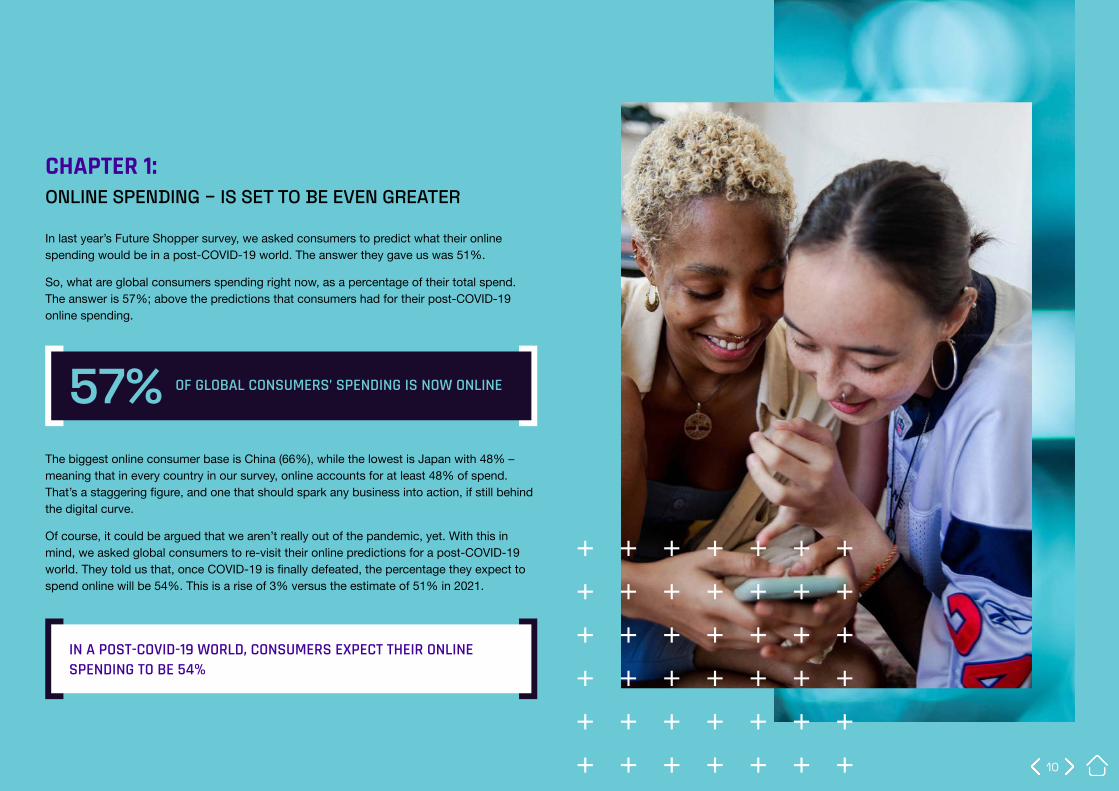
CHAPTER 1:ONLINE SPENDING – IS SET TO BE EVEN GREATER
In last year’s Future Shopper survey, we asked consumers to predict what their online spending would be in a post-COVID-19 world. The answer they gave us was 51%.
So, what are global consumers spending right now, as a percentage of their total spend. The answer is 57%; above the predictions that consumers had for their post-COVID-19 online spending.
The biggest online consumer base is China (66%), while the lowest is Japan with 48% – meaning that in every country in our survey, online accounts for at least 48% of spend. That’s a staggering figure, and one that should spark any business into action, if still behind the digital curve.
Of course, it could be argued that we aren’t really out of the pandemic, yet. With this in mind, we asked global consumers to re-visit their online predictions for a post-COVID-19 world. They told us that, once COVID-19 is finally defeated, the percentage they expect to spend online will be 54%. This is a rise of 3% versus the estimate of 51% in 2021.
IN A POST-COVID-19 WORLD, CONSUMERS EXPECT THEIR ONLINE SPENDING TO BE 54%
57% OF GLOBAL CONSUMERS’ SPENDING IS NOW ONLINE

11
PERCENTAGE OF ONLINE SPENDING
CURRENT ONLINE SPENDING
PREDICTED POST-COVID-19
ONLINE SPENDING (FROM 2022 DATA)
PREDICTED POST-COVID-19
ONLINE SPENDING (FROM 2021 DATA)
DURING COVID-19 ONLINE SPENDING
PRE-COVID-19 ONLINE SPENDING
OVERALL 57% 54% 51% 61% 45%UK 63% 56% 51% 66% 46%FRANCE 50% 47% 48% 57% 42%SPAIN 53% 52% 49% 59% 40%GERMANY 56% 51% 48% 56% 43%NETHERLANDS 60% 56% 47% 58% 42%CHINA 66% 59% 54% 64% 55%JAPAN 48% 42% 48% 51% 41%AUSTRALIA 55% 49% 49% 58% 43%THAILAND 60% 61% 54% 62% 51%INDONESIA 64% 63% 50% 62% 43%INDIA 64% 61% 55% 65% 56%COLOMBIA 58% 57% 51% 61% 38%ARGENTINA 55% 53% 52% 62% 38%BRAZIL 62% 60% 55% 65% 42%MEXICO 56% 53% 50% 62% 38%US 56% 53% 54% 62% 51%SOUTH AFRICA 56% 54% NA NA NAUAE 58% 55% 53% 65% 49%

12
CHAPTER 2:THE GROWTH OF ONLINE SPENDING WON’T STOP
So, online is likely to remain strong in a post-COVID-19 world, but will it continue to rise? Indeed, it looks set to grow, because 73% of global consumers said that online shopping will be more important to them in 2022, versus just 6% who disagreed. Furthermore, 60% said that they will increase their usage of digital shopping channels in the future.
73% OF GLOBAL SHOPPERS SAID THAT ONLINE SHOPPING WILL BE MORE IMPORTANT TO THEM THIS YEAR
60% OF GLOBAL SHOPPERS SAID THAT THEY WILL INCREASE THEIR USAGE OF DIGITAL SHOPPING CHANNELS IN THE FUTURE

13
CHAPTER 3:ONLINE VS OFFLINE – WHO’S BETTER AT WHAT?
With the growth of online set to continue, let’s see how online compares to physical currently across a number of factors. What is surprising from these results is the almost clean sweep of online versus offline.
With such dominance in terms of the experience, it’s no wonder that online will continue to grow as a percentage of overall sales.
Whilst this data might indicate that physical retail is dead, the reality is more nuanced. We will look at this later when we investigate omni-channel.
ONLINE VERSUS OFFLINE – WHO’S BETTER AT WHAT?
ONLINE IS BETTER
OFFLINE IS BETTER
WIDE VARIETY OF PRODUCTS/ITEMS
ONLINE IS BETTER 61% 12%REVIEW/EVALUATION OF PRODUCTS
ONLINE IS BETTER 60% 13%ACCESS FOR THOSE WITH DISABILITIES (IF APPLICABLE)
ONLINE IS BETTER 57% 15%LOW PRICE/COST OF PURCHASE (INCLUDING SHIPPING COST)
ONLINE IS BETTER 56% 16%COMPARISON OF BRANDS/PRODUCTS
ONLINE IS BETTER 55% 14%BETTER COMPREHENSION ABOUT BRANDS/PRODUCTS
ONLINE IS BETTER 48% 18%SPEED OF DELIVERY ONLINE IS BETTER 44% 31%FUN OF SHOPPING ONLINE IS BETTER 44% 24%RETURN PROCESS ONLINE IS BETTER 42% 27%SENSE OF LOYALTY TO A RETAILER OR BRAND
ONLINE IS BETTER 41% 21%CREDIBILITY OF PRODUCTS/RETAILERS
ONLINE IS BETTER 39% 24%FRESHNESS OF PRODUCTS ONLINE IS BETTER 38% 34%GETTING CONSULTATION WITH / ADVICE FROM STORE STAFF
PHYSICAL IS BETTER 36% 38%ABILITY TO TRY THE RIGHT PRODUCT OR GET THE RIGHT FIT
PHYSICAL IS BETTER 35% 42%

14

15
BOTTOM 5 COUNTRIES WHERE THE HIGHEST PERCENTAGE OF CONSUMERS NOW FELT “MORE” COMFORTABLE WITH TECHNOLOGY
1. NETHERLANDS 50%
2. FRANCE 51%
3. GERMANY 57%
4. UK 58%
5. JAPAN 59%
TOP 5 COUNTRIES WHERE THE HIGHEST PERCENTAGE OF CONSUMERS NOW FELT “MORE” COMFORTABLE WITH TECHNOLOGY
1. THAILAND 92%
2. INDONESIA 87%
3. INDIA 85%
4. BRAZIL 85%
5. SOUTH AFRICA 85%
CHAPTER 4:CONSUMER BEHAVIOR HAS CHANGED FOR GOOD
One of the driving factors of online’s rise over the last couple of years has been the increased comfort with technology amongst consumers who were forced to embrace it, as social and physical interactions became limited.
In 2021, 60% of consumers said they were now more comfortable with technology. In 2022, this percentage has increased to 72% – meaning that the consumers we are dealing with are now more technologically confident – and by implication, more literate – than ever before.
But there were regional differences as the chart demonstrates.
And what about the ongoing fear-factor of in-store shopping and COVID-19?
Last year, 41% of global consumers admitted they were frightened about shopping in-store. Thankfully, for physical and omni-channel retailers, this figure has now dropped – albeit only to 36%.
While one might presume that it would be the older generations who were most afraid due to their increased risk of illness with COVID-19, this was not borne out in our results. In fact, it was the 25–34-year-olds who were most frightened (44%), with the least concerned being the 55-64s and over-55s (21%).
And how about vaccination status? It would appear that non-vaccinated shoppers are less scared than their vaccinated counterparts (24% vs 38%). Yet, these figures differed hugely across countries, with the most frightened being in India (73%) and the least frightened in the Netherlands (19%) – a 54% swing!
72% OF GLOBAL SHOPPERS ARE NOW MORE COMFORTABLE WITH TECHNOLOGY – AN INCREASE FROM 60% IN 2021
36% OF GLOBAL CONSUMERS ARE FRIGHTENED ABOUT SHOPPING IN-STORE, DOWN FROM 41% IN 2021

16
MOST FRIGHTENED ABOUT SHOPPING IN-STORE DUE TO COVID-19
01 INDIA 73%
02 CHINA 64%
03 THAILAND 61%
04 INDONESIA 55%
05 UAE 53%
LEAST FRIGHTENED ABOUT SHOPPING IN-STORE DUE TO COVID-19
01 ARGENTINA 19%
02 NETHERLANDS 19%
03 SPAIN 20%
04 UK 23%
05 AUSTRALIA 24%
WHICH COUNTRIES ARE MOST AND LEAST FEARFUL OF SHOPPING IN-STORE?

17
CHAPTER 5: AS IN 2021, ONLINE SAVED CONSUMERS DURING THE PANDEMIC
Last year, 72% of consumers said online shopping came to their rescue, while this year, this percentage grew to 80%.
Across all age groups, the majority of consumers agreed this was the case. As one might expect, the over-65s agreed the least (61%), with the highest percentage coming in the 25-34-year-old age bracket (84%).
Coming out of the pandemic may also affect how consumers spend, with 56% saying they are now more inclined to spend money on experiences and days out based on what happened during lockdown.
But there are also other external factors to consider.
Over half (59%) of consumers said they are frustrated that international politics is impacting what they can buy and where they can get it from. As we go to print, the war in the Ukraine continues, and serves to impact people across the world well beyond its borders, albeit in less immediately tragic ways and circumstances.
Linked to this are the rising costs of inflation and the spike in the cost of living. As a result, 60% said this has made them more inclined to switch loyalty away from their favorite brands.
80% OF CONSUMERS SAID ONLINE SHOPPING CAME TO THEIR RESCUE THIS YEAR, IN COMPARISON TO 72% LAST YEAR

18
CHAPTER 6: THE EFFECT OF WORKING FROM HOME (WFH)
Perhaps one of the major lasting impacts of the pandemic will be a shift to more consumers working from home. Whether this continues or not is to be debated, but what we do know is that consumers want it, with 60% saying they wish their future working habits include more working from home than prior to the pandemic. Notably, there is variance across countries.
This change in mindset has forced consumers to reconsider how and where they live. A huge 41% of consumers are thinking about relocating due to working from home, while 47% are reconsidering their reliance on a car.
Itʼs evident that working from home has encouraged more spending on our home environments, with 61% of consumers saying they spent more on products within their home, and 61% saying they spent more on improving their home environment.
Whether or not it continues, the effect of working from home and the change in behavior that this instigated is of extreme importance.
For instance, 69% of consumers said they have shopped online more as a consequence of working from home, and in so doing, 62% said they have discovered new brands and retailers.
And delivery has become more important, too – a point that 67% of consumers agree with. In the same vein, 66% said the time of delivery has become more important, while 51% said they are now familiar with their delivery drivers.
What about the impact on loyalty to physical stores? It appears this could be an issue. Tellingly, 52% of global consumers feel less loyal to physical stores they used to frequent, as a consequence of working from home.
WHICH COUNTRIES MOST WANT THEIR FUTURE HABITS TO INCLUDE MORE WFH?
01 THAILAND 82%02 INDIA 76%03 UAE 75%04 SOUTH AFRICA 75%05 BRAZIL 74%06 INDONESIA 72%07 COLOMBIA 72%08 MEXICO 67%09 CHINA 65%10 ARGENTINA 64%11 USA 58%12 SPAIN 55%13 GERMANY 47%14 AUSTRALIA 47%15 UNITED KINGDOM 46%16 FRANCE 46%17 NETHERLANDS 38%18 JAPAN 38%
60% OF SHOPPERS SAID THEY WANT THEIR FUTURE WORK HABITS TO INCLUDE MORE WFH
62% OF GLOBAL CONSUMERS SAID THEY HAVE DISCOVERED NEW BRANDS AND RETAILERS AS A CONSEQUENCE OF WORKING FROM HOME MORE

19
CHAPTER 7: IT’S NOT JUST ABOUT ONLINE – REALLY, IT’S ABOUT OMNI-CHANNEL
2021 and 2022 have accelerated and shaped the debate over the long-term future of physical retail and the role of online. As always, we believe there is a role for multiple channels, spanning both physical and digital. And our data backs this up.
60% of consumers said they prefer to shop with a retailer or brand that has both a physical and online store – albeit this number was slightly down on the 64% who said the same in 2021.
As one might expect (and have experienced), consumers are moving swiftly between these different channels. Even when buying in-store, 72% of consumers are researching their purchases online in advance, while 60% admitted to checking product reviews on online marketplaces while standing in-store.
But running omni-channel operations is not easy. Consumers are particularly demanding about how well these channels operate together, and 59% wish that brands communicated seamlessly across different channels.
GUI BOHNENEXECUTIVE DIRECTOR OF OTO CRM
EXPERT OPINION:WHY LINKING ONLINE AND OFFLINE IS VITAL
In terms of customer experience, it is especially difficult to track customer behavior connecting both online and offline worlds. The customer-centric approach to being real O2O (online-to-offline) needs to have a key component that most brands lack: trying to identify as precisely as possible who the customer is at every touchpoint. And that means knowing what the consumerʼs PII (personal identification) is for most of their online and offline brand interactions. Therefore, knowing who the customer is allows brands to better attribute and measure the impact of their online strategies on offline, and vice versa, as it is the only common data in both spaces. Hence, brands need to empower their offline point-of-sales team to enable access and use of consumer data to become a true omni-channel customer experience brand.
60% OF GLOBAL SHOPPERS SAID THEY PREFER TO SHOP WITH A RETAILER OR BRAND THAT HAS BOTH DIGITAL AND PHYSICAL STORES

20
CHAPTER 8: DIGITIZING PRODUCTS AND SERVICES
Over the last few years, we have been monitoring a trend – namely that consumers are increasingly buying digital products and services online.
In 2021, digital products and services accounted for 33% of everything that was bought; this year the figure has risen to 38%.
In the section on fulfillment and delivery, we will see how expectations about faster delivery are getting harder and harder to achieve. However, challenges over the last mile only actually exist with physical products. If more products and services that are being bought online are digital, then delivery can be more-or-less instant.
And that is exactly what consumers want. Almost half (49%) said they would prefer their online purchases to be digital and instantly downloadable, rather than a physical item. Back in 2020, this figure was 33%, in 2021 it grew to 46%, and now it has risen a further 3%.
WHICH COUNTRY HAS THE HIGHEST PERCENTAGE OF DIGITAL ITEMS BEING BOUGHT ONLINE?
01 INDIA 47%02 NETHERLANDS 44%03 USA 43%04 MEXICO 41%05 UAE 41%06 AUSTRALIA 40%07 ARGENTINA 39%08 BRAZIL 39%09 COLOMBIA 39%10 SPAIN 38%11 UK 38%12 SOUTH AFRICA 37%13 GERMANY 36%14 CHINA 36%15 THAILAND 36%16 FRANCE 35%17 INDONESIA 33%18 JAPAN 28%
38% OF EVERYTHING BOUGHT ONLINE IS A DIGITAL PRODUCT OR SERVICE
49% OF GLOBAL SHOPPERS SAID THEY WOULD PREFER THEIR ONLINE PURCHASES TO BE DIGITAL AND INSTANTLY DOWNLOADABLE

21
SANJAY MEHTACEO, MIRUM INDIA, WUNDERMAN THOMPSON GROUP COMPANY
EXPERT OPINION:WHY ALL BUSINESSES MUST CONSIDER HOW THEY DIGITIZE THEIR PRODUCTS AND SERVICES
In a world where the Metaverse is slowly but surely playing out, and where NFTs are becoming increasingly common, the boundaries between physical and digital are becoming very fuzzy. The consumer of today is spoilt by the near instantaneous delivery of digitized product offerings, and is increasingly expecting quick responses and deliveries for almost everything. If a business thinks that their products or services can’t be digitized, they need to think again.
A few years back, we would have purchased a physical ticket, our insurance policies would have been a set of papers delivered to us in an envelope, and we would have walked into a physical building to conduct our banking services. As we know, all of these have changed, and all of them are now delivered digitally. While these may seem obvious as being potentially digitizable, it doesn’t stop there. Medical and legal services have been digitized via online consulting, and you can purchase the discretely defined services of a carpenter or a painter via apps.
When it comes to products, for example a television, car or washing machine: you can make a purchase online, instantaneously receive a digital receipt, take the receipt to the nearby store, and pick up the product. Offering that digitized experience enables the quick closure of the transaction and accelerates commerce in the process.
The opportunity for every business is very clear – digitize your products and service offerings or risk being cast aside.

22
KEY THOUGHTS SHOPPING BEHAVIOR HAS CHANGED FOREVER
■ Consumers are spending more than ever online in the wake of the pandemic, and all the indications are that this will continue. Digital will soon be the major source of revenue for most businesses, retailers and brands, if it is not already.
■ Increased reliance on technology through the pandemic, coupled with working from home, has made consumers more comfortable using digital channels. This has led to them discovering new options and, therefore, increased demand for digital products.
■ In the short term, at least, consumers are keen to spend more on experiences they missed during the pandemic, while financial pressures are loosening the ties of loyalty to favorite brands in the search for better value.
LINKING ONLINE AND OFFLINE EXPERIENCES REMAINS VITAL
■ While digital is now king, a majority of consumers are still showing a preference for brands that offer a choice between digital and physical stores. However, businesses with physical stores must think carefully about how to build the right value proposition around them, and shouldn’t overlook ongoing concerns about social distancing in the wake of the pandemic.
■ At the same time, consumers have increasingly high demands about how well aligned online and offline experiences are and want the freedom to move fluidly between them.
Getting your eCommerce strategy right is now a core business priority.
To find out how best to future proof your offer in response to this ‘new normal’ and optimize your omni-channel strategy, speak to Krantik Das, Head of Strategy, Wunderman Thompson Commerce: [email protected].
Find out more about Digital Strategy here.
23
In this section, we focus on the key stages of the customer journey – inspiration, search and purchase. Whilst, of course, the reality is that the customer journey is rarely linear, for the purpose of this report, we’ve simplified this into 3 parts.
SECTION 2:THE CUSTOMER JOURNEY

24
CHAPTER 1: INSPIRATION
Over the last few editions of our Future Shopper survey, we have been intrigued to see channels that one might not instantly associate with “inspiration” coming high in the rankings.
In last year’s survey, we also noticed that consumers were getting inspiration from a much richer variety of sources, and while this year this trend remains the same, we see the rise of marketplaces into first place. This posts an ominous sign for the other channels, who must now look to wrestle back consumers, with many of them having already started their journey with marketplaces.
However, these results differ depending on which country we look at. As expected, Amazon is dominant in Europe, while in APAC there is a wider spread across marketplaces, search engines and social. In LATAM as in Europe, a marketplace, namely Mercado Libre, takes number one spot, while in the US, UAE and South Africa their leading regional marketplace comes in first position, too.
What about age? Does it affect where consumers get their inspiration?
When it comes to marketplaces, as consumers get older, they are more likely to find inspiration with top marketplaces, with 27% of 16–24-year-olds going there, versus a high of 42% for the over-65s.
As one might expect, the opposite is true for social media channels, with the 16-24-year-olds finding inspiration here the most (37%), with this percentage declining as consumers get older, with just 6% of over-65s finding inspiration in this channel.
34% OF GLOBAL SHOPPERS GET THEIR INSPIRATION FROM MARKETPLACES – AHEAD OF SEARCH ENGINES IN SECOND POSITION (31%)
THE TOP 5 SOURCES OF INSPIRATION FOR ONLINE SHOPPERS
1. MARKETPLACES 34%
2. SEARCH ENGINES 31%
3. SOCIAL MEDIA CHANNELS 28%
4. YOUTUBE 25%
5. RETAILER SITES 18%
NB. Percentages do not add up to 100% as consumers could choose 3 options.

25
THE LEADING SOURCES OF INSPIRATION FOR ONLINE SHOPPERS IN DIFFERENT COUNTRIES
01 02 03
UK AMAZON – 47% SEARCH ENGINES – 32% RETAILER SITES – 25%
FRANCE AMAZON – 44% SEARCH ENGINES – 38% BROWSING IN-STORE – 19%
SPAIN AMAZON – 52% RETAILER SITES – 30% SEARCH ENGINES – 27%
GERMANY AMAZON – 52% SEARCH ENGINES – 35% SOCIAL MEDIA CHANNELS – 23% YOUTUBE – 23%
NETHERLANDS SEARCH ENGINES – 37% SOCIAL MEDIA CHANNELS – 28% COMPARISON SITES – 27%
CHINA OTHER MARKETPLACES – 42% (JD, PINDUODUO, DOUYIN)
SOCIAL MEDIA CHANNELS – 39% TMALL – 32%
JAPAN SEARCH ENGINES – 36% MARKETPLACES – 35%(I.E. RAKUTEN, LOHACO, YAHOO! SHOPPING, MERCARI) AMAZON – 34%
AUSTRALIA SEARCH ENGINES – 37% SOCIAL MEDIA CHANNELS – 32% RETAILERS’ SITES – 32%
THAILAND SHOPEE, LAZADA, 7-ELEVEN – 54% SOCIAL MEDIA CHANNELS – 48% YOUTUBE – 31%
INDONESIA MARKETPLACES – 54% (SHOPEE, LAZADA, BLIBLI)
YOUTUBE – 42% SOCIAL MEDIA – 40%
INDIA AMAZON – 41% YOUTUBE – 40% SOCIAL MEDIA CHANNELS – 27%
COLOMBIA MERCADO LIBRE – 39% SEARCH ENGINES – 31% SOCIAL MEDIA CHANNELS – 29%
ARGENTINA MERCADO LIBRE – 67% SEARCH ENGINES – 34% YOUTUBE – 30%
BRAZIL SEARCH ENGINES – 35% YOUTUBE – 35% RETAILERS’ MOBILE APPS – 32%
MEXICO MERCADO LIBRE – 41% AMAZON – 38% SOCIAL MEDIA CHANNELS – 29% YOUTUBE – 29%
USA AMAZON – 48% SEARCH ENGINES – 26% SOCIAL MEDIA CHANNELS – 23%
SOUTH AFRICA TAKEALOT – 44% SEARCH ENGINES – 32% RETAILER SITES – 32%
UAE AMAZON – 39% SOCIAL MEDIA CHANNELS – 31% YOUTUBE – 29%

26
AIMEE PEARCEVP BUSINESS DEVELOPMENTWUNDERMAN THOMPSON COMMERCE
EXPERT OPINION:WHY MARKETPLACES ARE NOW THE PLACE TO GO FOR INSPIRATION
Since 1999, Amazon’s vision was to be Earth’s most customer-centric company, where customers could come to discover anything and everything they might want to buy. Amazon made good on that promise and, as a result, marketplaces around the globe now delight their customers daily with the expected broad selection, fast shipping and great customer care. Marketplaces are the preferred online destination where shoppers gather to purchase, but just as important, where they go first to see their favorite brands’ new product launches and social posts, watch live product in-use sessions and how-to videos, shop for deals, read customer-generated ratings and reviews and browse for new discoveries as entertainment. By deliberately blurring the lines between shopping and social, Marketplaces are now THE place to go for all-round inspiration.

27
CHAPTER 2: OWNING INSPIRATION AND “COMPRESSED COMMERCE”:
Owning the inspiration stage is vitally important, because if you have the consumer at this point, they are yours to retain (or lose). Why? Because of the phenomenon of “compressed commerce” which reflects the consumer’s desire to get from inspiration to purchase as quickly as possible. Indeed, 80% of global consumers agreed they wanted “compressed commerce”. This is the same figure as in 2021.
So, what does all this mean? It means that businesses should have a two-pronged strategy.
Firstly, they must ensure they are “inspiring” consumers on marketplaces.
But with so much temptation and competition, they must also ensure that their inspiration strategies cover search engines, their social media sites, and their owned channels. In other words, their inspiration strategy must be omni-channel to minimize the risk of losing consumers at the first step of their journey.
80% OF GLOBAL CONSUMERS WANT TO GET FROM INSPIRATION TO PURCHASE AS QUICKLY AS POSSIBLE, REINFORCING WHAT WE CALL “COMPRESSED COMMERCE”
THE PERCENTAGE OF ONLINE SHOPPERS WHO WANT TO GET FROM INSPIRATION TO PURCHASE AS QUICKLY AS POSSIBLE
01 THAILAND 95%02 INDONESIA 94%03 BRAZIL 90%04 UAE 88%05 INDIA 88%06 SOUTH AFRICA 87%07 CHINA 86%08 COLOMBIA 86%09 MEXICO 85%10 ARGENTINA 78%11 USA 77%12 SPAIN 76%13 GERMANY 75%14 UK 74%15 AUSTRALIA 72%16 FRANCE 69%17 JAPAN 66%18 NETHERLANDS 62%
28
EXPERT OPINION:HOW DO YOU INSPIRE ON A MARKETPLACE?
Marketplaces are a very functional environment; consumers want to get to the point right away – speed is of the essence. The best way to convince consumers is , therefore, to address their shopping barriers and answer their questions up front. Usually, consumers search for these answers within the product reviews. Mining these reviews can help you to inspire your customers earlier in the buying journey. By providing them with the answers they are looking for in your product detail page, via enhanced text and visuals, you can improve your customers’ experience and help influence their decision before they turn to the reviews.
HELMUT RIEDERCEO, WPP CENTER OF EXCELLENCE FOR AMAZON EMEA
29
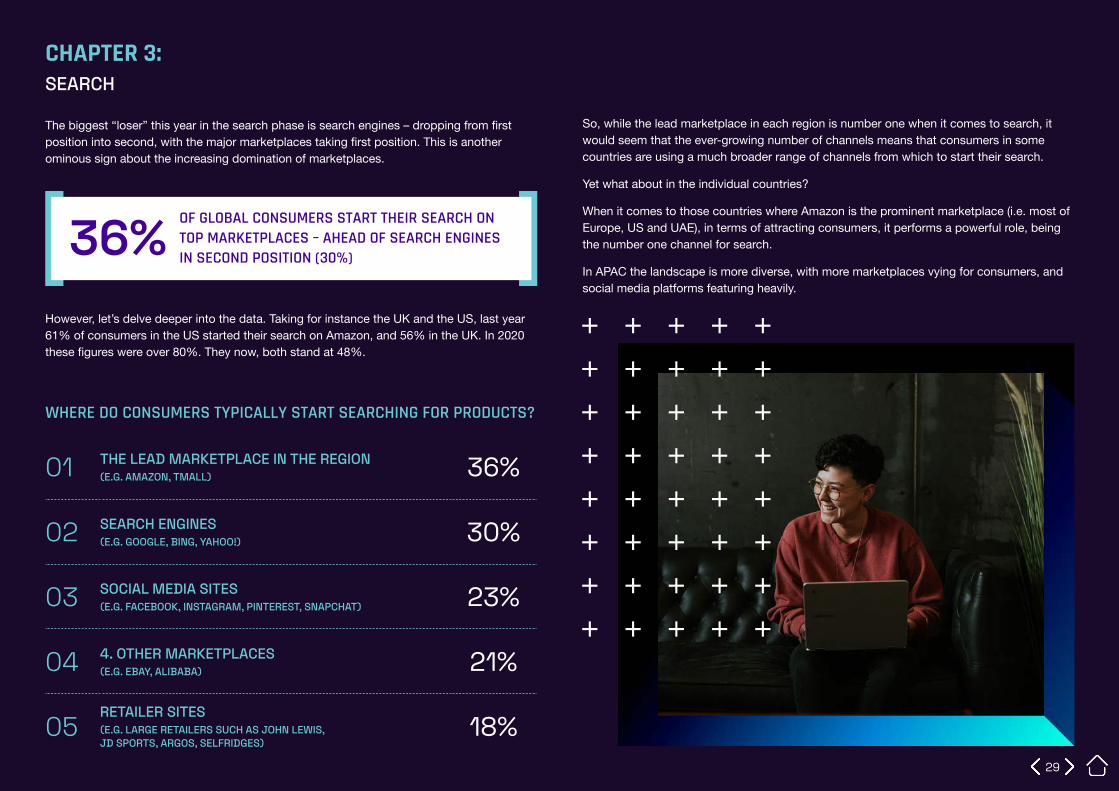
CHAPTER 3: SEARCH
The biggest “loser” this year in the search phase is search engines – dropping from first position into second, with the major marketplaces taking first position. This is another ominous sign about the increasing domination of marketplaces.
However, let’s delve deeper into the data. Taking for instance the UK and the US, last year 61% of consumers in the US started their search on Amazon, and 56% in the UK. In 2020 these figures were over 80%. They now, both stand at 48%.
So, while the lead marketplace in each region is number one when it comes to search, it would seem that the ever-growing number of channels means that consumers in some countries are using a much broader range of channels from which to start their search.
Yet what about in the individual countries?
When it comes to those countries where Amazon is the prominent marketplace (i.e. most of Europe, US and UAE), in terms of attracting consumers, it performs a powerful role, being the number one channel for search.
In APAC the landscape is more diverse, with more marketplaces vying for consumers, and social media platforms featuring heavily.
36% OF GLOBAL CONSUMERS START THEIR SEARCH ON TOP MARKETPLACES – AHEAD OF SEARCH ENGINES IN SECOND POSITION (30%)
WHERE DO CONSUMERS TYPICALLY START SEARCHING FOR PRODUCTS?
01 THE LEAD MARKETPLACE IN THE REGION (E.G. AMAZON, TMALL) 36%
02 SEARCH ENGINES (E.G. GOOGLE, BING, YAHOO!) 30%
03 SOCIAL MEDIA SITES (E.G. FACEBOOK, INSTAGRAM, PINTEREST, SNAPCHAT) 23%
04 4. OTHER MARKETPLACES (E.G. EBAY, ALIBABA) 21%
05RETAILER SITES (E.G. LARGE RETAILERS SUCH AS JOHN LEWIS, JD SPORTS, ARGOS, SELFRIDGES)
18%

30
WHERE DO ONLINE SHOPPERS SEARCH FOR PRODUCTS IN DIFFERENT COUNTRIES?
01 02 03
UK AMAZON – 48% SEARCH ENGINES – 34% RETAILER SITES – 27%
FRANCE AMAZON – 40% SEARCH ENGINES – 35% RETAILER SITES – 16%
SPAIN AMAZON – 51% SEARCH ENGINES – 25% RETAILER SITES – 25%
GERMANY AMAZON – 52% SEARCH ENGINES – 36% SOCIAL MEDIA SITES – 18%
NETHERLANDS SEARCH ENGINES – 35% COMPARISON SITES – 21% OTHER MARKETPLACES – 18%
CHINA OTHER MARKETPLACES – 41%(JD.COM / PINDUODUO)
TMALL – 39% SOCIAL MEDIA SITES – 37%
JAPAN OTHER MARKETPLACES – 44% SEARCH ENGINES – 34% AMAZON – 44%
AUSTRALIA SEARCH ENGINES – 42% RETAILER SITES – 30% BRAND WEBSITES – 22%
THAILAND SHOPEE / LAZADA – 59% SOCIAL MEDIA SITES – 41% SEARCH ENGINES – 33%
INDONESIA OTHER MARKETPLACES – 60% AMAZON – 41% SEARCH ENGINES – 29%
INDIA AMAZON – 39% YOUTUBE – 29% OTHER MARKETPLACES – 28%
COLOMBIA MERCADO LIBRE – 43% SEARCH ENGINES – 30% SOCIAL MEDIA SITES – 29%
ARGENTINA MERCADO LIBRE – 71% SEARCH ENGINES – 31% SOCIAL MEDIA SITES – 25%
BRAZIL SEARCH ENGINES – 36% MERCADO LIVRE – 35% OTHER MARKETPLACES – 31%
MEXICO MERCADO LIBRE – 44% AMAZON – 42% SOCIAL MEDIA SITES – 30%
USA AMAZON – 49% SEARCH ENGINES – 24% OTHER MARKETPLACES – 19%
SOUTH AFRICA TAKEALOT – 47% RETAILER SITES – 33% SEARCH ENGINES – 31%
UAE AMAZON – 40% SOCIAL MEDIA SITES – 29% SEARCH ENGINES – 23%

31
CHAPTER 4: WHICH CHANNEL DO GLOBAL ONLINE SHOPPERS USE TO MAKE PURCHASES?
As with last year, marketplaces command the biggest share when it comes to online spend, albeit the percentage has dropped from 42% to 35% this year.
Second place belongs to supermarkets, with their share dipping from 18% to 17%.
The big winner this year is social (including gaming and the metaverse), seeing a doubling of consumers purchasing through this channel from 7% to 14%.
A WORD ON DIRECT-TO-CONSUMER (DTC):
For brand sites / direct-to-consumer channels, certain statistics make for some challenging reading. What we see is attrition at the vital purchase stage:
■ Inspiration – 14% of consumers use DTC / branded sites for inspiration
■ Search – 15% use DTC / branded sites to search for products
■ Purchase – 7% use DTC / branded sites to purchase products
Seemingly, not only do DTC channels need to work harder at attracting consumers at the outset of the journey, but they need to do more to convert them once they are on their sites.
And this isn’t just an issue for brand sites and DTC, it’s a concern for retailer sites, too, who attract 18% at the inspiration stage, 18% at the search stage, and just 12% at the purchase.
So, what would encourage consumers to buy directly from brands?
35% OF ALL ONLINE SHOPPING GLOBALLY IS VIA MARKETPLACES – DOWN FROM 42% LAST YEAR, BUT STILL AHEAD OF SUPERMARKETS AND GROCERS AT 17%
ONLINE VERSUS OFFLINE; WHO’S BETTER AT WHAT?
2022 2021 DIFFERENCE
MARKETPLACES (TOP MARKETPLACE AND OTHER AND MERCADO)
35% 42% -7%
SUPERMARKETS AND GROCERS 17% 18% -1%
SOCIAL IN-APP PURCHASING(INCLUDING GAMING AND METAVERSE)
14% 7% +7%
RETAILER SITES 12% 12% 0%
AGGREGATORS AND DELIVERY APPS 11% 11% 0%
BRANDED SITES AND APPS (DTC) 7% 8% -1%
OTHER 4% 3% +1%

32
THE TOP 10 FACTORS THAT WOULD ENCOURAGE CONSUMERS TO BUY DIRECTLY FROM BRANDS
1. BETTER PRICE 49%
2. FREE DELIVERY 47%
3. FREE RETURNS 35%
4. FAST AND CONVENIENT DELIVERY 34%
5. LOYALTY PROGRAM 25%
6. EXCLUSIVE PRODUCTS 23%
7. BETTER INFORMATION ABOUT PRODUCTS 22%
8. ACCESS TO FULL PRODUCT RANGE 22%
9. BETTER ALL-ROUND EXPERIENCE ON BRAND OWNED SITES 17%
10. BUNDLED PRODUCT DEALS 17%
EXPERT OPINION:BRANDS MUST WORK HARDER AT DTC
Brands have a real opportunity to inspire customers through their brand sites. In a world where consumers have more choice than ever about where and how they shop, creating an engaging experience through their DTC channel is something we are hearing more about from the brands we work with. Improving their DTC propositions and giving new reasons for consumers to shop direct is essential for brands, whilst the key consumer drivers of convenience and value-add remain true for DTC as much as other channels.
SHALINA GANATRAHEAD OF ECOMMERCE CONSULTANCYWUNDERMAN THOMPSON COMMERCE

33
CHAPTER 5: FREQUENCY OF PURCHASING
Keeping with the theme that shoppers now utilize more channels, we see this in the frequency with which they purchase – in most cases, there has been a fall since last year. The only channels where this is not the case is with the lead marketplaces in each region and branded websites and social in-app purchasing.
However, it’s important to note that, while the frequency may have gone up for marketplaces, the previous section tells us that the total percentage of purchases through these channels has dropped. The only reason for this must be that, while the frequency has risen, consumers are purchasing lower-cost items.
HOW OFTEN DO CONSUMERS PURCHASE FROM EACH CHANNEL PER MONTH?
2022 2021
SUPERMARKETS AND GROCERS 6 6.9VIA AN AGGREGATOR / DELIVERY APP (UBER EATS, DELIVEROO) 5.1 5.8THE LEAD MARKETPLACE IN EACH REGION (AMAZON, TMALL) 4.6 4.5
SOCIAL – IN-APP PURCHASING 4.1 4
VIDEO GAMES 3.5 NAOTHER MARKETPLACES (E.G. EBAY, ALIBABA, GUMTREE) 3.8 4.8RETAILER SITES (E.G. JOHN LEWIS, JD SPORTS, ARGOS) 3.6 3.8
MERCADO LIBRE 4.2 3.7
BRANDED APPS 3.4 NATHE WEBSITE OF THE BRAND YOU WANT (E.G. NIKE, APPLE, DYSON) 3.3 3.1
METAVERSE 2.5 NA

34
CHAPTER 6: WHAT DRIVES CONSUMERS’ DECISION MAKING?
Unsurprisingly, and as has always been the case, price is the number one factor that drives online decision making. But, as last year, we also see that service and convenience play key roles, too – with availability, delivery and returns scoring highly.
In other words, online sellers cannot rely on price alone, but must back-up competitive pricing with brilliant customer service across a number of factors.
As we’ve noticed in previous years, the role of brand is nowhere to be seen in the top 10. Last year, brand occupied 16th position but has dropped one spot this year to 17th. This reaffirms what we have been saying that the brand being ordered, while important, is not the key, or even one of the leading drivers for online purchasing. And those brands and retailers wanting to be successful online would do well to invest in ensuring that their services are up to scratch, rather than relying just on brand equity.
And just as an aside, it wouldn’t harm retailers and brands to benchmark themselves against the likes of Amazon and Amazon Prime – because 70% of consumers said they wished more brands and retailers offered services similar to Amazon Prime.
THE TOP 10 DRIVERS OF ONLINE PURCHASE DECISION MAKING
2021’S RANKING
01 PRICE OF THE ITEM 1
02 THE ITEM I WANT IS IN STOCK 4
03 EASY TO FIND THE PRODUCT I AM LOOKING FOR 3
04 ACCURATE PRODUCT DESCRIPTIONS 2
05 STRONG CUSTOMER CARE 6
06 CONVENIENT DELIVERY 5
07 FREE DELIVERY 8
08 SPEED OF DELIVERY 9
09 EASY RETURNS PROCESS 10
10 FREE RETURNS 11
70% OF CONSUMERS SAID THEY WISHED THAT RETAILERS AND BRANDS OFFERED SIMILAR SERVICES TO AMAZON PRIME
35
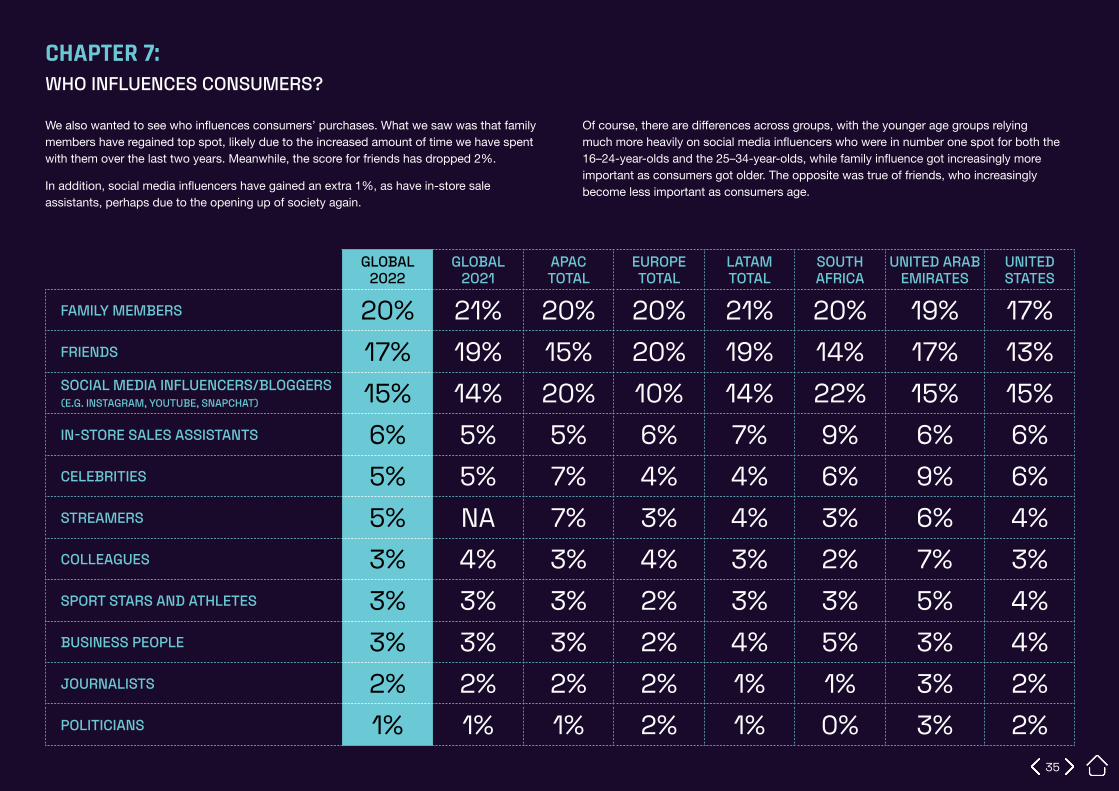
CHAPTER 7: WHO INFLUENCES CONSUMERS?
We also wanted to see who influences consumers’ purchases. What we saw was that family members have regained top spot, likely due to the increased amount of time we have spent with them over the last two years. Meanwhile, the score for friends has dropped 2%.
In addition, social media influencers have gained an extra 1%, as have in-store sale assistants, perhaps due to the opening up of society again.
Of course, there are differences across groups, with the younger age groups relying much more heavily on social media influencers who were in number one spot for both the 16–24-year-olds and the 25–34-year-olds, while family influence got increasingly more important as consumers got older. The opposite was true of friends, who increasingly become less important as consumers age.
GLOBAL 2022
GLOBAL 2021
APAC TOTAL
EUROPE TOTAL
LATAM TOTAL
SOUTH AFRICA
UNITED ARAB EMIRATES
UNITED STATES
FAMILY MEMBERS 20% 21% 20% 20% 21% 20% 19% 17%FRIENDS 17% 19% 15% 20% 19% 14% 17% 13%SOCIAL MEDIA INFLUENCERS/BLOGGERS (E.G. INSTAGRAM, YOUTUBE, SNAPCHAT) 15% 14% 20% 10% 14% 22% 15% 15%IN-STORE SALES ASSISTANTS 6% 5% 5% 6% 7% 9% 6% 6%CELEBRITIES 5% 5% 7% 4% 4% 6% 9% 6%STREAMERS 5% NA 7% 3% 4% 3% 6% 4%COLLEAGUES 3% 4% 3% 4% 3% 2% 7% 3%SPORT STARS AND ATHLETES 3% 3% 3% 2% 3% 3% 5% 4%BUSINESS PEOPLE 3% 3% 3% 2% 4% 5% 3% 4%JOURNALISTS 2% 2% 2% 2% 1% 1% 3% 2%POLITICIANS 1% 1% 1% 2% 1% 0% 3% 2%

36
KEY THOUGHTS THOSE WHO OWN INSPIRATION RULE THE ROOST
■ When it comes to inspiration, search and purchasing online, the key marketplaces across the regions (Amazon, Tmall, Mercado Libre, etc.) continue to dominate the customer journey. They are doing a great job at catching consumers at the earliest stage of their purchase journeys – inspiration – and retaining them through search and purchase.
■ The idea of ‘compressed commerce’, and the fact that the overwhelming majority of consumers want to get from inspiration to purchase as quickly as possible, suggests the retailers that capture consumer attention from the outset by owning inspiration and offering a clear, quick route to conversion, will be the winners.
■ Paradoxically, the best way for non-marketplaces to grab early attention is by taking an omni-channel approach to inspiration. Our findings show consumers are increasingly looking for ideas and influence across social media, YouTube and a range of other channels. If you spread your inspiration strategy across as many of these as possible, you maximize your chances of grabbing consumers at the first step of their journey.
DTC AND RETAILER CHANNELS STILL HAVE A NICHE BUT THERE’S WORK TO BE DONE
■ Some of the results for DTC and retailer sites make for sobering reading. Neither feature as favorites for consumers at any point along the customer journey. Brands and retailers clearly have work to do at both attracting customers and retaining/converting them when they do so.
■ But all is not lost. We’re seeing consumers browse and buy through an increasing range of channels. We’re seeing frequency of purchase and share of wallet across even the highest-ranking channels drop as a result (with some notable exceptions, like social).
■ There are opportunities for brands and retailers to carve out their own space. And consumers are clear about what they want to see – better prices backed up by excellence in service and experience, covering availability, convenience, delivery, customer care and more.
To find out how to implement an omni-channel inspiration strategy, or discuss revamping your brand’s customer journey strategy, speak to Tom Lancaster, Head of CX/UX, Wunderman Thompson Commerce: [email protected]
Find out more about our services to support the customer journey here.
To find out how to implement an omni-channel inspiration strategy, talk to Randy Kohl, Head of Marketing, Gorilla Group, a Wunderman Thompson Company: [email protected]

37
SECTION 3:GETTING THE EXPERIENCE RIGHT!

38
CHAPTER 1: THE EXPERIENCE NEEDS TO BE RIGHT!
Online shopping, as evidenced in previous sections of this report has done an enormous amount for us in the last few years, and our dependence on it is growing.
But from an experience perspective, there is still work to be done to give consumers what they want. In fact, 32% of global shoppers said they find shopping boring and 62% wish the online experience was more entertaining.
At the same time, 74% of consumers believe that retailers need to get better at giving them the products, services and experience they want when shopping online. This figure was 73% last year.
And getting the experience right is vitally important, because more than half (58%) of shoppers said they will not shop with a retailer, brand or marketplace which does not match their expectations of online shopping.
In the future, getting this experience right will be even more important because the next generation of consumers (that’s children today), will be even more demanding, something that 70% of consumers agree with. Notably, 56% of consumers believe children have unrealistic expectations when it comes to online shopping, delivery and availability.
62% OF GLOBAL SHOPPERS WISH ONLINE SHOPPING WAS MORE ENTERTAINING
58% OF SHOPPERS SAID THEY WOULD NOT SHOP WITH A RETAILER, BRAND OR MARKETPLACE THAT DOES NOT MEET THEIR EXPECTATIONS
THE COUNTRIES WITH THE MOST DEMANDING CONSUMERS WHO WILL NOT SHOP WITH RETAILERS, BRANDS OR MARKETPLACES WHO DO NOT MATCH THEIR EXPECTATION OF ONLINE SHOPPING
01 CHINA 73%02 UAE 73%03 INDIA 72%04 THAILAND 69%05 SOUTH AFRICA 67%06 BRAZIL 66%07 INDONESIA 63%08 USA 61%09 COLOMBIA 57%10 FRANCE 55%11 JAPAN 54%12 AUSTRALIA 53%13 GERMANY 53%14 MEXICO 52%15 NETHERLANDS 51%16 ARGENTINA 50%17 UK 49%18 SPAIN 44%

39
EXPERT OPINION:WHY GETTING THE EXPERIENCE RIGHT IS VITAL FOR HAPPY SHOPPERS
Following the pandemic, the shift in customer expectations is clear: experience trumps brand. With more customers choosing to shop online – and those customers prioritizing experience over brand – companies need to review their customer experience across every touch point, ensuring they remove frictions and maximize opportunities.
RACHEL SMITHCUSTOMER EXPERIENCE DIRECTOR

40
CHAPTER 2: SO, WHAT DOES GOOD LOOK LIKE?
We started by asking consumers which single thing they would change about online shopping. Coming out loud and clear was a focus on delivery and returns, with these topics occupying 4 of the top 5 spots.
Once again, we are reminded that consumers are increasingly focusing on service when it comes to their online shopping and that this is driving their decision making.
THE NUMBER ONE THING THAT CONSUMERS WOULD CHANGE ABOUT ONLINE SHOPPING IS “FASTER DELIVERY”
THE TOP 10 THINGS CONSUMERS WOULD CHANGE ABOUT ONLINE SHOPPING
1. FASTER DELIVERY 13%
2. FREE RETURNS 8%
3. I WOULD NOT CHANGE ONE THING 7%
4. CONVENIENT DELIVERY 6%
5. EASY RETURNS 5%
6. CREDIBLE REVIEWS AND RATINGS THAT I CAN TRUST 5%
7. BETTER PAYMENT OPTIONS 5%
8. FASTER REPLACEMENT OF PRODUCTS THAT ARE OUT OF STOCK 4%
9. EASIER TO SEARCH FOR AND FIND PRODUCTS 4%
10. BETTER CONTENT (E.G. FULLER DESCRIPTIONS, MORE IMAGERY) 4%

41
WHAT DO CONSUMERS WANT TO CHANGE ABOUT THE DELIVERY EXPERIENCE?
1. FASTER DELIVERY 48%
2. IT WOULD BE CHEAPER 41%
3. MORE CLARITY ON EXACT TIMES FOR DELIVERY 39%
4. BETTER PACKAGING 27%
5. ABLE TO DELIVER TO ME WHEREVER I AM 26%
6. IT WOULD CONSIDER THE ENVIRONMENT MORE 24%
7. MORE OPTIONS FOR PICK UP 22%
8. NO CONTACT DELIVERY 20%
9. ROADSIDE / CURBSIDE ITEM COLLECTION OPTION 15%
10. NOTHING 5%
CHAPTER 3: IMPROVING THE DELIVERY EXPERIENCE
So, if “faster delivery” is the number one thing that consumers would change about online shopping, then let’s dig deeper into the delivery experience.
First, we asked what could be done to improve the delivery experience. In first position came “faster delivery” which we will look into in the next chapter. Many of the other areas focused on the convenience of delivery and having more clarity and flexibility.
Consumers were able to choose multiple option, hence why the totals do not add up to 100%.

42
CHAPTER 4: SPEED OF DELIVERY
With “faster delivery” being so important, we wanted to understand what “faster” really means. On average, consumers were happy to wait for 2.36 days for the products they ordered online to arrive.
But when we drill deeper into the data, we see just how demanding consumers actually are; 41% of consumers expect their products to arrive in less than 24 hours, and 24% expect them in less than 2 hours! This is a huge increase on last year, where 30% expected delivery in 24 hours, and just 4% expected delivery in less than 2. So, not only are expectations lightning fast, but they are getting faster… quickly!
Men are more impatient than women, with 28% expecting delivery in less than 2 hours versus 21% of women.
And impatience is a young person’s game, with 29% of 16–24-year-olds, and 29% of 25–34-years-olds expecting delivery in 2 hours.
24% OF CONSUMERS EXPECT THEIR ONLINE ORDERS TO BE DELIVERED IN LESS THAN 2 HOURS!
WHICH COUNTRIES HAVE THE MOST IMPATIENT ONLINE ORDERERS? PERCENTAGE OF CONSUMERS WHO EXPECT THEIR PRODUCTS TO ARRIVE IN LESS THAN 2 HOURS!
01 UAE 50%02 INDIA 46%03 USA 37%04 BRAZIL 31%05 INDONESIA 27%06 COLOMBIA 27%07 CHINA 25%08 THAILAND 25%09 SOUTH AFRICA 25%10 ARGENTINA 23%11 MEXICO 20%12 FRANCE 18%13 UK 16%14 SPAIN 15%15 GERMANY 14%16 AUSTRALIA 14%17 NETHERLANDS 13%18 JAPAN 11%

43
And who is best at speedy delivery? – you guessed it, marketplaces, who are streets ahead (quite literally) of their competitors when it comes to fast delivery.
However, consumers appreciate that some products will take longer to arrive than others. So, we wanted to find out how long consumers were happy to wait for different products.
THE AVERAGE TIME CONSUMERS ARE HAPPY TO WAIT FOR DIFFERENT PRODUCTS THAT THEY ORDER ONLINE TO ARRIVE
AVERAGE DAYS
GROCERY (E.G. FOOD AND DRINK) 1.3HEALTH AND PHARMACEUTICAL 1.7CLEANING PRODUCTS 2.0ELDERLY CARE PRODUCTS 2.0PET CARE 2.1ENTERTAINMENT (E.G. MUSIC, BOOKS, TV AND FILMS) 2.1BEAUTY (E.G. HAIRCARE, SKINCARE, MAKEUP) 2.2TECHNOLOGY (E.G. SMART PHONES, TABLETS, COMPUTERS, HEADPHONES) 2.4TOYS (E.G. BOARD GAMES, SOFT TOYS) 2.5SECOND-HAND PRODUCTS 2.5LUXURY (E.G. HIGH-END CLOTHING, WATCHES, JEWELERY, BAGS, ART) 2.5CLOTHING AND FASHION (E.G. HIGH STREET CLOTHING, FOOTWEAR) 2.5GARDEN PRODUCTS 2.6WHITE GOODS 2.7MOTORS AND ACCESSORIES (E.G. SEAT COVERS, HUBCAPS, SATNAV) 2.7HOME FURNISHINGS 3.0
WHO IS BEST AT SPEEDY DELIVERY?
SPEEDY DELIVERY
THE LEAD MARKETPLACE IN REGION (E.G. AMAZON, TMALL, MERCADO LIBRE) 50%
RETAILERS ARE THE BEST AT THIS (E.G. JOHN LEWIS, JD SPORTS, ARGOS) 11%
OTHER MARKETPLACES ARE BEST AT THIS 10%
NONE OF THESE ARE THE BEST AT THIS 8%
VIA AN AGGREGATOR / DELIVERY APP (UBER EATS, DELIVEROO) 7%
INDIVIDUAL BRANDS ARE THE BEST AT THIS (E.G. NIKE, DYSON, APPLE) 6%
VOICE COMMERCE (E.G. VIA AMAZON ALEXA) 6%
SOCIAL PLATFORMS (E.G. FACEBOOK) 3%
MESSAGING PLATFORMS (E.G. WHATSAPP, WECHAT) 1%

44
EXPERT OPINION:SPEED OF DELIVERY AND AI
Expectations donʼt exist in silos, or sector by sector. Theyʼre the result of a consumerʼs collective experience across every aspect of their life, from media consumption to banking. I can binge on Bridgerton, transfer money, consult a doctor, or send a WhatsApp instantly – so why canʼt I get my Air Jordans delivered in less than an hour? Expectations around delivery in retail are high not just because of Jeff Bezos, but because of the innovations of every consumer company in the last ten years.
Of course, the tricky thing is that retail is in the business of delivering atoms, not bits, which makes faster delivery significantly harder and more expensive. New fulfillment models, such as local dark stores, can help. So too can campaigns that try to reset those expectations or in-store experiences that make a trip worthwhile. But perhaps the best investment retailers can make is to improve the resilience and agility of their supply chain, enabling the high selection, low prices and rapid delivery that consumers expect.
DANIEL HULMECEO SATALIA, AND CHIEF AI OFFICER, WPP

45
And it’s important to know that this isn’t just because products are wrong or don’t fit. In fact, it’s a clear tactic of a significant number of shoppers. A huge 39% of online shoppers globally admitted that they over-order with the intent of returning unwanted items. This is a sensible approach from online shoppers, but one that has huge financial implications on online and omni-channel sellers.
When we look at the returns process, it is once again marketplaces that lead in the way in making returns easy!
WHO ARE THE WORST OFFENDERS WHEN IT COMES TO RETURNS?
HIGHEST LOWEST
01 INDIA 44% 01 JAPAN 13%
02 USA 34% 02 ARGENTINA 15%
03 UAE 33% 03 COLOMBIA 16%
04 NETHERLANDS 32% 04 MEXICO 16%
05 THAILAND 30% 05 AUSTRALIA 17%
23% OF EVERYTHING THAT GLOBAL SHOPPERS ORDER ONLINE IS RETURNED
39% OF GLOBAL SHOPPERS ADMITTED TO OVER-ORDERING WITH THE INTENT OF RETURNING UNWANTED ITEMS
WHO OFFERS THE EASIEST RETURNS PROCESS?
THE LEAD MARKETPLACE IN REGION (E.G. AMAZON, TMALL, MERCADO LIBRE) 44%
NONE OF THESE ARE THE BEST AT THIS 13%RETAILERS ARE THE BEST AT THIS (E.G. JOHN LEWIS, JD SPORTS, ARGOS) 13%
OTHER MARKETPLACES ARE BEST AT THIS 11%INDIVIDUAL BRANDS ARE THE BEST AT THIS (E.G. NIKE, DYSON, APPLE) 7%VOICE COMMERCE (E.G. VIA AMAZON ALEXA) 5%VIA AN AGGREGATOR / DELIVERY APP (UBER EATS, DELIVEROO) 4%SOCIAL PLATFORMS (E.G. FACEBOOK) 2%MESSAGING PLATFORMS (E.G. WHATSAPP, WECHAT) 1%
CHAPTER 5: RETURNS
But what about the flip side of delivery, i.e. returns?
We wanted to know just how much of what was ordered online was returned – the answer was a significant 23%.

46
CHAPTER 6: WHICH CHANNELS ARE THE BEST AT WHAT?
With marketplaces sitting in number one position when it comes to purchasing, it should be no surprise that 55% of global shoppers said that marketplaces offered the best experience when it came to online shopping, way ahead of retailers, in second position, who garnered 12% of the votes.
Brand sites (DTC) got 7% of the votes, a small rise on last year’s 6%, but nonetheless a sign that more must be done to engage and convert consumers who have made the effort to visit a branded site.
WHAT ARE THE HIGHEST RATED CHANNELS?
2022 2021
MARKETPLACES 55% 60%RETAILERS ARE THE BEST AT THIS (E.G. JOHN LEWIS, JD SPORTS, ARGOS) 12% 11%NONE OF THESE ARE THE BEST AT THIS 11% 11%INDIVIDUAL BRANDS ARE THE BEST AT THIS (E.G. NIKE, DYSON, APPLE) 7% 6%VOICE COMMERCE (E.G. VIA AMAZON ALEXA) 6% 4%VIA AN AGGREGATOR / DELIVERY APP (UBER EATS, DELIVEROO) 4% 3%SOCIAL PLATFORMS (E.G. FACEBOOK) 3% 4%MESSAGING PLATFORMS (E.G. WHATSAPP, WECHAT) 1% 1%
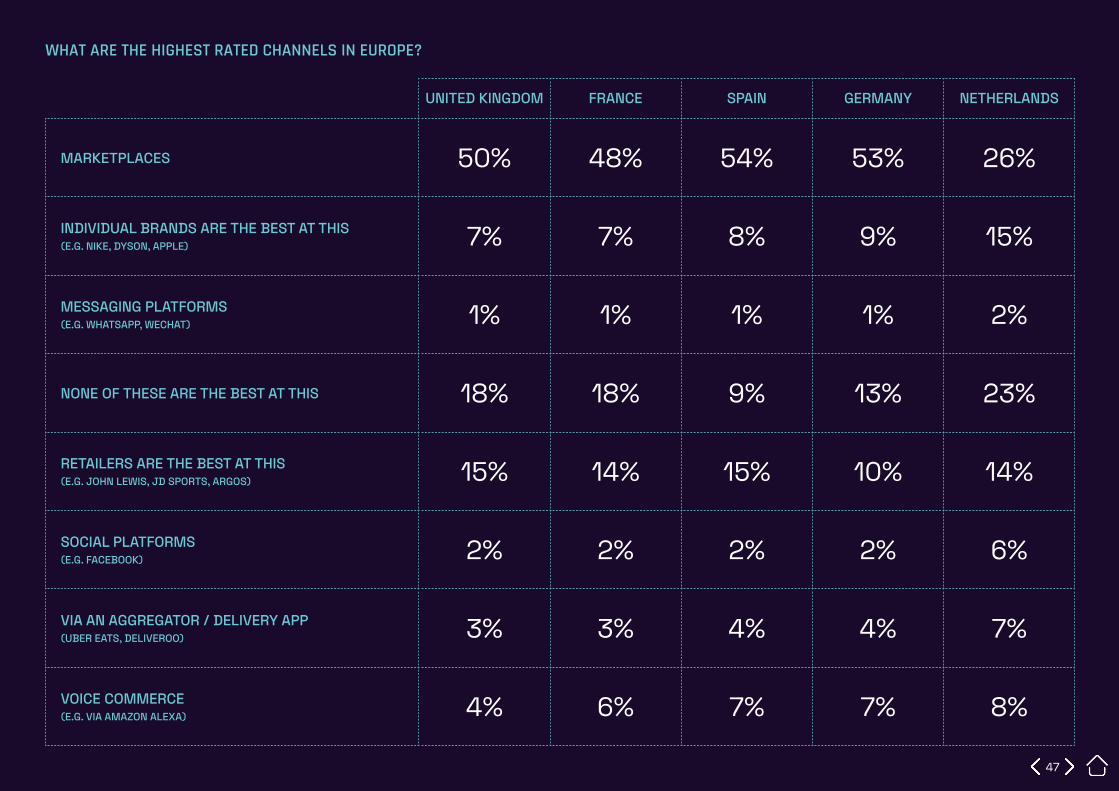
47
UNITED KINGDOM FRANCE SPAIN GERMANY NETHERLANDS
MARKETPLACES 50% 48% 54% 53% 26%
INDIVIDUAL BRANDS ARE THE BEST AT THIS (E.G. NIKE, DYSON, APPLE) 7% 7% 8% 9% 15%
MESSAGING PLATFORMS (E.G. WHATSAPP, WECHAT) 1% 1% 1% 1% 2%
NONE OF THESE ARE THE BEST AT THIS 18% 18% 9% 13% 23%
RETAILERS ARE THE BEST AT THIS (E.G. JOHN LEWIS, JD SPORTS, ARGOS) 15% 14% 15% 10% 14%
SOCIAL PLATFORMS (E.G. FACEBOOK) 2% 2% 2% 2% 6%
VIA AN AGGREGATOR / DELIVERY APP (UBER EATS, DELIVEROO) 3% 3% 4% 4% 7%
VOICE COMMERCE (E.G. VIA AMAZON ALEXA) 4% 6% 7% 7% 8%
WHAT ARE THE HIGHEST RATED CHANNELS IN EUROPE?

48
CHINA JAPAN AUSTRALIA INDONESIA THAILAND INDIA
MARKETPLACES 50% 51% 29% 79% 68% 64%
INDIVIDUAL BRANDS ARE THE BEST AT THIS (E.G. NIKE, DYSON, APPLE) 8% 7% 11% 4% 4% 6%
MESSAGING PLATFORMS (E.G. WHATSAPP, WECHAT) 2% 1% 1% 1% 1% 1%
NONE OF THESE ARE THE BEST AT THIS 5% 24% 22% 4% 4% 2%
RETAILERS ARE THE BEST AT THIS (E.G. JOHN LEWIS, JD SPORTS, ARGOS) 14% 9% 25% 4% 9% 11%
SOCIAL PLATFORMS (E.G. FACEBOOK) 6% 2% 4% 3% 6% 3%
VIA AN AGGREGATOR / DELIVERY APP (UBER EATS, DELIVEROO) 7% 2% 4% 5% 5% 3%
VOICE COMMERCE (E.G. VIA AMAZON ALEXA) 9% 4% 5% 0% 4% 9%
WHAT ARE THE HIGHEST RATED CHANNELS IN APAC?

49
COLOMBIA ARGENTINA BRAZIL MEXICO
MARKETPLACES 55% 60% 73% 67%
INDIVIDUAL BRANDS ARE THE BEST AT THIS (E.G. NIKE, DYSON, APPLE) 7% 5% 4% 5%
MESSAGING PLATFORMS (E.G. WHATSAPP, WECHAT) 2% 1% 1% 1%
NONE OF THESE ARE THE BEST AT THIS 8% 13% 7% 7%
OTHER MARKETPLACES ARE BEST AT THIS 9% 6% 20% 6%
RETAILERS ARE THE BEST AT THIS (E.G. JOHN LEWIS, JD SPORTS, ARGOS) 12% 8% 4% 8%
SOCIAL PLATFORMS (E.G. FACEBOOK) 5% 4% 3% 4%
VIA AN AGGREGATOR / DELIVERY APP (UBER EATS, DELIVEROO) 5% 4% 3% 4%
VOICE COMMERCE (E.G. VIA AMAZON ALEXA) 6% 4% 4% 4%
WHAT ARE THE HIGHEST RATED CHANNELS IN LATAM?
50
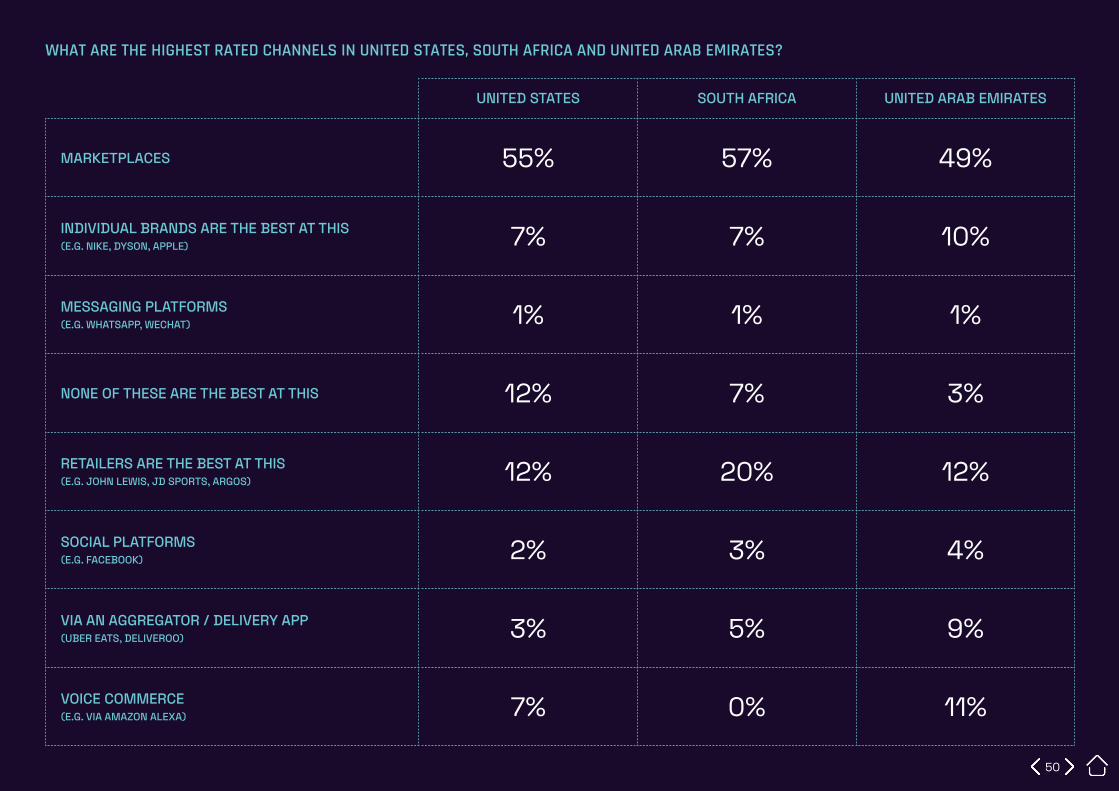
UNITED STATES SOUTH AFRICA UNITED ARAB EMIRATES
MARKETPLACES 55% 57% 49%
INDIVIDUAL BRANDS ARE THE BEST AT THIS (E.G. NIKE, DYSON, APPLE) 7% 7% 10%
MESSAGING PLATFORMS (E.G. WHATSAPP, WECHAT) 1% 1% 1%
NONE OF THESE ARE THE BEST AT THIS 12% 7% 3%
RETAILERS ARE THE BEST AT THIS (E.G. JOHN LEWIS, JD SPORTS, ARGOS) 12% 20% 12%
SOCIAL PLATFORMS (E.G. FACEBOOK) 2% 3% 4%
VIA AN AGGREGATOR / DELIVERY APP (UBER EATS, DELIVEROO) 3% 5% 9%
VOICE COMMERCE (E.G. VIA AMAZON ALEXA) 7% 0% 11%
WHAT ARE THE HIGHEST RATED CHANNELS IN UNITED STATES, SOUTH AFRICA AND UNITED ARAB EMIRATES?

51
“Experience” naturally covers many different elements, and so we wanted to look at who was best at each. And when it comes to experience, the finding is unanimous; it is marketplaces – Amazon, Tmall, Mercado Libre et al – that are setting the benchmark for experience:
01 THE LEAD MARKETPLACE IN REGION (E.G. AMAZON, TMALL, MERCADO LIBRE) 41%
02 RETAILERS ARE THE BEST AT THIS (E.G. JOHN LEWIS, JD SPORTS, ARGOS) 15%
03 OTHER MARKETPLACES ARE BEST AT THIS 12%
04 NONE OF THESE ARE THE BEST AT THIS 9%
05 INDIVIDUAL BRANDS ARE THE BEST AT THIS (E.G. NIKE, DYSON, APPLE) 9%
06 VOICE COMMERCE (E.G. VIA AMAZON ALEXA) 6%
07 VIA AN AGGREGATOR / DELIVERY APP (UBER EATS, DELIVEROO) 4%
08 SOCIAL PLATFORMS (E.G. FACEBOOK) 3%
09 MESSAGING PLATFORMS (E.G. WHATSAPP, WECHAT) 1%
01 THE LEAD MARKETPLACE IN REGION (E.G. AMAZON, TMALL, MERCADO LIBRE) 43%
02 RETAILERS ARE THE BEST AT THIS (E.G. JOHN LEWIS, JD SPORTS, ARGOS) 13%
03 OTHER MARKETPLACES ARE BEST AT THIS 12%
04 NONE OF THESE ARE THE BEST AT THIS 10%
05 INDIVIDUAL BRANDS ARE THE BEST AT THIS (E.G. NIKE, DYSON, APPLE) 9%
06 VOICE COMMERCE (E.G. VIA AMAZON ALEXA) 6%
07 VIA AN AGGREGATOR / DELIVERY APP (UBER EATS, DELIVEROO) 4%
08 SOCIAL PLATFORMS (E.G. FACEBOOK) 3%
09 MESSAGING PLATFORMS (E.G. WHATSAPP, WECHAT) 1%
ACCESS TO THE BRANDS I WANTED ACCURATE PRODUCT DESCRIPTIONS

52
01 THE LEAD MARKETPLACE IN REGION (E.G. AMAZON, TMALL, MERCADO LIBRE) 44%
02 OTHER MARKETPLACES ARE BEST AT THIS 14%
03 RETAILERS ARE THE BEST AT THIS (E.G. JOHN LEWIS, JD SPORTS, ARGOS) 12%
04 NONE OF THESE ARE THE BEST AT THIS 10%
05 INDIVIDUAL BRANDS ARE THE BEST AT THIS (E.G. NIKE, DYSON, APPLE) 6%
06 VOICE COMMERCE (E.G. VIA AMAZON ALEXA) 5%
07 VIA AN AGGREGATOR / DELIVERY APP (UBER EATS, DELIVEROO) 4%
08 SOCIAL PLATFORMS (E.G. FACEBOOK) 4%
09 MESSAGING PLATFORMS (E.G. WHATSAPP, WECHAT) 1%
01 THE LEAD MARKETPLACE IN REGION (E.G. AMAZON, TMALL, MERCADO LIBRE) 48%
02 RETAILERS ARE THE BEST AT THIS (E.G. JOHN LEWIS, JD SPORTS, ARGOS) 11%
03 OTHER MARKETPLACES ARE BEST AT THIS 11%
04 NONE OF THESE ARE THE BEST AT THIS 9%
05 INDIVIDUAL BRANDS ARE THE BEST AT THIS (E.G. NIKE, DYSON, APPLE) 6%
06 VIA AN AGGREGATOR / DELIVERY APP (UBER EATS, DELIVEROO) 6%
07 VOICE COMMERCE (E.G. VIA AMAZON ALEXA) 5%
08 SOCIAL PLATFORMS (E.G. FACEBOOK) 3%
09 MESSAGING PLATFORMS (E.G. WHATSAPP, WECHAT) 1%
BEST PRICE CONVENIENT DELIVERY

53
01 THE LEAD MARKETPLACE IN REGION (E.G. AMAZON, TMALL, MERCADO LIBRE) 44%
02 NONE OF THESE ARE THE BEST AT THIS 13%
03 RETAILERS ARE THE BEST AT THIS (E.G. JOHN LEWIS, JD SPORTS, ARGOS) 13%
04 OTHER MARKETPLACES ARE BEST AT THIS 11%
05 INDIVIDUAL BRANDS ARE THE BEST AT THIS (E.G. NIKE, DYSON, APPLE) 7%
06 VOICE COMMERCE (E.G. VIA AMAZON ALEXA) 5%
07 VIA AN AGGREGATOR / DELIVERY APP (UBER EATS, DELIVEROO) 4%
08 SOCIAL PLATFORMS (E.G. FACEBOOK) 2%
09 MESSAGING PLATFORMS (E.G. WHATSAPP, WECHAT) 1%
01 THE LEAD MARKETPLACE IN REGION (E.G. AMAZON, TMALL, MERCADO LIBRE) 48%
02 RETAILERS ARE THE BEST AT THIS (E.G. JOHN LEWIS, JD SPORTS, ARGOS) 12%
03 OTHER MARKETPLACES ARE BEST AT THIS 12%
04 NONE OF THESE ARE THE BEST AT THIS 8%
05 INDIVIDUAL BRANDS ARE THE BEST AT THIS (E.G. NIKE, DYSON, APPLE) 6%
06 VOICE COMMERCE (E.G. VIA AMAZON ALEXA) 6%
07 VIA AN AGGREGATOR / DELIVERY APP (UBER EATS, DELIVEROO) 4%
08 SOCIAL PLATFORMS (E.G. FACEBOOK) 3%
09 MESSAGING PLATFORMS (E.G. WHATSAPP, WECHAT) 1%
EASY RETURNS PROCESS EASY TO FIND THE PRODUCT I WAS LOOKING FOR
54
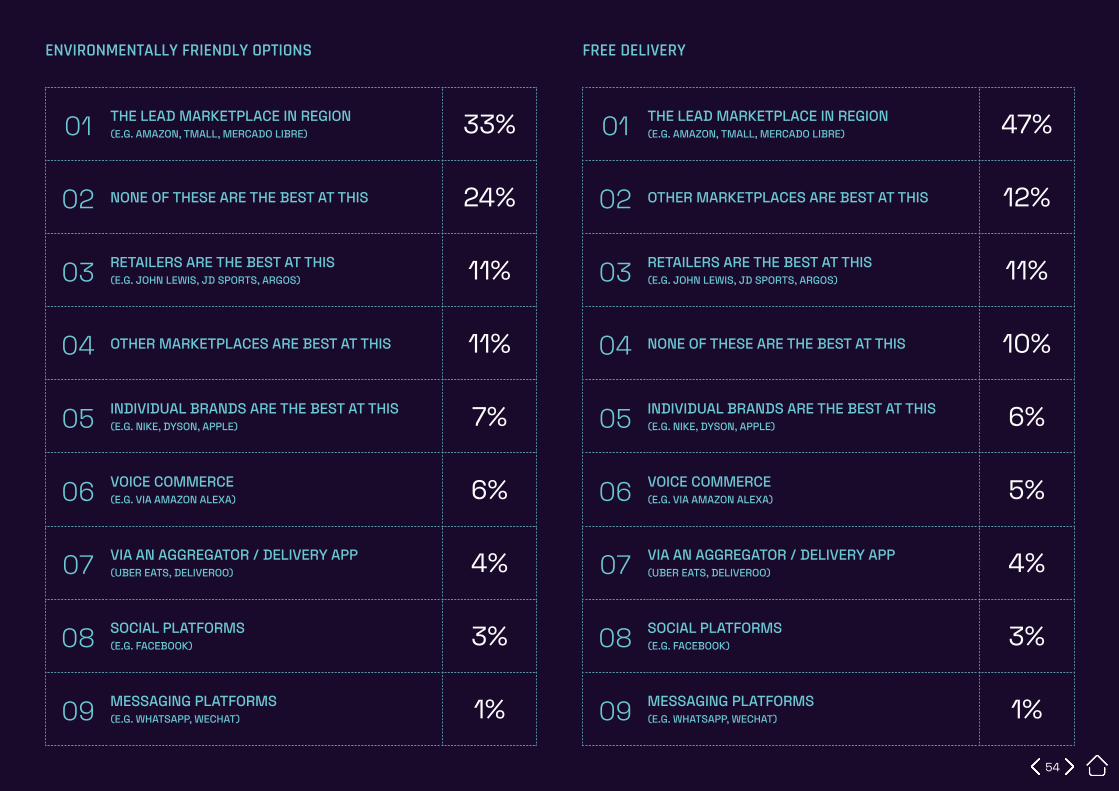
01 THE LEAD MARKETPLACE IN REGION (E.G. AMAZON, TMALL, MERCADO LIBRE) 33%
02 NONE OF THESE ARE THE BEST AT THIS 24%
03 RETAILERS ARE THE BEST AT THIS (E.G. JOHN LEWIS, JD SPORTS, ARGOS) 11%
04 OTHER MARKETPLACES ARE BEST AT THIS 11%
05 INDIVIDUAL BRANDS ARE THE BEST AT THIS (E.G. NIKE, DYSON, APPLE) 7%
06 VOICE COMMERCE (E.G. VIA AMAZON ALEXA) 6%
07 VIA AN AGGREGATOR / DELIVERY APP (UBER EATS, DELIVEROO) 4%
08 SOCIAL PLATFORMS (E.G. FACEBOOK) 3%
09 MESSAGING PLATFORMS (E.G. WHATSAPP, WECHAT) 1%
ENVIRONMENTALLY FRIENDLY OPTIONS
01 THE LEAD MARKETPLACE IN REGION (E.G. AMAZON, TMALL, MERCADO LIBRE) 47%
02 OTHER MARKETPLACES ARE BEST AT THIS 12%
03 RETAILERS ARE THE BEST AT THIS (E.G. JOHN LEWIS, JD SPORTS, ARGOS) 11%
04 NONE OF THESE ARE THE BEST AT THIS 10%
05 INDIVIDUAL BRANDS ARE THE BEST AT THIS (E.G. NIKE, DYSON, APPLE) 6%
06 VOICE COMMERCE (E.G. VIA AMAZON ALEXA) 5%
07 VIA AN AGGREGATOR / DELIVERY APP (UBER EATS, DELIVEROO) 4%
08 SOCIAL PLATFORMS (E.G. FACEBOOK) 3%
09 MESSAGING PLATFORMS (E.G. WHATSAPP, WECHAT) 1%
FREE DELIVERY

55
01 THE LEAD MARKETPLACE IN REGION (E.G. AMAZON, TMALL, MERCADO LIBRE) 36%
02 NONE OF THESE ARE THE BEST AT THIS 16%
03 OTHER MARKETPLACES ARE BEST AT THIS 13%
04 RETAILERS ARE THE BEST AT THIS (E.G. JOHN LEWIS, JD SPORTS, ARGOS) 12%
05 INDIVIDUAL BRANDS ARE THE BEST AT THIS (E.G. NIKE, DYSON, APPLE) 8%
06 VOICE COMMERCE (E.G. VIA AMAZON ALEXA) 6%
07 VIA AN AGGREGATOR / DELIVERY APP (UBER EATS, DELIVEROO) 4%
08 SOCIAL PLATFORMS (E.G. FACEBOOK) 4%
09 MESSAGING PLATFORMS (E.G. WHATSAPP, WECHAT) 1%
01 THE LEAD MARKETPLACE IN REGION (E.G. AMAZON, TMALL, MERCADO LIBRE) 40%
02 NONE OF THESE ARE THE BEST AT THIS 12%
03 OTHER MARKETPLACES ARE BEST AT THIS 12%
04 RETAILERS ARE THE BEST AT THIS (E.G. JOHN LEWIS, JD SPORTS, ARGOS) 11%
05 INDIVIDUAL BRANDS ARE THE BEST AT THIS (E.G. NIKE, DYSON, APPLE) 7%
06 SOCIAL PLATFORMS (E.G. FACEBOOK) 6%
07 VOICE COMMERCE (E.G. VIA AMAZON ALEXA) 6%
08 VIA AN AGGREGATOR / DELIVERY APP (UBER EATS, DELIVEROO) 4%
09 MESSAGING PLATFORMS (E.G. WHATSAPP, WECHAT) 2%
PERSONALIZED OFFERSONLINE CONTENT THAT WAS REALLY RELEVANT TO ME

56
01 THE LEAD MARKETPLACE IN REGION (E.G. AMAZON, TMALL, MERCADO LIBRE) 50%
02 RETAILERS ARE THE BEST AT THIS (E.G. JOHN LEWIS, JD SPORTS, ARGOS) 11%
03 OTHER MARKETPLACES ARE BEST AT THIS 10%
04 NONE OF THESE ARE THE BEST AT THIS 8%
05 VIA AN AGGREGATOR / DELIVERY APP (UBER EATS, DELIVEROO) 7%
06 INDIVIDUAL BRANDS ARE THE BEST AT THIS (E.G. NIKE, DYSON, APPLE) 6%
07 VOICE COMMERCE (E.G. VIA AMAZON ALEXA) 6%
08 SOCIAL PLATFORMS (E.G. FACEBOOK) 3%
09 MESSAGING PLATFORMS (E.G. WHATSAPP, WECHAT) 1%
SPEEDY DELIVERY
01 THE LEAD MARKETPLACE IN REGION (E.G. AMAZON, TMALL, MERCADO LIBRE) 45%
02 OTHER MARKETPLACES ARE BEST AT THIS 12%
03 RETAILERS ARE THE BEST AT THIS (E.G. JOHN LEWIS, JD SPORTS, ARGOS) 11%
04 NONE OF THESE ARE THE BEST AT THIS 11%
05 INDIVIDUAL BRANDS ARE THE BEST AT THIS (E.G. NIKE, DYSON, APPLE) 7%
06 VOICE COMMERCE (E.G. VIA AMAZON ALEXA) 6%
07 SOCIAL PLATFORMS (E.G. FACEBOOK) 4%
08 VIA AN AGGREGATOR / DELIVERY APP (UBER EATS, DELIVEROO) 3%
09 MESSAGING PLATFORMS (E.G. WHATSAPP, WECHAT) 1%
PRODUCT REVIEWS AND ADVICE

57
01 THE LEAD MARKETPLACE IN REGION (E.G. AMAZON, TMALL, MERCADO LIBRE) 47%
02 RETAILERS ARE THE BEST AT THIS (E.G. JOHN LEWIS, JD SPORTS, ARGOS) 13%
03 OTHER MARKETPLACES ARE BEST AT THIS 12%
04 NONE OF THESE ARE THE BEST AT THIS 9%
05 INDIVIDUAL BRANDS ARE THE BEST AT THIS (E.G. NIKE, DYSON, APPLE) 7%
06 VOICE COMMERCE (E.G. VIA AMAZON ALEXA) 6%
07 VIA AN AGGREGATOR / DELIVERY APP (UBER EATS, DELIVEROO) 4%
08 SOCIAL PLATFORMS (E.G. FACEBOOK) 3%
09 MESSAGING PLATFORMS (E.G. WHATSAPP, WECHAT) 1%
01 THE LEAD MARKETPLACE IN REGION (E.G. AMAZON, TMALL, MERCADO LIBRE) 42%
02 RETAILERS ARE THE BEST AT THIS (E.G. JOHN LEWIS, JD SPORTS, ARGOS) 14%
03 NONE OF THESE ARE THE BEST AT THIS 11%
04 OTHER MARKETPLACES ARE BEST AT THIS 11%
05 INDIVIDUAL BRANDS ARE THE BEST AT THIS (E.G. NIKE, DYSON, APPLE) 8%
06 VOICE COMMERCE (E.G. VIA AMAZON ALEXA) 6%
07 VIA AN AGGREGATOR / DELIVERY APP (UBER EATS, DELIVEROO) 4%
08 SOCIAL PLATFORMS (E.G. FACEBOOK) 3%
09 MESSAGING PLATFORMS (E.G. WHATSAPP, WECHAT) 1%
THE ITEM I WANTED WAS IN STOCKSTRONG CUSTOMER SERVICE
58
KEY THOUGHTS CONSUMERS ARE MORE DEMANDING THAN EVER AND GIVING THEM THE EXPERIENCES THEY WANT IS A KEY BATTLEGROUND IN COMMERCE.
■ Consumers expect a lot from their online experience. Their demands include faster and faster delivery, but also easy returns and availability. A majority even want shopping to be more entertaining.
■ What should be clear to businesses is how significant these demands are in influencing buying decisions. Three-quarters of global consumers don’t feel online retailers live up to their expectations around products, services and experience. More than half said they won’t shop with brands that fail to give them what they want.
There are clear opportunities for anyone who can deliver on CX.
DEMANDS AROUND DELIVERY AND RETURNS POSE BIG CHALLENGES TO VENDORS
■ The pace of change in expected delivery times is relentless – globally, the proportion of consumers who expect sub-two-hour deliveries has gone from 4% to 24% in just a year! This is a real test of resources and resourcefulness. As is the fact that a sizable proportion of shoppers admit to over-ordering online fully intending to send some items back.
■ Big marketplaces don’t do the rest of the commerce ecosystem any favors by putting their considerable weight behind pushing fast, free delivery and returns. This in many ways creates the expectations. Smaller retailers and brands probably can’t hope to match the logistical resources of the giant marketplaces, so must get creative about how they differentiate.
Do you put your store to work with a stronger focus on click or collect? Or do you partner with local couriers and aggregators for bespoke local delivery?
For more inspirational fulfillment ideas, speak to Tim Reay, Head of Business Services, Wunderman Thompson Commerce: [email protected]
Find out more about our customer experience services here.
Speak to Rachel Smith, Customer Experience Director, Wunderman Thompson Commerce: [email protected] to find out how.
5959
As discussed in the chapter on the customer journey, a huge 35% of all online shopping is conducted through marketplaces. This is, in fact, a slight fall on the 42% of last year, something that has been reflected in some of the marketplacesʼ financial results, as the process of shopping re-normalization takes place.
SECTION 4:MARKETPLACES

60
CHAPTER 1: CONSUMERS DEMAND EASE AND CONVENIENCE
The strength of marketplaces can undoubtedly be attributed to the ease and convenience which they offer to consumers (alongside range and service, of course).
But while some may feel threatened by the scale, power and dominance of marketplaces, it appears that any concerns are usurped by the benefits of ease and convenience, because 64% of consumers said they are excited about being able to order all of their goods through one retailer. Incidentally, this percentage has not changed since last year.
64% OF GLOBAL CONSUMERS ARE EXCITED BY THE PROSPECT OF BUYING EVERYTHING THROUGH ONE RETAILER
EXPERT OPINION:WHY MARKETPLACES ARE THE KINGS AND QUEENS OF EASE AND CONVENIENCE
The post-pandemic era has revolutionized the way people organize their lives. Optimizing their work-life balance also means optimizing shopping activities in a smarter way. Marketplaces offer a unique solution to this. Combining online shopping, assortment, competitive prices, efficient delivery and an incredibly improved customer experience in a single platform, helps to retain people´s attention and solve their shopping needs.
Although eCommerce channels have significantly changed the game, marketplaces offer an unbeatable experience, combining all the characteristics that help optimize “life-time” and effort, across the entire journey, from search to delivery, all in one place.
GLENDA KOKCHIEF OF TECHNOLOGY BUSINESSWUNDERMAN THOMPSON LATAM
61
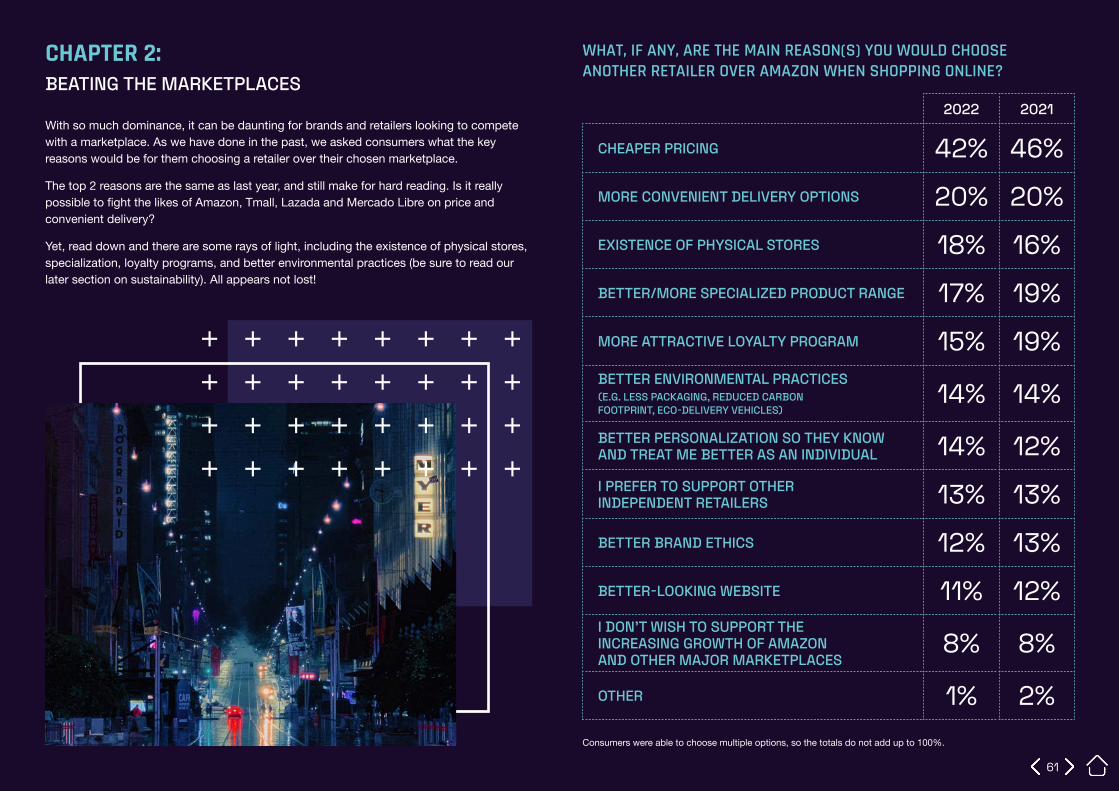
CHAPTER 2: BEATING THE MARKETPLACES
With so much dominance, it can be daunting for brands and retailers looking to compete with a marketplace. As we have done in the past, we asked consumers what the key reasons would be for them choosing a retailer over their chosen marketplace.
The top 2 reasons are the same as last year, and still make for hard reading. Is it really possible to fight the likes of Amazon, Tmall, Lazada and Mercado Libre on price and convenient delivery?
Yet, read down and there are some rays of light, including the existence of physical stores, specialization, loyalty programs, and better environmental practices (be sure to read our later section on sustainability). All appears not lost!
WHAT, IF ANY, ARE THE MAIN REASON(S) YOU WOULD CHOOSE ANOTHER RETAILER OVER AMAZON WHEN SHOPPING ONLINE?
2022 2021
CHEAPER PRICING 42% 46%MORE CONVENIENT DELIVERY OPTIONS 20% 20%EXISTENCE OF PHYSICAL STORES 18% 16%BETTER/MORE SPECIALIZED PRODUCT RANGE 17% 19%MORE ATTRACTIVE LOYALTY PROGRAM 15% 19%BETTER ENVIRONMENTAL PRACTICES (E.G. LESS PACKAGING, REDUCED CARBON FOOTPRINT, ECO-DELIVERY VEHICLES)
14% 14%BETTER PERSONALIZATION SO THEY KNOW AND TREAT ME BETTER AS AN INDIVIDUAL 14% 12%I PREFER TO SUPPORT OTHER INDEPENDENT RETAILERS 13% 13%BETTER BRAND ETHICS 12% 13%BETTER-LOOKING WEBSITE 11% 12%I DON'T WISH TO SUPPORT THE INCREASING GROWTH OF AMAZON AND OTHER MAJOR MARKETPLACES
8% 8%
OTHER 1% 2%Consumers were able to choose multiple options, so the totals do not add up to 100%.

62
CHAPTER 3: REVIEWS AND COUNTERFEITS AND CONCERNS
It’s not all plain sailing for marketplaces though, with 47% of global consumers saying they are worried about marketplaces dominating the retail industry.
In addition, more than half of global consumers (53%) support Amazon and other marketplaces paying more taxes.
There are also issues of trust when it comes to products and reviews. Marketplaces, with their vast ranges, reach and access to customers, have become key places to research products and hear what other shoppers have to say.
For instance, while 35% of consumers said they trust reviews, and 35% add that they trust products to be what they say they are, 19% admit they have encountered a product they suspect may be counterfeit. And 21% claim they have encountered a review they suspect to be fake. Clearly, there is still some work to be done by marketplaces to win over the trust of all shoppers.
How do purchase suggestions posed by marketplaces help or hinder this? Just under a quarter (24%) of consumers said that suggested purchases like “Amazon’s Choice” influence what they purchase. But the flip side is that 20% think that “sponsored” items get in the way of what they’re looking for, and 19% question the “credibility” of the sponsored items.
19% OF GLOBAL SHOPPERS SAID THEY HAVE ENCOUNTERED A PRODUCT THEY SUSPECT IS COUNTERFEIT ON MARKETPLACES

63
CHAPTER 4: RETAILER AND BRAND MARKETPLACES
When we think about marketplaces, we naturally think of the likes of Amazon, Tmall and Mercado Libre, but we are increasingly seeing brands and retailers approaching us to ask about the possibilities of creating their own marketplaces – think Next in the UK.
We saw earlier how consumers want ease and convenience, and are in fact excited about buying everything through one retailer. So, it should be no surprise that 54% of consumers said they like buying from branded marketplaces like Next.
EXPERT OPINION:WHY ALL BRANDS SHOULD BE CONSIDERING CREATING MARKETPLACES OF THEIR OWN
As well as offering ease and convenience for consumers, the marketplace model can also help tackle key business challenges. Creating a marketplace enables brands to extend their product ranges, expand into different categories and experiment with new products and services with much less risk; the dynamic and agile nature of marketplaces make them great testing beds. They also do a great job in supporting a supply chain. By working with multiple sellers, brands can improve their product availability and bolster their fulfillment options with much less investment than doing it themselves.
However, be wary of the ‘build it and they will come’ notion. Marketplaces operate quite differently to traditional business models and, therefore, need specialist expertise to successfully launch, manage and harness their true potential.
CHIOMA ANOKURUACCOUNT DIRECTORWUNDERMAN THOMPSON COMMERCE

64
CHAPTER 5: LOYALTY AND MARKETPLACES
Another area where marketplaces are strong, is the matter of loyalty.
However, it is not the marketplaces that win this particular battle. The highest percentage of consumers are members of supermarket / grocery loyalty schemes (43%), marginally ahead of the lead marketplaces (38%).
Nonetheless, the marketplace loyalty penetration globally remains high, providing consumers yet another reason to purchase:
PERCENT OF CONSUMERS THAT ARE SIGNED UP TO MARKETPLACE LOYALTY PROGRAMS
LATAM – MERCADO LIBRE PUNTOS
43%
43+57+0CHINA – TMALL
44%
44+56+0
EUROPE – AMAZON PRIME
39%
39+61+0US – AMAZON PRIME
45%
45+55+0

65
CHAPTER 6: AMAZON PRIME
Last year 60% of consumers told us that they thought Amazon Prime was good value for money, this has now increased to 66%, while Prime customers remain unchanged at 79% believing it is good value for money.
Over the years, we’ve also noticed that being a Prime member changes your perception of Amazon positively. The table illustrates how Prime members are much more positive about Amazon across all metrics. It’s yet another reason why Amazon wants to increase its Prime penetration.
GLOBAL MEMBERSHIP OF LOYALTY SCHEMES
SUPERMARKETS / GROCERS 43%THE LOYALTY SCHEME OF THE MAJOR MARKETPLACE IN REGION 38%HEALTH AND BEAUTY 28%DEPARTMENT STORES 25%FASHION 20%TRAVEL 18%WHOLESALE 16%CONSUMER ELECTRONICS 16%I'M NOT A MEMBER OF ANY OF THESE 14%AGGREGATOR SITES 13%MERCADO LIBRE 11%JD VIP 2%
AMAZON IS BEST AT THIS PRIME NON-PRIME DIFFERENCE (+/-)
BEST PRICE 48% 26% 22%ACCESS TO THE BRANDS I WANTED 44% 25% 19%SPEEDY DELIVERY 56% 29% 27%CONVENIENT DELIVERY 55% 28% 27%FREE DELIVERY 55% 27% 28%EASY RETURNS PROCESS 48% 25% 23%ONLINE CONTENT THAT WAS REALLY RELEVANT TO ME 44% 24% 20%ACCURATE PRODUCT DESCRIPTIONS 46% 26% 20%EASY TO FIND THE PRODUCT I WAS LOOKING FOR 53% 28% 25%PERSONALIZED OFFERS 40% 22% 18%STRONG CUSTOMER SERVICE 46% 25% 21%THE ITEM I WANTED WAS IN STOCK 51% 28% 23%PRODUCT REVIEWS AND ADVICE 48% 26% 22%ENVIRONMENTALLY FRIENDLY OPTIONS 35% 21% 14%

66

67
CHAPTER 7: EXPANDING MARKETPLACE SERVICES
We know that Amazon’s strategy is based on its aim to “sell everything from A to Z,” and this is the same for most of the major marketplaces across the world, so what are some of the areas that it’s expanding into, and how is this development going?
FINANCIAL SERVICESLet’s take a look at one clear area of expansion – financial services. Last year we asked consumers if they would be open to banking through their preferred marketplaces. Just over half (54%) of consumers said yes. This year, that number has fallen slightly to 46%, while the percentage of consumers open to other financial products like mortgages, pensions, and insurance was 47% (last year’s figure was 48%).
While the percentages may have seen a decline since last year, there is still a significant percentage of consumers interested in engaging with marketplaces around financial services. But a word of caution, the move towards banking with non-traditional banking businesses isn’t exclusive to marketplaces, as 41% of consumers said they would like their retailers to be their banks.
GROCERIESAnd what about groceries? Marketplaces such as Amazon and Tmall have been testing this for a number of years. And it would appear they still have work to do, with 62% of consumers preferring to go either to a supermarket’s online or physical store, rather than ordering groceries through marketplaces.
SPORTS COVERAGEAmazon has assumed more of a position in the sports broadcasting market in the last few years – showing high profile events such as Premier League football and Grand Slam tennis. Last year, 40% of consumers said they were impressed with this coverage, a figure that has risen, slightly to 45% in 2022.

68
KEY THOUGHTS ■ Marketplaces are out in front when it comes to the experiences that they offer, and their
services are increasing. They lead when it comes to offering consumers what they want – a one-stop shop – but they’re not unbeatable.
■ It might be daunting thinking about trying to beat marketplaces on price and delivery. But there are areas that smaller operators can leverage, where they are much better placed to compete on – for instance, the simple fact of having a physical store, a more specialized, niche product range, more attractive loyalty schemes, or better personalization.
■ Marketplaces face question marks over the authenticity of products and reviews, their financial arrangements, their environmental impact and more. A lot of people simply don’t want to see marketplaces dominate retail.
■ The larger marketplaces continue to expand their services aggressively into new areas, and consumers continue to lap them up. It’s clear that the marketplace model has huge appeal to consumers. So, there’s an argument that the best way to compete is to copy it.
To find out how to make marketplaces work for your business, not against it speak to Helmut Rieder, CEO WPP Center of Excellence for Amazon EMEA: [email protected].
Find out more about our marketplace services here.

69
SECTION 5:SOCIAL COMMERCE

70
CHAPTER 1: BUYING ON SOCIAL MEDIA PLATFORMS AND SOCIAL COMMERCE
With so much noise around social commerce, we wanted to get down to the details. And one of the first questions we wanted an answer to was “what percentage of shoppers have actually bought through social media platforms?” The answer was 65%, a huge rise on the 44% who said the same last year.
This seems very high given that the ability to purchase directly via the platforms is still, in most countries and regions, in its infancy. So, we delved a little deeper...
36% of consumers said they have purchased “on-platform”.
Buying “on-platform” is so important because consumers want fast online shopping experiences, and don’t want to leave social platforms to make their purchases. Our data backs up this wish, with 56% of consumers globally saying they do not want to leave to complete the transaction.
Of course, these numbers differ across countries, and, surprisingly, it wasn’t China who had the highest percentage of social commerce buyers – instead, it was Thailand, followed by the UAE and India (86%).
65% OF GLOBAL SHOPPERS SAID THEY HAVE ALREADY BOUGHT THROUGH SOCIAL MEDIA PLATFORMS – UP FROM 44% IN 2021
56% OF GLOBAL CONSUMERS SAID THEY DO NOT WANT TO LEAVE THE SOCIAL MEDIA PLATFORM TO COMPLETE A TRANSACTION
OVERALL ON-PLATFORM
OVERALL 65% 36%THAILAND 88% 62%UNITED ARAB EMIRATES 86% 49%INDIA 86% 50%CHINA 84% 52%COLOMBIA 80% 46%INDONESIA 79% 42%MEXICO 76% 43%BRAZIL 72% 42%ARGENTINA 68% 41%SOUTH AFRICA 68% 42%UNITED STATES 63% 32%NETHERLANDS 56% 27%AUSTRALIA 53% 27%SPAIN 52% 22%GERMANY 48% 22%UNITED KINGDOM 47% 22%FRANCE 41% 19%JAPAN 35% 16%
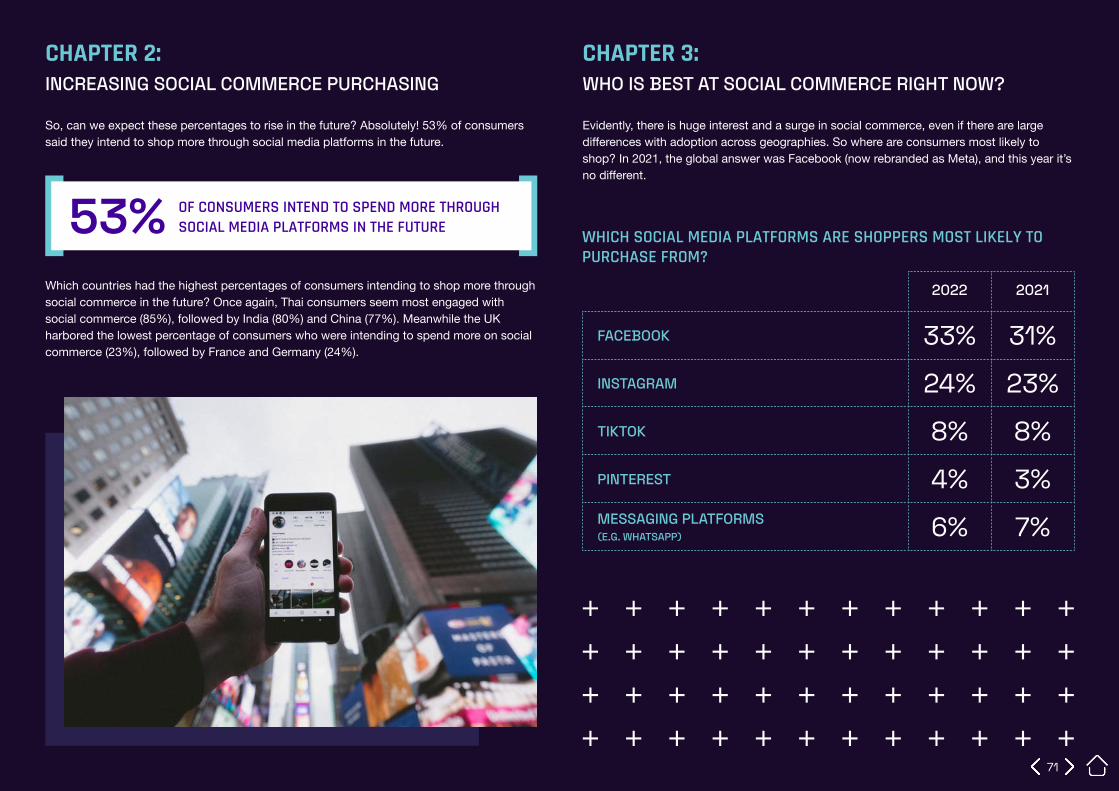
71
CHAPTER 2: INCREASING SOCIAL COMMERCE PURCHASING
So, can we expect these percentages to rise in the future? Absolutely! 53% of consumers said they intend to shop more through social media platforms in the future.
Which countries had the highest percentages of consumers intending to shop more through social commerce in the future? Once again, Thai consumers seem most engaged with social commerce (85%), followed by India (80%) and China (77%). Meanwhile the UK harbored the lowest percentage of consumers who were intending to spend more on social commerce (23%), followed by France and Germany (24%).
CHAPTER 3: WHO IS BEST AT SOCIAL COMMERCE RIGHT NOW?
Evidently, there is huge interest and a surge in social commerce, even if there are large differences with adoption across geographies. So where are consumers most likely to shop? In 2021, the global answer was Facebook (now rebranded as Meta), and this year it’s no different.
53% OF CONSUMERS INTEND TO SPEND MORE THROUGH SOCIAL MEDIA PLATFORMS IN THE FUTURE WHICH SOCIAL MEDIA PLATFORMS ARE SHOPPERS MOST LIKELY TO
PURCHASE FROM?
2022 2021
FACEBOOK 33% 31%INSTAGRAM 24% 23%TIKTOK 8% 8%PINTEREST 4% 3%MESSAGING PLATFORMS (E.G. WHATSAPP) 6% 7%

72
WHICH SOCIAL MEDIA PLATFORMS OFFER SHOPPERS THE BEST SOCIAL COMMERCE EXPERIENCE IN 2022?
1. FACEBOOK 31%
2. INSTAGRAM 24%
3. NONE OF THE ABOVE ARE BEST AT THIS/I DON’T KNOW 23%
4. TIKTOK 8%
5. PINTEREST 3%
6. WECHAT 3%
7. LINE 2%
8. SNAPCHAT 2%
9. OTHER 2%
10. TELEGRAM 1%
11. SIGNAL 0%
12. SHARECHAT 0%
And much of the reason for this result is because Facebook is seen as giving consumers the “best social commerce experience,” with Instagram in second, both significantly ahead of TikTok.

73
But as one might expect, these global figures hide telling nuances across markets.
COUNTRIES WHERE FACEBOOK WAS RANKED AS THE NUMBER ONE SOCIAL COMMERCE EXPERIENCE
01 ARGENTINA 41%
02 AUSTRALIA 28%
03 COLOMBIA 46%
04 FRANCE 26%
05 MEXICO 61%
06 NETHERLANDS 26%
07 SOUTH AFRICA 40%
08 THAILAND 62%
09 UNITED ARAB EMIRATES 39%
10 UNITED KINGDOM 27%
11 UNITED STATES 32%
COUNTRIES WHERE INSTAGRAM WAS RANKED AS THE NUMBER ONE SOCIAL COMMERCE EXPERIENCE
01 BRAZIL 42%
02 GERMANY 24%
03 INDIA 36%
04 INDONESIA 35%
05 JAPAN 20%
06 SPAIN 33%
COUNTRIES WHERE TIKTOK WAS RANKED AS THE NUMBER ONE SOCIAL COMMERCE EXPERIENCE
01 CHINA 34%

74
CHAPTER 4: BUYING MORE THROUGH SOCIAL
So, it would appear that social commerce is on the rise, and driven by consumer demand. This means that businesses, retailers and brands must look at how they can convert consumers more in this channel. We, therefore, asked what would encourage consumers to purchase more through social media platforms in the future.
The answers were almost identical to last year, with “deals and discounts” coming in first position. Seemingly consumers want to be tempted when they are on social media platforms. Second comes “ease of purchase,” once again reinforcing the need for a simple buying mechanism on social, something that currently is not widespread. Again, this shows the unquenched appetite that consumers have for social purchasing.
WHAT WOULD ENCOURAGE CONSUMERS TO PURCHASE MORE THROUGH SOCIAL PLATFORMS IN THE FUTURE?
2022 2021
DEALS AND DISCOUNTS 36% 37%EASE OF PURCHASE 32% 31%EXCLUSIVE OFFERS 27% 27%MORE CUSTOMER REVIEWS 24% 24%GREATER PRODUCT AVAILABILITY 22% 20%SEEING THE PRODUCTS ON REAL CUSTOMERS 21% 23%FASTER PAYMENT / MORE SEAMLESS PAYMENTS 20% 18%SERVICE / DELIVERY UPDATES 18% 17%EXCLUSIVE RANGES 16% 14%EARLY ACCESS TO PRODUCTS 16% 14%ENDORSEMENTS / INFLUENCERS 14% 9%NOTHING 14% 19%LIVESTREAM COMMERCE (VIDEO CALLS WITH SALES ASSISTANTS AND/OR INFLUENCERS) 13% 11%

75
CHAPTER 5: LIVESTREAM COMMERCE
One of the emerging trends over the last few years has been the rise of livestream commerce – watching brands, retailers and influencers discussing products to buy. In the previous section, we saw that globally, 13% of consumers said that livestream commerce would encourage them to buy more through social media platforms.
But that’s the future – what about today? We wanted to know how mainstream this has now become. Amazingly, 46% of consumers globally said they had used livestream commerce to purchase products!
However, where you live, and therefore what social platforms are currently offering livestream commerce, clearly influence how many consumers have bought this way.
Unsurprisingly, the age group with the highest percentage was the 16-24-year-olds (58%), with the percentage dropping incrementally as consumers got older – however 9% of over-65s still claim to have purchased via livestream commerce, a figure that appears, to us at least, questionably high.
46% OF GLOBAL CONSUMERS HAVE ALREADY USED LIVESTREAM COMMERCE TO PURCHASE PRODUCTS ONLINE
WHAT PERCENTAGE OF GLOBAL CONSUMERS HAVE ALREADY USED LIVESTREAM COMMERCE TO PURCHASE AN ITEM ONLINE?
YES NO
CHINA 77% 23%INDIA 75% 25%THAILAND 72% 28%UNITED ARAB EMIRATES 70% 30%INDONESIA 69% 31%COLOMBIA 54% 46%MEXICO 54% 46%UNITED STATES 45% 55%SPAIN 44% 56%ARGENTINA 42% 58%SOUTH AFRICA 42% 58%FRANCE 35% 65%BRAZIL 35% 65%JAPAN 32% 68%GERMANY 28% 72%NETHERLANDS 23% 77%AUSTRALIA 22% 78%UNITED KINGDOM 21% 79%

76

77
EXPERT OPINION:WHY IT’S VITAL TO HAVE YOUR SOCIAL COMMERCE STRATEGY IN PLACE
Social Commerce empowers consumers to buy on platform. Social media has played such a critical role in the compression of the traditional marketing funnel, causing points of inspiration and purchase to converge. We’re seeing huge growth in social platforms being used across the entire purchase journey – from attraction, engagement, conversion, to retention. Brands want, and need, to be where their consumers are – and that’s on social media. The beauty of social commerce is that it’s discovery-driven and contains the entire path to purchase in one platform. That’s why, having a robust social commerce strategy is vital for commerce success looking into the future. It’s no longer about how we use social in isolation as a media play and media play only, but more about how social is woven into a wider balanced channel strategy, and really driving that conversion for brands, ultimately leading to increased purchases via the channels, and the desire for repeat purchasing.
CHLOE COXHEAD OF SOCIALWUNDERMAN THOMPSON COMMERCE

78
KEY THOUGHTS ■ Social commerce is arguably the hottest trend in digital commerce, with a huge leap in
the number of consumers who have bought through social media compared to last year. And our findings underline the fact that shoppers are looking forward to using social media more and more.
■ The gauntlet has been laid down to brands and retailers to integrate social into their sales as well as their marketing strategies and work out how to convert more customers on social platforms.
■ Consumers are clear about what they want to see. Deals and discounts, exclusive offers, more customer reviews, better product availability, and seeing the product on real people all featured highly as influencing factors to buy more through social channels.
■ Easier purchasing, more seamless payment options, and the ability to complete a purchase directly all point to on-platform purchasing within the social app, rather than having to click elsewhere. And the majority of consumers want this – even though, currently, it’s not in place on all social platforms.
■ The fact that Facebook and Instagram have pioneered on-platform social buying perhaps explains why they are, by some distance, the most popular social sites to shop on worldwide. Although the growing popularity of ‘livestream commerce’, especially among younger age groups, positions TikTok as a major growth platform to watch.
To discuss the right social channels to add to your commerce strategy, speak to Chloe Cox, Head of Social, Wunderman Thompson Commerce: [email protected]
Find out more about our social commerce services here.

79
SECTION 6:DIFFERENCE ACROSS SECTORS

80
WHEN YOU BUY THE FOLLOWING TYPES OF PRODUCTS ONLINE, WHERE ARE YOU MOST LIKELY TO ACTUALLY PURCHASE?
ALCOHOLBEAUTY
(E.G. HAIRCARE, SKINCARE, MAKEUP)
CLEANING PRODUCTS
CLOTHING AND FASHION (E.G. HIGH STREET
CLOTHING, FOOTWEAR)
ELDERLY CARE PRODUCTS
ENTERTAINMENT (E.G. MUSIC, BOOKS,
TV AND FILMS)
FINANCIAL PRODUCTS
(E.G. INSURANCE)
AMAZON 9% 19% 19% 15% 13% 27% 6%AT THE WEBSITE OF THE BRAND I WANT (E.G. NIKE, DYSON, CLINIQUE, APPLE) 6% 14% 6% 20% 7% 8% 13%COMPARISON SITES (E.G. SKYSCANNER, COMPARE THE MARKET, TRIVAGO) 2% 2% 2% 2% 2% 2% 9%IN VIDEO GAMES 1% 1% 1% 1% 1% 1% 1%MERCADO LIBRE 3% 5% 4% 5% 4% 5% 2%METAVERSE 0% 1% 0% 0% 0% 0% 1%NA 8% 3% 3% 2% 15% 3% 7%OTHER 4% 4% 4% 3% 3% 3% 10%OTHER MARKETPLACES (E.G. EBAY, ALIBABA, GUMTREE) 5% 8% 8% 10% 5% 8% 4%RETAILER SITES (E.G. LARGE RETAILERS SUCH AS JOHN LEWIS, JD SPORTS, TESCO, ARGOS) 10% 14% 13% 20% 7% 7% 5%RETAILERS' MOBILE APPS 5% 5% 6% 5% 4% 4% 6%SECOND-HAND SITES 1% 1% 1% 2% 1% 1% 1%SOCIAL MEDIA SITES (E.G. FACEBOOK PINTEREST, INSTAGRAM, SNAPCHAT) 3% 6% 4% 5% 4% 6% 4%STREAMING (E.G. VIA SPOTIFY, VIDEOLAND, NETFLIX) 1% 1% 1% 1% 1% 14% 1%VIA AN AGGREGATOR / DELIVERY APP (E.G. UBER EATS, DELIVEROO, EXPRESS GROCERY APPS) 8% 2% 4% 2% 2% 2% 2%I NEVER BUY THIS PRODUCT ONLINE 34% 15% 23% 7% 31% 9% 29%

81
GARDEN PRODUCTS
GROCERY (E.G. FOOD
AND DRINK)
HEALTH AND PHARMACEUTICAL
HOME FURNISHINGS
LUXURY (E.G. HIGH-END
CLOTHING, WATCHES, JEWELERY, BAGS, ART)
MOBILE DATA/AIRTIME
AMAZON 19% 10% 13% 18% 14% 9%AT THE WEBSITE OF THE BRAND I WANT (E.G. NIKE, DYSON, CLINIQUE, APPLE) 6% 8% 13% 10% 18% 16%COMPARISON SITES (E.G. SKYSCANNER, COMPARE THE MARKET, TRIVAGO) 2% 2% 2% 2% 2% 3%IN VIDEO GAMES 1% 1% 1% 1% 1% 1%MERCADO LIBRE 7% 2% 3% 7% 5% 3%METAVERSE 1% 1% 1% 1% 0% 1%NA 8% 3% 4% 4% 7% 7%OTHER 3% 5% 6% 3% 3% 10%OTHER MARKETPLACES (E.G. EBAY, ALIBABA, GUMTREE) 7% 7% 6% 9% 7% 4%RETAILER SITES (E.G. LARGE RETAILERS SUCH AS JOHN LEWIS, JD SPORTS, TESCO, ARGOS) 10% 16% 12% 15% 12% 6%RETAILERS' MOBILE APPS 4% 7% 6% 5% 4% 10%SECOND-HAND SITES 1% 1% 1% 2% 2% 1%SOCIAL MEDIA SITES (E.G. FACEBOOK PINTEREST, INSTAGRAM, SNAPCHAT) 4% 4% 4% 5% 5% 5%STREAMING (E.G. VIA SPOTIFY, VIDEOLAND, NETFLIX) 1% 1% 1% 1% 1% 2%VIA AN AGGREGATOR / DELIVERY APP (E.G. UBER EATS, DELIVEROO, EXPRESS GROCERY APPS) 2% 16% 5% 2% 1% 2%I NEVER BUY THIS PRODUCT ONLINE 25% 19% 25% 17% 22% 21%

82
MOTORS AND ACCESSORIES (E.G. SEAT COVERS, HUBCAPS, SATNAV)
PET CARE
SECOND-HAND
PRODUCTS
TECHNOLOGY (E.G. SMART PHONES,
TABLETS, COMPUTERS, HEADPHONES)
TOYS (E.G. BOARD
GAMES, SOFT TOYS)
TRAVEL AND
GETAWAYS
UTILITIES/PREPAID
(E.G. ENERGY BILLS, INSURANCE POLICIES)
WHITE GOODS
AMAZON 18% 18% 8% 25% 28% 6% 8% 19%AT THE WEBSITE OF THE BRAND I WANT (E.G. NIKE, DYSON, CLINIQUE, APPLE) 8% 7% 4% 16% 7% 12% 13% 10%COMPARISON SITES (E.G. SKYSCANNER, COMPARE THE MARKET, TRIVAGO) 2% 2% 2% 3% 2% 24% 6% 2%IN VIDEO GAMES 1% 1% 1% 1% 2% 1% 1% 1%MERCADO LIBRE 9% 6% 7% 9% 9% 2% 2% 8%METAVERSE 1% 1% 1% 1% 1% 1% 1% 1%NA 8% 10% 6% 2% 6% 6% 7% 4%OTHER 3% 4% 3% 2% 2% 8% 11% 3%OTHER MARKETPLACES (E.G. EBAY, ALIBABA, GUMTREE) 8% 6% 13% 8% 9% 6% 4% 8%RETAILER SITES (E.G. LARGE RETAILERS SUCH AS JOHN LEWIS, JD SPORTS, TESCO, ARGOS) 7% 9% 4% 13% 9% 7% 6% 17%RETAILERS' MOBILE APPS 3% 4% 3% 5% 3% 5% 8% 5%SECOND-HAND SITES 2% 1% 18% 1% 2% 1% 1% 1%SOCIAL MEDIA SITES (E.G. FACEBOOK PINTEREST, INSTAGRAM, SNAPCHAT) 4% 5% 10% 4% 5% 6% 4% 4%STREAMING (E.G. VIA SPOTIFY, VIDEOLAND, NETFLIX) 1% 1% 1% 1% 1% 1% 1% 1%VIA AN AGGREGATOR / DELIVERY APP (E.G. UBER EATS, DELIVEROO, EXPRESS GROCERY APPS) 1% 3% 2% 1% 2% 2% 2% 2%I NEVER BUY THIS PRODUCT ONLINE 25% 24% 17% 10% 14% 14% 25% 15%

83
With so much international and political focus on the environment and sustainability, we wanted to take a look at this topic through a commercial lens. Just how much does sustainability impact buying behavior, and upon which sustainability criteria are consumers judging retailers and brands?
SECTION 7:SUSTAINABILITY

84
CHAPTER 1: CONSUMERS ARE DEMANDING BETTER SUSTAINABILITY PRACTICES
This year, 68% of global consumers said they wished retailers and brands offered better environmental practices – a slight fall versus the 71% who said the same last year.
When it comes to the amount of packaging used for online purchases, this is something that 68% of online shoppers wish could be improved. Online retailers should also look into areas of their sites where reselling or second-hand goods can be sold – this was something seen as desirable by 62% of consumers.
When it comes to actually making their purchases, 65% of consumers said that ethics and morals play an important part in their decision, again a slight decrease on the 67% who said the same last year.
And it would appear that retailers and brands should be putting sustainability at the core of their offering. Why? Because 61% of global consumers said they like to shop with brands who have a purpose that goes beyond just selling services and products, while 60% said that they actively choose retailers and brands that are environmentally friendly.
While we might have assumed it is the youngest consumers who are driving this number, in fact, the percentage of consumers for whom this is important is relatively consistent across all age groups.
But what about across countries?
65% OF GLOBAL CONSUMERS SAID THAT ETHICS AND MORALS PLAY AN IMPORTANT ROLE IN THEIR ONLINE PURCHASE DECISION MAKING
61% OF GLOBAL SHOPPERS SAID THEY LIKE TO SHOP WITH BRANDS AND RETAILERS WHO HAVE A PURPOSE WHICH GOES BEYOND JUST SELLING PRODUCTS AND SERVICES
I ACTIVELY CHOOSE COMPANIES / BRANDS THAT ARE ENVIRONMENTALLY RESPONSIBLE
01 THAILAND 83%02 INDONESIA 82%03 INDIA 81%04 UNITED ARAB EMIRATES 75%05 CHINA 71%06 COLOMBIA 71%07 BRAZIL 69%08 MEXICO 68%09 SOUTH AFRICA 67%10 SPAIN 60%11 UNITED STATES 58%12 ARGENTINA 54%13 FRANCE 47%14 AUSTRALIA 46%15 GERMANY 46%16 UNITED KINGDOM 43%17 JAPAN 38%18 NETHERLANDS 32%

85
CHAPTER 2: SUSTAINABILITY, THE ENVIRONMENT AND DELIVERY
But do these findings stand up to scrutiny?
If you’ve read other sections in this report, you’ll know that consumers are increasingly demanding faster and more convenient delivery, whilst also demanding great availability and free returns, all the while over-ordering with the intention of sending products back.
Is this a case of consumers wanting it all? It would seem that way, and this poses a challenge to businesses… how can they support the myriad, often conflicting, demands of today’s consumers?
Take for instance the stats around what consumers would improve about the delivery experience. 48% demanded faster delivery, while just half of this (24%) wanted their deliveries to consider the environment more.

86
CHAPTER 3: WHAT HAPPENS WHEN CONSUMERS CAN CHOOSE?
And what about when the consumer can choose how environmentally friendly their deliveries are, using, for example, Amazon Day Delivery or the local alternative? In total, 43% of consumers claim to have opted for these environmentally friendly delivery options – up from 34% last year – demonstrating that retailers and brands should be offering these options. In the UK it was 38% and in the US it was 54%.
When the power to make better decisions is in the hands of the consumer, the table on page 85 shows which countries are most likely to make these decisions:
And who is seen as being best-in-class when it comes to these environmentally friendly options? Once again it is the lead marketplaces in each region that are seen as best.
01 THE LEAD MARKETPLACE IN REGION (E.G. AMAZON, TMALL, MERCADO LIBRE) 33%
02 NONE OF THESE ARE THE BEST AT THIS 24%
03 RETAILERS ARE THE BEST AT THIS (E.G. JOHN LEWIS, JD SPORTS, ARGOS) 11%
04 OTHER MARKETPLACES ARE BEST AT THIS 11%
05 INDIVIDUAL BRANDS ARE THE BEST AT THIS (E.G. NIKE, DYSON, APPLE) 7%
06 VOICE COMMERCE (E.G. VIA AMAZON ALEXA) 6%
07 VIA AN AGGREGATOR / DELIVERY APP (UBER EATS, DELIVEROO) 4%
08 SOCIAL PLATFORMS (E.G. FACEBOOK) 3%
09 MESSAGING PLATFORMS (E.G. WHATSAPP, WECHAT) 1%
WHICH CHANNELS OFFER THE BEST ENVIRONMENTALLY FRIENDLY OPTIONS

87
EXPERT OPINION:WHY HAVING THE RIGHT SUSTAINABLE STRATEGY IS VITAL FOR THE SURVIVAL OF OUR PLANET AND FOR YOUR BUSINESS
Businesses are leaving profit on the table by failing to invest in sustainability. When it comes to digital commerce, the opportunities are vast and cover both bottom-line improvements, as well as top-line growth.
From a bottom-line perspective, we have proven that intelligent business optimization can generate significant efficiencies through the application of AI to packaging and logistics. We are seeing double-digit percentage improvements for clients, increased margins, and significant reductions in waste and GHG (greenhouse gas) emissions from these solutions.
From a top-line perspective, our report highlights the importance of transparency and access to sustainability information throughout the shopping journey to motivate sustainable choices, and drive preference and willingness to pay amongst consumers. Businesses have a unique opportunity to differentiate their brands and products by articulating investments into sustainability programs in ways that are more relatable for the consumer.
From our work with Vaayu, the clean tech company changing how carbon footprint is measured and tracked in retail, we have seen brands gain an advantage through simple nudges like carbon labeling, clearly sign-posted delivery options and showcasing the impact of returns on the environment.
These solutions prove that taking a sustainable approach to commerce is good for business, good for consumers, and good for the planet.
RUTH ZOHRERGLOBAL CHIEF CLIENT SUCCESS OFFICERWUNDERMAN THOMPSON COMMERCE

88
KEY THOUGHTS ■ In the past, retailers have been able to hide behind claims that consumer demands
for better sustainability are largely just talk. They pointed to facts like the majority of online shoppers are still clamoring for faster and more convenient delivery, regardless of environmental impact.
■ What we’re seeing now is that, when given the choice, more and more consumers will take the greener option. A clear majority want to see improvements in areas like plastic packaging, the expansion of the circular economy and so on. Most shoppers said they already actively choose who to buy from based on their environmental practices.
■ Brands and retailers can conclude from this that consumers are seeking and waiting for better sustainable options. When they are offered them, they will take them. Rather than just being talk, shoppers are waiting for businesses to match up to their environmental expectations.
Those that do shape up can build a major competitive advantage.
To find out how to bring your environmental practices up to speed, speak to Ruth Zohrer, Global Chief Client Success Officer, Wunderman Thompson Commerce: [email protected]
Find out more about our Sustainable Commerce Practice here.

89
Technology and commerce wait for no one, and there are constant innovations, developments and changes taking place. We wanted to gauge the appetite for innovation and technology from consumers.
SECTION 8:NEW CHANNELS, TECHNOLOGIES, AND THE FUTURE

90
CHAPTER 1: CONSUMERS WANT DIGITAL INNOVATION
We saw earlier in the experience section, that many consumers will not shop with retailers or brands who do not meet their expectation. So, what are their expectations?
64% of global consumers said they wish brands and retailers would be more innovative in how they use digital technology to improve their experiences. And this view is backed up by 59% who said that if a brand or retailer is digitally innovative, then they are more likely to purchase from them.
So, let’s take a look at some of the areas of innovation that will impact shopping in the future:
CHAPTER 2: THE FUTURE OF PAYMENTS
One of the key friction points in physical shopping has always been paying, and the associate queuing. 58% of consumers said they were excited about cashless payments, and 64% said they were excited about stores where you don’t have to queue to pay (like Amazon Go).
And when it comes to new store formats like Amazon Go, and the Amazon 4-Star store, 56% of global consumers said they were excited by them.
Seemingly, consumers are also happy to use more innovative ways of paying, too, with half (50%) saying they liked the idea of being able to make payments using parts of their body like their face, palms and eyes.
When it comes to online payments, almost half (47%) of global consumers wished that more online businesses accepted cryptocurrencies as a payment method.

91
CHAPTER 3: FRAUDS AND SCAMS
With more connected devices, omni-channel retailing, and generally more data, there is a sense amongst consumers that their personal data is at risk and that they could be victims of frauds and scams.
For instance, 65% said they are more concerned about the possibilities of being hacked via connected devices, while 71% said they were concerned about the increased rates of fraud and the prevalence of online scams.
And what about the issues of deep-faking, i.e. creating convincing images, audio and video hoaxes via AI? Nearly two-thirds (61%) said they were worried about AI and deep-faking on their ability to judge what is real or fake online.
CHAPTER 4: GAMING AND THE METAVERSE
The world of gaming has seen a huge rise in importance since the outbreak of the COVID-19 pandemic, offering consumers a fantastic way to socialize with friends. And for the last couple of years, we’ve been tracking its progress as a sales channel.
But let’s start by first quantifying the opportunity, because a huge 86% of consumers said they play video games. The number one gaming channel is mobile phones (66%).
Of those that game, 62% said that they spend money within these games, up from 59% in 2021.
VIRTUAL REALITY HEADSETS
12%12+88+0
NONE OF THE ABOVE
2%2+98+0
MOBILE PHONE
66%66+34+0
COMPUTER
45%45+55+0
CONSOLE
34%34+66+0
WHERE DO CONSUMERS PLAY VIDEO GAMES?
PERCENT OF SHOPPERS THAT SAID THEY SPEND MONEY IN GAME
16-24 69%25-34 72%35-44 63%45-54 47%55-64 27%65+ 16%

92
PERCENT OF SHOPPERS THAT SAID THEY SPEND MONEY IN GAME
AUSTRALIA 51% CHINA 82% INDIA 76% INDONESIA 72% JAPAN 51% THAILAND 80% FRANCE 42% GERMANY 56% NETHERLANDS 55% SPAIN 55% UNITED KINGDOM 48% ARGENTINA 58% BRAZIL 63% COLOMBIA 65% MEXICO 67% SOUTH AFRICA 58% 71% UNITED STATES 64%
One of the main reasons for this increased expenditure through gaming, is the blurring of lines between our physical and digital selves.
As we spend more time in the digital world, our digital selves become more important – so much so that the concept of buying products for our digital selves must now be taken seriously by businesses, brands and retailers. Our data tells us that 60% of consumers would be interested in buying the same products for themselves and for their avatars, again showing rise from the 2021 figure of 56%.
And when we look back at our customer journey data, we can see gaming playing a greater role, with 6% of global shoppers saying they get inspiration about what to buy through gaming. It’s not a surprise, however, that it is with 16-24-year-olds that gaming provides most inspiration.
For more information about gaming commerce, take a look at our infographic here.
PERCENT OF SHOPPERS BY AGE THAT USE GAMING FOR INSPIRATION
16-24 11%25-34 7%35-44 5%45-54 3%55-64 1%65+ 0%
UNITED ARAB EMIRATES

93
EXPERT OPINION:WHY GAMING IS MORE THAN A GAME
We have seen a huge increase in the number of consumers playing video games over the last few years, with gaming moving from purely entertainment to a new form of socializing. It should come as no surprise, then, that gaming is fast becoming one of the most important channels for marketing and advertising globally – especially in the retailer sector. In fact, a huge 86% of online shoppers now play video games. That’s a massive number and one that spans multiple age groups, not just young people. Not only are the number of shoppers that game high, but 62% of those consumers also spend money in game! One thing you can take from this data on gaming is that gaming should start to become part of your overall commerce strategy sooner rather than later.
NAJI EL-ARIFIHEAD OF INNOVATIONWUNDERMAN THOMPSON COMMERCE

94
CHAPTER 5: REDEFINING THE CONSUMER
What’s clear is that the traditional definition of a consumer needs to be reconsidered. And if you’re not convinced of this, get familiar with the metaverse! But is it all talk, or is this really a channel for the future? Let’s take a look…
One of the most surprising stats from this year’s Future Shopper report is the percentage of consumers who claim to have made, or be making purchases online, via the metaverse – a staggering 23%.
But it looks like quite a large number of consumers still need convincing, with 38% saying they do not intend to use the metaverse for purchasing online.
In fact, one of the questions that we’ve been asking ourselves is “do you even need to be alive to make a purchase?” AI, linked to a bank account, mining commerce data from across consumers’ lifetimes could very effectively make purchase decisions for consumers who are no longer alive, allowing them to continue to support families and friends, for instance, buying birthday, anniversary, wedding and graduation gifts.
But is this really something that consumers would be interested in? The answer for 47% of global consumers is “yes” – up from 44% last year.
47% OF GLOBAL SHOPPERS SAID THEY WOULD BE INTERESTED IN SHOPPING FROM BEYOND THE GRAVE
23% OF GLOBAL CONSUMERS SAID THEY HAVE USED OR ARE USING THE METAVERSE TO MAKE PURCHASES ONLINE
I WOULD BE INTERESTED IN THE ABILITY TO SPEND FROM BEYOND THE GRAVE, FOR INSTANCE FOR ONGOING SUPPORT FOR MY FAMILY (AKA POST-DEATH CONSUMERISM)
01 THAILAND 78%02 INDIA 72%03 UNITED ARAB EMIRATES 70%04 INDONESIA 68%05 SOUTH AFRICA 60%06 COLOMBIA 51%07 MEXICO 50%08 CHINA 50%09 UNITED STATES 50%10 BRAZIL 47%11 NETHERLANDS 41%12 SPAIN 38%13 ARGENTINA 36%14 FRANCE 33%15 JAPAN 33%16 GERMANY 32%17 AUSTRALIA 31%18 UNITED KINGDOM 31%

95
A third of consumers (33%) claim to either be using, or having used, programmatic commerce in the past, while 20% said they intend to use this technology in the future. So, it would certainly appear that programmatic commerce has a future.
And what about the usage of AI when it comes to making product recommendations? 35% of consumers claim to have used this to make purchases.
AGE GROUPI CURRENTLY USE THIS
ORDERING SERVICE
I HAVE NEVER USED THIS ORDERING SERVICE
AND AM UNSURE IF I WILL IN THE FUTURE
I HAVE NEVER USED THIS ORDERING SERVICE
AND DO NOT INTEND TO IN THE FUTURE
I HAVE NEVER USED THIS ORDERING SERVICE
BUT INTEND TO IN THE FUTURE
I HAVE USED THIS ORDERING SERVICE
IN THE PAST
16-24 22% 16% 15% 25% 22%25-34 28% 13% 17% 21% 21%35-44 24% 15% 24% 20% 18%45-54 17% 16% 36% 18% 12%55-64 11% 20% 48% 15% 7%
65+ 7% 17% 64% 9% 4%
35% OF CONSUMERS CLAIM TO HAVE USED AI TOOLS TO HELP THEM MAKE ONLINE PURCHASES
HOW DO PEOPLE FEEL ABOUT SHOPPING VIA A SMART ASSISTANT?
CHAPTER 6: ZERO UI, VOICE AND SUBCONTRACTING PURCHASE DECISION MAKING
Let’s start with voice commerce and smart assistants.
For a long time, we’ve been talking about zero UI (using interfaces that have no screens) and how consumers are increasingly adopting these forms of interaction with the online world.
At the same time, we’ve witnessed the penetration of smart devices in homes grow, too. But what’s really interesting for us, is, what this means for commerce.
40% said they have used smart assistants to make purchases online. This continues the rise that we’ve seen over the last couple of years. In 2020 this figure was 27%, while in 2021 the figure was 38%. A further 20% intend to use smart assistants and voice ordering in the future.
But there are other zero UI devices, too, for instance machines that automatically re-order products on behalf of their consumers aka “Programmatic Commerce™”. While we’ve been talking about this for some time, what impact are these devices having on consumer behaviors?

96
CHAPTER 7: SUBSCRIPTIONS
There has been a great deal of discussion over the success (or not) of subscription services. Superficially, our data appears inconclusive in telling us just how successful they are. For instance, this year, 57% of global consumers said they had a subscription, rising from 44% in 2021. However, this is still below the 68% who said they had a subscription back in 2020.
Arguably, this fluctuation is testament to the development – and challenges – in recent years of the subscriptions industry which has experienced both higher costs of acquisition and higher churn rates, whilst also attracting the likes of retail giants such as Amazon. (Notably, Amazon’s Subscribe & Save service has the highest overall subscription rate in the industry today). Whilst this makes it a more difficult arena for brands and retailers to compete in, it should mean a better experience for consumers.
The UAE (79%) and India (75%) lead the way with the highest percentage of consumers with a subscription, while South Africa (42%) and Japan (39%) have the fewest.
What this data also tells us quite clearly is that, irrespective of where you are in the world, a large proportion of consumers have subscriptions. How many? The highest percentage of consumers have just one subscription (22%), while 2% said that have over 7.
CHAPTER 8: NFTS
In the last year, the acronym NFT has entered popular vernacular. Many may have heard it, but probably not that many know that itʼs an abbreviation of “non-fungible token”, and even fewer actually know what that means.
Or do they? We asked consumers if they knew what an NFT was, and 47% said yes, higher than we might have predicted.
Of those who knew what an NFT was, we wanted to know if they would be happy to spend money on one – and 70% said yes.
Once again, it is India leading the way with NFTs, with 88% of consumers who know what they were saying they would happily buy one, followed by 84% in China. The lowest percentage came from the UK (46%) followed by Australia (49%).

97
EXPERT OPINION:WHAT IS AN NFT AND WHY SHOULD WE CARE?
NFT stands for “Non-Fungible Tokenˮ and relates to the ability to, for lack of a better word, sign a digital item with ownership. At the minute they are being mainly used for art, with users being able to “own” a piece of digital art. This is of course a starting point, but there is no reason why it can’t be used for IDs and ownership of a loyalty scheme. It is still the early days of this technology and, personally, I find that there is a lot of noise with not enough focus on the strategy behind using the technology. Therefore, it is important to understand the technology and not rush headfirst into something that you won’t end up supporting for a long time. Ask yourself, why do you want an NFT? What will you use it for? What chain should it be on? What added value will you give the owner of the NFT? Can you as a business hold cryptocurrency or will a 3rd party have to? Will you combine the NFT with a smart contract, so the NFT goes above and beyond purely ownership? So many questions arise with new technology early in the lifecycle, but with so many people talking about it, you should 100% keep your eye on this one.
NAJI EL-ARIFIHEAD OF INNOVATIONWUNDERMAN THOMPSON COMMERCE

98
KEY THOUGHTS ■ Many businesses put innovation in technologies in the ‘nice-to-have’ category. But there
are at least two very good reasons why innovation should be considered a priority. One is that, as our research has shown, consumers actively want the brands they shop with to be more innovative with technology, and will make purchasing decisions on that basis. The other is that you can guarantee some of your rivals will be pushing the envelope on innovation. And with today’s relentless pace of technological change, you can quickly lose ground.
■ There’s a lot of emerging technology to choose from that will add to your business in different ways. From new payment technologies and AI that speed up and streamline the customer journey, to areas like gaming, the metaverse, and NFTs, that represent whole new digital markets, there are important choices to make in terms of the technologies that will create the biggest opportunities for your business.
Speak to Naji El-Arifi, Head of Innovation, Wunderman Thompson Commerce: [email protected] to get expert advice on the right tech choices for your business today and in the future.

99
CONCLUSIONIf we roll back the clock to when we first launched our Future Shopper reports 5 years ago, it’s astounding how much has changed in the world of commerce in such a short space of time.
Back then, the overwhelming majority of retail spend still went through physical stores, not online channels. When consumers made a purchase online, they were happy if their goods arrived in a matter of days, never mind a couple of hours.
Concepts like buying on social media or through a smart voice assistant were in their infancy, fanciful and futuristic to most consumers. Now they are an established part of the commerce fabric.
By contrast, today’s emerging trends include growing demand for digital downloads and brand-new digital products like NFTs. Online gaming and the metaverse, meanwhile, are changing the entire concept of who consumers are, as more and more people spend money on their digital as well as their physical selves.
From the perspective of a few short years ago, we might say that the future of shopping has already arrived. Change has noticeably been accelerated by events of the past couple of years, driving people to rely on digital technology more and more.
But what is clear when we talk about ‘the Future Shopper’ is that we are not speaking about trends that may or may not occur decades down the line. We’re talking about forces that are already very much in motion and that are set to have a big influence on retail in the near future.
Our findings show that consumers are very much ready and eager for the future of commerce to unfold. They intend to use digital more and more, they want more digital products and services, they want brands and retailers that are digitally innovative.
They want speed, they want efficiency, they want omni-channel flexibility, they want excellence in service. They even want to be entertained as they shop. And with an entire digital metaverse to explore, and they will be happy to shop around until they find it.
That is the gauntlet laid down to brands and retailers. It’s up to them to start delivering the future of commerce, now.

100

101
ECOMMERCE PLATFORM TECHNOLOGYDeploying and integrating best-in-class technology to support your eCommerce operations.
Through the implementation of world-leading commerce platforms underpinned by future-ready technologies, we’re able to support the most ambitious client strategies. We’ve been doing this for more than 30 years – with hundreds of successful eCommerce implementations to our name, including the world’s largest fashion and B2B platforms and grocery replatform. READ MORE
MARKETPLACE STRATEGY AND MANAGEMENTSupporting and advising brands on how to increase results globally, at scale, on Amazon, Tmall and other online marketplaces.
Wunderman Thompson Commerce is the leading provider of global eCommerce marketplace services and the founding partner of the WPP ACE, a Center of Excellence for Amazon. We run the largest global consultancy helping brands succeed on Amazon, Tmall and other marketplaces. Today, we’re supporting more than 150 brands, and generating more than $10bn annually for clients on marketplaces. READ MORE
SOCIAL COMMERCE Helping businesses nail their end-to-end social presence via social commerce.
Social platforms have evolved and consumers can now buy through the likes of Instagram and Facebook, so brands and retailers need to master their social commerce journeys to win over their audience on this vital channel. Our service supports your business’s end-to-end social commerce experience, and covers everything you need to nail your social presence, comprising 5 key capabilities areas to offer a best-in-class approach to social commerce. READ MORE
SHOPPER MARKETINGCreating seamless consumer experiences to drive commerce in physical or digital retail.
We help organizations to create seamless consumer experiences that drive commerce opportunities at physical or digital retail environments through a variety of specialist services. READ MORE
ECOMMERCE STRATEGYAs a growth partner, we help retailers and brands strategize for high-performance eCommerce through a suite of proven end-to-end services.
We help enterprise-level organizations to transact more business online by designing and implementing high-performance, future-ready digital strategies. This starts with defining a balanced multichannel strategy, aligned to your vision, and the planning of high-performance eCommerce solutions to support your growth ambitions and customer journeys. READ MORE
INNOVATION AND FUTURE-READY TECHNOLOGYReviewing, testing, and deploying innovative technologies and solutions to keep businesses ahead and future-ready.
We explore, recommend and implement workable innovation, testing ideas, methodologies and leading-edge technologies to help businesses shape their own future and stay ahead. After all, how can you navigate the future of eCommerce without an understanding of the tech and trends shaping it? READ MORE
Connect with our Strategy Director in Europe, Krantik Das or our Chief Strategy Officer in North America, Adam Brown.
Connect with the Head of WPP’s Center of Excellence for Amazon in Europe, Helmut Rieder or Aimee Pierce, VP Business Development in NA. Connect with our Head of Innovation, Naji El-Arifi.
Connect with our Head of Social, Chloe Cox.
Connect with our Group Account Director, Todd Hudgens.Connect with our Global CTO, Glen Burson.
HOW WE CAN HELP

102
CREATIVE SERVICES INC. DESIGN & BUILDInspiring powerful online CX and industry-leading websites.
We see the combination of creative inspiration with frictionless CX as the critical agent of change. We combine qualitative & quantitative insights to create interfaces that exceed expectations. We create design systems for consistency, speed-to-market and best practice governance; and pixel perfect visual designs to front-end build, including websites, mobile sites, app and more. READ MORE
MANAGED SERVICES: PEAK SELLING SUPPORTProtecting your most important business asset – your eCommerce website – so you can focus on what you’re best at.
Our managed services and applications are tailored specifically to client requirements and budgets, so they can concentrate on their core business, assured of powerful eCommerce performance through the support of highly experienced teams, including commerce architects and software engineers. A key service is our peak operations support. As one of the leading authorities on peak selling, we support many of the biggest retailers through the Black Friday and holiday sales periods. READ MORE
DIGITAL INTELLIGENCEDelivering insight-driven change to help your business excel in the age of the customer.
Led by an expert team of implementation, data science and optimization analysts, we help multichannel organizations manage and interpret their data in order to support insight driven change. We also work with businesses to develop the tools and processes needed to become a data-led organization that gets results. READ MORE
COMMERCE DATA MANAGEMENTOptimizing the Path to Purchase for brands and helping consumers buy what they want, wherever they are shopping.
We make any channel shoppable, and create data-driven solutions to assist consumers’ ability to purchase the products they love. Feed Management and Commerce Director connect consumers to retailers’ and brands’ products, on any channel, to maximize sales. Our technology enables performance monitoring, benchmarking globally to deliver insight. READ MORE
EXPERIENCE – CUSTOMER & EMPLOYEECreating customer and employee experiences that engage and convert.
In putting the customer at the heart of every journey touchpoint, we design frictionless customer experiences that drive engagement, action and transaction. We understand the value of employee experience in driving the right experience for customers, and design the processes and digital interfaces to enable and empower them. READ MORE
PRODUCT EXPERIENCE MANAGEMENTOffering the best quality product content, published on every digital shelf, where consumers are browsing for products is vital for success.
We offer a full service to businesses looking for best in class product content organization, including delivery of the best PXM solutions, such as “Shelfmaster”, to help brands push the limits of their digital shelf. We partner with brands, retailers and distributors to help them improve their customer experience, product content processes and organizational needs to help them win on the digital shelf. READ MORE
Connect with our Experience Director, Rachel Smith.
Connect with our Head of Service Operations, Mario D’Cruz.Connect with our PIM/PXM Lead, Dennis Peek.
Connect with our Head of Data Analytics and Strategy, Adonis Themistokleous.
Connect with our Head of Commerce Data Management, Dwayne Manzano.Connect with our Head of UX & CX Consultancy, Mike Rokes or our Head of UI, Tom Lancaster.
HOW WE CAN HELP

©2022 Wunderman Thompson Commerce. All rights reserved. All company and product names, brands and symbols mentioned herein are brand names and/or registered trademarks of their respective owners.
ABOUT WUNDERMAN THOMPSON COMMERCE
At Wunderman Thompson Commerce we inspire people to transact.
Part creative agency, part consultancy and part technology company, we are unique in our ability to connect world-class strategic thinking and creative insight with deep executional capability across technology and operations to deliver winning commerce solutions across all major digital routes to market worldwide: marketplaces, online retailers, D2C, B2B and social commerce.
We are a diverse team of 1700+ commerce experts across more than 20 offices worldwide, who believe that growth through commerce begins with connected customer experiences that amplify the brand and drive business outcomes. We excel at orchestrating commerce touchpoints through intelligent deployment and integration of world class technology from strategic partners like Adobe, SAP, Salesforce, HCL, Shopify, BigCommerce & commerce tools, as well as driving sales from marketplaces (Amazon, Tmall and beyond) and retailers.
For more information on Wunderman Thompson Commerce, please visit us at www.wundermanthompson.com/service/commerce and follow us on Twitter, Facebook, LinkedIn, and Instagram.
For UK sales inquiries:
+44 (0)20 3858 0061
For European sales inquiries:
For North America sales inquiries:
206-641-7220
ABOUT GORILLA GROUP
Gorilla Group, a Wunderman Thompson company, is an award-winning Agency, Consultancy, and Tech Company. In one. Here, strategy, business intelligence, experience design, technology enablement, and support and growth services come together to create innovative, award-winning commerce experiences for enterprise B2B and direct-to-consumer brands across industries. Named a Leader in Digital Commerce Services by Forrester Research, we are aligned to help brands connect with their customers across the entirety of the customer journey, or at any point along the way.
For more information on Gorilla Group, please visit us at www.gorillagroup.com and follow us on Twitter, Facebook, and LinkedIn.
For Sales inquiries:
+1 888 601 2091