Older shopper types from store image factors
11
Older shopper types from store image factors Robert J. Angell a , Phil Megicks b , Juliet Memery c,n , Troy W. Heffernan b a Cardiff Business School, Cardiff University, Colum Drive, Cardiff, CF10 3EU, UK b Plymouth Business School, Plymouth University, Drake Circus, Plymouth, Devon, PL4 8AA, UK c The Business School, Bournemouth University, 89 Holdenhurst Road, Bournemouth, Dorset, BH8 8EB, UK article info Article history: Received 24 July 2013 Accepted 24 July 2013 Available online 14 August 2013 Keywords: Older shoppers Shopper typology Grocery shopping Store choice Cluster analysis abstract This study aims to characterise the older shopper by exploring unobserved heterogeneity within the segment and developing an older shopper typology from an empirically derived store image scale. Store attribute theory informed a two-stage research design. Firstly, a ‘pool’ of salient store attributes was identified through in-depth interviews. Scales were then developed and quantitatively tested using data collected through a household postal survey. Seven store image factors emerged, forming the basis of the typology. Five clusters were subsequently profiled using behavioural and demographic variables: Prudent neutrals, All-Round demanders, Reluctant casuals, Demanding sociables, and Affluent utilitarians. A discussion of the resultant classification's utility in terms of retail strategy, including opportunities for better targeting through adjustment of the retail offer, is presented. This study develops a store image scale that reflects the importance of store choice decisions of older shoppers, extending store image research by providing contemporary insights into the requirements of older shoppers in a changing retail environment. & 2013 Elsevier Ltd. All rights reserved. 1. Introduction Older consumers (60+ years) are now commanding greater academic and practitioner attention, with businesses and researchers recognizing that this group possesses the key characteristics to justify targeted selection in the marketplace (Chaston, 2011; Yoon et al., 2009). Official national statistics indicate that 23% of the UK popula- tion will be 65 years and above by 2034, an increase of 8% from 1984 (ONS, 2011). Retailers responsive and adaptable to the needs of older customers are thought able to leverage increased financial benefits from their considerable spending power (Thompson and Thompson, 2009). However, in order to do so effectively, retailers are increasingly being required to consider older consumers as a heterogeneous group (Yoon et al., 2009). Similarly, researchers are being encouraged to identify the similarities and differences in retail engagement (Lumpkin, 1985) within this segment, particularly unobserved hetero- geneity (Ahmad, 2002; Teller and Gittenberger, 2011). Despite limited research, many believe the current older generation to be significantly different from its predecessor (Myers and Lumbers, 2008; Thompson and Thompson, 2009) and, consequently, worthy of more attention and study. Yoon et al. (2009) investigated heterogeneity in older consu- mers on the basis of understanding how ageing affects consumer decision making. Through developing a person-context fit framework of consumer decision making they concluded that older people with greater consumer experience and expertise are often competent in making decisions. However where competence is affected by greater environmental demands older consumers may apply strategies to mitigate these effects i.e. they adapt themselves (Yoon et al., 2009), determined by emotional responses to situational conditions (Carstensen, 2006; Labouvie-Vief, 2009). Where it is not possible for such adaptations to take place there is a call for marketers to assist decision-making through the use of appropriate marketing mix tools, based on a profound understanding of consumer needs (Yoon et al., 2009) and recognition of the contextual factors which interact with age (Yoon et al., 2005). Consumer decision making styles can be characterised by the consumer typology approach (Sproles and Sproles, 1990). Classify- ing shoppers into subgroups by developing typologies has been, for several decades, a common procedure when modelling con- sumer heterogeneity (Reynolds et al., 2002). This has enriched the wider development of consumer behaviour, consumer decision- making and shopping theories, whilst enabling practitioner's greater scope for targeting and positioning strategies (Westbrook and Black, 1985). A number of studies have developed typologies on the basis of decision-making traits (for a literature review, see Mitchell and Bates, 1998). Sprotles and Kendall (1986) devised the Consumer Styles Inventory (CSI) for their studies of student shopper decision making traits in the US. Further studies applied this scale to test multi-cultural applications (Canabal, 2002; Contents lists available at ScienceDirect journal homepage: www.elsevier.com/locate/jretconser Journal of Retailing and Consumer Services 0969-6989/$ - see front matter & 2013 Elsevier Ltd. All rights reserved. http://dx.doi.org/10.1016/j.jretconser.2013.07.010 n Corresponding author. Tel.: +44 1202 968743. E-mail address: [email protected] (J. Memery). Journal of Retailing and Consumer Services 21 (2014) 192–202
-
Upload
independent -
Category
Documents
-
view
2 -
download
0
Transcript of Older shopper types from store image factors

Journal of Retailing and Consumer Services 21 (2014) 192–202
Contents lists available at ScienceDirect
Journal of Retailing and Consumer Services
0969-69http://d
n CorrE-m
journal homepage: www.elsevier.com/locate/jretconser
Older shopper types from store image factors
Robert J. Angell a, Phil Megicks b, Juliet Memery c,n, Troy W. Heffernan b
a Cardiff Business School, Cardiff University, Colum Drive, Cardiff, CF10 3EU, UKb Plymouth Business School, Plymouth University, Drake Circus, Plymouth, Devon, PL4 8AA, UKc The Business School, Bournemouth University, 89 Holdenhurst Road, Bournemouth, Dorset, BH8 8EB, UK
a r t i c l e i n f o
Article history:Received 24 July 2013Accepted 24 July 2013Available online 14 August 2013
Keywords:Older shoppersShopper typologyGrocery shoppingStore choiceCluster analysis
89/$ - see front matter & 2013 Elsevier Ltd. Ax.doi.org/10.1016/j.jretconser.2013.07.010
esponding author. Tel.: +44 1202 968743.ail address: [email protected] (J.
a b s t r a c t
This study aims to characterise the older shopper by exploring unobserved heterogeneity within thesegment and developing an older shopper typology from an empirically derived store image scale. Storeattribute theory informed a two-stage research design. Firstly, a ‘pool’ of salient store attributes wasidentified through in-depth interviews. Scales were then developed and quantitatively tested using datacollected through a household postal survey. Seven store image factors emerged, forming the basis of thetypology. Five clusters were subsequently profiled using behavioural and demographic variables: Prudentneutrals, All-Round demanders, Reluctant casuals, Demanding sociables, and Affluent utilitarians. Adiscussion of the resultant classification's utility in terms of retail strategy, including opportunities forbetter targeting through adjustment of the retail offer, is presented. This study develops a store imagescale that reflects the importance of store choice decisions of older shoppers, extending store imageresearch by providing contemporary insights into the requirements of older shoppers in a changing retailenvironment.
& 2013 Elsevier Ltd. All rights reserved.
1. Introduction
Older consumers (60+ years) are now commanding greateracademic and practitioner attention, with businesses and researchersrecognizing that this group possesses the key characteristics to justifytargeted selection in the marketplace (Chaston, 2011; Yoon et al.,2009). Official national statistics indicate that 23% of the UK popula-tion will be 65 years and above by 2034, an increase of 8% from 1984(ONS, 2011). Retailers responsive and adaptable to the needs of oldercustomers are thought able to leverage increased financial benefitsfrom their considerable spending power (Thompson and Thompson,2009). However, in order to do so effectively, retailers are increasinglybeing required to consider older consumers as a heterogeneous group(Yoon et al., 2009). Similarly, researchers are being encouraged toidentify the similarities and differences in retail engagement(Lumpkin, 1985) within this segment, particularly unobserved hetero-geneity (Ahmad, 2002; Teller and Gittenberger, 2011). Despite limitedresearch, many believe the current older generation to be significantlydifferent from its predecessor (Myers and Lumbers, 2008; Thompsonand Thompson, 2009) and, consequently, worthy of more attentionand study.
Yoon et al. (2009) investigated heterogeneity in older consu-mers on the basis of understanding how ageing affects consumer
ll rights reserved.
Memery).
decision making. Through developing a person-context fit frameworkof consumer decision making they concluded that older people withgreater consumer experience and expertise are often competent inmaking decisions. However where competence is affected by greaterenvironmental demands older consumers may apply strategies tomitigate these effects i.e. they adapt themselves (Yoon et al., 2009),determined by emotional responses to situational conditions(Carstensen, 2006; Labouvie-Vief, 2009). Where it is not possible forsuch adaptations to take place there is a call for marketers to assistdecision-making through the use of appropriate marketing mix tools,based on a profound understanding of consumer needs (Yoon et al.,2009) and recognition of the contextual factors which interact withage (Yoon et al., 2005).
Consumer decision making styles can be characterised by theconsumer typology approach (Sproles and Sproles, 1990). Classify-ing shoppers into subgroups by developing typologies has been,for several decades, a common procedure when modelling con-sumer heterogeneity (Reynolds et al., 2002). This has enriched thewider development of consumer behaviour, consumer decision-making and shopping theories, whilst enabling practitioner'sgreater scope for targeting and positioning strategies (Westbrookand Black, 1985). A number of studies have developed typologieson the basis of decision-making traits (for a literature review, seeMitchell and Bates, 1998). Sprotles and Kendall (1986) devisedthe Consumer Styles Inventory (CSI) for their studies of studentshopper decision making traits in the US. Further studies appliedthis scale to test multi-cultural applications (Canabal, 2002;

R.J. Angell et al. / Journal of Retailing and Consumer Services 21 (2014) 192–202 193
Fan and Xiao, 1998; Lysonski et al., 1996), however many ofthese investigations also used student samples and there is littleevidence of the CSI being applied to older age segments. Theapplicability of a scale designed with a view to younger consumershas obvious limitations, particularly as the language used anddominant resultant typologies (Chase et al., 2007) are unlikely toreflect older consumer's experiences and language, and thereforescales for specialist population segments are recommended(Mitchell and Bates, 1998).
An alternative approach to establishing shopper typologies hasbeen built on the solid foundations of store attribute theory in whichconsumers form an assessment of a retail store by ascribing variedlevels of importance to components of its wider formation—otherwiseknown as store image (Bellenger et al., 1977; Darden and Ashton,1975; Ganesh et al., 2007; Karande and Ganesh, 2000). Consequently,theories of store image have retained an established position inretailing and shopping theory, where the emphasis has predomi-nantly been on the classification of store image attributes and factors(Kunkel and Berry, 1968; Lindquist, 1974–1975; Martineau, 1958;Zimmer and Golden, 1988). Whilst a handful of seminal studies haveboth formed the foundations of, and enriched, a plethora of empiricalinvestigations, it is unknown how robust these theories stand whenapplied (1) in contemporary retail settings, and (2) with specificgroups of consumers. The latter issue is progressively important withresearchers stressing the need for greater illumination of smaller andmore defined segments (e.g. Breazeale and Lueg, 2011; Reynolds et al.,2002).
The current study is positioned in the UK grocery sector. As theprevious comments demonstrate, a new distinct store image scale isrequired in order to measure the attributes that match olderconsumer's distinctive shopping ‘needs’ and ‘wants’ (see Goodwinand Mcelwee, 1999; Lambert, 1979; Meneely et al., 2009; Pettigrewet al., 2005). A combination of ‘store image’ and ‘older consumer’research informs the empirical development of a new scale, which issubsequently used to satisfy the requirement for an age-basedtypology, namely for older shoppers (Breazeale and Lueg, 2011;Sudbury and Simcock, 2009). This builds upon previous researchwithin this context that has focused on a creating a qualitativetypology from the literature and in-depth interviews (Angell et al.,2012). This extends this work using a more rigorous and scientificprocedure.
This article begins by reviewing both shopper typology andstore image literature before presenting the empirical researchprocess employed in this study. A series of conclusions are drawnfrom the findings, providing implications for theory, retail practiceand future research.
2. Conceptual background
2.1. Shopper types
A number of studies have successfully constructed shopper typol-ogies in a range of settings (Bellenger and Korgaonkar, 1980; Dardenand Reynolds, 1971; Reynolds et al., 2002), utilising a mixture ofmethods (Moschis, 1976; Westbrook and Black, 1985) and samplinggroups (Arnold and Reynolds, 2003; Breazeale and Lueg, 2011). Theearliest example of customer profiling originates in the work of Stone(1954) who identified different types of urban shopper. This trendcontinued in the work of other researchers who used motivationalattributes as the basis for segmentation (e.g. Guiot and Roux, 2010;Jarratt, 1996; Reynolds and Beatty, 1999; Tauber, 1972; Westbrook andBlack, 1985). In variations of this approach, other studies have usedstore image attributes as an alternative to motivational items with theintention of locating aspects of the store having higher (or lower)importance to different customers (Hansen and Deutscher, 1977–1978;
Memery et al., 2012; Reynolds et al., 2002). The objective is to classifyshoppers into meaningful groups by assessing variations in a series offocal attributes. For instance, Reynolds et al. (2002) identified sixtraditional and mall shopper types from 17 store attributes; namelyBasic, Apathetic, Destination, Enthusiasts, Serious, and Brand. In recentyears, research has started to consider the development of profiling formore specific groups of customers e.g. cultures (Jin and Kim, 2003;Theodoridis and Chatzipanagiotou, 2009), genders (Shim andKotsiopoulos, 1993) and age groups (Breazeale and Lueg, 2011).Sudbury and Simcock (2009) categorised 50–79 year old shoppers inthe UK using a wide range of ageing and behavioural variables derivedfrom gerontology literature and consumer research. They found fiveclusters in the older consumer market—solitary sceptics, bargainhunting belongers, self-assured sociables, positive pioneers and cau-tious comfortables. However, three of these clusters had an averagechronological age of under 60 years and few of the scales used wereassociated with store image attributes, thus inhibiting meaningfulmarketing management decision making for specific aspects of theretail offer.
2.2. Store image
Store image has appeared in the extant literature since theseminal work of Martineau (1958) who described it as fusingfunctional qualities and psychological attributes comprising theretail store. Despite its rich heritage, there remains little clarity inhow store image should be conceptualized (Hartman and Spiro,2005). Most definitions confirm that store image is a holisticmeasurement in which the shopper assesses components formingconstituent parts of their store evaluations (Doyle and Fenwick,1974). It is therefore a multi-attribute construct (James et al., 1976;Theodoridis and Chatzipanagiotou, 2009) where the overallimpression is greater than the sum of the parts (Oxenfeldt,1974–1975).
Debates have centred on the appropriate construction and mea-surement of store image (Buttle, 1985; Samli et al., 1998). In theseminal article by Martineau (1958), four key attributes were identi-fied: layout and architecture, symbols and colour, advertising, andsales personnel. Kunkel and Berry (1968) later developed this toinclude 12 dimensions, each comprising between three and sevenattributes. Lindquist (1974–1975) reviewed 26 research papers repre-senting the most commonly cited store image studies. He compiled alist of nine factors: merchandise, service, clientele, physical facilities,convenience, promotion, store atmosphere, institutional factors andpost-transaction satisfaction. He suggested that these comprisedvarious attribute-level considerations, but confirmed that previousresearch, on which his article was based, showed merchandise to bethe most salient dimension of image when viewed through aconsumer lens. Hansen and Deutscher (1977–1978) extended earlierresearch to produce a quantitative instrument that yielded a list of 41variables, constituting the most important variables to shoppers whenselecting a grocery and department store. These were subsequentlyranked and compared across both types of retailer.
Zimmer and Golden (1988) later attacked the lack of empirical,inductive research in previous developments of store imagetheory. Following a rigorous qualitative content analysis procedure47 attributes were derived, representing seven dimensions. Theyargue that this more deeply captured retail store image than paststudies, claiming their taxonomy was unique in terms of itsinquiry, particularly in light of the fact that previous researchhad been dominated mostly by deductive applications.
The evidence presented thus far is compelling in its implica-tions for store image research. However, in common with the bodyof consumer typology research, previous store image research hastended to ignore older consumers' use of ‘specific’ attributes toevaluate retail experiences (e.g. Bearden and Mason, 1979; Hare

R.J. Angell et al. / Journal of Retailing and Consumer Services 21 (2014) 192–202194
et al., 1999; Lambert, 1979). Assuming a generic perception ofretail store image is likely to be poorly conceived (Gunter, 1998;Moschis, 1992). As such, an empirically derived scale constructedfrom store attributes rather than self-attributes as a basis for anempirical typology of older shoppers is considered to represent auseful and necessary development containing both theoretical andpractical merit.
3. Methodology
The empirical research undertaken in this study relies heavily onthe scale development paradigm sanctioned by authorities such asChurchill (1979), DeVellis (2003), Gerbing and Anderson (1988) andPeter (1981). A mixed-method procedure, in line with the sequentialtransformative approach endorsed by Cresswell (2002) was adopted,with qualitative research informing a later stage of quantitativeresearch. Analysis was conducted using a series of statistical tests;namely exploratory factor analysis, confirmatory factor analysis andcluster analysis.
3.1. Qualitative research
Thirty six in-depth interviews were used to elicit store imageattributes important to older people when shopping for groceries.Participants were 60 years and older (in line with recent studies; e.g.Meneely et al., 2009) and responsible for doing their household'sgrocery shopping. People were recruited using six different local andnational social organisations for older people resulting in a mix ofparticipants ranging in age, gender, socio-economic and geographicalcharacteristics.
Given the lack of precedency, a fairly unstructured interviewingapproach was adopted. Interviews aimed to identify both whatissues were considered salient to the respondents and why, as wellas the benefits they expected to accrue (Seidman, 2006). A contentanalysis procedure was followed to identify themes in the data(Zimmer and Golden, 1988). Two analysts independently codedrecurring attributes, which were then placed into more generalcategories. A panel of university professors in the areas of market-ing and research methodology assessed the content validity ofitems for the quantitative research instrument (DeVellis, 2003).The number of store image attributes for quantitative explorationconsequently reduced from 50 to 42 items.
3.2. Qualitative results
A framework of attributes (see Appendix) underlying eightstore image factors was identified: Accessibility, Merchandise,Physical Environment, Atmospheric Environment, Price & Promo-tions, Services, Personnel and Clientele factors. In general, thefindings provide a natural extension to previous work (e.g. Kunkeland Berry, 1968; Lindquist, 1974–1975; Martineau, 1958; Zimmerand Golden, 1988), consolidating attributes into a single frame-work and inducting new theory.
The first factor is Accessibility, which measured distance to thestore, availability of car parking, store opening times, and per-ceived accessibility. The interviews revealed attributes similar toKunkel and Berry (1968), with an extension being the importanceof a well-served network of bus routes. This emerged as animportant variable as many respondents relied heavily on publictransport (e.g. Meneely et al., 2009).
Merchandise is well established in-store image theory (Dicksonand Albaum, 1977; Kunkel and Berry, 1968; Lindquist, 1974–1975). Ithas previously incorporated components ranging from store ‘quality’,‘selection’ and ‘price’ (Lindquist, 1974–1975), to availability of ‘brandnames’ and ‘assortment’ (Kunkel and Berry, 1968). Whilst these items
were found to be relevant in this context (see Appendix) oldershoppers displayed an interest in having a wide range of ‘productsizes’, ‘dietary products’, as well as ‘clear product information’ onpackaging. A range of product sizes was found to be especially salient;a finding documented in several studies (e.g. Hare et al., 1999; Masonand Bearden, 1978). One person commented that his generationdisliked wasting food, which was a problem if products were notavailable in the required size: “I was born in the war and we didn'twaste food. However it's catch 22 as I cannot be eating such largeportions”. Some respondents claimed to have problems readingproduct labels due to font size, resulting in, at times, purchasingunexpected goods. As such, having clearly stated and appropriatelysized wording on products is critical (e.g. Lambert, 1979; Meneelyet al., 2009). The availability of special dietary products was found tobe a direct consequence of the heightened health consciousnessamongst older people. Whilst, this represents a new theme in retailtheory, the onset of age related illnesses such as diabetes has beendiscussed in previous work (see Gunter, 1998; Moschis, 1992).
The Physical Environment being distinct from the AtmosphericEnvironment was clear, supporting Lindquist (1974–1975). Henoted the importance of elevators, lighting, temperature, wash-rooms, aisle placement, store layout and architecture, aspects thatwere found to be evident amongst older shoppers also. Some clearextensions were identified: reachable shelf heights were notedamongst those with physical acuities (e.g. Meneely et al., 2009);wider aisles were considered as a measure to prevent encroachingon the space of other shoppers (e.g. Lumpkin et al., 1985; Meneelyet al., 2009); and in-store seating areas were needed for those whofound shopping a physically difficult activity (e.g. Lambert, 1979;Lumpkin et al., 1985; Mason and Bearden, 1978). Several partici-pants also identified the importance of having a navigable layoutsince older people can find it difficult remembering whereproducts are located (e.g. Leighton and Seaman, 1997). Otheraspects of the physical environment, such as readable storesignage (e.g. Lambert, 1979) and quality trolleys/baskets(Pettigrew et al., 2005) further extended the generic definitionsupplied by Lindquist (1974–1975) to older customers.
The fourth dimension delineated the Atmospheric Environ-ment. In Lindquist's (1974–1975) framework this constructincluded attributes such as feelings of acceptance, warmth or ease.Here, this was extended to include cleanliness and tidiness, goodlighting, pleasant sounds and pleasant smells (see Burt andGabbott, 1995). Lighting is placed within this category because ofthe reported perception of several participants that this attributecontributed to their mood, although it is equally possible thatmood was influenced by practical impacts of the attribute, such asease of reading labels: “I get frustrated when I can't see the foodproperly. I want it to be light and airy. That helps to make me feelmore comfortable”. This would align more with Lindquist's (1974–1975) classification of lighting as part of the physical environment.
The inclusion of Pricing and Promotions as separate themes issupported by many classical store image studies (e.g. Kunkel andBerry, 1968; Lindquist, 1974–1975; Samli et al., 1998; Zimmer andGolden, 1988). In the current research these were found to beintertwined concepts with respondents highlighting competitivepricing as a backdrop to a wider range of promotional offerings(e.g. multiple-buy, price discounts, clearance items and loyaltycards). Whilst these have been well documented in a range ofstudies, the importance of loyalty cards represents a more recenttrend in grocery retailing, superseding food stamps (Kunkel andBerry, 1968). Meneely et al. (2009) noted that older people liked toparticipate in reward schemes and are motivated by the thrill ofobtaining a bargain (Myers and Lumbers, 2008).
Services, such as home delivery, returns and additional in-storeservices (e.g. dry cleaning) have been well documented (e.g. Kunkeland Berry, 1968; Lindquist, 1974–1975). These were all found to be

R.J. Angell et al. / Journal of Retailing and Consumer Services 21 (2014) 192–202 195
applicable to older shoppers (see Appendix), with extensions includingthe importance of an efficient and fair complaints system (e.g.Lumpkin et al., 1985). One respondent discussed this at length,highlighting that having this assurance reduces purchasing risk—something considered as very important when buying both higherrisk products (Moschis, 1992) and perishable items (Hare et al., 1999).
The role of Personnel has resonated as important in many ofthe classical store image studies (e.g. Kunkel and Berry, 1968;Lindquist, 1974–1975; Samli et al., 1998; Zimmer and Golden,1988), to include attitude, knowledgeability and the number ofservice staff. In the current study respondents were more explicitin the properties they considered to represent this component. Assuch, the importance of friendly, helpful and polite staff wasincluded. Older people are thought to place importance in theretail staff since they offer a further opportunity for interactionand socialising (e.g. Kang and Ridgway, 1996; Myers and Lumbers,2008).
Martineau (1958) and Lindquist (1974–1975) both highlightedthe importance of Clientele as a component of store image.Martineau proposes there to be an element of social class appealwhen evaluating a retail store. Respondents discussed feelingmore comfortable around other shoppers who were of a like-minded disposition. This was extended to other shoppers thatwere friendly (e.g. Kang and Ridgway, 1996; Myers and Lumbers,2008) and helpful when asked to provide assistance, for example,in reaching products or holding doors open: “I definitely need tofeel comfortable if asking a fellow shopper for help reaching foodfrom a high shelf or similar”.
3.3. Quantitative research
Following advice about store image scale construction (Doyle andFenwick, 1974; Zelnio and Gagnon, 1981) 42 store image attributeswere taken forward for quantitative exploration using a self-completion survey. Respondents were asked to rate the importanceof each of the items when making a store choice decision using a7-point Likert scale (1¼Extremely Unimportant—7¼ExtremelyImportant). An interlocking quota sample was drawn to representthe profile of the over-60 age group within England. Respondentswere selected by age, gender and geographical location to encouragea more representative sample. Furthermore only those people whowere responsible for doing their household's grocery shopping wereeligible to take part.
Overall, 2000 questionnaires were sent out via post. In linewith the recommendations provided by Dillman (1978), a two-wave procedure was implemented with a reminder postcard sentbetween send-outs. In total, 356 responses were collected fromwave one and 168 responses from wave two; a combined sampleresponse rate of 26.2%. Independent sample t-tests verified nostatistically significant differences (Armstrong and Overton, 1977).To rectify the small amount of missing data, (o5%), theExpectation-Maximization (EM) algorithm was used to imputeempty cells (Allison, 2002).
3.4. Exploratory factor analysis
Whilst the taxonomy presented as a result of the qualitativeanalysis provided some insights into the underlying structure ofthe items, this was provisional and needed empirical testing withmore generalizable data. Hence the remaining items were sub-jected to an exploratory factor analysis (EFA) (DeVellis, 2003).
In the initial analysis the Kaiser–Meyer–Olkin Measure of Sam-pling Adequacy (KMO) was.936 with Bartlett's test for sphericitysignificant. The EFA procedure used principal axis factoring withvarimax rotation (e.g. Arnold and Reynolds, 2003; Diamantopoulosand Souchon, 1999). A total of seven factors with an eigenvalue of
greater than 1.0 were extracted from the data. The seven-factorsolution explained 67.41% of the variance in the observed items. Therotated component matrix highlighted three items with either(1) cross loadings on one or more other factors above .45 or(2) low factor loadings below .45. In line with the advice of Hairet al. (2009), and to preserve the assumption of unidimensionality(Gerbing and Anderson, 1988), ‘availability of dietary products’,‘accessible bus routes’ and ‘a quality complaints procedure’ wereeliminated. The resultant seven-component factorial solution pro-vided an empirically and substantively explainable structure consist-ing of 39 store image items.
Factor one consisted of items relating to the aesthetics andtangible quality of the store and its components (i.e. shelves,trolleys, etc.), hence it was labelled Store Environment. Theselection and quality of products available were strongly referredto in factor two, and was therefore labelled as Merchandise. Infactor three each of the items related to the quality of staff withinthe store; accordingly it was labelled as Personnel. Factor fourincluded the stores pricing policy and application of promotions,as well as the returns policy. This was therefore labelled Pricing &Promotions. The fifth component consisted of items relating to thetype of patron using the store; as such this factor was referred toas Clientele. Factor six included items that related to the char-acteristics of the store that has little to do with the environment orproduce, but included aspects of a stores functional policy such asa delivery service. This factor was labelled as Services. Finally, theitems in factor seven referred to the accessibility and convenienceof the store; for instance its opening times and car parkingprovision. This was labelled as Accessibility. This outcome differedvery little with the initial framework developed through qualita-tive analysis. The only significant difference was that the hypothe-sized atmospheric and physical environmental components wereadjoined to make the wider Store Environment construct. Thissuggests that the importance ascribed by shoppers to bothphysical and atmospheric aspects of a grocery store were signifi-cantly correlated to justify their fusion.
3.5. Confirmatory factor analysis
A measurement model, representing the indicators, factors andhow they interrelated was specified and estimated (Brown, 2006).In line with Gerbing and Anderson's (1988) advice for assuringunidimensionality, each of the seven factors was integrated into ameasurement model and estimated using the Mplus 5.4 RobustMaximum Likelihood (RBL) procedure (Muthen and Muthen,2009). The parameters for each of the remaining 39 items andtheir corresponding factors are given in Table 1. Assessment of themodel fit statistics suggested a poor initial fit between the modeland data with estimates below commonly accepted thresholds(CFI¼ .86; TLI¼ .85; RMSEA¼ .07) (Hu and Bentler, 1999). Assess-ment of the standardised residual estimates identified areas ofstrain within the measurement model. Further exploration, in theform of Modification Indices (MI), suggested seven items withhighly correlated errors (product freshness, different product sizes,spacious layout), cross loading on unspecified factors (good light-ing), or low factor loadings (money-off discounts, helpful staff,availability of non-food products).
These issues were substantively explainable (Brown, 2006), allwith MI's in excess of 50.0. To retain the internal consistency and(in some cases) the unidimensionality of the scales, all offendingitems were duly eliminated from the measurement model. Asecond measurement model was estimated, revealing a moreimproved fit between the model and data (CFI¼ .91; TLI¼ .90;RMSEA¼ .07).

R.J. Angell et al. / Journal of Retailing and Consumer Services 21 (2014) 192–202196
3.6. Construct validity
As tests of construct validity, both convergent and discriminantvalidity were assessed. Convergent validity was evident in allseven store image constructs, with all items loading significantly
Table 1Confirmatory factor analysis.
Standardized factor loadings(standard errors)
Store environmentSE1. Good lighting –
SE2. Spacious layout –
SE3. Quality trolleys & baskets .837 (.015)SE4. Reachable shelving .812 (.016)SE5. Wide aisles .839 (.014)SE6. Navigable layout .847 (.014)SE7. Clear signage .817 (.016)SE8. Cleanliness and tidiness .844 (.014)SE9. Pleasant smells .732 (.022)SE10. Pleasant sounds .578 (.030)SE11. In-store seating .535 (.032)SE12. Efficient checkouts .713 (.023)
MerchandiseM1. Product freshness –
M2. Product ranges .869 (.016)M3. Product quality .775 (.021)M4. Product availability .828 (.018)M5. Different product sizes –
M6. Branded products .583 (.032)M7. Clear product information .588 (.032)
PersonnelP1. Knowledgeable staff .818 (.016)P2. Available staff .908 (.009)P3. Polite staff .953 (.006)P4. Helpful staff –
P5. Friendly staff .945 (.006)
Pricing & promotionsPP1. Money-off discounts –
PP2. Multi-buy promotions .771 (.021)PP3. Competitive prices .683 (.027)PP4. Reduced-to-clear items .612 (.030)PP5. Loyalty cards .877 (.016)PP6. Returns policy .612 (.031)
ClienteleC1. Helpful shoppers .939 (.007)C2. Friendly shoppers .973 (.006)C3. Likeminded shoppers .879 (.011)
ServicesS1. Additional services (cafe, keycutting, etc)
.741 (.043)
S2. Home delivery .745 (.044)S3. Availability of non-food products –
AccessibilityC1. Store location .755 (.031)C2. Long opening times .713 (.032)C3. Free car parking .660 (.034)
Table 2Factor correlation matrix.
1 2 3
1. Store environment .58 (.76)2. Merchandise .42 .55 (.74)3. Personnel .74 .31 .89 (.94)4. Pricing & promotions .67 .34 .585. Clientele .40 .16 .416. Services .34 .23 .277. Accessibility .53 .39 .43
Note: lower segment¼factor correlations; diagonal¼AVE (√AVE).
(po .01) and the Average Variance Extracted (AVE) analysisexplaining a minimum of 50% of variance in the observed items(Fornell and Larcker, 1981). Discriminant validity was checked andconfirmed as evident at a satisfactory level for all factors (Fornelland Larcker, 1981) (see Table 2). Once the store image scale hadbeen successfully developed, the focus of the analysis evolved tothe classification of meaningful and relevant segments (as inHansen and Deutscher, 1977–1978).
4. Developing a typology of older shoppers
A two-stage clustering protocol (Punj and Stewart, 1983) wasimplemented combining the benefits of both hierarchical and non-hierarchical methods. First the summed scales for each of the storeimage factors were calculated, and a cluster analysis performed usingWard's (1963) hierarchical method (squared Euclidian distances). Awell-established approach was utilised to select an appropriate scopeof clusters (Hair et al., 2009), comparing a range of different solutions(in this case 3–6). The selected five-cluster solution was based oninterpretation of the dendrogram and agglomeration schedules of thehierarchical cluster process, and further supported through proceduresproposed by Sharma (1996). Following this, a non-hierarchicalk-means clustering procedure (MacQueen, 1967) was adopted toproduce a final solution which used the hierarchical cluster centresas the initial seeds. The clarity and practicality of the shopping typesderivedwas assessed and a solution proposedwhich allocated subjectsto five clusters (N1¼152, N2¼120, N3¼98, N4¼84 and N5¼70).
The internal validity of the solution was subsequently testedby procedures prescribed by Klastorin (1983) and Westbrookand Oliver (1991). Firstly, canonical discriminant analysisshowed 94.5% of original grouped cases were correctly classified,and secondly, a two-dimensional scatter-plot of the clustersrevealed that the clusters occupied distinct positions. Furtherinternal validity was indicated through performing a multivariateanalysis of variance (MANOVA) where the five clusters werecompared using the remaining 39 store items rather than the7 identified factors. This produced a significant result (Hotelling'sTrace¼2.962; F¼16.713, po .001) indicating that the five seg-ments differed significantly from each other. In addition, separateunivariate ANOVA for the same 39 items all produced significantresults at po .001. Taking these results together suggests strongsupport for the internal validity of the resultant five-clustersolution. Several methods for assessing external validity areavailable to researchers (e.g. Ivens and Valta, 2012), although thisstudy utilises an approach recently executed by Schoefer andDiamantopoulos (2009). This requires that a theoretically relevantvariable that is not used in the derivation of the cluster solution iscompared across segment membership. Where such a variable canbe shown to be impacted on by a typology, then the classificationwill have explanatory value. In this instance the value of oldershopper types for retailers and store attribute researchers wouldbe enhanced if the clusters were strongly aligned to shopper
4 5 6 7
.52 (.72)
.43 .87 (.93)
.45 .37 .55 (.74)
.53 .34 .37 .51 (.71)

R.J. Angell et al. / Journal of Retailing and Consumer Services 21 (2014) 192–202 197
satisfaction (Ivens and Valta, 2012). This variable has also generallybeen regarded as having different mean levels across identifiedshopper types (see Theodoridis and Chatzipanagiotou, 2009). Amultiple item composite taken from the scale introduced byFornell (1992) to reflect overall store satisfaction was used tomeasure this. A one-way ANOVA test for satisfaction as thedependent variable using cluster membership as the fixed factorproduced a highly significant outcome (F¼13.005; po .001),providing support for the external validity of the solution.
The final five-cluster solution presented in Table 3 describes thesegments based on the mean scores for each of the 7 factors usedto derive the segments and the additional satisfaction variable. Toimprove the practical implications, or external validity, of thesolution, a series of other personal characteristic and behaviouralvariables were included. This is to aid practitioners in betterreaching the target audience—i.e. older shoppers—and has beenused in many previous studies; e.g. Arnold and Reynolds (2003),Ivens and Valta (2012), Megicks et al. (2012).
The first segment, given the label prudent neutrals and com-prising 29% of the sample, is the largest of the five clusters. Theseshoppers appear to be fairly neutral, when compared to othersegments, on most aspects of the store, with the exception of Price &Promotions; they also attach some importance to the Services
Table 3Older grocery shopper types.
Cluster (type) 1 (Prudentneutrals)
2 (All-rounddemanders)
3 (Reluctantcasuals)
4 (Dsoci
No (%) 152 (29) 120 (23) 98 (19) 84 (
Store image factorStore environment 5.97 6.57 5.47 6.32
Merchandise 5.91 6.43 5.37 6.22
Personnel 6.25 6.68 5.88 6.61
Pricing & promotions 6.33 6.25 4.62 5.58
Clientele 4.60 6.15 4.57 5.85
Services 4.27 5.53 2.05 1.95
Accessability 6.05 6.59 5.31 6.30
Satisfaction 5.49 6.04 5.27 5.91
Demographics and behaviourGender (% women) 60 69 59 63Household composition(% couples)
53 48 51 54
Mobility (% with cars) 77 64 74 76Age (% under 70) 47 45 50 39Education (% no qualifications) 42 56 38 46Income (% under d15,000) 51 69 44 56Working status (% employed) 25 15 22 12Geodemographic area(% comfortable or better)
68 52 71 66
Household ownership (% owning) 82 68 81 85Frequency of shopping(% shopping44 times a month)
47 49 50 60
Distance from store (% travelling lessthan 2 miles)
56 60 56 65
Shopping at main store (%) 78 79 74 80Expenditure on shopping(% spending4d50 per week)
41 43 40 44
Highest scores in bold; lowest in italics.Significance:
nnn po .001.nn po .01.n po .05.
factor. This suggests that segment one is a more cautious group inregard to the cost of grocery shopping and its members thereforeplace a high emphasis on prices, scoring this higher than any ofthe other clusters. They may also see the potential value availablethrough the additional services (e.g. delivery) on offer comparedwith other groups. The scores for Personnel and Accessibility,although lower in comparison with some other segments, arenonetheless highly important factors for these shoppers. The meansatisfaction score for this group is below the average for all oldershoppers, and significantly lower than the two most satisfiedsegments. The prudent neutrals have demographic characteristicsand patterns of shopping behaviour that are very closely asso-ciated with the average older shopper in the sample as a whole,with little variation being displayed except in the case of workingstatus. This segment has the highest proportion (25%) of itsmembers in employment, which is significantly greater than someof the other groups.
The second segment is entitled all-round demanders (23% of thetotal sample) owing to the high importance they place on allaspects of the shopping experience including Services. They scorehighest on the Store Environment, Personnel, Clientele, Servicesand Accessibility and are only marginally lower than the top-scoring groups on the remaining two factors Merchandise and
emandingables)
5 (Affluentutilitarians)
Total
16) 70 (13) 524(100)
(F value/χ2) Multiple comparison(significant at po .05)
5.26 5.97 54.36*** 143, 145, 241, 243, 245,441, 443, 445
6.55 5.95 36.53*** 143, 241, 243, 245, 441,443, 445, 543
5.29 6.21 47.46*** 143, 145, 241, 243, 245,345, 441, 443, 445
4.44 5.32 73.90*** 143, 145, 241, 243, 244,245, 443, 445
1.95 4.80 342.92*** 145, 241, 243, 245, 345,441, 443, 445
2.45 3.53 385.16*** 143,144,145, 241, 243,244, 245, 544, 543
5.41 5.99 35.39*** 143, 145, 241, 243, 245,443, 445
5.37 5.62 13.05*** 241, 243, 245, 441, 443,445
61 62 3.2357 52 1.53
84 75 10.87*
49 46 2.4229 43 15.51**
39 53 14.28**
20 20 8.1377 66 16.26**
87 80 13.88**
41 49 5.49
51 58 3.53
77 78 1.5846 43 .77
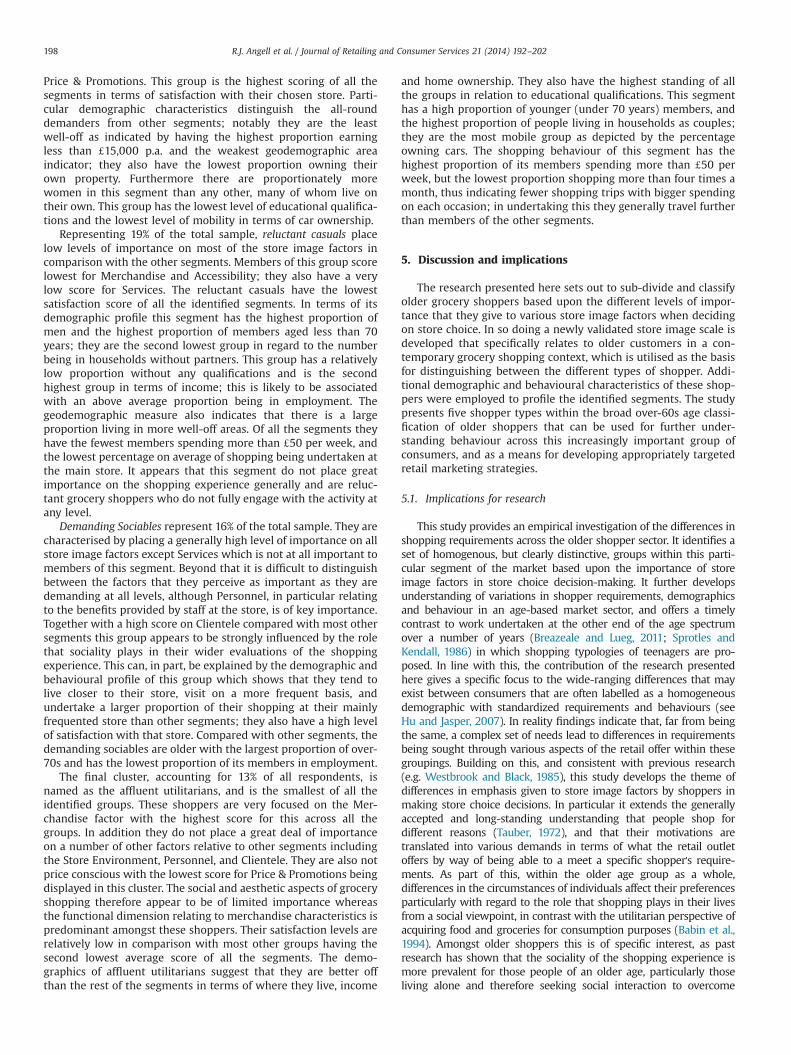
R.J. Angell et al. / Journal of Retailing and Consumer Services 21 (2014) 192–202198
Price & Promotions. This group is the highest scoring of all thesegments in terms of satisfaction with their chosen store. Parti-cular demographic characteristics distinguish the all-rounddemanders from other segments; notably they are the leastwell-off as indicated by having the highest proportion earningless than d15,000 p.a. and the weakest geodemographic areaindicator; they also have the lowest proportion owning theirown property. Furthermore there are proportionately morewomen in this segment than any other, many of whom live ontheir own. This group has the lowest level of educational qualifica-tions and the lowest level of mobility in terms of car ownership.
Representing 19% of the total sample, reluctant casuals placelow levels of importance on most of the store image factors incomparison with the other segments. Members of this group scorelowest for Merchandise and Accessibility; they also have a verylow score for Services. The reluctant casuals have the lowestsatisfaction score of all the identified segments. In terms of itsdemographic profile this segment has the highest proportion ofmen and the highest proportion of members aged less than 70years; they are the second lowest group in regard to the numberbeing in households without partners. This group has a relativelylow proportion without any qualifications and is the secondhighest group in terms of income; this is likely to be associatedwith an above average proportion being in employment. Thegeodemographic measure also indicates that there is a largeproportion living in more well-off areas. Of all the segments theyhave the fewest members spending more than d50 per week, andthe lowest percentage on average of shopping being undertaken atthe main store. It appears that this segment do not place greatimportance on the shopping experience generally and are reluc-tant grocery shoppers who do not fully engage with the activity atany level.
Demanding Sociables represent 16% of the total sample. They arecharacterised by placing a generally high level of importance on allstore image factors except Services which is not at all important tomembers of this segment. Beyond that it is difficult to distinguishbetween the factors that they perceive as important as they aredemanding at all levels, although Personnel, in particular relatingto the benefits provided by staff at the store, is of key importance.Together with a high score on Clientele compared with most othersegments this group appears to be strongly influenced by the rolethat sociality plays in their wider evaluations of the shoppingexperience. This can, in part, be explained by the demographic andbehavioural profile of this group which shows that they tend tolive closer to their store, visit on a more frequent basis, andundertake a larger proportion of their shopping at their mainlyfrequented store than other segments; they also have a high levelof satisfaction with that store. Compared with other segments, thedemanding sociables are older with the largest proportion of over-70s and has the lowest proportion of its members in employment.
The final cluster, accounting for 13% of all respondents, isnamed as the affluent utilitarians, and is the smallest of all theidentified groups. These shoppers are very focused on the Mer-chandise factor with the highest score for this across all thegroups. In addition they do not place a great deal of importanceon a number of other factors relative to other segments includingthe Store Environment, Personnel, and Clientele. They are also notprice conscious with the lowest score for Price & Promotions beingdisplayed in this cluster. The social and aesthetic aspects of groceryshopping therefore appear to be of limited importance whereasthe functional dimension relating to merchandise characteristics ispredominant amongst these shoppers. Their satisfaction levels arerelatively low in comparison with most other groups having thesecond lowest average score of all the segments. The demo-graphics of affluent utilitarians suggest that they are better offthan the rest of the segments in terms of where they live, income
and home ownership. They also have the highest standing of allthe groups in relation to educational qualifications. This segmenthas a high proportion of younger (under 70 years) members, andthe highest proportion of people living in households as couples;they are the most mobile group as depicted by the percentageowning cars. The shopping behaviour of this segment has thehighest proportion of its members spending more than d50 perweek, but the lowest proportion shopping more than four times amonth, thus indicating fewer shopping trips with bigger spendingon each occasion; in undertaking this they generally travel furtherthan members of the other segments.
5. Discussion and implications
The research presented here sets out to sub-divide and classifyolder grocery shoppers based upon the different levels of impor-tance that they give to various store image factors when decidingon store choice. In so doing a newly validated store image scale isdeveloped that specifically relates to older customers in a con-temporary grocery shopping context, which is utilised as the basisfor distinguishing between the different types of shopper. Addi-tional demographic and behavioural characteristics of these shop-pers were employed to profile the identified segments. The studypresents five shopper types within the broad over-60s age classi-fication of older shoppers that can be used for further under-standing behaviour across this increasingly important group ofconsumers, and as a means for developing appropriately targetedretail marketing strategies.
5.1. Implications for research
This study provides an empirical investigation of the differences inshopping requirements across the older shopper sector. It identifies aset of homogenous, but clearly distinctive, groups within this parti-cular segment of the market based upon the importance of storeimage factors in store choice decision-making. It further developsunderstanding of variations in shopper requirements, demographicsand behaviour in an age-based market sector, and offers a timelycontrast to work undertaken at the other end of the age spectrumover a number of years (Breazeale and Lueg, 2011; Sprotles andKendall, 1986) in which shopping typologies of teenagers are pro-posed. In line with this, the contribution of the research presentedhere gives a specific focus to the wide-ranging differences that mayexist between consumers that are often labelled as a homogeneousdemographic with standardized requirements and behaviours (seeHu and Jasper, 2007). In reality findings indicate that, far from beingthe same, a complex set of needs lead to differences in requirementsbeing sought through various aspects of the retail offer within thesegroupings. Building on this, and consistent with previous research(e.g. Westbrook and Black, 1985), this study develops the theme ofdifferences in emphasis given to store image factors by shoppers inmaking store choice decisions. In particular it extends the generallyaccepted and long-standing understanding that people shop fordifferent reasons (Tauber, 1972), and that their motivations aretranslated into various demands in terms of what the retail outletoffers by way of being able to a meet a specific shopper's require-ments. As part of this, within the older age group as a whole,differences in the circumstances of individuals affect their preferencesparticularly with regard to the role that shopping plays in their livesfrom a social viewpoint, in contrast with the utilitarian perspective ofacquiring food and groceries for consumption purposes (Babin et al.,1994). Amongst older shoppers this is of specific interest, as pastresearch has shown that the sociality of the shopping experience ismore prevalent for those people of an older age, particularly thoseliving alone and therefore seeking social interaction to overcome

R.J. Angell et al. / Journal of Retailing and Consumer Services 21 (2014) 192–202 199
loneliness and boredom, and fulfilling other benefits such as takingexercise and getting a change of scenery (e.g. Kim et al., 2005; Myersand Lumbers, 2008; Sudbury and Simcock, 2009).
The differences in these reasons for shopping amongst olderconsumers, together with personal characteristics are reflected inthe typologies developed in this research. Some shoppers affordgreat importance to the socially-based image factors when makingstore choice decisions, whereas others do not, and give greateremphasis to factors associated with the functional dimension ofgrocery shopping. Thus the demanding sociables and the all-rounddemanders place great importance on Clientele and Personnel,whilst for the affluent utilitarians the importance of these twofactors is not weighted so highly in their decision making. Affluentutilitarians place a very strong emphasis on the Merchandisefactor which indicates this group's concern for the products onoffer and how their attributes contribute to the functionality oftheir use and the shopping experience. Furthermore, prudentneutrals place only limited emphasis on Clientele, although theyregard Personnel as being very important; but they afford thegreatest importance to Price & Promotions thus distinguishingthem from other groups. The reluctant casuals similarly score lowon Clientele and are relatively low scoring on the importance ofPersonnel, which reflects generally on their comparative dislike ofgrocery shopping from both social and functional perspectives.
A further, but extremely important, contribution of this research isthe identification of a store image scale comprising a set of factorsthat specifically reflect the importance in store choice decisions ofolder shoppers. This scale extends store image research by providingcontemporary insights into the specific requirements of older shop-pers in a changing retail environment with evolving market condi-tions. Thus the inclusion of a new factor relating to Clientele as part ofa reliable and valid scale broadens the conceptualisation of storeimage to account for ‘other shoppers’, which although consistentwith previous understanding of the needs of older shoppers (Kangand Ridgway, 1996), may also hold credence for shoppers in general.The work provides greater clarification that generic store imagescales may lack validity when applied with specific groups ofconsumer, and that researchers should be cognisant to the potentialneed for extension.
5.2. Implications for retail practice
The importance of an expanding older shopper sector forretailers and suppliers in the grocery industry cannot be ignored,and distinguishing variations in customer types provides insightswhich can be levered for future success. Moreover the combina-tion of store image, demographic and shopping behaviour in thesegmentation process facilitates the formulation of appropriatemerchandising and retail service strategies. Although in someinstances there do not appear to be dramatic differences betweensegments they are significant in many respects, and thereforeprovide a platform for differentiating the retail mix where appro-priate from an economic cost and return standpoint.
Clearly there are opportunities for independent retailers to exploitexplicit differences in store image requirements by formulating atargeted retail positioning that focuses on the specific demands ofparticular segments (e.g. Merchandise for the affluent utilitarians orPrice & Promotions for the prudent neutrals). Yet there is alsopotential in a broader offer that encompasses the range of expecta-tions held by the two segments that look to fulfil a wider range ofneeds through their grocery shopping (the all-round demanders andthe demanding sociables), with a distinction being made around thegreater emphasis on the importance of Services for the former group.Moreover, whilst it appears possible to propose a specific retail offerthat accounts for the differing degrees of importance afforded to thestore image factors by the reluctant casuals (such as a diminished
emphasis on Services), this may not be a viable strategy given thereticence of this group to fully engage with the grocery shoppingexperience.
Alternatively smaller retailers and producers may pay specificattention to individual segments within the older shopper sector andfocus their efforts on the high scoring aspects the older consumers'retail offer generally (Merchandise, Personnel, Store Environment, andAccessibility) as well as those that clearly distinguish between theneeds of particular groups (Price & Promotions, Clientele, Services,and Accessibility). Further to this there are possibilities for larger retailmultiples to develop an all-encompassing retail strategy that accom-modates the needs of older shoppers generally or a well-consideredapproach that creates a distinction between their sub-brands to meetthe requirements of the different shopper types.
The degree to which grocery retailers and manufacturersencompass a targeted approach to older shopper groups isdependent upon the extent to which they can either focus ordifferentiate within this sector. Variations in levels of satisfactionacross the groups adds a further dimension to the shaping of theretail offer in the context of different older grocery shopping types.
5.3. Limitations and future research
This study has a number of limitations which signpost directionsfor further investigation. The generalisability of the findings beyondthe UK grocery sector is not possible and further research of oldershoppers in different product and geographical markets is required tovalidate its applicability in these settings. Responses elicited in thequantitative study only relate to a single chosen store which inpractice may not be a true reflection of actual shopper behaviour.Indeed many older shoppers may frequent multiple stores as part oftheir regular grocery shopping activities, and this could be regardedas an important part of the social interaction that they seek offeringmultiple interactions with staff and other shoppers. Further researchof this would give deeper understanding of how different shoppers'needs are fulfilled in this respect perhaps through adopting a‘servicescapes’ perspective (Bitner, 1992).
Older shoppers may use alternative sources of acquiringproduce not explored in this study, such as on-line ordering andhome delivery. Research into shopping through internet channelsmay be timely as its adoption increases, older consumers becomemore familiar with this mode of shopping, and grocery retailersexpand their on-line services. Such insights may broaden anddeepen the nature of the typologies that have been developed.
The use of cross-sectional data in a single context does not accountfor the possibility of older shoppers moving across groups over timeas they grow older and their circumstances change, which a long-itudinal investigation may identify. Further research could also extendthe work by, for example, Carstensen (2006), Labouvie-Vief (2009),and Sudbury and Simcock (2009), which accommodates character-istics of older consumers not considered in this research particularlythose of a socio-psychological nature such as attitudes, personalityand emotional responses, but could integrate these with storeattributes to further profile the existing segments or as a platformfor undertaking a different segmentation approach. In additionopportunities for future research exist through utilising the oldershopper store image scale to enhance understanding of behaviour inthe sector. Within the groups of shopping types relationshipsbetween the different store image factors and such outcomes ascustomer retention, loyalty, as well as satisfaction could be identified,thus offering insights for retailers to improve their performanceagainst these measures. Finally research amongst stores and suppliersinto whether and how they address differences in their oldershopper segments, and the effectiveness of strategies adopted in thisregard offers an alternative avenue of investigation of an increasinglymore important sector of contemporary retailing.

Table A1Dimensional attributes of store choice.
Dimension/attribute Illustrative quote Older consumer specific literature (e.g.)
AccessibilityStore location “Convenience is definitely a big point. I can't get to other stores that easily. I am happy as long as
it is nearby to me.” (R10)Burt and Gabbott (1995), Meneely et al. (2009)
Bus access “Gosh, the buses are vital for me. It would be very difficult for me otherwise…” (R8) Hare et al. (1999), Meneely et al. (2009)Car parking “The availability of spaces in the car park is essentially very important to me. I need to get close
to the store.” (R29)Goodwin and Mcelwee (1999), Meneely et al.(2009)
Long opening times “The shops are forever open. They are always open until gone eight. That to me, is veryimportant because I am always going to places and then coming back and realising I needsomething.” (R15)
MerchandiseBranded products “I like a name. When a product is branded, you know what you are getting. They have a name to
it, and they then keep their standard up.” (R13)Lumpkin et al. (1985), Meneely et al. (2009)
Product freshness “If its fresh products it has to be ripe and not flagging. If its meat it has got to be the right smelland colour.” (R28)
Goodwin and Mcelwee (1999)
Clear productinformation
“I don't like surprises in prices, ingredients and the like. Make sure the labels are clear and easyto read for older people” (R4)
Lambert (1979), Meneely et al. (2009)
Product availability “It's annoying when you go for something that you always have had, and it's one of the reasonsthat we go there, and they take it away! So frustrating.” (R6)
Hare et al. (1999), Pettigrew et al. (2005)
Product quality “Top of my list is quality. I really believe that it is the quality of what you eat that is important.Quality is foremost…you must put quality into your body to be quality yourself.” (R30)
Burt and Gabbott (1995) Goodwin and Mcelwee(1999), Hare et al. (1999)
Product ranges “The most important thing for me is that they have what I want—everything I need for eachday.” (R36)
Burt and Gabbott (1995), Lumpkin, 1985,Meneely et al. (2009)
Different product sizes “I don't always want big sizes for the families. Small containers!” (R1) Hare et al. (2001), Lambert (1979), Lumpkinet al. (1985), Meneely et al. (2009)
Dietary ranges available “I am a diabetic so I need to regulate what I eat. I need to have a healthy diet through a range ofproducts!” (R9)
N/A
Physical environmentReachable shelving “I'm not short, but I have shrunk two inches. We all shrink. The top shelves are sometimes a bit
high for people to reach.” (R26)Meneely et al. (2009)
Wide aisles “Having a man in a wheelchair with me I need to have the room to move around. Enough spacefor accommodating wheelchairs is important.” (R5)
Lumpkin et al. (1985), Meneely et al. (2009)
In-store seating “I need a break often at the end of my trip, or sometimes during…” (R2) Lambert (1979), Lumpkin et al. (1985), Masonand Bearden (1978), Meneely et al. (2009)
Navigable layout “The important thing is that I know where things are and that I can get to them easily.” (R26) Leighton and Seaman (1997)Spacious layout “I like it when it is spread out better. When the aisles are wider then it gives the impression of
freshness. I don′t like it when it is cramped. It feels better when it is open.” (R31)Meneely et al. (2009)
Clear signage “I think there is a lot to learn when pricing things. When the food is stocked on the shelves it ishard to actually find out how much it is. There are times when prices are not displayedeffectively at all.” (R27)
Lambert (1979)
Efficient checkouts “We like to get through the till pretty quickly.” (R6) Lambert (1979), Meneely et al. (2009)Quality trolleys & baskets “When you are old and you don′t want that much stuff, you don′t need an enormous big
trolley.” (R11)Pettigrew et al. (2005)
Atmospheric environmentCleanliness andtidiness
“The one thing that I need is store cleanliness. I just need it to be neat, tidy and clean. There “havebeen times when I have dropped into places and it just doesn′t look good.” (R28)
Burt and Gabbott (1995), Hare et al. (1999)
Good lighting “It has to be light! It′s depressing going to a dull store!” (R29) Burt and Gabbott (1995)Pleasant sounds “If it is the right noise, I am comfortable and happy.” (R9) Burt and Gabbott (1995)Pleasant smells “In the same regard that I need the shop to be clean…it can′t smell either.” (R23) Burt and Gabbott (1995)
Pricing & promotionsCompetitive prices “You have to watch the price of things. We are not poor, but you still have to be careful.” (R29) Meneely et al. (2009), Lambert (1979)Multi-buy promotions “If they are selling three for two or BOGOF and I use it then I will buy it.” (R26)Money-off discounts “I prefer money off to be honest. Very often they put money off from products that I wouldn′t use—
they don′t think of us you see! Getting cash off makes me feel good about what I buy.” (R30)Goodwin and Mcelwee (1999)
Loyalty cards “I like collecting points and getting something for nothing” (R8) Lumpkin et al. (1985)Reduced-to-clearitems
“One of the most exciting parts of the shopping trip is going to the reduction counter.” (R11) Hare et al. (1999)
ServicesAdditional facilities(toilets, key cutting,etc.)
“It is really handy to be able to pick up dry cleaning at the same time as getting my groceries. Talkabout two birds and one shot.” (R24)
Complaints system “If you have a complaint then they need to deal with it. I don′t want to be fobbed off with excuses ifthey appear not to be interested or whatever!” (R8)
Lumpkin et al. (1985)
Home delivery “…a big push towards a greater delivery service…If I cannot move around easily any longer then Iwould be happy to use the internet for ordering things.” (R18)
Meneely et al. (2009), Lambert (1979)
Returns policy “I like to take things back. It′s reassuring you see. With oranges and things you obviouslycannot see how good they are. Taking them back, you obviously want something to bedone about it. “(R4)
Lumpkin et al. (1985)
Availability of non-food items
“You can get your clothes, cards, and everything else there. All under one roof. That is veryimportant to me now.” (R13)
Thompson and Thompson (2009)
PersonnelAvailable staff “There should be enough staff to be able to find someone fairly easily.” (R34) Pettigrew et al. (2005), Leventhal (1997)Friendly staff “People, people, people! That′s good retailing…” (R3) Pettigrew et al. (2005), Leventhal (1997)
R.J. Angell et al. / Journal of Retailing and Consumer Services 21 (2014) 192–202200

Table A1 (continued )
Dimension/attribute Illustrative quote Older consumer specific literature (e.g.)
Helpful staff “You really need the staff to be helpful, and not look put out when you ask them for help!” (R13) Pettigrew et al. (2005), Leventhal (1997),Goodwin and Mcelwee (1999), Hare et al.(1999)
Knowledgeable staff “They always know the type of food I like and will advise me. That is important to me.” (R4) Johnson-Hillery et al. (1997)Polite staff “I expect people to be polite. I expect them to acknowledge me as a person.” (R22) Hare et al. (1999)
ClienteleFriendly shoppers “It has to be sociable. I live on my own. I come down; I have a cup of coffee and a chat. I meet my
friends…it can take half an hour or three hours depending on whom I actually meet.” (R1)Pettigrew et al. (2005), Hare et al. (1999)
Helpful shoppers “I am not going to shop in a place where I feel uncomfortable having to ask other shoppers for ahand.” (R1)
Pettigrew et al. (2005), Meneely et al. (2009)
Likeminded shoppers “I think it is to do with the other shoppers’. XXX, for example, I find a little bit off-putting. It′s anawful thing to say, but it′s true!” (R34)
Pettigrew et al. (2005)
R.J. Angell et al. / Journal of Retailing and Consumer Services 21 (2014) 192–202 201
Appendix
See Table A1.
References
Ahmad, R., 2002. The older or ageing consumers in the UK are they really thatdifferent? International Journal of Market Research 44 (3), 337–360.
Allison, P.D., 2002. Missing Data. Sage Publications, London.Angell, R.J., Megicks, P., Memery, J., Heffernan, T., Howell, K.E., 2012. Discovering the
older shopper: a behavioural typology. Journal of Retailing and ConsumerServices 19 (2), 259–269.
Armstrong, J.S., Overton, T.S., 1977. Estimating nonresponse bias in mail surveys.Journal of Marketing Research 14 (3), 396–402.
Arnold, M.J., Reynolds, K.E., 2003. Hedonic shopping motivations. Journal ofRetailing 79 (2), 77–95.
Babin, B.J., Darden, W.R., Griffin, M., 1994. Work and/or fun: measuring hedonic andutilitarian shopping value. Journal of Consumer Research 20 (4), 644–656.
Bearden, W.O., Mason, J.B., 1979. Elderly use of in-store information sources anddimensions of product satisfaction/dissatisfaction. Journal of Retailing 55 (1),79–91.
Bellenger, D.N., Robertson, D.H., Greenberg, B.A., 1977. Shopping center patronagemotives. Journal of Retailing 53 (2), 29–38.
Bellenger, D.N., Korgaonkar, P.K., 1980. Profiling the recreational shopper. Journal ofRetailing 56 (3), 77–92.
Bitner, M., 1992. Servicescapes: the impact of physical surroundings on customersand employees. Journal of Marketing 56 (2), 57–71.
Breazeale, M., Lueg, J.E., 2011. Retail shopping typology of American teens. Journalof Business Research 64 (6), 565–571.
Brown, T.A., 2006. Confirmatory Factor Analysis For Applied Research. GuilfordPress, New York, NY.
Burt, S., Gabbott, M., 1995. The elderly consumer and non-food purchase behaviour.European Journal of Marketing 29 (2), 43–57.
Buttle, F., 1985. Measuring food store image using kelly's repertory grid. ServiceIndustries Journal 5 (1), 79–89.
Canabal, J.E., 2002. Decision making styles of young south Indian consumers: anexploratory study. College Student Journal 36 (1), 12–19.
Carstensen, L.L., 2006. The influence of a sense of time on human development.Science 312 (5782), 1913–1915.
Chase, M., Driscoll, L., Stewart, D., Hayhoe, C., Leech, I., 2007. Exploring therelationship of first-year, first-semester college students' mind styles and theirconsumer decision-making styles. Journal of Family and Consumer SciencesEducation 25 (1), 10–23.
Chaston, I., 2011. Older consumer opportunities: small firm response in a selectedgroup of UK service sector markets. Service Industries Journal 31 (3), 371–384.
Churchill, G.A., 1979. A paradigm for developing better measures of marketingconstructs. Journal of Marketing Research 16 (1), 64–73.
Cresswell, J.W., 2002. Research Design: Qualitative, Quantitative and MixedMethods Approaches. Sage Publications, London.
Darden, W.R., Reynolds, F.D., 1971. Shopping orientations and product usage rates.Journal of Marketing Research 8 (4), 505–508.
Darden, W.R., Ashton, D., 1975. Psychographic profiles of patronage preferencegroups. Journal of Retailing 50 (4), 99–112.
DeVellis, R.F., 2003. Scale Development: Theory and Applications, Second ed. SagePublications, Thousand Oaks, CA.
Diamantopoulos, A., Souchon, A.L., 1999. Measuring export information use: scaledevelopment and validation. Journal of Business Research 46 (1), 1–14.
Dickson, J., Albaum, G., 1977. A method for developing tailormade semanticdifferentials for specific marketing content areas. Journal of Marketing Research14 (2), 87–91.
Dillman, D.A., 1978. Mail and Telephone Surveys: The Total Design Method. JohnWiley & Sons, New York, NY.
Doyle, P., Fenwick, I., 1974. How store image affects shopping habits in grocerychains. Journal of Retailing 50 (4), 39–52.
Fan, J.X., Xiao, J.J., 1998. Consumer decision-making styles of young-adult Chinese.The Journal of Consumer Affairs 32 (2), 275–294.
Fornell, C., 1992. A national customer satisfaction barometer: the Swedish experi-ence. Journal of Marketing 56 (1), 6–21.
Fornell, C., Larcker, D.F., 1981. Evaluating structural equation models with unob-servable variables and measurement error. Journal of Marketing Research 18(1), 39–50.
Ganesh, J., Reynolds, K.E., Luckett, M.G., 2007. Retail patronage behavior andshopper typologies: a replication and extension using a multi-format, multi-method approach. Journal of the Academy of Marketing Science 35 (3),369–381.
Gerbing, D.W., Anderson, J.C., 1988. An updated paradigm for scale developmentincorporating unidimensionality and its assessment. Journal of MarketingResearch 25 (2), 186–192.
Goodwin, D.R., Mcelwee, R.E., 1999. Grocery shopping and an ageing population:research note. International Review of Retail, Distribution and ConsumerResearch 9 (4), 403–409.
Guiot, D., Roux, D., 2010. A second-hand shoppers' motivation scale: antecedents,consequences, and implications for retailers. Journal of Retailing 86 (4),355–371.
Gunter, B., 1998. Understanding the Older Consumer. Routledge, London, UK.Hair Jr., J.F., Black, W.C., Babin, B.J., Anderson, R.E, 2009. Multivariate Data Analysis,
Seventh ed. Prentice Hall, Upper Saddle River, NJ.Hansen, R.A., Deutscher, T., 1977–1978. An empirical investigation of attribute
importance in retail store selection. Journal of Retailing 53 (4), 59–73.Hare, C., Kirk, D., Lang, T., 1999. Identifying the expectations of older food
consumers: more than a “shopping list” of wants. Journal of Marketing Practice:Applied Marketing Science 5 (6/7/8), 213–232.
Hare, C., Kirk, D., Lang, T., 2001. The food shopping experience of older consumersin Scotland: critical incidents. International Journal of Retail & DistributionManagement 29 (1), 25–40.
Hartman, K.B., Spiro, R.L., 2005. Recapturing store image in customer-based storeequity: a construct conceptualization. Journal of Business Research 58 (8),1112–1120.
Hu, L., Bentler, P., 1999. Cutoff criteria for fit indexes in covariance structureanalysis: conventional criteria versus new alternatives. Structural EquationModeling 6 (1), 1–55.
Hu, H., Jasper, C.R., 2007. A qualitative study of mall shopping behaviors of matureconsumers. Journal of Shopping Centre Research 14 (1), 17–38.
Ivens, B., Valta, K., 2012. Customer brand personality perception: a taxonomicanalysis. Journal of Marketing Management 28 (9/10), 1062–1093.
James, D.L., Durand, R.M., Dreves, R.A., 1976. The use of a multi-attribute attitudemodel in a store image study. Journal of Retailing 52 (2), 23–32.
Jarratt, D., 1996. A shopper taxonomy for retail strategy development. TheInternational Review of Retail, Distribution and Consumer Research 6 (2),196–215.
Jin, B., Kim, J.-O., 2003. A typology of Korean discount shoppers: shopping motives,store attributes, and outcomes. International Journal of Service IndustryManagement 14 (4), 396–419.
Johnson-Hillery, J., Kang, J., Tuan, W., 1997. The difference between elderlyconsumers' satisfaction levels and retail sales personnel's perceptions. Interna-tional Journal of Retail & Distribution Management 25 (4), 126–137.
Kang, Y.S., Ridgway, N.M., 1996. The importance of consumer market interactions asa form of social support for elderly consumers. Journal of Public Policy &Marketing 15 (1), 108–117.
Karande, K., Ganesh, J., 2000. Who shops at factory outlets and why?: anexploratory study. Journal of Marketing Theory and Practice 8 (4), 29–42.

R.J. Angell et al. / Journal of Retailing and Consumer Services 21 (2014) 192–202202
Kim, Y.-K., Kang, J., Kim, M., 2005. The relationships among family and socialinteraction, loneliness, mall shopping motivation, and mall spending of olderconsumers. Psychology and Marketing 21 (12), 995–1015.
Klastorin, T., 1983. Assessing cluster analysis results. Journal of Marketing Research20 (1), 92–98.
Kunkel, J.H., Berry, L.L., 1968. A behavioral conception of retail image. Journal ofMarketing 32 (4), 21–27.
Labouvie-Vief, G., 2009. Dynamic integration theory: emotion, cognition, andequilibrium in later life. In: Bengston, V., Gans, D., Pulney, N., Silverstein, M.(Eds.), Handbook of Theories of Ageing, Second ed. Springer Publishing Co.,New York, NY, pp. 277–293.
Lambert, Z.V., 1979. An investigation of older consumers' unmet needs and wants atthe retail level. Journal of Retailing 55 (4), 35–57.
Leighton, C., Seaman, C., 1997. The elderly food consumer: disadvantaged? Journalof Consumer Studies and Home Economics 21 (4), 363–370.
Leventhal, R.C., 1997. Aging consumers and their effects on the marketplace.Journal of Consumer Marketing 14 (4), 276–281.
Lindquist, J.D., 1974–1975. Meaning of image. Journal of Retailing 50 (4), 29–39.Lumpkin, J.R., 1985. Shopping orientation segmentation of the elderly consumer.
Journal of the Academy of Marketing Science 13 (2), 271–289.Lumpkin, J.R., Greenberg, B.A., Goldstucker, J.C., 1985. Marketplace needs of the
elderly: determinant attributes and store choice. Journal of Retailing 61 (2),75–103.
Lysonski, S., Durvasula, S., Zotos, Y., 1996. Consumer decision-making styles: amulti-country investigation. European Journal of Marketing 30 (12), 10–21.
MacQueen, J.B., 1967. Some Methods for Classification and Analysis of MultivariateObservations, In: Le Cam, L.A., Newman, J., (Eds.), Proceedings of the 5thBerkley Symposium on Mathematical Statistics and Probability. University ofCalifornia Press, Berkeley, CA, pp. 281–297.
Martineau, P., 1958. The personality of the retail store. Harvard Business Review 36,47–55.
Mason, J.B., Bearden, W.O., 1978. Profiling the shopping behavior of elderlyconsumers. The Gerontologist 18 (5), 454–461.
Megicks, P., Memery, J., Angell, R., 2012. Understanding local food shopping:unpacking the ethical dimension. Journal of Marketing Management 28,264–289.
Memery, J., Megicks, P., Angell, R., Williams, J., 2012. Understanding ethical groceryshoppers. Journal of Business Research 65 (9), 1283–1289.
Meneely, L., Strugnell, C., Burns, A., 2009. Elderly consumers and their food storeexperiences. Journal of Retailing and Consumer Services 16 (6), 458–465.
Mitchell, V.W., Bates, L., 1998. UK consumer decision-making styles. Journal ofMarketing Management 14 (1–3), 199–225.
Moschis, G.P., 1976. Shopping orientations and consumer use of information.Journal of Retailing 52, 61–70.
Moschis, G.P., 1992. Marketing to Older Consumers. Quorum Books, Westport, CT.Myers, H., Lumbers, M., 2008. Understanding older shoppers: a phenomenological
investigation. Journal of Consumer Marketing 25 (5), 294–301.Muthen, L., Muthen, B., 2009. Mplus User's Guide, Fifth ed. Muthen & Muthen, Los
Angeles, CA.Office of National Statistics, 2011. Older People's Day 2011(online). Office of
National Statistics, London. Available from: ⟨http://www.ons.gov.uk/ons/dcp171778_235000.pdf⟩ (accessed 04.07.12).
Oxenfeldt, A.R., 1974–1975. Developing a favorable price-quality image. Journal ofRetailing 50 (4), 8–15.
Peter, J.P., 1981. Construct validity: a review of psychometric basic issues and recentmarketing practices. Journal of Marketing Research 18 (2), 133–145.
Pettigrew, S., Mizerski, K., Donovan, R., 2005. The three “big issues” for oldersupermarket shoppers. Journal of Consumer Marketing 22 (6), 306–312.
Punj, G., Stewart, D.W., 1983. Cluster analysis in marketing research: review andsuggestions for application. Journal of Marketing Research 20, 134–148.
Reynolds, K.E., Beatty, S.E., 1999. A relationship customer typology. Journal ofRetailing 75 (4), 509–523.
Reynolds, K.E., Ganesh, J., Lukett, M., 2002. Traditional malls vs. factory outlets:comparing shopper typologies and implications for retail strategy. Journal ofBusiness Research 55 (9), 687–696.
Samli, A.C., Kelly, J.P., Hunt, H.K., 1998. Improving the retail performance bycontrasting management- and customer-perceived store images: a diagnostictool for corrective action. Journal of Business Research 43 (1), 27–38.
Schoefer, K., Diamantopoulos, A., 2009. A typology of consumers' emotionalresponse styles during service recovery encounters. British Journal of Manage-ment 20 (3), 292–308.
Seidman, I., 2006. Interviewing as Qualitative Research: A Guide for Researchers inEducation and the Social Sciences, Third ed. Teachers College Press, New York,NY.
Sharma, S., 1996. Applied Multivariate Techniques. John Wiley and Sons, New York,NY.
Shim, S., Kotsiopoulos, A., 1993. A typology of apparel shopping orientationsegments among female consumers. Clothing and Textiles Research Journal12 (1), 73–85.
Sproles, E., Sproles, G., 1990. Consumer decision-making styles as a function ofindividual learning styles. Journal of Consumer Affairs 24 (1), 134–147.
Sprotles, G.B., Kendall, E.L., 1986. A methodology for profiling consumers' decision-making styles. Journal of Consumer Affairs 20 (2), 267–279.
Stone, G.P., 1954. City shoppers and urban identification: observations on the socialpsychology of city life. American Journal of Sociology 60 (1), 36–45.
Sudbury, L., Simcock, P., 2009. A multivariate segmentation model of seniorconsumers. Journal of Consumer Marketing 26 (4), 251–262.
Tauber, E.M., 1972. Why do people shop? Journal of Marketing 36 (4), 46–49.Teller, C., Gittenberger, E., 2011. Patronage behaviour of elderly supermarket
shoppers—antecedents and unobserved heterogeneity. International Reviewof Retail, Distribution and Consumer Research 21 (5), 483–499.
Theodoridis, P.K., Chatzipanagiotou, K.C., 2009. Store image attributes and customersatisfaction across different customer profiles within the supermarket sector inGreece. European Journal of Marketing 43 (5/6), 708–734.
Thompson, N.J., Thompson, K.E., 2009. Can marketing practice keep up withEurope's ageing population? European Journal of Marketing 43 (11/12),1281–1288.
Ward, J.H., 1963. Hierarchical grouping to optimize an objective function. Journal ofthe American Statistical Association 58 (301), 236–244.
Westbrook, R.A., Black, W.C., 1985. A motivation-based shopper typology. Journal ofRetailing 61 (1), 78–103.
Westbrook, R.A., Oliver, R.L., 1991. The dimensionality of consumption emotionpatterns and customer satisfaction. Journal of Consumer Research 18 (1), 84–91.
Yoon, C., Laurent, G., Fung, H., Gonzalez, R., Gutchess, A., Hedden, T., Lambert-Pandraud, R., Mather, M., Park, D., Peters, E., Skurnik, I., 2005. Cognition,persuasion and decision making in older consumers. Marketing Letters 16 (3/4),429–441.
Yoon, C., Cole, C., Lee, M., 2009. Consumer decision making and aging: currentknowledge and future directions. Journal of Consumer Psychology 19 (1), 2–16.
Zelnio, R.N., Gagnon, J.P., 1981. The construction and testing of an image ques-tionnaire. Journal of the Academy of Marketing Science 9 (3), 288–299.
Zimmer, M.R., Golden, L.L., 1988. Impressions of retail stores: a content analysis ofconsumer images. Journal of Retailing 64 (3), 265–293.