Multivariate Analysis of Factors Responsible for Visual ...
15
FUTY Journal of the Environment Vol. 14 No. 3 September, 2020 20 Multivariate Analysis of Factors Responsible for Visual Pollution in the Central Business District of Ore Town, Ondo State, Nigeria Ebitimi, E. D. and *Ibanga, O.A. Department of Geography & Regional Planning, University of Benin Benin City, Edo State, Nigeria *Correspondence email: [email protected] Abstract One of the key features of many primordial settlements in sub-Saharan Africa and their resurgence as urban centres is visual pollution and deterioration in environmental quality. This is due to the inability of city authorities to regulate what is assembled, built or displayed in public spaces. The paper deals with multivariate analysis of factors responsible for visual pollution in the Central Business District (CBD) of Ore Town, Ondo State, Nigeria. Fifty indicators capable of causing visual pollution were sourced from field survey of 133 respondents selected randomly using structured questionnaire. Data analysis was carried out using descriptive statistics and factor analysis/principal component analysis (FA/PCA) in SPSS. Results showed that about 69.6% of the combined effects of 50 factors explained the variations in visual pollution in the CBD of Ore Town with a 30.4% error margin. Based on the first extracted component, disorderly placement of posters, chaotic arrangement of electricity lines/pole, haphazard arrangement of signposts/billboards, graffiti (writing on roads, fences and public areas) and potholes on road were identified as the most pressing factors responsible for visual pollution in the CBD of Ore Town. Multivariate statistics with the use of FA/PCA, therefore, demonstrated a veritable and robust analytical framework in assessing complex indicators of global environmental change to support policy and sustainable development. The study recommended massive urban sensitization, infrastructure renewal and planning which take into cognizance anthropogenic and ecological disasters to restore and guarantee visual esthetics and environmental quality. Keywords: Factor Analysis, PCA, Pollution, Visual, Ore Town INTRODUCTION One of the key features of many primordial settlements in sub-Saharan Africa and their resurgence as urban centres is deterioration in visual environmental appearance and quality. In 1950, about 30% of the world’s population lived in urban areas which later increased to about 4.2 billion people (55%) at the end of 2018 with a projected figure of 751 million people (68%) by 2050 (United Nations Department of Economic and Social Affairs-UN DESA, 2018). Daily, rural-urban drift have transformed many prehistoric settlements who were hitherto population clusters (Ur et al., 2007), antique settlers (Biello, 2007) and a peculiar model of houses scattered out from the inner religious compounds like shrines (Mark, 2014) to vibrant spaces of growth, shrink, and transformations (Piro and Ganser, 2016). These developments creates momentous adverse consequences particularly when the seeming prospects offered by the urban centres are not met. Added to the urban decay are poor planning and ineffective governance strategies by municipal authorities to contain the hurried changes. The tipping point is not only the decline in visual
-
Upload
khangminh22 -
Category
Documents
-
view
0 -
download
0
Transcript of Multivariate Analysis of Factors Responsible for Visual ...
FUTY Journal of the Environment Vol. 14 No. 3 September, 2020
20
Multivariate Analysis of Factors Responsible for Visual Pollution in the
Central Business District of Ore Town, Ondo State, Nigeria
Ebitimi, E. D. and *Ibanga, O.A.
Department of Geography & Regional Planning, University of Benin
Benin City, Edo State, Nigeria
*Correspondence email: [email protected]
Abstract
One of the key features of many primordial settlements in sub-Saharan Africa and their resurgence
as urban centres is visual pollution and deterioration in environmental quality. This is due to the
inability of city authorities to regulate what is assembled, built or displayed in public spaces. The
paper deals with multivariate analysis of factors responsible for visual pollution in the Central
Business District (CBD) of Ore Town, Ondo State, Nigeria. Fifty indicators capable of causing
visual pollution were sourced from field survey of 133 respondents selected randomly using
structured questionnaire. Data analysis was carried out using descriptive statistics and factor
analysis/principal component analysis (FA/PCA) in SPSS. Results showed that about 69.6% of the
combined effects of 50 factors explained the variations in visual pollution in the CBD of Ore Town
with a 30.4% error margin. Based on the first extracted component, disorderly placement of
posters, chaotic arrangement of electricity lines/pole, haphazard arrangement of
signposts/billboards, graffiti (writing on roads, fences and public areas) and potholes on road
were identified as the most pressing factors responsible for visual pollution in the CBD of Ore
Town. Multivariate statistics with the use of FA/PCA, therefore, demonstrated a veritable and
robust analytical framework in assessing complex indicators of global environmental change to
support policy and sustainable development. The study recommended massive urban sensitization,
infrastructure renewal and planning which take into cognizance anthropogenic and ecological
disasters to restore and guarantee visual esthetics and environmental quality.
Keywords: Factor Analysis, PCA, Pollution, Visual, Ore Town
INTRODUCTION
One of the key features of many primordial settlements in sub-Saharan Africa and their resurgence
as urban centres is deterioration in visual environmental appearance and quality. In 1950, about
30% of the world’s population lived in urban areas which later increased to about 4.2 billion people
(55%) at the end of 2018 with a projected figure of 751 million people (68%) by 2050 (United
Nations Department of Economic and Social Affairs-UN DESA, 2018). Daily, rural-urban drift
have transformed many prehistoric settlements who were hitherto population clusters (Ur et al.,
2007), antique settlers (Biello, 2007) and a peculiar model of houses scattered out from the inner
religious compounds like shrines (Mark, 2014) to vibrant spaces of growth, shrink, and
transformations (Piro and Ganser, 2016). These developments creates momentous adverse
consequences particularly when the seeming prospects offered by the urban centres are not met.
Added to the urban decay are poor planning and ineffective governance strategies by municipal
authorities to contain the hurried changes. The tipping point is not only the decline in visual

FUTY Journal of the Environment Vol. 14 No. 3 September, 2020
21
esthetics but the deterioration in overall physical environmental appearance and quality, hence,
visual pollution.
According to Milan and Tanaya (2015), human initial intuition of a neighborhood is its visual
environment that entails a mosaic of built and natural forms. Visual pollution is defined as the
whole of irregular formations (Kan et al., 2012 cited in Jana and De, 2015). It may refer to
everything altered by human activities that are unattractive and affect people’s ability to enjoy or
appreciate the view and vista. Anything that interferes with the beautiful scenerie and other
defacements may become a cause of visual pollution (Chmielewski et al., 2015). It may consist of
garbage (solid waste) thrown in different places, cables or wires running in the urban areas in an
unorganized fashion, billboards ill-arranged and alluring, old decaying buildings, discarded civil
and structural engineering supplies, electricity poles, telecommunication masks, skywriting etc
(Cvetković, 2018; Wakil, 2019). They are subjective and literally, depend on the eye of the
beholder.
Nevertheless, the eye, which is the perceptory organ for visual esthetics, get modified on prolonged
exposure to visual pollutants. Visual blight and visual clutter are two terms of relevance here.
Visual blight may refer to dazzling billboards, power lines, ugly buildings etc (Kumar and De,
2015). Visual pollution occurs everyday in an uncontrolled urban fabric and the built environment.
It may impair a person’s ability to find certain objects in such environments or in finding a person
we are trying to meet in the street (Asher, 2013). Factors responsible for visual pollution are
multifarious, including administrative negligence, excessive advertisement, and vandalism. A
situation where the municipal authority loses control over what is built or assembled in public
spaces often leads to visual pollution. Visual pollution is also a consequences of the inability of
city planners and managers to know where to put what and what is displayed on the street. Besides,
when the problem of buildings in unauthorized locations are left unresolved no matter who is
involved, visual pollution is inevitable.
Similarly, excessive advertisements are oftentimes literally suffocating because not even the green
areas (trees, land, parks, etc.) are spared in the desire to ensure good visibility (Bankole, 2013).The
existence of disorganized, torn, unequal and giant billboards also creates visual pollution. Despite
the fact that advertisement does inform the consumers about different products but the social and
cultural implications of excessive advertisement remain unclear and have stirred intellectual
attention in many circles. There is this confusion between perception and interpretation. Anti-
social menaces which include vandalism, graffiti, offensive messages, obscenities, buildings and
street markings of course contribute to visual pollution (Kumar and De, 2015; Shrivastava and
Choudhary, 2016; Nami et al., 2016).
The effects of exposure to visual pollution may be vast and penetrating. They include distraction,
decreases in opinion diversity, and loss of identity (Yilmaz, 2011). It also include traffic congestion
and health hazards of diverse kinds (Jana and De, 2015). Robol (2012) also reported irritability
and psychological disturbances as well as eye fatigue as among the effects of exposure to visual
pollution. Other consequences of visual pollution include loss of sense of hygiene and aesthetics,
feeling of civility in addition to the overall loss of quality of life of individuals residing in the
community. Moreover, teenagers who are highly exposed to visual pollution from childhood are

FUTY Journal of the Environment Vol. 14 No. 3 September, 2020
22
generally bereft of subtle aesthetics and they get used to these unsightly surroundings thereby
losing their natural desire to correct it (Yusuf, 2013).
When almost all urban and suburban areas are infested with the same kind of visual pollution, it
naturally eliminates the uniqueness of each place and causes homogenization of our communities
(Jana and De, 2015). Areas free from visual clutter, like a huge lawn, a picturesque landscape, a
forest, hills, greeneries etc. are visually soothing, they help to re-energize human wellbeing, soothe
our pains and restore our productivity. Thus, though we feel that the visual environment is integral
to our daily experience of the built and natural worlds yet, the altering of this visual environment
is often taken for granted (Jana and De, 2015).
Iyorakpo (2015) stressed that the rate of rapid urbanization taking place in many primordial
settlements in sub-Saharan Africa will lead to the emergence of several unplanned structures,
haphazard deposition of refuse, lack of drainage, inadequate housing facilities, among others.
These problems associated with urbanization and other consequences of unplanned and
uncontrolled urban growth and the consequent impacts are widespread. In Ore Town, Ondo State,
Nigeria, visual pollution has created serious environment, development, governance and planning
challenges to municipal authorities and the city dwellers. Thus, in an attempt to investigate the
complexities and interrelations of several factors responsible for visual pollution, several
frameworks including multivariate analysis abound in the literature.
Multivariate analysis has been conceptualized to refer to any statistical framework capable of
evaluating the complex interrelationships, causes and effects of several factors responsible for
certain or multiple phenomena in space and time simultaneously (Johnson and Wichern, 2007;
Hair Jr et al., 2010). Notable multivariate frameworks used in environmental pollution and quality
analysis include multiple linear regression analysis, discriminant analysis, cluster analysis, factor
analysis (FA), principal component analysis (PCA), biplots, multidimensional scaling, and
canonical correlations among other (Manoj and Padhy, 2014; Marden, 2015; Chmielewski et al.,
2015; Ebqa’ai and Ibrahim, 2017; Cvetković et al., 2018; Nuñez-Alonso et al., 2019). In all, FA
and PCA is very flexible and have enjoyed extensive application in environment and development
research. They have inherent ability to reduced several redundant variables into most important
components (Manoj and Padhy, 2014; Marden, 2015). It is based on these capabilities that the
study deployed PCA-based multivariate approach in the assessment of the visual quality in Ore
Town, Ondo State, Nigeria. The prime motivation is to contribute to enhancing urban planning
and management. Consequently, this study hypothesized that there is no significant relationship
between visual aesthetic factors and visual pollution in the Central Business District (CBD) of Ore
Town, Ondo State, Nigeria.
METHODOLOGY
Study Area This study was carried in the CBD of Ore Town, Ondo State, Nigeria. Ore is the administrative
headquarters of Odigbo Local Government Area (LGA), Ondo State as seen in Figure 1. It lies
approximately between latitude 6O 43’ and 6O 47’ North of the Equator and longitude 4O 51’and
4O 55’ East of the Greenwich Meridian.

FUTY Journal of the Environment Vol. 14 No. 3 September, 2020
23
Figure 1: Ore Town Showing the Central Business District (Study Zone)
Ore, which is a nodal town serving as a linkage between the eastern and western parts of Nigeria
occupies a land area of about 66.2km2. The town has been experiencing unprecedented growth in
the past decade both in population and in physical expansion. As of 1964, Ore was a mere road
junction where motorists from Lagos to the eastern part of Nigeria stopped-over to refuel their
vehicles, eat and also engage in other social activities. The surrounding land was a thick forest
where people mainly traders and farmers engaged in subsistence and commercial farming. This

FUTY Journal of the Environment Vol. 14 No. 3 September, 2020
24
was before the civil war. During the Nigeria Civil War of 1967-1970, it was also a military base
for the Nigeria troops. There were the defunct 202 infantry battalions and a small military camp at
Constain which is a small settlement near Ore. From 1986 various factors have contributed to the
emergence of Ore as one of the major urban settlement in Ondo state The increase in population
which affects the expansion of the town was due to increase in commercial activities, and most
importantly the location of the town as a nodal town (Aguda et al., 2013).
The CBD of Ore Town in 1964 was estimated to be approximately 1.2km2 which is approximately
2 percent of the study area. The study area in Ore Town grew to about 11.3km2 (18 percent of the
total land area) in 1986 and 13.2km2 (approximately 21.2 percent of the total land area) in 2002.
The possible expansion value of the town by the year 2027 was also calculated using the average
rate of expansion of 1964 to 1986 and 1986 to 2002. Therefore, expansion value in 2027 would be
55.33km2 (Aguda et al, 2013). The population of Odigbo LGA was put at 230,351 (NPC, 2006).
The current population of Ore Town, the administrative headquarter of the local government is
about 183,821.
In terms of climate, Ore Town is located within the Humid Tropical climate with an absolute yearly
precipitation of between 1500-2000mm. It is set apart by two unmistakable seasons. The dry
season happens among November and March while the rainy season starts from April to October.
The temperature changes from 210C to 290C during the time with a normal estimation of 250C.
The mean month to month relative moistness is under 70%. The regular vegetation of this zone is
of the swamp tropical rainforest type, made out of an assortment of hardwood timbers. An
important aspect of the vegetation of the study area is the prevalence of tree crops. The major tree
crops include cocoa, coffee, rubber oil palms and citrus, cocoa being the most prevalent over most
of the state. The natural vegetation has been very much degrading as a result of human activities,
the chief which is based on the rotation of the bush fallow system. As a result, the original
vegetation is now restricted to the forest reserve.
The economic activities in the CBD of Ore Town are highly influenced by the nodal nature of the
town. These economic activities can be classified into primary, secondary and tertiary activities.
Primary economic activities mainly include farming, hunting, lumbering. Secondary activities
include cottage industries scattered all over the place such as asawmill, hotel services, and furniture
industries. The major tertiary activities in the CBD of Ore Town include services such as banking
and marketing. Also, industrial activity prominent in Ore Town is the location of Nigeria National
Petroleum Corporation (NNPC) depot. In addition, the CBD of Ore Town provides an enabling
environment for the growth of retail and social services as a result of the links it has with other
regions (Ondo, Benin City, Okitipupa and Sagamu).
Research Design, Datasets, Sources, Sampling Procedures
This study adopted survey research approach with principal data retrieved from fieldwork using
structured questionnaire as the main research instrument. The Institute of Food and Agricultural
Sciences, University of Florida (IFAS, 2008) sample size framework was used in the selection of
399 respondents from the 2019 projected population of 183,821 in Ore Town. The formula is
presented in equation1 as:

FUTY Journal of the Environment Vol. 14 No. 3 September, 2020
25
n =N,
[1+N (e)2] (1)
Where: n= sample size, N= population size, and e = margin of error which is 0.05 or 5%
A total of 50 environmental descriptors representing aesthetic variables/factors capable of
impacting negatively on the visual appearance of the town were identified. They were generated
from previous studies and field reconnaissance. The CBD was randomly selected and based on the
sampling size of 399, 133 questionnaires were administered at this sampling/spatial unit. In each
of the streets, a stratified sampling method was adopted at every tenth house on each side of the
street until the questionnaires were exhausted. During the field survey, respondents were asked to
list the five most important aesthetic variables/factors responsible for visual pollution in their
neighbourhood. Respondents were also expected to express their opinions on the 50 visual
pollution factors using a five-point Likert framework. The scale ranged from Very serious/very
impactful, Serious/impactful, somewhat serious/some impact, no serious/little impact and no real
impact. These scales indicated the extent to which each of the 50 esthetic variables/factors listed
caused visual pollution in their neighbourhood.
Analytical Frameworks The multivariate statistical analysis deployed in the investigation of the 50 factors responsible for
visual pollution in the CBD of Ore Town was factor analysis. Factor analysis (FA) is an inferential
statistical technique (Marden, 2015) deployed primarily to either reduce large volume of data to a
manageable size. The technique can also uncover the underlying configuration within the dataset
(Chmielewski et al., 2015; Ebqa'ai and Ibrahim, 2017). In data reduction, FA eliminates
unnecessary (extremely associated) variables from the data file and possibly substituting the whole
dataset with a less significant number of uncorrelated variables (Cvetković et al., 2018; Nuñez-
Alonso et al., 2019). The purpose of structure detection is to examine the underlying (or latent)
relationships between the variables (Marden, 2015).
The aim of deploying the FA framework in this research was for data reduction where principal
component analysis (PCA) was used. The PCA begins by finding a linear grouping of variables
(component) capable of explaining as much variation in the original variables as possible (Kline,
1994). It then finds another component that accounts for as much of the remaining discrepancy as
possible and is uncorrelated with the previous component, continuing in this way until there are as
many components as original variables. Usually, a few components will account for most of the
variation, and these components can be used to replace the original indicators. In this study, 50
aesthetic variables/factors of visual pollution in Ore Town were extracted from questionnaires.
Factor analysis was then used to test the proposed hypothesis which states that “there is no
significant relationship between visual aesthetic factors and visual pollution in Ore Town”.
RESULTS AND DISCUSSION
Demographic characteristics of survey participants The result of the demographic characteristics of survey participants indicates that 76 (36.2%) were
male while 69 (36.5%) were female. Also, 32 (24.1%) of the respondents were under the age grade
FUTY Journal of the Environment Vol. 14 No. 3 September, 2020
26
of 20 - 29 years, 37 (27.8%) were under the age grade of 30 - 39 years, 36 (27.1%) were under the
age grade of 40 - 99 years, 19 (14.3%) were under the age grade of 50 - 59 years while 9 (6.8%)
were 60 years and above. Besides, education has been adjudged as the bedrock of sustainable
development. Thus, majority (n = 56; 42.1%) of the survey respondents were educated up to
secondary level, 33 (24.8%) had primary education, 26 (19.5%) were educated up to tertiary level,
14 (10.5%) acquired professional qualification whereas 4 (3%) had no formal education.The
findings on sex contradict earlier results of Kquofi and Glover (2012) whose majority of the study
respondents were female while that of age corroborates the same authors where age category 20-
55 years constituted majority of the participants. The finding on educational qualification also
implied that the majority of the study respondents were literate with considerable aptitudes to
effectively perceive visual pollution in the area. Again, this result agrees with Kquofi and Glover
(2012) findings in Kumasi region of Ghana.
Factors Responsible for Visual Pollution in Ore Town A total of 50 aesthetic factors responsible visual pollution in the CBD of Ore Town and other
emerging urban centre were extracted from the literature and field surveys. These variables were
presented to respondents who selected five most prevalent factors which disfigure or reduce the
visual aesthetics in the neighbourhood. At the end of the survey, related factors were carefully
sorted, grouped in the order of importance and ranked based on the number of occurrences (count)
of each factor and the result is presented in Table 1. As it could be seen, old
buildings/structures/houses and roof emerged the top ranked factor causing visual pollution in the
CBD of Ore Town based on the count of 71 respondents. The 2nd most perceived factor was
drainage related issues (no gutters, blocked drainage, waterlogged/stagnant water on the street,
flooding and erosion) based the rating of 66 respondents.
The 3rd most perceived factor was filthiness/street littering/offensive odour from neighbourhood
based on the rating of 61 respondents while the 4th was untarred street/road network based on the
response of 59 respondents. The 5th most perceived factor was roadside trading/inappropriate
display of goods on main roads/streets as a result of the rating of 52 study participants. On the
contrary, undeveloped bushy areas, contrasting building colours as well as chaotic arrangement of
electricity pools/lines and communication masks were all ranked the 24th factors responsible for
visual pollution in Ore Town. Details of other factors and their respective ranks are all presented
in Table 1.
Relationship between visual aesthetic factors and visual pollution in the CBD
The postulated hypothesis bordered on the relationship between the 50 aesthetic variables/factors
reducing visual appearance and visual pollution in Ore Town. Factor analysis (FA) with principal
component analysis (PCA) algorithm in SPSS 22 were used. To ascertain the adequacy of the
sample, Kaiser-Meyer-Olkin (KMO) and Bartlett's Tests were used and the result is shown in Table
2. However, previous analysis by Arumugam et al (2010) showed that KMO coefficient of more
than 0.60 is good enough for PCA to be executed. Thus, at 95% confidence level, the sample was
declared adequate and fit for FA/PCA to be carried out based on the KMO of 0.643.

FUTY Journal of the Environment Vol. 14 No. 3 September, 2020
27
Table 1: Frequency count and ranking of most important aesthetic variables/factors that cause visual
pollution in the CBD of Ore Town
Esthetic variables/factors Count Rank Esthetic variables/factors Count Rank
Old Buildings/Structures/
Houses and Roof
71 1st Dumped/Abandoned household and
construction materials/junk
materials
11 15th
Drainage related issues (No
gutters, blocked drainage,
waterlogged/stagnant water on
the street, flooding and erosion)
66 2nd Unpainted houses, building and
structures
9 16th
Filthiness/street
littering/offensive odour from
neighbourhood
61 3rd Dust especially during hamatan and
dry season
8 17th
Untarred street/road network 59 4th Dilapidated buildings/structures 7 18th
Roadside trading/inappropriate
display of goods on main
roads/streets
52 5th Pest infestation and loitering of
streets by animals
6 19th
Crowded buildings/houses/
structures
45 6th Buildings, houses and shops too
close to roads/streets and
development in unauthorized/
unplanned areas
6 19th
Lack of/Poor/Bad/Narrow Road
Network
43 7th Roadside gambling/ smoking/
hooligans/ rapist at night
5 20th
Poor Hygiene 34 8th Graffiti/writing on the roads, fence,
walls and disorderly placement of
posters, sign posts and banners at
public places
5 20th
Too many shops and kiosk 27 9th Incompatible land
uses/encroachment of commercial
activities into residential areas
4 21st
Poor street layout/planning/
beautification
18 10th Absence of walkway 4 21st
Waste management issues
(indiscriminate dumping of
refuge along the road and
gutters/poor evacuation)
18 10th Uncompleted buildings/abandoned
projects
3 22nd
Roadside parking/abandoned
vehicles
16 11th Rugged topography 3 22nd
Poor Housing/building design 16 11th Absence of open space 2 23rd
Vehicular traffic congestion 15 12th Poor street maintenance 2 23rd
Too many wooden, substandard
and make-shift structures
15 12th Absence of flowers and ornamental
trees
2 23rd
Poor infrastructural amenities 13 13th Undeveloped bushy areas 1 24th
Poor street lighting especially at
night
12 14th Contrasting building colours 1 24th
Potholes on the road 12 14th Chaotic arrangement of electricity
pools/lines and communication
masks
1 24th
FUTY Journal of the Environment Vol. 14 No. 3 September, 2020
28
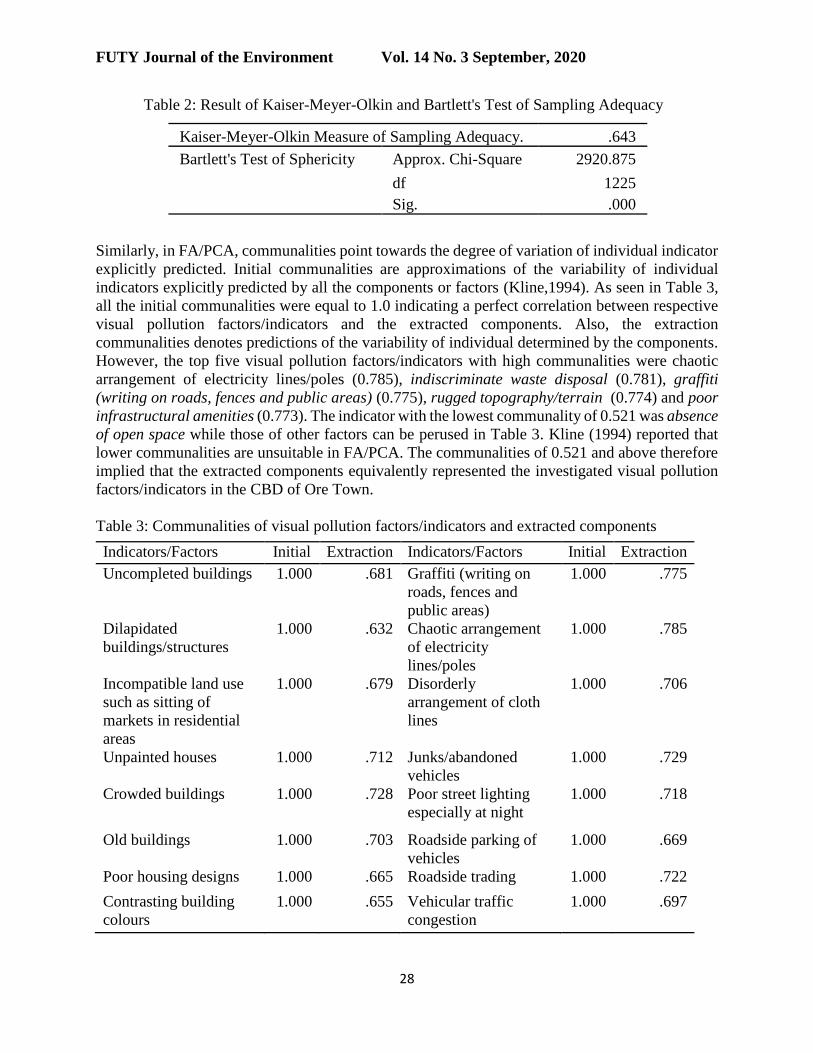
Table 2: Result of Kaiser-Meyer-Olkin and Bartlett's Test of Sampling Adequacy
Kaiser-Meyer-Olkin Measure of Sampling Adequacy. .643
Bartlett's Test of Sphericity Approx. Chi-Square 2920.875
df 1225
Sig. .000
Similarly, in FA/PCA, communalities point towards the degree of variation of individual indicator
explicitly predicted. Initial communalities are approximations of the variability of individual
indicators explicitly predicted by all the components or factors (Kline,1994). As seen in Table 3,
all the initial communalities were equal to 1.0 indicating a perfect correlation between respective
visual pollution factors/indicators and the extracted components. Also, the extraction
communalities denotes predictions of the variability of individual determined by the components.
However, the top five visual pollution factors/indicators with high communalities were chaotic
arrangement of electricity lines/poles (0.785), indiscriminate waste disposal (0.781), graffiti
(writing on roads, fences and public areas) (0.775), rugged topography/terrain (0.774) and poor
infrastructural amenities (0.773). The indicator with the lowest communality of 0.521 was absence
of open space while those of other factors can be perused in Table 3. Kline (1994) reported that
lower communalities are unsuitable in FA/PCA. The communalities of 0.521 and above therefore
implied that the extracted components equivalently represented the investigated visual pollution
factors/indicators in the CBD of Ore Town.
Table 3: Communalities of visual pollution factors/indicators and extracted components
Indicators/Factors Initial Extraction Indicators/Factors Initial Extraction
Uncompleted buildings 1.000 .681 Graffiti (writing on
roads, fences and
public areas)
1.000 .775
Dilapidated
buildings/structures
1.000 .632 Chaotic arrangement
of electricity
lines/poles
1.000 .785
Incompatible land use
such as sitting of
markets in residential
areas
1.000 .679 Disorderly
arrangement of cloth
lines
1.000 .706
Unpainted houses 1.000 .712 Junks/abandoned
vehicles
1.000 .729
Crowded buildings 1.000 .728 Poor street lighting
especially at night
1.000 .718
Old buildings 1.000 .703 Roadside parking of
vehicles
1.000 .669
Poor housing designs 1.000 .665 Roadside trading 1.000 .722
Contrasting building
colours
1.000 .655 Vehicular traffic
congestion
1.000 .697

FUTY Journal of the Environment Vol. 14 No. 3 September, 2020
29
Encroachment of
commercial activities
into residential areas
1.000 .584 Haphazard
arrangement of
signposts/billboards
1.000 .736
Untarred road 1.000 .600 Communication masts 1.000 .607
Potholes on road 1.000 .688 Inappropriate display
of goods along major
streets
1.000 .711
Absence of road
network
1.000 .684 Offensive odour from
neighbourhood
1.000 .675
Narrow road network 1.000 .695 Erosion 1.000 .724
Absence of walkway 1.000 .760 Flooding 1.000 .682
Non adherence to
planning standards
1.000 .690 Stagnant
water/waterlogged
streets
1.000 .576
Poor street layout 1.000 .650 Dust 1.000 .687
Undeveloped bushy
areas
1.000 .715 Rugged
topography/terrain
1.000 .774
Street littering 1.000 .737 Blocked drainages 1.000 .662
Indiscriminate waste
disposal
1.000 .781 Absence of drainages 1.000 .667
Absence of open space 1.000 .521 Absence of
ornamentals
1.000 .693
Poor evacuation of
waste
1.000 .733 Dumped household
appliances and objects
1.000 .694
Poor hygiene/filthiness 1.000 .664 Makeshift structures
e.g. shops and kiosk,
etc.
1.000 .770
Loitering of streets by
animals
1.000 .701 Poor infrastructural
amenities
1.000 .773
Pest infestation 1.000 .747 Old building roofs 1.000 .701
Disorderly placement
of posters
1.000 .720 Dumped/abandoned
construction materials
1.000 .730
The total variance explained by the initial solution as well as the extracted components is presented
in Table 4. Based on Kaiser principle (Nuñez-Alonso, 2019), eigenvalues exceeding 1 were
extracted during the analysis, thus making the first 15 principal components to form the extracted
solution. In general, the results in the extracted components showed that the 15 components
explained about 69.6% of the variability in the original 50 factors with about 30.4% loss of
information. However, the first five components significantly explained about 40.5% of the
variability of visual pollution in the CBD of Ore Town.

FUTY Journal of the Environment Vol. 14 No. 3 September, 2020
30
Table 4: Components and Total Variance Explained
Components Initial Eigenvalues Extraction Sums of Squared
Loadings
Total % of
Variance
Cumulative
%
Total % of
Variance
Cumulative
%
1 7.212 14.423 14.423 7.212 14.423 14.423
2 4.700 9.400 23.823 4.700 9.400 23.823
3 3.199 6.398 30.221 3.199 6.398 30.221
4 2.709 5.417 35.638 2.709 5.417 35.638
5 2.429 4.857 40.495 2.429 4.857 40.495
6 2.085 4.171 44.666 2.085 4.171 44.666
7 1.853 3.707 48.373 1.853 3.707 48.373
8 1.715 3.430 51.803 1.715 3.430 51.803
9 1.649 3.297 55.100 1.649 3.297 55.100
10 1.419 2.838 57.937 1.419 2.838 57.937
11 1.330 2.661 60.598 1.330 2.661 60.598
12 1.263 2.526 63.124 1.263 2.526 63.124
13 1.155 2.310 65.435 1.155 2.310 65.435
14 1.070 2.139 67.574 1.070 2.139 67.574
15 1.005 2.010 69.584 1.005 2.010 69.584
Component 1 had the highest eigenvalues of 7.212 contributing 14.4% to the overall variability in
the original 50 variables while Component 2 had eigenvalues of 4.7 (9.4% of variability). In
contrast, Component 3 had eigenvalues of 3.199 (6.4% of variability), Component 4 had
eigenvalues of 2.709 (5.4% of variability) whereas Component 5 had eigenvalues of 2.429 (4.5%
of variability). The 15th Component (eigenvalues of 1.005) was the lowest contributor (2.01%) to
the overall variability in the original 50 variables.
To establish the relationships between the extracted components and the 50 factors responsible for
visual pollution in the CBD of Ore Town, the first component was used. This is because the
component had the highest eigenvalue and hence, influence the variability in the original 50
factors. Zare et al (2011) and Nuñez-Alonso (2019) reported that in most scenarios, majority of
the variation in the main data is always explained by the 1st extracted component.
Based on these principles, the abridged version of the component matrix of the 1st principal
component and rank is presented in Table 5. It shows the relationship between the1st principal
component and the top five factors responsible for visual pollution in the CBD of Ore Town. These
first five factors were highly correlated with the 1st component based on (loadings ≥ 0.5). These
include disorderly placement of posters (0.639), chaotic arrangement of electricity lines/pole
(0.608), haphazard arrangement of signposts/billboards (0.604), graffiti (writing on roads, fences
and public areas (0.551) and potholes on the road (0.545).

FUTY Journal of the Environment Vol. 14 No. 3 September, 2020
31
Table 5: Abridged Version of Factor Loadings from the 1st Principal Component and Rank
Factors/Indicators Loadings Rank
Disorderly placement of posters 0.639 1
Chaotic arrangement of electricity lines/poles 0.608 2
Haphazard arrangement of signposts/billboards 0.604 3
Graffiti (writing on roads, fences and public areas) 0.551 4
Potholes on road 0.545 5
Nevertheless, a retrospective appraisal of the first five factors that were highly correlated with the
1st component using their coefficients of multiple determination (CMD) revealed intriguing
findings. The deployment of CMD of the indicators also facilitated the arrival of more definitive
conclusions regarding the extent to which each factor contributed to visual pollution in the Central
Business District of Ore Town. Thus, disorderly placement of posters contributed about 41% to
visual pollution in the Central Business District of Ore Town. Also, 37% of the visual pollution in
the Central Business District of Ore Town can be attributed to chaotic arrangement of electricity
lines/pole and 36% byhaphazard arrangement of signposts/billboards.
On the other hand, graffiti (writing on roads, fences and public areas accounted for 30% of the
visual pollution in the CBD of Ore Town while 29.7% can be linked to the presence of potholes
on road. Interestingly, this study noticed disparities between the factors perceptually ranked by the
respondents and the visual pollution factors empirically determined using FA/PCA. Besides,
although the variability was noticed in all the factors responsible for visual pollution in the CBD
of Ore Town, they were statistically significant at 0.05 level of confidence. This led to the rejection
of the null hypothesis and the adoption of the alternate hypothesis. This implied that there is
significant relationship between visual aesthetic factors and visual pollution in the Central
Business District of Ore Town.
These findings however agrees with earlier reports by Bankole (2013), Kumar and De (2015),
Shrivastava and Choudhary (2016) and Nami et al (2016) among others. For instance Bankole
(2013) reported that the proliferation of billboards in many urban centers in Nigeria is responsible
for the visual disorder and sensual difficulty vis-à-vis reduction visual responsiveness with
grievous implication on urban development and planning. Kumar and De (2015) also linked the
proliferation of billboards to health related hazards, obstruction of radio and telecommunication
signals, creation of distraction to drivers and blocks birds’ navigation. Shrivastava and Choudhary
(2016) also attributed the causes of visual pollution to the interplay between human perception,
familiarity, ethical necessities, obvious features of market locations, buildings and business
symbols and announcements such as style, arrangement, density, and disparity. Nami et al (2016)
also reported that the cities’ environmental quality, attractiveness, pleasure, bliss and urban vigor
have been negatively impacted by the menace of visual pollution.
CONCLUSION
The study attempted an assessment of factors responsible for visual pollution in the CBD of Ore
Town, Ondo State, Nigeria. A total of 50 environmental descriptors representing aesthetic
variables/factors capable of causing visual pollution were reduced to 15 components with the aid
of FA/PCA multivariate analytical framework. At 95% level of confidence, the study established

FUTY Journal of the Environment Vol. 14 No. 3 September, 2020
32
that there is significant variation in the 50 aesthetic variables/factors responsible for visual
pollution. Consequently, about 69.6% of the combined effects of 50 factors could explain the
variations in visual pollution in the CBD of Ore Town with a 30.4% error margin. Based on the
first extracted component, disorderly placement of posters, chaotic arrangement of electricity
lines/pole, haphazard arrangement of signposts/billboards, graffiti (writing on roads, fences and
public areas, potholes on road, disorderly arrangement of cloth lines and flooding were identified
as the pressing factors responsible for visual pollution in the CBD in Ore Town. Multivariate
statistics with the use of FA/PCA, therefore, demonstrated a veritable and robust analytical
framework in assessing complex indicators of global environmental change to support policy and
sustainable development. The onus, therefore, lies on all critical stakeholders including urban
dwellers, developers, entrepreneurs and the planning authorities to evolve a workable governance
framework to check billboards/posters proliferations, indiscriminate display of textile wares and
graffiti. There is also the need for massive urban sensitization, infrastructure renewal and planning
which take into cognizance anthropogenic and ecological disasters to restore and guarantee visual
esthetics and environmental quality.
References
Arumugam, N., Fatimah, M. A., Chiew, E. F. C. and Zainalabidin, M. (2010). Supply
chain analysis of fresh fruits and vegetables (FFV): prospects of contract farming.
Agricultural economics.Vol. 56(9), pp. 435-442.
Asher, M. F., Tolhurst, D. J., Troscianko, T. and Gilchrist, I. D. (2013). Regional effects of clutter
on human target detection performance. Journal of Vision. Vol.13 (5-25), pp. 1-15.
Bankole, O. E. (2013). urban environmental graphics: impact, problems and visual pollution of
signs and billboards in Nigerian Cities. International Journal of Education and Research.
Vol. 1 (6), pp. 1-12.
Biello, D., (2007). Ancient squatters may have been the world’s first suburbanites. Scientific
American Newsletter August 30, 2007. Retrieved on 26th March, 2020 from
https://www.scientificamerican.com/article/ancient-squatters-worlds-first-suburbanites/
Chmielewski, S., Lee, D. J., Tompalski, P., Chmielewski, T. J. and Wężyk, P. (2015). Measuring
visual pollution by outdoor advertisements in an urban street using intervisibility analysis
and public surveys. International Journal of Geographical Information Science. DOI:
10.1080/13658816.2015.1104316
Cvetković, M., Momčilović-Petronijević1, A. and Ćurčić, A. (2018). Visual pollution of urban
areas as one of the main issues of the 21st Century. 26th International Conference
Ecological Truth & Environmental Research, 12-15 June 2018, Bor Lake, Bor, Serbia.
Ebqa'ai, M. and Ibrahim, B. (2017). Application of multivariate statistical analysis in the pollution
and health risk of traffic-related heavy metals. Environmental Geochemistry and Health.
Vol.39(6), pp.1441-1456. doi:10.1007/s10653-017-9930-9.
Ganser, R. and Piro, R. (2016). Parallel patterns of shrinking cities and urban growth: Spatial
planning for sustainable development of city regions and rural areas. New York:
Routledge.
Gulgundi, M. S. and Shetty, A. (2018). Groundwater quality assessment of urban Bengaluru using
multivariate statistical techniques. Applied Water Science. Vol. 8 (43), pp. 1-15.
https://doi.org/10.1007/s13201-018-0684-z

FUTY Journal of the Environment Vol. 14 No. 3 September, 2020
33
Hair (Jr), J. F. K., Black W. C., Babin, B. J. and Anderson R. E. (2010). Multivariate data
analysis. New Jersey: Pearson Prentice Hall.
Iyorakpo, J. (2015). Impact of rapid urbanization on environmental quality in Yenegoa metropolis.
European Scientific Journal. Vol. 11 (23), pp.1857-1881.
Jana, M. K and De, T. (2015). Visual pollution can have a deep degrading effect on urban and
suburban community: A study in few places of Bengal, India, with special reference to
unorganized billboards. European Scientific Journal. Special edition, pp. 1-14.
Johnson, R. A. and Wichern, D. W. (2007). Applied multivariate statistical analysis.
New Jersey, Pearson Prentice Hall.
Kline, P. (1994). An easy guide to factor analysis. London: Routledge.
Kquofi, S. and Glover, R. (2012). Awareness level of environmental aesthetics on KNUST
Campus, Kumasi, Ghana: A descriptive account. Journal of Environment and Earth
Science. Vol. 2 (10), pp. 84-92.
Kumar, M. and De, T. (2015). Visual pollution can have a deep degrading effect on urban
and suburban community: A study in few places of Bengal, India, with special reference
to unorganized billboards. European Scientific Journal.Special edition, pp. 1-14.
Manoj, K. and Padhy, P. K. (2014). Multivariate statistical techniques and water quality
assessment: Discourse and review on some analytical models. International Journal of
Environmental Sciences. Vol. 5 (3), pp. 607-626. doi: 10.6088/ijes.2014050100053
Marden, J. I. (2015). Multivariate Statistics. Illinois, Urbana-Champaign University of Illinois
Press.
Mark, J. J. (2014). The Ancient City. Ancient History Encyclopedia. Retrieved on 26th March,
2020 from https://www.ancient.eu/city/
Milan, K. J and Tanaya, D. (2015). Visual pollution can have a deep degrading effect on urban
and sub- urban community: a study in few places of Bengal, India, with special reference
to unorganized billboards. European Scientific Journal. Special edition, pp. 1857 – 7881.
Nami, P., Jahanbakhsh, P. and Fathalipour, A. (2016). The role and heterogeneity of visual
pollution on the quality of urban landscape using GIS; case study: historical garden in City
of Maraqeh. Open Journal of Geology.Vol.6, pp. 20-29.
http://dx.doi.org/10.4236/ojg.2016.61003
Nuñez-Alonso,D., Pe´rez-Arribas, L. V., Manzoor, S. and Ca´ceres, J. O. (2019). Statistical
tools for air pollution assessment: Multivariate and spatial analysis studies in the Madrid
Region. Journal of Analytical Methods in Chemistry. Vol. 2019, pp. 1-9.
https://doi.org/10.1155/2019/9753927
Robol, V., Casco, C., and Dakin, S.C. (2012). The role of crowding in contextual influences on
contour integration. Journal of Vision.Vol. 12 (7 issue 3), pp. 1–18.
Shrivastava, T. and Choudhary, A. (2016). Model to Mitigate Visual Pollution by Ads and Signage
for Urban Unison. International Journal of Engineering Research and General Science.
Vol. 4 (3), pp. 516-521.
United Nations Department of Economic and Social Affairs (UN DESA) (2018). The 2018
Revision of World Urbanization Prospects. Geneva, UN DESA.
Ur, J. A., Karsgaard, P. and Oates, J. (2007). Early Urban Development in the Near East.
Science. Vol. 317 (5842), pp. 1188. DOI: 10.1126/science.1138728.
Wakil , K., Naeem, M. A., Anjum, G. A., Waheed, A., Thaheem, M. J., ulHussnain, M. Q. and
Nawaz, R. (2019). A hybrid tool for visual pollution assessment in urban environments.
Sustainability. Vol. 11 (2211).doi: 10.3390/su11082211.
FUTY Journal of the Environment Vol. 14 No. 3 September, 2020
34
Yilmaz, D. (2011). In the context of visual pollution: effects to Trabzon City Center Silhoutte.
Asian Social Science. Vol. 7 (5), pp. 98-109.
Yusuf, H. (2013). Reduction of visual pollution and access to an appropriate color environment.
Retrieved on 30th May, 2020 from http://creamainteriors.com/wp-
content/uploads/2013/09/Reduction-of-visual-pollution-and-access-to-an- appropriate-
color-environment.pdf.
Zare, G. A., Sheikh, V. and Sadoddin, A. (2011). Assessment of seasonal variations of chemical
characteristics in surface water using multivariate statistical methods, International
Journal of Environmental Science and Technology.Vol. 8(3), pp. 581-592, Doi:
10.1007/BF03326244.
© 2020 by the authors. License FUTY Journal of the Environment, Yola,
Nigeria. This article is an open access distributed under the terms and conditions
of the Creative Commons Attribution (CC BY) license
(http://creativecommons.org/licenses/by/4.0/).