Prospects for ecological intensification of Australian agriculture

ORIGINAL ARTICLE
Shifting maize cultivation and secondary vegetationin the Southern Yucatan: successional forest impactsof temporal intensification
Birgit Schmook
Received: 11 February 2010 / Accepted: 7 May 2010 / Published online: 26 May 2010
� Springer-Verlag 2010
Abstract Shifting cultivation around the Calakmul Bio-
sphere Reserve of Mexico, part of the Mesoamerican
Biological Corridor, appears to be intensifying temporally
through reductions in crop–fallow cycles, with potential
impacts on species diversity in the regenerating forest
patches surrounding the reserve. This paper documents the
temporal intensity of shifting maize cultivation in the
region and links it to the species diversity found in sec-
ondary vegetation of different ages following different
crop–fallow cycles. It finds that younger secondary growth,
which is increasing under intensification, has less diversity
in species composition. Simultaneously, the concentration
of cultivation practices appears to foster more patches in
older and more species-diverse vegetation. The implica-
tions for the preservation of the region’s forest remain
uncertain, however, given the spatial concentration of open
lands along two key axes, one which dissects the reserve.
Keywords Seasonally dry tropical forests �Shifting cultivation � Agricultural intensification �Calakmul Biosphere Reserve � Biodiversity
Introduction
Estimates of the number of shifting cultivators globally
range from 37 to 1,000 million (Mertz et al. 2009), the
majority of which occupies tropical dry forests (Alvarez-
Yepiz et al. 2008; Burgos and Maass 2004; Murphy and
Lugo 1986a; Romero-Duque et al. 2007). In the face of
increasing land pressures, especially on lands surrounding
biological reserves (Figueroa and Sanchez-Cordero 2008;
Lawrence et al. 2007; Wittemyer et al. 2008), concerns are
raised about the efficacy of shifting cultivation in terms of
its potential role in the loss of biotic diversity and eco-
system function (Gonzalez-Iturbe et al. 2002; MEA 2005;
Ochoa-Gaona et al. 2007).
To date, much attention has been paid to the scale of
deforestation and the ecological consequences of the
total land area under shifting cultivation (Brown and
Schreckenberg 1998; Fujisaka et al. 1996). Much less
attention has been given to the temporal dimension of
shifting cultivation (i.e., repeated crop–fallow cycles) on
secondary vegetation and its consequences on biodiversity
and related environmental services (Sheil 2001). A notable
exception exists for the humid forests in the Lacandon
region in Chiapas (Mexico), where Ochoa-Gaona et al.
(2007) found that secondary vegetation derived from low-
intensity and low-frequency shifting cultivation cushioned
the effects of fragmentation in agricultural areas and favored
dispersal and establishment of native flora. In contrast,
secondary succession in areas with decreasing fallow cycles
displayed a decrease in plant diversity. Given the impor-
tance of understanding the land-use patterns in areas adja-
cent to or within biological reserves (DeFries et al. 2007;
Figueroa and Sanchez-Cordero 2008) and the need to
understand sustainable land architectures for tropical forests
in general (Turner 2009), the impacts of increased cropping
frequencies on biodiversity and ecological functioning
warrant more attention.
In the southern Yucatan (SY) region of Mexico—
defined as the southwestern portion of Quintana Roo state
and southeastern portion of Campeche state—shifting
cultivation is intensifying and the area under pasture is
expanding (see Busch and Geoghegan, and Turner, this
B. Schmook (&)
El Colegio de la Frontera Sur, Av. del Centenario Km 5.5,
C.P. 77900 Chetumal, Quintana Roo, Mexico
e-mail: [email protected]
123
Reg Environ Change (2010) 10:233–246
DOI 10.1007/s10113-010-0128-2

issue). This area lies around and within the Calakmul
Biosphere Reserve (CBR), part of the Mesoamerican Bio-
logical Corridor (MBC). The combination of increasing
numbers of farmers, state-mandated protection of primary
forests, structural adjustment policies negatively affecting
producer prices for basic staples, and expanding engage-
ment in off-farm employment has led to an increase in
cropping frequency in what is locally called milpa culti-
vation, a shifting cultivation system focused on maize,
often intercropped with beans and squash and in some
cases, incorporates chili in the cycle of land-use. In the
1960s, this system may have operated on as much as a
25-year fallow cycle; today that cycle has been reduced to
10 years or less (Klepeis et al. 2004). In many cases,
multiple but much shorter crop–fallow cycles take place on
the same parcel of land (Lawrence et al. 2007). This
intensification in cultivation has not generated any signif-
icant increase in agricultural production which, for the
most part, has not been accompanied by such inputs as
fertilizers.
The research presented here asks: What are the impacts
of crop–fallow cycles in shifting cultivation on the char-
acter of secondary forests in the SY? I address it by doc-
umenting current cropping frequencies and the species
richness, diversity, and evenness in successional forests for
parcels throughout the SY that are part of a shifting culti-
vation system. A series of quantitative tests examine the
links between different crop–fallow cycles and three eco-
logical measures. These links are particularly important
because the area under study lies within the jurisdiction of
the CBR and MBC (Vester et al. 2007). The reserve and
corridor management is dedicated to preservation of biotic
diversity, which includes the movement of biota along the
ecocline of the SY, while farmers seek to improve their
well being, which includes maintaining their claims to
lands that maintain both successional and older growth
forests.
Background on intensification and secondary vegetation
The intensification of shifting cultivation involves ques-
tions of reducing crop–fallow cycles, and the increasing
frequency of cultivation affects the regeneration of vege-
tation once the fallow process begins or the land is aban-
doned. These two themes—crop–fallow reduction and
secondary vegetation—warrant further elaboration.
Intensification in shifting cultivation
Shifting cultivation consists of cutting, drying and burning
patches of woody vegetation to clear land for agricultural
production (Ruthenberg 1980). Burning the vegetation
temporarily eliminates weeds, releases the soil nutrient
stock, replenishes nitrogen, and adds phosphorus, potas-
sium, magnesium and manganese contained in the ash of
the burned woody material (Chidumayo 1987; Ochoa-
Gaona et al. 2007; Sanchez 1976; Wilken 1987). After one
or more years of cultivation, the plot is left to fallow,
allowing secondary forest to return and replenish soil
nutrients. Forest re-growth also constitutes valuable capi-
tal, since secondary forest relatively quickly accumulates
aboveground biomass, which increases the potential for
carbon storage and provision of other environmental ser-
vices (Alvarez-Yepiz et al. 2008). The secondary forest is
eventually cut and the plot is brought back into cultivation
(Pascual and Barbier 2006). In this way, shifting cultiva-
tion tends to be labor and input efficient, but over the crop–
fallow cycle, the level of production per plot cultivated is
relatively low (Turner and Brush 1987).
Agricultural intensification is defined in a number of
ways, all of which are intended to address the increase in
land productivity through increases in inputs of any form
(Boserup 1965, 1988; Brookfield 1984, 1993; Doolittle
1984; McConnel and Keys 2005; Netting 1993;
Ruthenberg 1980; Turner and Doolittle 1978; Turner et al.
1977). A common intensification strategy among shifting
cultivators involves increasing the cropping frequency by
reducing the ratio of the fallow to the cultivation periods.
As the fallow period declines, the application of inputs
increases, such as the use of fertilizers, pesticides and more
frequent weeding (Boserup 1965, 1988; Brookfield 1984;
Doolittle 1984; McConnel and Keys 2005; Netting 1993;
Ruthenberg 1980; Shriar 2000; Turner and Brush 1987;
Turner and Doolittle 1978; Turner et al. 1977). Such steps
are frequently, but not necessarily, taken because of
increasing pressure on land generated by increasing
demand for cultivation (Boserup 1965; Turner and Brush
1987).
Cropping frequency has been used as one measure of
agricultural intensity for shifting agriculture (Boserup
1965; Joosten 1962; Ruthenberg 1980; Shriar 2000; Turner
and Doolittle 1978). It refers to the length of time a parcel
of land is cropped compared to the time it is left fallow.
Such measures (e.g., the R value by Ruthenberg 1980),
however, do not account for double cropping or two har-
vests per year from the same plot, which occurs in some
shifting cultivation systems. For instance, in the SY, some
farmers cultivate winter maize (tornamil) after the summer
maize on the same plot in the same year (Roy Chowdhury
and Turner 2006). To account for this double cropping, a
measure developed by Turner and Doolittle (1978) is
employed in this study: the number of harvests in one
cultivation period is divided by the combined total number
of years of fallow and cultivation. For example, if the entire
cultivation cycle is 1:4 (one harvest in 1 year and 4 years
234 B. Schmook
123

of fallow), the cropping frequency is 0.20 (1 harvest divi-
ded by the 5 years of the entire cultivation cycle). If two
crops are harvested in 1 year, followed by 4 years of fal-
low, the cropping frequency would be 0.40. Using this
measure, data on cultivation and fallow periods for milpa
cultivation reported by Eastmond and Faust (2006) for the
state of Yucatan can be translated into cropping frequen-
cies ranging from 0.06 to 0.38. At the high end, these
values constitute some of the highest for shifting cultiva-
tion systems worldwide (Ruthenberg 1980).
Measuring cropping frequency can be further compli-
cated by the simultaneous use of various crop–fallow cycle
practices within a single household. This variance is
ignored in many studies in which attention focuses on the
crop–fallow cycle that prevails for the major or staple crop
(Turner et al. 1977). Gleave (1996) criticizes this approach
as masking critical variability across households and even
within a single household that reflects management deci-
sions and varying access to land within communal tenure
systems (Ickowitz 2006). Different fallow and/or cropping
lengths can also vary between crops, as in the case of maize
or chili cultivation in the SY. Such variance is not a
problem in this study because analysis is at the individual
plot level.
Impact of increasing crop–fallow cycles
on secondary vegetation
Regardless of its immediate or local importance, Murphy
and Lugo (1986a) suggest that most shifting cultivation
occurs in tropical dry forests, rather than in tropical humid
forests. This is a reflection of human settlement preferences
and, perhaps, the fact that tropical dry forest is of a gen-
erally smaller stature compared to the more humid tropical
rain forests, rendering forest clearing easier. Additionally,
dry forest soils tend to be more fertile than those of humid
forests because less leaching occurs, and weeds and suc-
cessional vegetation tend to be less aggressive (Murphy
and Lugo 1995). Given this preference, secondary forests
are expanding among dry forests, with implications for
biodiversity, seed stocks, and soil nutrients (Alvarez-Yepiz
et al. 2008; Brown and Lugo 1990; Burgos and Maass
2004; Daily et al. 2003; Foley et al. 2005; Romero-Duque
et al. 2007; Vieira and Scariot 2006).
To date, studies have tended to focus on the changing
properties of secondary forest as they are permitted to grow
toward older growth status (Finegan 1996; Marın-Spiotta
et al. 2007; Pena-Claros 2003; Pinard et al. 1999;
Saldarriaga et al. 1988; Vester 1997). These studies indi-
cate that secondary forests maintain differences in their
structure and composition for long periods. For example,
the Shannon–Wiener diversity index increases significantly
in the first stages of succession, but subsequently this rate
of increase slows (Marın-Spiotta et al. 2007; Saldarriaga
et al. 1988) due to differences in regeneration patterns
between species that are likely to colonize a recently dis-
turbed area and those that require forest cover in order to
colonize an area (Pinard et al. 1999; Vester 1997).
The qualities of secondary forests depend on the nature
of prior disturbance, which is a function of fallow length,
cultivation length, number of cropping cycles, and other
management practices (Lawrence et al. 2005). Lawrence
(2005) demonstrated that biomass and forest structure in
Borneo are dependent upon the previous number of culti-
vation cycles. Further, in central Amazonia, Gehring et al.
(2005) documented that the first cycle of re-growth had
only minor effects on secondary vegetation biomass, but
changed the structural characteristics if land-use intensity
increased by extending the cultivation period.
Murphy and Lugo (1986a) report that succession in dry
tropical forests is slower, in terms of plant growth and other
developmental features, than in humid forests. The relative
structural simplicity and small stature of dry forests and the
predominance of coppicing within dry forests, however,
foster conditions that favor recovery to a mature state more
quickly than do humid forests. Coppicing is the primary
regeneration mechanism that occurs in dry sites that have
been cut but with stumps and roots remaining in place
(Ewel 1977; Murphy and Lugo 1986b). A consequence of
this practice is the very patchy development of dry forests
in the early stages of succession and the development of a
long-lived stage characterized by a large density of very
small tree stems (Murphy and Lugo 1986b).
For the dry forests of the SY, Vester et al. (2007) found
that stem density of small stems [\10 cm diameter at
breast height (DBH) of 1.30 m] was much greater in young
secondary forests (aged 2–10 years), and was especially
pronounced in the 5–10 cm DBH range. Further, a larger
percentage of large stems ([10 cm DBH) existed in the
mature forest as opposed to older secondary forests. This
difference was even clearer in the youngest secondary
forests, where the density of large stems was 89% lower
than in mature forests. Canopy heights displayed the same
tendencies with young secondary forests being consider-
ably lower. Maximum canopy height for all secondary
forests was 40% lower than that of mature forest (14 vs.
23 m).
Studies examining the recovery of species composition
reveal contrasting findings. While Brown and Lugo (1990)
reported slow recovery, Perez-Salicrup (2004) found that
forest succession took place rapidly in the SY, with species
composition indistinguishable from old-growth forests only
20–30 years after agricultural abandonment. This result
was attributed to two possibilities: (a) former Maya occu-
pancy fostered resilient, often re-sprouting tree species, and
(b) the forests in question had only one cycle of cultivation
Shifting maize cultivation and secondary vegetation 235
123
and were still relatively close to mature forest seed sources.
These hypotheses are challenged by Haug et al. (2003) who
attribute the resilience of the forest system to the inter-
mittent dry–humid cycles in the Yucatan Peninsula. Like
Perez-Salicrup, Lebrija-Trejos et al. (2008) indicate that
initial forest succession is rapid in Nizanda, Oaxaca, with
tree densities and coverage in the early stages comparable
to those of a mature forest. Recovery in the diversity of
species occurs slowly, however, starting from 30 years of
land abandonment (Lebrija-Trejos et al. 2008).
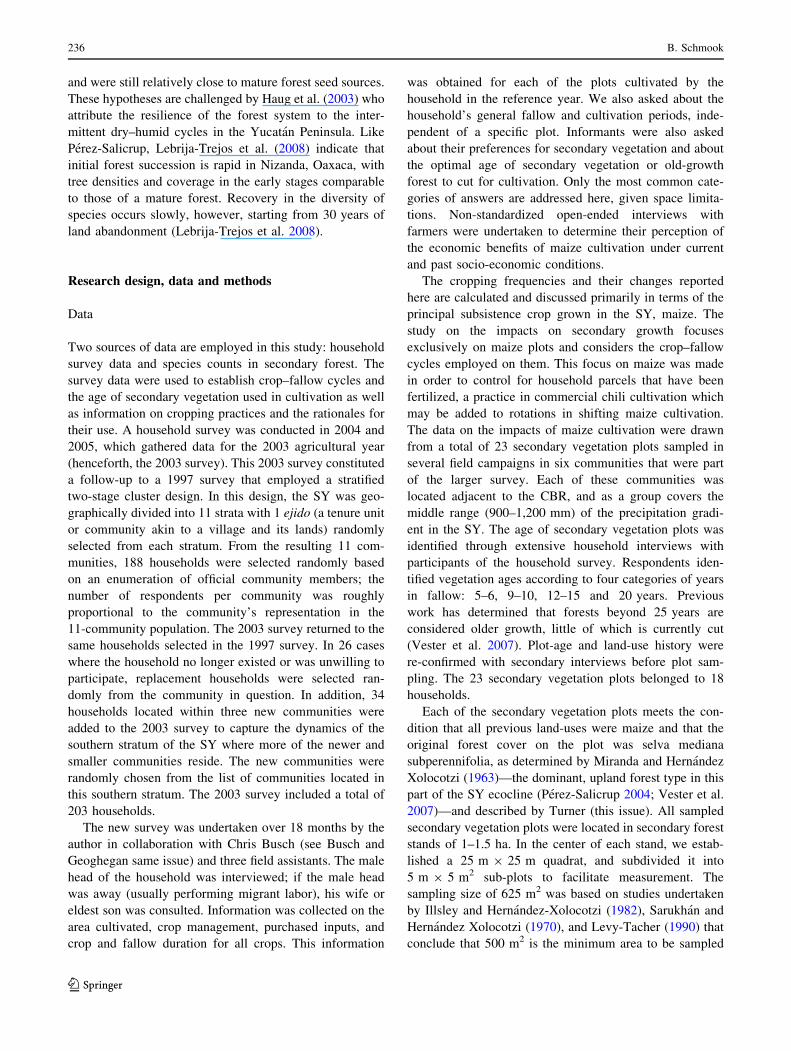
Research design, data and methods
Data
Two sources of data are employed in this study: household
survey data and species counts in secondary forest. The
survey data were used to establish crop–fallow cycles and
the age of secondary vegetation used in cultivation as well
as information on cropping practices and the rationales for
their use. A household survey was conducted in 2004 and
2005, which gathered data for the 2003 agricultural year
(henceforth, the 2003 survey). This 2003 survey constituted
a follow-up to a 1997 survey that employed a stratified
two-stage cluster design. In this design, the SY was geo-
graphically divided into 11 strata with 1 ejido (a tenure unit
or community akin to a village and its lands) randomly
selected from each stratum. From the resulting 11 com-
munities, 188 households were selected randomly based
on an enumeration of official community members; the
number of respondents per community was roughly
proportional to the community’s representation in the
11-community population. The 2003 survey returned to the
same households selected in the 1997 survey. In 26 cases
where the household no longer existed or was unwilling to
participate, replacement households were selected ran-
domly from the community in question. In addition, 34
households located within three new communities were
added to the 2003 survey to capture the dynamics of the
southern stratum of the SY where more of the newer and
smaller communities reside. The new communities were
randomly chosen from the list of communities located in
this southern stratum. The 2003 survey included a total of
203 households.
The new survey was undertaken over 18 months by the
author in collaboration with Chris Busch (see Busch and
Geoghegan same issue) and three field assistants. The male
head of the household was interviewed; if the male head
was away (usually performing migrant labor), his wife or
eldest son was consulted. Information was collected on the
area cultivated, crop management, purchased inputs, and
crop and fallow duration for all crops. This information
was obtained for each of the plots cultivated by the
household in the reference year. We also asked about the
household’s general fallow and cultivation periods, inde-
pendent of a specific plot. Informants were also asked
about their preferences for secondary vegetation and about
the optimal age of secondary vegetation or old-growth
forest to cut for cultivation. Only the most common cate-
gories of answers are addressed here, given space limita-
tions. Non-standardized open-ended interviews with
farmers were undertaken to determine their perception of
the economic benefits of maize cultivation under current
and past socio-economic conditions.
The cropping frequencies and their changes reported
here are calculated and discussed primarily in terms of the
principal subsistence crop grown in the SY, maize. The
study on the impacts on secondary growth focuses
exclusively on maize plots and considers the crop–fallow
cycles employed on them. This focus on maize was made
in order to control for household parcels that have been
fertilized, a practice in commercial chili cultivation which
may be added to rotations in shifting maize cultivation.
The data on the impacts of maize cultivation were drawn
from a total of 23 secondary vegetation plots sampled in
several field campaigns in six communities that were part
of the larger survey. Each of these communities was
located adjacent to the CBR, and as a group covers the
middle range (900–1,200 mm) of the precipitation gradi-
ent in the SY. The age of secondary vegetation plots was
identified through extensive household interviews with
participants of the household survey. Respondents iden-
tified vegetation ages according to four categories of years
in fallow: 5–6, 9–10, 12–15 and 20 years. Previous
work has determined that forests beyond 25 years are
considered older growth, little of which is currently cut
(Vester et al. 2007). Plot-age and land-use history were
re-confirmed with secondary interviews before plot sam-
pling. The 23 secondary vegetation plots belonged to 18
households.
Each of the secondary vegetation plots meets the con-
dition that all previous land-uses were maize and that the
original forest cover on the plot was selva mediana
subperennifolia, as determined by Miranda and Hernandez
Xolocotzi (1963)—the dominant, upland forest type in this
part of the SY ecocline (Perez-Salicrup 2004; Vester et al.
2007)—and described by Turner (this issue). All sampled
secondary vegetation plots were located in secondary forest
stands of 1–1.5 ha. In the center of each stand, we estab-
lished a 25 m 9 25 m quadrat, and subdivided it into
5 m 9 5 m2 sub-plots to facilitate measurement. The
sampling size of 625 m2 was based on studies undertaken
by Illsley and Hernandez-Xolocotzi (1982), Sarukhan and
Hernandez Xolocotzi (1970), and Levy-Tacher (1990) that
conclude that 500 m2 is the minimum area to be sampled
236 B. Schmook
123
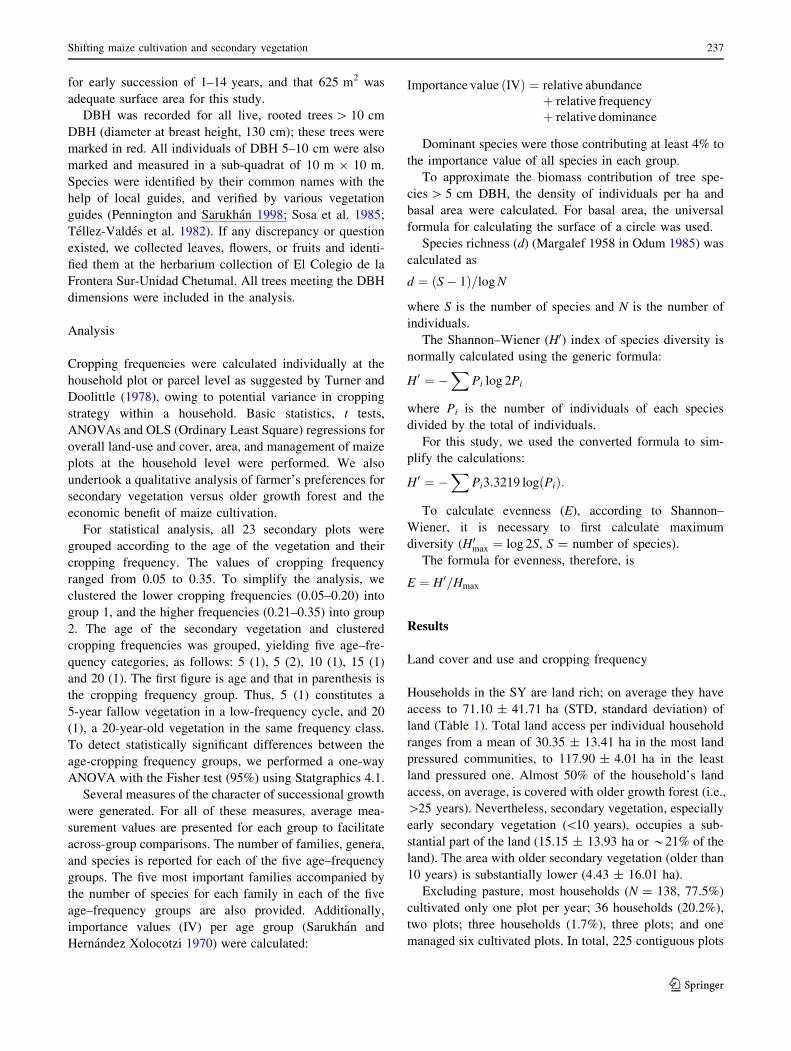
for early succession of 1–14 years, and that 625 m2 was
adequate surface area for this study.
DBH was recorded for all live, rooted trees [ 10 cm
DBH (diameter at breast height, 130 cm); these trees were
marked in red. All individuals of DBH 5–10 cm were also
marked and measured in a sub-quadrat of 10 m 9 10 m.
Species were identified by their common names with the
help of local guides, and verified by various vegetation
guides (Pennington and Sarukhan 1998; Sosa et al. 1985;
Tellez-Valdes et al. 1982). If any discrepancy or question
existed, we collected leaves, flowers, or fruits and identi-
fied them at the herbarium collection of El Colegio de la
Frontera Sur-Unidad Chetumal. All trees meeting the DBH
dimensions were included in the analysis.
Analysis
Cropping frequencies were calculated individually at the
household plot or parcel level as suggested by Turner and
Doolittle (1978), owing to potential variance in cropping
strategy within a household. Basic statistics, t tests,
ANOVAs and OLS (Ordinary Least Square) regressions for
overall land-use and cover, area, and management of maize
plots at the household level were performed. We also
undertook a qualitative analysis of farmer’s preferences for
secondary vegetation versus older growth forest and the
economic benefit of maize cultivation.
For statistical analysis, all 23 secondary plots were
grouped according to the age of the vegetation and their
cropping frequency. The values of cropping frequency
ranged from 0.05 to 0.35. To simplify the analysis, we
clustered the lower cropping frequencies (0.05–0.20) into
group 1, and the higher frequencies (0.21–0.35) into group
2. The age of the secondary vegetation and clustered
cropping frequencies was grouped, yielding five age–fre-
quency categories, as follows: 5 (1), 5 (2), 10 (1), 15 (1)
and 20 (1). The first figure is age and that in parenthesis is
the cropping frequency group. Thus, 5 (1) constitutes a
5-year fallow vegetation in a low-frequency cycle, and 20
(1), a 20-year-old vegetation in the same frequency class.
To detect statistically significant differences between the
age-cropping frequency groups, we performed a one-way
ANOVA with the Fisher test (95%) using Statgraphics 4.1.
Several measures of the character of successional growth
were generated. For all of these measures, average mea-
surement values are presented for each group to facilitate
across-group comparisons. The number of families, genera,
and species is reported for each of the five age–frequency
groups. The five most important families accompanied by
the number of species for each family in each of the five
age–frequency groups are also provided. Additionally,
importance values (IV) per age group (Sarukhan and
Hernandez Xolocotzi 1970) were calculated:
Importance value ðIVÞ ¼ relative abundance
þ relative frequency
þ relative dominance
Dominant species were those contributing at least 4% to
the importance value of all species in each group.
To approximate the biomass contribution of tree spe-
cies [ 5 cm DBH, the density of individuals per ha and
basal area were calculated. For basal area, the universal
formula for calculating the surface of a circle was used.
Species richness (d) (Margalef 1958 in Odum 1985) was
calculated as
d ¼ ðS� 1Þ=log N
where S is the number of species and N is the number of
individuals.
The Shannon–Wiener (H0) index of species diversity is
normally calculated using the generic formula:
H0 ¼ �X
Pi log 2Pi
where Pi is the number of individuals of each species
divided by the total of individuals.
For this study, we used the converted formula to sim-
plify the calculations:
H0 ¼ �X
Pi3:3219 logðPiÞ:
To calculate evenness (E), according to Shannon–
Wiener, it is necessary to first calculate maximum
diversity (H0max ¼ log 2S, S = number of species).
The formula for evenness, therefore, is
E ¼ H0=Hmax
Results
Land cover and use and cropping frequency
Households in the SY are land rich; on average they have
access to 71.10 ± 41.71 ha (STD, standard deviation) of
land (Table 1). Total land access per individual household
ranges from a mean of 30.35 ± 13.41 ha in the most land
pressured communities, to 117.90 ± 4.01 ha in the least
land pressured one. Almost 50% of the household’s land
access, on average, is covered with older growth forest (i.e.,
[25 years). Nevertheless, secondary vegetation, especially
early secondary vegetation (\10 years), occupies a sub-
stantial part of the land (15.15 ± 13.93 ha or *21% of the
land). The area with older secondary vegetation (older than
10 years) is substantially lower (4.43 ± 16.01 ha).
Excluding pasture, most households (N = 138, 77.5%)
cultivated only one plot per year; 36 households (20.2%),
two plots; three households (1.7%), three plots; and one
managed six cultivated plots. In total, 225 contiguous plots
Shifting maize cultivation and secondary vegetation 237
123

were farmed by 178 households. 25 of the 203 households
in the sample had no crops or only pasture in the reference
year. A few (8) of these plots were cultivated with crops
(e.g., papaya) other than maize or chili. Households often,
but not always, divide their plots to accommodate both
maize and chili in the same cropping period in order to
reduce travel time. A total of 60 plots were divided in this
way. Adding the 60 maize sub-plots to the 130 main maize
plots, a total of 190 maize plots were recorded. Information
is sufficiently complete to calculate cropping frequencies
for 182 of these plots. An overwhelming 83% of maize
plots were taken from secondary growth, and only 17%
from older growth forest.
In 2003, a total of 175 (86.20%) out of 203 households
cultivated maize (Table 2). In 1997, all 188 households
sampled cultivated maize. A t test of difference between
the area of maize cultivated over all sampled households in
1997 and 2003 reveals that maize was grown in a signifi-
cantly smaller area in 2003 than in 1997 (3.28 vs. 4.51 ha;
P = 0.002). Differences by community exist. In five, all
Table 1 Average land access and land-use distribution per household at the community and sample level in hectares
El
Refugio
Centauro
del Norte
Alvaro
Obregon
Nuevo
Becar
X-Bonil Nicolas
Bravo
La
Lucha
Tomas
Garrido
Arroyo
Negro
Chan
Laguna
Km.
120
Alacranes Cana
Brava
Ricardo
Payro
Total
N 9 18 21 17 23 22 6 15 13 14 11 9 12 13 203
Household land access
Mean 67.33 103.33 46.17 41.53 86.43 110.2 50.67 109.93 30.35 34.59 117.91 66.5 55.56 37.38 71.1
Median 60 100 27 40 100 100 60 107 28 36.5 116 70 50 40 60
STD 20.52 26.92 57.32 20.88 42.77 23.78 14.85 22.55 13.41 12.4 4.01 7.68 14.18 14.87 41.71
Secondary vegetation \ 5 years
Mean 3.89 8.06 4.48 4.26 7.86 5.93 10.33 4.37 9.71 5.79 7.75 17.31 13.71 5.54 7.24
Median 3.5 7 4 3 5.25 4 6.5 2 6.5 3.5 6 12 13.5 4 5
STD 2.79 4.7 3.96 5.54 8.56 7.65 9.48 6.27 12.7 7.09 5.25 13.23 12.14 5.32 8.18
Secondary vegetation 5–10 years
Mean 11.39 5.17 4.86 8.04 13.1 14.18 4.5 6.13 4.38 4.14 5.64 8.61 8.21 6.62 7.91
Median 8 5 1 5 5 7.25 1.5 5 1 1 3 8 6.5 4 4.25
STD 10.43 4.6 7.25 8.94 17.47 22.61 5.65 6.7 4.86 6.02 5.22 7.56 7.9 6.12 11.54
Secondary vegetation 10–15 years
Mean 3.78 0.94 6.76 1.88 1.52 2.36 2.5 4.87 3.96 0.36 8 0.81 1.67 1.77 2.93
Median 0 0 0 0 0 0 2 0 0 0 5 0 0 0 0
STD 10.26 2.88 21.69 5.09 6.29 5.57 2.74 12.22 9.67 1.34 11.32 2.15 3.26 4.27 9.5
Secondary vegetation 15–20 years
Mean 2.22 0.22 3.29 1.12 0 1.18 0 2.47 0 0 0 0.56 0 0 0.89
Median 0 0 0 0 0 0 0 0 0 0 0 0 0 0 0
STD 6.67 0.94 11.27 4.61 0 3.94 0 6.08 0 0 0 1.67 0 0 4.65
Secondary vegetation 20–25 years
Mean 0 0 2.38 0 1.65 0.45 0 0 0 0 2 0.56 0 0 0.62
Median 0 0 0 0 0 0 0 0 0 0 0 0 0 0 0
STD 0 0 10.91 0 7.92 2.13 0 0 0 0 6.63 1.67 0 0 4.71
Old-growth forest
Mean 38.06 80.89 17.1 13.71 41.26 45.84 28.25 65.12 5.31 2.07 87.18 23.28 21.58 5.92 34.96
Median 34 79 7 10 40 50 32.5 72 0 0.5 95 20 20 4 26
STD 14.95 27.54 20.54 14.56 30.22 32.12 15.61 23.49 8.51 2.76 25.89 13.61 15.57 8.59 33.79
Pasture
Mean 3.22 2.22 2.07 5.29 15.09 24.45 1 22.63 1.35 19.66 1.36 6.44 3 12.69 9.85
Median 0 0.5 0 0 10 3 0 22 0 18.5 0 3 2.5 3 2
STD 5.56 3.22 5.71 8.39 17.71 37.49 1.67 19.74 2.84 12.66 3.26 6.97 3.25 19.91 18.18
Crops
Mean 3.22 3.97 3.07 3.79 3.87 7.9 2.13 3.27 4.94 2.43 3.82 4.5 4.81 2.19 4.04
Median 3 3.75 2 4 4 4.5 2.25 3 4 1 3 4.5 3.63 2 3
STD 1.42 2.28 2.11 2.33 3.89 9.35 1.36 2.53 3.17 2.95 4.26 1.2 2.96 2.03 4.23
238 B. Schmook
123
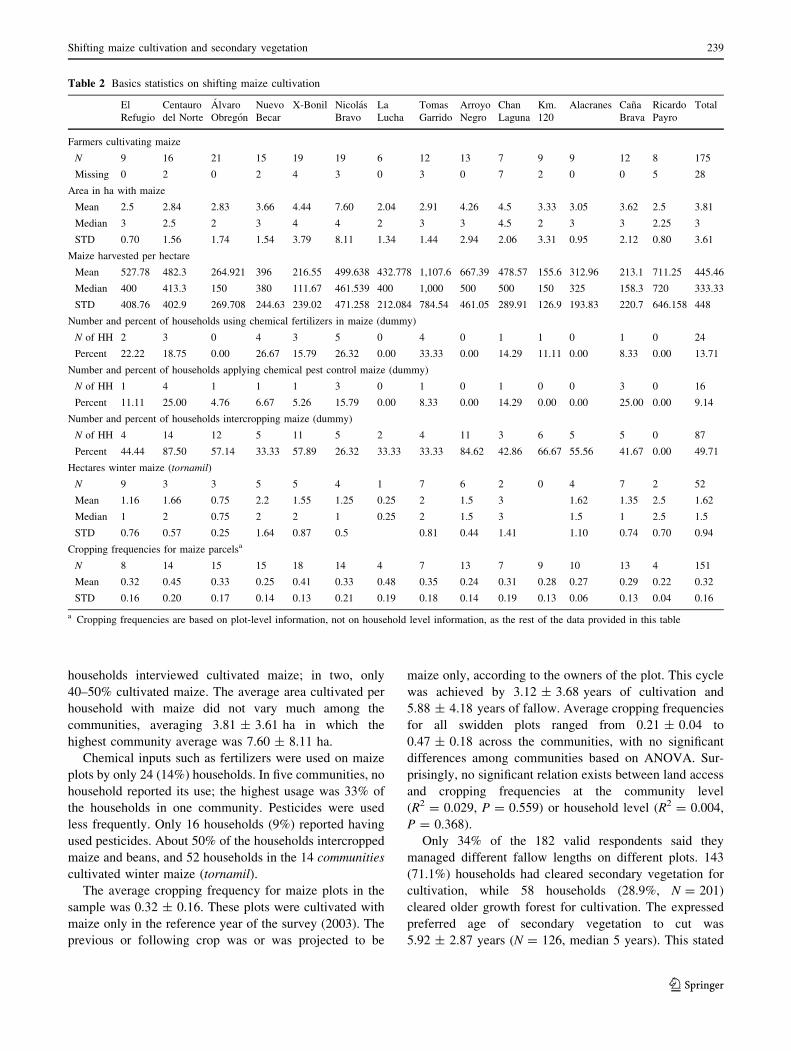
households interviewed cultivated maize; in two, only
40–50% cultivated maize. The average area cultivated per
household with maize did not vary much among the
communities, averaging 3.81 ± 3.61 ha in which the
highest community average was 7.60 ± 8.11 ha.
Chemical inputs such as fertilizers were used on maize
plots by only 24 (14%) households. In five communities, no
household reported its use; the highest usage was 33% of
the households in one community. Pesticides were used
less frequently. Only 16 households (9%) reported having
used pesticides. About 50% of the households intercropped
maize and beans, and 52 households in the 14 communities
cultivated winter maize (tornamil).
The average cropping frequency for maize plots in the
sample was 0.32 ± 0.16. These plots were cultivated with
maize only in the reference year of the survey (2003). The
previous or following crop was or was projected to be
maize only, according to the owners of the plot. This cycle
was achieved by 3.12 ± 3.68 years of cultivation and
5.88 ± 4.18 years of fallow. Average cropping frequencies
for all swidden plots ranged from 0.21 ± 0.04 to
0.47 ± 0.18 across the communities, with no significant
differences among communities based on ANOVA. Sur-
prisingly, no significant relation exists between land access
and cropping frequencies at the community level
(R2 = 0.029, P = 0.559) or household level (R2 = 0.004,
P = 0.368).
Only 34% of the 182 valid respondents said they
managed different fallow lengths on different plots. 143
(71.1%) households had cleared secondary vegetation for
cultivation, while 58 households (28.9%, N = 201)
cleared older growth forest for cultivation. The expressed
preferred age of secondary vegetation to cut was
5.92 ± 2.87 years (N = 126, median 5 years). This stated
Table 2 Basics statistics on shifting maize cultivation
El
Refugio
Centauro
del Norte
Alvaro
Obregon
Nuevo
Becar
X-Bonil Nicolas
Bravo
La
Lucha
Tomas
Garrido
Arroyo
Negro
Chan
Laguna
Km.
120
Alacranes Cana
Brava
Ricardo
Payro
Total
Farmers cultivating maize
N 9 16 21 15 19 19 6 12 13 7 9 9 12 8 175
Missing 0 2 0 2 4 3 0 3 0 7 2 0 0 5 28
Area in ha with maize
Mean 2.5 2.84 2.83 3.66 4.44 7.60 2.04 2.91 4.26 4.5 3.33 3.05 3.62 2.5 3.81
Median 3 2.5 2 3 4 4 2 3 3 4.5 2 3 3 2.25 3
STD 0.70 1.56 1.74 1.54 3.79 8.11 1.34 1.44 2.94 2.06 3.31 0.95 2.12 0.80 3.61
Maize harvested per hectare
Mean 527.78 482.3 264.921 396 216.55 499.638 432.778 1,107.6 667.39 478.57 155.6 312.96 213.1 711.25 445.46
Median 400 413.3 150 380 111.67 461.539 400 1,000 500 500 150 325 158.3 720 333.33
STD 408.76 402.9 269.708 244.63 239.02 471.258 212.084 784.54 461.05 289.91 126.9 193.83 220.7 646.158 448
Number and percent of households using chemical fertilizers in maize (dummy)
N of HH 2 3 0 4 3 5 0 4 0 1 1 0 1 0 24
Percent 22.22 18.75 0.00 26.67 15.79 26.32 0.00 33.33 0.00 14.29 11.11 0.00 8.33 0.00 13.71
Number and percent of households applying chemical pest control maize (dummy)
N of HH 1 4 1 1 1 3 0 1 0 1 0 0 3 0 16
Percent 11.11 25.00 4.76 6.67 5.26 15.79 0.00 8.33 0.00 14.29 0.00 0.00 25.00 0.00 9.14
Number and percent of households intercropping maize (dummy)
N of HH 4 14 12 5 11 5 2 4 11 3 6 5 5 0 87
Percent 44.44 87.50 57.14 33.33 57.89 26.32 33.33 33.33 84.62 42.86 66.67 55.56 41.67 0.00 49.71
Hectares winter maize (tornamil)
N 9 3 3 5 5 4 1 7 6 2 0 4 7 2 52
Mean 1.16 1.66 0.75 2.2 1.55 1.25 0.25 2 1.5 3 1.62 1.35 2.5 1.62
Median 1 2 0.75 2 2 1 0.25 2 1.5 3 1.5 1 2.5 1.5
STD 0.76 0.57 0.25 1.64 0.87 0.5 0.81 0.44 1.41 1.10 0.74 0.70 0.94
Cropping frequencies for maize parcelsa
N 8 14 15 15 18 14 4 7 13 7 9 10 13 4 151
Mean 0.32 0.45 0.33 0.25 0.41 0.33 0.48 0.35 0.24 0.31 0.28 0.27 0.29 0.22 0.32
STD 0.16 0.20 0.17 0.14 0.13 0.21 0.19 0.18 0.14 0.19 0.13 0.06 0.13 0.04 0.16
a Cropping frequencies are based on plot-level information, not on household level information, as the rest of the data provided in this table
Shifting maize cultivation and secondary vegetation 239
123
preference is supported by the observed data generated in
this study.
Tree species diversity in secondary vegetation
During field sampling, vouchers from 718 individu-
als [ 5 cm DBH in the 23 secondary vegetation plots were
collected. Floristic composition consisted of 75 species
distributed over 60 genera and 29 families.
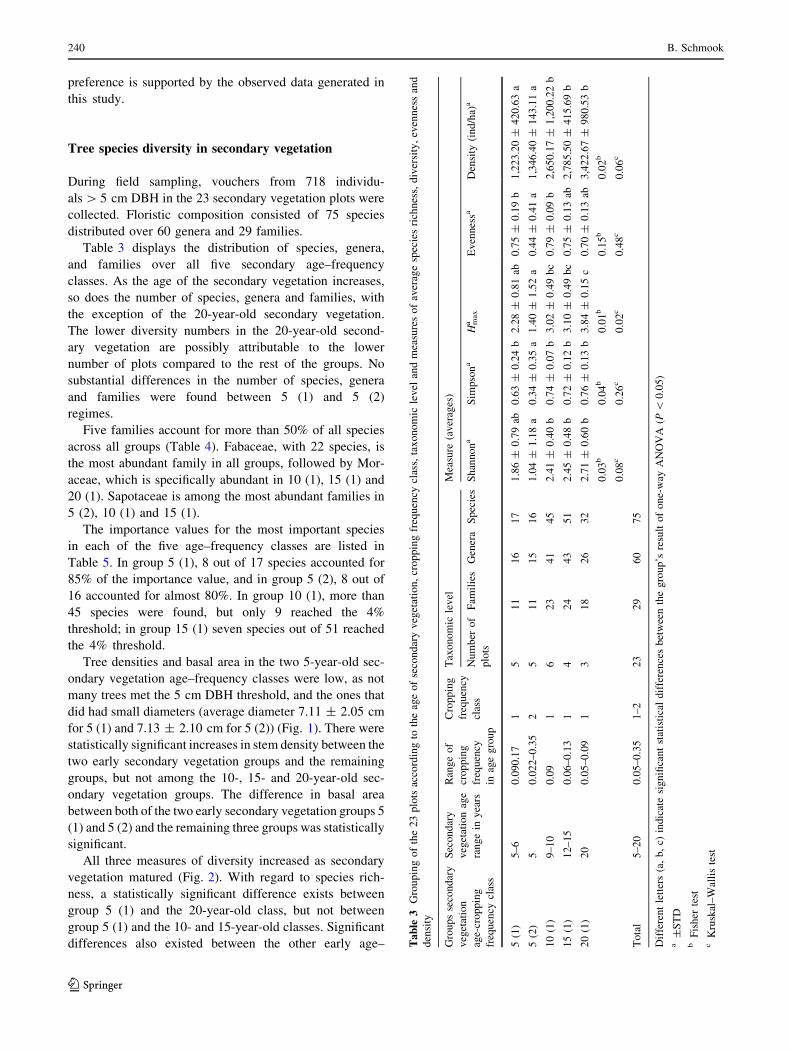
Table 3 displays the distribution of species, genera,
and families over all five secondary age–frequency
classes. As the age of the secondary vegetation increases,
so does the number of species, genera and families, with
the exception of the 20-year-old secondary vegetation.
The lower diversity numbers in the 20-year-old second-
ary vegetation are possibly attributable to the lower
number of plots compared to the rest of the groups. No
substantial differences in the number of species, genera
and families were found between 5 (1) and 5 (2)
regimes.
Five families account for more than 50% of all species
across all groups (Table 4). Fabaceae, with 22 species, is
the most abundant family in all groups, followed by Mor-
aceae, which is specifically abundant in 10 (1), 15 (1) and
20 (1). Sapotaceae is among the most abundant families in
5 (2), 10 (1) and 15 (1).
The importance values for the most important species
in each of the five age–frequency classes are listed in
Table 5. In group 5 (1), 8 out of 17 species accounted for
85% of the importance value, and in group 5 (2), 8 out of
16 accounted for almost 80%. In group 10 (1), more than
45 species were found, but only 9 reached the 4%
threshold; in group 15 (1) seven species out of 51 reached
the 4% threshold.
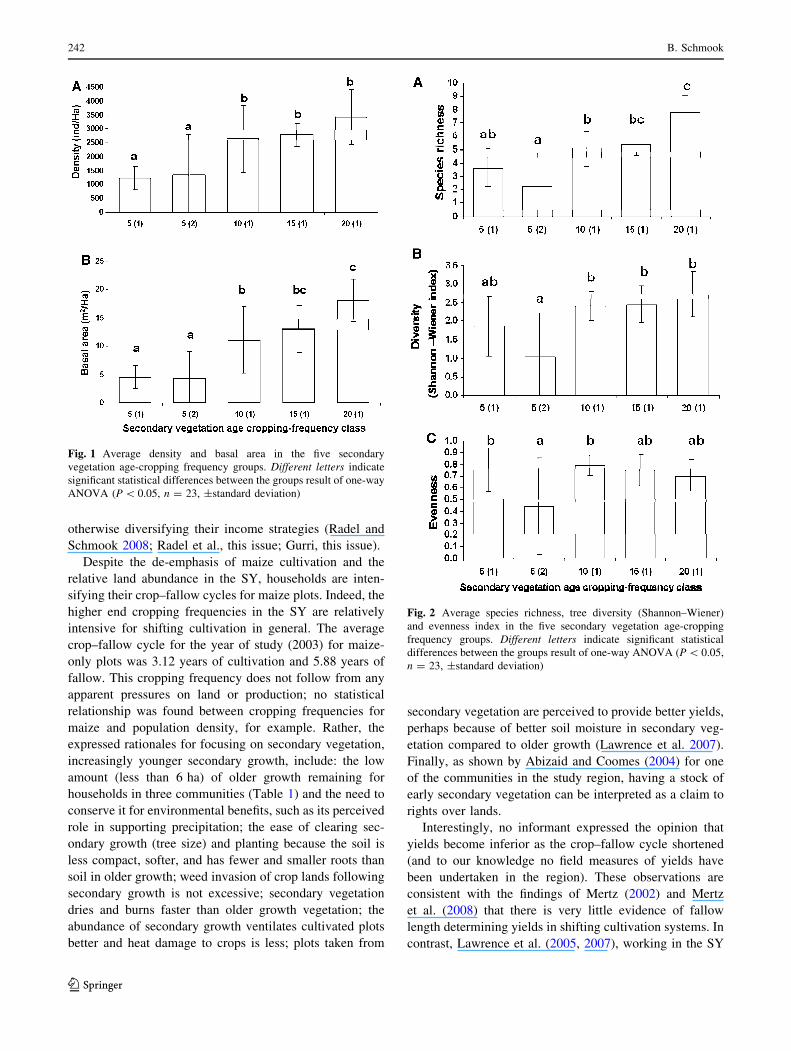
Tree densities and basal area in the two 5-year-old sec-
ondary vegetation age–frequency classes were low, as not
many trees met the 5 cm DBH threshold, and the ones that
did had small diameters (average diameter 7.11 ± 2.05 cm
for 5 (1) and 7.13 ± 2.10 cm for 5 (2)) (Fig. 1). There were
statistically significant increases in stem density between the
two early secondary vegetation groups and the remaining
groups, but not among the 10-, 15- and 20-year-old sec-
ondary vegetation groups. The difference in basal area
between both of the two early secondary vegetation groups 5
(1) and 5 (2) and the remaining three groups was statistically
significant.
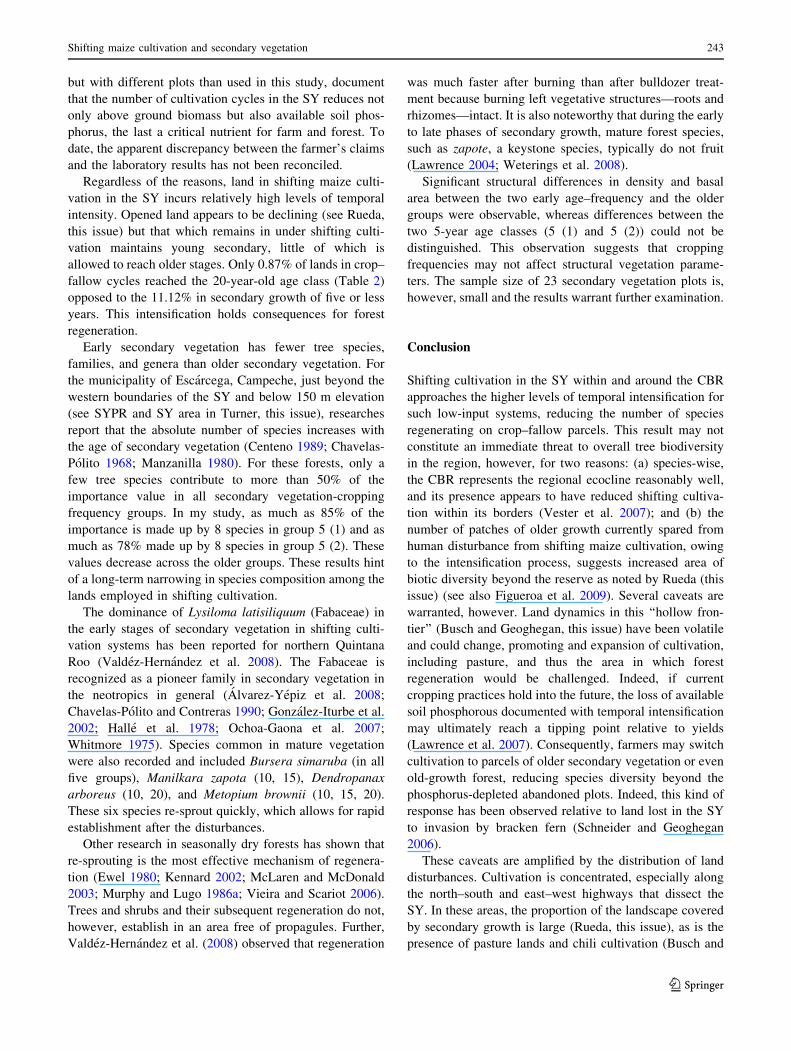
All three measures of diversity increased as secondary
vegetation matured (Fig. 2). With regard to species rich-
ness, a statistically significant difference exists between
group 5 (1) and the 20-year-old class, but not between
group 5 (1) and the 10- and 15-year-old classes. Significant
differences also existed between the other early age– Ta
ble
3G
rou
pin
go
fth
e2
3p
lots
acco
rdin
gto
the
age
of
seco
nd
ary
veg
etat
ion
,cr
op
pin
gfr
equ
ency
clas
s,ta
xo
no
mic
lev
elan
dm
easu
res
of
aver
age
spec
ies
rich
nes
s,d
iver
sity
,ev
enn
ess
and
den
sity
Gro
up
sse
con
dar
y
veg
etat
ion
age-
croppin
g
freq
uen
cycl
ass
Sec
on
dar
y
veg
etat
ion
age
ran
ge
iny
ears
Ran
ge
of
cro
pp
ing
freq
uen
cy
inag
eg
roup
Cro
pp
ing
freq
uen
cy
clas
s
Tax
ono
mic
lev
elM
easu
re(a
ver
ages
)
Nu
mb
ero
f
plo
ts
Fam
ilie
sG
ener
aS
pec
ies
Sh
ann
on
aS
imp
son
aH
max
aE
ven
nes
saD
ensi
ty(i
nd
/ha)
a
5(1
)5
–6
0.0
90.1
71
51
11
61
71
.86
±0
.79
ab0
.63
±0
.24
b2
.28
±0
.81
ab0
.75
±0
.19
b1
,22
3.2
0±
42
0.6
3a
5(2
)5
0.0
22–
0.3
52
51
11
51
61
.04
±1
.18
a0
.34
±0
.35
a1
.40
±1
.52
a0
.44
±0
.41
a1
,34
6.4
0±
14
3.1
1a
10
(1)
9–
10
0.0
91
62
34
14
52
.41
±0
.40
b0
.74
±0
.07
b3
.02
±0
.49
bc
0.7
9±
0.0
9b
2,6
50
.17
±1
,20
0.2
2b
15
(1)
12
–1
50
.06
–0
.13
14
24
43
51
2.4
5±
0.4
8b
0.7
2±
0.1
2b
3.1
0±
0.4
9b
c0
.75
±0
.13
ab2
,78
5.5
0±
41
5.6
9b
20
(1)
20
0.0
5–0
.09
13
18
26
32
2.7
1±
0.6
0b
0.7
6±
0.1
3b
3.8
4±
0.1
5c
0.7
0±
0.1
3ab
3,4
22
.67
±9
80.5
3b
0.0
3b
0.0
4b
0.0
1b
0.1
5b
0.0
2b
0.0
8c
0.2
6c
0.0
2c
0.4
8c
0.0
6c
To
tal
5–
20
0.0
5–0
.35
1–
22
32
96
07
5
Dif
fere
nt
lett
ers
(a,
b,
c)in
dic
ate
sig
nifi
can
tst
atis
tica
ld
iffe
ren
ces
bet
wee
nth
eg
rou
p’s
resu
lto
fo
ne-
way
AN
OV
A(P
\0
.05
)a
±S
TD
bF
ish
erte
stc
Kru
skal
–W
alli
ste
st
240 B. Schmook
123

frequency class 5 (2) and the 10-, 15- and 20-year-old
vegetation groups.
The Shannon–Wiener index indicates statistically sig-
nificant differences in species diversity between 5-year-old
vegetation with a high cropping frequency (5 (2)) and the
10-, 15-, and 20-year-old secondary vegetation plots with a
low cropping frequency. No significant differences were
found between 5 (1) and all older secondary vegetation.
The evenness index was relatively similar over all sec-
ondary age–frequency classes, with the exception of 5 (2).
This class exhibits a low evenness value as a result of low
total species abundance, which is significantly different
from others, as a result of low total species abundance.
Discussion
Interestingly, maize production, the mainstay of cultivation
in the SY since ancient Maya times, is simultaneously
declining in area and amount but increasing in temporal
intensity throughout the region. The average area of maize
cultivation per household dropped from 4.51 ha in 1997 to
3.28 ha in 2003, and in some communities, less than half of
the previous maize farming households are now engaged in
maize cultivation. This decline reflects the loss of guar-
anteed state price support for the crop in the current
regional economy, and the production of maize foremost
for direct consumption among households that are
Table 4 The five most species-rich plant families and number of species in each family in the five secondary vegetation age-cropping frequency
groups and percent contribution to overall number of species in each group
5 (1) 5 (2) 10 (1) 15 (1) 20 (1) Total
Fabaceae (7) Fabaceae (3) Fabaceae (15) Fabaceae (13) Fabaceae (10) Fabaceae (22)
Burseraceae (1) Polygonaceae (3) Sapotaceae (4) Sapotaceae (4) Euphorbiaceae (3) Moraceae (6)
Apocynaceae (1) Sapotaceae (2) Moraceae (3) Moraceae (4) Polygonaceae (2) Sapotaceae (4)
Verbenaceae (1) Burseraceae (1) Rubiaceae (3) Rubiaceae (3) Moraceae (2) Polygonaceae (4)
Ulmaceae (1) Apocynaceae (1) Polygonaceae (2) Euphorbiaceae (3) Verbenaceae (2) Euphorbiaceae (4)
64.71% 62.5% 58.70% 54.00% 59.38% 53.33%
3.63 ± 1.42a (ab) 2.23 ± 2.56a (a) 5.10 ± 1.31a (b) 5.40 ± 0.84a (bc) 7.74 ± 1.30a (c)
Number of species in each family is in parentheses. Fisher test = 0.00, Kruskal–Wallis test = 0.01
Different letters (a, b, c) indicate significant statistical differences between the group’s result of one-way ANOVA (P \ 0.05)a Species richness ± STD
Table 5 Most important species in the five secondary age-cropping frequency groups
5 (1) IVa 5 (2) IVa 10 (1) IVa 15 (1) IVa 20 (1) IVa
Bursera simaruba (33.99) Hampeatrilobata
(16.98) Burserasimaruba
(16.61) Piscidiapiscipula
(10.34) Croton arboreus (16.86)
Thevetia gaumeri (12.20) Lysilomalatisiliquum
(15.00) Crotonarboreus
(11.82) Crotonarboreus
(9.99) Bursera simaruba (12.31)
Lysilomalatisiliquum
(11.63) Bursera simaruba (12.97) Thevetiagaumeri
(6.45) Burserasimaruba
(8.38) Croton sp.(Linneo, 1753)
(7.70)
Cecropia peltata (7.70) Gymnopodiumfloribundum
(11.68) Acaciadolichostachya
(5.05) Lonchocarpusxuul
(8.30) Colubrina sp.(Rich ex
Brongn 1826)
(6.83)
Vitex gaumeri (6.16) Lonchocarpusrugosus
(8.29) Piscidiapiscipula
(4.77) Ficus sp(Linneo, 1753)
(7.79) Piscidia piscipula (5.95)
Platymisciumyucatanum
(4.75) Vitex gaumeri (4.99) Hampeatrilobata
(4.51) Thevetiagaumeri
(6.38) Lysilomalatisiliquum
(5.94)
Piscidia piscipula (4.74) Sideroxylonsalicifolium
(4.50) Pouteriacampechiana
(4.31) Lysilomalatisiliquum
(6.31)
Lonchocarpusxuul
(4.03) Pouteriacampechiana
(4.19) Ficus sp(Linneo, 1753)
(4.16)
Lonchocarpusxuul
(4.13)
Total 85.20 78.60 61.81 57.48 55.58
a Importance value of each species
Shifting maize cultivation and secondary vegetation 241
123
otherwise diversifying their income strategies (Radel and
Schmook 2008; Radel et al., this issue; Gurri, this issue).
Despite the de-emphasis of maize cultivation and the
relative land abundance in the SY, households are inten-
sifying their crop–fallow cycles for maize plots. Indeed, the
higher end cropping frequencies in the SY are relatively
intensive for shifting cultivation in general. The average
crop–fallow cycle for the year of study (2003) for maize-
only plots was 3.12 years of cultivation and 5.88 years of
fallow. This cropping frequency does not follow from any
apparent pressures on land or production; no statistical
relationship was found between cropping frequencies for
maize and population density, for example. Rather, the
expressed rationales for focusing on secondary vegetation,
increasingly younger secondary growth, include: the low
amount (less than 6 ha) of older growth remaining for
households in three communities (Table 1) and the need to
conserve it for environmental benefits, such as its perceived
role in supporting precipitation; the ease of clearing sec-
ondary growth (tree size) and planting because the soil is
less compact, softer, and has fewer and smaller roots than
soil in older growth; weed invasion of crop lands following
secondary growth is not excessive; secondary vegetation
dries and burns faster than older growth vegetation; the
abundance of secondary growth ventilates cultivated plots
better and heat damage to crops is less; plots taken from
secondary vegetation are perceived to provide better yields,
perhaps because of better soil moisture in secondary veg-
etation compared to older growth (Lawrence et al. 2007).
Finally, as shown by Abizaid and Coomes (2004) for one
of the communities in the study region, having a stock of
early secondary vegetation can be interpreted as a claim to
rights over lands.
Interestingly, no informant expressed the opinion that
yields become inferior as the crop–fallow cycle shortened
(and to our knowledge no field measures of yields have
been undertaken in the region). These observations are
consistent with the findings of Mertz (2002) and Mertz
et al. (2008) that there is very little evidence of fallow
length determining yields in shifting cultivation systems. In
contrast, Lawrence et al. (2005, 2007), working in the SY
Fig. 1 Average density and basal area in the five secondary
vegetation age-cropping frequency groups. Different letters indicate
significant statistical differences between the groups result of one-way
ANOVA (P \ 0.05, n = 23, ±standard deviation)
Fig. 2 Average species richness, tree diversity (Shannon–Wiener)
and evenness index in the five secondary vegetation age-cropping
frequency groups. Different letters indicate significant statistical
differences between the groups result of one-way ANOVA (P \ 0.05,
n = 23, ±standard deviation)
242 B. Schmook
123
but with different plots than used in this study, document
that the number of cultivation cycles in the SY reduces not
only above ground biomass but also available soil phos-
phorus, the last a critical nutrient for farm and forest. To
date, the apparent discrepancy between the farmer’s claims
and the laboratory results has not been reconciled.
Regardless of the reasons, land in shifting maize culti-
vation in the SY incurs relatively high levels of temporal
intensity. Opened land appears to be declining (see Rueda,
this issue) but that which remains in under shifting culti-
vation maintains young secondary, little of which is
allowed to reach older stages. Only 0.87% of lands in crop–
fallow cycles reached the 20-year-old age class (Table 2)
opposed to the 11.12% in secondary growth of five or less
years. This intensification holds consequences for forest
regeneration.
Early secondary vegetation has fewer tree species,
families, and genera than older secondary vegetation. For
the municipality of Escarcega, Campeche, just beyond the
western boundaries of the SY and below 150 m elevation
(see SYPR and SY area in Turner, this issue), researches
report that the absolute number of species increases with
the age of secondary vegetation (Centeno 1989; Chavelas-
Polito 1968; Manzanilla 1980). For these forests, only a
few tree species contribute to more than 50% of the
importance value in all secondary vegetation-cropping
frequency groups. In my study, as much as 85% of the
importance is made up by 8 species in group 5 (1) and as
much as 78% made up by 8 species in group 5 (2). These
values decrease across the older groups. These results hint
of a long-term narrowing in species composition among the
lands employed in shifting cultivation.
The dominance of Lysiloma latisiliquum (Fabaceae) in
the early stages of secondary vegetation in shifting culti-
vation systems has been reported for northern Quintana
Roo (Valdez-Hernandez et al. 2008). The Fabaceae is
recognized as a pioneer family in secondary vegetation in
the neotropics in general (Alvarez-Yepiz et al. 2008;
Chavelas-Polito and Contreras 1990; Gonzalez-Iturbe et al.
2002; Halle et al. 1978; Ochoa-Gaona et al. 2007;
Whitmore 1975). Species common in mature vegetation
were also recorded and included Bursera simaruba (in all
five groups), Manilkara zapota (10, 15), Dendropanax
arboreus (10, 20), and Metopium brownii (10, 15, 20).
These six species re-sprout quickly, which allows for rapid
establishment after the disturbances.
Other research in seasonally dry forests has shown that
re-sprouting is the most effective mechanism of regenera-
tion (Ewel 1980; Kennard 2002; McLaren and McDonald
2003; Murphy and Lugo 1986a; Vieira and Scariot 2006).
Trees and shrubs and their subsequent regeneration do not,
however, establish in an area free of propagules. Further,
Valdez-Hernandez et al. (2008) observed that regeneration
was much faster after burning than after bulldozer treat-
ment because burning left vegetative structures—roots and
rhizomes—intact. It is also noteworthy that during the early
to late phases of secondary growth, mature forest species,
such as zapote, a keystone species, typically do not fruit
(Lawrence 2004; Weterings et al. 2008).
Significant structural differences in density and basal
area between the two early age–frequency and the older
groups were observable, whereas differences between the
two 5-year age classes (5 (1) and 5 (2)) could not be
distinguished. This observation suggests that cropping
frequencies may not affect structural vegetation parame-
ters. The sample size of 23 secondary vegetation plots is,
however, small and the results warrant further examination.
Conclusion
Shifting cultivation in the SY within and around the CBR
approaches the higher levels of temporal intensification for
such low-input systems, reducing the number of species
regenerating on crop–fallow parcels. This result may not
constitute an immediate threat to overall tree biodiversity
in the region, however, for two reasons: (a) species-wise,
the CBR represents the regional ecocline reasonably well,
and its presence appears to have reduced shifting cultiva-
tion within its borders (Vester et al. 2007); and (b) the
number of patches of older growth currently spared from
human disturbance from shifting maize cultivation, owing
to the intensification process, suggests increased area of
biotic diversity beyond the reserve as noted by Rueda (this
issue) (see also Figueroa et al. 2009). Several caveats are
warranted, however. Land dynamics in this ‘‘hollow fron-
tier’’ (Busch and Geoghegan, this issue) have been volatile
and could change, promoting and expansion of cultivation,
including pasture, and thus the area in which forest
regeneration would be challenged. Indeed, if current
cropping practices hold into the future, the loss of available
soil phosphorous documented with temporal intensification
may ultimately reach a tipping point relative to yields
(Lawrence et al. 2007). Consequently, farmers may switch
cultivation to parcels of older secondary vegetation or even
old-growth forest, reducing species diversity beyond the
phosphorus-depleted abandoned plots. Indeed, this kind of
response has been observed relative to land lost in the SY
to invasion by bracken fern (Schneider and Geoghegan
2006).
These caveats are amplified by the distribution of land
disturbances. Cultivation is concentrated, especially along
the north–south and east–west highways that dissect the
SY. In these areas, the proportion of the landscape covered
by secondary growth is large (Rueda, this issue), as is the
presence of pasture lands and chili cultivation (Busch and
Shifting maize cultivation and secondary vegetation 243
123

Geoghegan, this issue). Together, these land-uses generate
large and almost continuous patches of open land and early
secondary vegetation that potentially serve as impediments
to the connection and flow of biota across the ecocline of
the SY. Over the long-term, the temporal intensification
preference in current cropping practices is likely to create a
less species-rich landscape barrier than has existed to date
and one that will take much longer to re-establish to mature
conditions if abandoned, for whatever reason.
As land change science researchers search for sus-
tainable land architectures in tropical forest biomes
(Turner et al. 2007; Turner 2009), especially those con-
sistent with the goals of biosphere reserves, the implica-
tions of low-input but temporally intensive shifting
cultivation warrant much further examination. This will
prove to be the case in the SY, should economic
dynamics sustain or increase current cultivation practices,
especially given the regional ecological missions of the
CBR and MBC, two entities established to facilitate the
preservation of biodiversity.
Acknowledgments I thank B. L. Turner II, Deborah Lawrence,
Hans Vester, Rebecca Dickson and Mirna Canul Montanez for their
comments on previous drafts. Special thanks go to Dalia Hoil Vill-
alobos who assisted me with species counts in secondary forest and to
the kind farmers in the SY who put up with long hours of inter-
viewing. I also thank two anonymous reviews who provide excellent
direction in the development of this paper. Core funding for the
Southern Yucatan Peninsular Region project from 1997 to 2009 was
provided by NASA’s LCLUC program (NAG 56046, 511134,
06GD98G) and NSF’s BCS program (0410016). An additional
sponsor of the research reported in this paper was the Mexican
National Commission for the Knowledge and Use of Biodiversity,
CONABIO (BJ002). The project is indebted to assistance provided by
our host institution in Mexico, El Colegio de la Frontera Sur, espe-
cially Unidad Chetumal.
References
Abizaid C, Coomes OT (2004) Land use and forest fallowing
dynamics in seasonally dry tropical forests of the southern
Yucatan Peninsula, Mexico. Land Use Policy 21:71–84
Alvarez-Yepiz JC, Martinez-Yrizar A, Burquez A, Linquist C (2008)
Variation in vegetation structure and soil properties related to
land use history of old-growth and secondary tropical dry forest
in northwestern Mexico. For Ecol Manag 256:355–366
Boserup E (1965) The conditions of agricultural growth: the
economics of agrarian change under population pressure.
Aldine-Atherton, Chicago
Boserup E (1988) Population growth as a stimulant to agricultural
development. In: Steinmann G, Zimmermann KF, Heilig G (eds)
Probleme und Chancen demographischer Entwicklungen in der
dritten Welt. Springer, New York, pp 61–75
Brookfield HC (1984) Intensification revisited. Pac View 25:15–44
Brookfield HC (1993) Notes on the theory of land management.
PLEC News Views 1:28–32
Brown S, Lugo AE (1990) Tropical secondary forests. J Trop Ecol
6:1–32
Brown D, Schreckenberg K (1998) Shifting cultivators as agents of
deforestation: assessing the evidence. Nat Resour Perspect 29:1–
14
Burgos A, Maass JM (2004) Vegetation change associated with land-
use in tropical dry forest areas of Western Mexico. Agric Ecosyst
Environ 104:475–481
Centeno ELR (1989) Analisis estructural de cuatro etapas sucesio-
nales de selva mediana subperennifolia en la region de Escarc-
ega, Campeche. Tesis de Licenciatura, Universidad Autonoma
de Chapingo, Estado de Mexico, Mexico
Chavelas-Polito J (1968) Estudio florıstico-sinecologico del campo
experimental forestal ‘‘El Tormento’’, Escarcega, Campeche. In:
Comision de estudios sobre la ecologıa de Dioscoreas. Instituto
nacional de Investigaciones Forestales, V Informe, Mexico, D.F.,
pp 130–221
Chavelas-Polito J, Contreras G (1990) Caracterizacion de la estruc-
tura de acahuales de diferentes edades. Taller internacional sobre
investigacion en silvicultura y manejo de selvas. SARH/INIFAP,
Mexico, D.F., Mexico
Chidumayo EN (1987) A shifting cultivation land use system under
population pressure in Zambia. Agrofor Syst 5:15–25
Daily GC, Ceballos G, Pacheco J, Suzan G, Sanchez-Azofeifa A
(2003) Countryside biogeography of neotropical mammals:
conservation opportunities in agricultural landscapes of Costa
Rica. Conserv Biol 17:1814–1826
DeFries R, Hansen A, Turner BL II, Reid R, Liu J (2007) Land use
change around protected areas: management to balance human
needs and ecological function. Ecol Appl 17:1031–1038
Doolittle WE (1984) Agricultural change as an incremental process.
Ann Ass Am Geogr 74:124–137
Eastmond A, Faust B (2006) Farmers, fires and forests: a green
alternative to shifting cultivation for conservation of the Maya
forest. Landsc Urban Plan 74:267–284
Ewel JJ (1977) Differences between wet and dry successional tropical
ecosystems. Geo Eco Trop 1:103–117
Ewel JJ (1980) Tropical succession: manifold routes to maturity.
Biotropica 12:2–7
Figueroa F, Sanchez-Cordero V (2008) Effectiveness of naturalprotected areas to prevent land use and land cover change in
Mexico. Biodivers Conserv 17:3223–3240
Figueroa F, Sanchez-Cordero V, Meave JA, Trejo I (2009) Socio-
economic context of land use and land cover change in Mexican
biosphere reserves. Environ Conserv 3:180–191
Finegan B (1996) Pattern and process in neotropical secondary rain
forests: the first hundred years of succession. Trends Ecol Evol
11:119–124
Foley JA, DeFries R, Asner GP, Barford C, Bonan G, Carpenter SR,
Chapin F, Stuart C, Michael T, Daily GC, Gibbs HK, Helkowski
JH, Holloway T, Howard EA, Kucharik CJ, Monfreda C, Patz
JA, Prentice IC, Ramankutty N, Snyder PK (2005) Global
consequences of land use. Science 309:570–574
Fujisaka S, Hurtado L, Uribe R (1996) A working classification of
slash-and-burn agricultural systems. Agrofor Syst 34:151–169
Gehring C, Denich M, Vlek PLG (2005) Resilience of secondary
forest regrowth after slash-and-burn agriculture in central
Amazonia. J Trop Ecol 21:519–527
Gleave MB (1996) The length of the fallow period in tropical fallow
farming systems: a discussion with evidence from Sierra Leone.
Geogr J 162:14–24
Gonzalez-Iturbe JA, Olmsted I, Tun Dzul F (2002) Tropical dry forest
recovery after long term Henequen (sisal, Agave fourcroydesLem.) plantation in northern Yucatan, Mexico. For Ecol Manag
167:67–82
Halle F, Oldeman RA, Tomlinson PB (1978) Tropical trees and
forests an architectural analysis. Springer, New York
244 B. Schmook
123
Haug GH, Gunther D, Peterson LC, Sigman DM, Hughen KA,
Aeschlimann B (2003) Climate and the collapse of Maya
civilization. Science 299:1731–1735
Ickowitz A (2006) Shifting cultivation and deforestation in tropical
Africa: critical reflections. Dev Change 37:599–626
Illsley CE, Hernandez-Xolocotzi E (1982) La vegetacion en relacion a
la produccion agrıcola en el ejido de Yaxcaba, Yucatan. In:
Hernandez Xolocotzi E, Padilla I, Ortega R (eds) Seminario
sobre produccion agrıcola en Yucatan. Gobierno del Estado de
Yucatan, Merida, Mexico, pp 343–371
Joosten JHL (1962) Wirtschaftliche und agrarpolitische Aspekte
tropischer Landbausysteme (mimeo). Institut fur landwirtschaf-
tliche Betriebslehre, Gottingen, Germany
Kennard DK (2002) Secondary forests succession in a tropical dry
forest: patterns of development across a 50-year chronosequence
in lowland Bolivia. J Trop Ecol 18:53–66
Klepeis P, Vance C, Keys E, Macario Mendoza P, Turner BL II
(2004) Subsistence sustained: swidden or milpa cultivation. In:
Turner BL II, Geoghegan J, Forster DR (eds) Integrated land-
change science and tropical deforestation in the southern
Yucatan: final frontiers. Oxford University Press, Oxford, pp
189–207
Lawrence D (2004) Erosion of tree diversity during 200 years of
shifting cultivation in Bornean rain forest. Ecol Appl 14:
1855–1869
Lawrence D (2005) Biomass accumulation after 10–200 years of
shifting cultivation in Bornean rain forest. Ecology 86:26–33
Lawrence D, Suma V, Mogea JP (2005) Change in species
composition with repeated shifting cultivation: limited role of
soil nutrients. Ecol Appl 15:1952
Lawrence D, D’Odorico P, Diekmann L, DeLonge M, Das R, Eaton J
(2007) Ecological feedbacks following deforestation create the
potential for a catastrophic ecosystem shift in tropical dry forest.
Proc Natl Acad Sci 104:20696–20701
Lebrija-Trejos E, Bongers F, Perez-Garcia EA, Meave JA (2008)
Successional change and resilience of very dry tropical decid-
uous forest following shifting agriculture. Biotropica 40:
422–431
Levy-Tacher S (1990) Sucesion secundaria en Yucatan: antecedentes
para su manejo. Tesis de Maestrıa. Colegio de Postgraduados,
Chapingo, Estado de Mexico, Mexico
Manzanilla H (1980) Los sitios permanentes de investigacion
silvıcola del INIFAP. Un sistema integrado para iniciarse en el
cultivo de los ecosistemas forestales. SARH-SDFAF-INIFAP,
Mexico, D.F., Mexico
Marın-Spiotta E, Ostertag R, Silver WL (2007) Long-term patterns in
tropical reforestation: plant community composition and above-
ground biomass accumulation. Ecol Appl 17:828–839
McConnel W, Keys E (2005) Meta-analysis of agricultural change.
In: Moran E, Ostrom E (eds) Seeing the forest and the trees. MIT
Press, Cambridge, MA, pp 325–353
McLaren KP, McDonald MA (2003) Coppice regrowth in a disturbed
tropical dry limestone forest in Jamaica. For Ecol Manag
180:99–111
MEA-Millennium Ecosystem Assessment (2005) Ecosystems and
human well-being: synthesis. Island Press, Washington, DC
Mertz O (2002) The relationship between fallow length and crop
yields in shifting cultivation: a rethinking. Agrofor Syst 55:149–
159
Mertz O, Wadley RL, Nielsen U, Bruun TB, Colfer CJP, De
Neergaard A, Jepsen MR, Martinussen T, Zhao Q, Noweg GT,
Magid J (2008) A fresh look at shifting cultivation: fallow length
an uncertain indicator of productivity. Agric Syst 96:75–84
Mertz O, Leisz SJ, Heinimann A, Rerkasem K, Thiha, Dressler W,
Pham VC, Vu KC, Schmidt-Vogt D, Colfer CJP, Epprecht M,
Padoch C, Potter L (2009) Who counts? Demography of swidden
cultivators in Southeast Asia. Hum Ecol. doi:10.1007/
s1074450099249y
Miranda F, Hernandez Xolocotzi E (1963) Los tipos de vegetacion de
Mexico y su clasificacion. Bol Soc Bot Mexico 28:29–179
Murphy PG, Lugo AE (1986a) Ecology of tropical dry forests. Annu
Rev Ecol Syst 17:67–88
Murphy PG, Lugo AE (1986b) Structure and biomass of a subtropical
dry forest in Puerto Rico. Biotropica 18:89–96
Murphy PG, Lugo AE (1995) Dry forests of Central America and the
Caribbean. In: Bullock S, Mooney HA, Medina E (eds)
Seasonally dry tropical forests. Cambridge University Press,
Cambridge, pp 9–34
Netting RM (1993) Smallholders, householders: farm families and the
ecology of intensive, sustainable agriculture. Stanford University
Press, Stanford, CA
Ochoa-Gaona S, Hernandez-Vazquez F, de Long BHJ, Gurri-Garcıa
FD (2007) Perdida de diversidad florıstica ante un gradiente de
intensificacion del sistema agrıcola de roza-tumba y quema: un
estudio de caso en la Selva Lacandona, Chiapas, Mexico. Bol
Soc Bot Mexico 81:65–80
Odum EP (1985) Ecologıa. Interamericana S.A de C.V, Mexico, D.F.,
pp 158–178
Pascual U, Barbier EB (2006) Deprived land-use intensification in
shifting cultivation: the population pressure hypothesis revisited.
Agric Econ 34:155–165
Pena-Claros M (2003) Changes in forest structure and species
composition during secondary forest succession in the Bolivian
Amazon. Biotropica 4:450–461
Pennington TD, Sarukhan J (1998) Arboles tropicales de Mexico:
Manual para la identificacion de las principales especies.
Universidad Nacional Autonoma de Mexico y Fondo de Cultura
Economica, Mexico, D.F., p 521
Perez-Salicrup DR (2004) Forest types and their implications. In:
Turner BL II, Geoghegan J, Forster DR (eds) Integrated land-
change science and tropical deforestation in the southern Yucatan:
final frontiers. Oxford University Press, Oxford, pp 63–80
Pinard MA, Putz FE, Rumiz D, Guzman R, Jardin A (1999)
Ecological characterization of tree species for guiding forest
management decisions in seasonally dry forests in Lomerio,
Bolivia. For Ecol Manag 113:201–213
Radel C, Schmook B (2008) Male transnational migration and its
linkages to land use change in a southern Campeche ejido. J Lat
Am Geogr 7:59–84
Romero-Duque LP, Jaramillo VJ, Perez-Jimenez A (2007) Structure
and diversity of secondary tropical dry forests in Mexico, differing
in their prior land-use history. For Ecol Manag 253:38–47
Roy Chowdhury R, Turner BL II (2006) Reconciling agency and
structure in empirical analysis: smallholder land use in the
southern Yucatan, Mexico. Ann Ass Am Geogr 96:302–322
Ruthenberg H (1980) Farming systems in the tropics. Claredon Press,
Oxford
Saldarriaga JG, West DC, Tharp ML, Uhl C (1988) Long-term
chronosequence of forest succession in the upper Rio Negro of
Colombia and Venezuela. J Ecol 76:938–958
Sanchez PA (1976) Properties and management of soils in the tropics.
Wiley, New York
Sarukhan J, Hernandez Xolocotzi E (1970) Sinecologıa de las selvas
de Terminalia amazonia en la vertiente del Golfo de Mexico:
analisis de la metodologıa de estudio. Bol Inst For Latinoamer-
icano 34:3–20
Schneider L, Geoghegan J (2006) Land abandonment in an agricul-
tural frontier after a plant invasion: the case of bracken fern in
southern Yucatan, Mexico. Agric Res Econ Rev 35:1–11
Sheil D (2001) Conservation and biodiversity monitoring in the
tropics: realities, priorities, and distractions. Conserv Biol
15:1179–1182
Shifting maize cultivation and secondary vegetation 245
123

Shriar AJ (2000) Agricultural intensity and its measurement in
frontier regions. Agrofor Syst 49:301–318
Sosa V, Flores S, Rico-Gray V, Lira R, Ortiz JJ (1985) Etnoflora
yucatanense. Lista florıstica y sinonimia maya. Fascıculo 1.
Instituto Nacional de Investigaciones sobre Recursos Bioticos
(INIREB), Xalapa, Veracruz, Mexico
Tellez-Valdes O, Sousa-Sanchez M, Cabrera E (1982) Imagenes de la
Flora Quintanarroense. CIQRO, Puerto Morelos, Quintana Roo,
Mexico
Turner BL II (2009) Sustainability and forest transitions in the
southern Yucatan: the land architecture approach. Land Use
Policy. doi:10.1016/j.landusepol.2009.03.006
Turner BL II, Brush SB (1987) Comparative farming systems.
Guilford Press, New York
Turner BL II, Doolittle WE (1978) The concept and measure of
agricultural intensity. Prof Geogr 30:297–301
Turner BL II, Hanham RD, Portararo AV (1977) Population pressure
and agricultural intensity. Ann Ass Am Geogr 67:384–396
Turner BL II, Lambin EF, Reenberg A (2007) The emergence of land
change science for global environmental change and sustain-
ability. Proc Natl Acad Sci 104:20666–20671
Valdez-Hernandez M, Sanchez-Sanchez O, Islebe G (2008) Recovery
and succession in a dry tropical forest of southeastern Mexico
(unpublished manuscript)
Vester HFM (1997) The trees and the forest. The role of tree
architecture in canopy development; a case study in secondary
forests (Araracuara, Colombia). Academisch Proefschrift, The
Netherlands
Vester HFM, Lawrence D, Eastman JR, Turner BL II, Calme S,
Dickson R, Pozo C, Sangermano F (2007) Land change in the
southern Yucatan and Calakmul biosphere reserve: implications
for habitat and biodiversity. Ecol Appl 17:989–1003
Vieira DLM, Scariot A (2006) Principles of natural regeneration of
tropical dry forest for restoration. Restor Ecol 14:11–20
Weterings MJA, Weterings-Schonck SM, Vester HFM, Calme S
(2008) Senescence of Manilkara zapota trees and implications
for large frugivorous birds in the Southern Yucatan Peninsula,
Mexico. For Ecol Manag 256:1604–1611
Whitmore TC (1975) Tropical rain forests of the Far East. Oxford
Clarenton Press, London
Wilken GC (1987) Good farmers: traditional agricultural resource
management in Mexico and Central America. University of
California Press, Berkeley
Wittemyer G, Elsen P, Bean WT, Burton ACO, Brashares JS (2008)
Accelerated human population growth at protected area edges.
Science 321:123–126
246 B. Schmook
123
Copyright © 2022 FDOKUMEN