Social-ecological impacts of agrarian intensification
319
ADVERTIMENT. Lʼaccés als continguts dʼaquesta tesi queda condicionat a lʼacceptació de les condicions dʼús establertes per la següent llicència Creative Commons: http://cat.creativecommons.org/?page_id=184 ADVERTENCIA. El acceso a los contenidos de esta tesis queda condicionado a la aceptación de las condiciones de uso establecidas por la siguiente licencia Creative Commons: http://es.creativecommons.org/blog/licencias/ WARNING. The access to the contents of this doctoral thesis it is limited to the acceptance of the use conditions set by the following Creative Commons license: https://creativecommons.org/licenses/?lang=en
-
Upload
khangminh22 -
Category
Documents
-
view
1 -
download
0
Transcript of Social-ecological impacts of agrarian intensification

ADVERTIMENT. Lʼaccés als continguts dʼaquesta tesi queda condicionat a lʼacceptació de les condicions dʼúsestablertes per la següent llicència Creative Commons: http://cat.creativecommons.org/?page_id=184
ADVERTENCIA. El acceso a los contenidos de esta tesis queda condicionado a la aceptación de las condiciones de usoestablecidas por la siguiente licencia Creative Commons: http://es.creativecommons.org/blog/licencias/
WARNING. The access to the contents of this doctoral thesis it is limited to the acceptance of the use conditions setby the following Creative Commons license: https://creativecommons.org/licenses/?lang=en


Ph.D. dissertation
Social-ecological impacts of agrarian
intensification:
The case of modern irrigation in Navarre
Amaia Albizua
Supervisors:
Dr. Unai Pascual
Ikerbasque Research Professor. Basque Center for Climate Change (BC3), Building Sede 1, 1st floor
Science Park UPV/EHU, Sarriena | 48940 Leioa, Spain
Dr. Esteve Corbera
Senior Researcher. Institute of Environmental Science and Technology (ICTA), Universitat Autònoma
de Barcelona, Building Z Campus UAB | 08193 Bellaterra (Cerdanyola). Barcelona, Spain
A dissertation submitted for the degree of Ph.D. in Environmental Science and Technology
2016


Amaia Albizua 2016
Cover: Painting by Txaro Otxaran, Navarre case study region


Nire familiari, ama, aita ta Josebari
Ta batez ere, amama Felisaren memorian


i
Preface
This dissertation is the product of nearly five years of intense personal and professional development.
The exploration began when a series of coincidences led me to the Basque Centre for Climate Change
Centre (BC3). I had considered doing a PhD since the beginning of my professional career, but the long
duration of a PhD and focusing on a particular topic discouraged such intentions. After some years
working in the private sector, I realised I still had much to learn. For this reason, I applied for and
subsequently received a grant for an MSc programme on soil and water management and then, in
2010, I obtained a grant to go to Ghana, working as a consultant in the UNESCO’s office in Accra. My
time there made me realise that doing a PhD transcended becoming an expert in a topic. Through
various positions, I shared time with politicians and professors from whom I learned that the personal
and technical skills gained from pursuing a PhD were invaluable; consequently, I aspired to incorporate
these aptitudes in my own self-development.
Thereafter, I explored PhD opportunities, preferably in the Basque Country, as I had been studying
and working abroad, and I was keen on understanding my native land. I had the opportunity to work
in the BC3, but the former scientific director suggested that I pursue an additional master’s degree in
economics. After reviewing several master’s programs and speaking with different professors, I
understood that the masters of ecological economics offered at ICTA-UAB provided a new scientific
paradigm, one of complexity, and from a notably socially and environmentally-committed perspective.
It was a crucial moment of lucidity when I realised that I had to bridge those areas (the
land/ecosystems dimension with the social dimension) to build my own research career. During the
MSc programme at ICTA, I discovered political ecology and my enthusiasm amplified. This knowledge
acquisition shaped the ideas which I then began to develop for my PhD.
After completing the MSc at ICTA, I moved home and started the PhD in Bilbao with Unai Pascual. I
have spent all my PhD years there, making at least one visit per year to Barcelona, where I typically
spent several days with Esteve Corbera discussing PhD issues and ideas. I must admit that the early
years were challenging, when after reading so much information, I was still unable to properly
formulate the research questions of my thesis. I felt a bit lost, but this way of proceeding also allowed
for a more creative and thought-invoking process, where I developed my own interests through my
personal learning on an iterative basis. The camaraderie of BC3 and ICTA colleagues and their
unconditional support have made this learning process much more dynamic and productive.
By the end of the first year, I moved to Lund, Sweden, supported by EcoFINDERs project funds, an EU-
funded program on Ecological Function and Biodiversity Indicators in European Soils in which Unai
was involved. It was in September 2012 when I developed the ecological aspects of my ideas with the

ii
help of Katarina Hedlund’s team in the Department of Biology of Lund University. More specifically, I
assessed the effects of different types of land management practices on the soil properties and the
trade-offs and synergies of soil ecosystem services (ES) under different intensities of land
management. I greatly value the learning experience that I received from my participation in this
group regarding statistics and understanding ecological processes. The product of this collaborative
work resulted in publishing the first article of this thesis. However, I have not included it within the
dissertation. The cases of Sweden and Navarre are completely different, as the Swedish case was
conducted under controlled conditions (which focused on rotations of crop varieties and the amount
of mineral fertilisers used), whereas the Navarre case encompassed a broad quantity of crops and land
management practices, including in turn different crop varieties (not considering rotations), types of
fertilisers (not considering quantities) and use of irrigation. Initially, I intended to make two separate
sections addressing each case study, but as my research thinking evolved, I decided to focus the
dissertation on Navarre only, in order to produce a more coherent and less convoluted thesis.
The research process has been anything but linear. The learning path has been cyclical and has been
continuously adapted to emerging ideas and reflections, to questions and debates arising through in-
depth research. I dedicated approximately one year intermittently to fieldwork, which has been the
best part of the PhD. Another year was devoted to analysing the Navarre case study results using R,
which was a challenging learning process. Lastly, I dedicated a year or more on writing. Combining all
the pieces together and communicating results with fluidity has been more arduous work than first
expected. I hope to have succeeded in constructing an interesting research narrative, and that the
final reading reflects the long and stimulating journey it entailed. I hope you enjoy and learn from it
as much as I have.
Amaia Albizua Aguinaco
iii
Peer-reviewed journal publications
Albizua, A., Williams, A., Hedlund, K., Pascual, U. 2015. Crop rotation including ley and manure can
promote ecosystem services in conventional farming systems. APPLIED SOIL ECOLOGY. 95. 54-61. DOI
(10.1016/j.apsoil.2015.06.003)
Conference oral presentations
Albizua, A. Métodos de evaluación de los servicios ecosistémicos. Congreso: Life Tremedal organised
by Gestión Ambiental de Navarra (October 2015). Señorío de Bertiz, Navarre (Spain)
Albizua, A. Soil agrarian systems under intensification: Changing values and livelihoods in Navarre,
Spain. Transformations 11th International Conference of the European Society for Ecological
Economics (June 2015). University of Leeds, United Kingdom
Albizua, A. Understanding today´s vulnerability for tomorrow’s planning. : IV Congreso de la red
REMEDIA (May, 2015). Escuela Técnica Superior de Ingenieros Agrónomos de la Universidad
Politécnica de Madrid (Spain)
Albizua, A. El riego, cuestionado para la adaptación al cambio climático en Navarra. Klimagune
(December 2014). Bizkaia Aretoa, Avda Abandoibarra 3, Bilbao (Spain)
Albizua, A. Political ecology of agrarian ecosystem services. EcoFINDERS 3rd Annual Meeting (February
2014). University of Manchester, United Kingdom
Conference poster presentations
Albizua, A. Governing ecosystem services: Institutional dynamics behind vulnerability. Summer School
BC3: Climate Change on the road to Paris (July, 2015). Palacio MiraMar Donostia-San Sebastian (Spain)
Albizua, A. Agrarian ecosystem services for human wellbeing. Perceptions and valuations under land
intensification process. Summer School BC3: Climate Change: Understanding the Challenge (July,
2014). Palacio MiraMar Donostia-San Sebastian (Spain)
Albizua, A. Tradeoffs and synergies of bundles of ecosystem services under a gradient of agricultural
management. III workshop REMEDIA (April, 2014). Escuela Técnica Superior de Ingeniería Agronómica
y Del Medio Natural, en la Universitat Politècnica de València (Spain)
Albizua, A., Williams, A., Hedlund K., Pascual, U. Tradeoffs and synergies of bundles of ecosystem
services under a gradient of agricultural management. Post-Graduate Course: Soil, Biodiversity and
Life / Second Annual Consortium Meeting of EcoFINDERS (November, 2011). Wageningen University,
The Netherlands

iv
Albizua, A. Synergies and trade-offs of agricultural management decision making under climate
change. Political ecology of soil management. KLIMAGUNE From Euskadi to Rio + 20 (June, 2012).
Bilbao (Spain)
Dissemination talks
Albizua, A., Maestre, S., Calvo-Boyero, D. and Grau, M. WACHI Workshop on Institutional analysis in
Vielha (Lérida). Discusión sobre los fundamentos y análisis de instituciones (July, 2015)
Albizua, A., Training Caravan (Ikerlariak gelan). Difusión sobre ciencia en centros escolares. Koldo
Mitxelena, Olabide Ikastola and Carmelitas School in Vitoria-Gasteiz (2013, 2014)
Albizua, A., Agricultural management intensity effects on bundles of soil ecosystem services. Difusión
y discusión de resultados durante los seminarios semanales en el ICTA, Universitat Autonoma de
Barcelona (June 2013)
v
Abstract
The introduction of modern irrigation technology in agroecosystems often leads to an intensification
of land management practices. Modern irrigation is expected to increase crops’ productivity but it can
also have negative environmental impacts, such as greenhouse gas emissions, water pollution, or/and
social ones, including for instance the unequal social access to natural resources. The Itoiz-Canal de
Navarra irrigation project, implemented in the region of Navarre, northern Spain, is inducing the
intensification of land management practices and favouring in turn the use of heavy machinery and
higher applications of fertilisers and pesticides.
This dissertation aims to understand the effects of such intensification on farmers’ lives, paying
specific attention to changes in their livelihoods, their farming strategies and perceptions of
ecosystem services, the institutions governing land and water resources and their vulnerability and
capacity to adapt to global change. Discerning uneven effects among rural inhabitants will shed light
on which kind of rural livelihoods and values are enhanced by the irrigation project and which kind of
rural development model is likely to dominate in the future.
The manuscript includes eight chapters. After an introduction, I develop a conceptual chapter that lays
out the key ideas and debates underpinning my work, including: social-ecological systems, ecosystem
services, rural livelihoods, social vulnerability and institutions. The subsequent chapter presents the
research strategy and the methods employed to operationalise the theoretical framework, which
include a large-scale survey, semi-structured interviews, participant observation and a focus group.
In the first empirical chapter, I adopt the rural livelihood approach to describe the rural livelihoods
that exist in the study region. I find four main types: small-scale diversified, medium-scale rainfed
organic and two differentiated degrees of intensive livelihoods when attending to the combination of
capital assets associated with particular land management intensities. Farmers holding intense
livelihoods with a clear market-oriented agriculture have mainly adopted modern irrigation. In
contrast, small-scale diversified farmers have not adopted modern irrigation and are being
consequently displaced from the agrarian landscape.
In the second empirical chapter, I show how farmers’ perspectives and their values regarding agrarian
ecosystem services are affected by their chosen land management practices. Informed by a socio-
cultural valuation approach, I find that intensive farmers value highly the capacity of agrarian land to
absorb pollutants, whereas they disregard other cultural services such as traditional knowledge. In
contrast, I demonstrate that small-scale diversified farmers appreciate cultural services greater than
other kinds of farmers and they are the most aware of the contribution of their management practices
to enhanced food quality.
vi
In the third empirical chapter, I highlight that farmers’ livelihoods in the case study region are exposed
to climatic stressors and shocks as well as structural economic transformations that make crop prices
fluctuate with the potential to significantly increase farmers’ vulnerability. I employ a “double
vulnerable” framework combined with political ecology to interrogate if the adoption of modern
irrigation technology makes farmers more able to adapt or increases instead their vulnerability. I find
that modern irrigation increases farmers’ robustness against the mentioned stressors and does so
despite most intensive farmers are more sensitive to such stressors given their full time dedication to
agriculture and their specialisation in water demanding cash crops, among other factors.
In the fourth and last empirical chapter, I assess the role played by modern irrigation institutions (both
formal and informal) in influencing land management and access to common property resources. I
find that the robustness of water and land resource governance seems to increase control over
water consumption, but it negatively impacts upon the recognition of farmers’ right to organise.
Farmers become more dependent on nested enterprises that control irrigation water, which
makes them more dependent on external aid in case of necessity. Additionally, using the lenses of
legitimacy and equity, I show that those who are doubly vulnerable – small-scale diversified farmers –
are not acknowledged in the norms that legitimate modern irrigation and that their participation in
decision-making is limited compared to intensive farmers.
Overall, the findings of this dissertation portray differences in farmers’ understanding and values of
ecosystem services, and they reveal that modern irrigation results in very uneven effects on farming
livelihoods and water management institutions. This research is hoped to be of interest to epistemic
communities interested in broader, intricate and overarching debates over ecosystem services and
rural livelihoods in agrarian social-ecological systems undergoing global change.
Keywords: modern irrigation, agrarian intensification, agrarian ecosystem services, rural livelihoods,
social vulnerability, equity and legitimacy

vii
Resumen
La introducción de la tecnología moderna de riego en los agro-ecosistemas a menudo conduce a una
intensificación de las prácticas de manejo del suelo. La irrigación moderna está destinada a aumentar
la productividad, pero al mismo tiempo también puede tener impactos ambientales negativos, tales
como las emisiones de gases de efecto invernadero, la contaminación del agua, y / o impactos sociales,
como por ejemplo, el acceso desigual a los recursos naturales. Itoiz-Canal de Navarra, una región del
norte de España, está experimentando una transformación rural significativa mediante la
intensificación del manejo de la tierra cuya transformación está asociada al riego moderno, que a su
vez favorece el uso de maquinaria pesada, y mayores aplicaciones de fertilizantes y pesticidas.
Esta tesis incluye ocho capítulos, entre ellos un capítulo conceptual, otro metodológico, y cuatro
capítulos empíricos. En el primer capítulo empírico, adopto el enfoque de medios de vida rurales para
descubrir los diversos medios de vida rurales existentes en dicha región en transformación. He
encontrado cuatro tipos principales de medios de vida rurales: agricultores de pequeña escala
diversificados, agricultores orgánicos de mediana escala y dos grados diferenciados de los medios de
vida intensivos. Esta clasificación atiende a la combinación de activos de capital asociados a
determinadas intensidades de manejo de la tierra. El regadío moderno ha sido adoptado
principalmente por los agricultores intensivos con una clara agricultura orientada al mercado. Por el
contrario, los agricultores diversificados a pequeña escala no adoptan la irrigación moderna y
consecuentemente son desplazados del paisaje agrario dado que algunos deciden vender sus tierras.
En el segundo capítulo empírico muestro cómo las perspectivas de los agricultores y sus valores con
respecto a los servicios de los ecosistemas agrarios se ven afectados por sus prácticas de manejo de
la tierra. Utilizo un enfoque de valoración socio-cultural y encuentro que los agricultores intensivos
valoran altamente la capacidad de la tierra agraria para absorber contaminantes, mientras que no
tienen en cuenta otros servicios culturales como el conocimiento tradicional. Por el contrario, los
agricultores diversificados a pequeña escala aprecian los servicios culturales en mayor medida que
otros tipos de agricultores, siendo este grupo además más consciente de los efectos que sus prácticas
agrícolas tienen en la calidad de los alimentos.
En el tercer capítulo empírico, destaco que en el caso de estudio de Itoiz-Canal de Navarra, los medios
de vida de los agricultores están expuestos a factores de estrés como las perturbaciones climáticas, y
las transformaciones económicas estructurales que hacen que los precios de los cultivos fluctúen,
aumentando de esta manera la potencial vulnerabilidad de los agricultores. Empleo el marco de doble
vulnerabilidad y lo combino con la ecología política para responder a la pregunta de si la adopción de
la tecnología moderna de riego hace que los agricultores sean más capaces de adaptarse o, por el

viii
contrario, aumentan su vulnerabilidad. Encuentro que el nuevo regadío hace más robustos a los
agricultores frente a los factores de estrés mencionados pero también encuentro que al mismo tiempo
los agricultores más intensivos son más sensibles al adoptar la irrigación moderna debido a su
dedicación a tiempo completo a la agricultura y su especialización en cultivos comerciales con alta
demanda de agua, entre otros factores.
En el cuarto y último capítulo empírico evalúo el papel que desempeñan las instituciones (formales e
informales) relacionadas con el regadío moderno para influir en la gestión de la tierra y el acceso a los
recursos de propiedad común. Encuentro que el nuevo regadío es más sólido respecto a la gestión de
los recursos hídricos y de la tierra debido a que parece aumentar el control sobre el consumo de agua.
Sin embargo, tiene un impacto negativo sobre el reconocimiento del derecho de los agricultores a
organizarse. Esto hace que los agricultores sean más dependientes de las empresas anidadas que
controlan el agua de riego, a su vez, haciéndolos más dependientes de la ayuda externa en caso de
necesidad. Además, la aproximación de análisis desde la legitimidad y la equidad, muestra que
aquellos agricultores doblemente vulnerables - los agricultores diversificados a pequeña escala - no
están reconocidos en las normas que legitiman la introducción del riego moderno y su participación
en la toma de decisiones es menor en comparación con los agricultores más intensivos.
Esta tesis retrata diferentes visiones acerca del valor de los servicios de los ecosistemas, el desarrollo
rural y los efectos de la modernización y la vulnerabilidad de los agricultores integrados en el más
amplio nexo entre medio ambiente y desarrollo. Esta investigación se espera que sea de interés para
comunidades interesadas en debates sobre los servicios de los ecosistemas y los medios de vida
rurales de los sistemas socio-ecológicos agrarios influidos por el proceso de cambio global.
Palabras clave: riego moderno, de intensificación agraria, servicios de los ecosistemas agrarios, los
medios de vida rurales, la vulnerabilidad social, equidad y legitimidad

ix
Laburpena
Ureztaketa teknologiaren hastapenak nekazal-ekosistemetan askotan lur erabilera intensiboari loturik
egon da. Ureztaketa modernoak emankortasuna handitzen du, baina aldi berean ingurune-inpaktu
kaltegarriak ere baditu, berotegi- efektuko gasem izurketa, uraren kutsadura edo inpakt sozialak,
besteak beste. Itoiz- Nafarroako ubidea, Espainiako estatuaren iparraldean, landa- bizitza eraldatze
sakon bat jasaten ari da, ureztaketa modernoa eta honi loturiko; makineria astun zein ongarri eta
pestiziden erabilpenaren ondorioz.
Doktoretza-tesi hau zortzi ataletan banatuta dago. Atal bat kontzeptuala da, beste bat metodologikoa,
gainontzeko lauak enpirikoak eta sarrera eta konklusioak. Lehenengo atal enpirikoan, nekazal
ikuspegitik, herrialdean dauden bizimodu desberdinak azaltzen ditut. Oinarrizko lau bizimodu
desberdin bereizten ditut: nekazari txiki dibertsifikatuak, eskala ertaineko nekazari organikoak, eta bi
gradu ezberdineko nekazari intentsiboak. Honako sailkapena kaptial-aktibo eta lur erabilerare
intentsitate maila desberdinen konbinazioei dagokio. Ureztaketa modernoa batik bat nekazari
intentsiboek aukeratu dute merkataritzari zuzendutako ekoizpen argi batekin. Nekazari txiki
dibertsifikatuak berriz, ez dute gaur egungo ureztaketa hautatzen eta honen ondorioz nakazaritza
eremutik baztertuak izaten dira, batzuk beraien lurrak saltzeraino.
Bigarren atal enpirikoan nekazarien ikuspegiak eta ekosistemen zerbitzuekiko balioak nola moldatzen
diren, lurraren erabileraren arabera, azaltzen dut. Ikuzpegi sozio-kultural batetik, nekazari
intentziboek asko balioztatzen dute lurrak kutsagarriak xurgatzeko duen gaitasuna, baina ez dituzten
kontutan hartzen ekosistemen beste zerbitzuak , jakintza tradizionala esaterako. Nekazari txikiek
berriz, kultur zerbitzuak beste nekazariek baino gehiago balioesten dituzte. Azken multzo honek
nekazal-jarduera desberdinek elikagaien kalitatean dituzten eraginak besteek baino gehiago hartzen
dituzte kontutan.
Hirugarren kapitulu enpirikoan, Itoiz- Nafarroa ubideko kasuan nabarmentzen dut nekazarien
bizibideak estres-faktoreen menpe daudela, hala nola eguraldi perturbazioak eta eraldatze ekonomiko
estrukturalak, landaketen prezioei gorabeherak eragiten dizkienak, nekazarien ahultasuna areagotuz.
Ahultasun bikoitzaren markoa erabiltzen dut eta ekologia politikoarekin batera, nekazariek gaur
egungo ureztaketa adoptatuz hobeto egokitzen diren edo beren ahultasuna areagotzen duten
galderari erantzuten diot. Gaur egungo ureztaketak aipatutako estres-faktorearen aurka, nekazariak
indartzen dituela aurkitzen dut. Era berean, nekazari intentsiboak sentikorragoak dira erabateko
dedikazioa baitute eta ur behar izan handia duten labore komertzial espezializazioaren menpe bait
daude, besteak beste.
x
Laugaren eta azken atal enpirikoan, gaur egungo ureztaketarekin zerikusia duten erakundeen papera
aztertzen dut (erakunde formalak eta informalak). Hauek lur erabilera eta guztien baliabideen
kudeaketan duten eragina alegia. Gaur egungo ureztaketa lur eta ur-baliabidean kudaketan
eraginkorragoa dela ikusten dut, ur erabileraren kontrola handiagoa baita da.
Honela bada, nekazariek ura kontrolatzen duten enpresekin menpekotasun haundiago dute, beharra
izanez gero kanpoko laguntzarekiko menpetakosuna handituz. Azterketa zilegitasun eta berdintasun
ikuspuntutik hartuz, nekazari ahulenak direnak, nekazari txiki dibertsifikatuak, ez dira kontutan
hartzen ureztatze modernoaren erabilera justifikatzeko orduan, eta beraien erabakitzeko indarra
txikiagoa da nekazari intentziboekin alderatuz.
Doktoretza-tesi honek konbergentziak eta desadostasunak azalarazten ditu ekosistemen zerbitzuen
ikuspegitik , nekazarien garapen eta modernizazioren arteko lotura kontuan hartuz eta, ingurumen
zein garapenari loturiko nekazaritzaren ahultasunak kontextu zabalago batetatik aztertuta. Honekin,
ikuspegi sozio-ecologikotik, aldaketa globalari loturik , ekosistema-zerbitzuen zein nekazal-
bizimoduen inguruan diarduten jakintza eremuetan interesa sustatuko duen itxaropena dugu.
Hitz gakoak: ureztaketa modernoa, nekazaritza intensifikazioa, nekazal ekosistem-serbitzuak, baserri
bizimoduak, ahaltasun soziala, ekitatea, zilegitasuna

xi
Resum
La introducció de la tecnologia moderna del reg en els agroecosistemes sovint condueix a una
intensificació de les pràctiques de gestió del sòl. La irrigació moderna està destinada a augmentar la
productivitat, però al mateix temps també pot tenir impactes ambientals negatius, com ara les
emissions de gasos d'efecte hivernacle, la contaminació de l'aigua, i/o impactes socials, com per
exemple, l'accés desigual als recursos naturals. Itoiz-Canal de Navarra és un projecte de regadiu
modern que s'està adoptant en una zona de navarresa, al nord d'Espanya. Aquesta regió està
experimentant una transformació rural significativa mitjançant la intensificació de la gestió de la terra,
associada al reg modern, que alhora afavoreix l'ús de maquinària pesada, i majors aplicacions de
fertilitzants i pesticides.
Aquesta tesi inclou vuit capítols, entre ells un capítol conceptual, un altre metodològic, i quatre
capítols empírics. En el primer capítol empíric, adopto l'enfocament dels mitjans de vida rurals per
descobrir els diversos mitjans de vida rurals existents en la dita regió en transformació. He trobat
quatre tipologies principals de mitjans de vida rurals: agricultors de petita escala diversificats,
agricultors orgànics de mitjana escala, i dos graus diferenciats de mitjans de vida intensius. Aquesta
classificació té en compte la combinació d'actius de capital associats a determinades intensitats de
gestió de la terra. El regadiu modern s'ha adoptat principalment pels agricultors intensius amb una
clara agricultura orientada al mercat. Per contra, els agricultors diversificats a petita escala no adopten
la irrigació moderna i conseqüentment són desplaçats del paisatge agrari, ja que alguns decideixen
vendre les seves terres.
En el segon capítol empíric mostro com les perspectives dels agricultors i els seus valors respecte als
serveis dels ecosistemes agraris es veuen afectats per les seves pràctiques de gestió de la terra. Utilitzo
l'enfocament de valoració socio-cultural i trobo que els agricultors intensius valoren altament la
capacitat de la terra agrària per absorbir contaminants, mentre que no tenen en compte altres serveis
culturals com els coneixements tradicionals. Per contra, els agricultors diversificats a petita escala
aprecien els serveis culturals en major mesura que altres tipologies d'agricultors, essent el grup més
conscient dels efectes que les seves pràctiques agrícoles tenen en la qualitat dels aliments.
En el tercer capítol empíric, destaco que en el cas d'estudi de Itoiz-Canal de Navarra, els mitjans de
vida dels agricultors estan exposats a factors d'estrès com les pertorbacions climàtiques i les
transformacions econòmiques estructurals que fan que els preus dels cultius fluctuïn, augmentant
d'aquesta manera la potencial vulnerabilitat dels agricultors. Utilitzo aquí el marc de la doble
vulnerabilitat i el combino amb l'ecologia política per a respondre a la pregunta de si l'adopció de la
tecnologia moderna de reg fa que els agricultors siguin més capaços d'adaptar-se o, pel contrari,

xii
augmenten la seva vulnerabilitat. Trobo que el nou regadiu fa més robustos als agricultors davant dels
factors d'estrès mencionats, però al mateix temps també trobo que els agricultors més intensius són
més sensibles quan han adoptat la irrigació moderna degut a la seva dedicació a temps complet a
l'agricultura i la seva especialització en cultius comercials amb alta demanda d'aigua, entre altres
factors.
En el quart i últim capítol empíric avaluo el paper que desenvolupen les institucions (formals i
informals) relacionades amb el regadiu modern per influir en la gestió de la terra i l'accés als recursos
de propietat comuna. Trobo que el nou regadiu és més sòlid respecte a la gestió dels recursos hídrics
i de la terra ja que sembla augmentar el control sobre el consum d'aigua. Tot i així, té un impacte
negatiu sobre el reconeixement del dret dels agricultors a organitzar-se. Això fa que els agricultors
siguin més dependents de les empreses que controlen l'aigua de reg, alhora, fent-los més dependents
de l'ajuda externa en cas de necessitat. A més, l'aproximació analítica des de la legitimitat i l'equitat
mostra que aquells agricultors doblement vulnerables - els agricultors diversificats a petita escala - no
estan reconeguts en les normes que legitimen la introducció del reg modern i la seva participació en
la presa de decisions és menor en comparació amb els agricultors més intensius.
Aquesta tesi retrata les diferències sobre visions referents al valor dels serveis dels ecosistemes, el
desenvolupament rural i els efectes de la modernització i la vulnerabilitat dels agricultors integrats en
el més ampli nexe entre medi ambient i desenvolupament. Aquesta investigació s'espera que sigui
d'interès per les comunitats interessades en debats sobre els serveis dels ecosistemes i els mitjans de
vida rurals dels sistemes socio-ecològics agraris influïts pel procés de canvi global.
Paraules clau: reg modern, intensificació agrària, serveis dels ecosistemes agraris, els mitjans de vida
rurals, la vulnerabilitat social, equitat i legitimitat.

xiii
Acknowledgements
This work has been possible thanks to several people who have supported me in many different ways.
When I embarked on the PhD process, I aspired to equip myself in many different aspects, not only by
advancing my knowledge of socio-ecological dynamics, which I am passionate about, but also by
becoming a more patient, resolute and politically mature person. For me it has always been, and still
is, a learning process where the journey itself is more important than the destination.
First of all, I would like to thank Nerea Ortiz and Anil Markandya for financing four years of PhD studies
at the Basque Centre for Climate Change Centre (BC3). They trusted me since the beginning of the
journey, when I arrived with few fuzzy research ideas focused on relating soil ecosystems management
with social governance structures.
These ideas took shape when Unai Pascual agreed to supervise my PhD within the EcoFINDERs
European project. This project allowed me to gain access to valuable databases and finance a three
months stay in Sweden, and to develop fieldwork in Navarre, Spain. I will always be indebted to Unai
for his confidence. Although he warned me about the high level of expertise he expected from me, he
never excessively pressured me and has guided me, providing me with inspiration in difficult moments
of design, analysis and throughout the writing process. With his attention to detail, accuracy and
critical analysis, Unai has provided me with many invaluable insights and comments over the years
that have made the conceptualisation and execution of this dissertation much stronger.
I also owe my gratitude to my other supervisor, Esteve Corbera, at the Institute of Environmental
Science and Technology (ICTA), Universitat Autònoma Barcelona. Esteve is an esteemed professional,
and I appreciate his spirits that, along with Unai’s, have encouraged and motivated me all the way
through. I thank you for all the guidance in designing this thesis, the inspiring discussions through
Skype and the transferred strength to keep searching for answers to the ‘not always obvious’
questions.
Both Unai and Esteve’s support has had great value through the ellaboration of the thesis as a whole.
They have set an incredible example and a mirror in which I aspire to see myself reflected. Both have
contributed not only to this dissertation, but also to my intellectual and personal development.
Despite moments of uncertainty in which I could not “see the end”, they encouraged me and explained
that every process deserves its maturation time. Perhaps I would have been more optimistic if mine
had developed a bit faster…
I also want to thank the invaluable team of BC3. I have really felt at home there. I would like to first
begin by thanking with my desk mates: Elisa Sainz de Murieta, Marta Olazabal, Patricia Gallejones.

xiv
Elisa, Marta and Patri have, in close proximity, supported the good but also the bad moments of nerves
and desperation when I could not concentrate or in certain moments struggling with statistics or
writing. I have learned a lot from them and enjoyed their company very much. They helped me with
Zotero citation skills and provided many other advice, at both personal and professional levels, which
were always useful and perceptive.
I also had great support for the dissertation collaboration from Marc Neumann. He has acted as my
professional mentor, primarily at the last stages of my PhD and he was of great support on R scripts
writing. Thank you for your always good disposition and your good humour. I really appreciate it.
I would also like to thank Elena Ojea for her guidance, especially in the beginning stages of the thesis.
I greatly enjoyed our meals where I could speak through my thoughts, which revitalised my work.
Agustin del Prado and Iñaki Arto have also been good advisors whenever I was in doubt. Iñaki, together
with Ignacio Cazcarro, helped with the vulnerability indexes and Agus provided excellent feedback for
a useful agrarian contextualisation; thank you, for always making me feel very comfortable when
talking to you. Ignacio Palomo and Eneko Garmendia were also of great assistance whenever I asked
them about ecosystem services and methodological doubts (survey, interviews and focus groups) and
about political ecology doubts.
R programming and statistics have been by far the most difficult tasks I have had to learn. To express
my gratitude in this regard, I have a long list of names of whom I owe considerable appreciation: Arelly
Ornelas, Vicente Nuñez, Juan Ignacio Modroño, Aitor Larrañaga, Ignacio Palomo, Victor Urrea, Dae-Jin
Lee, Iñigo Capellan, Josue Polanco, Javier Martínez, Elena Perez-Miñana, Alwyn Williams and especially
Marc Neumann. I can be very tiresome when stuck in R!
I owe a significant thank you to all those who helped at the end with the writing of this dissertation.
Julen Ugalde, Mary Thomson, Bosco Lliso, Noelia Zafra, Iñigo Capellan, Mavi Román, Elena Galan,
Martha Kerr and especially Ane Zubizarreta for their help on English edits while writing the dissertation
manuscript. You have demonstrated great camaraderie and affection. I would also like to thank to
Rebekah Breding for the proof reading of the thesis. I have learnt a lot during the process and she has
been very fast mainly at the last stage when my demands were much shorter in time.
I would also thank to the Oketa group for the stimulating discussions and field trips we took together.
Most of the mates in BC3 have become good friends over time. Many of them have already been
mentioned but I would also like to include Amaia de Ayala, Marta Pascual, Maialen Garmendia, Alina
Tempes, Itxaso Ruiz, Pablo Martinez, Guillermo Pardo, Xaquin García, Kishore Davala, Nadine Sahouri,
xv
and many others. They all have been of immense help over the years. Thanks for the beers after work
and the humorous coffee breaks.
I cannot forget to express my extreme gratitude to Mari Jose, the current director of BC3, who has
supported me to finish this stage of my life, advising me through those chapters and also in future
career opportunities.
I especially want to thank all the support of Julen Ugalde, in and outside of BC3. He has read several
chapters of the dissertation, assisting me with writing and has endured some of my troubled times
and disappointments but always maintained confidence in me, despite my most stressed moments.
Outside of BC3, I would also like to thank Jose Ramon Olarieta and Christoz Zografos, both of whom
supervised the two masters’ dissertations and kindled the flame of curiosity and enthusiasm, which
was crucial in starting the PhD. They have always been helpful during the PhD process, especially at
the beginning.
I do not want to forget about my mates during my stay in Sweden: my supervisor there, Katarina
Hedlund, who offered me the warmest welcome and who always took consideration of my comfort
level and intellectual curiosities. I really appreciated she always had time for me whenever I knocked
on her door. I really learnt a lot and had the calmest mind of the process while I was there, which
allowed me to advance and savour my stay. Alwyn Williams, Helene Bracht Jörgensen, Ronggang Cong
(Leo) and Mark Brady, thank you! Likewise, to my Latin friends who made my visit much more
interesting: Soraya Maya, Alejo and Jesus. Thanks for all the trips and long and interesting discussions
we shared together.
I would also like to include in these acknowledgements to my WACHI friends from the University
Autonomous of Barcelona: Diana Calvo, Sara Maestre and Mar Grau. I am always looking forward to
seeing you whenever I go to Catalunya. Our workshop in Vielha was incredible and it was the seed of,
I hope, many other meetings to continue our discussions on institutions and political ecology. You all
inspire me a great deal! I dedicate a special thank you to Diana Calvo for our discussions since the
master’s and within the last stages of the thesis. You have always been ready to share references and
discuss complicated concepts. I am glad to have met you and to discover that we are traveling parallel
paths! Laura Calvet was also of considerable help when designing my survey for the fieldwork and
mainly for the socio-cultural valuation methods. Marta Borros with the maps. In Barcelona, I cannot
forget about Natalia Jojart and Felipe Díaz, both good friends, who are always willing to host me in my
visits or to help with administrative issues.

xvi
I would like also to express my gratitude to Marc Vizcano. You were there before, during and almost
up until the end of the journey. You know very well how difficult this has been at certain moments
and you have always helped me to your best ability; reviewing drafts, lending your car for work
purposes, accompanying me through lows and listening to all my complaints, all while trying to make
me feel better.
Julien Brun and Idoia Urrutia deserve an enormous thank you for their professionalism during the
three intensive months of fieldwork in Navarre. I am grateful for their patience and understanding at
some challenging moments. I also want to thank Begoña Renteria and Imanol Okiñena for their
assistance during the focus groups. You provided more than merely transcribing the discussion, time
management and photography. You also gave me the necessary energy which propelled me through
that day. I have many fieldwork participants in mind that made this work much more pleasant: Patxi
Sueskun, Leire Elorz, Juan Jesus Corcin, Charo Brinquis, Jokin del Valle, Celsa Peitado, Milagros and
Mari, among others. I have learnt so much from all of you; not only about rural life but also about
myself.
Other friends who deserve a special mention for all the encouragement throughout these doctoral
years (despite my periods of silence and disappearance) include my friends from Amurrio. Although
sometimes I felt as if my situation was difficult to relate to, you helped me to disconnect from work
through long walks, mountain trips, party nights and the funniest pintxo-potes. You have encouraged
me by attending a few of my seminars and listening to my long boring rehearsals beforehand. I have
felt very fortunate of having all you in my life: Begoña Renteria, Garazi Ibarretxe, Miriam Larrakoetxea,
Leire Cuadra, Oihane Abrisketa, Aitziber Lazkano, Maria Larrea, and Ana Isabel Romero.
Most definitely, this would have not been possible without the help of my family. You have always
facilitated the construction of the person I am today. My brother, Joseba Albizua has always provided
me with the calm atmosphere I needed through his company and long walks. You have educated me
and I have learnt from you that with effort and determination all is possible, or at least, you taught
me to learn from the process, which may be more important. I have climbed the highest mountains
and visited the farthest places while dreaming of my future. Thank you for sharing all of this and for
helping me realise about my ambitions. Although I may have complained about your strictness, I know
you only wanted to help me grow and better myself. My father, Iñaki Albizua has always helped with
all that he was capable. He provided me a shoulder to rest on or by taking me to the airport, train or
bus whenever I had to travel. He has always listened patiently and trusted me. Finally, my mother has
greatly assisted me with everything she could. She has listened and patiently advised and

xvii
accompanied me throughout the worst moments of the doctorate. She has not only provided me with
the best meals but also nourished me emotionally. Thank you.

xviii
Agradecimientos
Este trabajo ha sido posible gracias a muchas personas que me han ayudado de diversas maneras.
Cuando me embarqué en esta aventura quería 'equipar mi mente'. No sólo avanzar en el conocimiento
sobre las dinámicas socio-ecológicas, un tema que me apasiona, sino también convertirme en una
persona más paciente, decidida y madura a nivel político. Para mí siempre ha sido y sigue siendo, un
proceso de aprendizaje donde el viaje en sí mismo es más importante que el destino.
En primer lugar, me gustaría dar las gracias a Nerea Ortiz y Anil Markandya por financiar mis cuatro
años de estudios de doctorado en el Basque Centre for Climate Change (BC3). Ellos confiaron en mí al
principio, cuando llegué con algunas ideas difusas sobre los ecosistemas de suelo y las estructuras de
gobernanza social.
Esto tomó forma con el tiempo, cuando Unai Pascual decidió supervisar mi doctorado dentro del
proyecto europeo EcoFINDERs. Este proyecto me permitió acceder a una valiosa base de datos y
financiar la estancia de tres meses en Suecia y el trabajo de campo desarrollado en Navarra. Siempre
estaré en deuda con Unai por su confianza. Aunque me advirtió acerca del nivel de exigencia que
esperaba de mí, nunca me ha presionado en exceso, ha hecho que supere este reto dirigiendo el
trabajo y aportándome inspiración en los momentos más difíciles del diseño, análisis y escritura. Con
su atención al detalle, precisión y análisis crítico, Unai me ha proporcionado muchas ideas invaluables
y comentarios durante estos años, haciendo que la conceptualización y la redacción de esta tesis sea
mucho más fuerte. También debo mi agradecimiento a mi supervisor Esteve Corbera, en el Institut de
Ciència i Tecnologia Ambientals (ICTA), de la Universidad Autónoma de Barcelona. Esteve no es sólo
un gran profesional, también reconozco y agradezco su gran vitalidad y espíritu, que me ha animado
y motivado. Le agradezco toda la ayuda en el diseño de esta tesis, las discusiones inspiradoras al otro
lado del Skype y la fuerza transmitida a seguir buscando respuestas a preguntas que no siempre
resultaban obvias. Tanto, el apoyo de Unai como el de Esteve, han tenido un gran valor en la
elaboración de esta tesis. Ambos han sido un modelo y un espejo en el que me ha agradado verme
fugazmente reflejada. Los dos han contribuido mucho a esta tesis doctoral y a mi desarrollo intelectual
y personal. A pesar de los malos momentos, cuando no podía ver el final, me han animado y explicado
que cada proceso merece su tiempo de maduración. Habría agradecido si el mío hubiera sido un poco
más rápido...
Agradezco al gran equipo de BC3. Realmente me he sentido en casa allí. Me gustaría empezar con mis
compañeras de mesa: Elisa Sainz de Murieta, Marta Olazabal y Patricia Gallejones. Elisa, Marta y Patri
han vivido de cerca los buenos pero también los malos momentos de nervios cuando no me podía
concentrar o lidiaba con bloqueos en la estadística y la escritura. He aprendido mucho de ellas y he

xix
disfrutado de su compañía. No sólo me han ayudado a nivel académico, sus consejos a nivel personal
y profesional siempre fueron útiles y perspicaces.
También tuve un gran apoyo de Marc Neumann. Marc ha actuado como mi mentor profesional, sobre
todo en las etapas finales de mi tesis doctoral. Debo agradecer de corazón su siempre positiva
disposición y su buen humor para ayudarme con los comandos de R.
También me gustaría agradecer a Elena Ojea por su orientación, especialmente en las primeras etapas
de la tesis. He disfrutado mucho de nuestras comidas en las que aireaba mis dudas sobre la tesis y
estas conversaciones me daban fuerza y energía para empezar de nuevo el trabajo.
Agustín del Prado e Iñaki Arto también han sido buenos consejeros. Iñaki, junto con Ignacio Cazcarro,
me han ayudado con los índices de vulnerabilidad y Agus me ha aportado excelentes comentarios para
una mejor contextualización agraria. Ignacio Palomo y Eneko Garmendia también fueron de gran
ayuda con temas relacionados con los servicios eco-sistémicos y la ecología política, tanto a nivel
metodológico como conceptual.
La estadística y sobre todo la programación en R han sido las tareas más difíciles que he tenido que
aprender. En este sentido, tengo una larga lista de nombres a quien debo considerable
reconocimiento: Arelly Ornelas, Vicente Nuñez, Juan Ignacio Modroño, Aitor Larrañaga, Ignacio
Palomo, Víctor Urrea, Dae-Jin Lee, Iñigo Capellan, Josue Polanco, Javier Martínez, Elena Perez-Miñana,
Alwyn Williams y especialmente Marc Neumann. Puedo ser muy cansina cuando estoy bloqueda en
R!
Debo un gran agradecimiento a todos los que me han ayudado al final con la escritura de esta tesis.
Mary Thomson, Bosco Lliso, Noelia Zafra, Iñigo Capellan, Mavi Román, Elena Galán, Martha Kerr y
especialmente Ane Zubizarreta. Gracias Ane por tu gran ayuda en las ediciones de inglés mientras
escribía el manuscrito. Habéis demostrado cariño y gran camaradería. También me gustaría agradecer
a Rebekah Breding la mejora de la escritura. He aprendido mucho durante el proceso y ha sido muy
rápida principalmente al final cuando mis demandas eran cada vez más cortas en el tiempo.
Quiero también dar las gracias al grupo Oketa por las estimulantes discusiones y excursiones. La
mayoría de los compañeros en BC3 se han convertido en buenos amigos con el tiempo. Muchos de
ellos ya los he mencionado, pero también me gustaría incluir a Amaia de Ayala, Marta Pascual, Maialen
Garmendia, Alina Tempes, Itxaso Ruiz, Pablo Martinez, Guillermo Pardo, Xaquin García, Kishore
Davala, Nadine Sahouri y muchos otros. Todos ellos han sido de enorme ayuda durante estos años.
Gracias por las cervezas después del trabajo y los divertidos descansos a la hora del café.

xx
No puedo olvidar mi gratitud a Mari Jose, la actual directora de BC3, que me ha apoyado para terminar
esta etapa de mi vida, y también me ha asesorado en estos capítulos así como me ha brindado su
apoyo en mis perspectivas futuras como científica.
Especialmente quiero agradecer todo el apoyo de Julen Ugalde, dentro y fuera de BC3. Ha leído varios
capítulos de la tesis y me ha ayudado no sólo con la escritura sino que también ha sufrido algunos de
mis malos momentos y decepciones. Gracias por tu confianza, y por ayudarme a desconectar y hacer
mucho más llevadero este final de tesis.
Fuera de BC3, también me gustaría agradecer a Jose Ramon Olarieta y Christoz Zografos, ambos me
supervisaros las dos tesinas de master y encendieron la llama de la curiosidad y el entusiasmo que fue
crucial en el inicio de la tesis doctoral. Siempre han sido de ayuda durante el proceso de tesis,
especialmente al principio.
No quiero olvidarme de mis compañeros durante mi estancia en Suecia: mi supervisora, Katarina
Hedlund, quien me ofreció la más cordial bienvenida y siempre se preocupó de mi bienestar tanto
intelectual como personal. Aprecio muy profundamente el tiempo dedicado. Fue un placer tu atención
cada vez que tocaba tu puerta. Realmente aprendí mucho y tuve la mayor calma de todo el proceso
mientras estaba allí, que me permitió avanzar y disfrutar de mi estancia. Alwyn Williams, Helene
Bracht Jörgensen, Ronggang Cong (Leo) y Mark Brady, gracias! Además, a mis amigos latinos allí que
hicieron mi visita mucho más interesante: Soraya Maya, Alejo y Jesús. Gracias por todos los viajes y
largas e interesantes conversaciones que compartimos.
También me gustaría incluir en los agradecimientos a mis amigas WACHI de la Universidad Autónoma
de Barcelona: Diana Calvo, Sara Maestre y Mar de Grau. Siempre espero veros cuando viajo a
Barcelona. Nuestro taller en Vielha fue increíble y fue la semilla de, espero, muchos otros encuentros
para continuar nuestras discusiones sobre instituciones y ecología política. Todas vosotras me inspiráis
mucho! Dedico un agradecimiento especial a Diana Calvo, por nuestros debates desde el comienzo y
sobre todo en las últimas etapas de la tesis. Gracias por tu cooperación a la hora de compartir
referencias y discutir conceptos complicados. Me alegro de haberte conocido y descubrir que estamos
viajando en caminos paralelos. Laura Calvet también fue de considerable ayuda en el diseño de la
valoración socio-cultural para el trabajo de campo y Marta Borros me ha ayudado con los mapas. No
puedo olvidar a Natalia Jojart y Felipe Díaz, ambos buenos amigos, que siempre están dispuestos a
hospedarme en mis visitas o a ayudarme con cuestiones administrativas.
También me gustaría expresar mi agradecimiento a Marc Vizcano. Estabas ahí antes, durante y casi
hasta el final del viaje. Sabes muy bien lo difícil que ha sido en algunos momentos y siempre has

xxi
tratado de ayudarme lo mejor que has sabido; has revisado borradores, me has prestado tu coche
para trabajar y me has acompañado y escuchando todas mis quejas, al mismo tiempo tratando de
hacerme sentir mejor.
Julien Brun e Idoia Urrutia merecen un gracias enorme, por su profesionalidad durante los tres meses
de intensivo trabajo en Navarra. Agradezco vuestra paciencia y comprensión en momentos difíciles.
También quiero agradecer a Begoña Renteria e Imanol Okiñena por su ayuda durante el taller en
Miranda de Arga. Más allá de transcribir la discusión, gestionar el tiempo y sacar fotos, me disteis la
energía que necesitaba ese día.
Tengo a muchos de los participantes en este trabajo de campo en la mente que han hecho este trabajo
mucho más agradable: Patxi Sueskun, por su increíble generosidad dejándome quedar en su casa,
Leire Elorz, Juan Jesus Corcin, Charo Brinquis, Jokin del Valle, Celsa Peitado, Milagros y Mari, entre
otros. He aprendido mucho de vosotros; no sólo sobre la vida rural sino también sobre mí misma.
Una mención especial por todo el estímulo a lo largo de estos años de doctorado (a pesar de mis
periodos de silencio y desaparición) a mis amigas de Amurrio. Aunque a veces me sentía un poco
incomprendida en este tema, me habéis ayudado a desconectar del trabajo a través de caminatas,
excursiones, noches de fiesta y los divertidos pintxo-potes. Algunas de vosotras me habéis animado
asistiendo a algunos de mis seminarios y escuchando mis aburridos ensayos previamente. Me siento
muy afortunada de teneros en mi vida: Begoña Renteria, Garazi Ibarretxe, Miriam Larrakoetxea, Leire
Cuadra, Oihane Abrisketa, Aitziber Lazkano, María Larrea, Ana Isabel Romero y mi prima, Amaia Diego.
Definitivamente, esto no hubiera sido posible sin la ayuda de mi familia. Vosotros habéis contribuido
los que más en hacer de mí la persona que soy. Mi hermano, Joseba Albizua siempre me ha aportado
la tranquilidad necesaria, a través de su compañía y las largas caminatas. Él me ha educado y de él he
aprendido que con esfuerzo y determinación casi todo es posible, o al menos consigues enriquecerte
en el proceso. He subido las montañas más altas y he visitado los lugares más lejanos mientras soñaba
con mi futuro. Gracias por compartir todo esto y por ayudarme a llevar a cabo mis ambiciones. Aunque
muchas veces me he quejado de que eres muy estricto, sé que sólo quieres ayudarme a crecer y
mejorar. Mi padre, Iñaki Albizua me ha ayudado siempre con todo lo que era capaz. Prestándome un
hombro para descansar o llevándome al aeropuerto, tren o autobús cada vez que tenía que viajar. Él
siempre ha escuchado y confiado en mí. Finalmente, mi madre ha ayudado con todo lo que ha podido.
Ella ha escuchado pacientemente, me ha aconsejado y me ha acompañado en los peores momentos
del doctorado. No sólo me proporciona las mejores comidas sino que también me nutre
emocionalmente. Gracias.

xxii
Eskerrak
Lan hau posiblea izan da jende askori esker. Abentura hontan sartu nintzenean, nire burua garatu nahi
nuen. Sozio-ekologiko dinamikaei buruz adimena aurreratzeaz aparte, izugarri atsegin dudan gaia,
pertsona pazienteago, seguruago eta politikoki heldu batean bilakatu nahi nuen. Niretzat, ikasteko
prozesu honetan bidaia helmuga baino garrantzitsuagoa da.
Lehengoz, Nerea Ortizi eta Anil Markandyari eskertu nahi diet, doktoretza Basque Centre for Climate
Change (BC3)-an lau urte finantzatzeagatik. Nitaz fidatu ziren hasieran, lur ekosistema eta gizarte
gobernu egiturei buruzko ideia batzuekin heldu nintzenean.
Ideia hauek forma hartu zuten Unai Pascualek nire lana gainbegiratzea erabaki zuenean eta nire
doktoretza EcoFINDERS europar proiektuan sartu zuenean. Proiektu honi esker datu baliotsuetara
heldu eta Suedian estantzia bat finantziatu ahal izan nuen. Beti izango naiz zorretan Unairekin, bere
konfiantzagatik. Nahiz eta exigentzia maila altua adierazi izana, ez nau inoiz presio gehiegi jarri eta
erronka gainditzea lagundu dit momentu zailetan, bere laguntza oso baliogarria izan da, disenuan,
analisietan eta idazkeran. Bere arreta xehetasuna, zehaztasun eta analisi kritikoa, Unaik ideia eta
komentario baliotsu asko eman dizkit urteetan zehar, berak kontzeptualizazio eta idazkera asko
indartu ditu. Baita Esteve Corbera-ri, Institut de Ciència i Tecnologia Ambientals-ean (ICTA),
Bartzelonako Unibertsitate Autonomoan, eskerrak eman nahi dizkiot. Esteve ez da soilik profesional
handi bat, bere bizitasunak eta espirituak animatu eta asko motibatu naute. Tesi honen diseinuari
buruz emandako laguntza guztiak eskertzen dizkiot, baita Skype atzean iradoki eztabaidak eta
transmititzen duen indarra begi-bistako galderak ez zirenei erantzunak bilatzerakoan. Biok, Unai eta
Esteve eredu bat jarraitzeko izan dira niretzat. Biok asko lagundu dute tesi honen eta nire garapen
intelektualan eta pertsonalan. Momentu txarrak izan arren, bukaera ezin nuenean ikusi, animatu
naute eta prozesu guztiek bere denbora behar dutela azaldu didate. Eskertuko nuke nirea pixkat
arinago izango balitz...
BC3 taldeari eskerrak eman behar dizkiot. Benetan etxean bezala sentitu naiz han. Hasiko naiz nire
mahai kideekin: Elisa Sainz de Murieta, Marta Olazabal eta Patricia Gallejones. Elisa, Marta eta Patri
hurbiletik bizi dute momentu onak baina urduritasun momentu txarrak ere bai. Asko ikasi eta
disfrutatu dut haiekin. Ez naute bakarrik akademikoki lagundu baina pertsonal arloan ere oso
baliogarriak izan dira.
Marc Neumann-ek ere asko lagundu dit. Marc nire aholkulari profesionala izan da, batez ere nire
doktoretzaren azken txanpetan. Bihotzez eskertzen diot bere laguntza, beti jarrera positiboarekin eta
umore onarekin R idazkeran asko lagundu nau.
xxiii
Elena Ojeari ere bere orientabidea eskertu nahi diot, betez ere abentura honen hasieran. Oso ondo
pasatu dut gure bazkarietan beti nire zalantzak ateratzen nituenean. Elkarrizketa horiek indarra
ematen zidaten lana berriz hasteko.
Agustín del Prado eta Iñaki Arto aholkulari onak ere izan dira. Iñakik eta Ignacio Cazcarrok ahultasuna
indizerekin lagundu naute eta Agus komentario baliogarriekin nekazal-ekosistema kontextua
indartzeko. Ignacio Palomo eta Eneko Garmendia ere oso lagungarriak izan dira, ekosistema zerbitzuak
eta ekologia politika gaietan.
Estatistika eta bereziki R programazioa ikasi behar izana, lan zailena izan da. Zentzu honetan, izenen
zerrenda luze bat daukat onarpen handia dudan jendearentzat: Arelly Ornelas, Vicente Nuñez, Juan
Ignacio Modroño, Aitor Larrañaga, Ignacio Palomo, Víctor Urrea, Dae-Jin Lee, Iñigo Capellan, Josue
Polanco, Javier Martínez, Elena Perez-Miñana, Alwyn Williams eta batez ere Marc Neumann. Oso
astuna izan naiteke R-n blokeatuta nagoenean!
Esker handia azken etapan idazketan lagun didatenei: Mary Thomson, Bosco Lliso, Noelia Zafra, Iñigo
Capellan, Mavi Román, Elena Galán, Martha Kerr eta bereziki Ane Zubizarreta. Ane, mila esker zure
ingelesa zuzenketengatik. Maitasuna eta adiskidetasun handia erakutsi duzue. Rebeka Bredingi ere
eskerrak ematea nahiko nuke. Oso azkarra izan da batez ere, amaieran, nire eskaerak denboran
laburragotan bilakatu zirenean.
Oketa taldeari ere eskerrak eman nahi dizkiot, ibilaldi eta elkarrizketengatik. BC3 bazkide gehienak
lagun onak bihurtu dira denboran zehar. Horietako asko jada aipatu ditut, baina, era berean sartu nahi
ditut: Amaia de Ayala, Marta Pascual, Maialen Garmendia, Alina Tempes, Itxaso Ruiz, Pablo Martinez,
Guillermo Pardo, Xaquin García, Kishore Davala, Nadine Sahouri eta abar. Haiek guztiak laguntza handi
bat izan dira urte hauetan. Mila esker lana bukatu osteko garagardoengatik eta kafe atseden
dibertigarriengatik.
Ezin dut ahaztu Mari Jose, egungo BC3ko zuzendaria. Asken etapa hau amaitzea lagundu dit. Kapitulu
hauetan aholkatu dit eta zientifiko gisa nire etorkizuneko perspektibetan ere bai.
Batez ere, Julen Ugalderen laguntza eskertu nahi dut, BC3 barruan eta kanpoan. Ez duzu bakarrik
tesiaren kapitulu batzuk irakurri eta idazkeran lagundu baina baita nire une txarrak eta etsipen batzuk
jasan dituzu. Eskerrik asko nigan sinesteagatik eta azken txanpa hau askoz errazagoa egiteagatik.
BC3-tik kanpo, Jose Ramon Olarieta eta Christoz Zografos ere aipatu nahi ditut. Biek master tesiak
gainbegiratu zituzten eta kuriositate grina piztu zuten. Hau erabakigarria izan zen doktoretza tesi hau
hasterakoan. Beti lagungarriak izan dira tesi prozesuan, bereziki hasieran.
xxiv
Ez dut Suediako lagunak ahaztu nahi. Nire superbisorak Katarina Hedlund-ek ongietorri bero bat
eskaini zidan eta nire ongizateaz beti kezkatu zen. Eman zuen denbora asko eskertzen dut. Plazer bat
izan zen beti denbora izatea niretzat. Asko ikasi nuen denbora hartan eta tesi prozesuaren lasaitasun
momentu onena izan zen. Honekin tesi lana aurreratu eta estantziaz gozatu ahal izan nuen. Eskerrak
to Alwyn Williams, Helene Bracht Jörgensen, Ronggang Cong (Leo) eta Mark Brady! Lagun latinoak ere
egonaldi hura interesgarriagoa egin zuten: Soraya Maya, Alejo eta Jesús. Eskerrik asko bidaiengatik
eta elkarrizketa luzeak eta interesgarriak izateagatik.
Bartzelonako Unibertsitate Autonoma WACHI lagunak ere sartu nahi ditut atal honetan: Diana Calvo,
Sara Maestre eta Mar Grau. Beti Bartzelonara noa zuek ikusteko gogoekin. Vielhan egindako tailerra
sinestezina izan zen eta espero dut instituzio eta ekologia politikoari buruz eztabaidak izaten
jarraitzea. Zuek denok inspirazio handi bat zarete niretzat! esker berezi bat Dianarentzat, hasieratik
gure elkarrizketengatik. Eskerrik asko zure erreferentziak banatzeagatik eta kontzeptu konplikatuak
eztabaidatzegatik. Asko pozten naiz zu aurkitzeaz eta bide paralelo batean bidaiatzeaz. Laura Calvet
ere laguntza handikoa izan zen balorazio sozio-kulturalaren disenuan eta Marta Borros mapak egiten.
Ezin ditut ahaztu Natalia Jojart eta Felipe Díaz lagunak, beti ostatu bat eman didate ala administrazio
paperekin lagundu didate.
Eskerrak eman nahi dizkiot Marc Vizcanori. Bidaia aurretik, bitartean eta ia amaieran han egon zara.
Oso ondo dakizu ze zaila izan den momentu batzuetan eta beti laguntzen ahalegindu zara. Zirriborroak
irakurri dituzu, zure kotxea utzi didazu lan egiteko eta nire kezka guztiak entzun dituzu aldi berean ni
hobeto egotea saiatzen.
Julien Brunek eta Idoia Urrutiak esker handia merezi dute, erakutsitako profesionaltasunagatik
Nafarroan emandako hiru hilabetetan egindako lan gogorraren geroztik. Une zailetan zuen pazientzia
eta ulermena eskertzen ditut. Begoña Renteriari eta Imanol Okiñenari ere eskerrak eman nahi dizkiet
emandako laguntzagatik Miranda de Arga tailerrean. Denbora kontrolatu, argazkiak atera eta
eztabaida idatziz aparte, egun horretan behar nuen energia eman zidaten.
Lan honetan parte hartu dutenen izen asko ditut buruan, lana askoz atseginagoa egin dutenak: Patxi
Sueskun, euren eskuzabaltasunagatik bere etxea eskaintzean, Leire Elorz, Juan Jesus Corcin, Charo
Brinquis, Jokin del Valle, Celsa Peitado, Milagros y Mari, besteak beste. Zuetaz asko ikasi dut; ez
bakarrik nekazal bizitzari buruz baina baita neure buruari buruz.
Aipamen berezi bat Amurrioko lagunentzat. Doktoretza urte hauetan (nire isiltasuna eta desagertze
epeak gorabehera) emandako animoengatik. Nahiz eta batzuetan ulertzen ez nautelakoan sentitu,
deskonektatzen lagundu didazue, mendi martxetan, txangoetan, jaietan eta pintxo-pote

xxv
dibertigarrietan. Zuetako batzuk hitzaldi batzuetara etorri zarete animoak emateko eta nire saio
aspergarri eta luzeak ere entzun dituzue. Oso zoriontsu sentitzen naiz nire bizitzan zuek izateagatik:
Begoña Renteria, Garazi Ibarretxe, Miriam Larrakoetxea, Leire Cuadra, Oihane Abrisketa, Aitziber
Lazkano, María Larrea, Ana Isabel Romero eta nire lehengusina, Amaia Diego.
Behin betiko, hau ez litzateke posible izan nire familiaren laguntza barik. Gehien lagundu didazue
naizen pertsona bihurtzen. Nire neba, Joseba Albizua beti eman dit beharrezko lasaitasuna bere
konpainia eta ibilaldi luzeen bidez. Berak hezi nau eta erakutsi dit, ahalegin eta determinazioarekin ia
dena posible dela, edo , gutxienez, prozesuan ikasten duzula. Mendi altuenak igo ditut toki urrunenak
bisitatu ditut berarekin nire etorkizunari buruz ametsetan nenbilen bitartean. Mila esker guzti
horretan parte-hartzeagatik eta nire ametsak lortzen laguntzeagatik. Nahiz eta askotan zure zorrotaz
kexatu izan, badakit bakarrik lagundu nahi duzula. Nire aitak, Iñaki Albizua, beti ahal zuen guztian
lagundu dit. Atseden hartzen edo aireportura edo autobus / tren geltokira eramaten bidaiatu behar
nuen bakoitzean. Beti niri entzun eta nigan konfiantza izan du. Amaitzeko nire amak, Gloria Aguinaco,
aholkuak eman eta momentu txarrenetan nirekin egon da. Ez du bakarrik bazkaririk hoberenak
ematen baina sentiberaz ere elikatzen nau. Mila esker.

xxvi
Agraïments
Aquesta feina ha estat possible gràcies a moltes persones que m'han donat suport de moltes maneres
diferents. Quan vaig embarcar-me en el procés del doctorat vaig voler ‘equipar la meva ment' en molts
aspectes diferents, no només avançant en les dinàmiques socioecològiques del coneixement, de les
quals en sóc apassionada, sinò també esdevenint una persona més pacient, resolutiva i madura
políticament. Per a mi sempre ha estat, i encara és, un procés d'aprenentatge on el viatge és més
important per sí mateix que la destinació.
Primer de tot, m'agradaria donar les gràcies a Nerea Ortiz i Anil Markandya per finançar els meus 4
anys d’estudis de doctorat al Basque Centre for Climate Change Centre (BC3). Van confiar en mi al
començament quan vaig arribar amb idees borroses sobre com cavar més profund en els ecosistemes
del sòl connectant la seva gestió amb les estructures socials de governança.
Tot va agafar molta més forma amb temps quan Unai Pascual va decidir supervisar el meu doctorat
dins del projecte europeu EcoFINDERs. Aquest projecte em va permetre aconseguir accés a una base
de dades valuosa i finançar tres mesos d’estada Suècia i el treball de camp que vaig desenvolupar més
tard a Navarra, Espanya. Sempre estaré en deute amb Unai per la seva confiança. Tot i que em va
advertir de l’alt nivel que esperava de mi, mai m’ha pressionat en excès i ha guiat aquesta tesi tot
proporcionant-me inspiració en moments de dificultat durant el procès de disseny, anàlisi i escriptura.
Amb la seva atenció pel detall, la precisió i l’anàlisi crítica Unai m’ha proporcionat moltes idees
inavaluables i comentaris durant aquests anys que han fet la conceptualització i la redacció d'aquesta
dissertació molt més forta. També dec el meu agraïment al meu altre supervisor, Esteve Corbera, de
l’Institut de Ciència i Tecnologia Ambientals (ICTA), a l'Universitat Autònoma de Barcelona. Esteve no
és només un gran professional sinó que també reconec els seus esforços, que es van unir a Unai i
m’han animat i motivat. Agraeixo tota l'ajuda en el disseny d’aquesta tesi, les discussions inspiradores
darrere de la línia de l’Skype i la força transmesa per continuar buscant respostes a unes preguntes
que no sempre eren evidents. El suport de tots dos, d’Unai i Esteve, ha tingut un gran valor al llarg de
l’elaboració de la tesi. Han estat un molt bon exemple i un mirall on vaig voler veure’m reflectida.
Ambdós han contribuït a aquesta dissertació i al meu desenvolupament intel·lectual i personal.
Malgrat els moments dolents que vaig tenir quan no podria veure el final, m'han animat i m’han
explicat que cada procés mereix el seu temps de maduració. Hauria agraït que el meu haguès estat
una mica més ràpid…
Dono les gràcies al magnífic equip del BC3. Realment m’he sentit com a casa. M'agradaria començar
pels els meus companys de taula: Elisa Sainz de Murieta, Marta Olazabal, Patricia Gallejones al
començament, i Ane Zubizarreta més tard. Elisa, Marta i Patri principalment que han viscut aquest

xxvii
període en la distància curta donant-me suport tant en els bons moments com també als moments
dolents de nervis i desperació quan no podria concentrar-me o durant els moments de lluita
estadística o d’escriptura. He après molt d'ells i he gauidit molt de la seva companyia. Em van ajudar
amb Zotero i amb molts altres consells, tant a nivell personal i com professional, el qual ha estat
sempre molt útil.
També vaig tenir un gran suport per l’elaboració de la dissertació d’en Marc Neumann, que ha actuat
com el meu mentor professional, principalment en les últimes etapes del meu doctorat i va ser de
gran ajuda en l’escriptura de scripts de R. Gràcies per la teva bona dispossició i el teu bon humor.
Realment l'aprecio.
També m'agradaria donar les gràcies a Elena Ojea pel seu guidatge, especialment a principis de la tesi.
Vaig gaudir molt els nostres àpats on podia parlar amb ella i trobar com re-començar per fer la feina
millor. Agustin del Prado i Iñaki Arto també han estat bons consellers sempre que tenia dubtes. Iñaki,
juntament amb Ignacio Cazcarro, em van ajudar ajudar en l’elaboració dels índexs de vulnerabilitat i
Agus va donar un bon feedback per a la conceptualització agraria. Sempre m’he sentit molt còmode
parlant amb vosaltres. Ignacio Palomo també ha estat de gran ajut sempre que li preguntava sobre
serveis ecosistèmics i dubtes metodològics (enquesta, entrevistes i focus groups). També he buscat el
consell d'Eneko Garmendia moltes vegades durant aquest procés.
Estadístiques i sobretot la programació en R han estat les tasques més difícils que he tingut d'aprendre.
En aquest sentit, tinc una llarga llista de noms a qui devem considerable reconeixement: Arelly
Ornelas, Vicente Nuñez, Juan Ignacio Modroño, Aitor Larrañaga, Ignacio Palomo, Víctor Urrea, Dae-Jin
Lee, Iñigo Capellan, Josue Polanco, Javier Martínez, Elena Pérez-Miñana, Alwyn Williams i
especialment Marc Neumann. Que pot ser molt cansat quan estic bloquejat per la R!
Li dec un gran gràcies a tots els que m'han ajudat amb l'escriptura d'aquesta tesi. Mary Thomson,
Bosco Lliso, Noelia Zafra, Iñigo Capellan, Mavi Román, Elena Galán, Martha Kerr i especialment Ane
Zubizarreta, gràcies Ane per la teva ajuda en les edicions de l'anglès mentre escrivia el manuscrit. Heu
demostrat l'afecte i la companyonia gran. També m'agradaria agrair Rebeca Breding. He après molt
durant el procés i ha estat molt ràpid principalment al final quan les meves demandes eren cada cop
més curt temps.
També vull donar les gràcies al grup de Oketa per els debats i excursions. La majoria de companys en
BC3 han esdevingut bons amics amb el temps. Molts d'ells esmentat, però jo també vull incloure
Amaia de Ayala, Marta Pascual, Maialen Garmendia, Alina Tempes, Itxaso Ruiz, Pablo Martínez,
Guillermo Pardo, Xaquin García, Kishore Davala, Nadine Sahouri i molts altres. Tots ells han estat de

xxviii
gran ajuda durant aquests anys. Gràcies per les cerveses després de treballar i diversió es trenca quan
es tracta de cafè.
Meu agraïment no em puc oblidar de Mari Jose, la directora actual de BC3, que m’ha donat el seu
suport per acabar aquesta etapa de la meva vida i també m'aconsellava en aquests capítols, així com
ha donat suport en el meu futur com a científic.
Especialment vull agrair tot el suport de Julen Ugalde, dins i fora BC3. Has llegit diversos capítols de la
tesi i m'has ajudat no només amb l'escriptura, sinó també has sofert alguns dels meus mals moments
i decepcions. Gràcies per la teva confiança en mi i per ajudar-me a desconnectar i fer molt més
suportable aquest final de la tesi.
Fora de BC3, vull també agrair José Ramón Olarieta i Christoz Zografos, per supervisar les dues tesis
de master i encesa la flama de la curiositat i entusiasme que va ser crucial en l'inici de la tesi doctoral.
Ells sempre han estat útils durant el procés de tesi, sobretot al començament.
No vull oblidar els meus companys durant la meva estada a Suècia: la meu supervisora, Katarina
Hedlund, que em va donar la benvinguda i sempre es preocupava pel meu benestar personal i
intel·lectual. Agraeixo molt profundament el temps invertit. Ha estat un plaer rebre la seva atenció
cada vegada que va tocar la porta. Realment he après molt i estava més tranquila durant tot el procés,
mentre era allà, ja que això em va permetre avançar i gaudir de la meva estada. Alwyn Williams,
Helene Bracht Jörgensen, Ronggang Cong (Leo) i Mark Brady, gràcies! A més, als meus amics, els llatins
d’allà que feia la meva visita molt més interessant: Soraya Maya, Alejo i Jesús. Gràcies per tots els
viatges i converses de llargs i interessants que compartim.
També m'agradaria incloure en els agraïments als meus amics WACHI de la Universitat Autònoma de
Barcelona: Diana Calvo, Sara Maestre i mar Grau. Sempre espero veure’t quan viatjo a Barcelona. El
nostre taller de Vielha va ser increïble, espero que sigui el començament de molts altres tallers per
continuar els nostres debats sobre institucions i ecologia política. Tots vosaltres m’inspireu molt! Vull
dedicar un especial agraïment a Diana Calvo, pels nostres debats des del principi i sobretot en les
últimes etapes de la tesi. Gràcies per la teva col·laboració, per compartir referències i debatre els
conceptes complicats. M'alegro d'haver-te conegut i descobrir que estem viatjant per camins
paral·lels. Laura Calvet va ser també d'ajuda considerable en el disseny de l'avaluació sociocultural per
a treball de camp. No puc oblidar a Natalia Jojart i Felipe Díaz, dos bons amics, que sempre estan
disposats a acollir-me en les meves visites o ajudar amb temes administratius.
També vull expressar el meu agraïment al Marc Vizcano. Hi erets abans, durant i gairebé fins al final
del viatge. Saps molt bé el difícil que ha estat de vegades i sempre has intentat ajudar-me com millor
xxix
sabies; has revisat esborranys, he utilitzat el seu cotxe per anar treballar i m’ha acompanyat a mi i ha
escoltat totes les meves queixes, al mateix temps tractant de fer-me sentir millor.
Julien Brun i Idoia Urrutia mereixen un enorme gràcies per la seva professionalitat durant els tres
mesos d'intens treball a Navarra. Agraeixo la vostra paciència i comprensió en moments difícils. També
vull donar les gràcies Begoña Renteria i Imanol Okiñena per la seva ajuda durant el taller en Miranda
de Arga. A més de transcriure la discussió, gestionar el temps i fer fotografies, em van donar l'energia
que necessitava aquell dia.
Molts dels participants en aquest treball de camp que tinc en ment que han fet aquesta tasca molt
més agradable: Patxi Sueskun, per la seva generositat increïble i deixar que em quedés a la teva casa,
Leire Elorz, Juan Jesús Corcin, Charo Brinquis, Jokin del Valle, Celsa Peitado, Milagros i Mari, entre
d'altres. He après molt de vosaltres; no només sobre la vida rural, sinó també sobre mi mateix.
Una menció especial per l'alè durant aquests anys de doctorat (tot i els meus períodes de silenci i
desaparició) als meus amics de Amurrio. Encara que de vegades em sentia una mica incompresa en
aquest tema, ells m’han ajudat a desconnectar del treball a través de passejades, excursions, les nits
de festa i divertit pintxo-potes. Algunes de vosaltres m'heu animat assistint a alguns dels meus
seminaris i escoltant els meus avorrits assajos prèviament. Em sento molt afortunada tenir-vos en la
meva vida: Begoña Renteria, Garazi Ibarretxe, Miriam Larrakoetxea, Leire Cuadra, Oihane Abrisketa,
Aitziber Lazkano, María Larrea, Ana Isabel Romero i la meu cosí, Amaia Diego.
Definitivament, això no hagués estat possible sense l'ajuda de la meva familia. Vosaltres heu contribuït
els que més en fer de mi la persona que sóc. El meu germà, Joseba Albizua que sempre m'ha aportat
la tranquillitat necessària, a través de la seva companyia i les llargues caminades. Ell m'ha educat i d'ell
he après que amb esforç i determinació gairebé tot és possible, o almenys aconsegueixes enriquir-te
en el procés. He pujat les muntanyes més altes i he visitat els llocs més llunyans mentre somiava en el
meu futur. Gràcies per compartir tot això i per ajudar-me a dur a terme les meves ambicions. Encara
que moltes vegades m'he queixat que ets molt estricte, sé que només vols ajudar-me a créixer i
millorar. Al meu pare, Iñaki Albizua m'ha ajudat sempre amb tot el que era capaç. Posant l’espatlla per
descansar o portant-me l'aeroport, tren o autobús cada vegada que havia de viatjar. Ell sempre m’ha
escoltat i confiat en mi. Finalment, la meva mare, Gloria Aguinaco, que m’ha ajudat aen tot el que ha
pogut. Ella ha escoltat pacientment, m'ha aconsellat i m'ha acompanyat en els pitjors moments del
doctorat. No només em proporciona els millors menjars sinó que també em nodreix emocionalment.
Gràcies.

xxx
xxxi
ContentsContentsContentsContents
1. Introduction .................................................................................................................................... 1
1.1. Aims and rationale .................................................................................................................. 3
1.2. Research questions ................................................................................................................. 4
1.3. Outline of the thesis ................................................................................................................ 6
2. A conceptual approach for the study of agrarian social-ecological systems .................................. 8
2.1. Conceptualising agrarian social-ecological systems ............................................................. 13
2.2. The sustainable livelihoods approach from a social-ecological perspective ........................ 14
2.3. Ecosystem services for human wellbeing ............................................................................. 17
2.3.1. ES classifications ............................................................................................................ 19
2.3.2. ES values ........................................................................................................................ 22
2.4. Livelihood vulnerability to external stressors in agrarian social-ecological systems............ 23
2.5. Institutions influence access to natural resources in agrarian social-ecological systems .... 24
2.6. Summary ............................................................................................................................... 29
3. Case study and methods ............................................................................................................... 30
3.1. Research approach................................................................................................................ 30
3.1.1. Ontology, epistemology and research strategy ............................................................ 30
3.1.2. A case study approach .................................................................................................. 31
3.2. The Case study of Navarre .................................................................................................... 33
3.2.1. Country focus: Spain ..................................................................................................... 33
3.2.2. Regional focus: Navarre and its modern irrigation project .......................................... 35
3.3. Research methods ................................................................................................................ 42
3.3.1. Semi-structured interviews ........................................................................................... 42
3.3.2. Household survey design .............................................................................................. 46
3.3.3. Livelihood Vulnerability Index ....................................................................................... 54
3.3.4. Focus group discussion ................................................................................................. 57
3.3.5. Document analysis and participant observation .......................................................... 58
3.4. Research ethics ..................................................................................................................... 62
3.5. Summary ............................................................................................................................... 64
4. Livelihoods in rural Navarre .......................................................................................................... 65
4.1. Introduction .......................................................................................................................... 65

xxxii
4.2. Socio-demographic features, assets and institutions in the study area ............................... 66
4.2.1. Socio-demographic characteristics ............................................................................... 67
4.2.2. Human capital ............................................................................................................... 68
4.2.3. Financial capital ............................................................................................................. 69
4.2.4. Physical (man-made) capital ......................................................................................... 70
4.2.5. Social capital.................................................................................................................. 71
4.2.6. Private property that allows control over natural capital ............................................ 71
4.3. Institutions regulating irrigation water and communal land ................................................ 72
4.4. Livelihood strategies in Navarre case study .......................................................................... 73
4.5. Linking capital assets, livelihood strategies and livelihood outcomes ................................. 75
4.5.1. Typologies of livelihoods according to land management ........................................... 75
4.5.2. Socio-demographic characterisation of farmers’ livelihoods in Navarre ..................... 78
4.6. Discussion .............................................................................................................................. 83
4.6.1. Four livelihoods in the Itoiz-Canal de Navarra case study area .................................... 83
4.6.2. Livelihoods outcomes due to modern irrigation introduction ..................................... 84
4.7. Summary ............................................................................................................................... 86
5. Unraveling the socio-cultural values of ecosystem services ......................................................... 87
5.1. Introduction .......................................................................................................................... 87
5.2. Local perceptions of agrarian ecosystem services for human wellbeing ............................. 89
5.2.1. Links between cultural ecosystem services and human wellbeing dimensions ........... 90
5.2.2. Links between provisioning services and human wellbeing ......................................... 95
5.2.3. Links between regulating services and their connections with human wellbeing ....... 97
5.2.4. Links between supporting services and their connection with human wellbeing...... 100
5.3. Valuation of agrarian ecosystem services and awareness of their co-production ............. 102
5.3.1. Values and perceptions ............................................................................................... 102
5.3.2. Differences between absolute and relative valuations across farmers’ livelihood
profiles ..................................................................................................................................... 104
5.3.3. Co-production awareness ........................................................................................... 106
5.3.4. Access to capital assets influences the perception of ecosystem services values ..... 108
5.4. Agrarian ecosystem services trade-off analysis .................................................................. 111
5.5. Discussion ............................................................................................................................ 116

xxxiii
5.5.1. Understanding how livelihood profiles effect ecosystem services values ................. 116
5.5.2. Agrarian ecosystem services trade-offs ...................................................................... 119
5.6. Summary ............................................................................................................................. 121
6. Farmers’ vulnerability to external stressors ............................................................................... 123
6.1. Introduction ........................................................................................................................ 123
6.2. Applied theories about exposure, sensitivity and adaptive capacity ................................. 126
6.2.1. Exposure to climate variability, drought and crop price volatility .............................. 126
6.2.2. Sensitivity to climate variability, drought and crop prices volatility ........................... 127
6.2.3. Adaptive capacity to climate variability, drought and crop prices volatility .............. 128
6.3. Rural livelihoods’ exposure to multiple threats .................................................................. 129
6.4. Measuring vulnerability ...................................................................................................... 133
6.4.1. Vulnerability to rainfall variability and drought .......................................................... 134
6.4.2. Vulnerability to price volatility .................................................................................... 137
6.5. Discussion ............................................................................................................................ 139
6.5.1. Farmers’ vulnerability and the role of modern irrigation technology ........................ 139
6.5.2. Strengths and weakness of using a vulnerability index .............................................. 141
6.6. Summary ............................................................................................................................. 143
7. An institutional approach to understand farmers’ vulnerability ................................................ 144
7.1. Introduction ........................................................................................................................ 144
7.2. The traditional and modern irrigation systems in Miranda de Arga .................................. 146
7.3. Drivers of the modern irrigation project............................................................................. 149
7.4. Comparing the robustness of traditional and modern irrigation systems ......................... 156
7.5. A qualitative undertanding of the effects of modern irrigation on farmers’ livelihoods ... 160
7.6. Farmers’ vulnerability through the lens of legitimacy and equity ...................................... 163
7.7. Summary ............................................................................................................................. 167
8. Conclusions ................................................................................................................................. 168
8.1. Summary of findings ........................................................................................................... 168
8.1.1. Four typologies of farming livelihoods........................................................................ 168
8.1.2. Divergent perceptions and values of agrarian ecosystem services ............................ 169
8.1.3. Double vulnerable livelihoods and trade-offs between vulnerability dimensions ..... 170
8.1.4. Modern irrigation institutions increase the vulnerability of non-adopters ................ 171

xxxiv
8.2. Theoretical and practical implications ................................................................................ 172
8.3. Future research directions .................................................................................................. 174
8.4. Final remarks ....................................................................................................................... 175
References .......................................................................................................................................... 177
Appendixes .......................................................................................................................................... 189
I. Template for the first round of semi-structured interviews ....................................................... 189
II. Participants in the first round of interviews ............................................................................... 194
III. Template for the second round of semi-structured interviews ............................................. 196
IV. Participants in the second round of interviews ...................................................................... 201
V. Survey template .......................................................................................................................... 202
VI. Livelihood assets and socio-demographic features ................................................................ 217
VII. ES valuations ........................................................................................................................... 232
VIII. Vulnerability analysis .............................................................................................................. 240
IX. Focus group template ............................................................................................................. 255
X. Pictures of traditional and modern irrigation systems ............................................................... 258
XI. Glossary ................................................................................................................................... 260

xxxv
Tables
Table 2.1 Summary of the links between the main concepts of the dissertation ................................ 13
Table 2.2 Typology of cultural services and benefits associated to ecosystems .................................. 20
Table 3.1 Summary of methods used in each chapter ......................................................................... 62
Table 4.1 Socio-demographic and capital assets .................................................................................. 67
Table 4.2 Characterisation of the clusters regarding farmers’ land use management (N=364) .......... 76
Table 5.1 Cultural services and their connection with human wellbeing ............................................. 92
Table 5.2 Provisioning services and their connection with human wellbeing dimensions .................. 96
Table 5.3 Regulating services and their connection with human wellbeing dimensions ..................... 98
Table 5.4 Supporting services and their connection with human wellbeing dimensions .................. 101
Table 6.1 Summary of the data sources used for the analysis of farmers’ vulnerability.................... 126
Table 6.2 Valuation of rural stressors and shock, ordered from most (5) to least (0) important ...... 130
Table 6.3 Differences among existing livelihoods regarding their perception about stress and shock
factors (index from 0 min to 5 max.) .................................................................................................. 132
Table 6.4 VI to climate variability and drought contributing factors for the four types of livelihoods
(IPCC, 2001) ......................................................................................................................................... 135
Table 6.5 VI to price volatility contributing factors for the four types of livelihoods (IPCC, 2001) .... 137
Table 7.1 External and internal motivations driving the modern irrigation project and their influene
over farmers’ vulnerability .................................................................................................................. 154
Table 7.2 Comparison between robustness of modern and traditional irrigation systems ............... 159
Table III.1 Notes used to aid interview conversation ......................................................................... 198
Table VI.1 List of all the indicator variables for the five types of capital assets, context dependent
socio-demographic variables and livelihood strategies collected in the fieldwork. ........................... 217
Table VI.2 Main socio-demographic variables .................................................................................... 221
Table VI.3 Main human variables........................................................................................................ 222
Table VI.4 Main financial variables ..................................................................................................... 222
Table VI.5 Farmers’ access to land features ....................................................................................... 224
Table VI.6 Labour diversification strategy description ....................................................................... 225
Table VI.7 Land management (crops, irrigation technology and other inputs) .................................. 226
Table VI.8 Description of main livelihood strategy variables.............................................................. 227
Table VI.9 Crops diversification after the installation of modern irrigation ....................................... 227
Table VI.10 Land tenure shifts after the installation of modern irrigation ......................................... 228
xxxvi
Table VI.11 Characterisation of land management groups resulting from hierarchical cluster analysis
............................................................................................................................................................ 230
Table VII.1 ES: Absolute and relative valuation according to Likert Scale and Pebble Method ......... 232
Table VII.2 Adjusted absolute (Likert Scale) and relative (Pebble Method) differences in valuation
among existing livelihood profiles ...................................................................................................... 233
Table VII.3 Co-production awareness of ES ........................................................................................ 234
Table VII.4 Socio-demographic variables influencing significantly agrarian services valuation ......... 235
Table VII.5 Factor loadings of the PCA ................................................................................................ 239
Table VIII.1 Exposure to climate variability and market prices volatility ............................................ 240
Table VIII.2 Sensitivity and adaptive capacity to climate variability related stressors ....................... 241
Table VIII.3 Sensitivity to crop prices volatility related stressors ....................................................... 245
Table VIII.4 Sub-components, major components and overall VI to climate variability and drought 248
Table VIII.5 Sub-components, major components, and overall VI to price volatility ......................... 250
Table VIII.6 Indexed sub-components, major components, and overall VI to climate variability and
drought ............................................................................................................................................... 252
Table VIII.7 Indexed sub-components, major components, and overall VI to price volatility ............ 254
xxxvii
Figures
Figure 2.1 ASES components and sub-components ............................................................................... 9
Figure 2.2 Connectivity across the main conceptual lenses of the dissertation .................................. 11
Figure 2.3 The sustainable livelihoods approach applied to the analysis of ASES ................................ 15
Figure 2.4 A conceptual roadmap about ES, sustainable livelihoods, institutions and vulnerability
connections. Based on (Maru et al., 2014, p. 341) ............................................................................... 28
Figure 3.1 Location of Navarre in Spain ................................................................................................ 35
Figure 3.2 Map of Navarre’s geographical regions ............................................................................... 36
Figure 3.3 Phase One and its extension of Canal de Navarra ............................................................... 39
Figure 3.4 Data on production of traditional crops that are decreasing .............................................. 41
Figure 3.5 Data on production of main crops in Navarre ..................................................................... 41
Figure 3.6 Respondents executing Pebble Method Valuation ............................................................. 50
Figure 3.7 Hierarchical cluster analysis (HCA) representation.............................................................. 53
Figure 3.8 Desk-based and fieldwork periods ....................................................................................... 61
Figure 4.1 Steps of the analytical process ............................................................................................. 66
Figure 4.3 Scaled mean variables represented in the flower diagrams represent socio-demographic
features and asset differences among farmer livelihood typologies ................................................... 82
Figure 5.1 Steps of the analytical process of Chapter 5 ........................................................................ 89
Figure 5.2 Absolute valuation of ES based on a Likert Scale (0, min -5, max) .................................... 103
Figure 5.3 Relative values of ES relative valuation (mean values) using the Pebble Method (0, min -5,
max) .................................................................................................................................................... 104
Figure 5.4 Adjusted absolute (Likert Scale) difference in valuation across existing livelihood profiles
(0, min -5, max) ................................................................................................................................... 105
Figure 5.5 Adjusted relative (Pebble) difference in valuation across existing livelihood profiles (0, min
-5, max) ............................................................................................................................................... 106
Figure 5.6 Co-production awareness on each ecosystem service calculated through the stated times
mean over all the services valued (0, min -0.28, max) ....................................................................... 107
Figure 5.7 Adjusted co-production awareness differences among existing livelihoods .................... 108
Figure 5.8 Valuation differences regarding cropped land areas (-0.1, min -0.16, max) ..................... 110
Figure 5.9 Valuation differences regarding access to modern irrigation (0.3, min - 2.51, max) ........ 111
Figure 5.10 Trade-off analysis of agrarian ES valuation using Principal Component Analysis (PCA) .. 113
Figure 5.11. Trade-off analysis of agrarian ES valuation among existing livelihoods ......................... 115
Figure 6.1 Line of reasoning for the analytical process in Chapter 6 .................................................. 125

xxxviii
Figure 6.2 Price volatility for the period (1995-2014) by farmers in Navarre .................................... 130
Figure 6.3 Categorisation of analytical variables, components and contributing factors from the IPCC
vulnerability definition for climate connected stressors and shocks ................................................. 133
Figure 6.4 Categorisation of analytical variables, components and contributing factors from the IPCC
vulnerability definition for crop prices connected stressors .............................................................. 134
Figure 6.5 Vulnerability triangle of the VI_climate for the four types of livelihoods when exposed to
climate linked variability ..................................................................................................................... 135
Figure 6.6 Vulnerability radar diagram for the four types of farmer groups when exposed to climate
variability............................................................................................................................................. 136
Figure 6.7 Vulnerability trainagle for the four types of livelihoods when exposed to price volatility 138
Figure 6.8 Vulnerability diagram of the major components for the four types of livelihoods when
exposed to crop price volatility ........................................................................................................... 138
Figure 7.1. Line of reasoning for the analytical process ..................................................................... 146
Figure VII.1 Valuation differences regarding irrigated land areas (-0.13, min -0.17, max) ................ 236
Figure VII.2 Valuation differences in regard to gender differences .................................................... 236
Figure VII.3 Valuation differences in regard to age differences ......................................................... 237
Figure VII.4 Valuation differences in regard to the level of studies differences ................................ 238
Figure X.1 Traditional irrigation system .............................................................................................. 258
Figure X.2 Modern irrigation system .................................................................................................. 259

xxxix
Acronyms
AGBAR Aigües de Barcelona, an international water management company
ASES Agrarian Social-Ecological Systems
CAP Common Agricutlural Policy
CHE Confederación Hidrográfica del Ebro (English: Ebro River Basin Agency)
CICES Common International Classification of Ecosystem Services
CUMA Cooperativas de utilización de maquinaria agrícola (English: Cooperatives for the use of
agricultural machinery)
EHNE Euskal Herriko Nekazarien Elkartasuna (English: farmers from the Basque Country Union)
ES Ecosystem Services
FEADER Fondo Europeo Agrícola de Desarrollo Rural (English: Rural Development Agrarian European
Funds)
FEAGA Fondo Europeo de Garantía Agraria (English: Agrarian Insurance European Fund)
GHG Greenhouse Gases
HCA Hierarchical Cluster Analysis
INTIA Tecnologías e Infraestructuras Agroalimentarias. Public company attached to Navarre
Government that projected Itoiz-Canal de Navarra canal
IPBES Intergovernmental Platform on Biodiversity and Ecosystem Services
IPCC Intergovernmental Panel on Climate Change
MA Millennium Ecosystem Assessment
MCA Multiple Correspondence Analysis
SAU Superficie Agraria Útil (English: Agrarian useful land)
SES Social-Ecological System
SLA Sustainable Livelihoods Approach
TEEB The Economics of Ecosystems and Biodiversity
UAGN Union de Agricultores y Ganaderos de Navarra (English: farmers and ranchers from Navarre
Union)
UK-NEA UK National Ecosystem Assessment


CHAPTER 1: INTRODUCTION
- 1 -
CHAPTER 1
“We shape the world by the questions we ask”
John Wheeler
1. Introduction
Agrarian ecosystems are social-ecological systems. They play a crucial role in providing the conditions
and processes to sustain terrestrial life and shape the outputs (goods and services) that directly or
indirectly affect human wellbeing (Turner et al., 2007; Díaz et al., 2015; Berbés-Blázquez et al., 2016).
Such ecosystems are a dominant land use. More than 1.5 billion hectares – approximately 12% of the
world’s land area – are used for crop production. Likewise, agriculture accounts for approximately
70% of the total freshwater withdrawn in the world, predominately through irrigation (FAO, 2015).
Agrarian ecosystems are simultaneously drivers of and responsive to cross-scale environmental
changes, from climate to macro-economic related stressors (Turner et al., 2013). They supply food for
humanity, provide energy and materials to urban regions, while simultaneously absorbing urban
impacts (Kroll et al., 2012; Radford and James, 2013). Agrarian ecosystems are the largest source of
biologically active nitrogen to the atmosphere, are active sources and sinks of carbon and are a major
component of the hydrologic cycle (Pielke, 2005; Raudsepp-Hearne et al., 2010).
Such social-ecological systems, however, are under rising stress. Population growth, dietary changes
and the increase of average incomes apply further pressures on the global food system, both on the
demand and on the supply side, caused by greater competition for inputs (Godfray and Garnett, 2014).
Additionally, climate change – an increase in temperatures and climate variability with more frequent
extreme events - is presenting an unprecedented challenge for agriculture (Jackson et al., 2011; Barros
et al., 2014; FAO, 2015).
To contest such stressors globally, scientific advances and government investments have
industrialised agriculture to a large extent with two primary alternatives: 1) agricultural expansion -
increasing arable land, and; 2) intensification –increasing the productivity of the existing agricultural
footprint (Rivera-Ferre, 2008; Foley et al., 2011; Godfray and Garnett, 2014; FAO, 2015).
This dissertation focuses on intensification, which may be regarded as one of the main pillars of
agriculture’s ‘modernisation paradigm’. This paradigm assumes that farmers aim to: specialise the
crops they cultivate; increase the size of their cultivated land; develop more intensified management
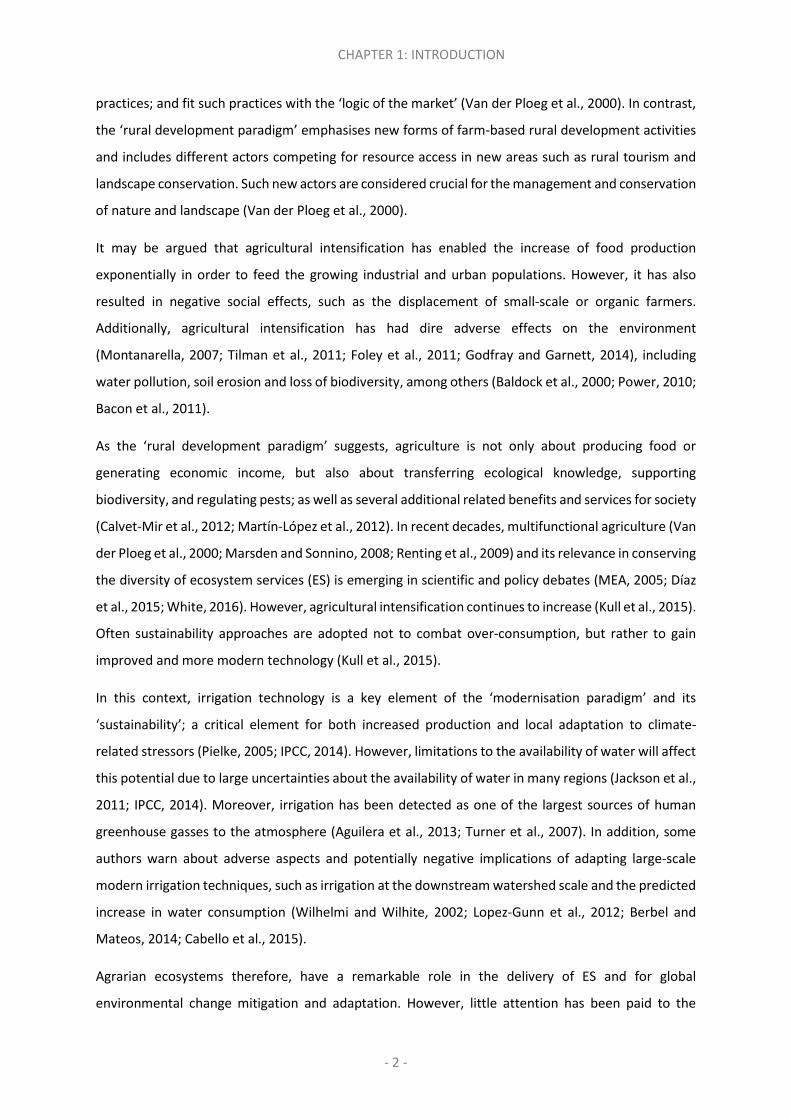
CHAPTER 1: INTRODUCTION
- 2 -
practices; and fit such practices with the ‘logic of the market’ (Van der Ploeg et al., 2000). In contrast,
the ‘rural development paradigm’ emphasises new forms of farm-based rural development activities
and includes different actors competing for resource access in new areas such as rural tourism and
landscape conservation. Such new actors are considered crucial for the management and conservation
of nature and landscape (Van der Ploeg et al., 2000).
It may be argued that agricultural intensification has enabled the increase of food production
exponentially in order to feed the growing industrial and urban populations. However, it has also
resulted in negative social effects, such as the displacement of small-scale or organic farmers.
Additionally, agricultural intensification has had dire adverse effects on the environment
(Montanarella, 2007; Tilman et al., 2011; Foley et al., 2011; Godfray and Garnett, 2014), including
water pollution, soil erosion and loss of biodiversity, among others (Baldock et al., 2000; Power, 2010;
Bacon et al., 2011).
As the ‘rural development paradigm’ suggests, agriculture is not only about producing food or
generating economic income, but also about transferring ecological knowledge, supporting
biodiversity, and regulating pests; as well as several additional related benefits and services for society
(Calvet-Mir et al., 2012; Martín-López et al., 2012). In recent decades, multifunctional agriculture (Van
der Ploeg et al., 2000; Marsden and Sonnino, 2008; Renting et al., 2009) and its relevance in conserving
the diversity of ecosystem services (ES) is emerging in scientific and policy debates (MEA, 2005; Díaz
et al., 2015; White, 2016). However, agricultural intensification continues to increase (Kull et al., 2015).
Often sustainability approaches are adopted not to combat over-consumption, but rather to gain
improved and more modern technology (Kull et al., 2015).
In this context, irrigation technology is a key element of the ‘modernisation paradigm’ and its
‘sustainability’; a critical element for both increased production and local adaptation to climate-
related stressors (Pielke, 2005; IPCC, 2014). However, limitations to the availability of water will affect
this potential due to large uncertainties about the availability of water in many regions (Jackson et al.,
2011; IPCC, 2014). Moreover, irrigation has been detected as one of the largest sources of human
greenhouse gasses to the atmosphere (Aguilera et al., 2013; Turner et al., 2007). In addition, some
authors warn about adverse aspects and potentially negative implications of adapting large-scale
modern irrigation techniques, such as irrigation at the downstream watershed scale and the predicted
increase in water consumption (Wilhelmi and Wilhite, 2002; Lopez-Gunn et al., 2012; Berbel and
Mateos, 2014; Cabello et al., 2015).
Agrarian ecosystems therefore, have a remarkable role in the delivery of ES and for global
environmental change mitigation and adaptation. However, little attention has been paid to the

CHAPTER 1: INTRODUCTION
- 3 -
effects of different land management intensities, including the analysis of trade-offs and synergies
across and between ES and land management (Kroeger and Casey, 2007; Swinton et al., 2007; Turner
et al., 2007; Turner and Daily, 2008, 2008, p. 200; Daily et al., 2009; C. Raudsepp-Hearne et al., 2010).
This thesis investigates such land management intensification effects through the examination of the
Itoiz-Canal de Navarra modern irrigation project, located in Navarre, Spain. The research analyses how
the agrarian intensification process induced by the irrigation project influences farmers’ perceptions
regarding ecosystem service values and social vulnerability to multiple stressors. In doing so, it first
assesses the context and the variability of types of farmers being affected by the modern irrigation
transformation process. With this aim, a rural livelihoods approach is used to classify the different
types of rural livelihoods in the area. This provides further understanding regarding which assets are
typically combined and which are discarded to pursue different livelihood strategies (Allison and Ellis,
2001; Scoones, 2009). The land management interface between humans and agrarian ecosystems is
used as a pivotal aspect of this research with particular attention to whether or not farmers adopt
modern irrigation.
Secondly, grounded on the idea that diverse worldviews are relevant in valuation, this dissertation
adheres to an ES framework and explores the effect of intensification on farmers’ worldviews and
values relative to agrarian ES (Calvet-Mir et al., 2012; Iniesta-Arandia et al., 2014; Klain et al., 2014;
Bennett et al., 2015). Thirdly, it combines a sustainable livelihood approach with a human vulnerability
framework to understand the influences of modern irrigation on farmers’ adaptive capacity and their
social vulnerability to climate-related stressors and shocks, as well as to the volatility of crops’ price
(Eakin, 2003; Adger, 2006; Birkmann, 2006; Eakin and Bojórquez-Tapia, 2008). Finally, the dissertation
assesses how the new water-management institutions brought about by modern irrigation influence
farmers’ vulnerability, focusing on how such new institutions mediate access to water and influence
the value systems that establish how natural resources should be managed (Vatn, 2007; Young, 2010).
1.1. Aims and rationale
The adoption of large-scale modern irrigation contributes centrally to land management
intensification processes in Europe and beyond. This dissertation postulates that modern irrigation
may confine this agrarian social-ecological system onto an unsustainable path. On the one hand,
farmers will become more vulnerable to the multiple rural stressors (e.g. climate and market
variability) and will be unable to maintain their livelihoods. On the other hand, the adoption of an
intensive agricultural strategy will contribute to the degradation of the agrarian ecosystem’s
ecological base .

CHAPTER 1: INTRODUCTION
- 4 -
Focusing on the case of the Itoiz-Canal de Navarra modern irrigation project, the objective of this
thesis is fourfold:
1) To explore the contextual factors and the access to different assets that shape farmers’
livelihood strategies;
2) To interrogate if modern irrigation influences farmers’ perceptions and valuation of
agrarian ES;
3) To identify the stressors that affect farmers in Navarre and the livelihoods that result more
vulnerable to such stressors, and;
4) To examine how and why modern irrigation and its concerned institutions influence
farmers’ vulnerability.
In addressing these four objectives, the dissertation seeks to contribute to the debate concerning the
nexus between land management intensification, ES, social vulnerability, rural development and
resource governance.
1.2. Research questions
The thesis is organised around four main research questions that derive from the four objectives
highlighted above.
1) What combinations of capital assets are associated with particular livelihood strategies in
Navarre?
This question is addressed in the first empirical chapter, Chapter 4, where the sustainable livelihoods
approach is applied to understand i) how natural, financial, man-made, human and social assets are
combined and used strategically by different types of farmers; and ii) if modern irrigation technology
adoption leads to asymmetrical outcomes among existing livelihoods. Classifying farmers attending to
their land management practices reveals the co-existence of very distinct livelihoods in the Itoiz-Canal
de Navarra case. Moreover, Chapter 4 identifies the critical features and the key assets that distinguish
the livelihoods of the case study area. The chapter also demonstrates some of the early outcomes
such as land purchases and water tenure changes, that accompany modern irrigation introduction and
which will be further analysed in Chapter 7.
2) Does the current process of agrarian intensification in Navarre influence farmers’ perceptions and
valuation of multiple agrarian ES?
This question is addressed in Chapter 5 and investigates famers’ perceptions and valuation of
agrarian ES. Classifying farmers according to their land management practices (Chapter 0) permits
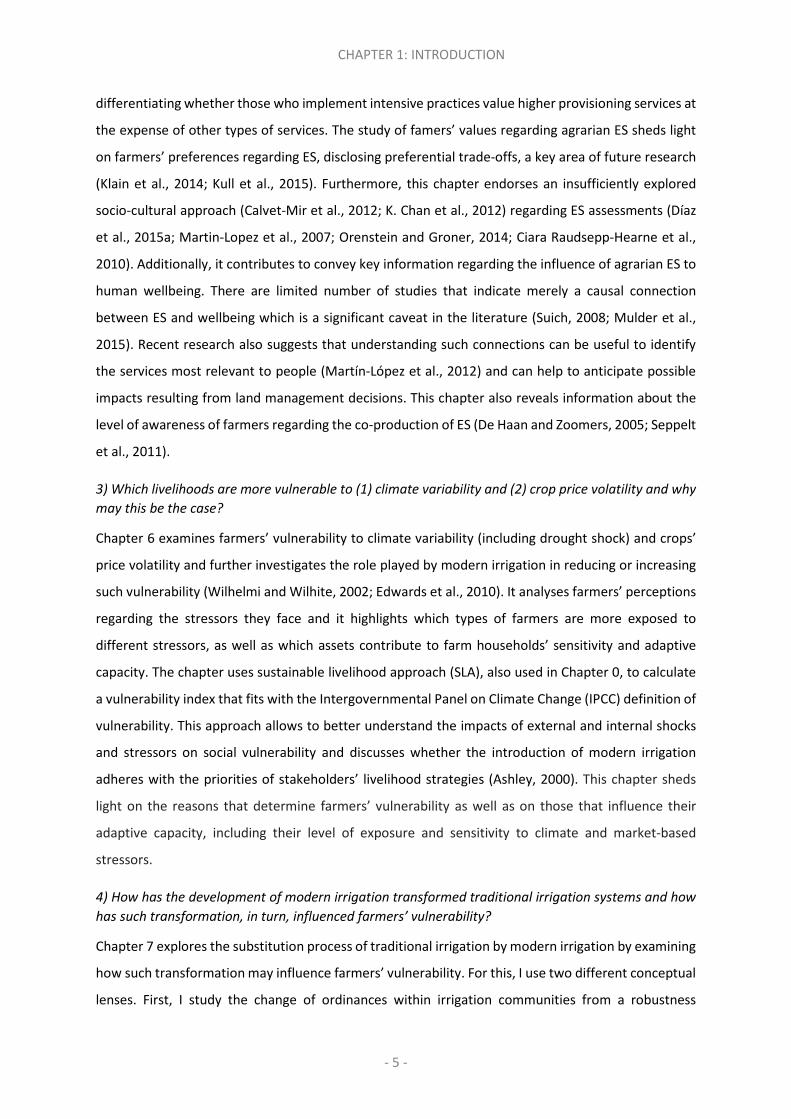
CHAPTER 1: INTRODUCTION
- 5 -
differentiating whether those who implement intensive practices value higher provisioning services at
the expense of other types of services. The study of famers’ values regarding agrarian ES sheds light
on farmers’ preferences regarding ES, disclosing preferential trade-offs, a key area of future research
(Klain et al., 2014; Kull et al., 2015). Furthermore, this chapter endorses an insufficiently explored
socio-cultural approach (Calvet-Mir et al., 2012; K. Chan et al., 2012) regarding ES assessments (Díaz
et al., 2015a; Martin-Lopez et al., 2007; Orenstein and Groner, 2014; Ciara Raudsepp-Hearne et al.,
2010). Additionally, it contributes to convey key information regarding the influence of agrarian ES to
human wellbeing. There are limited number of studies that indicate merely a causal connection
between ES and wellbeing which is a significant caveat in the literature (Suich, 2008; Mulder et al.,
2015). Recent research also suggests that understanding such connections can be useful to identify
the services most relevant to people (Martín-López et al., 2012) and can help to anticipate possible
impacts resulting from land management decisions. This chapter also reveals information about the
level of awareness of farmers regarding the co-production of ES (De Haan and Zoomers, 2005; Seppelt
et al., 2011).
3) Which livelihoods are more vulnerable to (1) climate variability and (2) crop price volatility and why
may this be the case?
Chapter 6 examines farmers’ vulnerability to climate variability (including drought shock) and crops’
price volatility and further investigates the role played by modern irrigation in reducing or increasing
such vulnerability (Wilhelmi and Wilhite, 2002; Edwards et al., 2010). It analyses farmers’ perceptions
regarding the stressors they face and it highlights which types of farmers are more exposed to
different stressors, as well as which assets contribute to farm households’ sensitivity and adaptive
capacity. The chapter uses sustainable livelihood approach (SLA), also used in Chapter 0, to calculate
a vulnerability index that fits with the Intergovernmental Panel on Climate Change (IPCC) definition of
vulnerability. This approach allows to better understand the impacts of external and internal shocks
and stressors on social vulnerability and discusses whether the introduction of modern irrigation
adheres with the priorities of stakeholders’ livelihood strategies (Ashley, 2000). This chapter sheds
light on the reasons that determine farmers’ vulnerability as well as on those that influence their
adaptive capacity, including their level of exposure and sensitivity to climate and market-based
stressors.
4) How has the development of modern irrigation transformed traditional irrigation systems and how
has such transformation, in turn, influenced farmers’ vulnerability?
Chapter 7 explores the substitution process of traditional irrigation by modern irrigation by examining
how such transformation may influence farmers’ vulnerability. For this, I use two different conceptual
lenses. First, I study the change of ordinances within irrigation communities from a robustness
CHAPTER 1: INTRODUCTION
- 6 -
perspective (Ostrom, 1990; Anderies et al., 2003). I analyse whether such institutions (irrigation
norms) become weaker with the adoption of modern irrigation. In doing so, the chapter analyses to
what extent farmers’ vulnerability will be exacerbated, since they may find an absence of mechanisms
(e.g. rights to organise or means to solve conflicts) to manage various stressors and shocks (Vatn,
2005; Adger, 2006; Paavola, 2007). Second, I adopt a legitimacy and equity-based analytical approach
to understand how the adoption of modern irrigation influences farmers’ vulnerability. Uneven power
relations and injustice are seen as fundamental drivers of vulnerability and insecurity (Kloos et al.,
2013). The chapter sheds light on the effects of modern irrigation on communal land and water
access relations, and they contribute to improve our understanding of how local stakeholders
participate and benefit from common water resources.
1.3. Outline of the thesis
This dissertation is divided into eight chapters, including this Introduction.
Chapter 2 presents an inter-disciplinary theoretical framework, which establishes the conceptual basis
for the subsequent empirical chapters. It includes explanations about social-ecological systems, rural
livelihood theories, agrarian ES and their valuation, the notion of vulnerability and institutional
analysis. It considers the interaction between land management activities, farmers’ values about ES,
their livelihood strategies and their vulnerability. It also addresses the issue of what is meant by access
and institutional robustness and advocates for a plural approximation to the assessment of modern
irrigation that goes beyond the analysis of income gains as the sole proxy to measure modern irrigation
success and pays attention also to livelihoods diversity, fairness and equity in access to water, and
institutional dynamics at local and larger administrative scales.
Chapter 3 presents the research strategy and the methods employed to operationalise the theoretical
framework. Methods include both quantitative and qualitative research techniques. It presents a case
study approach to analyse the social-ecological implications of modern irrigation adoption: the
irrigation project takes place in the Itoiz-Canal de Navarra area in the Zona Media and Ribera Alta
regions, both in Navarre, Spain. The institutional context in which modern irrigation is embedded is
also presented in this chapter because it is critical to understand farmers’ uneven access to natural
resources and other types of assets.
Chapter 4 illustrates the socio-demographic features, assets and key institutions within the study area.
It reveals how human, social, man-made, natural and financial assets are connected, and it classifies
these features according to farmers’ livelihoods strategies. This chapter illustrates the existing
diversity of farmers co-existing in this region (Lynam, 2006) and it describes the outcomes which result
CHAPTER 1: INTRODUCTION
- 7 -
from farmers’ livelihood strategies, as well as which livelihoods benefit most from modern irrigation
adoption.
Chapter 5 connects agrarian ES valuation to the previously found livelihood profiles, grounded on the
hypothesis that their land management choices and held values are interconnected (Vatn, 2007). This
chapter reveals legitimate differences between farmers’ preferences (Costanza et al., 2007; Gómez-
Baggethun and de Groot, 2010; Pascual et al., 2014) and it does not only disclose which agrarian
services are valued and why they are important as a contribution to human wellbeing, but it also shows
which services are perceived as being coproduced through farmers’ effort.
Chapter 6 describes external stressors connected to climate and the global markets that affect rural
Navarre. It analyses if the adoption of modern irrigation increases or decreases farmers’ vulnerability
to such stressors. The analysis is based on the development of a vulnerability index drawing on the
sustainable livelihood approach presented in Chapter 4. This chapter reveals if there are double
vulnerable farmer groups and also explores the reasons of their vulnerability; whether it is due to high
exposure, sensitivity, adaptive capacity features or a combination of these dimensions. This chapter
also includes a reflection on the strengths and weaknesses of using vulnerability indexes.
Chapter 7 offers a historical approach to understand formal and informal irrigation institutions. It
assesses the robustness of traditional irrigation norms as they evolve to meet a modern irrigation
framework. The chapter analyses which types of farmers are favoured with such ongoing institutional
change and uses the lens of legitimacy and equity to understand further how modern irrigation
influences farmers’ vulnerability.
Lastly, Chapter 8 concludes with a synthesis of research findings and discusses their implications for
agrarian ES in the context of rural livelihoods sustainability. The chapter also outlines a series of
questions for further research.

CHAPTER 2: A CONCEPTUAL APPROACH FOR THE STUDY OF AGRARIAN SOCIAL-ECOLOGICAL SYSTEMS
- 8 -
CHAPTER 2
“A Nation that destroys its soil destroys itself.”
Roosevelt in a letter to all State Governors, 1937
2. A conceptual approach for the study of agrarian social-ecological
systems
This chapter presents the dissertation’s theoretical framework. It encompasses a number of
concepts and approaches that are helpful for characterising agrarian social-ecological systems
(ASES). ASES are dynamic: they can change when new markets emerge and new crops or varieties
become profitable, their ecological conditions evolve as a result of climate change, or their
management practices adapt to new technologies. These are just a few factors that contribute to
such dynamism. This dissertation focuses on an ASES that is being transformed to become a more
intensively managed system as a result of modern irrigation. Transformation here is referred to a
shift of the ASES’s components to a different state – i.e. change of farmers’ livelihoods, farmers’
values and perceptions of agrarian services alteration and agrarian institutions governing resource
management.
Figure 2.1 represents an example of the analysed ASES components and their sub-components. On
the left hand side, it aims to illustrate that in a given context there are different kinds of farmers
classified by their livelihood strategies. These farmers may also change their perceptions and values
about agrarian ES. In this regard, the centre of the figure illustrates human wellbeing as being closely
dependent on ecosystems (McMichael et al., 2005). There are several agrarian ecosystems services

CHAPTER 2: A CONCEPTUAL APPROACH FOR THE STUDY OF AGRARIAN SOCIAL-ECOLOGICAL SYSTEMS
- 9 -
categories and dimensions of wellbeing depicted. Wellbeing is understood in this dissertation as a
desirable state in which the household reaches economic or material objectives, as well as the
connections and affirmation of its members’ personal significance and group identity (Tang et al.,
2013) (further developed in Section 2.3). Disaggregation of these categories and dimensions helps
understanding the complexity of a change within one of these components, since shifts in farmers’
values in certain services can affect one or several wellbeing dimensions simultaneously. The right
hand side of the figure shows the organisations and the norms that govern natural resources and are
relevant for this dissertation. Such institutions influence, as well as are influenced by, farmers’ values
and perceptions, which in turn affect their preferences over livelihood strategies.
Figure 2.1 ASES components and sub-components

CHAPTER 2: A CONCEPTUAL APPROACH FOR THE STUDY OF AGRARIAN SOCIAL-ECOLOGICAL SYSTEMS
- 10 -
Figure 2.1 and Figure 2.2 (below) refer to the concept of agrarian social-ecological system (ASES), and
they contribute to highlight the interdependencies of social and ecological systems. In the current
dissertation, it is assumed that such interdependencies are mediated by the interface of land
management, which is in turn affected by institutions and livelihood strategies (links A and B of Figure
2.2).
The left side of Figure 2.2 describes the sustainable livelihoods framework. This framework is useful
to discuss the variety of livelihoods assets – i.e. available resources - that result in distinctive
development strategies, including numerous ways to access and use natural resources, ecosystems
and their services (Chambers and Conway, 1992; Scoones, 1998; Carney, 1999; Allison and Ellis, 2001).
Additionally, this framework can be used to characterise farmers according to their land management
strategies. Link A refers to the effect that land management practices have over natural resources’
properties and that farmers co-produce agrarian ES. Agrarian ecosystems, in turn, determine the
possibilities farmers can develop, supported by technological, financial human and social assets.
The central part of the figure (middle-upper section of Figure 2.2) concerns ES for human wellbeing
and is further discussed in section 2.3. Grounded on the Millennium Ecosystem Assessment (MA,
2005), and the more recent Intergovermental Platform on Biodiversity and Ecosystem Services (IPBES,
2015; Díaz et al., 2015a), the diversity of ES types and the several dimensions of human wellbeing are
explored and their interrelations analysed. Farmers’ values influence their choices over livelihood
strategies and the latter impact on ecosystems and their services (illustrated by link A).

CHAPTER 2: A CONCEPTUAL APPROACH FOR THE STUDY OF AGRARIAN SOCIAL-ECOLOGICAL SYSTEMS
- 11 -
Figure 2.2 Connectivity across the main conceptual lenses of the dissertation
Note: Rectangular shapes represent key concepts that are a part of ASES (livelihoods, ES for human wellbeing and institutions) whereas the circular shape illustrates a key concept that is an attribute of the ASES which depends on internal components and external disturbances such as climate change and economic globalisation. The number of the section where each concept appears throughout this chapter is also indicated on the side of each shape. All the concepts are interconnected through bi-directional arrows and letters represent connections and explanations: A refers to the co-production of agrarian ES by farmers (by combining their assets) and ecosystems B relates social values and awareness about ES influence over existing institutions and vice versa C connects the importance of accessing livelihoods’ assets’ to avoid vulnerability and how vulnerable farmers are at risk of not keeping their livelihoods D links institutions to farmers’ vulnerability. Institutions set the conditions for accessing natural resources. There are differences on how stakeholders participate to define such institutions E connects vulnerability to ES and human wellbeing reflects that if farmers are vulnerable, their wellbeing decreases. The dimensions of human wellbeing increment normally encompass higher demands of ES, which may affect (increase) the vulnerability of ASES in the long-term may increase F connects the fact that institutions and social relations regulate access to different kind of assets. Access to certain assets can enable individuals to influence the institutions that govern them
The fourth section of the chapter reviews the literature on social vulnerability (bottom middle of
Figure 2.2). This dissertation combines both quantitative methods (index, based on data collected
through a survey) (McLaughlin and Dietz, 2008; Hinkel, 2011; Tang et al., 2013) and qualitative
methods (interviews) to understand the vulnerability of the studied population to different stressors
over a given time. If farmers or the ecosystems are vulnerable, their livelihoods cannot be
environmentally and socially sustainable (Link C). Moreover, when certain parts of a group are

CHAPTER 2: A CONCEPTUAL APPROACH FOR THE STUDY OF AGRARIAN SOCIAL-ECOLOGICAL SYSTEMS
- 12 -
differently affected by changes, such as the adoption of a new technology like modern irrigation,
impacts or benefits may not be fairly distributed and conflicts may arise. This may lead to an increase
of vulnerability and a reduction in human wellbeing for those farmers whose values are not considered
by existing policies (Vatn, 2005) (links B, D and E).
The last section of the chapter reviews institutional analysis literature to discuss the role that norms,
rules, and policies play in mediating access to farming assets (link F in Figure 2.2) and thus, on the
capacity to co-produce services and benefits (link A) and to influence social vulnerability (link D) of
ASES. This dissertation adopts a historical institutionalism perspective, which defines institutions as
formal and informal procedures, routines, norms and conventions (Hall and Taylor, 1996).
Furthermore, the thesis uses the concept of ‘institutional robustness’ as a suitable means to evaluate
success in natural resource governance (Anderies et al., 2004a). Additionally, legitimacy and equity
act as complementary analytical criteria to analyse which farmers are (un)able to shape and benefit
from the new irrigation institution (link C) (Adger, 2006; Barros et al., 2014; Berbés-Blázquez et al.,
2016).

CHAPTER 2: A CONCEPTUAL APPROACH FOR THE STUDY OF AGRARIAN SOCIAL-ECOLOGICAL SYSTEMS
- 13 -
Table 2.1 Summary of the links between the main concepts of the dissertation
Link Connected
concepts
Description of the links Key references from the
literature
A Sustainable livelihoods and ES for human wellbeing
Farmers need natural resources for making their living whereas they simultaneously co-produce ES and disservices
(Seppelt et al., 2011; Lele et al., 2013; Díaz et al., 2015a; Mulder et al., 2015; Palomo et al., 2016)
B ES for human wellbeing and institutions
Social values shape the rules, norms and convections and those simultaneously influence perspectives about agrarian management and the importance of ES
(Chan et al., 2012; Duraiappah et al., 2014; Spangenberg et al., 2014; Farhad et al., 2015; Felipe-Lucia and Comín, 2015)
C Sustainable livelihoods and social vulnerability
The combination of different assets’ determines people’s vulnerability to external stressors. Farmers’ vulnerability, in turn, determines their livelihoods sustainability and fairness
(Scoones, 1998; Palomo et al., 2016)
D Institutions and social vulnerability
Institutions shape farmers vulnerability through enhancing or avoiding farmers’ access to different kind of resources. Vulnerability information may also be useful to guide policies towards higher equitable and effective outcomes
(Adger, 2006; Anderies et al., 2004a; Barros et al., 2014; Berbés-Blázquez et al., 2016; Corbera et al., 2007a; Paavola, 2007; Ribot and Peluso, 2003; Vatn, 2005)
E Vulnerability and ES for human wellbeing
When farmers are vulnerable, human wellbeing decreases since some dimensions (e.g. security, social relations) may be negatively affected. When some farmers increase their human wellbeing demands over ES increase and consequently, vulnerability may increase
(Vatn, 2005; De Haan and Zoomers, 2005; Adger, 2006; Eakin et al., 2009)
F Institutions and sustainable livelihoods
Institutions and social relations regulate the access to different kind of assets. Assets enable people to influence the institutions that govern them
(Bebbington, 1999; Ribot and Peluso, 2003; Ribot, 2014; Palomo et al., 2016)
2.1. Conceptualising agrarian social-ecological systems
Human and natural systems have traditionally been studied as isolated, separate systems. An ASES,
however, is a complex system that requires holistic analytical approaches. Individuals invest time and
effort in developing forms of physical and institutional infrastructure which affect natural system
functions over time (Janssen and Ostrom, 2006). Grounded on Ostrom’s (2009a) understanding of
agrarian SES, this dissertation acknowledges that an ASES is made up of other sub-components,
including a resource system (e.g. an agrarian ecosystem), resource units (e.g. crops, organic matter,
nutrients), users (e.g. farmers, society), and governance systems (e.g. organisations and rules that
CHAPTER 2: A CONCEPTUAL APPROACH FOR THE STUDY OF AGRARIAN SOCIAL-ECOLOGICAL SYSTEMS
- 14 -
guide farming in a given context), which are connected to each other. Those subsystems are relatively
divisible but interact to produce outcomes at ASES level, influencing these subsystems and their
components, as well as other ASES (Janssen and Ostrom, 2006).
Farmers’ main activity –i.e. land cultivation - is performed through land management practices,
understood here as the human activities that affect ecosystems’ properties and functions (Van
Oudenhoven et al., 2012). Management becomes then the nexus between human and ecological
systems. Positive and negative effects of management are shaped by the degree of land management
intensity (McMichael et al., 2005). Here, intensification is understood as the management utilisation
to increase yield per surface and time. Intensification typically incorporates intensive tillage regimes,
increased application of fertilisers, irrigation when necessary (Baldock et al., 2000), and reductions in
crop diversity both in time and space, at plot or landscape levels (Matson et al., 1997).
2.2. The sustainable livelihoods approach from a social-ecological perspective
The SLA proposes that ES do not occur in a vacuum, and there are other necessary human, social,
physical and financial assets to make a livelihood possible. These assets are determined by: (i) social
relations, which are simultaneously determined by factors such as gender and age; (ii) institutions –
e.g. rules and customs, land tenure and markets– that regulate resources access operation (link F in
Figure 2.2); and (iii), organisations, including associations, and local and national public administration
(Allison and Ellis, 2001).
Often, farmers’ practices and identities are diverse and not all rural people have a full-time dedication
to agriculture, but usually perform a range of agricultural and non-agricultural activities to sustain
their livelihoods (Carney, 1999; Gorman et al., 2001; Van der Ploeg et al., 2000). The SLA framework
looks at individuals or groups of social actors and their relationships, concerning their livelihood
strategies. Such strategies typically encompass different land management regimes (e.g. cropping
systems, fertilising and pest control patterns, and crop varieties), non-natural resource management
activities (e.g. how much time will be invested in alternative income sources or other livelihood
activities, including leisure) and the distribution of control over resources (De Haan and Zoomers,
2005) (links A and F in Figure 2.2). The combination of these strategies affect farmers’ livelihood
outcomes (e.g. income level, income stability) and environmental sustainability (e.g. soils and water
quality and biodiversity) (Scoones, 1998; Allison and Ellis, 2001; Hahn et al., 2009).

CHAPTER 2: A CONCEPTUAL APPROACH FOR THE STUDY OF AGRARIAN SOCIAL-ECOLOGICAL SYSTEMS
- 15 -
Figure 2.3 The sustainable livelihoods approach applied to the analysis of ASES
Human capital is the knowledge, talents, skills, abilities, experience, intelligence, training, judgment,
wisdom and health possessed individually and collectively within a population. This concept
encompasses one's capacity to work (physical and mental ability) to labour power itself (Becker, 1962;
Bruce and Yearley, 2006). Thus, measuring human capital in the survey involves identifying variables
such as formal education and health (Hahn et al., 2009; Ifejika Speranza et al., 2014).
Financial capital is understood as any economic resource, monetarily measured and utilised by
households to buy necessities to support their livelihood. This asset distinguishes between
‘agricultural’ or ‘farm’ income (derived from the production/gathering of unprocessed crops or
livestock from natural resources) and ‘non-agricultural’ or ‘nonfarm’ income (all other sources of
income) (Barrett et al., 2001). The household’s financial situation is determined by the income and its
savings and investments on for example machinery, insurances and workforce (Bruce and Yearley,
2006). Physical (man-made) capital includes infrastructure such as roads and irrigation systems, but
also other assets such as machinery. It is a fixed reproducible product of human activity (Turner, 2006;
Ostrom, 2007).In this dissertation physical capital refers to the installation of modern irrigation and
the use of Internet for agrarian purposes.
Social capital is the result of relationships between individuals, families, groups, or communities that
provide access to valuable benefits and/or resources (Turner, 2006). Bourdieu (cited in Turner, 2006,
p. 558) views social capital as a resource that individuals possess and can be used strategically to gain
access to other, especially economic, resources. He also argued that social capital is one form of capital
closely tied to other forms he called ‘symbolic’ and ‘cultural’ capital. These forms of capital are

CHAPTER 2: A CONCEPTUAL APPROACH FOR THE STUDY OF AGRARIAN SOCIAL-ECOLOGICAL SYSTEMS
- 16 -
important as they disguise the processes by which power relations and material inequalities are
reproduced. A key aspect of Bourdieu’s conceptions of social and cultural capital is their
instrumentality. Coleman’s functional theory of social capital (also cited in Turner, 2006, p. 558), on
the other hand, focuses on groups and the collective nature of social capital (Ishihara and Pascual,
2009). He highlights the benefits accrued by dense networks characterised by trust and mutual
obligation. Coleman’s model views social capital in terms of social structure cited in Turner, 2006, p.
558). This capital domain is associated with the preservation of a range of cultural practices and
routines, such as card games, rural festivals, religious traditions as well as commitment to the family
as part of stakeholders’ identity. Social capital in this dissertation includes belongingness to
cooperatives and syndicates as well as information share among neighbors.
Natural capital encompasses physical assets such as land, water, biota and other resources an
individual may mobilize or access to make a living (Costanza et al., 1997; Fisher et al., 2009). In this
dissertation, it is constrained to the availability of agrarian land among surveyed farmers (Ifejika
Speranza et al., 2014).
Different combinations of capital assets determine people’s capability to define the type of livelihood
strategy they aim to adopt. There are different attributes to consider when combining assets. Firstly,
there are usual packages of assets. Being associated with a particular livelihood and securing a certain
capital can often allow access to other assets (Scoones, 1998). Such assets are triggers for reaching a
particular livelihood strategy (Scoones, 1998) and are typically irreplaceable. For example, as it is the
case in the case study in this dissertation, to access certain agrarian subsidies (financial asset) farmers
must attend a training course, for which they need certain level of education (human asset).
Secondly, time and resources enable people to make demands and influence the institutions that
govern them (Ribot, 2014). This allows restructuring an agent’s power structure, as these surplus
assets allow for individuals to challenge the rules that govern the control, use and transformation of
resources (Bebbington, 1999; Ribot, 2014) (Link F of Figure 2.2). In this regard, ‘capabilities’ are
outcomes to which individuals have access given their personal characteristics and assets, along with
the resources and rights that enable them to act (Scoones, 1998).
There are multiple ways of classifying livelihood strategies (Chambers and Conway, 1992; Rakodi,
1999; Barrett et al., 2001; De Haan and Zoomers, 2005). This dissertation adopts the classification of
De Haan and Zoomers (2005), which is grounded on Zoomers (1999). These authors distinguish four
categories of strategies: accumulation, consolidation, compensatory and security (see section 4.4).
Recognising which trade-offs occur when deciding upon a livelihood strategy is another key concern
of the SLA framework (Scoones, 1998). An individual or a household may decide to disinvestment in

CHAPTER 2: A CONCEPTUAL APPROACH FOR THE STUDY OF AGRARIAN SOCIAL-ECOLOGICAL SYSTEMS
- 17 -
certain capital assets in order to sustain their livelihood. This may be natural capital (e.g. selling arable
land), social capital (e.g. weakening social bonds by diminishing participation in social organisations or
networks), and human capital (e.g. sending children to work in order to mobilise labour or to avoid
paying school fees). Other strategies may also encompass the sale of other assets to compensate for
a consumption shortfall or to release funds for investment (Rakodi, 1999).
Finally, ASES sustainability is presented in Figure 2.3 as the desirable outcome of rural livelihoods. A
livelihood is sustainable when it can manage and overcome stressors and shocks, maintain or enhance
its capabilities and assets (Link C in Figure 2.2), while not weakening the natural resource base (link A
in Figure 2.2) (Scoones, 1998). It is debatable the ‘level of sustainability’ to which different groups of
people may aspire towards (Bebbington, 1999), particularly because diverse people may value
different dimensions of human wellbeing in a different way (see section 2.3) (Bebbington, 1999) (link
A in Figure 2.2). Some may prioritise income gains, while others may prefer to maintain certain social
or cultural practices, even if such maintenance is secured at the expense of economic improvement.
The SLA implicitly portrays farmers as active actors with capacity to deal with the diverse stressors
they might face (De Haan and Zoomers, 2005) (link C in Figure 2.2).
In this dissertation, the SLA framework helps to reveal how development interventions, such as the
introduction of large infrastructure (i.e. irrigation), fit with current livelihood strategies, which can
then contribute to redefine such interventions (Ashley, 2000). Finally, it contributes to acknowledge
the importance of multiple actors’ varied aims and interests. It makes explicit social differences that
can subsequently allow for the development of more effective, legitimate and fair agrarian policies
(O’Brien and Wolf, 2010; Albizua and Zografos, 2014).
2.3. Ecosystem services for human wellbeing
In this dissertation, the framework of ES is adopted to analyse the dynamics of farmers within ASES,
from a different perspective from the one adopted by the SLA. The concept of ES generally refers to
the benefits that ecosystems provide to people (MA, 2005; Díaz et al., 2015). It is grounded on the
notion of ecosystems’ multi-functionality, i.e. their capacity to deliver multiple benefits
simultaneously, from the same source (McMichael et al., 2005). In the context of ASES, ecosystems
support crop production and other benefits and services as it has long been recognised in the
literature (McIntyre et al., 2008; Martín-López et al., 2012; Díaz et al., 2015a).
However, it is not just ecosystems that are important to produce services, ignoring humans’
contribution in this regard would be misleading (Palomo et al., 2016). Farmers’ use of anthropogenic
assets to deliver ES is termed as ‘co-production’ (Anderies et al., 2003; Seppelt et al., 2011; Palomo et

CHAPTER 2: A CONCEPTUAL APPROACH FOR THE STUDY OF AGRARIAN SOCIAL-ECOLOGICAL SYSTEMS
- 18 -
al., 2016). This research focuses on the influence of farmers’ labour, the connection to utilised assets,
and the delivery of agrarian ES. When co-production of services’ effects are negative, such as soil
erosion, salinity and water quality loss, services become ‘disservices’ (Power, 2010; Bacon et al., 2011).
This thesis supports the idea that the magnitude of disservices is shaped by the grade of land
management intensity (Kremen et al., 2002; Klein et al., 2007; Zhang et al., 2007) (Link A in Figure 2.2).
How ES are defined and classified influences the appropriate analytical approach. Most research has
focused on the ecological or the economic analysis of ES. However, it is critical to consider an
interdisciplinary assessment of ES which embraces the multiple types of existing services in order to
obtain an image which encompasses existing ES (Orenstein and Groner, 2014). This is why a common
classificatory framework is needed to facilitate multidisciplinary efforts towards a better
understanding of complex ASES (Ostrom, 2009a).
The Millennium Ecosystem Assessment (MA, 2005) developed a classification of ES through different
categories of services, represented by proxies, to understand the multiple types of services
ecosystems provide. Although other approaches exist to classify ES (e.g., Fisher et al., 2009; Bryan et
al., 2010; De Groot et al., 2010; Dominati et al., 2010; EEA, 2013), this research follows The Economics
of Ecosystems and Biodiversity (TEEB) proposal (Sukhdev and Kumar, 2008), which combined with the
Common International Classification of Ecosystem Services (CICES) (EEA, 2013)1 classification, results
in an updated version of the MA (2005) classification.
MA developed a classification of ES in terms of provisioning (e.g. agricultural yield), supporting (e.g.
microbial community biomass), regulating (e.g. climate and water regulation) and cultural services
(e.g. aesthetic, spiritual and recreational benefits). This classification of ES is the most wide-spread
and commonly accepted, allowing for meaningful comparisons across time and space (Barrios, 2007;
Daily, 1997; Swinton et al., 2007; Zhang et al., 2007). In order to overcome challenges identified during
the research process, classifying ES has required complementing classifications of ES with fieldwork
insights (Mulder et al., 2015).
As noted in the UK National Ecosystem Assessment (UK-NEA), however, the assessment of ES entails
multiple challenges. It is critical to understand which services are provided by which ecosystems, how
such services may evolve over time, and how such evolution affects the quantity and quality of the
services provided. Difficulty increases with the fact that changes in ES are not necessarily linear, and
there may be thresholds in which ecosystems’ response is unknown (DEFRA, 2011).
1 Consulted in April 2016: < http://biodiversity.europa.eu/maes/ecosystem-services-categories-in-millennium-ecosystem-assessment-ma-the-economics-of-ecosystem-and-biodiversity-teeb-and-common-international-classification-of-ecosystem-services-cices>.
CHAPTER 2: A CONCEPTUAL APPROACH FOR THE STUDY OF AGRARIAN SOCIAL-ECOLOGICAL SYSTEMS
- 19 -
2.3.1. ES classifications
The first challenge encountered in this dissertation when operationalising the TEEB classification is
distinguishing between ES and benefits. Although ES are defined as benefits for humans, benefits may
also be seen as an outcome of the services. Taking them as synonyms may lead us to an inaccurate
accountability of ES and to a misunderstanding of why they are considered important for humans
(Watson, 2012). In this regard, the UK-NEA report distinguishes between final and intermediate
services to prevent double-counting and the difficulty of valuing certain ES (DEFRA, 2011). Likewise,
the IPBES (Díaz et al., 2015a) discerns that among the ecosystem benefits there are services and goods.
Goods are objects from ecosystems that people value through experience, use or consumption (i.e.
direct benefits), whereas services benefit people even though they might not be perceived as such
(Palomo et al., 2016).
This mentioned challenge was more relevant when it concerned cultural services and their related
benefits. Distinguishing among those two was a complex issue and for this reason this dissertation
adapts Klain et al’s (2014) classification of cultural ES, based, in turn, on Chan et. al, (2012). Table 2.2
displays cultural services and benefits definitions. I have added a symbol after the services to show
which are shared in the MA, TEEB and Klain et al. (2014) classifications. This ES/benefits classification
of cultural services allows accommodating the views of different social actors and/or cultures into
conceptual approaches of ES (Castillo et al., 2005; Fisher et al., 2009; Klain et al., 2014; Diaz et al.,
2015).

CHAPTER 2: A CONCEPTUAL APPROACH FOR THE STUDY OF AGRARIAN SOCIAL-ECOLOGICAL SYSTEMS
- 20 -
Table 2.2 Typology of cultural services and benefits associated to ecosystems
Category Definition
Cultural ES Input flows for producting benefits from ecosystems. They tend to be fund-service (non-consumptive) in nature and are by definition subjective (Mulder et al., 2015)
Outdoor recreation (=)
Activities in natural or semi-natural settings for the purpose of relaxation or amusements (e.g. kayaking, mushroom-picking etc.)
Education & research (=)
Activities associated with learning about the natural world or research related to a natural or semi-natural landscape
Artistic Associated with the creation and appreciation of beauty from nature
Ceremonial Set of actions performed on special occasions for symbolic value and linked to biotic features
Self-fulfilment * Energy that land ecosystem provides farmers and consequently allows for contentment through a metaphysical force and/or identity connected strength
Ecosystem benefits Valued goods, experiences and conditions
Material Tangible products of ecosystems (e.g. crops, wood)
Aesthetic (≠) Relating to beauty or appreciation of beauty
Place/Heritage (≠) Meaning or importance associated with a location, locations that serve as reminders of past events for people and communities
Activity Intangible benefits associated with an action (e.g. sports in nature)
Spiritual (≠) Related to metaphysical forces that exist beyond the individual
Inspiration (≠) Mental stimulation to do or feel something
Knowledge Theoretical as well as practical information and/or skills
Existence/bequest Intangible non-use benefits associated with knowing that something exists or satisfaction in preserving a natural landscape for future generations
Option The predicted benefit of future use of a natural resource
Social cohesion Contributing to enhancing relationships among people
Identity Ideas, relationships and sense of belonging that shape people
Employment Contribution to work that provides monetary income
Source: (Klain et al., 2014, p. 6). ≠ classified as a service in the MA and TEEB frameworks, but as a benefit within the Klain et al (2014) classification = Considered a service in the three classifications. * Not included in MA (2005) and TEEB (2015) nor in Klain et al (2014). The second challenge identified when operationalising the ES framework results from the existing
interaction between the various ecological, social and economic components of ASES which occur at
different spatio-temporal scales (White, 2016). Ecological data are typically collected from indicators
that operate at local and short-term spatio-temporal scales. Social scientists work with individuals or

CHAPTER 2: A CONCEPTUAL APPROACH FOR THE STUDY OF AGRARIAN SOCIAL-ECOLOGICAL SYSTEMS
- 21 -
populations of humans at larger spatial scales and over a mid-length period of time (annual to
decadal). Economists, however, work at scales including the global economy and often over much
longer time periods (White, 2016). The research scale of this dissertation is confined to the regional
scale, but integrates ecological insights as ES proxies, and global factors as contextual stressors that
affect current rural dynamics.
The transformation of a given ASES due to, for example, the introduction of modern irrigation can lead
to changes within agrarian ES, as well as to changes in farmers’ perceptions over the system, the goods
and services delivered and their role in the co-production of ES. ES contribution to human wellbeing
is a common omission of many of the ES studies (Turner et al., 2003; Adger, 2006; Kroeger and Casey,
2007; Raudsepp-Hearne et al., 2010) and this research also attempts to clarify these connections (see
section 5.2).It is important to remark also that this thesis supports that ES exist whether we are aware
of them or not. However, attention to conserve those services is dependent on humans’ observation,
analysis and valuation of the utility of the ecosystem functions (Norgaard, 2010).
The IPBES defined wellbeing as ‘a perspective on a good life that comprises access to basic materials
for a good life, freedom and choice, health and physical wellbeing, good social relations, security,
peace of mind and spiritual experience’ (Díaz et al., 2015b, p. 14). The contribution of certain agrarian
ES (such as supporting and cultural services) towards the fulfilment of human needs is complex (Daniel
et al., 2012a). Supporting services are ‘indirect’ in the sense that they are associated with a longer
process of human cognition. Such services (e.g. soil formation) normally require long-term processes
for the production of the other three categories of services (provisioning, regulating and cultural
services) (Kull et al., 2015). In contrast, provisioning services, such as healthy crops and fibres, are
intuitively perceived. Changes in provisioning services have strong impacts on food security for
example, since there may be a loss of access to essential resources such as food and water. Regulating
services, on the other hand are abundant, but often human intervention makes them decrease or
exceeds ecosystems’ capacity to provide them (Carpenter et al., 2009). These services are also difficult
to perceive and are not typically included within policy evaluation. A greater focus on them could be
useful (DEFRA, 2011) since changes in regulating services, such as climate and flood regulation, can
have strong influence on human security at global and national scales.
Finally, as briefly introduced above, cultural ES are non-material and consequently difficult to
measure. Cultural services influence stakeholders’ attitudes (i.e. sense of responsibility and identity)
towards nature (Calvet-Mir et al., 2012; Daniel et al., 2012; Tengberg et al., 2012; Turner et al., 2003).
Changes in such services may imply alterations in many other ES and different dimensions of human
wellbeing. For instance, they may contribute to the breakdown or strengthening of social networks,
CHAPTER 2: A CONCEPTUAL APPROACH FOR THE STUDY OF AGRARIAN SOCIAL-ECOLOGICAL SYSTEMS
- 22 -
which will have an effect on the stability of social relations. Another example could be the effect of
social-ecological transitions towards intensive agriculture over human dietary changes (cultural
service linked to identity) and landscape (cultural service connected to outdoor recreation activities)
(Gonzalez de Molina, 2010) due to alterations in provisioning services (e.g. crops shifts).
2.3.2. ES values
Stakeholders’ judgement and action are guided by their value system, which is simultaneously
affected by contextual norms and principles – i.e. normative and moral frameworks people use to
endorse their beliefs and engagements (Pritchard et al., 2000). In the context of this dissertation, it is
advocated that the valuation2 of ecosystems is important in at least two ways: a) to know what matters
most to farmers when it comes to their relationship with nature (link A in Figure 2.2); and b) to develop
a solid base of evidence to design more effective, inclusive and legitimate policies for ASES (Link B in
Figure 2.2).
In addition to the various valuation approaches that can be implemented, the different categories of
ES are also difficult to compare. Provisioning services have a clear exchange value while cultural
services are generally intangible and incommensurable (Vatn, 2007; Chan et al., 2012). Another
constraint is linked to the motivations of different stakeholders’ valuations of ES. This is, some ES are
valued from an individual point of view, whereas others are appreciated from a social standpoint. For
example, provisioning services may be understood as a direct source of welfare for the farmer
producing such crops (individual standpoint) or as a crucial feeding source for humanity (social
standpoint). Some cultural services can also relate to a metaphysical experience (e.g. self-fulfilment)
rather than an experiential one. Cultural services may have a supporting or inherent value rather than
a final value such as with provisioning services (Chan et al., 2012). Also, cultural services may often be
connected to bio-centric worldviews as well as relational values3 whereas provisioning services are
always anthropocentric.
This dissertation aims to find a way of revealing trade-offs between ES valuations since they are
inevitable in any land management decision-making context (Bennett et al., 2009) (see Chapter 0).
Farmers will typically consider effects on provisioning services (yields) in a short term temporal scale
(Klapwijk et al., 2014). However, their management also has impacts on long term and spatially distant
services. Identifying trade-offs can help policy makers to understand the long-term effect of preferring
2 Valuation is the process of assigning a value to a particular action or object (Farber et al., 2002). 3 Relational values refer to the relations humans have with nature so that such interactions importance does not lay on instrumental neither intrinsic reasons but rather an intimate kin and stewardship relationship with nature (Chan et al., 2016).
CHAPTER 2: A CONCEPTUAL APPROACH FOR THE STUDY OF AGRARIAN SOCIAL-ECOLOGICAL SYSTEMS
- 23 -
one ES over another, and the consequences of focusing only on the present provision of a service
rather than on its future sustainability (Rodríguez et al., 2006). Socio-cultural valuation can illuminate
both individual and social preferences over ES and shed light on the reasons behind the preferences
of certain ES (Vatn, 2007). Still, disclosing stakeholders’ preferences over ES is not enough to
understand who are the beneficiaries and losers of certain types of ES (Daw et al., 2011). However,
such analysis aids in understanding the different ES and the potential distribution among diverse
stakeholders (see link D and F in Figure 2.2).
In this dissertation, farmers’ stated preferences may reveal potential ES trade-offs under the
hypothesis that ES preferences are aligned with their land management choices, which in turn result
in different levels of provision and types of ES (see link A in Figure 2.2) (see Section 5.4). As Chan, Poe
and colleagues argue (cited in Klain et al., 2014, p. 310), such analysis can be a useful way to illuminate
why some services that are valued only by some farmers become so central to policy-making and
resource management institutions (links A, D and F in Figure 2.2). Revealing contrasting preferences
may be used to legitimate sometimes ‘invisible’ positions (Klain et al., 2014).
2.4. Livelihood vulnerability to external stressors in agrarian social-ecological
systems
The Intergovernmental Panel on Climate Change (IPPC) defines vulnerability as the propensity or
predisposition to be adversely affected by a stressor (e.g. climate change) (IPCC, 2014).4 The origins of
this concept should be found on the natural hazards and food security literature. It has more recently
been applied in assessments of climate change impacts (Luers et al., 2003a; Vincent, 2004). In this
dissertation, vulnerability, as human wellbeing, is multi-dimensional. Securing wellbeing requires then
finding ways to reduce vulnerability and to take into account the interdependencies of global (e.g.
global market influences and climate change) and local mechanisms that create these vulnerabilities
(e.g. lack of access to irrigation or markets) (Adger, 2006; Eakin et al., 2009) (see link E in Figure 2.2).
The natural hazards school of thought arises out of a positivist perspective, and focuses on the
‘objective’ study of hazards (Vincent, 2004). Under this approach, emphasis is placed on a particular
environmental stress, and vulnerability then refers to the risk of exposure of an ecosystem to a hazard.
In contrast, the human ecology and political economy schools of thought are grounded on interpretive
social sciences (Vincent, 2004). Vulnerability in these two schools focus on a particular group or social
unit of exposure and particularly on the structures and institutions that govern it (Vincent, 2004) (see
links C and D in Figure 2.2). The different approaches involved in vulnerability studies are thus
4 For a review of other definitions see Cutter, (1996a).

CHAPTER 2: A CONCEPTUAL APPROACH FOR THE STUDY OF AGRARIAN SOCIAL-ECOLOGICAL SYSTEMS
- 24 -
strengthening the division between top-down biophysical risk exposure on one hand, and bottom-up
social vulnerability on the other (Vincent, 2004).
Political ecology brings together critical insights from the human ecology and political economy
perspectives with concerns about the interaction of physical and human systems (Vincent, 2004). This
is the adopted perspective in this dissertation and its value pivots on recognising the physical
phenomena to which individuals, families or households are exposed and embedded within and
mediated by the particular human context in which they live (social, political, economic, and
institutional) (see links C and D in Figure 2.2). Whilst physical phenomena are necessary for the
production of a natural hazard, their translation into risk and potential for disaster is therefore
contingent upon human exposure and the level of capacity to cope with the negative impacts that
exposure might bring to individuals or human systems (Adger, 2006). In political ecology, vulnerability
should be understood as a two-sided phenomenon involving an external side of disturbances in which
a system is exposed and an internal side that represents the ability or lack of ability to adequately
respond to and recover from external stressors (Chambers, 1983; Luers et al., 2003a; Scoones, 1998).
There is a wide variety of definitions and frameworks to assess vulnerability of households and
ecosystems (e.g. Adger 2006). In line with other scholars (IPCC, 2001; Notenbaert et al., 2013), this
research also assumes that the vulnerability of any system is a function of three main components:
exposure, sensitivity and adaptive capacity. Therefore, these are presented as the vulnerability
dimensions of farmers’ livelihoods in the context of global change (climate variability and market
volatility) and technological transition (modern irrigation).
Analysing the exposure of farming livelihoods to gradual and continual stressors such as climate
variability is more difficult than examining their exposure to discrete stressors, such as floods.
Likewise, vulnerability as a current state is difficult to assess due to the variety of factors interacting
on different scales. However, this work aligns with Adger et al., (2003) who consider that
understanding the current state of the ASES is the best possible proxy to understand existing and
potential vulnerability for preventive action. Thus, this approach enables preliminary assessment to
decide where adaptation efforts are most required (Vincent, 2004).
2.5. Institutions influence access to natural resources in agrarian social-ecological
systems
Institutions, understood as formal and informal procedures, routines, norms and conventions (Hall
and Taylor, 1996), mediate access to ES and other assets that may evolve to become opportunities or
barriers to different types of livelihoods (Anderies et al., 2004a; McDermott et al., 2013) (see link B

CHAPTER 2: A CONCEPTUAL APPROACH FOR THE STUDY OF AGRARIAN SOCIAL-ECOLOGICAL SYSTEMS
- 25 -
and F in Figure 2.2). Therefore, to understand contestations, negotiations and trade-offs it is necessary
to investigate social relationships, their institutional forms and the power dynamics embedded within
a modern irrigation technological shift (Scoones, 1998; Corbera et al., 2007b).
Following Ribot and Peluso (2003), access is defined in this dissertation as the ability to derive benefits
from things whereas property right is defined as the right to benefit from things. By focusing on the
ability rather than on the right, this conception brings attention to a wider range of social relationships
that can constrain or enable people to benefit from resources without focusing solely on property
relations. In this context property is just one set of access relationships among others (Ribot and
Peluso, 2003).
Rights-based access can be enforceable through permissions; licenses controlled by the state and
other organisations with power, such as watershed confederations within this dissertation. This
prospect permits identifying the organisations in charge of controlling natural resources, e.g. water
for irrigation. When there are contrasting perspectives about who should have access to a given
resource, and whether their means of access are legitimate, the state often remains as the ultimate
mediator, adjudicator and power holder. In this situation, some farmers may be able to enhance their
own benefits by aligning with the government’s position and/or possibly influencing government
arrangements. In this way, some elite stakeholders may choose the government’s position as the
forum in which to claim their rights (see link D in Figure 2.2). These capabilities held by such elite
stakeholders may shape who controls and who maintains access to resources (Ribot and Peluso, 2003).
When access is exercised through political-economic and cultural structures, one can refer to
structural and relational mechanisms of access. As previously mentioned when exploring SLA,
accessing certain assets (financial, human, social and physical) can synergistically influence who has
priority to access other related assets and manage natural resources (see link F in Figure 2.2).
Accessing technology, for instance, shapes the ways in which resources can be extracted or can benefit
certain actors over others. Access to financial capital is also crucial since it determines who can benefit
or keep their access to almost any kind of resource. Markets, simultaneously shaped by policies,
licenses and taxes, also affect the distribution of resources and benefits. Knowledge is another key
factor influencing access. For example, ‘scientific expert’ status or ‘ecologist’ narratives serve to justify
control over resources. ‘Economic crisis’ narratives also serve to reject other petitions over access and
control. Authority5 serves to discern which legal paths favour or harm certain groups. Other social
5 Authority can be categorised as a type of social identity and the access to authority as a social relation type but they are normally treated separately (Ribot and Peluso, 2003).

CHAPTER 2: A CONCEPTUAL APPROACH FOR THE STUDY OF AGRARIAN SOCIAL-ECOLOGICAL SYSTEMS
- 26 -
relations (e.g. friendship, trust, reciprocity or dependency) are of key importance to understand access
(Ribot and Peluso, 2003).
If institutions are robust, resource users would be less vulnerable to different types of disturbances
(Vatn, 2005; Adger, 2006; Paavola, 2007) (link D in Figure 2.2). A system is considered robust when it
is long-living and the operational rules are formulated and modified over time according to a set of
collective choice rules (Anderies et al., 2003). Institutions, then, should be flexible and able to adapt
to human and ecosystem dynamics in ASES (Pritchard et al., 2000). Anderies et al., (2004), grounded
on Ostrom, (2009) defined eight principles to discern when an institution is considered robust. The
principles are as follows: i) the definition of clear boundaries; ii) the existence of proportional
equivalence between benefits and costs; iii) collective choice arrangements option; iv) monitoring; v)
graduated sanctions; vi) conflict resolutions mechanism presence; vii) recognition of rights to organise
and viii) nested enterprises.
The bottom-up and top-down strategies often generate nested institutional structures where
governance solutions with smaller jurisdiction are nested within larger solutions (Paavola, 2007).
Institutions at a large scale should complement rather than remove locally evolved institutions. At a
broader scale, institutions are typically necessary to protect common ES that may be undervalued at
local scale (e.g. biodiversity, soil carbon). On the other hand, local institutions that protect services
valued by local stakeholders are more likely to succeed in adapting management strategies and
capturing the dynamics of the ecosystems, which is essential for the sustainable use of ES (see link B
in Figure 2.2).
This research focuses on assessing how different farmers and land-holders’ access common resources
(e.g. water for irrigation and agrarian land), and how such access relations have changed over time
due to the current technological shift (modern irrigation) affecting the ASES. This research also
considers equity and legitimacy as useful criteria to design and evaluate natural resource governance
regimes (Adger, 2006; McDermott et al., 2013). Current debates about global environmental
governance indicate the importance of equity to fair and sustainable outcomes, yet there is lack of
clarity regarding the definition and components of equity (Brown and Corbera, 2003; Forbes, 2008;
McDermott et al., 2013; Martin et al., 2016).
This dissertation adheres to Corbera et al.’s approach to legitimacy and equity (2007a) . Legitimacy
relates to the way in which livelihoods’ outcomes are negotiated, accomplished and accepted by
stakeholders. This is, the extent to which decisions are acceptable to participants and non-participants
that are affected by decisions. There are three fundamental pillars sustaining the concept of
legitimacy. First, recognition, which refers to the fact that diverse stakeholders have plural views;

CHAPTER 2: A CONCEPTUAL APPROACH FOR THE STUDY OF AGRARIAN SOCIAL-ECOLOGICAL SYSTEMS
- 27 -
second, participation in decision making; and third, the distribution of decision-making power
(Paavola, 2007). This dissertation asserts that all affected stakeholders should be engaged in the
decision-making process regarding the modern irrigation project, especially the most vulnerable, with
the aim to guarantee that no farmer becomes worse off as a result of modern irrigation (Section 7.6).
Finally, the dissertation focuses also on the distribution of any outcomes (costs and benefits) resulting
from the irrigation project. The extent to which a given policy or project outcomes result equitable to
affected actors depend on decision-making procedures (legitimacy) as well as on project design
factors, historical configuration of resource access institutions and the social relations concerning
access to resources (Corbera et al., 2007a). Context is crucial to understand social impact or fairness
of a project (McDermott et al., 2013). Initial social conditions need to be examined to determine
whether modern irrigation implementation is fair for the different kind of farmers co-existing in
Navarre. Equity6, hence, must be understood within the context of the culture in question –i.e. beliefs,
practices and institutions. The capabilities component reveals the interdependence of distribution and
procedure (recognition and participation) (Schlosberg, 2004; Corbera et al., 2007b; McDermott et al.,
2013).
6 Equity is understood as environmental justice and it is used in this dissertation as synonyms as Martin et al., (2016) define in their recent research about recognition.
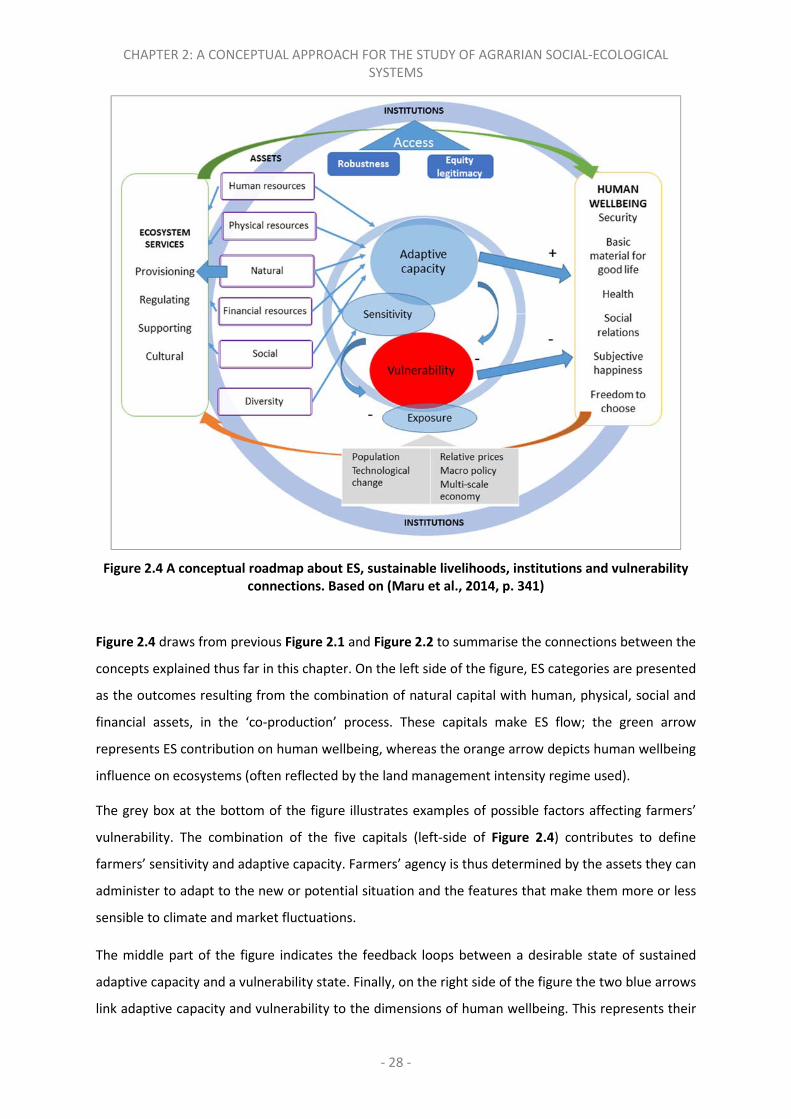
CHAPTER 2: A CONCEPTUAL APPROACH FOR THE STUDY OF AGRARIAN SOCIAL-ECOLOGICAL SYSTEMS
- 28 -
Figure 2.4 A conceptual roadmap about ES, sustainable livelihoods, institutions and vulnerability
connections. Based on (Maru et al., 2014, p. 341)
Figure 2.4 draws from previous Figure 2.1 and Figure 2.2 to summarise the connections between the
concepts explained thus far in this chapter. On the left side of the figure, ES categories are presented
as the outcomes resulting from the combination of natural capital with human, physical, social and
financial assets, in the ‘co-production’ process. These capitals make ES flow; the green arrow
represents ES contribution on human wellbeing, whereas the orange arrow depicts human wellbeing
influence on ecosystems (often reflected by the land management intensity regime used).
The grey box at the bottom of the figure illustrates examples of possible factors affecting farmers’
vulnerability. The combination of the five capitals (left-side of Figure 2.4) contributes to define
farmers’ sensitivity and adaptive capacity. Farmers’ agency is thus determined by the assets they can
administer to adapt to the new or potential situation and the features that make them more or less
sensible to climate and market fluctuations.
The middle part of the figure indicates the feedback loops between a desirable state of sustained
adaptive capacity and a vulnerability state. Finally, on the right side of the figure the two blue arrows
link adaptive capacity and vulnerability to the dimensions of human wellbeing. This represents their
CHAPTER 2: A CONCEPTUAL APPROACH FOR THE STUDY OF AGRARIAN SOCIAL-ECOLOGICAL SYSTEMS
- 29 -
direct connection; since when farmers’ vulnerability is high, human wellbeing decreases and when
adaptive capacity increases, the sustainability of the SES increases. Institutions influence the access to
ES and assets, consequently affecting farmers’ wellbeing and their vulnerability. This presents a
continuous feedback between human wellbeing and ES.
2.6. Summary
This chapter has provided the theoretical lenses that will be used throughout this dissertation to
approach the research problem and to interpret the research findings. The chapter has argued that
ASES are complex systems that require holistic analytical approaches to understand all the links among
and between the related sub-components that constitute them. It has also suggested that the SLA is
a useful approach to understand rural livelihoods diversity. The SLA approach permits undertanding
how households combine different assets in order to deliver their livelihoods strategies, with a focus
on the different land management regimes. An ES approach and farmers’ co-production of agrarian
services have also been presented. The importance of classifying and valuing ES in order to disclose
trade-offs between ES valuations related to diferent land management practices has been
emphasised.
The chapter has subsequently presented livelihoods vulnerability and the adoption of a political
ecology approach to analyse the effects of modern irrigation on the human dimension of ASES. This
chapter has assumed that vulnervility is a function of: exposure, sensitivity and adaptive capacity.
Finally, it has defined institutions as formal and informal procedures, routines, norms and conventions
that mediate access to ES and other assets. It has proposed a robustnes approach to analyse
institutions influence over livelihoods vulnerability and it has also proposed equity and legitimacy as
useful criteria to design and evaluate natural resource governance regimes. The next chapter outlines
the research methodological framework, drawing its epistemological approach, the research
tecniques employed and some ethical considerations.

CHAPTER 3: CASE STUDY AND METHODS
- 30 -
CHAPTER 3
"Si buscas resultados distintos, no hagas siempre lo mismo"
Adapted from Albert Einstein
3. Case study and methods
This chapter explains the methods employed for data collection and analysis. The first section
presents the overarching research approach, focusing on key ontological and epistemological
considerations. The second section justifies the selection and the characteristics of the case
study in Navarre and the third section provides a detailed explanation of the qualitative and
quantitative methods employed in the empirical chapters. In the fourth and final section I reflect
upon various aspects of field research, including research ethics.
3.1. Research approach
3.1.1. Ontology, epistemology and research strategy
The essence of research is to understand and explain the world (Scheba 2014). Research is
deeply engaged with a philosophical debate over perceptions of reality and how it is organised
(ontology), and what do we know about it (epistemology) (Newing et al. 2011). Epistemology
and methodology are similar concepts, but differ in that although both deal with how we come
to know, methodology is more practical in nature. Methodology focuses on specific techniques,
the methods, which can be used to better understand the world.
This dissertation takes a critical realist perspective as its epistemological stance. Critical realism
belongs to the post-positivist school of thought, one of the major philosophical schools in
contemporary social-ecological research. It offers an alternative to positivism’s reductionist
scientificity and the relativist reactions to it. Critical realism considers that there is a ‘real’ world,
existing independently of the researcher’s knowledge of it (Sayer 2004). It becomes important
to study how historical and contemporary factors shape different interpretations of a single
material world (Scheba 2014). Critical realism stresses that the experience of knowledge
imperfections, mistakes and unexpected outcomes give us the conviction that the world is not
merely a social construction (Sayer 2004). There is an iterative process developing over time
between what has been previously mentally constructed and the material world.

CHAPTER 3: CASE STUDY AND METHODS
- 31 -
As a researcher, I agree with critical realists on the normative implications of our commitments
with society. The ‘critical’ dimension of critical realism lies in the fact that social practices are
informed by ideas, which may or may not be true. Identifying understandings in society as false
implies that those beliefs and actions ought to be changed (Sayer 2004). However, one must be
careful in this ‘search for the truth’. Realists do not assume the truth to be an absolute, all-or-
nothing matter. Rather, they prefer to talk about degrees of practical adequacy. Many social
science dissensions are not mutually exclusive rivals, but they emphasise different aspects of
complex processes (Sayer 2004). This approach emphasises the importance of multiple
investigative measures and the need for triangulation across these multiple informative sources
(e.g. actors’ discourses, primary and secondary data).
Moreover, critical realism considers that objectivity is not merely the act of an individual, but
rather a social phenomenon. Therefore, it is better suited within a broader context, among a
community that reviews each other’s work (Vatn 2007). Critical realists also argue that the world
is ‘stratified’, as with biological phenomena, where new properties develop from objects
emerging from their constituents (Sayer 2004). The relationship of these categories is examined
within my analysis of ES, along with an assessment of influential livelihood assets, which are
simultaneously affected by global factors assessed within a vulnerability index (see e.g., Sections
3.3.3 and 3.3.4).
Researchers may critically examine why reality is as it is, focusing on shaping features such as
power structures and social networks (Scheba 2014). They emphasise that although people have
causal powers, such powers are realised differently due to structural mechanisms and social
contexts (Sayer 2000). I reflect upon these ideas first in Chapter 0, when I focus on farmers’
motivations to value agrarian ES, and in Chapter 0, where I aim to understand new irrigation
isntitutions that eventually influence individual and social land management choices.
The research strategy takes on a case study approach, which allows for an in-depth examination
of the research questions and the use of a variety of research tools to gather reliable and
accurate information. The research is performed through empirical observation, incorporating
deductive and inductive strategies.
3.1.2. A case study approach
A case study approach enables the researcher to gain insights from a particular case, which can
be utilised in other cases, allowing for a detailed research process and enabling the researcher
to study social processes and relationships more in-depth. Referencing daily social practices

CHAPTER 3: CASE STUDY AND METHODS
- 32 -
allows the researcher to respond to such questions of what things are, and how and why they
happen.
Each case study, though in itself unique, is an example of broader phenomena and its
generalisation depends on how similar the case study is to others of similar type (Scheba 2014).
Within this approach, it is therefore important to explain why or how the selected case is
comparable to others, and to contrast findings, thus exploring possibilities for generalisation. In
rural development literature, as shown in Section 3.2 below, the irrigation of agrarian systems
in the Mediterranean region has received increasing attention over the past two decades. The
ecological and productivity effects of irrigation have been largely studied and broadly discussed
(Urama 2005; van Halsema & Vincent 2012). More recent studies have investigated whether
irrigation can be understood as a practice of climate change mal-adaptation, and how it fits into
a wider hydro-social system that distributes ecological and social costs inequitably (Connor et
al. 2012; Cooper et al. 2008; Deressa et al. 2009; Fischer et al. 2007; Fleischer et al. 2008; Monaco
et al. 2014; Swyngedouw, 2009).
Qualitative methods were used primarily for data collection and interpretation. This includes
semi-structured interviews, focus group workshops, document analysis, and participant
observation (see Sections 3.3.2, 3.3.4 and 3.3.5 below). These methods are valid for
understanding case study specifics, such as the historical evolution of agrarian systems in the
case study area, the functioning of existing institutions, and power relations among social actors.
A complementary quantitative survey was also deployed to collect farmers’ information relevant
to characterise farmers’ perceived stressors and calculate the household vulnerability index. The
survey was also accompanied by an absolute and relative ranking exercise to capture farmers’
valuation of ES (see Sections 3.3.2.2 below). Throughout the dissertation, I contrast my findings
with literature published on the topic, including similar case studies.
I carried out fieldwork with an open mind and willing to listen to people without preconceptions.
However, I acknowledge my familiarity with the context of the case study area, since I come
from a neighbouring region and followed the development of the irrigation project through
written press and e-media. In order to deepen my understanding of local livelihood strategies
and grasp the drivers and the consequences of the irrigation project, I lived in one of the villages
for nearly four months, and made frequent visits for an additional four months to conduct semi-
structured interviews. This methodology obliged me to remain flexible and receptive to
unforeseen findings during fieldwork, which led to continuous revision of the research strategy,
questions and findings.

CHAPTER 3: CASE STUDY AND METHODS
- 33 -
3.2. The Case study of Navarre
3.2.1. Country focus: Spain
Spain was selected as the case study country, primarily because Spanish agriculture is of high
importance in terms of the surface it occupies, the generated employment (around 7% of total
employment in the country) and the high subsidies it receives7. More than twenty-five million
hectares (approximately 50% of Spain’s total area) are classified as useful agricultural lands
(SAU).8 Accounting for meadows and pastures, this area reaches 80% (MAGRAMA 2013).
Between 2007-2013, Spain ranked as the second highest receiving country in relation to the EU’s
Common Agricutlural Policy (CAP) (Carricondo & Peiteado 2010). There is a close connection
between intensive land management practices (in terms of fertilisers and water consumption)
and established agricultural subsisdies. Moreover, there is an overlap between CAP subsidies,
overused aquifers, and nitrate-polluted areas that have been declared vulnerable due to
agrarian sources (Carricondo & Peiteado 2010). This occurs in a context where croplands and
bare soil are above the European average (28% versus 25% and 12% versus 5%, respectively),
whereas surface water (0.9%) and wetlands (0.1%) are below the European average (MAGRAMA
2013).
Traditionally, much of the irrigation practiced in Spain consisted of gravity-fed systems, where
water was transported from surface sources via small canals and used to flood agricultural land
(Baldock et al. 2000). Currently, the most widespread irrigation method is by sprinklers utilising
pressure systems. This has been facilitated through policy measures that have subsidised
farmers’ adoption of irrigation infrastructure, guaranteeing low water prices. Although sprinkler
systems allow for a better control of water use during irrigation, higher quantities of water are
used through such systems, causing overall a more severe impact on the environment (Baldock
et al., 2000). While modern irrigation systems such as sprinkler and drip irrigation systems
provide more efficiency, water consumption has also increased as agrarian land has expanded
(INE 2011); confirming theories linked to the Jevons Paradox9 (Swyngedouw 2004).
Water is considered a public good in Spain, yet historically, the use of it has been private. The
River Basin Agency grants users long-term water-use concessions (approximately seventy-five
years), based upon estimates of available water within the River Basin Hydraulic Plans. Irrigators’
7 Available at http://www.lamoncloa.gob.es/espana/eh15/agricultura/Paginas/index.aspx. 8 Spanish acronym for “Superficie Agraria Útil”. 9 In economics, the Jevons paradox occurs when technological progress increases the efficiency with which a resource is used (reducing the quantity necessary for any one use), yet increasing demand causes a rising rate of resource consumption.
CHAPTER 3: CASE STUDY AND METHODS
- 34 -
associations, with regulating statutes drawn up and passed by the users themselves, mainly use
such allocated water.
Water scarcity has been a reoccurring theme in Spain's public policy rhetoric during the last
century, and the search for water persists (Swyngedouw 2004). Nearly every river basin has been
altered, engineered, and transformed. The resulting water transfer has led to conflicts and given
rise to new associations, ecological groups and movements such as La Nueva Cultura del Agua.10
Spain is the fourth country in number of dams after China, the USA, and India, and it has the
highest number of dams per square kilometre per capita in the world (Mendez 2001). Today the
country has nearly nine hundred dams, more than eight hundred of which were constructed
during the second half of the 20th century. Dams are justified on the grounds of producing
hydroelectricity and securing water availability in drought periods and, more recently, they have
been further justified on the grounds of climate change-related concerns, such as buffering
infrastructures to mitigate temperature rise and to regulate extreme flooding events (Bruckner
et al., 2011). Relatedly, irrigation infrastructure has been also presented as a measure of climate
change adaptation as long as stored water is available (Field et al. 2014).
Climate change can be approached as a catalyst for mitigation and adaption; an outcome which
human activity should aim to avoid. Although Spanish agriculture’s impact on the country’s total
greenhouse gas (GHG) emissions is a relatively low (11%) (Gallejones et al. 2012), the agriculture
sector is responsible for emitting two of the most potent GHGs: methane (CH4) and nitrous oxide
(N2O). Respectively, these gases have around 25 and 298 times more heating potential than CO2
over a hundred year period (IPCC 2007). Irrigated systems also emit a higher level of N2O
compared to rainfed systems (Aguilera et al. 2013). Therefore, what could be considered a short-
term climate change adaption strategy could also be a driver of climate change. The widespread
transformation of rainfed systems into irrigated systems throughout the country, evoke a
reflection of the latter’s likely associated maladaptation characteristics. That is, insofar as they
promote higher levels of water consumption, they also translate in higher emissions and induce
irrigation-related environmental harms. Further examination of these issues is required given
the heterogeneous Spanish climate conditions and differential water scarcity and environmental
impacts across the country.
10 The Nueva Cultura del Agua – New Culture of Water - is a social movement that emerged in the mid-1990s. It promotes a change in water management policy in favor of more rational and sustainable actions. Members are professionals from various fields (business, academic, cultural, social, etc.).
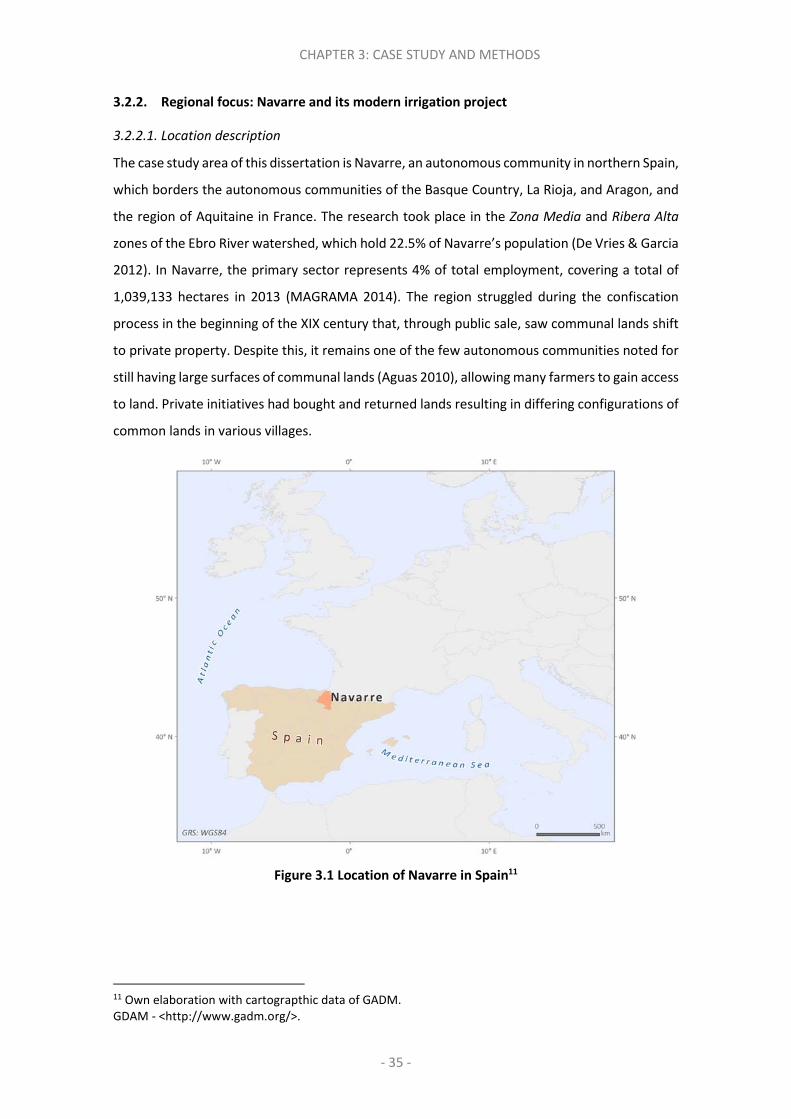
CHAPTER 3: CASE STUDY AND METHODS
- 35 -
3.2.2. Regional focus: Navarre and its modern irrigation project
3.2.2.1. Location description
The case study area of this dissertation is Navarre, an autonomous community in northern Spain,
which borders the autonomous communities of the Basque Country, La Rioja, and Aragon, and
the region of Aquitaine in France. The research took place in the Zona Media and Ribera Alta
zones of the Ebro River watershed, which hold 22.5% of Navarre’s population (De Vries & Garcia
2012). In Navarre, the primary sector represents 4% of total employment, covering a total of
1,039,133 hectares in 2013 (MAGRAMA 2014). The region struggled during the confiscation
process in the beginning of the XIX century that, through public sale, saw communal lands shift
to private property. Despite this, it remains one of the few autonomous communities noted for
still having large surfaces of communal lands (Aguas 2010), allowing many farmers to gain access
to land. Private initiatives had bought and returned lands resulting in differing configurations of
common lands in various villages.
Figure 3.1 Location of Navarre in Spain11
11 Own elaboration with cartograpthic data of GADM. GDAM - <http://www.gadm.org/>.

CHAPTER 3: CASE STUDY AND METHODS
- 36 -
The Ebro watershed alone holds 299 dams, including those in operation, under construction, or
projected and accepted (Confederación Hidrográfica del Ebro, 2015). Of these, 24 are in Navarre
(Ministerio de Agricultura, Alimentación y Medio Ambiente, 2015). It is planned that water from
one of these dams, the Itoiz dam, is to be used primarily for irrigation of 57,700 hectares of
agricultural lands. The Canal de Navarra was built for this purpose, as well as to facilitate the
generation of hydroelectricity and guarantee supply to neighbouring cities.
Figure 3.2 Map of Navarre’s geographical regions12
12 Own elaboration with cartographic data of Digital Chart of the World, GADM and IDENA repositories. GDAM - <http://www.gadm.org/ IDENA>.

CHAPTER 3: CASE STUDY AND METHODS
- 37 -
3.2.2.2. The modern irrigation project
The Navarre’s government, coordinated with other Spanish administrations and European
strategies, has provided farmers with infrastructure and public subsidies to favour the adoption
of modern irrigation as a means to deal with current rural development challenges (e.g.
productivity losses and climate variability). Formal norms and rules have accompanied the
irrigation system transformation since the late 1990s. The Real Decree 22/1997 allowed the
construction of the Itoiz dam, arguing that the dam should be regarded as a benefit for farmers
and Spanish society in general. Subsequently, the Foral Law 7/1999, Navarre Irrigation Plan and
the Foral Law 1/2002, regarding agrarian infrastructures, among others, followed suit to
establish favourable conditions for the modern irrigation project to be financed and to expand.
The Water Framework Directive (2000/60/CE) establishes water consumptions attending to type
of crops and area, which in turn allows developing a charging system by blocks of consumption.
Communal land decrees and laws, including the Foral Law 6/1986 -repealed by Foral Law
6/1990-, have also been modified to facilitate modern irrigation. The Foral Order 186/2011 and
Foral Order 185/2015 are about modern irrigation financing. Councils transforming communal
lands can get a higher subsidy for the installation of the modern irrigation if such councils
prioritise full time farmers rather than other kind of farmers when allocating communal lands
among the neighbouring farmers.
Over these years, there have also been moments when the pursuit of modern irrigation was
halted. In 1995, for example, the Court of Administrative Justice of the Audiencia Nacional13,
sentenced that the Real Decree-Law 22/1997 had exaggerated when it had argued that building
the Itoiz dam was urgently needed. Other outstanding events have also occurred as the
construction of the Itoiz-Canal de Navarra project advanced. Some examples are the
demonstrations against the Itoiz-Canal de Navarra project, non-binding referendums among
local farmers to decide about modern irrigation implementation and alternative studies to the
official ones about the adequacy of such project (Beaumont, 1997). The more extreme act
against the project happened in 1996, when eight activists of Solidari@s con Itoiz14 stopped the
- Infraestructura de Datos Espaciales de Navarra - <http://idena.navarra.es/Portal/Inicio>. For the meteorological stations location information was found in: <http://meteo.navarra.es/estaciones/mapadeestaciones.cfm>. 13 The Audiencia Nacional (English: National Court) is a special and exceptional high court in Spain. It has jurisdiction over all of the Spanish territory. In most cases, the rulings and decisions of these different divisions of the Audiencia Nacional can be appealed before the Supreme Court of Spain (Díaz, 2004). 14 The Solidari@s con Itoiz collective was born to cover a battle front of direct, public and non-violent action, within a strategy of civil disobedience in defense of land.
CHAPTER 3: CASE STUDY AND METHODS
- 38 -
dam construction works for one year after cutting the transport system cables that conducted
the concrete to any point of the dam. They peacefully entrusted themselves to the police and
two people were imprisoned. This was a disobedience act that attracted much publicity and
social support. Ultimately though, all such direct actions did not avoid the construction of the
dam, the development of the canal and the installation of the modern irrigation system
throughout the study area.
The Canal de Navarra was projected to be built in two phases; Phase One in the Zona Media and
Ribera Alta zones, and Phase Two in the Ribera Baja zone. Phase One (2006-2014) which has a
Mediterranean climate and an arid and semi-arid climates, respectively (as per the Papadakis
classification) converted 22,445 ha to modern irrigation across twenty-two villages. This area is
now divided into fifteen administrative sectors. Phase Two, however, has not yet happened due
to lack of funding. Over half of the canal was intended to flow underground and would require
the water to be pumped, as natural gravity would be impeded by orography. As a result, in 2015
the project was altered, with an extension of 15,000 hectares to the west of Zona Media and
Ribera Alta (See Figure 3.3).
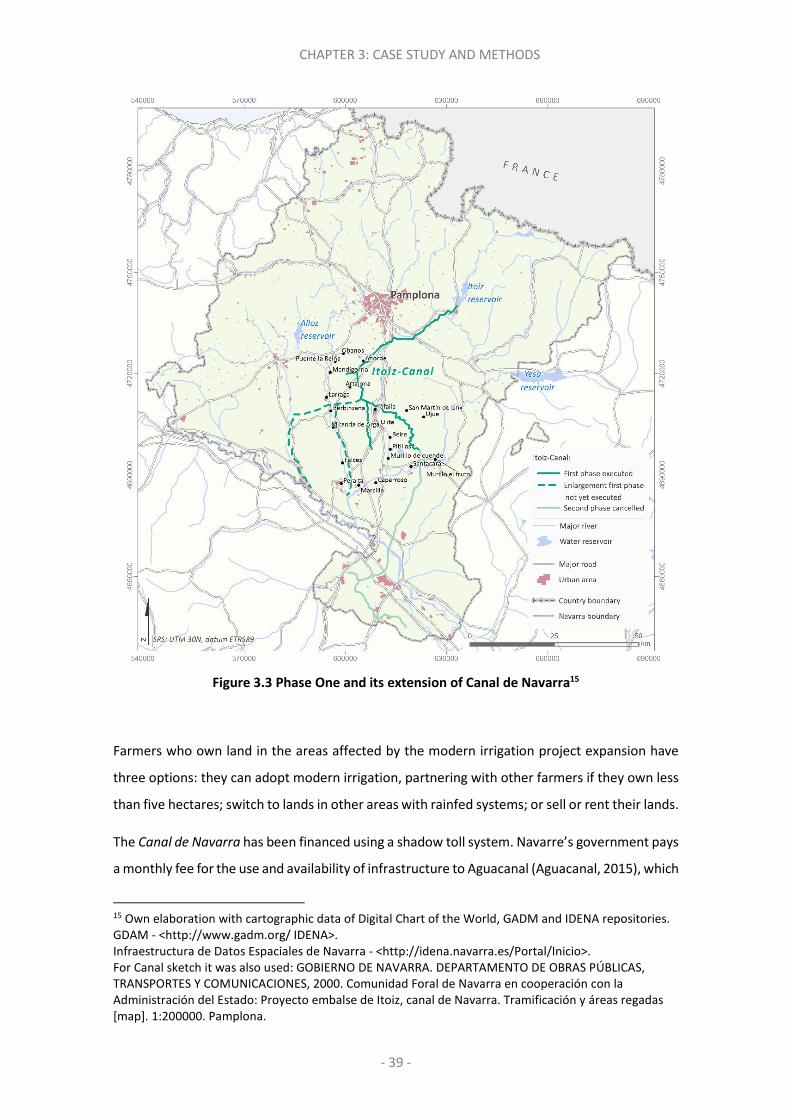
CHAPTER 3: CASE STUDY AND METHODS
- 39 -
Figure 3.3 Phase One and its extension of Canal de Navarra15
Farmers who own land in the areas affected by the modern irrigation project expansion have
three options: they can adopt modern irrigation, partnering with other farmers if they own less
than five hectares; switch to lands in other areas with rainfed systems; or sell or rent their lands.
The Canal de Navarra has been financed using a shadow toll system. Navarre’s government pays
a monthly fee for the use and availability of infrastructure to Aguacanal (Aguacanal, 2015), which
15 Own elaboration with cartographic data of Digital Chart of the World, GADM and IDENA repositories. GDAM - <http://www.gadm.org/ IDENA>. Infraestructura de Datos Espaciales de Navarra - <http://idena.navarra.es/Portal/Inicio>. For Canal sketch it was also used: GOBIERNO DE NAVARRA. DEPARTAMENTO DE OBRAS PÚBLICAS, TRANSPORTES Y COMUNICACIONES, 2000. Comunidad Foral de Navarra en cooperación con la Administración del Estado: Proyecto embalse de Itoiz, canal de Navarra. Tramificación y áreas regadas [map]. 1:200000. Pamplona.

CHAPTER 3: CASE STUDY AND METHODS
- 40 -
is the concessionaire enterprise. Aguacanal shareholders are composed of seven companies.
The largest holders are Acciona, a large construction group, with 35% and AGBAR, an
international water management company, holding another 35%. The payment will be made
over the next thirty years through INTIA S.A., the public company attached to Navarre
Government that projected the canal. Aguacanal receives a monthly fee based on the hectares
transformed into irrigation for each sector. Irrigators also pay annually for the maintenance and
conservation work carried out by Aguacanal, through the community of irrigators in each sector.
A process called concentraciones de tierras (land concentration) was a prerequisite for
transforming formerly rainfed agricultural lands into irrigated areas. In this process, small plots
of lands were brought together to encompass five hectares at least. The resulting land parcels
were classified in categories of quality and suitability for irrigation on the basis of soil
productivity and properties such as texture, stony loam, and organic matter. Therefore, if a
landholder holds two hectares of high quality land, for example, they could gain access to the
same area of equal quality, or to a larger area of lower quality, whether in the same or different
location. This process remained consistent for lands under traditional irrigation, yet the
requirement of a minimal area of five hectares presented a significant challenge, as 96% of these
plots were less than two hectares (De Vries & Garcia 2012). Also, farmers sharing a minimum of
five hectares had to agree on an irrigation system, thus limiting crop selection choices.
Concentraciones de tierras were then established to increase land profitability, as farmers would
be then able to manage larger land surfaces with the introduction of more efficient machinery.
3.2.2.3. Crops in the case study area
The Zona Media is primarily cultivated with winter wheat (Triticum spp.), barley (Hordeum
vulgare), and to a lesser extent, vineyards. Villages such as Olite and San Martín de Unx are
famous for their wine production. In Ribera Alta, rotations of cereal crops and vineyards, in
addition to vegetables are important. Olive and almond trees are also quite common and
distributed throughout the case study area. Corn (Zea mays) and forage was the predominant
crop introduced after modern irrigation was introduced. Traditional irrigation is still common
across the study region, but mainly in the Ribera Alta, due to its semi-arid climate. Therefore,
before the building of the Canal de Navarra, a large number of farmers already had access to
water for irrigation.
Most farmers have abandoned crops with high labour costs such as asparagus, peppers and fruit
trees, which compete with imports from countries like China or Peru and which are affected by
other factors such as internal labour compositions change in which machineries replace human
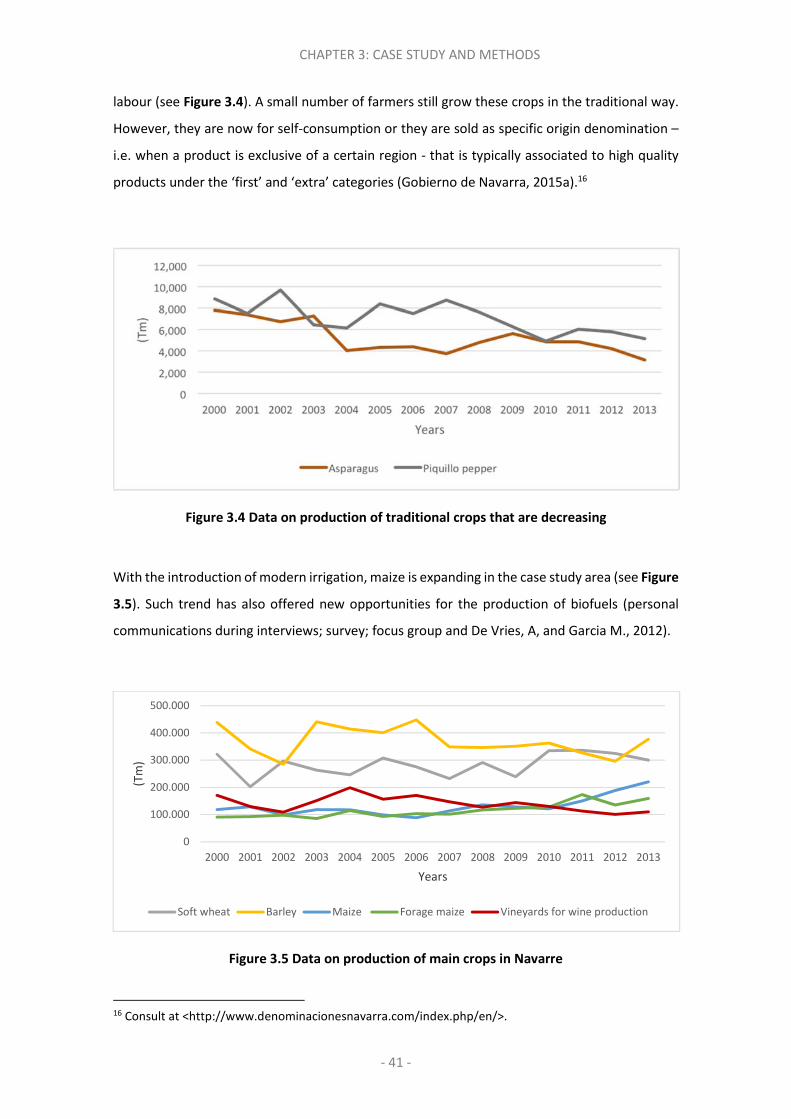
CHAPTER 3: CASE STUDY AND METHODS
- 41 -
labour (see Figure 3.4). A small number of farmers still grow these crops in the traditional way.
However, they are now for self-consumption or they are sold as specific origin denomination –
i.e. when a product is exclusive of a certain region - that is typically associated to high quality
products under the ‘first’ and ‘extra’ categories (Gobierno de Navarra, 2015a).16
Figure 3.4 Data on production of traditional crops that are decreasing
With the introduction of modern irrigation, maize is expanding in the case study area (see Figure
3.5). Such trend has also offered new opportunities for the production of biofuels (personal
communications during interviews; survey; focus group and De Vries, A, and Garcia M., 2012).
Figure 3.5 Data on production of main crops in Navarre
16 Consult at <http://www.denominacionesnavarra.com/index.php/en/>.
0
100.000
200.000
300.000
400.000
500.000
2000 2001 2002 2003 2004 2005 2006 2007 2008 2009 2010 2011 2012 2013
(Tm
)
Years
Soft wheat Barley Maize Forage maize Vineyards for wine production

CHAPTER 3: CASE STUDY AND METHODS
- 42 -
In 2012, the primary sector in Navarre represented around 3% of the region’s gross added value,
slightly above the Spanish average, but far from autonomous communities with greater
agricultural potential, such as Aragón (4.3%) and La Rioja (6.8%) (De Vries, A, and Garcia M.,
2012). Navarre is a net cereals importer, buying cereals from France in 2012 and from Poland
and Russia, Latvia and Lithuania in 2013. A share of its maize production is nonetheless exported
to Portugal and France. Navarre exports wine to Germany and the United Kingdom, as well as
to the Netherlands, Switzerland and the United States, but it also imports from France and other
Spanish regions (De Vries, A, and Garcia M., 2012).
3.3. Research methods
3.3.1. Semi-structured interviews
The research involved two rounds of semi-structured interviews. In the first round (May-July
2013), I conducted 29 in depth interviews following a snowball interviewee selection process
that involved scientists (N=1), policy-makers (N=4), NGOs (N=2), syndicates (N=2), cooperative
workers (N=1), members of consumer groups (N=2), water management companies’ officers
(N=1), INTIA technicians (N=3), and farmers (N=13). This allowed for a range of possible
perspectives about the Canal de Navarra irrigation project. Preliminary interviews were
arranged via email and telephone. The purpose of these interviews was to gather key
information for the design of household surveys (see Section 3.3.2.). The interviews were
organised according to a set of topics and questions defined a priori for each subset of
stakeholders involved, distinguishing farmers and rural landowners from ‘other’ respondents.
Appendix I outlines interview contents for these key stakeholders and Appendix II presents a
descriptive list of participants. ES rhetoric was not used in the same manner with an academic,
the regional government’s environmental officer, or an elderly rural owner who was not familiar
with technical terms.
The second round of interviews (May-June 2015) encompassed 19 interviews of two different
types to explore institutional change and vulnerability resulting from the transformation to
modern irrigation: one type addressed to a stratified sample of farmers in the village of Miranda
de Arga (N=17) and another to actors of cross-scale government officers (N=2). The interviewee
sample of the first type was stratified based on farmers’ land management practices, which had
been previously identified through the analysis of the survey (further explained in Section 3.3.2.,
below). Appendix III and IV outline interview contents and a descriptive list of participants. This
CHAPTER 3: CASE STUDY AND METHODS
- 43 -
second round of semi-structured interviews was key to be able to identify and select focus group
participants (see Section 3.3.4).
Interviewees in both rounds were approached within their daily context; on the farm, in their
office, or at home. They were always alone, with exception of two cases in which a family
member or a friend of the interviewee was also present. They were shortly briefed about my
research project and consent for both interviewing and tape-recording was sought orally (and
obtained in all cases). Participants typically engaged easily in conversation, and interviews lasted
between half an hour to one hour depending on the interviewee’s availability and flow of the
conversation. Anonymity was ensured to all interviewees, though for consistency and accuracy
within my research, I wrote up in my fieldwork diary key background information of each
respondent. I remained flexible during the interview and attempted to adapt to contextual
factors while ensuring that the conversation was useful to my research.
Specifically, I attempted to provide minimal direction or interruption, but often had to
encourage interviewees to remain focused on the subject, while still allowing them to talk
openly and freely. It was also important for me to consider aspects related to research design
and practicalities, such as how much time interviewees would allocate, where the interview took
place (formal office setting or evening drink), and not least, how well they already knew and
trusted me. In this regard, the second round of interviews was much easier than the first: I had
become acquainted with interviewees and they became more familiarised with my research.
Thus, I spent less time explaining the purpose of the research beforehand and gained their trust
more quickly, leading to more thorough and rich conversations within the time constraints.
In some interviews I had difficulties in accessing certain information, particularly during the first
round. Such difficulties differed depending on the type of question. Farmers who had been
directly involved in the irrigation project spoke more fluently about the strengths and difficulties
of the project and about the experienced factors of stress they perceive in their profession.
However, compared to other interviewees, some farmers had difficulties answering questions
related to the link between agrarian ecosystem goods and services and their wellbeing. When
the interviewee did not understand the question, I provided some examples to move the
conversation forward. In these situations, my own perspective might have influenced the
respondent’s views. In other interviews, the respondent declined to provide an answer on the
basis of lack of information and knowledge.
Participants did not generally challenge my research purpose. Most interviewees actively
contributed in interviews and also participated in the survey. At village level, motivations to
CHAPTER 3: CASE STUDY AND METHODS
- 44 -
participate in the interviews differed. Some refused to participate claiming lack of time during
periods of intensive work such as harvesting. Others cited the recent grim experience of selling
their lands due to modernisation, and stated they did not want to talk about it, or that they were
not farmers anymore. In contrast, some were enthusiastic about participating, showing me their
crops and lands, and sharing their practices and knowledge. Over the research process, only two
government officers were unavailable for an interview. One of them probably felt uneasy,
because his institution has a significant presence at the watershed level, and his participation
could have been regarded as inappropriate. The other’s reluctance to participate was justified
by an ongoing electoral process, and the officer asserted he did not have the time.
3.3.1.1. Interview design
As noted in Appendix I, interviews covered a variety of themes, each containing a number of
related questions. I tried to create simple, straightforward questions since the interview was
expected to last about an hour.
Information from the first round of interviews was used to draft the survey (see Appendix V and
Section 3.3.2), and to ensure that issues and variables of local concern and relevance were
systematically captured. The interview was first contextualised by asking interviewees if they
were familiar with the ES framework. Once their perception of ecosystem goods and services
was established, I asked why they were important for them and how they contributed to their
wellbeing. Interviewees were asked to briefly characterise and classify the different types of
farmers in the research area.
Interviewees offered their views on the main challenges and stressors of Navarre’s agrarian
sector. I explicitly asked about climatic factors, how intense (magnitude, duration and scope)
and frequent these stressors were, and how they had been confronting them in the past. I asked
whether they thought there were more sensitive profiles, or more exposed agents, to the stated
stressors. They were encouraged to reflect on the extent to which successful coping strategies
relied on their knowledge, natural assets, social networks or financial standing. They also
identified the institutional arrangements that helped them adapt to the stressors identified.
I asked interviewees if and how farmers collectively organised, and which forms of financial aid
they had access to. Based on this information, I was able to produce a compilation of the main
institutions playing a role in farmers’ livelihoods. I enquired as to how the concentraciones de
tierras were made, in which way parcels were distributed afterwards, and if and how they
believed modern irrigation would help to improve their livelihoods. Possible conflicts resulting
CHAPTER 3: CASE STUDY AND METHODS
- 45 -
from the transformation were broadly discussed- including positive and negative aspects of
modern irrigation, along with favoured production models.
For the second round of interviews (see Appendix III), I structured the conversation around the
three main issues related to changes in water access over time: (1) a comparison between
traditional irrigation institutions and modern irrigation, (2) the socio-economic precursors that
led to modernisation, and (3) the implications of modern irrigation for rural livelihoods. Most
interviews provided insights into the social relations in the village as well as personal opinions,
feelings and experiences.
3.3.1.2. Interview data analysis
The first round of interviews was not completely transcribed except for statements where
participants perceived a link between ES and human wellbeing dimensions. These statements
were additionally organised according to the scale at which ES are delivered, whether the
benefits are self or other-oriented, and whether such benefits are directly or indirectly received
by the beneficiaries.
As highlighted in the previous chapter, there is disparity in the literature regarding the
classifications of services and benefits, which created challenges in my analytical process. For
example, landscape and traditional knowledge are treated as services in the Millennium
Ecosystem Assessment (MA 2005), yet considered benefits by Chan et al. (2012) and Klain et al.
(2014). Participants also discussed how several benefits might be produced from the same
service (e.g. outdoor recreation might simultaneously lead to physical activity, artistic and
spiritual benefits). Because of this, before going into the field, I erroneously organised
participants’ statements, confusing the concepts of services and benefits. Specifically, I classified
some sentences for the Likert scale exercise and some cards for the Pebble Method (see Section
3.3.2.1) as if they were services when they were benefits (e.g. employment, economic gains, and
happiness). This is an important caveat of my research, which fortunately was noted quickly and
corrected to the best of my ability. Before data analysis I removed such sentences from the Likert
Scale exercise. Since this valuation method consisted on absolute valuation, the valuations of
such cases were just discarded without any other arrangement. In the case of Pebble method,
however, since this method consisted of a relative valuation, removing such cards implied the
distribution of farmers’ allocated pebbles among the rest of cards proportionally to the values
attached to the remaining cards (see Section 3.3.2.2).
For clarity, I deviated from the MA classification (2005) of ES and organised the participants
statements in alignment with Klain et al. (2014), primarily for a more precise alignment of

CHAPTER 3: CASE STUDY AND METHODS
- 46 -
cultural services and connected benefits. In this process I discarded seven statements associated
with cultural services and benefits, along with two statements related to provisioning services.
The rest of the information was summarised as key parts to narratives about ES for human
wellbeing and vulnerability analysis, which allowed me to identify key questions to include in
the survey (see Section 3.3.2 below and Appendix III), and to compile the different assets that
constituted local rural livelihoods.
For the second round of interviews I transcribed all recordings and coded them in an Excel
dataset, excluding only irrelevant and off-topic sections. I compiled the codes and looked for
themes that encompassed ideas revealing certain patterns (Saldana 2012), and attempted to
provide an explanation for the patterns identified within the data. Documents, newspapers and
other written sources were also assessed as a way of triangulating the information.
3.3.2. Household survey design
In addition to the interviews, I conducted a survey to complement and triangulate some of my
qualitative findings with quantitative data. It took three months and involved two research
assistants, employed full-time. The household was selected as the main unit of analysis (Thomas
and Twyman, 2005).
The survey was performed in the 22 villages affected by the Canal de Navarra modern irrigation
project. For the development of the questionnaire, the research assistants and I followed an
iterative process. First, I conducted four pilot questionnaires to assess whether the questions
were clear and if participants could fully understand them. Improved versions of the
questionnaire were re-administered to initial participants, and I gauged their responses
regarding comprehension of any alterations. Once this revision was complete, we performed
381 questionnaires between August and December 2013. The objectives of the survey were:
i) To value agrarian soil ES;
ii) To gather detailed information on livelihood assets (human, physical, natural, financial
and social information);
iii) To identify the main prosperity challenges farmers faced;
iv) To obtain information on participants’ views on modern irrigation, including how it fits
with their livelihood strategies; and finally
v) To collect their views on the agrarian institutions that played a key role in their
livelihoods.

CHAPTER 3: CASE STUDY AND METHODS
- 47 -
The survey aimed to cover as many farmers affected by the modern irrigation project as possible.
Aguacanal gave me the names of such farmers and which village they belonged to, but due to
data protection restrictions I had to search for further contact details in public sources. Based
on sample size calculation (Newing et al., 2011) and in order to achieve a 95% confidence
interval, I required a minimum of 360 surveys to represent the 2,555 affected farmers in the
area. In total 381 household surveys were conducted. Eight were found invalid due to ‘missing
data’ and were discarded in the analysis.
To select participants, probability sampling17 was followed. Potential interviewees were
randomly contacted via telephone to schedule a date to complete the survey. The research team
also used face-to-face approach as a common tactic in public spaces such as cooperatives and
bars.
The 176-question survey typically took between one and a half hours to complete and, as in the
case of interviews, the research project was briefly introduced and consent was orally sought.
Surveys were conducted mainly in Spanish but there were also a few conducted in Basque. My
mother tongue (Spanish) was spoken by most of the interviewed farmers and Basque was also
spoken by one of the research assistants and myself.
Internal quality control procedures were established during a week-long training phase, and
allowed me to identify areas for improvement. For example, when questions were identified as
ambiguous with potential to misinterpretation, all field staff agreed to a common framing.
Corrections to the original survey template were also made to eliminate repetitive information
and to revise questions that impeded conversation flow.
As the survey advanced, it became increasingly difficult to find farmers willing to participate
because of time constraints or due to their apprehensions regarding the length of the survey –
which was noted to them on the phone. Weather conditions also influenced our access to
participants. For example, farmers were more available on rainy days and therefore we were
able to complete more surveys on that kind of days. Other uncontrollable aspects influenced the
research process, such as my role in conducting the survey and my social characteristics (e.g.
gender, age). I did not predict the implications of the researcher’s gender during the interviews,
though it became evident during survey administration that being a woman seemed to be
17 The underlying principal of probability sampling is that every case – every member of the study population – has a known probability of being included in the sample, and therefore statistically valid inferences can be made from the sample to the overall population (Newing et al., 2011, p. 67).

CHAPTER 3: CASE STUDY AND METHODS
- 48 -
beneficial in gaining access to farmers, as they were more receptive and trusting toward my
female assistant and me in comparison to the male research assistant.
Initially, and unconsciously, we had avoided farmers who were negatively affected by the
modern irrigation project. This happened because when we contacted them and explained the
purpose of the study they were reluctant to participate on the basis of their limited involvement
in and knowledge of modern irrigation. Subsequently, only those still holding land areas declared
for modern irrigation were asked to participate. This occurred in the first villages surveyed
(Artajona, Obanos, Añorbe, Puente la Reina, Mendigorria, and partly Tafalla all in Zona Media).
Three weeks into survey administration, I noticed this bias and tried to correct it by deliberately
looking for farmers who had been negatively affected by irrigation.
Overall, although we still used a random selection of farmers, we also targeted purposively a
wide range of farmer typologies among those in the list provided by AguaCanal including
landowners, retired and active farmers, and members of working cooperatives – i.e. farmers
that labour other owners land in exchange of a salary. It became apparent it was an emotionally
charged process, and many farmers still refused to participate, as they had previously lost lands.
For instance, two participants started crying during the survey, and several people became angry
on the telephone when I explained my research, reporting they did not wish to recall bad
memories.
3.3.2.1. Soil ES valuation: Likert scale and Pebble method
The importance of ecosystems is approximately divided into three types: ecological, socio-
cultural and economic (De Groot et al., 2002a). Ecological value encompasses the health state
of a system, measured with ecological indicators such as diversity and integrity. An economic
approach may operate through market prices that exist for some ES, especially for provisioning
services such as crops. However, it has been estimated that more than 80% of the values of ES
are not captured in markets (e.g. Costanza et al., 1997; De Groot et al., 2002). In these cases,
indirect economic methods can be used (e.g. avoided damage cost methods (for regulating
services), and hedonic pricing and travel cost methods (for some cultural services such as
aesthetically pleasing landscapes) (De Groot et al., 2002a). This economic approach is
considered adequate for conventional market-based commodities18 but not that convenient
when dealing with other types of ES (Martín-López et al., 2014; Pritchard et al., 2000).
18 Commodity is defined as an exchangeable unit of economic wealth (“Definition of ‘commodity’ | Collins English Dictionary,” n.d.).
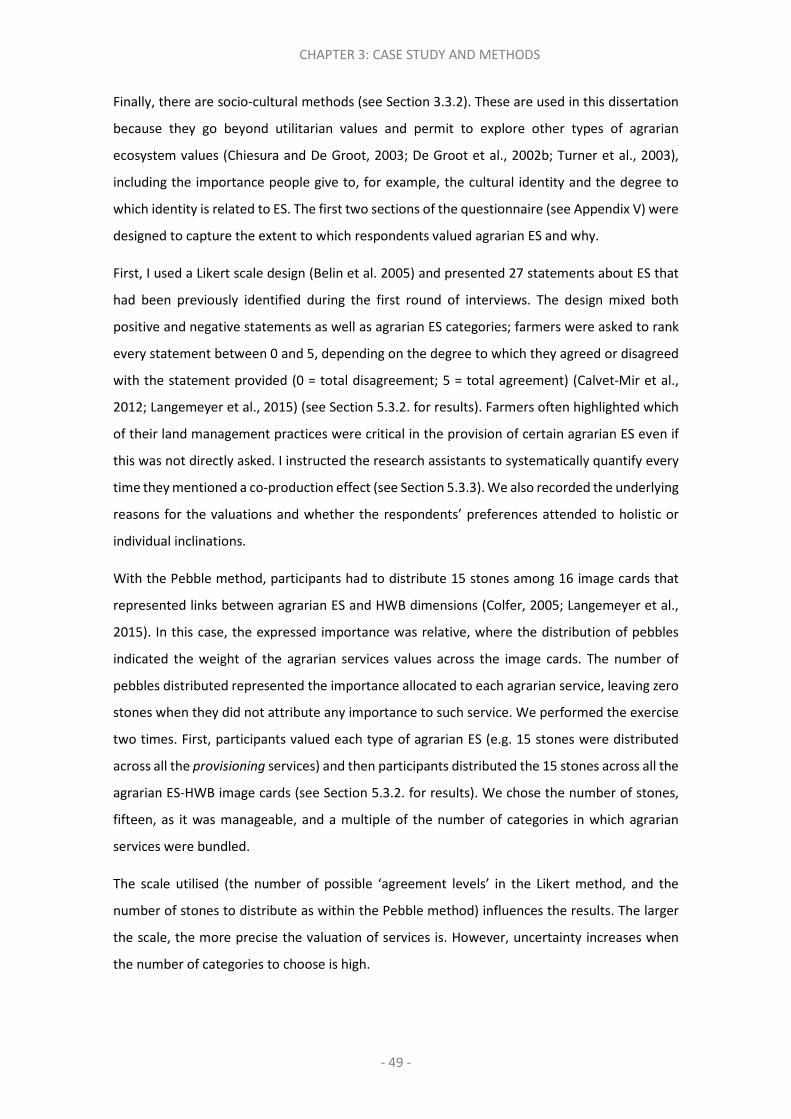
CHAPTER 3: CASE STUDY AND METHODS
- 49 -
Finally, there are socio-cultural methods (see Section 3.3.2). These are used in this dissertation
because they go beyond utilitarian values and permit to explore other types of agrarian
ecosystem values (Chiesura and De Groot, 2003; De Groot et al., 2002b; Turner et al., 2003),
including the importance people give to, for example, the cultural identity and the degree to
which identity is related to ES. The first two sections of the questionnaire (see Appendix V) were
designed to capture the extent to which respondents valued agrarian ES and why.
First, I used a Likert scale design (Belin et al. 2005) and presented 27 statements about ES that
had been previously identified during the first round of interviews. The design mixed both
positive and negative statements as well as agrarian ES categories; farmers were asked to rank
every statement between 0 and 5, depending on the degree to which they agreed or disagreed
with the statement provided (0 = total disagreement; 5 = total agreement) (Calvet-Mir et al.,
2012; Langemeyer et al., 2015) (see Section 5.3.2. for results). Farmers often highlighted which
of their land management practices were critical in the provision of certain agrarian ES even if
this was not directly asked. I instructed the research assistants to systematically quantify every
time they mentioned a co-production effect (see Section 5.3.3). We also recorded the underlying
reasons for the valuations and whether the respondents’ preferences attended to holistic or
individual inclinations.
With the Pebble method, participants had to distribute 15 stones among 16 image cards that
represented links between agrarian ES and HWB dimensions (Colfer, 2005; Langemeyer et al.,
2015). In this case, the expressed importance was relative, where the distribution of pebbles
indicated the weight of the agrarian services values across the image cards. The number of
pebbles distributed represented the importance allocated to each agrarian service, leaving zero
stones when they did not attribute any importance to such service. We performed the exercise
two times. First, participants valued each type of agrarian ES (e.g. 15 stones were distributed
across all the provisioning services) and then participants distributed the 15 stones across all the
agrarian ES-HWB image cards (see Section 5.3.2. for results). We chose the number of stones,
fifteen, as it was manageable, and a multiple of the number of categories in which agrarian
services were bundled.
The scale utilised (the number of possible ‘agreement levels’ in the Likert method, and the
number of stones to distribute as within the Pebble method) influences the results. The larger
the scale, the more precise the valuation of services is. However, uncertainty increases when
the number of categories to choose is high.

CHAPTER 3: CASE STUDY AND METHODS
- 50 -
Figure 3.6 Respondents executing Pebble Method Valuation
The execution of this exercise required patience and deliberate explanations. In very few cases
(between two to four), some elderly participants warranted assistance; we discussed with them
the number of stones assigned to each card, and when agreement was reached, we distributed
the stones and waited for their confirmation for final distribution.
The Likert scale offers an absolute valuation, while the Pebble method deals with relative
(comparative) valuation, among and between AES categories. Although Likert is designed for
valuation, in practice I found responses rather corresponded to whether farmers agreed or
disagreed with presented statements and normally assigned extreme values. A service may be
highly regarded but does not necessarily mean it is valued when forced to choose - as evidenced
when I presented all the cards and participants were asked to distribute the stones. Therefore,
the relative valuation through the Pebble method provided richer information since clearer
preferences were revealed.
I acknowledge that asking surveyed individuals to rank a service based on a pre-written positive
statement could introduce a bias in the score provided. Therefore, my results might overvalue
positively stated agrarian services and undervalue the negatively stated ones. Moreover, some
concepts (e.g. the agrarian ecosystem capacity to absorb pollutants) were difficult to understand
and this might have had an influence on the results. Combining both valuation techniques
allowed respondents to consider agrarian ES while providing me further insights on the co-
production of such services.
3.3.2.2. Quantitative data analysis
After manually performing data cleaning via Excel, I analysed quantitative data from the survey
using the R statistical software (R i386 3.1.2.), and assigned a code for all the questions of the
questionnaire. When allowed more than one response, I separated the questions into the

CHAPTER 3: CASE STUDY AND METHODS
- 51 -
number of possible responses and assigned dummy codes19 (Yes/No responses option). There
were six open questions for which I gave categorical codes.20 Some numerical continuous
variables were grouped into categories, and histograms were made to illustrate equilibrated
categories in terms of the number of participants within each category, aligned with expert
criteria (e.g. minimal land area to install irrigation). Questions with too many missing values
were removed before data analysis. When there were few missing values (e.g. <ten missing data)
it was retained, but respondents with missing values were removed from the analysis of such
particular variable. Thus, the results of the dissertation rely on 364 respondents of the 381 total
surveys performed.
Answers that were difficult to interpret were also discarded. For example, when the survey
asked whether or not the respondent would request financial help from family members or
friends, an answer could have several interpretations. Answering ‘no’ could mean they would
not ask for it or that they had never received such help. It was also difficult to interpret a
question about chronic illness since answers reflected a wide range of more or less acute
illnesses, from back-pain to a missing arm.
‘Don’t know’ answers were categorised according to the type of question. In questions where
not knowing the response was relevant within the field, the ‘Don’t know’ answer was kept as a
response category; in the rest of responses, respondents were eliminated if there were less than
twenty cases. If there were more than twenty, the question was deleted.
Likert scale and Pebble method valuation data analysis
In the case of the Likert scale valuation exercise, I analysed 18 statements instead of 27, as I
realised I had made the mistake of showing sentences discussing benefits rather than services.
Additionally, ‘Don’t know’ answers were treated in two ways. On one hand, in four cases I added
the mean value of respondents’ valuation to the ‘Don’t know’ answers. Doing so meant keeping
the rest of values attached to other services equal - not affecting therefore the general result.
On the other hand, I also made the analysis computing the ‘Don’t know’ answer as an added
category to catch the uncertainty and discern which types of services were not clearly perceived.
Regarding the Pebble relative valuation, I removed three of the cards values (income,
employment and happiness since they were considered benefits rather than services) and those
values were proportionally distributed among the rest of services that had weights attributed.
19 A dummy variable, in statistics and econometrics, is one that takes the value 0 or 1 to indicate the absence or presence of some categorical effect; this is Yes/No responses options. 20 A categorical variable (sometimes called a nominal variable) is one that has two or more categories, but there is no intrinsic ordering to the categories.

CHAPTER 3: CASE STUDY AND METHODS
- 52 -
Participants were classified based on the type of land management they performed. For this
purpose, I included the type of crop, water consumption system, type of fertiliser (organic,
mineral or mixed), size of the worked plots, and time invested in working the land (professional,
hobby or household nourishment). These variables influence the land management
intensification regimes (e.g. the type of crop is linked with water requirement levels; maize, for
example, needs to be intensively irrigated compared to vineyards). Crop rotations also impact
higher or lower harvest levels, in the same time and space. Additionally, surfaces of crop fields
also are indicative of possible use of large machines.
Grouping and characterising process
I performed a Hierarchical Cluster Analysis (HCA) to identify groups of participants (so-called
clusters) that shared particular characteristics, which were in turn dissimilar to those of another
group. This technique is sequential; in the first phase, each case acts as a separated cluster, while
in a second phase most similar groups (clusters) are grouped. The clustering process continues
until a unique cluster that encompasses the whole sample is created. Groups are created as a
function of a distance matrix. Cluster centres are defined, and the distance to another group is
calculated from the centre of that group to the centre of the nearest group, such that the
squared distances from the cluster are minimised. The closer the clusters are, the more similar
they are in terms of land management.
Figure 3.7 below sets an example. The lower part of the figure represents the whole sample
formed by a, b, c, d, e and f cases; a single cluster group. They are then separated according to
their dissimilarities and I can discern that a is different to the rest of the cases. In the next
iteration, I can differentiate b and c from the rest, and the process continues separating the
cases until they all are individual cluster groups. I further characterised the clusters according to
remaining socio-demographic features, by performing a Multiple Correspondance Analysis21 to
identify the variables explaining the highest variance.
21 Multiple Correspondence Analysis (MCA) is based in the same foundations of Principal Component Analysis (PCA), but is used for qualitative analysis. It allows for a reduction of data dimensions, which is used to analyse the dependency and independency relations of categorical variables in a contingency table. It summarises the information of columns and rows in such a way that the projection of them on a reduced space simultaneously represents their points allowing conclusions about ordinal and nominal variables to be obtained (Nenadic and Greenacre 2007).
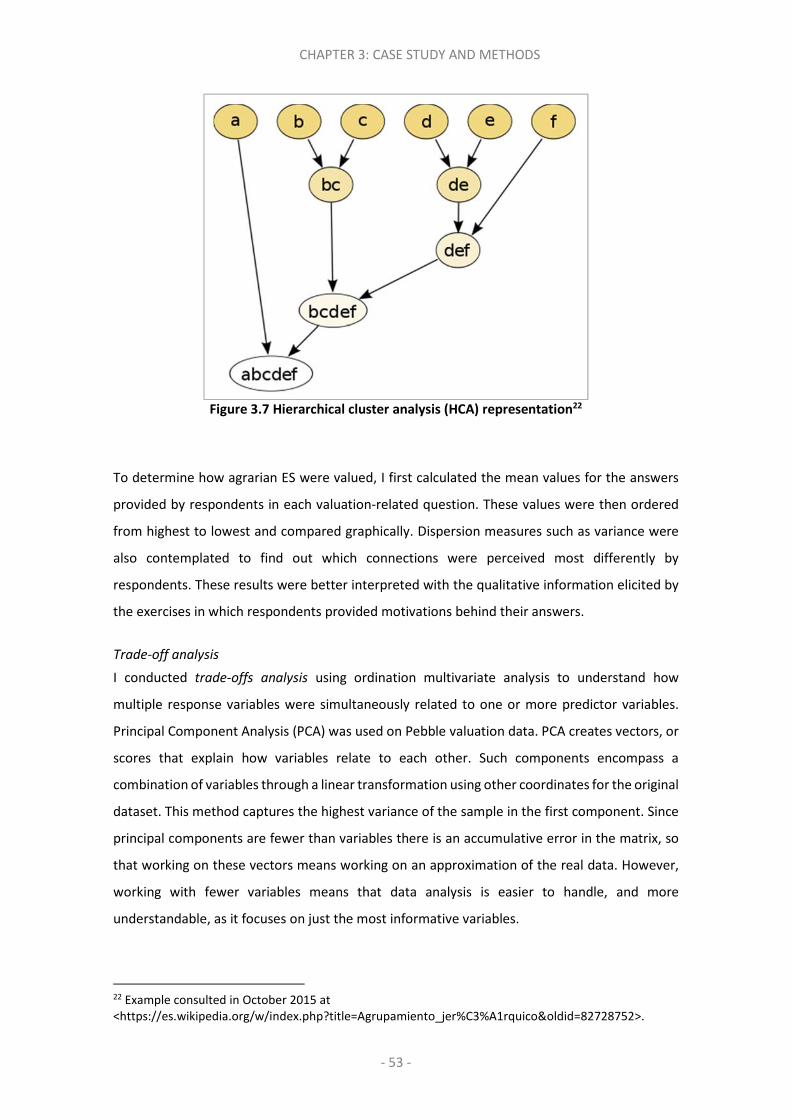
CHAPTER 3: CASE STUDY AND METHODS
- 53 -
Figure 3.7 Hierarchical cluster analysis (HCA) representation22
To determine how agrarian ES were valued, I first calculated the mean values for the answers
provided by respondents in each valuation-related question. These values were then ordered
from highest to lowest and compared graphically. Dispersion measures such as variance were
also contemplated to find out which connections were perceived most differently by
respondents. These results were better interpreted with the qualitative information elicited by
the exercises in which respondents provided motivations behind their answers.
Trade-off analysis
I conducted trade-offs analysis using ordination multivariate analysis to understand how
multiple response variables were simultaneously related to one or more predictor variables.
Principal Component Analysis (PCA) was used on Pebble valuation data. PCA creates vectors, or
scores that explain how variables relate to each other. Such components encompass a
combination of variables through a linear transformation using other coordinates for the original
dataset. This method captures the highest variance of the sample in the first component. Since
principal components are fewer than variables there is an accumulative error in the matrix, so
that working on these vectors means working on an approximation of the real data. However,
working with fewer variables means that data analysis is easier to handle, and more
understandable, as it focuses on just the most informative variables.
22 Example consulted in October 2015 at <https://es.wikipedia.org/w/index.php?title=Agrupamiento_jer%C3%A1rquico&oldid=82728752>.

CHAPTER 3: CASE STUDY AND METHODS
- 54 -
Selecting the number of components is based on Kaiser criteria; that is, the selection of the
components with eigenvalues higher than one. Results are discussed in terms of component
scores (transformed variable values corresponding to a particular data point), and loadings (the
weight by which each standardised original variable should be multiplied to get the component
score). Principal components are guaranteed to be independent if the dataset is normally
distributed. However, normality is not a requirement. Standardization was not made due to
being in a similar scale (0-15).
Valuation differences analysis
Finally, I explored if there were significant valuation differences among the existing livelihood
groups. In doing so, I used three different types of tests depending on the nature of the
compared variables. When both variables compared in the same sample were categorical, I used
the chi-square test to check if there was a significant association between those variables or if
they were independent of each other (see Section 5.3.4). The Spearman test was performed
when the co-relation test was applied to two continuous variables with no normal distribution.
These tests allowed me to determine the variables that were significantly different across
livelihood groups.
Finally, the Kruskal-Wallis test was used to understand if there were significant differences
regarding the valuation of agrarian ES attributed in the Pebble exercise (Martín-López et al.,
2012). The Kruskal-Wallis test is a non-parametric method for testing whether samples originate
from the same distribution. It is used to compare more than two samples that are independent,
or not related. This test does not assume a normal distribution. The method behind the test is a
ranking of all data from all groups together. The algorithm is influenced by the number of
observations in a group (364 in my case) and the rank among all observations of variables.
Since I made this comparison among four livelihoods, I decided to apply a method called False
Discovery Rate (FDR) control, to counteract the problem of multiple comparisons (Brown et al.,
2006). In this case, when the number of variables is high, there are more possibilities of
significance by chance. For this reason, p-values are normally adjusted to a more restrictive p-
value.
3.3.3. Livelihood Vulnerability Index
Indicators are quantifiable constructs that provide information on matters of wider significance
than what is actually measured, or on processes or trends that otherwise might not be apparent
(Vincent, 2004). In addition to being used in their own right, indicators can be aggregated to

CHAPTER 3: CASE STUDY AND METHODS
- 55 -
form indices, leading to a more comprehensive model of reality. We must consider that they are
simplifications of reality and sometimes may not be valid.
I adopted a two-steps approach when developing the Vulnerability Index (VI). Firstly, the VI is
expressed as a composite index comprised of seven major components, while this is later
aggregated into three contributing factors to vulnerability: adaptive capacity, exposure and
sensitivity, following the Intergovernmental Panel on Climate Change (IPPC) guidelines (IPCC,
2007b). Following Hahn et al. (2009), I used primary data from household surveys to develop VI
and derived a generic vulnerability metric by translating a general definition of vulnerability into
a mathematical expression. I characterised farmers’ sensitivity and adaptive capacity using
sustainable livelihoods assets (natural, social, human, physical and financial) and integrated
exposure in order to comprehensively evaluate livelihood risks (Hahn et al., 2009). For
simplification purposes, only final (aggregated) results are shown in Section 6.4 but disggregated
results can be found in Appendix VIII, which allow a better understanding of the vulnerability
results - i.e. whether a low level of adaptive capacity is due to lack of technology or reduced
social connections for instance.
Farmers’ testimonies were taken into account to understand if a given variable influenced,
whether positively or negatively, the sensitivity and adaptive capacity of stakeholders in the
local context. To calculate exposure, the survey provided evidence that crop prices volatility,
and climate variability were the respondents’ main perceived stressors. The statistical dataset
(Gobierno de Navarra, 2015b) provided me with long-term climatic empirical measurements.
Farmers’ exposure to climate variability was measured by average calculations conducted by
Navarre’s government. I analysed two climatic related stressors. For the climate variability
calculation, the average standard deviation of the maximum and minimum monthly
temperatures and monthly precipitation23 (Ahmed et al. 2009; Hahn et al. 2009). For estimating
the hydric deficit, I substracted evapotranspiration to the average rainfall. Data from seven
stations were used (Caparroso, Falces, Miranda de Arga, Olite, Puente la Reina, Tafalla and Ujue)
and assigned to the closest meteorological station to the village where each interviewee
lived/worked. On average the stations provided a data series of eighty-nine years (1920-2009).
I acknowledge that different crops have diverse growing periods, and the phases of their
maturation have differentiated importance, but using annual averages was better suited to
analyse four crops simultaneously.
23 In order to understand whether climate variability was actually variable, we compared standard deviation of 30 years with the mean standard deviation of a larger period (80 years).

CHAPTER 3: CASE STUDY AND METHODS
- 56 -
Prices volatility is the third analysed stressor. For each crop, data on prices and yields production
were compiled for the region, using data provided by the Department of Agriculture of Navarre.
The standard deviation for each crop was calculated for the period 1995-2013. Before doing this,
it was important to subtract the inflation effect of the years prior to 2013, which was done using
the annual average consumption prices index (Instituto Nacional de Estadística, 2015). Mean
price divided by the standard deviation gives a ratio that can be compared with the mean annual
inflation to interpret whether those fluctuations have a strong effect on the household
economy. The standard deviation of crops prices was used to calculate exposure to prices
volatility.
Subcomponents of adaptive capacity and sensitivity were selected through a review of the
literature on sustainable livelihood assessment (SLA) (Ahmed et al., 2010; Eakin and Bojórquez-
Tapia, 2008; Hahn et al., 2009; Haile et al., 2013; Ifejika Speranza et al., 2014; Notenbaert et al.,
2013) (see Section 6.2.2 and 6.2.3) and recorded during fieldwork through data collection. I also
discussed their influence on households’ sensitivity and adaptive capacity with other experts
and the farmers themselves.
Adaptive capacity was quantified based on a number of variables. For human features, I included
knowledge through the academic level of studies, including agrarian-related studies, or years of
experience. Socio-demographic variables were accounted for through age, gender and number
of family members working on the same farm. Financial status was considered through the
percentage of owned and rented land, the subsidies perceived (CAP, modernisation and
irrigation) and the number of agrarian insurances (integral, hail and others) farmers regularly
contract. Physical assets were counted, such as internet use and if they had installed modern
irrigation. Social networks referred to farmers’ participation in specific organisations, as an
important means for information exchange.
Sensitivity was measured by assessing the current state of the household and the stressors’
effect on the agro-ecological system. Indicators included the level of crops diversification, the
number of economically dependent family members, and the cultivated hectares of maize – a
crop that is more dependent on irrigation than others in the region.
The VI uses a balanced weighted average approach (Hahn et al. 2009) where each sub-
component contributes equally to the overall index, despite each major component being
comprised of a different number of sub-components. Once I had selected all the variables (sub-
components) classified by each component, I normalised them as an index: Y = (value -
min)/(max. – min.), where Y denotes an indicator of ES (Albizua et al. 2015; Hahn et al, 2009;
CHAPTER 3: CASE STUDY AND METHODS
- 57 -
Yagiz & Gokceoglu 2010). Having standardised the sub-components, the same weight was given
to each of the components:
CF= ∑ �����/∑ �����
�� (1)
CF is the IPCC-defined contributing factor (exposure, sensitivity, or adaptive capacity). Mi is the
major components index. WMi is the weight of each component, and n is the number of major
components in each contributing factor. Once exposure, sensitivity, and adaptive capacity were
calculated, the three contributing factors were combined using the following equation:
VI= (E - AC) * S (2)
The VI is the VI expressed using the IPCC vulnerability framework. E is the calculated exposure
score to the main stressors (equivalent to drought, prices and climate variability). AC is the
calculated adaptive capacity score (the weighted average of the socio-demographic, knowledge,
physical, financial, and social networks major components), and S is the calculated sensitivity
score (the weighted average of family members economically dependent, maize area and crops
diversification).
The VI was calculated twice with regard to the three main stressors, including a slightly different
selection of variables for the main components in each case depending on whether it was a
climatic or a market-related stressor (see Section 6.4 for further details). The index aggregates
all the information into a single score. Assessing the components separately allows for
understanding the relative importance of each component in relation to farmers’ vulnerability
and why some farmer groups are more or less vulnerable. Finally, I used again the Kruskal-Wallis
test to understand vulnerability differences between farmers’ groups (see last part of Section
3.3.2 above).
3.3.4. Focus group discussion
Miranda de Arga was an interesting case because it had held a non-binding referendum in June
2014 to explore farmers’ views about adopting the Itoiz-Canal de Navarra project in their
traditionally irrigated lands. It resulted in more votes opposing modern irrigation than votes in
favour. However, another voting process in December 2014 revealed that the majority was in
favour of modern irrigation transformation. By this time some owners had already sold their
lands. On 4th June 2015, I conducted a focus group discussion in the village of Miranda de Arga
to analyse the institutional changes induced by the modern irrigation project.

CHAPTER 3: CASE STUDY AND METHODS
- 58 -
The focus group was developed to complement the information gathered during the second
round of interviews. A focus group allows participants to engage in discussions and the
researcher to learn from the various views and opinions on a certain topic (Bryman 2004;
Liamputtong 2011). Participants were recruited using purposive sampling based on farmers’
profiles, which were simultaneously based on their livelihoods strategies– i.e. their land
management practices. Seven participants initially committed to the group, though ultimately
five people partook: two members of the traditional irrigation community (eventually members
of the modern irrigation community), a local environmental activist, an owner who refused to
make the transformation, and an INTIA technician who led the village’s involvement in the
concentraciones de tierras and the resulting land redistribution process.
Throughout the focus group, which lasted around 6 hours, I attempted to ensure a balance
between participants’ potential views concerning modern irrigation. I also remained cautious of
possible confrontation between participants, since there was uncertainty and tension in the
village concerning the distribution of re-classified lands across affected farmers. I considered
carefully the impact of participants various views on particular topics, and the potential
exposition of vulnerable individuals to others. I spoke with each participant in advance, to help
him or her feel more comfortable during the focus group. Additionally, I sent an email
beforehand including the program and list of participants, which allowed them to consider
issues and the opportunity to reflect on possible responses for the discussion (Barbour 2005).
As the location of a focus group can influence the discussion (Barbour 2005), I tried to find a
neutral location. Thus, the public library of Miranda de Arga was selected, as none of the
participants had differential attachment to the place. I invited a master’s student and a friend
to take notes and help facilitate the focus group, while I moderated the unfolding discussion.
Analysis of the material was very similar to the second round of interviews; I transcribed the
workshop and then coded a hard copy by hand.
3.3.5. Document analysis and participant observation
In addition to the data collected through interviews, the survey and the focus group, I collected
data from key policy documents and media concerning the case study prior, during and after the
fieldwork. These documents provided very rich information about the irrigation project’s goals,
and agricultural challenges and opportunities. Most of these documents were sourced from
online newspapers, inter-scale government websites, websites of other associations, and the
affected individuals themselves. They are cited throughout the dissertation as appropriate.
CHAPTER 3: CASE STUDY AND METHODS
- 59 -
Finally, in social science and ethnographic research, participant observation is often cited as a
complementary method to interviewing (Bryman 2004; Denscombe 2003). Ethnographies imply
researchers’ emersion in people’s lives for an extended period of time, making regular
observations about their behaviour, participating in conversations and interviewing informants
on issues which are not directly amenable to observation. Ethnographies are often used by
sociologists and social anthropologists to ascertain the specifics of social behaviour in a
particular culture (Bryman 2004: 292-294).
Informal conversations with households and observations of people’s daily activities were
documented during a five-month period. Active participation took place, primarily during one
week in December 2013. I visited different types of managed plots, including some multi-
functional organic farms, where I helped manually harvest olives. Famers described to me other
connected activities they conducted, such as rural tourism, environmental education, or natural
pollination of their plots. I had the opportunity to share meals with several of the interviewees
over the four months I was conducting the survey, allowing for informal conversations and
insight to how community households managed their natural resources, perception of future
rural development, and viewpoints on how the modern irrigation project influenced their
livelihoods.
When I participated in workshops about irrigation, I tried to engage in social activities
surrounding these events. For example, I actively participated in the annual meeting of Nueva
Cultura del Agua in May 2012, as well as a seven-day kayak experience along the Ebro River with
this group in July 2012, and other local meetings in the winter of 2013. Whenever possible, I
attended formal and informal talks ranging in topic from modern irrigation and how the reform
of the CAP affected farmers and nitrate water pollution in Navarre. I was also present at the
plenary when the concentraciones de tierras were presented to owners in the village of Larraga.
Participant observation and interviewing is critical within ethnography, initiating access to local
settings, local households and people’s lives. As noted earlier, interviews allowed me to establish
contacts with the NGO ‘La Nueva Cultura del Agua’, which allowed me to meet other social
actors and key individuals. One of the NGO members helped me find a house during the
fieldwork period, and the owner of the house then introduced me to several farmers.
Participating in farming events and talking to farmers in the village bar was interpreted as a sign
of respect and admiration for rural life and their customs, which increased farmers’ confidence
with me.

CHAPTER 3: CASE STUDY AND METHODS
- 60 -
During the first round of interviews, I contacted one of the major cooperatives, where many
area farmers are involved, ‘Cooperative of Artajona’, which also allowed for rapid access to its
members. Gaining access to farmers not enrolled in the cooperative was more difficult and time-
consuming, and only became possible through the database of certified organic farmers
published online by Navarre’s government.
Figure 3.8 summarises the research preparation and fieldwork periods, and includes detail on
the methods used, sample size, and the chapters that the resulting data inform.

CHAPTER 3: CASE STUDY AND METHODS
- 61 -
Figure 3.8 Desk-based and fieldwork periods
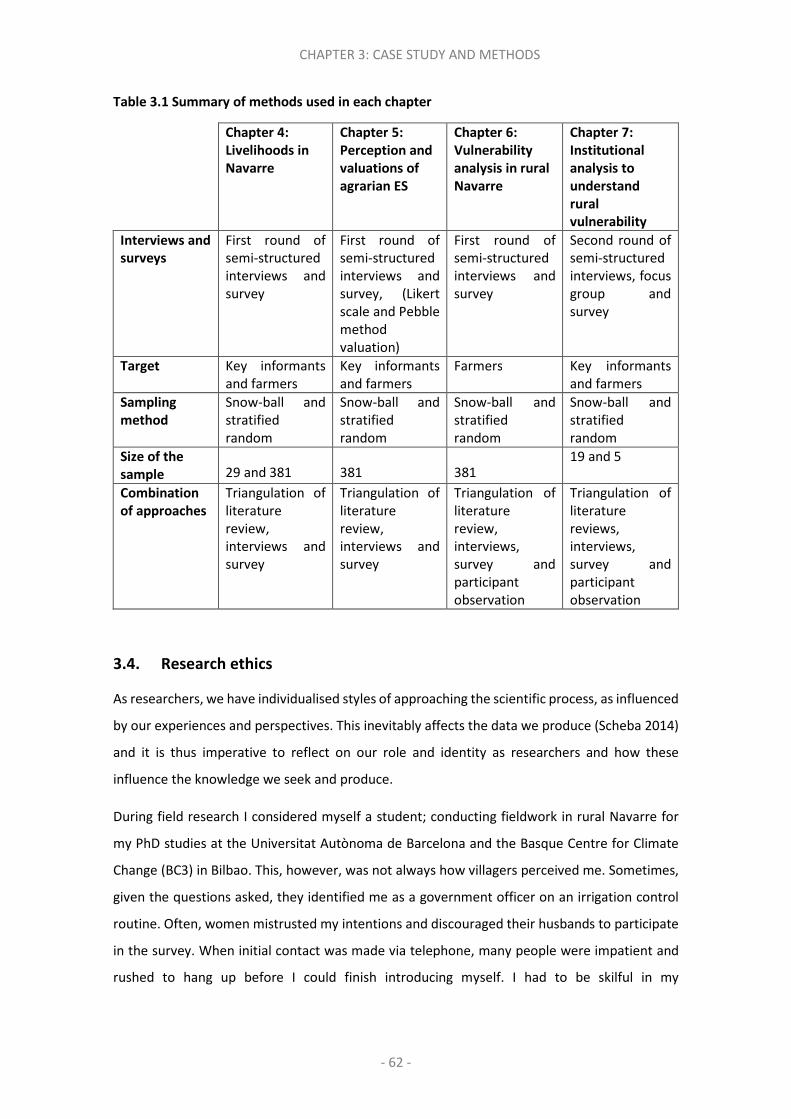
CHAPTER 3: CASE STUDY AND METHODS
- 62 -
Table 3.1 Summary of methods used in each chapter
Chapter 4:
Livelihoods in
Navarre
Chapter 5:
Perception and
valuations of
agrarian ES
Chapter 6:
Vulnerability
analysis in rural
Navarre
Chapter 7:
Institutional
analysis to
understand
rural
vulnerability
Interviews and
surveys
First round of semi-structured interviews and survey
First round of semi-structured interviews and survey, (Likert scale and Pebble method valuation)
First round of semi-structured interviews and survey
Second round of semi-structured interviews, focus group and survey
Target Key informants and farmers
Key informants and farmers
Farmers Key informants and farmers
Sampling
method
Snow-ball and stratified random
Snow-ball and stratified random
Snow-ball and stratified random
Snow-ball and stratified random
Size of the
sample 29 and 381 381 381 19 and 5
Combination
of approaches
Triangulation of literature review, interviews and survey
Triangulation of literature review, interviews and survey
Triangulation of literature review, interviews, survey and participant observation
Triangulation of literature reviews, interviews, survey and participant observation
3.4. Research ethics
As researchers, we have individualised styles of approaching the scientific process, as influenced
by our experiences and perspectives. This inevitably affects the data we produce (Scheba 2014)
and it is thus imperative to reflect on our role and identity as researchers and how these
influence the knowledge we seek and produce.
During field research I considered myself a student; conducting fieldwork in rural Navarre for
my PhD studies at the Universitat Autònoma de Barcelona and the Basque Centre for Climate
Change (BC3) in Bilbao. This, however, was not always how villagers perceived me. Sometimes,
given the questions asked, they identified me as a government officer on an irrigation control
routine. Often, women mistrusted my intentions and discouraged their husbands to participate
in the survey. When initial contact was made via telephone, many people were impatient and
rushed to hang up before I could finish introducing myself. I had to be skilful in my

CHAPTER 3: CASE STUDY AND METHODS
- 63 -
communication abilities to evade these situations, and was much easier when approaching
farmers in person.
As it was a divided society (in favour and against modern irrigation), I tried my best not to align
myself with either position, whether verbally or through my actions. For example, I did not
disclose where I was staying overnight and tried to maintain a low profile in the village. Over
time, most of the participants viewed me as a PhD student conducting research. Some of them
were willing to cooperate based on their own son or daughters’ similar experiences. After five
months visiting villagers I developed a friendship with some individuals. In most of the
workshops I participated in, some affected stakeholders were clearly positioned against
irrigation, whereas certain friends I had made were involved in local political parties, and openly
showed their affiliation. Although I attempted to remain ideologically neutral when participating
in village affairs, a few villagers may have associated me with certain political positions. I tried
to counteract this by not supporting specific parties during political discussions, by intentional
conversation, and creating relationships with people from all parties and backgrounds during
my fieldwork period.
Ethical considerations are vital to any research as the rights and interests of research
participants must be respected and protected throughout the research period (Newing et al.
2011; Scheba 2014). During fieldwork, the main ethical concerns was transparency regarding
research objectives, ensuring farmers provided informed consent, and offering a guarantee of
confidentiality and anonymity. It was also key to ensure that farmers understood they had the
right to drop out the interview or the survey at any time. I explained to each interviewee that all
information collected was to be used for my PhD studies, and that nobody else would have
access to the data. As noted earlier, it was emphasised that recording some personal data was
useful for future contact. Whenever I made the survey or conducted participant observation I
explained to villagers that they had the right to withdraw, skip questions or not participate at
all.
The fieldwork stage was my best experience during the PhD process. Getting to know rural
inhabitants’ testimonies on how modern irrigation was experienced, how it affected livelihoods,
or how rural development policies have evolved over time in Navarre was an incredibly enriching
experience. During fieldwork, one of the most difficult tasks I encountered was organising
research assistance team for survey administration. It required a lot of time in organisation,
mentorship and supervision. I also realised too late the importance of asking ‘just’ the necessary
questions to shed light on the overarching research questions. During the first few months, I

CHAPTER 3: CASE STUDY AND METHODS
- 64 -
tried to cover too much. Most interviews extended beyond what were strictly necessary, which
provided me with more knowledge but complicated data analysis. I also realised, quite late into
the process, that the survey was too long and interviewees got tired quite easily. It contained
too many qualitative questions, which were time consuming during administration, processing
and analysis.
Budget limitations and lack of awareness about possible unexpected delays made fieldwork less
pleasant than it could have been. I did not have enough time to mentally and physically recover
in between village visits, which left the research assistance team and me rather exhausted after
fieldwork. I also did not account for aspects such as the fact that much of the surveyed
population, with hearing difficulties, could be slow in understanding the interview and survey
questions, which inevitably translated into lengthier and thus more tiring conversations.
3.5. Summary
This chapter has presented the research strategy and the methods employed to answer the
research questions. The research adopts a case study approach and utilises a combination of
qualitative and quantitative methods. These methods are suitable to capture farmers’ values of
ES, and to perform the vulnerability and institutional analyses proposed in the theoretical
framework.
Semi-structured interviewing allows the researcher to involve a range of individuals and
organisations within the research process, and to obtain information related to survey design
and contextual factors relevant to interpreting the results. Semi-structured interviews are
complemented by document analysis, in both policy and project contexts, and by participant
observation at the community level. Household surveys are the core tool for analysis, and are
used to understand the types of livelihoods co-existing in the study area, how participants value
the agrarian ES, and to what extent they are vulnerable to current stressors affecting their
livelihoods. A second round of interviews and the focus group exercise allowed me to gain a
better perspective of why and how land management intensification affects rural socio-
ecological systems.
The next empirical chapters document how the process of land management intensification
induced by the modern irrigation project in the study area shapes local livelihood strategies,
influences farmers’ perceptions and values of ES, determines local vulnerability and adaptive
capacity, and results in new water management institutions that benefit some farmers more
than others.

CHAPTER 4: LIVELIHOODS IN RURAL NAVARRE
- 65 -
CHAPTER 4
“Livelivelihoods beyond income”
Fernando Hernandez Espino
4. Livelihoods in rural Navarre
4.1. Introduction
This chapter highlights and discusses farming livelihood characteristics in the case study site. It
addresses Research Question 1, i.e. What combination of capital assets is associated with particular
livelihood strategies in Navarre? The chapter examines the different means of subsistence, economic
activity and social composition of the case study households and demonstrates how farmers respond
to markets and to a new agricultural technology, i.e. modern irrigation. The chapter also highlights
how livelihood assets are connected to land use and management intensities and how such
connections mediate farmers’ agricultural strategies. Specifically, the chapter illuminates how farmers
respond to irrigation through their livelihood strategies choices.
Adding to the abundant literature on SLA (see Section 2.2), this chapter contributes to debates of how
natural, financial, man-made, human and social assets are transformed strategically by different types
of farmers and whether technological changes lead to asymmetrical environmental and social
outcomes among the existing livelihoods. I clarify the configuration of the different livelihoods present
in Zona Media and Ribera Alta of Navarre, contributing to the debates about rural development
through modernisation associated with intensive transformative processes. The data mobilised in the
chapter are largely drawn from the quantitative survey described in Section 3.3.2. These quantitative
data enable to assess numerically the differences and similarities of livelihoods characteristics within
the sample, in the case study region under transformation.
First, as Figure 4.1 illustrates, I contribute with a general description of the five assets (Section 4.2)
identified in this case study and some brief insights of the current institutions shaping access to the
assets (Section 4.3). The livelihoods strategies are analysed in Section 4.4, with a focus on land
management. Section 4.5 describes the classification of livelihoods according to land management
strategies, while the livelihood outcomes related to modern irrigation adoption are also analysed and
Section 4.6 contributes to the discussion of the existing strategies and their alignment with current
institutions promoting the modern irrigation model. Finally, in Section 4.7, some key messages are
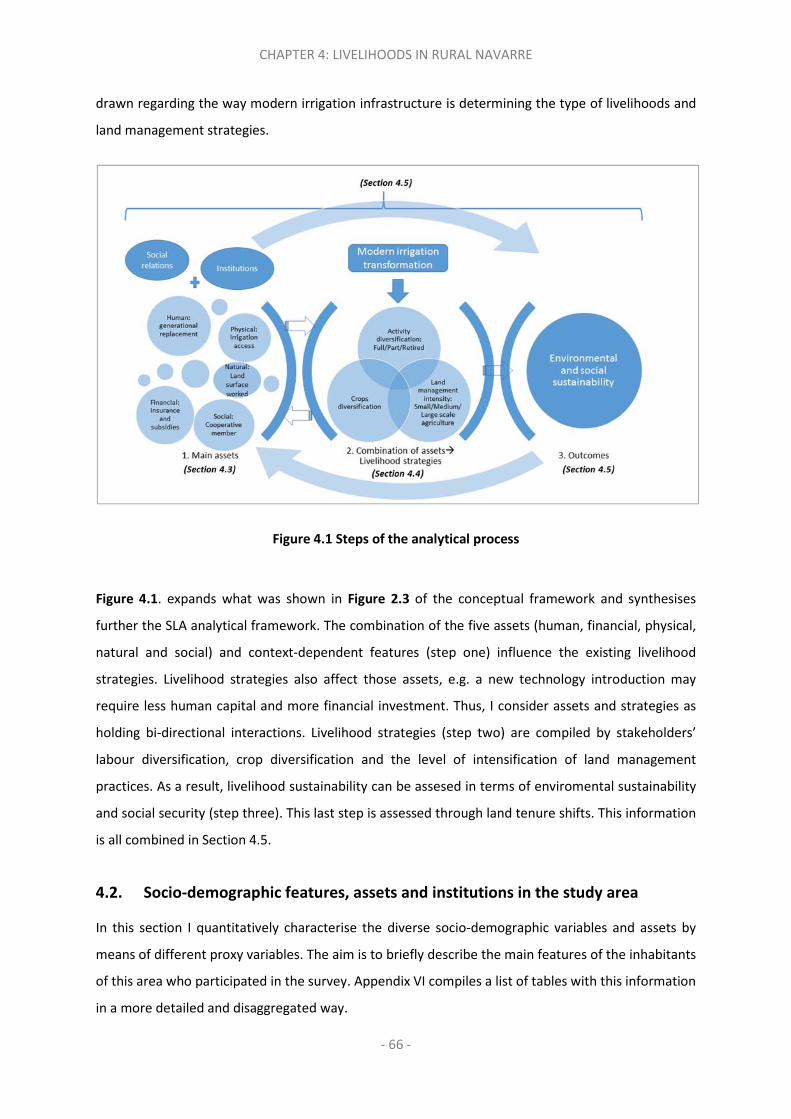
CHAPTER 4: LIVELIHOODS IN RURAL NAVARRE
- 66 -
drawn regarding the way modern irrigation infrastructure is determining the type of livelihoods and
land management strategies.
Figure 4.1 Steps of the analytical process
Figure 4.1. expands what was shown in Figure 2.3 of the conceptual framework and synthesises
further the SLA analytical framework. The combination of the five assets (human, financial, physical,
natural and social) and context-dependent features (step one) influence the existing livelihood
strategies. Livelihood strategies also affect those assets, e.g. a new technology introduction may
require less human capital and more financial investment. Thus, I consider assets and strategies as
holding bi-directional interactions. Livelihood strategies (step two) are compiled by stakeholders’
labour diversification, crop diversification and the level of intensification of land management
practices. As a result, livelihood sustainability can be assesed in terms of enviromental sustainability
and social security (step three). This last step is assessed through land tenure shifts. This information
is all combined in Section 4.5.
4.2. Socio-demographic features, assets and institutions in the study area
In this section I quantitatively characterise the diverse socio-demographic variables and assets by
means of different proxy variables. The aim is to briefly describe the main features of the inhabitants
of this area who participated in the survey. Appendix VI compiles a list of tables with this information
in a more detailed and disaggregated way.

CHAPTER 4: LIVELIHOODS IN RURAL NAVARRE
- 67 -
4.2.1. Socio-demographic characteristics
Before describing the five livelihood assets (human, financial, physical, social and natural), I briefly
characterise some socio-demographic features relevant for livelihoods development. Age, gender and
residence of farmers are aspects that may strongly influence the capacity of agents to put their assets
into action (Swyngedouw, 2009). For example, age and gender strongly influence farmers’
participation in social networks (Antwi-Agyei et al., 2013; Campos, et al., 2014). Location of the village
may also determine farmers’ alternative income sources as being closer to large cities or towns with
factories can present higher employment prospects in other sectors. The majority of the farmers in
the area were older (66% were older than 55 years) men (95%), similarly distributed over the whole
case study area; they belonged proportionally to the northern, mid and southern areas of Ribera Alta
and Zona Media of Navarre.24 Table 4.1 summarises the variables used to describe the socio-
demographic features and categorises the five capital assets measured in the case study.
Table 4.1 Socio-demographic and capital assets
Socio-demographic Description
Age Farmers’ years
Gender Whether the house-head is male or female
Residence location Village respondents belong to
Capital assets
Human Knowledge Level of studies
Work experience Years farming
Total number of members in the household
Number of people living in the same household
Generational replacement
Whether sons or daughter will keep farming in the future
Number of member working in the farm
Number of people belonging to and working in the farm
Number of members economically dependent
Number of people in the household who depend on the head in economic terms
Number of member who had emigrated
Number of people who used to live in the household but moved to another country / city
Financial Subsidies Economic aids
CAP European subsidies given per land area
Modernisation Navarre government subsidy to modernise the farms
Irrigation Navarre government subsidy to install modern irrigation
CUMA Cooperative to share agrarian machinery
24 This is due to a methodological construct already explained in chapter 3, Section 3.3.4 ‘Household survey design’.

CHAPTER 4: LIVELIHOODS IN RURAL NAVARRE
- 68 -
Cooperative Organisation to store crops, sell them, get advice and buy agrarian inputs at a better price
Insurance Coverage under a contract in which one party agrees to compensate another for a loss
Integral Insurance that covers a variety of events such as climatic stressors, animals attack etc.
Hail Insurance that covers hail damages
Others Other kind of insurances
Financial aid from family / friends Borrow money from family or friends
Physical Irrigation access Whether farmers can irrigate (traditional, modern or any other way)
Modern irrigation installation Whether farmers have adopted modern irrigation in their lands
Machinery Whether farmers own or rent machinery
Internet Whether farmers access and use Internet with agrarian aims
Social Cooperatives Whether farmers participate in agrarian cooperatives
Agrarian workers’ union Whether farmers participate in agrarian syndicates
INTIA advice use Whether farmers use INTIA’s advice services
Natural Land Owned Rented
Ownership of land Payment made to the owner of land for the right to use it
Rural livelihood strategies
Time investment
Farmer profile Whether farmers employ full tim to farmng or whether they have other income sources in the household
Commercialising type
Work for agro-industry Whether farmers access this kinds of agro-contracts
Land management
Fertilisation type Type of fertiliser used: organic, mineral
Irrigation system Whether they irrigate crops or not
Type of crop Hectares of each crop
Social outcomes
Buy more lands after irrigation Land purchasing outcomes
Rent more lands after irrigation
4.2.2. Human capital
Regarding education, most farmers in the case study (63%) held basic education. Of these, 50% were
full time farmers, while 30% were retired. Thirty-five percent of the farmers had coursed higher
education degrees, 16% in agrarian related studies. Work experience also contributes to agrarian
knowledge. In this regard, 40% of the farmers had been working in the sector for over 30 years.

CHAPTER 4: LIVELIHOODS IN RURAL NAVARRE
- 69 -
I also considered the number of skilled workers in the farm. This is influenced by the dependency ratio
and their health status (Hahn et al., 2009; Notenbaert et al., 2013; Ifejika Speranza et al., 2014). I found
that 55% of the farmers had at least one family member who was economically dependent on the
household. Ten percent of the respondents stated that a member of their family had migrated to work
outside the country. In line with other studies (Gómez-Limón et al. 2009), the case study sites are
characterised by low generational replacement rates in agriculture; farmers may not be able to
depend on their sons and/or daughters to continue with farming activities. Although 69% of families
surveyed had between two and four members in the household, 64% reported they could not depend
on generational replacement, 21% reported their sons/daughters would continue farming and about
15% did not know what their children would choose to do in the future. This follow-up of their activity
strongly determines households’ rural strategies such as the type of financial inversions made.
4.2.3. Financial capital
In Navarre, as in the rest of Europe, agricultural subsidies are very important for the maintenance of
agrarian livelihoods. Eighty-two percent of survey farmers reported receiving Common Agricultural
Policy (CAP) subsidies. Most of the farmers were not aware of receiving FEAGA or FEADER25 funds,
only that they received money per farmed hectare. However, they did recognise whether they
received subsidies aimed at modernising their farm or adopting irrigation, which are managed and
disbursed by Navarre’s government. These subsidies were accessed by 29% and 48%, respectively.
Some cooperatives also offered economic aid, similar to those offered by banks, but often with better
interest rates (approximately 1.4% in Larraga sector (II.2)). 26 However, just 2% of the farmers stated
access to them. Subsidies provided to the cooperatives in order to encourage machinery-sharing
(CUMAs27) and those for young farmers28 were received by 5% of the surveyed households. Four
percent of the farmers also reported other less common subsidies.
Hail and integral insurances29 were the most common agricultural insurances contracted in the study
area. The integral insurance covered climatic problems such as drought, flood or hail, as well as natural
25 FEAGA are the Spanish acronyms for Fondo Europeo de Garantía Agraria, Agrarian Insurance European Fund. FEAGA’s goal is guaranteeing crops and livestock products and farmers’ complementary incomes from the market. FEADER are the Spanish acronyms for Fondo Europeo Agrícola de Desarrollo Rural, Rural Development Agrarian European Funds. FEADER’s objective is preserving the environment meanwhile agrarian economy diversification (Sanjuán and others, 2013). The name of the subsidies have been changing over the time with the multiple CAP reforms but those terms were shown as understandable in the survey. 26 Calculation determined from personal communication of the credit in Larraga sector. 27 Spanish acronyms stand for Cooperativas de utilización de maquinaria agrícola (CUMA). 28 Young farmers’ subsidies are financial aids given to those who install in the sector for the first time. 29 Integral insurance cover climatic and other kind of hazards such as animal attacks etc.
CHAPTER 4: LIVELIHOODS IN RURAL NAVARRE
- 70 -
fires and damage caused by wild fauna (MINECO, 2010). The latter was contracted by 35% of the
interviewees, while 42% were covered only by hail insurance. The remaining did not contract any
insurance. Overlaps occurred when some stakeholders contracted both insurances. Finally, when
farmers were asked if they would approach other family members (outside of the household) or
friends for funding in case of need, 82% indicated reluctance in doing so. Responses varied broadly
from ‘I would not ask for it’ or ‘I don’t trust they would give it to me’.
4.2.4. Physical (man-made) capital
Survey results show that 50% of the farmers already had irrigation systems in place prior to the most
recently deployed system based on dripping and aspersion systems. In the past, farmers had relied on
traditional irrigation infrastructure (old canals from which fields were flooded and irrigated by gravity),
as well as on water wells and ponds (Baldock et al., 2000; Appendix V).
Sixty-five percent of the surveyed farmers reported they had installed a modern irrigation system.
32% reported that they had placed between 10 and 50 hectares under the new irrigation system. This
was followed by farmers (25%) working small-irrigated lands (0-1 hectares). However, such small
farming plots may indicate two possible situations: respondents may have joined neighbours to keep
their land under modern irrigation, or they kept traditional irrigation systems. Among the 65% who
had installed modern irrigation, 35% stated they had yet to pay for the connection of the plots to the
main drainage infrastructure (such as plot piping system or sprinkler installation). Many of them stated
that they were not going to install it in the future. This means they were paying for the possibility of
accessing modern irrigation, even though they did not intend to use it. They explained they preferred
to pay and preserve their lands rather than being relocated to rainfed lands.
Sixty-two percent of those who adopted the modern irrigation technology relied on a sprinkling
system, 50% on drip, and 25% on other types of technology. Citing more than 100% results refers to
farmers who relied on more than one type of irrigation scheme. From those who had installed the
new irrigation infrastructure, 6% had to share the irrigation water tank with another neighbour
(typically no more than one). In doing so, they shared water as well as investment and maintenance
costs.
The level of agricultural mechanisation was high among the surveyed households. It was common for
tractors to be used in the area for ploughing or harrowing, although not all farmers owned the
required machinery. Forty-three percent of the survey respondents rented at least the harvester.
Finally, 69% reported having access to Internet, but only half used it to get information about agrarian
issues.

CHAPTER 4: LIVELIHOODS IN RURAL NAVARRE
- 71 -
4.2.5. Social capital
Regarding farmers’ reliance on social networks in learning additional information or techniques on
agriculture and related issues, 69% of respondents stated a high or very high grade of agrarian
information shared with neighbours or friends. The most remarkable social networks found in the
study area were the cooperatives. The influence they have over villagers’ agrarian practices and
extended social networks was evident during fieldwork. Participation at the cooperatives often
influenced communication between neighbours, allowing them to be cognisant of others’ situations
and choices.
There are several types of cooperatives in the study area: (i) those that store crops and sell seeds,
fertilisers and other goods to both farmers and other ‘working cooperatives’, and (ii) ‘working
cooperatives’, which function similar to enterprises: there are employees who work the members’
lands and bring crops to traditional cooperatives to be stored and sold. These types of cooperatives
were perceived as a solution to the increasing number of older farm-owners with no generational
replacement, and who were unwilling to sell their lands. With regard to cooperatives partnership, 85%
of surveyed individuals belonged to one or more cooperative, but only 34% stated active participation
within the cooperatives. Finally, 56% of the farmers belonged to an agrarian workers’ union and only
8% reported contributing to the union in an active way (in a high or very high degree), e. g.
participating in management activities and political decision-making. Eighty-five percent were
members of UAGN30 while the remainder were primarily EHNE31 syndicates.
4.2.6. Private property that allows control over natural capital
Ninety percent of the farmers owned at least part of their cultivated lands; 30% were full owners,
while 60% reported that they partially owned the land they cultivated. Thirty-four percent fully owned
between ten and fifty hectares, followed by farmers owning less than one hectare. These data on fully
owned and/or managed landholdings and the interviews confirm that Navarre’s farmers typically
inherit land. Twenty-five percent rented between 10 and 50 hectares of land, while 32% rented less
than one hectare. The extension of shared land was typically around 44% and corresponded with plots
smaller than one hectare. Rented land was often reported as communal land. Part time farmers and
retired farmers were those working the smallest plots, while full time farmers and farm workers
worked larger farms (over ten hectares in 80% of cases).
30 UAGN Spanish acronyms stand for Union de Agricultores y Ganaderos de Navarra; farmers and ranchers from Navarre Union. 31 EHNE Basque acronyms stand for Euskal Herriko Nekazarien Elkartasuna; farmers from the Basque Country Union.

CHAPTER 4: LIVELIHOODS IN RURAL NAVARRE
- 72 -
4.3. Institutions regulating irrigation water and communal land
As indicated in Section 2.5, institutions regulate the access to assets within the SLA framework, which
clarifies the differences in farmers decision-making when securing their assets (Blaikie, 1985; De Haan
and Zoomers, 2005).
Institutions are mechanisms by which humans attempt to shape the incentives and constraints
governing their interactions with each other and the natural word (Ostrom, 2005). Institutions are
therefore social practices based on ‘the rules of the game’, which is often referred to throughout the
literature; but also include common discourses to understand and address the issues at stake, agree
with the appropriate behaviour and routine activities to live in community (Young, 2002a).
In this case, I briefly describe the institutions to access communal lands and the private use of public
good - water for irrigation. Renting communal land is a common strategy among Navarre’s farmers.
Access to such land differed depending on the village’s location. In general, applicants must be
registered in the city council for a certain period and must prove they can work the land (through
access to machinery) (Personal communication by farmer #SI1-2). Once they apply for the land, the
council distributes sets of plots of varying dimensions (hectares) and for a certain amount of years
that varies depending on whether it is rainfed land or an area with access to modern irrigation. If there
is land surplus after the villagers’ applications, the council normally establishes an auction among
neighbours, where anyone may participate.
Modern irrigation transformation was often reported as an important factor to explain the changes in
common land availability and the institutions regulating the correspondent access. Village councils
were in charge of land attribution. Councils had greater economic aid than farmers for the installation
of modern irrigation, so neighbours living in municipalities with large communal landholdings and
whose council had invested in the transformation had greater chances to access irrigated lands in the
modern system. However, this access was not equal for all the villages since a higher share of land
area, as well as larger plots, were attributed to young farmers and full time farmers. The Councils’
investments in modern irrigation had also translated into an increase in the rent price and an
extension of the time period of the assigned communal lands to the same applicants so that rotation
of communal lands among villagers was lower.
In the traditional irrigation system, water for irrigation was accessed according to whose lands were
located in the flood area, i.e. the water concession holder owned the land to which the water was
allocated to, which meant that the irrigation communities had therefore a collective use right (Water
Law, 2001). There were also some communal lands of the council. The river Ebro watershed
confederation provided a given amount of water that was controlled through turns, which irrigators

CHAPTER 4: LIVELIHOODS IN RURAL NAVARRE
- 73 -
had to respect, as not all of them could irrigate simultaneously. These alternations typically began
uphill and passed downward.
With the modern irrigation system, a water concession was given to a concessionarie enterprise, after
the approval of at least half of the irrigators owning the correspondent land.32 Sprinkling or dripping
automatic systems were generally installed and irrigation could be programmed so that land did not
require taking turns, at least during the time in which the survey was performed. Access was
dependent on whether they were willing to invest in installing the new system on their plots. This in
turn, was sometimes dependent on the extension of land available, since there was a minimum of five
hectares to access a hydrant. Thus, financial assets were crucial to invest in buying or renting more
lands based on their livelihood strategies. In at least seven villages (Larraga, Berbinzana, Miranda de
Arga, Tafalla, Beire, Satacara, Murillo del Fruto (Personal communication by farmer #SI1-13,
representing AguaCanal) the adoption of modern irrigation presumed the removal of traditional
system access. There may be more villages, though it is still uncertain how the transformation will be
made in the extension of the canal.
4.4. Livelihood strategies in Navarre case study
Based on Zoomers’ (1999) original work, De Haan and Zoomers (2005) distinguish four categories of
livelihood strategies: accumulation, consolidation, compensatory and security. Accumulation
strategies involve establishing a minimum resource base and preparing for future expansion. Such
strategies are usually guided by a long-term strategic view of future gaining income (De Haan and
Zoomers, 2005). They often include migration, land acquisition and labour recruitment. After
achieving a certain level of desired affluence, households might apply consolidation strategies, which
involve investments to stabilise the household’s wellbeing and to improve the quality of life in the
short-term. In this scenario, households are typically well-established, with surplus to invest.
Compensatory strategies, in turn, are executed by farmers coping with a sudden shock, or unexpected
impact of a stressor, and poor farmers dealing with managing a structural shortage of land or labour
power. These farmers strive to maintain their subsistence through migration, economising, selling
capitals, and borrowing and trading, often while using the aid of family and social networks. Finally,
32In the case of the enlargement of the irrigation area, the concession was initially given to Navarre governement who later transferred the concession to the general irrigator community when this was not still representative of the owners of the lands transformed. Only a posteriori was this general community representative of the owners holding more than the half of the irrigated area. There is an appeal initiated because of this initial Water Law default.

CHAPTER 4: LIVELIHOODS IN RURAL NAVARRE
- 74 -
security strategies include diversification by multiple cropping and multi-tasking, exploring non-
agricultural opportunities, sharecropping and stockpiling.
During the survey, I asked direct questions about whether the farmers diversified their labour
throughout various activities, specific questions characterising their land management intensity, and
also market strategies pursued by Navarre rural inhabitants. Regarding labour diversification, only
10% of the farmers were registered as full time farmers; for over half of farmers (sixty 60%) agriculture
was not their only income source in the household. Some of them reported their partner also worked
elsewhere. In other cases, (28%) farmers combined agriculture with other jobs such as industry or
services. Elderly farmers (17%) reported also receiving pension payment, while others indicated a
combination of incomes.
Participants reported that rainfed cereal and irrigated maize occupied surfaces between 500 and 1000
hectares, as maize extensions require larger rotation areas than other cereals. The survey revealed
that irrigated maize was the most widespread crop after the irrigation conversion. Figure 3.5 shows a
distinctive increase in the area under maize cultivation from 2006, when the conversion to irrigation
began. The majority of respondents recognised that this crop, in addition to requiring large amounts
of water, demands high quantities of fertilisers and pesticides. Vineyards and winter-wheat benefited
in particular years when certain policies promoted those crops33 and are also influenced by the
increases and decreases over the time as a consequence of market price fluctuations. Cereal crops are
predominant under rainfed systems (72%), vineyards can be found in both systems in similar
proportions (15%) while maize is almost always irrigated via modern systems, as grown by 53% of the
respondents. Other crops, from vegetables to olive trees, are generally grown under irrigated systems.
The conventional compound of fertilisation (mineral nitrogen, phosphorus and potassium (NPK)) was
predominant under irrigated systems, followed by a mixed fertilisation using both conventional and
organic (including slurry and sludge) fertilisers. Under rainfed systems, conventional fertilisation
remained predominant, although organic fertilisers were used more often than in irrigated systems.
For both irrigated and rainfed systems, rotations of winter-wheat and barley were exposed to
conventional fertilisation two times more frequently than mixed fertilisation, and twenty times more
often than the organic fertilised fields. A similar situation occurred with vineyards and maize crops,
33 For instance, the Spanish Government promoted wine production in 2008 via the Real Decreto 1244 /2008,
de 18 de julio, por el que se regula el potencial de producción vitícola. Art. 19. Consulted in April 2015 at <http://www.magrama.gob.es/es/agricultura/temas/regulacion-de-los-mercados/real-decreto-1244-2008-consolidado_tcm7-321955.pdf>.
CHAPTER 4: LIVELIHOODS IN RURAL NAVARRE
- 75 -
though vineyards were much less fertilised and the difference between conventional and mixed
fertilisation was not as large.
Fourteen percent of the interviewees reported working for agro-industry. Most farmers (76%) used
cooperatives to commercialise their crops, whereas 24% made direct sells. From those who directly
sold to domestic consumers, half sold between 0-25 % of their production and the other half sold
more than 75% of their products.
4.5. Linking capital assets, livelihood strategies and livelihood outcomes
This section combines the descriptive information provided in previous sections to classify existing
livelihoods. This is developed through the performance of a Hierarchical Cluster Analysis (HCA) (see
next Section 4.5.1 and an explanation of this test in Section 3.3.2.2), which allowed me to identify four
distinctive groups of farmers and owners who deliver different land management choices.
The correlation of the resulting groups with the described assets (see following Section 4.5.2) allows
describing the clusters in socio-demographic terms. This classification recognises differential
livelihoods based on tangible, classifiable and quite stable variables, which in turn allow decision-
makers to foresee how rural policy should be oriented (Allison and Ellis, 2001; Eakin and Luers, 2006).
For instance, the approach and terminology of a given policy may differ depending on its targeted
demographic: either conventional farmers with a clear market-oriented production or elderly retired
farmers holding small-scale subsistence farming. This may be considered when drafting differential
policies or a policy that accounts for the multiple rural livelihoods co-existing within a given context.
Classifications allow researchers to extract information about how assets are associated to each other,
when accessing one type of capital where another capital is typically accessible by stakeholders. These
combinations grant possibilities that create different livelihoods, and allow research to then identify
which types of capitals are normally related.
4.5.1. Typologies of livelihoods according to land management
As indicated in Section 3.3.2.2 a multiple correspondence analysis (MCA) was developed across land
management variables to make the information more workable, and then a hierarchical cluster
analysis (HCA) was applied to the factors obtained. HCA provides a convenient, intuitive method to
identify distinct groupings that seem meaningful in interpreting different land management strategies
in the rural Zona Media and Ribera Alta of Navarre.

CHAPTER 4: LIVELIHOODS IN RURAL NAVARRE
- 76 -
Table 4.2 contains information about class, mode, p-value and v-test, and allow the interpretation of
the performed HCA. To understand HCA results, I first selected only the variables with a p-value lower
than 0.05 (less than 5%), as per variables in
Table 4.2 This means that the categories within a given variable were significantly different among the
livelihoods in 95% of the cases. In this way, each cluster is represented by some variables that are
significantly different across livelihoods. For example, if we look at the first cluster and the first row
of the
Table 4.2, we can infer that the first cluster, small-scale diversified farmers, is linked to the category
of not having irrigated maize. This can be explained by looking at the value of Cla/Mod, which reveals
that 65% of farmers who have not irrigated maize belong to the cluster of small-scale diversified
farmers. Furthermore, the Mod/Cla indicates that the 92% of the farmers in this cluster do not have
irrigated maize. Thus, this information explains that the farmers not holding irrigated maize are
overrepresented in this cluster.
Table 4.2 Characterisation of the clusters regarding farmers’ land use management (N=364)
Key variables to characterise clusters Cla/Mod Mod/Cla p-value v-test
Conventionally fertilised irrigated maize (No) 64.80 92.80 0.00 12.72
Conventionally fertilised irrigated cereal (No) 75.00 76.80 0.00 12.11
Irrigated maize (0 Ha) 64.50 87.20 0.00 11.66
Rainfed cereal (0 Ha 74.51 60.80 0.00 9.94
Irrigated ‘others’ (0-5 Ha) 69.51 45.60 0.00 7.42
Irrigated cereal (0 Ha) 47.23 88.80 0.00 7.33
Conventionally fertilised and irrigated ‘others’ (Yes) 64.20 39.69 0.00 5.86
Organic fertilised rainfed cereal 100.00 68.18 0.00 9.56
Organic fertilised rainfed vineyard 100.00 40.91 0.00 7.05
Rainfed vineyard (0-5 Ha) 23.53 36.36 0.00 3.57
Organic fertilised irrigated maize 50.00 18.18 0.00 3.42
Organic fertilised irrigated ‘others’ 23.08 27.27 0.00 2.98
Rainfed vineyard (>5 Ha) 23.81 22.73 0.01 2.74
Mixed fertilised rainfed cereal 83.05 56.98 0.00 10.81
Mixed fertilised irrigated maize 67.95 61.63 0.00 9.71
Rainfed cereal (75 Ha) 60.61 46.51 0.00 7.23
Irrigated maize (>50Ha) 63.33 22.09 0.00 4.81
Conventionally fertilised irrigated maize 81.82 61.83 0.00 11.11
Conventionally fertilised rainfed cereal 64.20 79.39 0.00 10.21
Conventionally fertilised irrigated cereal 85.71 50.38 0.00 10.18
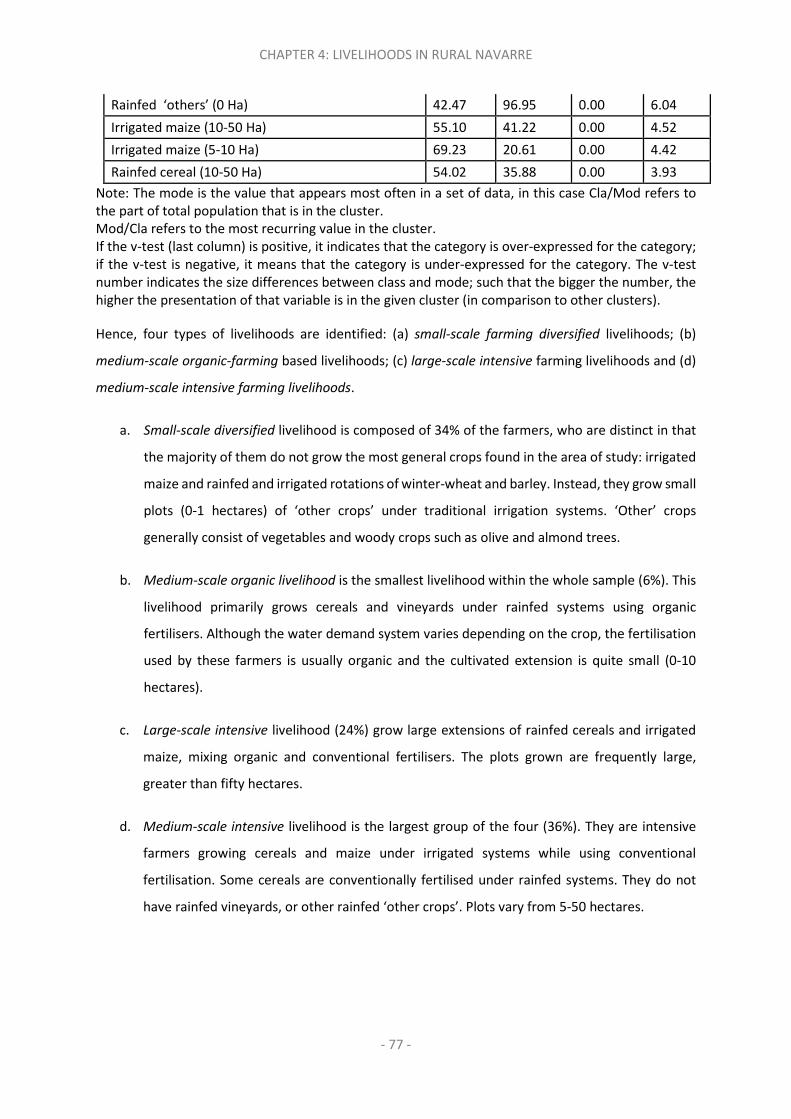
CHAPTER 4: LIVELIHOODS IN RURAL NAVARRE
- 77 -
Rainfed ‘others’ (0 Ha) 42.47 96.95 0.00 6.04
Irrigated maize (10-50 Ha) 55.10 41.22 0.00 4.52
Irrigated maize (5-10 Ha) 69.23 20.61 0.00 4.42
Rainfed cereal (10-50 Ha) 54.02 35.88 0.00 3.93
Note: The mode is the value that appears most often in a set of data, in this case Cla/Mod refers to the part of total population that is in the cluster. Mod/Cla refers to the most recurring value in the cluster. If the v-test (last column) is positive, it indicates that the category is over-expressed for the category; if the v-test is negative, it means that the category is under-expressed for the category. The v-test number indicates the size differences between class and mode; such that the bigger the number, the higher the presentation of that variable is in the given cluster (in comparison to other clusters).
Hence, four types of livelihoods are identified: (a) small-scale farming diversified livelihoods; (b)
medium-scale organic-farming based livelihoods; (c) large-scale intensive farming livelihoods and (d)
medium-scale intensive farming livelihoods.
a. Small-scale diversified livelihood is composed of 34% of the farmers, who are distinct in that
the majority of them do not grow the most general crops found in the area of study: irrigated
maize and rainfed and irrigated rotations of winter-wheat and barley. Instead, they grow small
plots (0-1 hectares) of ‘other crops’ under traditional irrigation systems. ‘Other’ crops
generally consist of vegetables and woody crops such as olive and almond trees.
b. Medium-scale organic livelihood is the smallest livelihood within the whole sample (6%). This
livelihood primarily grows cereals and vineyards under rainfed systems using organic
fertilisers. Although the water demand system varies depending on the crop, the fertilisation
used by these farmers is usually organic and the cultivated extension is quite small (0-10
hectares).
c. Large-scale intensive livelihood (24%) grow large extensions of rainfed cereals and irrigated
maize, mixing organic and conventional fertilisers. The plots grown are frequently large,
greater than fifty hectares.
d. Medium-scale intensive livelihood is the largest group of the four (36%). They are intensive
farmers growing cereals and maize under irrigated systems while using conventional
fertilisation. Some cereals are conventionally fertilised under rainfed systems. They do not
have rainfed vineyards, or other rainfed ‘other crops’. Plots vary from 5-50 hectares.

CHAPTER 4: LIVELIHOODS IN RURAL NAVARRE
- 78 -
4.5.2. Socio-demographic characterisation of farmers’ livelihoods in Navarre
Following farmers’ livelihoods are described arrending to the results of Sections 4.2, 4.3 and 4.4. I
performed a chi-square test, when both compared variables (the livelihood typology and the socio-
demographic variable) were categorical; only those that are significantly different among the
livelihoods are explained in Appendix VI. There, the socio-demographic features, assets, other pursued
strategies and outcomes of modern irrigation that are significantly different among the existing
livelihoods (p-value < 0.05) are presented.
Small-scale diversified farmers can be grouped as they are the most different ones with respect to
others farmers in the case study area. This group of farmers has the lowest level for all the categories
assessed, with the exception of age, as this group has the largest number of older individuals in
comparison to the other livelihoods. Figure 4.2 displays all the livelihoods and their socio-demographic
features. In this figure, small-scale diversified farmers are represented by one ‘petal’ of the flower
diagram- only the 'petal' representing age is present in the case of small-scale diversified farmers
group. This is because all the rest of the categories are zero when compared to the rest of the farmer
livelihood groups. Petals show the relative valuation with values scaled between zero and one.
The small-scale diversified group of farmers is characterised by older owners (60% are older than
sixty-five years), including part time farmers and retired farmers who still work their own lands. Thus,
their income is not solely derived from agriculture but also from retirement subsidies or other funding
sources. These farmers are found predominately in the northern area. They have no agrarian studies
and low or non-existent participation in cooperatives or syndicates. Female-headed households are
also represented in this group. This type of farmers do not stand out for having high financial
investments, since it is atypical for these individuals to contract agrarian insurances (approximately
80% did not). They do not receive access to financial aid through subsidies (only 30% received CAP and
88% do not gain access to modernisation/irrigation subsidies in comparison to the rest of the groups).
They do not have access to credit loans.
This group of farmers holds small plots (0-1 hectares) and work their own land (highest percentage of
full ownership) under traditional irrigated systems, since most (approximately 60%) reported not
having installed modern irrigation. Small-scale diversified farmers do not generally seek technical
advice (from INTIA) for land management and do not work for the agro-industry. After the modern
irrigation transformation, they did not acquire new lands. I can also distinguish two types of farmers:
‘active farmers’, who still work their land despite being retired, and ‘passive farmers’ who have left
their lands to work with cooperatives.

CHAPTER 4: LIVELIHOODS IN RURAL NAVARRE
- 79 -
The medium-scale intensive group of farmers encompasses younger farmers fully dedicated to
agriculture and with substantial financial and social assets. Their widespread participation in
cooperatives and syndicates (>60% held a high or very high participation) has helped these farmers to
access subsidies (around 95% accessed CAP subsidies and 74% received irrigation subsidy).
Additionally, this group of farmers has the highest level (60%) of agrarian insurance, and also the
highest rate of access to bank credit for agrarian development projects (greater than 60% of
stakeholders). During the survey, these medium-scale intensive farmers demonstrated frequent
contact with INTIA technical officers to receive information about land management related topics.
They acknowledged that decisions regarding land fertilisation, seeds and irrigation were highly
influenced by this organisation.
Farmers in this group are partial owners of large land properties (greater than fifty hectares), and 83%
have installed modern irrigation infrastructure. Most of them are full time farmers, and 20% of them
work for agro-industry (the highest rate compared with the rest of groups). These farmers benefit
from irrigation in terms of accessing more land through buying or renting. This is also the largest group
in terms of crop diversification, as 65% have diversified their crops’ portfolio.
For this farmer group age, gender and access to land facilitate their opportunities to integrate within
agrarian cooperatives and syndicates, whereas a high level of formal education enables them to utilise
those features in a more productive way. Participating in agrarian cooperatives appears to be a
secondary advantage obtained through a combination of human and natural assets. Thus, intensive
farmers seem to use their primary assets (human and natural) to gain access to social assets
(syndicates and cooperatives), which ultimately increases their access to financial (subsidies), and
physical (modern irrigation installation) assets, as well as to their natural assets (enlargement of their
cultivated lands).
The medium-scale rainfed organic group of farmers is characterised by young to medium aged
farmers (70% around 35-55 years) who hold agrarian studies (22%) and substantial financial assets.
Medium-scale rainfed organic farmers do not connect to cooperatives and farming unions as much as
intensive farmers do (around 45% do not participate or do so in a limited way). Farmers’ technical
advice acquired from INTIA is also lower when compared to intensive farmers. Their expenses on
agrarian insurances are on average lower compared to the other groups, while this group has access
to the highest rate of subsidies: primarily irrigation (77%) and modernisation subsidies (55%).
Although most of the organic rainfed winegrowers and cereal growers belong to this group, there are
also farmers who fertilise their crops in an organic way. They are characterised by holding lands
between 10-50 hectares under partial ownership. Fifty percent of these farmers have accessed bank

CHAPTER 4: LIVELIHOODS IN RURAL NAVARRE
- 80 -
credit for agrarian purposes. This group’s features are similar to the most intensive farmers in terms
of gender, age and human assets. Specifically, holding agrarian studies is highlighted since those with
agrarian studies are characterised by holding extreme opposing land management strategies, i.e. they
orient their management towards high intensive practices or focus on organic fertilisation and low
levels of water demanding crops.
The majority of households in this group have opted for an industrial agriculture model. However, a
small number of them have opted for an alternative organic model. Personal values, entrepreneurial
potential, labour diversification and land tenure availability influence farmers to undertake large-scale
crop production of intensive farming or small-scale but more quality focused approach of organic
farming. These farmers use their human assets to diversify their labour and to develop a land
management strategy that is not as broadly supported by existing local and regional organisations.
The low number of farmers observed in this group may reflect the difficulty of going against the
mainstream agricultural model in the area, which is even more difficult under the current
transformation process and its cross-scale ecological effects (e.g. cross-border pollution from
pesticides in intensively managed plots). Farmers’ lack of interest in existing agrarian cooperatives can
be explained by the fact that most cereal cooperatives do not differentiate between organic crops and
conventionally fertilised crops, among others, so that organic farmers reject to mix their yield with
the rest. Moreover, the advantages offered by cooperatives in terms of accessing fertilisers at
competitive prices, for example, do not fit organic farmers’ necessities. The case of winegrowers is
however different as their cooperatives account for ‘ecologically certified’ products.
The large-scale intensive group of farmers has similar characteristics to the medium-scale intensive
group, but involves some older and retired farmers too. Most of these individuals labour 10-50
hectares of arable land, and 55% of this group of farmers have diversified their crops. The large-scale
intensive livelihoods are mostly located in the southern area of Ribera Media. The geographical
distance to the capital seems to have encouraged this type of farmers to engage in more intensive-
oriented agrarian practices and ultimately more market-oriented agriculture than farmers belonging
to small-scale diversified livelihoods.
This group shares a similar livelihood, which characterised by substantial land renting and acquisition,
particularly in areas where modern irrigation has been adopted. They have a lower level of formal
education and their participation in cooperative and syndicates also differs in comparison to medium-
scale intensive farmers. Their participation in cooperatives is very high (60%) whereas in syndicates is
lower (40%), and most rely on INTIA’s advice. However, farmers’ access to financial assets such as

CHAPTER 4: LIVELIHOODS IN RURAL NAVARRE
- 81 -
bank credit and some insurance, although lower, is similar to medium-scale intensive intensive
farmers, with 42% having access to bank credit and around 95% to CAP subsidies.
Livelihood outcomes34 are assessed through resultant asymmetrical livelihood strategies35, where
proxies such as income stability or income level are used to assess livelihoods sustainability. Although
uncommon, some authors have also used crops diversification and land tenure shifts as indicators of
rural livelihoods feasibility (Gómez-Baggethun et al., 2012; Kaye-Zwiebel and King, 2014).
In this research, I identify accumulating lands in the form of land rents or purchases as a function of
livelihoods persistence over time, as land access is a vital asset in the configuration of rural livelihoods.
I concluded this after performing the first round of interviews, which provided insights to identify
these critical indicators when pursuing a sustainable strategy. Modern irrigation implementation is
justified as a means to reach crops diversification (up to 56 new products (INTIA, 2015)) and greater
extensions of cultivated lands that presumably increase the income level and its stability. By assessing
those indicators, I am also evaluating those assets in an indirect way. However, in the survey only 51%
of the surveyed farmers reported an increase in the number of crops. Specifically, 30% had added
three new crops, while 50% had increased just in one or two new crops.
Regarding land tenure shifts among rural inhabitants in this zone, I found that 34% of the respondents
have bought new lands in the transformed area. The majority of those (26%) had bought between two
and five hectares of irrigated lands. Nine percent of the respondents sold their lands or part of their
lands. Those sold lands areas were of approximately one to two hectares in most of the cases. Twenty-
two percent had rented new lands in the modern irrigated system zone.
Figure 4.2 presents flower diagrams showing all the livelihoods and their socio-demographic and
assets access features. The ranges of petal sizes are scaled mean from zero (petal absent, indicating a
low value for the agrarian service) to one as a large petal (indicating a high value for the service).
34 Livelihood outcomes typically refer to whether the existing livelihoods will be sustainable, both in social and ecological terms. 35 This section links with chapter 7 which will further assess the processes of dispossession, accumulation and differentiation among the existing livelihoods with the adoption of modern irrigation.

CHAPTER 4: LIVELIHOODS IN RURAL NAVARRE
- 82 -
Figure 4.2 Scaled mean variables represented in the flower diagrams represent socio-demographic features and asset differences among farmer
livelihood typologies
Large-scale intensive

CHAPTER 4: LIVELIHOODS IN RURAL NAVARRE
- 83 -
4.6. Discussion
This section discusses the differences between the livelihood profiles that have incorporated irrigation
and have intensified their practices (increased use of mineral fertilisers and water as well as larger
surface of laboured lands) and those farmers with less intensive livelihoods (smaller arable surfaces
as well as less water consumption and organic fertilisers’ utilisation). Results are considered in a
broader institutional context, which is expanded in Chapter 0.
4.6.1. Four livelihoods in the Itoiz-Canal de Navarra case study area
Intensive farmers (medium-scale intensive and large-scale intensive groups of farmers) and medium-
scale rainfed organic farmers follow a strong market-oriented strategy that can be classified as an
accumulative strategy. These farmers seek to increase the flow of income and stocks of physical, social
and financial assets (Masanjala, 2007). They accumulate financial assets through bank credit and
diverse subsidies to invest on physical assets such as irrigation infrastructure, seeds and fertilisers.
They are also characterised by an increased efficiency in the use of their physical assets, such as the
type of fertilisation and irrigation methods. However, these facts may simultaneously indicate a
reduction in the individuals involved in farming. In line with Allison and Ellis (2001), this chapter
discloses that as a result of intensive farmers' strategies, there may be a tendency to displace other
livelihoods from the agricultural sector. Furthermore, it may cause part-time farmers to work full-time
in an effort to repay loans and to increase their earnings for a sufficient return on the increased
investment.
Medium-scale rainfed organic farmers, alternatively, pursue a similar strategy but do not use
cooperatives and syndicates as key platforms through which to reach their productive aims. Instead,
they use their own knowledge and financial capital. Farmers who have diversified their crops after
installing the modern irrigation system have consequently adhered to a combination of accumulative
and adaptive strategies. These farmers diversify their labour and delegate the responsibilities of being
the producer, carrier and merchant simultaneously. However, their age and higher education degree
contributes to explain their entrepreneurship, which in turn allows them to take advantage of the
financial assets delivered by formal institutions in the form of subsidies. Their characteristics regarding
farm size and the type of used fertilisers align with the results of Clay et al. (1998).
Old farmers within the small-scale diversified livelihood follow a consolidate strategy (De Haan and
Zoomers, 2005), which is common after achieving certain level of desired affluence. Land management
for small-scale diversified farmers differed among them, i.e. there was not a clear tendency towards

CHAPTER 4: LIVELIHOODS IN RURAL NAVARRE
- 84 -
conservative or intensive agriculture. However, there were common strategies applied such as
forecasting the meteorology, storing crops individually instead of through cooperatives and rationing
their sows. Being agriculture the only income source in the household is not a significant difference
among the existing livelihoods. However, fieldwork revealed that extensive farmers (small-scale
diversified and medium-scale rainfed organic farmers) are associated with more diversified income
sources.
It should be noted that this analysis lacks information on the relationship between the level of non-
farm income and total income. The survey disclosed that for part time and retired farmers’ agriculture
was not the primary economic source, as was the case for intensive farmers. Income diversification
may not be always a positive feature. In some cases, it may be performed through unskilled labour or
overflow time allocation that does little to reduce household risk exposure, or to increase expected
income or human wellbeing (Barrett et al., 2001). Information about this is lacking in the current
dissertation.
These strategies, consolidate, adaptive and accumulative, evolve over time. For instance, the
accumulative strategies followed by younger stakeholders might be transformed into a consolidating
strategy in the future (De Haan and Zoomers, 2005). Part time extensive, full time intensive and organic
farmers’ strategies happen simultaneously as they are exclusive and follow divergent agrarian paths.
Such strategies are determined by farmers’ land access, knowledge, off-farm opportunities and
personal aspirations. Thus, it is not an evolving phase strategy, but rather a reflection of a
differentiated and multi-task portfolio that coexists in Navarre.
4.6.2. Livelihoods outcomes due to modern irrigation introduction
Current formal organisations and their related institutions are promoting modern irrigation in this
area through multiple types of subsidies and technical assistance at different scales. Land
concentration and irrigation conversion in the area has been clearly oriented to promote agribusiness
and biofuels production as well as new possibilities of implementing new crops (De Vries, A, and Garcia
M., 2012). Still, farmers have not diversified their cropping systems as much as the irrigation
promoters expected. A possible answer to why diversification remains constrained, even after
adopting irrigation, is that some farmers were accustomed to extensive cereals and several had never
used these methods of irrigation before. Some farmers’ aversion to irrigation and its embedded risks
may be due to (i) their self-reported conservative character; (ii) the low generational replacement rate
and/or (iii) some bad experiences described during the survey. In southern areas with a traditional
vegetable market orientation, growers’ strategies became difficult after the canning industry almost
CHAPTER 4: LIVELIHOODS IN RURAL NAVARRE
- 85 -
disappeared and quotas over certain crops, such as tomatoes, were established by EU regulations.
Farmers have shifted to irrigate maize and other crops linked to livestock such as alfalfa and forage.
Farmers with intensive livelihoods (large-scale and medium-scale intensive livelihoods) follow land
management strategies that are supported by institutions at different scales. Moreover, these farmers
are able to invest in modern irrigation installation and agrarian insurances due to their relatively
greater financial liquidity, which is facilitated by their better access to credit and remittances through
banks and institutional subsidies. For example, the EU’s CAP subsidies are higher if the targeted land
has an irrigated rather than a rainfed system in place (Carricondo and Peiteado, 2010). Navarre’s
government also offers irrigation and modernisation subsidies and other financial and technical help
that are facilitated by agrarian cooperatives. In sum, the larger land area under irrigated systems, as
well as the higher transformation of mechanisation and modernisation of the farms, the more funds
farmers can receive. One can infer that current official organisations funds promote therefore water
consumption.
Intensive livelihoods also reported a high or very high consultation to agricultural technicians in
comparison to the other extensive livelihoods. It may prove beneficial to investigate INTIA’s advice to
villagers, since farmers have demonstrated trust in this organisation in particular. In contrast, current
policies seem to be ignoring small-scale diversified livelihoods existence who, due to their consolidate
and multi-task security strategies, were uninterested in this agrarian transformation. Consequently,
early outcomes may already be observed through an exploration of the early effects of land tenure
change (German et al., 2011). This sheds some light on the security of intensive livelihoods, which may
in turn endure at the expense of other extensive livelihoods. For this reason, small-scale diversified
households’ sustainability is questioned within this context in which intensive farmers, buy and rent
more lands.
However, small-scale diversified farmers have an important role in maintaining agrarian land,
regardless of the reasoning behind preserving it (e.g. farming as ‘hobby’, family commitment or
identity concerns). They try to keep traditional practices, such as old system irrigation, alongside
present technologies and regulations. Therefore, the adoption of modern irrigation may be obscuring
aspects connected to identity, tradition, and other cultural values as well as factors influencing the
sustainability of the socio-ecological system in terms of oil, water and fertilisers increased dependency
(Oteros-Rozas et al., 2012). Furthemore, small-scale diversified farmers contribute to raise awareness
and promote understanding of how smallholder agricultural production and livelihood choices
interact with broader, non-agricultural economic opportunities, which might prove useful for
developing more appropriate smallholder policies (Koczberski and Curry, 2005).

CHAPTER 4: LIVELIHOODS IN RURAL NAVARRE
- 86 -
4.7. Summary
In this chapter I have discussed the different types of livelihoods of farmers within the Itoiz-Canal de
Navarra case study area. In doing so, I have characterised four main types of farmers each sharing a
similar livelihood with respect to the way they manage land and hold different assets: small-scale
diversified, medium-scale rainfed organic and two differentiated degrees of intensive farmers, namely
medium-scale intensive and large-scale intensive farmers. Accumulative strategies relate to intensive
livelihoods, adaptive strategies to organic livelihoods and consolidate as well as adaptive strategies to
small-scale diversified livelihoods.
The chapter has also analysed the combination of capital assets associated with particular land
management intensities and how such connections mediate farmers’ agricultural strategies. It has
found that human capital, particularly education, gender and age, in combination with the access to
agrarian land are vital to pursue productive options, and are significantly different across different
types of livelihoods in rural Navarre. Intensive farmers with a clear market-oriented agriculture have
mainly adopted modern irrigation, and some organic farmers have also done so.
The chapter has also argued that current institutions are not paying sufficient attention to how local
farmers make their living and the diverse assets they draw upon in the process (Bebbington, 1999). It
has disclosed that small-scale diversified farmers are clearly connected to the notion of ‘rural
livelihood’ while the rest of farmers, although also rural, are more related to an ‘agrarian livelihood’
focused on increasing income. As with similar case studies looking at small-scale practices (Allison and
Ellis, 2001), it seems that agrarian policy in Navarre has viewed farming as a full time occupation
seeking higher levels of efficiency. However, this aspect leads to the misinterpretation of how people
conduct their lives, and discounts policies which may fit with cross-sectorial livelihood strategies
pursued by small-scale diversified farmers and medium-scale organic farmers (Allison and Ellis, 2001).
The next chapter draws on the four livelihood typologies identified in this chapter to analyse whether
agrarian intensification influence people’s perception and valuation of multiple agrarian ES.

CHAPTER 5: UNRAVELING THE SOCIO-CULTURAL VALUES OF ECOSYSTEM SERVICES
- 87 -
CHAPTER 5
“Ecosystem-based conservation without cultural considerations is not only insufficient, it risks
producing unaccounted negative impacts to communities and misses an opportunity to build
culturally meaningful alternatives”
Poe et al, 2013
5. Unraveling the socio-cultural values of ecosystem services
5.1. Introduction
As indicated in the previous chapter, I addressed diversity of the rural livelihoods within the case
study area. The adoption of modern irrigation has strongly influenced the evolution of some of
the local livelihoods, resulting in more intensive land management strategies overall. According
to the type of land management adopted, I found contrasting small-scale diversified, medium-
scale rainfed organic, large-scale intensive and medium-scale intensive livelihood strategies. For
the first two classifications, the utilised strategies correspond with consolidated (solid and
secure strategy) and multi-task range of activities (diverse sources of household income arising
besides agrarian activities). Farmers holding intensive livelihoods follow agro-industry oriented
and accumulative strategies (characterised by a high rate of capital and labour use per unit land
area).
I hypothesise that the adoption of modern irrigation does not only influence land and water
access but also villagers’ perceived values of ES. In this vein, this chapter contributes to
answering the second research question, i.e. Does agrarian intensification influence people’s
perception and valuation of multiple agrarian ES?
Since agrarian ES contribute to human wellbeing and agrarian management practices influence
the co-production of ES (De Haan and Zoomers, 2005; Seppelt et al., 2011), I aim to contribute
towards better theorising of ES valuation frameworks through farmers’ valuation of ES, and its
relation to livelihood profiles and related explanatory variables.
Disaggregated ecosystem service valuation is a way of recognising legitimate differences
between farmers’ preferences (Costanza et al., 2007; Gómez-Baggethun and de Groot, 2010;
Pascual et al., 2014). Moreover, enhancing certain ES (such as in this case, through recent

CHAPTER 5: UNRAVELING THE SOCIO-CULTURAL VALUES OF ECOSYSTEM SERVICES
- 88 -
policies that foster large-scale intensive practices) may deny the enjoyment of other type of ES
by other interested parties (Castillo et al., 2005; Martín-López et al., 2012; Norgaard, 2010). For
this reason, making agrarian ES trade-offs visible (Salafsky and Wollenberg, 2000; Hartel et al.,
2014; Klain et al., 2014), and emphasising how cultural services are affected by modern farming
practices such as through intensive and technified irrigation, is of crucial importance. This
information would allow for identifying whose values may be challenged by the current agrarian
transformation.
The current chapter is organised in four main sections. Following the introduction, Section 5.2
qualitatively explores farmers’ perceived connections between agrarian ES and human
wellbeing, supported by interviews with key informants in the case study area. Section 5.3
focuses on farmers’ agrarian ES valuation. For this, I rely on data from a quantitative survey. I
employ a socio-cultural valuation approach (Martín-López et al., 2012; Oteros-Rozas et al., 2013;
Palomo et al., 2014) (see Section 3.3.2.1). This section also discusses how farmers’ land
management choices influence their perception about ES co-production (Diaz et al., 2015;
Palomo et al., 2016; Seppelt et al., 2011). Section 5.4 discusses the uncovered trade-offs
between tangible/material services that have a wide social recognition, such as provisioning
services, and other services which are less tangible such as cultural services (Daniel et al., 2012b;
Howe et al., 2014; Norgaard, 2010). Finally, Section 5.5 discusses the previous findings and
Section 5.6 discloses the key messages resulting from previous analysis.
Figure 5.1 synthesises the analysis process followed in this chapter.

CHAPTER 5: UNRAVELING THE SOCIO-CULTURAL VALUES OF ECOSYSTEM SERVICES
- 89 -
Figure 5.1 Steps of the analytical process of Chapter 5
5.2. Local perceptions of agrarian ecosystem services for human wellbeing
Semi-structured interviews of informants from varied backgrounds (e.g. scientists, farmers,
politicians, NGO members) provided 18 statements which connected agrarian ES with six
dimensions of human wellbeing including security, basic material for a quality life, health, social
relations, freedom of choice and action and subjective happiness. Through this, individuals were
able to express which type of agrarian ES they recognised, as well as to identify why such ES had
to be maintained or enhanced. Cultural ES were the most commonly reported services (seven
cultural services were identified), followed by regulating (six), supporting services (three) and
provisioning (two).
As shown in Section 3.3.2.1, I first summarised the interviews and extracted the statements that
linked agrarian ES and human wellbeing. Additionally, I conducted a broad literature review on
ES that served as a reference, and used this information to order and classify the pre-defined
statements. I did not include services that did not appear during the interviews such as
pollination or soil formation. However, other services that were not covered during the
literature review on ES but appeared during the interviews were included (e.g. self-fulfilment).
After a revision of the existing ES classifications (Costanza et al., 2007; De Groot et al., 2002b;
Dominati et al., 2010), I adapted the MEA (2005)36 classification with contributions of Chan
(2012); Summers et al (2012) and Klain (2014) to organise the interviews’ statements.
36 See Section 2.3 for further information about the importance of MEA and its evolution over time.

CHAPTER 5: UNRAVELING THE SOCIO-CULTURAL VALUES OF ECOSYSTEM SERVICES
- 90 -
Regarding wellbeing, Summers et. al (2012) emphasised the importance of the freedom-to-
choose and identified another sixth dimension: ‘subjective happiness’. The authors explain that
happiness can be separated into approximately three categories. The first is referred to as
solastalgia, which ascribes to the distress produced by environmental damage which is
exacerbated by a sense of powerlessness or lack of control over the unfolding change process.
Albrecht et al., (2007) argue on the opposite feeling –i.e. the psychological or existential comfort
caused by the experience of connecting to nature. The second category is topophilia, which is
related to one’s affection to their hometown, which often becomes mixed with the sense of
cultural identity among certain peoples and a love of particular aspects of such a place
(Ogunseitan, 2004). The final category is the affection and respect concerning one’s sense of
belonging to a given environment.
Table 5.1-5.4 show the statements that connect agrarian livelihoods in the study site and ES
with human wellbeing dimensions. Although the statements refer to ‘soils’, in some cases ‘soil’
is rather translated as ‘land’ or ‘agrarian ecosystem’. These fuzzy concepts were used on purpose
as local farmers used them interchangeably. The tables also provide information about i) the
type of ecosystem service and ii) the scale at which it is delivered; iii) the type of benefits37
connected to ecosystem service (fourth column Table 5.1) and iv) the human wellbeing
dimension to which ecosystem service contributes; v) whether the importance attached to the
services is in favour of individual or collective benefit (labelled ‘scale’ in the tables); vi) if the
benefits perceived are considered direct or indirect (‘indirect’ refers to a longer or more difficult
cognition process required to perceive the service effect) and vii) the information source
(whether statements are mentioned in the interviews, the literature or both).
5.2.1. Links between cultural ecosystem services and human wellbeing dimensions
Among cultural services, there is the cultural heritage service which is often associated with
identity, and defined as the legacy of biophysical features, physical artefacts, and intangible
attributes of a group or society inherited from past generations, adopted in the present and
maintained for the benefit of future generations (Daniel et al., 2012a). Recreation and tourism
expand the opportunity of enjoyment to a broader range of people and provide many benefits
such as physical exercise, aesthetic experiences, intellectual stimulation, inspiration and other
aspects connected to psychological wellbeing. Spiritual and religious significance is reflected as
a subcategory of cultural ES. Local ecological knowledge is transferred over generations and
37 In the case of benefits I follow Klain et al., (2014) classification explained in Section 2.2.2.

CHAPTER 5: UNRAVELING THE SOCIO-CULTURAL VALUES OF ECOSYSTEM SERVICES
- 91 -
regenerated through practical engagements with ecological components. Social relations are
organised and maintained by cultural practices and common understanding of a community
(Kitayama and Markus, 2000).
Table 5.1 illustrates that cultural ES were the most frequently mentioned services, compared to
the rest of services categories described by the survey participants, with seven cultural services
identified. Those services provide aesthetic, inspiration, knowledge, social cohesion, spiritual
and identity benefits (fifth column of Table 5.1). The wellbeing dimensions attached to these
services were: subjective happiness, social relations and freedom, and health benefits derived
from enjoying agricultural management and self-produced quality food, respectively.

CHAPTER 5: UNRAVELING THE SOCIO-CULTURAL VALUES OF ECOSYSTEM SERVICES
- 92 -
Table 5.1 Cultural services and their connection with human wellbeing
Type of
service Statement
Ecosystem
service
Scale
Benefit
Human wellbeing
dimension to which
ecosystem service
contributes
Human
wellbeing
Scale Effect
Source
Literature
Inte
rvie
w
Outdoor recreation
Agrarian soils are important because they offer a relaxing and leisure space: for walks, birds tourism
Landscape Activity Subjective happiness Solastalgia (distress by environment)
Individual Direct
(Calvet-Mir et al., 2012; Klain et al., 2014; MEA, 2005a; Swinton et al., 2007)
√
Outdoor recreation
Agrarian soils are important because they offer unique and attractive landscapes
Landscape Aesthetic Subjective happiness Solastalgia (distress by environment)
Collective /Individual
Direct
(De Groot et al., 2002; Kremen, 2005; MEA, 2005a; Swinton et al., 2007; Zhang et al., 2007)
√
Artistic
Agrarian soil is important because it offers an inspiration source (art, culture…)
All Inspiration Subjective happiness Solastalgia (distress by environment)
Individual Direct (Calvet-Mir et al., 2012; Klain et al., 2014; MEA, 2005a)
√
Education and cognitive development
Agrarian soil is important because it offers an ideal source of education (about natural cycles etc.)
All Knowledge
Subjective happiness Affection and respect: being part of environment Freedom to choose
Collective /Individual
Direct (Calvet-Mir et al., 2012; K. Chan et al., 2012; MEA, 2005a)
√
Education through traditional knowledge
Agrarian soil is important because it keeps and exposes traditional land activities, there is a culture, richness and knowledge
Landscape Knowledge and identity
Subjective happiness Affection and respect: we are part of environment; Social relations Mutual respect; Ability to help others
Collective /Individual
Direct (Calvet-Mir et al., 2012, MEA, 2005b)
√
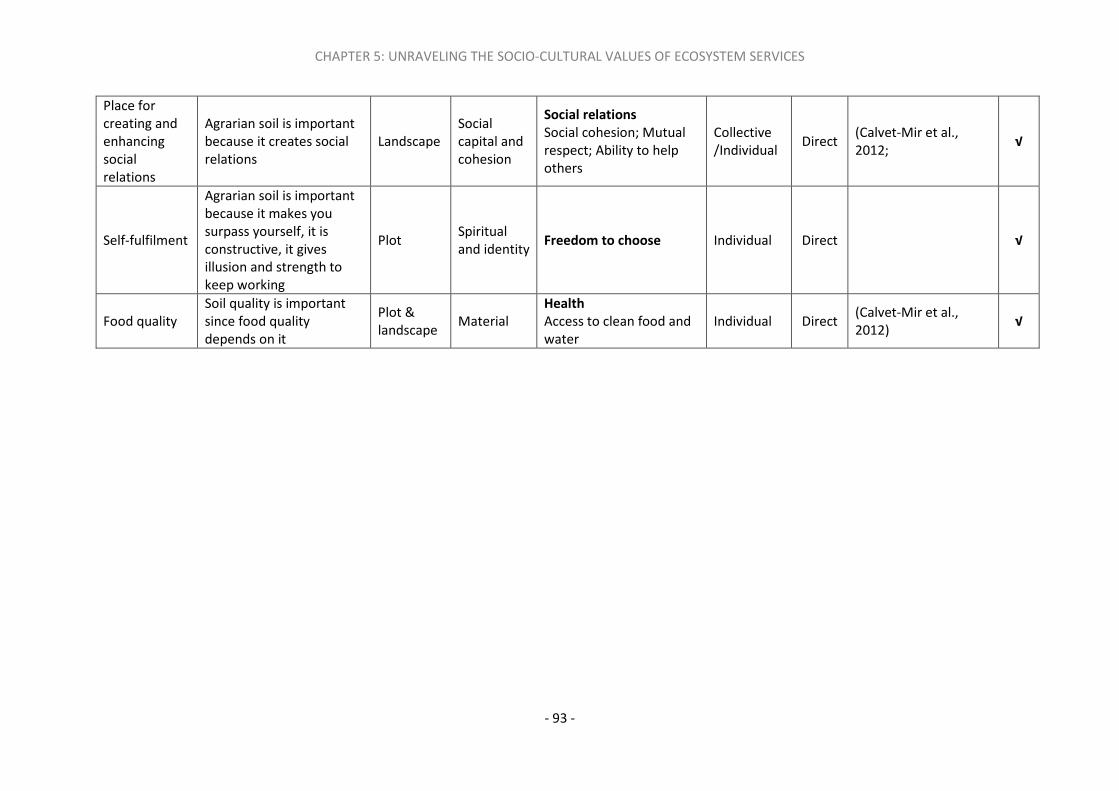
CHAPTER 5: UNRAVELING THE SOCIO-CULTURAL VALUES OF ECOSYSTEM SERVICES
- 93 -
Place for creating and enhancing social relations
Agrarian soil is important because it creates social relations
Landscape Social capital and cohesion
Social relations Social cohesion; Mutual respect; Ability to help others
Collective /Individual
Direct (Calvet-Mir et al., 2012;
√
Self-fulfilment
Agrarian soil is important because it makes you surpass yourself, it is constructive, it gives illusion and strength to keep working
Plot Spiritual and identity
Freedom to choose Individual Direct √
Food quality Soil quality is important since food quality depends on it
Plot & landscape
Material Health Access to clean food and water
Individual Direct (Calvet-Mir et al., 2012)
√
CHAPTER 5: UNRAVELING THE SOCIO-CULTURAL VALUES OF ECOSYSTEM SERVICES
- 94 -
Subjective happiness includes the comfort that the environment provided to the survey participants,
for example through the landscape beauty appreciation (Albrecht et al., 2007). It also relates to
personal creative inspiration and to the pleasure derived from; such as strolling between crops fields
of labouring the land. According to participants, such services provided direct and individual benefits,
although occasionally it was indicated that they could also lead to collectively perceived benefits (e.g.
landscape appreciation and affection and respect through education).
Agrarian cultural services were often mentioned by NGO members and local and regional agents.
Instances of reported self-fulfilment was mainly shared among farmers. They referred to the act of
fulfilling one's ambitions, desires, etc., as being achieved through one's own efforts, e. g. their land
labouring. Typically, this concerned individual and direct perceived benefits.
Additionally, participants manifested a strong sense of place or topophilia; mixed with the sense of
cultural identity and affection of certain aspects of such a place (Summers et al., 2012). This was
enthusiastically described regarding local identities and traditional knowledge passed through
generations, sometimes as a family tradition. This was also mainly perceived among farmers but it was
shared among the rest of participants (local and regional officers, NGOs and other local organisations
such as cooperative and syndicate workers).
An individual’s wellbeing is strongly influenced by their ability to develop a system of understanding
and practices, as well as mutual relations with others (Kitayama and Markus, 2000). Interviews
demonstrated how education, traditional knowledge and the direct maintenance of social relations
were of key importance for the interviewees’ wellbeing in terms of keeping social cohesion, sharing
mutual respect and cultivating the ability to help others (Hartel et al., 2014). The importance of social
relations was only remarked by farmers.
The freedom to choose dimension is central to the nature of wellbeing (Hausman, 1994). Education
and self-fulfiment services are included within this dimension of wellbeing; the former as an asset
which provides potential capabilities and the latter typically involves investment in ones self, which in
turn can promote a higher freedom to choose and therefore, subjective happiness. The spiritual
connection to nature, which is closely connected to labour farming, was also associated with this
dimension, and again was only principally mentioned by farmers.
Table 5.1 complements the current knowledge on cultural ES (Calvet-Mir et al., 2012; K. Chan et al.,
2012; K. M. Chan et al., 2012; Hartel et al., 2014). It further incorporates examples of links between
agrarian ES and human wellbeing. The data is enriched by the specificity of the type of ecosystem on

CHAPTER 5: UNRAVELING THE SOCIO-CULTURAL VALUES OF ECOSYSTEM SERVICES
- 95 -
which it is based, its multi-scalar dimensions and the incorporation of self-fulfilment, is not commonly
included in ES classifications.
5.2.2. Links between provisioning services and human wellbeing
The provisioning services identified by participants were connected to security, health and basic
materials for a good quality of life. Food and raw materials were perceived as basic means to develop
a livelihood (Schwartz, 1994). Both are direct material benefits for individuals and collectives (Fisher
et al., 2008). Accounting for these services implies acquiring food for the biophysical necessities and
security for material necessities. However, in the case study context, food provisioning or fibres are
not always basic material to live since most participants in the survey do not develop subsistence
agriculture. Nevertheless, food production is a basic source of income and employment. As expected,
provisioning services were identified by all interviewees.

CHAPTER 5: UNRAVELING THE SOCIO-CULTURAL VALUES OF ECOSYSTEM SERVICES
- 96 -
Table 5.2 Provisioning services and their connection with human wellbeing dimensions
Type of
service Example of related statement to
provisioning service
Benefit
Ecosyste
m service
Scale
Human
wellbeing
dimension to
which
ecosystem
service
contributes
Human
wellbeing scale
Effect Source
Literature Inter
view
Food Agrarian soil is important although not essential since technology makes possible crops without soil Material
Plot & landscape
Basic material
for good life &
Security Food; Access to goods
Collective & Individual
Direct
(De Groot et al., 2002b; MEA, 2005a; Swinton et al., 2007; Zhang et al., 2007)
√
Raw material
Agrarian soil is important because it provides with raw materials for industry and cattle
Material Plot & landscape
Basic material
for good life &
Security Access to goods
Collective & Individual
Direct (De Groot et al., 2002b; MEA, 2005a)
√
CHAPTER 5: UNRAVELING THE SOCIO-CULTURAL VALUES OF ECOSYSTEM SERVICES
- 97 -
5.2.3. Links between regulating services and their connections with human wellbeing
Regulating services were considered not only by people from specific profiles such as government
workers and academics, but also by organic farmers and a few conventional farmers. These services
are not as tangible as provisioning services (McMichael et al., 2005). In fact, water and climate
regulation, erosion prevention and pollutant control are indirect benefit of a desirable state of
agrarian soils. In general, such services were recognised mainly by local and regional organisations;
pollution related services were also strongly perceived, as both desirable and undesirable, by some
farmers. These services are connected to the health and security dimensions of human wellbeing. All
of them Additionally, these services have provided indirect collective benefits, since they influence
the sustainability of the studied ecosystem, as well as ‘higher’ linked ecosystems and interact with
agrarian soils as well as with neighbouring aquatic ecosystems (Fisher et al., 2008).
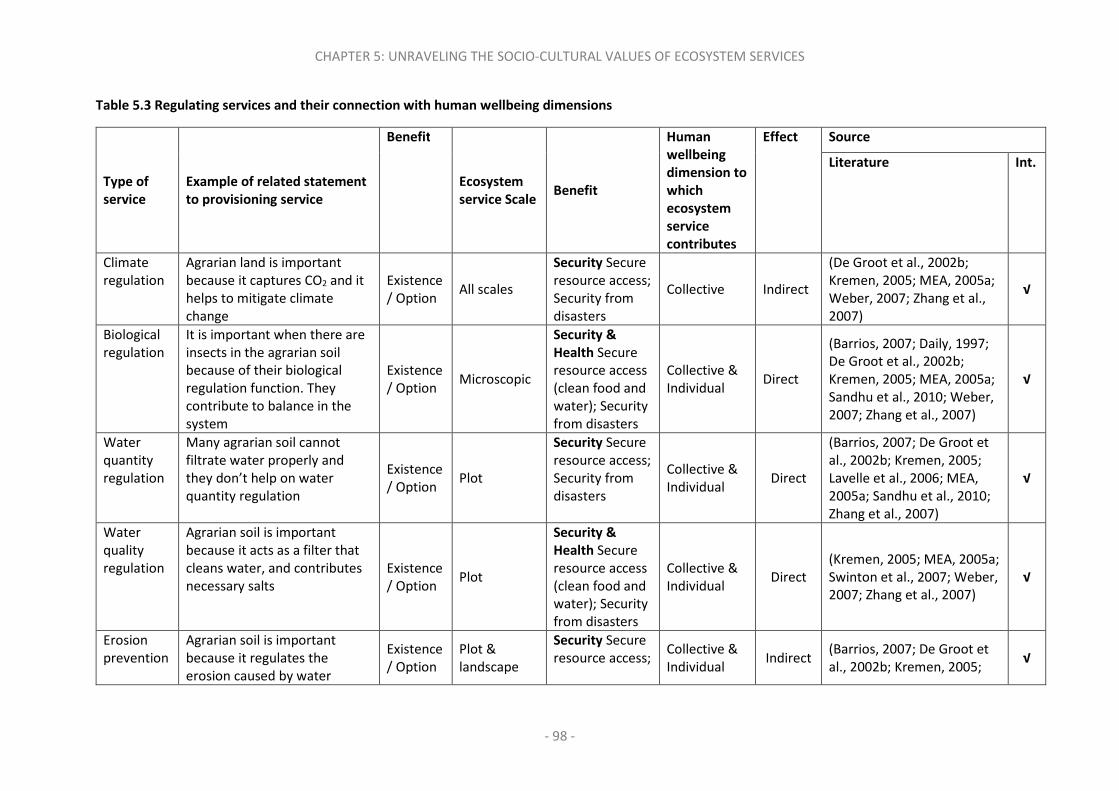
CHAPTER 5: UNRAVELING THE SOCIO-CULTURAL VALUES OF ECOSYSTEM SERVICES
- 98 -
Table 5.3 Regulating services and their connection with human wellbeing dimensions
Type of
service Example of related statement
to provisioning service
Benefit
Ecosystem
service Scale Benefit
Human
wellbeing
dimension to
which
ecosystem
service
contributes
Effect Source
Literature Int.
Climate regulation
Agrarian land is important because it captures CO2 and it helps to mitigate climate change
Existence / Option
All scales
Security Secure resource access; Security from disasters
Collective Indirect
(De Groot et al., 2002b; Kremen, 2005; MEA, 2005a; Weber, 2007; Zhang et al., 2007)
√
Biological regulation
It is important when there are insects in the agrarian soil because of their biological regulation function. They contribute to balance in the system
Existence / Option
Microscopic
Security &
Health Secure resource access (clean food and water); Security from disasters
Collective & Individual
Direct
(Barrios, 2007; Daily, 1997; De Groot et al., 2002b; Kremen, 2005; MEA, 2005a; Sandhu et al., 2010; Weber, 2007; Zhang et al., 2007)
√
Water quantity regulation
Many agrarian soil cannot filtrate water properly and they don’t help on water quantity regulation
Existence / Option
Plot
Security Secure resource access; Security from disasters
Collective & Individual
Direct
(Barrios, 2007; De Groot et al., 2002b; Kremen, 2005; Lavelle et al., 2006; MEA, 2005a; Sandhu et al., 2010; Zhang et al., 2007)
√
Water quality regulation
Agrarian soil is important because it acts as a filter that cleans water, and contributes necessary salts
Existence / Option
Plot
Security &
Health Secure resource access (clean food and water); Security from disasters
Collective & Individual
Direct (Kremen, 2005; MEA, 2005a; Swinton et al., 2007; Weber, 2007; Zhang et al., 2007)
√
Erosion prevention
Agrarian soil is important because it regulates the erosion caused by water
Existence / Option
Plot & landscape
Security Secure resource access;
Collective & Individual
Indirect (Barrios, 2007; De Groot et al., 2002b; Kremen, 2005;
√

CHAPTER 5: UNRAVELING THE SOCIO-CULTURAL VALUES OF ECOSYSTEM SERVICES
- 99 -
Type of
service Example of related statement
to provisioning service
Benefit
Ecosystem
service Scale Benefit
Human
wellbeing
dimension to
which
ecosystem
service
contributes
Effect Source
Literature Int.
Security from disasters
Lavelle et al., 2006; MEA, 2005a; Sandhu et al., 2010)
Pollutant regulation
Agrarian soil is important because it absorbs wastes that otherwise may be problematic
Existence / Option
Plot & landscape
Security &
Health Collective & Individual
Indirect
(Calvet-Mir et al., 2012; Daily, 1997; De Groot et al., 2002b; Kremen, 2005; MEA, 2005a)
√

CHAPTER 5: UNRAVELING THE SOCIO-CULTURAL VALUES OF ECOSYSTEM SERVICES
- 100 -
5.2.4. Links between supporting services and their connection with human wellbeing
Finally, while supporting services were related primarily to security dimensions, there were also some
supporting services attached dimensions of subjective happiness. Participants stated how important
the intrinsic value of biodiversity and habitat were and how these services made them feel better,
regardless of perceiving a direct use for them. They also noted how crucial these services were for
stabilising and maintaining the health of agrarian ecosystems. Most examples referred to trophic
chains regarding the necessity of biological control to avoid plagues. The security dimension refers to
the possibility of using those ES in the future, known as ‘option’ or ‘bequest’ value.
Those statements were then presented to farmers and owners affected by Itoiz-Canal de Navarra
modern irrigation transformation project for an absolute valuation using Likert Scale. A simplification
of them was also used for relative valuation using a total of 13 agrarian ES to be valued through Pebble
Method (see 3.3.2.1.)
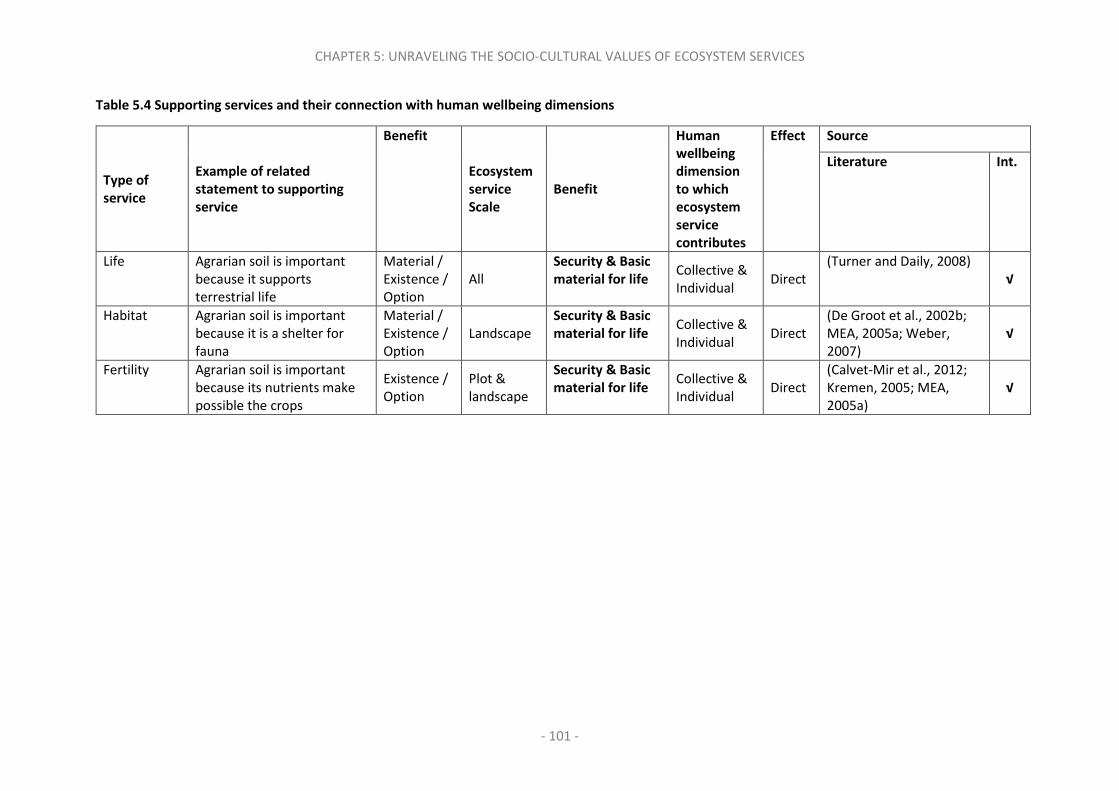
CHAPTER 5: UNRAVELING THE SOCIO-CULTURAL VALUES OF ECOSYSTEM SERVICES
- 101 -
Table 5.4 Supporting services and their connection with human wellbeing dimensions
Type of
service
Example of related
statement to supporting
service
Benefit
Ecosystem
service
Scale Benefit
Human
wellbeing
dimension
to which
ecosystem
service
contributes
Effect Source
Literature Int.
Life Agrarian soil is important because it supports terrestrial life
Material / Existence / Option
All Security & Basic
material for life Collective & Individual
Direct (Turner and Daily, 2008)
√
Habitat Agrarian soil is important because it is a shelter for fauna
Material / Existence / Option
Landscape Security & Basic
material for life Collective & Individual
Direct (De Groot et al., 2002b; MEA, 2005a; Weber, 2007)
√
Fertility Agrarian soil is important because its nutrients make possible the crops
Existence / Option
Plot & landscape
Security & Basic
material for life Collective & Individual
Direct (Calvet-Mir et al., 2012; Kremen, 2005; MEA, 2005a)
√

CHAPTER 5: UNRAVELING THE SOCIO-CULTURAL VALUES OF ECOSYSTEM SERVICES
- 102 -
5.3. Valuation of agrarian ecosystem services and awareness of their co-
production
Once I had gathered the 18 statements linking five types of agrarian ES with the six dimensions of
human wellbeing, I focused on understanding how those connections are evaluated by farmers
themselves and who were affected by Itoiz-Canal de Navarra irrigation project. The aim is to ascertain
whether and to what extent the management practices may influence such valuations by farmers. To
do so, I conducted an empirical valuation of the social importance of agrarian ES (see Section 5.3.1)
using two different socio-cultural valuation methods (explained in Section 3.3.2.1). Differences among
the existing livelihoods are later assessed (Section 5.3.2). Section 5.3.3 and 5.3.4 inform about co-
production awareness registered in the survey and differences on this perception among the
livelihoods, respectively.
5.3.1. Values and perceptions
To explore which ES were the most and least valued (and to what extent) by respondents, both Likert
(absolute) scale and Pebble (relative scale) methods were used. In employing the Likert Scale, 18
statements were presented to participants for an absolute valuation. Participants in the survey then
had to rate each statement between 0 and 5, to indicate if they strongly agreed (5) or strongly
disagreed (0) with it. In the case of the Pebble relative valuation, participants had to distribute 15
stones among 13 image cards that represented links between AES and HWB dimensions (see Section
3.3.2.2) for further explanation of scales in each method).
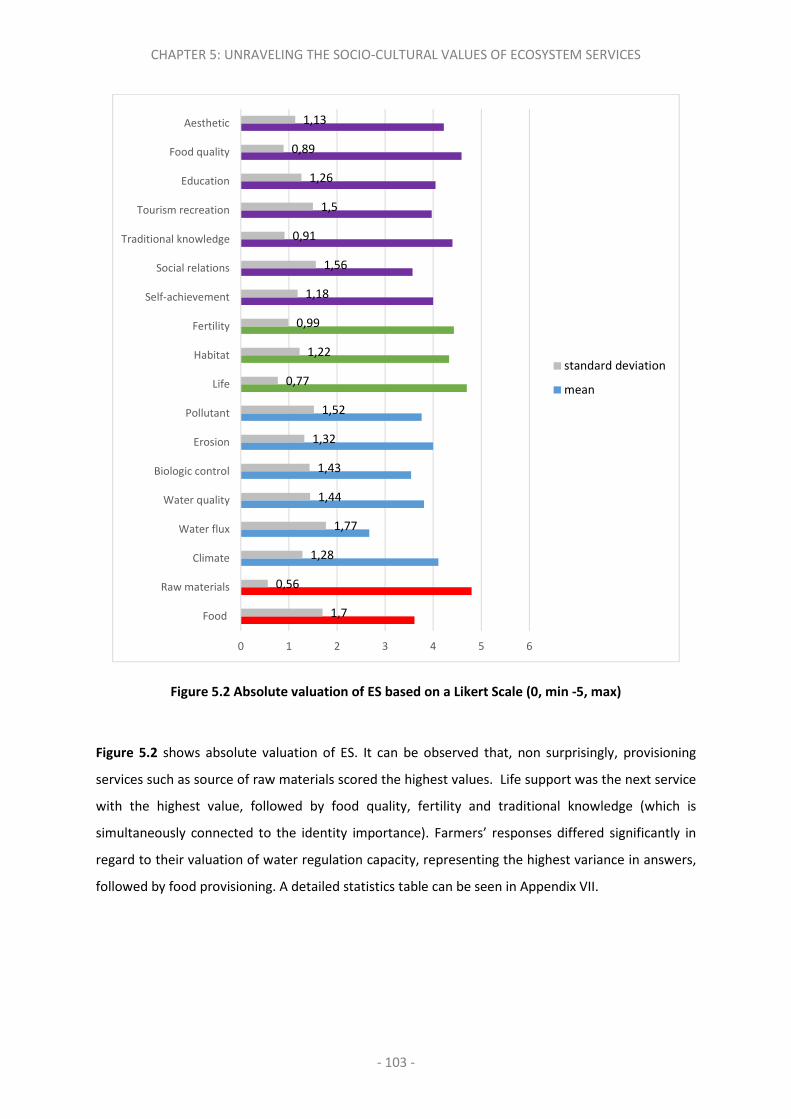
CHAPTER 5: UNRAVELING THE SOCIO-CULTURAL VALUES OF ECOSYSTEM SERVICES
- 103 -
Figure 5.2 Absolute valuation of ES based on a Likert Scale (0, min -5, max)
Figure 5.2 shows absolute valuation of ES. It can be observed that, non surprisingly, provisioning
services such as source of raw materials scored the highest values. Life support was the next service
with the highest value, followed by food quality, fertility and traditional knowledge (which is
simultaneously connected to the identity importance). Farmers’ responses differed significantly in
regard to their valuation of water regulation capacity, representing the highest variance in answers,
followed by food provisioning. A detailed statistics table can be seen in Appendix VII.
1,7
0,56
1,28
1,77
1,44
1,43
1,32
1,52
0,77
1,22
0,99
1,18
1,56
0,91
1,5
1,26
0,89
1,13
0 1 2 3 4 5 6
Food
Raw materials
Climate
Water flux
Water quality
Biologic control
Erosion
Pollutant
Life
Habitat
Fertility
Self-achievement
Social relations
Traditional knowledge
Tourism recreation
Education
Food quality
Aesthetic
standard deviation
mean
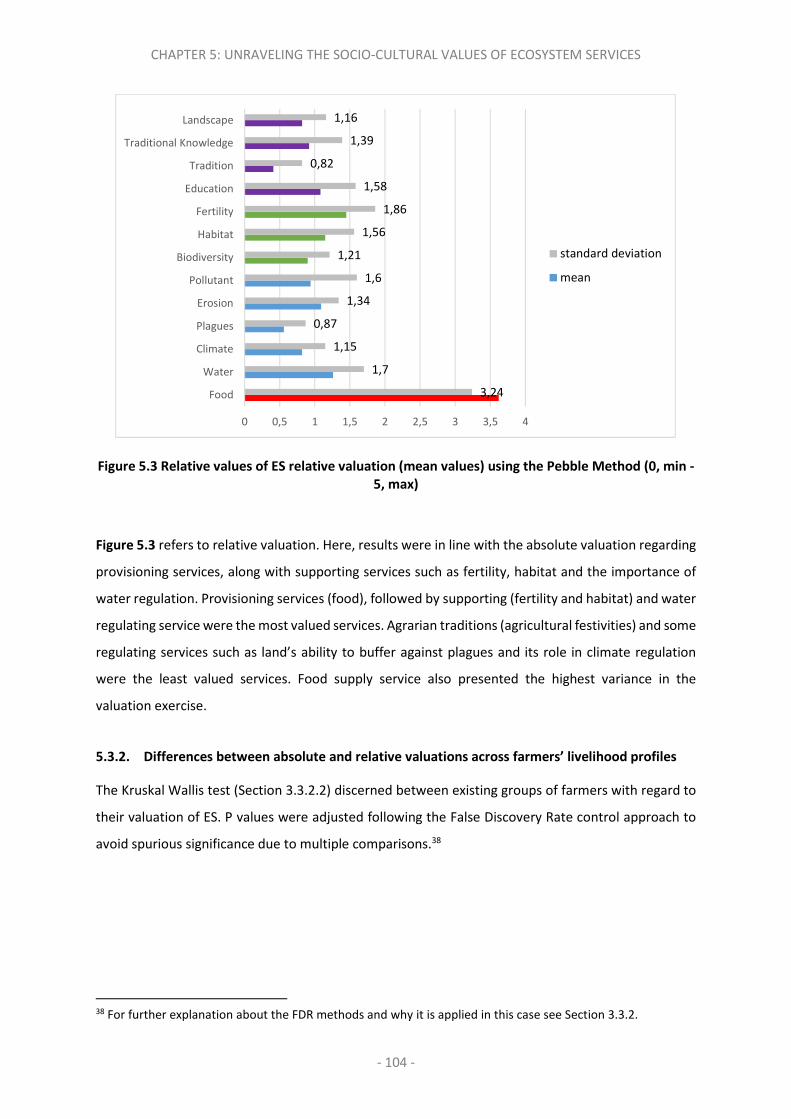
CHAPTER 5: UNRAVELING THE SOCIO-CULTURAL VALUES OF ECOSYSTEM SERVICES
- 104 -
Figure 5.3 Relative values of ES relative valuation (mean values) using the Pebble Method (0, min -
5, max)
Figure 5.3 refers to relative valuation. Here, results were in line with the absolute valuation regarding
provisioning services, along with supporting services such as fertility, habitat and the importance of
water regulation. Provisioning services (food), followed by supporting (fertility and habitat) and water
regulating service were the most valued services. Agrarian traditions (agricultural festivities) and some
regulating services such as land’s ability to buffer against plagues and its role in climate regulation
were the least valued services. Food supply service also presented the highest variance in the
valuation exercise.
5.3.2. Differences between absolute and relative valuations across farmers’ livelihood profiles
The Kruskal Wallis test (Section 3.3.2.2) discerned between existing groups of farmers with regard to
their valuation of ES. P values were adjusted following the False Discovery Rate control approach to
avoid spurious significance due to multiple comparisons.38
38 For further explanation about the FDR methods and why it is applied in this case see Section 3.3.2.
3,24
1,7
1,15
0,87
1,34
1,6
1,21
1,56
1,86
1,58
0,82
1,39
1,16
0 0,5 1 1,5 2 2,5 3 3,5 4
Food
Water
Climate
Plagues
Erosion
Pollutant
Biodiversity
Habitat
Fertility
Education
Tradition
Traditional Knowledge
Landscape
standard deviation
mean

CHAPTER 5: UNRAVELING THE SOCIO-CULTURAL VALUES OF ECOSYSTEM SERVICES
- 105 -
Figure 5.4 Adjusted absolute (Likert Scale) difference in valuation across existing livelihood
profiles39 (0, min -5, max)
Figure 5.4 presents the results obtained when farmers valued ES using the Likert scale method. The
values refer to the mean value given by farmers holding different livelihoods (Chi square test mean
value), being each of the farmers groups: small-scale diversified farmers, second medium-scale rainfed
organic farmers and third medium-scale intensive farmers and fourth large-scale intensive farmers.
The p value is denoted via the presence of asterisk(s) after the labelled service.
Thus, I found that small-scale diversified farmers valued the capacity of agrarian ecosystems for
tourism recreation significantly higher.40 This is in contrast with the other livelihood profiles, who are
39 One asterisk (*) after the service means that those categories are significantly different at a 90 percent significance, whereas two asterisks (**) denotes that those statements are significantly different at a 95 percent significance. This is repeated all over the rest of Figures. 40 See Appendix VII, Table VII.2.
0 0,5 1 1,5 2 2,5 3 3,5 4 4,5 5
Food
Raw materials
Climate
Water flux
Water quality
Biologic control
Erosion
Pollutant
Life
Habitat
Fertility
Self-achievement
Social relations
Traditional knowledge
Tourism recreation*
Education
Food quality
Aesthetic
Large-scale medium intensive Medium-scale intensive
Medium-scale rainfed organic Small-scale diversified

CHAPTER 5: UNRAVELING THE SOCIO-CULTURAL VALUES OF ECOSYSTEM SERVICES
- 106 -
more dedicated to agriculture, and regarded this service (provided by the agrarian ecosystem) to have
a lower value.
Figure 5.5 Adjusted relative (Pebble) difference in valuation across existing livelihood profiles (0,
min -5, max)
Figure 5.5 displays the results of the relative valuation, which is considered a more appropriate way
of valuation41 (Matson et al., 1997) (see also Section 3.3.2). However, when utilising the Pebble
method, I did not find any significant difference across livelihood profiles when p values were
adjusted, which is an absence of asterisks after the services names.
5.3.3. Co-production awareness
As explained in Section 2.3, co-production is understood as the contribution of farmers’ labour on the
delivery of agrarian ES (Seppelt et al., 2011). During fieldwork, when participants were asked about
41 Pebble valuation obligues participants to choose among the ES and this represent a more realistic situation regarding land management practices effects over agrarian ES. Moreover, although Likert is designed for valuation, in practice I found responses focused on the perception of agreement/disagreement with presented statements typically assigning extreme values to the sentences. Therefore, the relative valuation through the Pebble method provided richer information since clearer preferences were revealed.
0 0,5 1 1,5 2 2,5 3 3,5 4 4,5 5
Food
Water
Climate
Plagues
Erosion
Pollutant
Biodiversity
Habitat
Fertility
Education
Tradition
Traditional Knowledge
Landscape
Large-scale medium intensive Medium-scale intensive
Medium-scale rainfed organic Small-scale diversified

CHAPTER 5: UNRAVELING THE SOCIO-CULTURAL VALUES OF ECOSYSTEM SERVICES
- 107 -
agrarian ES, many of them highlighted that their labour practices strongly influenced the production
of the commented services and/or disservices. Although participants showed difficulty in
understanding regulating services (‘Don’t know’ answers were more frequently attributed to this type
of services than to others) and thus were normally scored as low, some participants highlighted the
importance of management practices in the production of such services. This awareness was not
measured using a scale of five categories, but as a dichotomy variable of being knowledgeable or not
in regard to this aspect of co-production.
As Figure 5.6 indicates, interviewed farmers were conscious of the fact that their tillage practices and
use of fertilisers and pesticides had an influence on the presence of plagues, the level of soil fertility
and water regulation. Interestingly, they also expressed how their practices had a strong influence on
some cultural services, such as rural traditions, aesthetic services (including landscape configuration),
and feelings of self-achievement.
Figure 5.6 Co-production awareness on each ecosystem service calculated through the stated
times mean over all the services valued (0, min -0.28, max)
0,05
0,05
0,05
0,07
0,07
0,10
0,10
0,12
0,18
0,19
0,27
0,28
0,35
0,37
0,41
0 0,1 0,2 0,3 0,4 0,5
Climate
Erosion prevention
Traditional knowledge
Food
Raw materials
Life
Water quality
Habitat
Water flow
Education
Social relations
Tourism recreation
Food quality
Fertility
Self-achievement
Aesthetic
Pollutants
Biological regulation
standard deviation
mean

CHAPTER 5: UNRAVELING THE SOCIO-CULTURAL VALUES OF ECOSYSTEM SERVICES
- 108 -
Figure 5.7 presents chi square test mean value results; the p value is denoted via the presence of
asterisk(s) after the labelled service. The bars represent the share or proportion of respondents
answering the yes/no question regarding whether they thought their own land management practices
influenced the services discussed. Scale of the horizontal axis from 0 to 0.28 represents the number
of times each services was perceived by the farmers as co-produced through their management
strategies. Small-scale diversified farmers significantly emphasised the importance of their practices
for the quality of the food produced. When discerning whether awareness of co-production differed
across existing livelihood profiles; I found only food quality as significantly different aware and this
occurred at a 95% of significance (p<0.05) after adjusting the p values.
Figure 5.7 Adjusted co-production awareness differences among existing livelihoods
5.3.4. Access to capital assets influences the perception of ecosystem services values
Chapter 0 concluded that age, land access, gender and education were key variables for gaining access
to other important capital assets such as participation in cooperatives and financial investment on
0 0,05 0,1 0,15 0,2 0,25 0,3
Food
Raw materials
Climate
Water flow
Biological regulation
Erosion prevention
Pollutants
Life
Habitat
Fertility
Self-achievement
Social relations
Tourism recreation
Education
Food quality **
Aesthetic
Large-scale medium intensive(N=86) Medium-scale intensive (N=131)
Medium-scale rainfed organic (N=22) Small- scale diversified (N=125)

CHAPTER 5: UNRAVELING THE SOCIO-CULTURAL VALUES OF ECOSYSTEM SERVICES
- 109 -
agrarian insurance systems, for example. Although the classification of the exiting livelihoods in
Navarre are based on their management choices and those variables are also significantly different
across the livelihood typologies, this section analyses if these key socio-demographic variables have a
significant influence on the relative valuation of agrarian ES when assessed separately. Non-
parametric tests were used to understand their significant differences. I used the Kruskal-Wallis (K-H)
test for discrete variables and variables with non-normal distribution, the Wilcox test for dichotomic
variables and the Spearman (S) test for continuous variables without a normal distribution (see Section
3.3.2.2).
To demonstrate this relationship, the bars in the following figures indicate the farmers' perceived
value of such services. Bars oriented to the right indicate that farmers with certain features hold a
higher value regarding different ES. When the bars are oriented to the left, this demonstrates a lower
perceived value of such services by farmers holding the same livelihood features.
As Figure 5.8 shows, farmers with access to large land areas valued land as a climate regulation source
and pollutant absorber higher than traditions (p=0.02) and traditional knowledge (p=0.02). This result
aligns with findings that intensive farmers (which typically work larger areas) value the capacity of land
to absorb pollutants higher than less intensive farmers, as well as have higher awareness of plagues
than other farmers. This is a logical finding, since maize and other cereals crops that demand high
fertiliser inputs normally occupy large irrigated extensions. Furthermore, these farmers often
reported the use of treatment system sludge and commented how some potential hazard components
of sludge were retained by agrarian soils.

CHAPTER 5: UNRAVELING THE SOCIO-CULTURAL VALUES OF ECOSYSTEM SERVICES
- 110 -
Figure 5.8 Valuation differences regarding cropped land areas (-0.1, min -0.16, max)
Figure 5.9 informs that those farmers adopting modern irrigation valued higher the capacity of land
to absorb pollutants (p=0.03) and regulate plagues (p=0.01) than the rest of farmers. Appendix VII
shows that women valued habitat and education services higher than men (p=0.06 and p=0.02). Age
also influenced valuations. While older farmers gave higher importance to the role of land with control
erosion (p=0.04), younger farmers were more conscious about the importance of land as animals’
habitat (p=0.01). Education was also a relevant variable to understand differences in valuations.
Respondents with more advanced levels of study assigned higher importance to the animal habitat as
a supporting function of agrarian landscapes (p=0.05), while designated a lower score to traditional
knowledge (p= 0.09) and education services (p= 0.06).
-0,15 -0,1 -0,05 0 0,05 0,1 0,15 0,2
Food
Water
Climate
Plagues
Erosion
Pollutants
Biodiversity
Habitat
Fertility
Education
Tradition
Trad. Kno
Landscape
Spearman's rho

CHAPTER 5: UNRAVELING THE SOCIO-CULTURAL VALUES OF ECOSYSTEM SERVICES
- 111 -
Figure 5.9 Valuation differences regarding access to modern irrigation (0.3, min - 2.51, max)
5.4. Agrarian ecosystem services trade-off analysis
Since stakeholders perceive different benefits from the same ES, sometimes their valuations can be
difficult to compare. For instance, some services may be recognised by some and not by others, so
those who do not acknowledge them do to attach any value to them. In other cases, individuals may
have a different understanding of the relevance of agrarian ES; certain services may be conceived as
a key element towards wellbeing, whereas others do not consider those services essential (Turner et
al., 2003; Brondízio et al., 2010; Pascual et al., 2013).
Trade-off analysis can be done through a principal component analysis (PCA) and can depicted with a
simple but equally intuitive petal flower diagram (Figure 5.11). PCA was applied to the data from the
Pebble relative valuation (Matson et al., 1997). PCA summarised overall valuations into six
components, which explained 57% of the variance with two factors (one representing food versus the
rest of services and the second one representing the cultural services) explaining 23% of the variance.
The PCA of the 13 ES used in the Pebble exercise illustrated that the factor analysis was multi-
dimensional (i.e. services were differently valued and therefore required six factors to meet the Kaiser
criterion (Kaiser, 1960) by having an eigenvalue higher than one. However, only the first three factors
0 0,5 1 1,5 2 2,5 3
Food
Water
Climate
Plagues**
Erosion
Pollutants**
Biodiversity
Habitat
Fertility
Education
Tradition
Trad. Kno
Landscape
Yes No

CHAPTER 5: UNRAVELING THE SOCIO-CULTURAL VALUES OF ECOSYSTEM SERVICES
- 112 -
are described (33%of variance explained), since the remaining factors account for low variance
(<9%)42.
I labelled the first factor (F1) as Food versus supporting and regulating services, since the factor
reflected that when regulating and supporting services were highly valued, the relative importance of
food production diminished. This is reflected in Figure 5.10 attending to factors one and two (F1 and
F2). The food provisioning service is represented in the ‘X’ (F1) axis (left side of the figure), while
almost all supporting and regulating services appear on the right side of this axis. Thus, when an
interviewee attached importance to provisioning services, they typically valued the supporting and
regulating services less than other services43. Only food provisioning service had high and negative
contribution to F1, while most of the supporting and regulating services had positive contributions
(with exception of pollutant absorption, which was negative but with a very low contribution towards
F1). Only small-scale diversified farmers differed from the rest of farmers typologies regarding
awareness of their practices and its effect on food quality. This reflects that those farmers’ main
objective was food production, which is manifested through their main crops: olive and almond trees,
vegetables, etc. These farmers held partially subsistent agriculture, whereas other farmers’ had a
primary objective of income generation for the household. Figure 5.11 shows that the most intensive
group did not attach much importance to food. Organic farmers valued higher regulating and
supporting services and valued food production lower than when compared to large-scale intensive
and small-scale diversified farmers.
42 This information can be found in Table VII.5 in Appendix VII 43 Table VII.5 (in Appendix VII) shows the same through the weight and the signs of each variable to explain Factor 1.

CHAPTER 5: UNRAVELING THE SOCIO-CULTURAL VALUES OF ECOSYSTEM SERVICES
- 113 -
Figure 5.10 Trade-off analysis of agrarian ES valuation using Principal Component Analysis (PCA)
Factor 2 (F2) reveals the importance attributed by interviewees to agrarian ES for cultural reasons,
which explains why I labelled it as the cultural services factor. This factor is represented by traditional
knowledge and agrarian festivities maintenance (traditions) as well as landscape configuration44.
Those variables have a positive sign and show highest weights on agrarian services valuation. Agrarian
ecosystem as an educative mean was also high and positively scored. In Figure 5.10, axis ‘Y’ (F2)
exhibits the variance regarding cultural services enhancement (upper left quadrant), food provisioning
(bottom left quadrant) and supporting and regulating services (right two quadrants). This means that
when interviewees attributed a relatively high importance to tradition, education and landscape, they
often underplayed the food provisioning service, even rating the latter below other services such as
44 This information can be found at Table VII.5 in Appendix VII.
-1.0 -0.5 0.0 0.5 1.0
-1.0
-0.5
0.0
0.5
1.0
Variables factor map (PCA)
Dim 1 (12.97%)
Dim
2 (
11
.62
%)
P_Food
P_Water
P_Climate
P_Plagues
P_Erosion
P_Pollutant
P_Biodiversity
P_Habitat
P_Fertility
P_Education
P_Tradition
P_Traditional_Knowledge
P_Landscape
P_Food
P_Water
P_Climate
P_Plagues
P_Erosion
P_Pollutant
P_Biodiversity
P_Habitat
P_Fertility
P_Education
P_Tradition
P_Traditional_Knowledge
P_Landscape
P_Food
P_Water
P_Climate
P_Plagues
P_Erosion
P_Pollutant
P_Biodiversity
P_Habitat
P_Fertility
P_Education
P_Tradition
P_Traditional_Knowledge
P_Landscape
P_Food
P_Water
P_Climate
P_Plagues
P_Erosion
P_Pollutant
P_Biodiversity
P_Habitat
P_Fertility
P_Education
P_Tradition
P_Traditional_Knowledge
P_Landscape
P_Food
P_Water
P_Climate
P_Plagues
P_Erosion
P_Pollutant
P_Biodiversity
P_Habitat
P_Fertility
P_Education
P_Tradition
P_Traditional_Knowledge
P_Landscape
P_Food
P_Water
P_Climate
P_Plagues
P_Erosion
P_Pollutant
P_Biodiversity
P_Habitat
P_Fertility
P_Education
P_Tradition
P_Traditional_Knowledge
P_Landscape
P_Food
P_Water
P_Climate
P_Plagues
P_Erosion
P_Pollutant
P_Biodiversity
P_Habitat
P_Fertility
P_Education
P_Tradition
P_Traditional_Knowledge
P_Landscape
P_Food
P_Water
P_Climate
P_Plagues
P_Erosion
P_Pollutant
P_Biodiversity
P_Habitat
P_Fertility
P_Education
P_Tradition
P_Traditional_Knowledge
P_Landscape
P_Food
P_Water
P_Climate
P_Plagues
P_Erosion
P_Pollutant
P_Biodiversity
P_Habitat
P_Fertility
P_Education
P_Tradition
P_Traditional_Knowledge
P_Landscape

CHAPTER 5: UNRAVELING THE SOCIO-CULTURAL VALUES OF ECOSYSTEM SERVICES
- 114 -
fertility, climate regulation capacity and biodiversity. This second trade-off is not as clear as the one
indicated by F1 (12.97%) but still explains 12% of the total variance in ES’ valuation.
The perceived value of food provision (and in a much lower scale water and erosion regulation) as
well as biodiversity and fertility services contributed in an opposite way to the cultural services factor.
The value of the rest of the services was very low (e.g. climate, erosion, habitat and pollutant absorber
capacity). This only reflected that they rarely contributed to this factor. This finding is also reflected in
Figure 5.11, where small-scale diversified farmers’ stated a higher preference towards some cultural
services in comparison to other livelihood profiles.
Finally, factor 3 (F3), labelled life vs. filter system, provided information that can be connected to the
findings when separate capital assets were analysed (Section 5.3.4). Moreover, it is also connected to
the existing valuations of livelihoods and whether the adoption of modern irrigation influences these
valuations. In regard to the values of F3, there was a clear trade-off between the importance
attributed to land as habitat (0.57), biodiversity source (0.41), as food provisioning service (0.30) and
land as a pollutant absorber (-0.56). Thus, this factor compared farmers who attribute low importance
to land due to its capacity to absorb pollutants in contrast to those who attributed high importance to
this function; which is clearly correlated with the notion of fertility (-0.39), as F3 shows. Agrarian
ecosystems, by definition, are grown to produce food and fibres. As Section 4.2.3 outlined, for half of
the participants it was their only source of household income, and for most of them it was an
important part of their livelihood and global economy. As it is intuitively perceived, when attaching
importance to food, habitat and biodiversity, the capacity of land to absorb pollutants was not scored
high. However, this provisioning service exaltation contradicts the more intensive livelihoods, which
were composed of the majority of participants in the study (217 people, the sum of farmers holding
medium-scale intensive and large-scale intensive livelihoods), who valued land’s capacity to absorb
pollutants significantly higher than others (see Section 5.3.4). These results may reflect that, on the
one hand, participants’ responses differed depending on whether their crops were for human
consumption or for biofuels or animal feeding. Moreover, it may also reflect that if small-scale
diversified farmers did value the option of their land to absorb pollutants, an over-use of land for this
purpose could imply polluting all their lands; which is why farmers typically attached a lower value to
this kind of agrarian services.
Drawing on Raudsepp-Hearne (2010), Figure 5.11 below presents the results of ES valuation across
livelihood profiles using flower diagrams, in which the petal length reflects the relative importance
attributed to the correspondent service by the interviewees.

CHAPTER 5: UNRAVELING THE SOCIO-CULTURAL VALUES OF ECOSYSTEM SERVICES
- 115 -
Figure 5.11. Trade-off analysis of agrarian ES valuation among existing livelihoods
Note: Flower diagrams showing the relative value of each stated preference for each agrarian ecosystem service by type of livelihood. Petal sizes range are a scaled mean from zero (petal absent, indicating a low value for the agrarian service) to one as a large petal (indicating a high value for the service). Each colour refers to a different kind of agrarian ecosystem service.
The flower diagrams depict a reflection of trade-offs and synergies across existing livelihood groups;
a base point of various sets of preferences associated with livelihood trajectories. It can be seen, in
the top right of Figure 5.11, that medium-scale rainfed organic farmers assigned higher importance to
regulating services such as climate, plagues and erosion regulation, biodiversity, fertility and
traditional knowledge. Small-scale diversified farmers (top left) placed a higher value on education,
tradition, landscape, and habitat; water was also quite valued by this group. Medium-scale intensive
Pebble valuation by livelihoods
Small-scale diversifiedMedium-scale rainfed organic
Medium-scale intensiveLarge-scale intensive
Food
Water
ClimatePlagues
Erosion
Pollutants
Biodiversity
Habitat
Fertility
EducationTradition
Traditional Knowledge
Landscape

CHAPTER 5: UNRAVELING THE SOCIO-CULTURAL VALUES OF ECOSYSTEM SERVICES
- 116 -
farmers (bottom left) have a low representation of food production as they do not value it as highly
when compared to the other livelihood typologies. However, medium intensive farmers place high
valuation on water, pollutants regulation, habitats and education, whereas large-scale intensive
farmers (bottom right) have clearly designated food as the highest value.
Although comparing livelihood profiles did not yield significant differences across the relative
valuation of agrarian ES, it did however generate an understanding of coherent valuation tendencies
regarding land management choices and the kind of services that are valued (i.e. the farmers’ practices
a priori promoted the services they valued). This is, those who did not perform such intensive practices
appreciated regulating and supporting services (medium-scale rainfed organic farmers) higher than
other farmer groups, while knowledge and traditions were more highly valued by small-scale
diversified owners and farmers. Additionally, the analysis also demonstrates that intensive farming (in
this case through large-scale modern irrigation) also influences valuation. The more land extension
under irrigated system, the higher a farmer values the capacity of land to absorb pollutants and its
capacity for biological control. Intensive farmers also valued traditions and traditional knowledge
services less than other farmers holding different livelihoods.
5.5. Discussion
The discussion of the results presented so far in the chapter is divided in two subsections. Subsection
5.5.1 discusses how farmers’ valuation of ES as related to their livelihood profiles contribute towards
a better theoretical understanding of ES valuation frameworks found in the literature. Findings
confirm that agricultural intensification influence farmers’ perceptions about agrarian ES. This
chapter’s findings indicate that while an across-livelihoods comparison may not reveal significant
differences, focusing on separate variables linked to intensification does disclose richer information.
Subsection 5.5.2 centres in an assessment of the provisioning and cultural services trade-offs and the
implications of disregarding cultural ES values. Furthermore, this section also clarifies how land use
intensification influences farmers’ perception about food production.
5.5.1. Understanding how livelihood profiles effect ecosystem services values
In Chapter 0, I outlined the analysis design of classifying Navarre farmers into different livelihood
profiles. Their strategies were categorised in a virtual gradient of land management intensity regime
which was developed according to the type of crops grown, fertiliser used, how the land was worked
and the type of irrigation system. Although not ideal, these aspects were the only variables which
provided insights into the distinct agricultural management strategies present in the study region. The
CHAPTER 5: UNRAVELING THE SOCIO-CULTURAL VALUES OF ECOSYSTEM SERVICES
- 117 -
clusters generated were not solely composed of the farmers with these characteristics, though a
majority of participants within these groups held these features.
I hypothesised that farmers’ management practices are related with the values they attribute to
agrarian ES; i.e. farmers’ decisions about their land management practices are connected to the
importance in which they attribute to use, non-use, option and bequest values associated with
different ES. However, as shown in Section 5.3.2, this hypothesis only held significant for small-scale
diversified farmers and for one typology of services. This group attached significantly higher values to
the recreation services provided by agrarian ecosystems than the other three groups.
Small-scale diversified farmers’ land management practices consisted of the cultivation of small plots
(less than one hectare) of diverse woody and vegetable crops using traditional irrigation and mineral,
organic or mixed fertilisers. These farmers placed a higher value to the immaterial benefits connected
to the subjective happiness dimension of human wellbeing which are provided through recreational
services, and also embraced option and bequest values. The farmers within this livelihood placed a
higher value on tourism recreation, which may be because some of the respondents within this
typology were previously dedicated to rural tourism and associated businesses when the survey was
performed.
This observation led me to realise that their land management strategies seemed not to respond solely
to their perceived values, but also to the circumstances for which they decided to follow one strategy
or another. As mentioned in the Chapter 0, all livelihoods were dynamic and related to the current
stage of farmers’ life. In other words, personal attributes such as age, experience, gender, etc.
influence the values held by each individual towards ES; values and circumstances are not two
independent factors explaining management styles. Thus, one could think that some of small-scale
diversified farmers could follow intensive agricultural practices if their situation changed, such as not
having an additional income source which would thereby affect renting and land buying decisions. In
fact, small-scale diversified farmers presented mixed features of irrigation adoption and fertiliser use,
which means that they were not very different from intensive farmers, except from the size of the
cultivated lands and the cropping patterns. Such profile could thus reflect more to their current age
or previous decisions on their livelihoods than to the values attached to the ES. In contrast, medium-
scale rainfed organic group involved farmers who had made a conscious decision about how to
produce their crops differently and the weight of attached values are presumably higher in this case.
In their case, circumstances in terms of age, gender, experience etc. were similar to intensive farmers,
but their values led them to choose a different land management strategy.
CHAPTER 5: UNRAVELING THE SOCIO-CULTURAL VALUES OF ECOSYSTEM SERVICES
- 118 -
On the contrary, when attending to individual features directly connected to modern irrigation
transformation, such as the type of installation and the size of the irrigated lands, I found significant
differences in agrarian ecosystem service valuations. Those with a modern irrigation installation
valued land capacity to regulate plagues (p=0.01) and its capacity to absorb pollutants (p=0.03) higher.
Moreover, those with larger irrigated farms not only valued those two services more (p=0.06 and
p=0.00 respectively), but they also valued traditions (p=0.02) and traditional knowledge (p=0.02)
associated to agrarian ES significantly lower. In general, cultural services valuation trends shown in
the trade-off analysis performed in the PCA and depicted through the flower diagrams disclosed that,
although not significant, small-scale diversified farmers valued highly cultural services. Moreover,
farmers within this livelihood are more conscious about the importance of rural traditions and
traditional knowledge. This was exampled in the case in Iniesta-Arandia et al. (2014) where farmers
not only contributed to food provisioning, but also to the delivery of those type of services.
There may be a possible connection between farm size and the knowledge and identity benefits
perceived by stakeholders. This seems plausible, as practices performed in large farms are typically
associated with heavy machinery and automated irrigation and fertilisation systems, all of which
involve a different connection between the farmer and the ecosystem. This is, small-scale traditional
agriculture is often characterised by manual labour and the farmers’ knowledge of land quality, crop
cycles and climate, which are crucial elements and subjected to heritage traditions. Due to the direct
contact the farmer has with the land and the implicit reflective process on obtaining profit without
damaging the ecosystem, there is a stronger link between the ecosystem and the farmer.
Agricultural intensification leads to the emergence of new landscapes that may contribute to the loss
of identity to the original landscape. Irrigation transformation implies land concentrations with the
consequent simplification of landscapes, the disappearance of micro-elements (hedges, borders,
slopes, woods etc.) and the introduction of new elements such as irrigation infrastructure (De Vries,
A, and Garcia M., 2012).
Furthermore, these results also inform about co-production awareness, which provides opportunities
for beter policy planning. Here, I do not only identify which agrarian services are greatly valued, but I
also inform about which services are perceived to influence farmers’ labour practices. Fertility was
valued highly and simultaneously perceived as a co-produced service through farmers’ labour. The
promotion of land management practices that improved fertility would be welcomed by farmers.
Regulating services such as biological control, pollutant regulation and climate regulation (although
perceived as co-managed services), were not particularly valued by farmers. These could be conflicting
viewpoints when adopting potential regulating service enhancement measures. Again, small-scale

CHAPTER 5: UNRAVELING THE SOCIO-CULTURAL VALUES OF ECOSYSTEM SERVICES
- 119 -
diversified farmers were the only group who were significantly more mindful about their management
effects on the quality of food.
5.5.2. Agrarian ecosystem services trade-offs
PCA has allowed me to discern that supporting services (on which the rest of services depend),
regulating services (necessary for long term sustainability), and cultural services (that encourage
individual roots and help determine social behaviour) are eclipsed by short-term, direct use food
production. These results align with previous studies (Carpenter et al., 2009; Martín-López et al.,
2012b; Palomo et al., 2013) that indicated the existence of two confronting aims: environmental
conservation and rural development. In this case, this common trade-off occurs as it is not only an
issue of provisioning services related to food and other regulating and supporting services but also to
cultural services. These types of trade-offs have been widely acknowledged, and within several scales
using other methodologies (Chan et al., 2012; Iniesta-Arandia et al., 2014). However, I have been
unable to find any study in ‘developed countries’ which assesses the potential trade-offs of agrarian
ES under transformation due to a technological change, such as irrigation. Moreover, insignificant
trade-offs among livelihoods and significant trade-offs across separate variables provide reflection
when considering the results of other studies. I also found that even food production seems to be
undervalued by the most intensive livelihoods, disclosing that appreciation is not necessarily placed
with the act of producing food, but instead with the income generation through the growing of crops,
regardless of the products final use.
It is true that the majority of participants placed a higher value on provisioning services, revealing an
agreement that food provisioning service is fundamental. Value conflict45 is found in regard to
regulating services such as climate and pollutant regulation and some cultural services. Fieldwork
revealed that participants did not equally understand the functions behind those services, and
consequently, did not attach the same value to them, which in turn was reflected as a value conflict.
On the other hand, cultural ES (traditions, landscape and traditional knowledge) were the least valued
services. In MA terms, such cultural services are ‘memories’ from past cultural ties. If the farmers who
value these services recede, future generations may people might not be exposed to the possibilities
such legacy could have offered. Consequently, this could influence the decisions we make regarding
what to remember and what to forget (Henle et al., 2008). So, if intensive land management becomes
the dominant landscape and socio-cultural structures cease, alternative models with a higher value of
45 When parties involved do not agree on the basic understanding of the issue discussed, what values are at stake and which should be given priority to (Vatn, 2007).

CHAPTER 5: UNRAVELING THE SOCIO-CULTURAL VALUES OF ECOSYSTEM SERVICES
- 120 -
cultural services might dissipate over time. Human wellbeing dimensions (happiness, social relations,
freedom and health) connected to cultural services are linked to livelihood and can help determine an
individual’s worldview and attitude (Poe et al., 2013). Thus, they are pivotal within the maintenance
of ecological functions. The motives of cultural ES valuation depend upon moral, aesthetic and other
cultural perspectives of the stakeholders involved (Hein et al., 2006; MEA, 2005a). The low valuation
of those services could be partially attributed to their poor recognition in policy and science (Díaz et
al., 2015a) and the consequent poor communication of their value to farmers (lack of incentives such
as subsidies and technical aid). Legitimacy of politics and academic works can influence farmers’
perceptions, which over time can be incorporated and accepted as facts (Vatn, 2007).
Although food provisioning was categorised as the most valued ES, I also found that medium-scale
intensive-type farmers valued these services significantly less than of the other livelihood profiles
(Figure 5.11). The decline of traditional farming in Europe is an issue that transcends the local scale.
This result parallels research by Iniesta-Arandia et al. (2014) and provides an explanation which could
clarify these findings. As Foley et al., (2011) also found, an important part of younger farmers’
production (which is over-represented within the intensive livelihood typologies) is not devoted to
direct consumption markets, but to animal feed, bio-energy and other industrial products such as
fibres. Although the percentage of agriculture dedicated to non-human market is not registered in this
case study, fieldwork suggests that a large part of the reported crops was used for biodiesel production
and animal feed. Additionally, the market orientation for income generation may be working against
farmers’ perceived importance of food quality. Only small-scale diversified farmers upholding more
traditional practices were significantly more conscious about their co-production on food quality,
which can be explained by the mere orientation of the production toward supplying local food
markets, friends, relatives and their families.
Irrigation transformation promotes an intensive farming model that is proposed by the government
and its linked technical organisations such as INTIA. These institutions presented modern irrigation as
an opportunity for increasing provisioning services quantities, therefore household income, and job
opportunities for future generations. In contrast, farmers with livelihoods outside of the current agro-
industry were propositioned to sell their lands, move to other lands in a rainfed area, or convert to
the promoted intensive model. These were the three options offered by Navarre Government to the
farmers who revealed their preferences towards food and cultural services. Moreover, cultural
services are the outcome of the human-ecological interactions and the foundation which sets the
preferences towards the rest of ES management (K. M. Chan et al., 2012). Time will reveal whether
small-scale diversified and medium-scale rainfed organic farmers co-exist under a more intensive land
management regime or whether intensification will suppose those kind of livelihoods disappearance.
CHAPTER 5: UNRAVELING THE SOCIO-CULTURAL VALUES OF ECOSYSTEM SERVICES
- 121 -
In this case, we may be facing an irreconcilable situation. Although they both refused to convert into
an intensive livelihood, they may not be able to maintain their practices due to the influence of
intensive practices surrounding them. Cultural services such as landscape and traditions would also
be threatened if the institutions promoting intensive land management regimes ignore them when
establishing agrarian policies. The results of this work are aligned with the results of Chan (2012)
regarding the importance of making an appropriate valuation which includes cultural dimensions that
enable decision-making, and is ecologically appropriate and socially just.
5.6. Summary
This chapter has set out that modern irrigation influences the farmers value system, as they may only
pursue services linked to such land management practices. This chapter has shown that farmers with
access to large irrigated land areas placed a higher value of the land’s pollution absorption capacity
and its biological control service than other kind of services. In contrast, small-scale diversified
farmers’ who value more cultural services in comparison to the rest of groupf of farmers. However, I
did not observe any significant trade-offs in the way groups of farmers sharing different livelihoods
valued ES.
Chapter 0 provided evidence of an imbalance of land and water resource distribution as an outcome
of the different livelihood strategies. Farmers that follow an iintensive livelihood profile were
acquiring new lands through purchase and rental agreements. Chapter 0 has furthered this fact by
informing about other potential impacts on ES promoted by modern irrigation, intensification and
thus through different livelihood profiles, which in turn are associaded with potentially different
valuations of ES. As a consequence of modern irrigation, a loss of mosaic landscape is occurring, along
with the detachment from traditional knowledge and connected heritage traditions, as well as
recreational, aesthetic, and spiritual benefits (De Vries, A, and Garcia M., 2012). Those services and
benefits are the least valued in general by all the farmer groups with exception of small-scale
diversified farmers. Those farmers are not gaining access to either land or water resources.
Furthermore, they may be losing their access to those valuable services.
Next, it is questioned whether the present institutional structures are poorly suited for ensuring long
term sustainability for small-scale diversified farmers and their preferences. I postulate that this is and
will continue being the case as long as the financial gain is the basic motivator driving the system.
Private interest is the source of the found tendencies (Zhang et al., 2007) and it is a reflect within the
effects of large-scale economies on small-scale societies. These reflections are answered in Chapter 0.

CHAPTER 5: UNRAVELING THE SOCIO-CULTURAL VALUES OF ECOSYSTEM SERVICES
- 122 -
Next Chapter 6, explores farmers’ uneven vulnerability to multiple rural stressors and the role that
adopting modern irrigation has on it.

CHAPTER 6: FARMERS’ VULNERABILITY TO EXTERNAL STRESSORS
- 123 -
CHAPTER 6
“Ecological arguments are never socially neutral any more than socio-political arguments are
ecologically neutral”
David Harvey
6. Farmers’ vulnerability to external stressors
6.1. Introduction
The previous chapter showed insignificant differences on the relative valuation of agrarian ES across
farmers with different livelihood profiles. Classifying farmers according to their land management
intensity regime does not reveal diverging valuations. However, certain variables connected to land
management intensity (e.g. area of farmland and whether or not farmers had installed modern
irrigation) suggest that farmers who adopted modern irrigation attribute greater importance to the
capacity of land to absorb pollutants and to control plagues than other farmer typologies. These
farmers also place a lower value on traditions and traditional knowledge than other farmer typologies.
Overall, these findings suggest that these farmers prefer the private benefits derived from agricultural
intensification over other type of benefits, even if such benefits are realised at the expense of
overexploiting the soil’s pollution absorption capacity and neglecting other cultural services
associated to identity and knowledge sharing.
This chapter turns now to investigate the adoption of modern irrigation from a different standpoint:
it examines if the access to modern irrigation increases or decreases farmers and landowners’
vulnerability to external stressors and shocks. The chapter contributes to answering Research
Question 3, i.e. Which livelihoods are more vulnerable to (1) climate variability and drought and (2)
crop price volatility and why this may be the case? I investigate the main stressors and shocks faced
by rural livelihoods and identify which farmers and landowners are more exposed to such threats, as
well as which assets contribute to farmers’ sensitivity and adaptive response capacity. I focus on the
role that modern irrigation plays in determining farming households’ vulnerability.
According to the IPCC (2014), climate change is likely to result in an increased reduction in water
availability from rivers and groundwater sources. The combination of increased water demand (e.g.

CHAPTER 6: FARMERS’ VULNERABILITY TO EXTERNAL STRESSORS
- 124 -
irrigation, energy and industry, domestic use) and reduced water drainage and runoff due to increased
evaporation, can result in several risks for many countries and economic sectors worldwide, but
particularly in southern Europe. This evidence, however, was not evident in the case study region,
where the majority of interviewed farmers (66%) manifested a lack of concern about future water
availability and, in fact, were in favour of endorsing modern irrigation to increase water consumption
and increase their competitiveness, regardless of potential investment for the long term. In this
context, I hypothesise that modern irrigation in Navarre might negatively impact the livelihoods of
some farmers and jeopardise the capacity to adapt to external stressors such as climate and market
changes. Further I also hypothesise that modern irrigation installation might instead lead farmers to
mal-adaptation.46
There is no consensus in the literature over the efficiency of modern irrigation (Berbel and Mateos,
Cabello et al., 2015; Tarjuelo et al., 2015) or to which extent it reduces or increases rural households’
vulnerability to drought (Wilhelmi and Wilhite, 2002). For instance, Edwards et al. (2010) show that
long droughts in Australia were not solved by the introduction of irrigation. Berbel and Mateos (2014)
assess the expansion of cultivated lands in Spain (north of Aragon and Andalusia) and demonstrate
that, counter-intuitively, modern irrigation results in higher water consumption and an increased
dependency on water for farming. In contrast, Tarjuelo et al., (2015) argue that modern irrigation in
Spain has increased water-use and energy efficiency. In this dissertation, I sustain that such arguments
about efficiency mask other unintended consequences of modern irrigation, such as increased
indebtedness and strong dependency in increasingly fewer crop markets (see e.g. Dumont et al, 2013).
The analysis carried out in this chapter is time and scale specific; therefore, the results do not capture
changes over time, assuming that adaptive capacity, sensitivity and exposure to external drivers are
constant (see also O’Brien et al., 2004; Vincent, 2004). Consequently, the study might be blind to
longer-term evolutions of social, political and environmental factors. As developed in Chapters 2 and
3, the analysis is based on the development of a vulnerability index, which in turn relies on the
livelihood analysis of Chapter 0, and it is also informed by additional data collected through interviews
and focus groups.
Figure 6.1 illustrates the reasoning behind the analytical process developed in this chapter, which is
structured in seven sections, including the introduction. Section 6.2 reviews the three main
dimensions of vulnerability following IPCC guidelines (IPCC, 2001): exposure, sensitivity and adaptive
capacity. Section 6.3 discusses the main stressors faced by farmers in the case study area. Insights
46 “Mal-adaptation occurs when a short term response inadvertently leads to an increase in future vulnerability” (Barros et al., 2014, p.214).

CHAPTER 6: FARMERS’ VULNERABILITY TO EXTERNAL STRESSORS
- 125 -
from semi-structured interviews are used to identify such stressors, which are then ranked by farmers
according to their own perceived importance. Then, statistical data of the highest ranked stressors
(price and climatic fluctuations as well as drought shocks) are used to calculate the farmers’ current
exposure. Overall, these two sections correspond with the left side of Figure 6.1.
Figure 6.1 Line of reasoning for the analytical process in Chapter 6
Section 6.4, identifies data collected through surveys which provide approximate information
regarding the assets and socio-demographic features influencing the sensitivity and adaptive capacity
of farming households to the selected stressors. First, principal components of vulnerability are
calculated (see Section 3.3.3) based on capital assets and socio-demographic features. This calculation
illustrates disaggregated data regarding how household assets influence vulnerability patterns and
also permits disclosing potential asset combinations that can decrease such vulnerability. Next, in
alignment with the IPCC vulnerability definition, the information is aggregated in an index (hereafter
VI). Assets are grouped into the IPCC’s three contributing factors to vulnerability (IPCC, 2001):
exposure, adaptive capacity and sensitivity (Hahn et al. 2009). Such index is represented in the bottom
right side of Figure 6.1, and it identifies the most vulnerable farmer typologies (Eakin and Bojórquez-
Tapia, 2008).

CHAPTER 6: FARMERS’ VULNERABILITY TO EXTERNAL STRESSORS
- 126 -
Finally, Section 6.5 discusses the chapter findings and highlights if there are ‘double exposed’
vulnerable livelihoods (sensu O'Brien and Leichenko, 2000); i.e. if the same farmer groups are
simultaneously vulnerable to climate variability, including drought, and the volatility of crop prices.
This section also draws on interview and focus group material to further contextualise the results.
Reflections about the strengths and weaknesses of vulnerability indexes are also included here. Table
6.1 synthesises the type of data sources used in this chapter, the demographic of each source and the
purpose for which the data is used.
Table 6.1 Summary of the data sources used for the analysis of farmers’ vulnerability
Data source Demographic Purpose
Qualitative interviews
29 interviews randomly selected including farmers, scientists, policy-makers, NGOs, cooperative workers, consumer groups and water management companies’ officers
Identification of perceived rural stressors faced by farmers in the last decade and other contextual information
Quantitative household survey
381 households randomly selected from the 22 villages affected by Itoiz-
Canal de Navarra project
Analysis of the weights farmers attributed to the previously mentioned factors of stress and identification of the assets that composite households sensitivity and adaptive capacity - components of the vulnerability indexes
Qualitative interviews
19 stratified sample of farmers in the village of Miranda de Arga
Analysis of farmers’ perceptions about the importance of assets influencing their own vulnerability and adaptive capacity
Focus group 5 individuals intentionally selected: farmers and landholders from Miranda de Arga, a local environmental activist, and an INTIA technician
Analysis of farmers’ perceptions about the importance of assets influencing their own vulnerability and adaptive capacity
6.2. Applied theories about exposure, sensitivity and adaptive capacity
6.2.1. Exposure to climate variability, drought and crop price volatility
Agriculture is considered a risky economic activity. Exogenous factors, such as the changing costs of
production inputs and the uncertainty of weather, pests, and plant diseases, act as factors that can
influence the phases of the agricultural cycle. These latter risks might intensify with anthropogenic

CHAPTER 6: FARMERS’ VULNERABILITY TO EXTERNAL STRESSORS
- 127 -
climate change and globalisation-induced price volatility47 (Isakson, 2014). When assessing
vulnerability, what someone or something is vulnerable to should be considered; i.e. identifying the
stress factors affecting farmers’ livelihoods (Birkmann and Wisner, 2006; Cutter, 2016). In this
research, and as noted in Section 2.4, farmers’ vulnerability is assessed with respect to two locally
identified stressors, climate variability and crop prices fluctuations48, and a shock, i.e. drought. To
analyse exposure to climate variability and drought, climatic station data were used (see Section
3.3.3). In order to assess farmers’ exposure to price volatility, data was used from official sources
examining the primary crops produced and their prices in the study area, i.e. cereals (wheat and
barley), maize and vineyards49 (see Section 3.3.3).
6.2.2. Sensitivity to climate variability, drought and crop prices volatility
Sensitivity can be described as the degree to which a system (e.g. social, economic) is affected by or
is responsive to external stimuli (Brooks et al., 2005; Stocker et al., 2013). Generally, a household’s
sensitivity to a given stressor is a function of combined factors, including the household’s structure
(e.g. the number of family members who are economically dependent) and the existence of a broader
livelihood portfolio – i.e. the availability of alternative non-farm income as complementary strategies
to buffer vulnerability (Antwi-Agyei et al., 2013).
Additionally, the sensitivity of rural households to different stressors is influenced by the type of the
crop, which influences investment levels and labour requirements, land tenure and land availability,
which also affect financial and human investment behavior, and the level of farmers' income
diversification, which determine farmers' bargaining power and exposure to risk. Prior experiences
with large-scale investments (e.g. resulting in distinct levels of awareness at the negotiation stage)
and contract terms (e.g. input provision arrangements, transparency, barriers to exit), and
diversification of market outlets (German et al., 2011) can also influence households’ sensitivity.50
47 Prices volatility refers to variations in economic variables over time (FAO and UNCTAD, 2011). Not all variations are problematic but become challenging when considerable and cannot be anticipated and, as a result, create a level of uncertainty that increases risks for producers, traders, consumers and governments (FAO and UNCTAD, 2011). 48 Stresses are pressures that are continuous and cumulative, predictable and negative while shocks are impacts that are typically sudden, unpredictable and traumatic (Luers et al., 2003b). 49 It was not possible to account for vegetables and woody crops export-import balance since they were registered in an aggregated way during fieldwork. This is a study caveat that has consequences for the analysis of small scale diversified farmers’ vulnerability, who are usually those that grow these crops. 50 See Appendix VIII, Table VIII.2 and Table VIII.3.

CHAPTER 6: FARMERS’ VULNERABILITY TO EXTERNAL STRESSORS
- 128 -
6.2.3. Adaptive capacity to climate variability, drought and crop prices volatility
A household’s adaptive capacity can be defined as the household’s capabilities that enable it to alter
or structurally reorganise its activities, in order to reduce current livelihood threats while
simultaneously enhancing its ability to counter new risks (Eakin, 2005). Therefore, a household’s
capacity to address the risks of multiple stressors has been described as a function of indicators
measuring various types of capitals. These capitals can include access to information, technology,
wealth and finance, and institutional resources (such as subsidies or other forms of external support)
(Eakin and Bojórquez-Tapia, 2008). Therefore, the capacity of the households to access and put their
assets into action will determine their ability to adapt, anticipate or react.51
Education is a crucial human capital asset that helps to increase adaptive capacity. Increased literacy
can improve access to information about key stressors and thus potentially enhance people’s capacity
to buffer against their potential impacts (Antwi-Agyei et al., 2013). Households may also be able to
increase their adaptive capacity when they have access to social capital, including participation in
social networks (Eakin and Bojórquez-Tapia, 2008; Hahn et al., 2009), family-based interactions, and
through cooperative ties, which can provide support that transcends socioeconomic factors (Antwi-
Agyei et al., 2013).
Farmers can shift their land management to a less vulnerable condition (Luers et al., 2003a). Age,
disability and health status, which are determinants of human capital, are key indicators that can
shape adaptive capacity of individuals to climate and non-climate related hazards (see IPCC, 2014a
from Campos, et al., 2014). In addition, financial assets are widely recognised as enabling anticipatory
coping strategies, including insurance and post-event responses to a shock or stress (Vincent, 2004).
Furthermore, individuals with access to physical assets are able to maintain their livelihoods, hence
widening the range or intensity of hazards for which they can cope (Vincent, 2004).
Although its is debated if modern irrigation may be a mal-adaptive measure and under which
conditions this might be the case, this dissertation considers that the adoption of such technology may
promote adaptation to adverse climatic change effects in the calculation of the index (Mendelsohn
and Seo, 2007; Deressa et al., 2009). Irrigation is hence included as one component of physical assets
in the VI calculations, and it is thus related to farmers’ adaptive capacity (Section 3.3 and Appendix
VIII). Throughout the chapter, I evaluate the adoption of modern irrigation to understand how it
relates to other assets and its potential effects on farmers’ sensitivity and vulnerability.
51 See Appendix VIII, Table VIII.2 and Table VIII.3.

CHAPTER 6: FARMERS’ VULNERABILITY TO EXTERNAL STRESSORS
- 129 -
6.3. Rural livelihoods’ exposure to multiple threats
During the first round of interviews (see Section 3.3.1 and Appendix I), farmers reported drought and
their lack of control over crops’ selling price as key risks to their livelihoods (for similar findings see
Eakin and Bojórquez-Tapia, 2008; Hahn et al., 2009; Isakson, 2014; Campos, et al., 2014). Participatory
observation also revealed concerns about climate variability. Surveyed farmers reported the absence
of institutional support as an important factor of stress, but to a lesser degree. Table 6.2 shows
farmers’ assessments of each stressor and shock reported during the survey.

CHAPTER 6: FARMERS’ VULNERABILITY TO EXTERNAL STRESSORS
- 130 -
Table 6.2 Valuation of rural stressors and shock, ordered from most (5) to least (0) important
Stressors mean sd
Price Volatility 4.07 1.61
Drought 3.35 1.91
Lack of institutional support 2.84 1.90
Source: author’s survey data analysis.52
When asked to evaluate the shock and stressors in a scale from zero to five (zero as insignificant and
five very important), 82% of the survey respondents assigned the highest importance to not having
control over crops’ selling price, - they explained that external factors in which they had not control
such as oil prices made crop prices fluctuate – they thus perceived price volatility as the most relevant
stressor.
Data provided by the Department of Agriculture of Navarre revealed that the volatility of the dominant
crops’ price has been higher during the 2000-2010 decade than in the previous two decades. Since
2006, all assessed crops have experienced considerable price volatility. Prices rose sharply in 2006 and
2007, peaking in the second half of 2007 for some products (Gobierno de Navarra, 2015). Figure 6.2
illustrates the volatility of the affected crops.
Figure 6.2 Price volatility for the period (1995-2014) by farmers in Navarre
52 Tables not showing a source means that they are derived from the author’s survey data analysis.
-80%
-60%
-40%
-20%
00%
20%
40%
60%
80%
19
95
19
96
19
97
19
98
19
99
20
00
20
01
20
02
20
03
20
04
20
05
20
06
20
07
20
08
20
09
20
10
20
11
20
12
20
13
Pe
rce
ive
d p
rice
vo
lati
lity
Time series (1995-2014)
Winther-wheat
Barley
Corn
Red wine

CHAPTER 6: FARMERS’ VULNERABILITY TO EXTERNAL STRESSORS
- 131 -
Future projections also point to increases in the volatility of food prices worldwide. Growing
population and rising disposable income in emerging and developing countries add to the increasing
demand for food, which coupled with the growing demand for feed crops and biofuels, will exert
further pressure on commodity prices (FAO and UNCTAD, 2011). In the future, situations such as low
crop stocks due to climatic factors are predicted to happen more often (FAO and UNCTAD, 2011).
Agricultural commodity prices are also becoming increasingly correlated with oil price (through the
price of fuel and fertiliser, for example). Potentially, high and volatile oil prices could therefore
contribute to higher and more volatile agricultural prices. This could occur due to higher input costs,
an increased demand for the commodities used in the production of biofuels (sugar, maize, vegetable
oils) and through competition for land (FAO and UNCTAD, 2011). The IPCC (2014) also warns that
periods of rapid food and cereal price increases following climate extremes in key producing regions
indicate a sensitivity of current markets to climate extremes.
Information gathered through interviews suggests that farmers with a more market-oriented profile,
e.g. the intensive farmers, were completely dependent on such international markets. One of these
farmers noted the following:
‘Regarding price there is no chance we can act upon. There is a grain bag traded daily. Wheat
and barley prices are determined by traders... If you look at the Madrid stock exchange, these
prices are changing every minute. This and the cost of energy (oil, transport) determine the
price! If we talk about cereals, producers are in Argentina, Russia, Australia, and Europe.
Cereals are exported from these places, we consume them. In Navarre, we have a negative
balance. If I bring cereal from EEUU here, the price will be assigned by the stock market, plus
the cost of transport: the ship to get here, crops transfer to the port, truck costs to get to my
factory. This is globalisation, the global economy. This happens to all products!’ (I2.4)53
Perceptions such as this one above were shared by at least 30% of the respondents, and were also
frequent during the interviews and focus group discussion.
Sixty percent of the surveyed farmers also considered drought as an important shock to their
livelihoods. However, variance54 was high for this stressor, which might be explained by differences in
53 Quotation not indicating a source means they are derived from the author's interviews data analysis and are self-translated. 54 Although I tried to make clear I was referring to agronomic drought (e.g. humidity deficit in the land following a meteorology drought thus negatively impacting crops production) results suggest that some survey respondents may have misunderstood this explanation.

CHAPTER 6: FARMERS’ VULNERABILITY TO EXTERNAL STRESSORS
- 132 -
memory recall and by the climatic differences existing between Zona Media and Ribera Alta, where
the former is wetter than the latter.
Finally, 45% of the respondents believed that institutional support from formal organisations was
insufficient and that such organisation did not provide enough subsidies to make most farming
livelihood economically viable. Institutions regulate access to key assets that can impact the
vulnerability of farmers, such as medium-scale organic farmers (Adger, 2006; IPCC, 2014). As farmers
reported institutions to be unsupportive, they characterised this to be a high stress factor. The high
standard deviation of responses in this case may be associated with varying levels of comprehension
regarding the questions provided. This stress factor is not analysed in this chapter, but deserves
attention in Chapter 0.
The importance attributed to the different stressors significantly differed according to the farmers’
distinct livelihood portfolios (Table 6.3). Small-scale diversified farmers considered price volatility and
drought as the least important stressors, and in doing so they highly contrasted with intensive farmers.
This result confirms that small-scale diversified farmers are not characterised by a strong market-
oriented profile and that this livelihood profile does not typically depend solely on agriculture-based
income. Medium-scale rainfed organic farmers were the most concerned with the absence of
institutional support and argued for increasing public support to improve their land management
practices and crop commercialisation capabilities.
Table 6.3 Differences among existing livelihoods regarding their perception about stress and shock
factors (index from 0 min to 5 max.)
Adjusted Likert valuation method
Stressors
valuations
Small-scale
diversified
Medium-scale
rainfed organic
Medium-
scale
intensive
Large-scale
intensive
(p.value)
** Price Volatility 3.35 4.18 4.70 4.27 (1.68e-05)
** Drought 2.68 2.86 3.74 3.79 (1.30e-04)
* Lack of institutional support
2.64 3.45 3.07 2.75 (1.08e-01)
* When stressors are perceived significantly different at a 90% of significance by farmers with different livelihoods
** When stressors are perceived significantly different at a 95% of significance

CHAPTER 6: FARMERS’ VULNERABILITY TO EXTERNAL STRESSORS
- 133 -
6.4. Measuring vulnerability
As introduced in Section 6.1 and illustrated in Figure 6.3 and Figure 6.4, the vulnerability index (VI) is
structured around three analytical dimensions: exposure, sensitivity and adaptive capacity of
vulnerability. Each of these, in turn, has a set of components (level 3 in Figure 6.3 and Figure 6.4) and
sub-components (level 4 in Figure 6.3 and Figure 6.4) that bring together the analytical variables
corresponding with the five types of capitals and other socio-demographic variables (see Section
3.3.3).
Farmers’ vulnerability to climate variability was calculated according to climate characteristics and its
fluctuations over time and farmers’ explanatory components of exposure, sensitivity and adaptive
capacity to such stressors (see Figure 6.3Figure 6.4). Exposure to price volatility was determined by
the number of crops farmers grow in the study area, the cultivated land area, as well as crops’ price
volatility from previous years (see Figure 6.4).
Sensitivity55 encompasses three analytical variables that differ to those used when referring to
vulnerability to market prices stressors. Adaptive capacity encompasses five components: human,
socio-demographic (e.g. gender, age), financial, physical and social (at level 3), which are neither
composed of the same analytical variables (level 4) in Figure 6.3 and Figure 6.4. Such components are
selected based on literature review and availability in the survey.
Figure 6.3 Categorisation of analytical variables, components and contributing factors from the
IPCC vulnerability definition for climate connected stressors and shocks
55 The word ‘sensitivity’ is used twice at level 3 and level 2 (see Figure 6.4).

CHAPTER 6: FARMERS’ VULNERABILITY TO EXTERNAL STRESSORS
- 134 -
Figure 6.4 Categorisation of analytical variables, components and contributing factors from the
IPCC vulnerability definition for crop prices connected stressors
6.4.1. Vulnerability to rainfall variability and drought
This section calculates the VI to analyse farmers’ vulnerability to climate variability and drought.
Unsurprisingly, this stress and this shock affect the case study farmers differently (Table 6.4). Index
values should be interpreted as relative values to be considered within the study sample only. The VI
to climate variability and drought (VI_climate) is on a scale from -0.10 (least vulnerable) to 0.24 (most
vulnerable). These values were the minimum and maximum results of VI_climate for each household.
I established thresholds of vulnerability dividing households in four groups into four quartiles (0-25,
25-50, 50-75 and >75%) of the total result. Intervals were then divided into very low [-0.10,-0.003];
low (-0.003,0.01]; high (0.01,0.03] and very high (0.03-0.24] vulnerabilities.
Overall, the VI_climate analysis shows that small-scale diversified farmers (0.035) and medium-scale
rainfed organic farmers (0.015) are the most vulnerable groups, whereas intensive farmers (0.007 and
0.005) are less vulnerable.56
56 See Table VIII.4 in Appendix VIII for supplementary data.
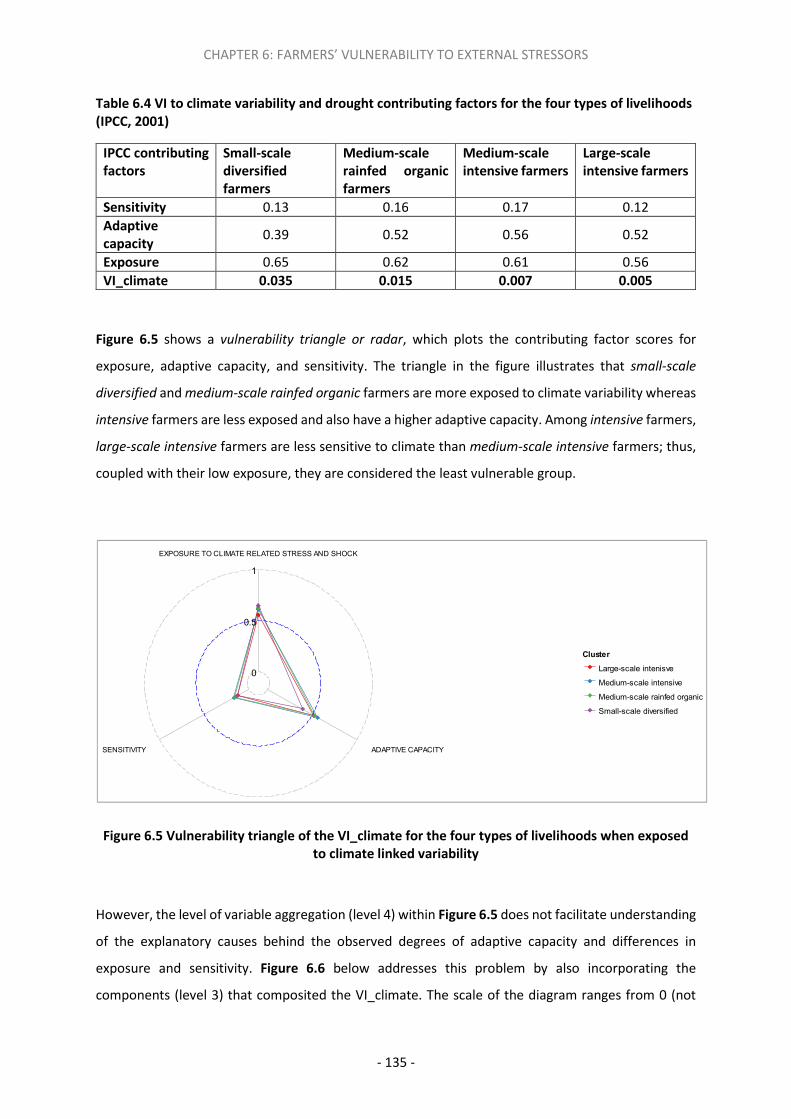
CHAPTER 6: FARMERS’ VULNERABILITY TO EXTERNAL STRESSORS
- 135 -
Table 6.4 VI to climate variability and drought contributing factors for the four types of livelihoods
(IPCC, 2001)
IPCC contributing
factors
Small-scale
diversified
farmers
Medium-scale
rainfed organic
farmers
Medium-scale
intensive farmers
Large-scale
intensive farmers
Sensitivity 0.13 0.16 0.17 0.12
Adaptive
capacity 0.39 0.52 0.56 0.52
Exposure 0.65 0.62 0.61 0.56
VI_climate 0.035 0.015 0.007 0.005
Figure 6.5 shows a vulnerability triangle or radar, which plots the contributing factor scores for
exposure, adaptive capacity, and sensitivity. The triangle in the figure illustrates that small-scale
diversified and medium-scale rainfed organic farmers are more exposed to climate variability whereas
intensive farmers are less exposed and also have a higher adaptive capacity. Among intensive farmers,
large-scale intensive farmers are less sensitive to climate than medium-scale intensive farmers; thus,
coupled with their low exposure, they are considered the least vulnerable group.
Figure 6.5 Vulnerability triangle of the VI_climate for the four types of livelihoods when exposed
to climate linked variability
However, the level of variable aggregation (level 4) within Figure 6.5 does not facilitate understanding
of the explanatory causes behind the observed degrees of adaptive capacity and differences in
exposure and sensitivity. Figure 6.6 below addresses this problem by also incorporating the
components (level 3) that composited the VI_climate. The scale of the diagram ranges from 0 (not
SENSITIVITY
EXPOSURE TO CLIMATE RELATED STRESS AND SHOCK
ADAPTIVE CAPACITY
0
0.5
1
Cluster
Large-scale intenisve
Medium-scale intensive
Medium-scale rainfed organic
Small-scale diversified

CHAPTER 6: FARMERS’ VULNERABILITY TO EXTERNAL STRESSORS
- 136 -
vulnerable) at the centre of the web, increasing to 1 (most vulnerable) at the outside edge. It can be
observed, in contrast with Figure 6.6, that sensitivity is similar for all farmer groups. However,
medium-scale intensive farmers are more sensitive due to a few factors: 1) households fully depend
on agricultural income; 2) the number of economically dependent family members is higher; 3) their
crops diversity is lower, and; 4) the amount of land dedicated to maize cultivation is the largest.57 Their
adaptive capacity, however, is the highest compared to other farmer typologies.
Figure 6.6 Vulnerability radar diagram for the four types of farmer groups when exposed to
climate variability
Figure 6.6 shows that the differences of adaptive capacity to climate related stressors and shocks
among farmer groups are more notorious than those of sensitivity or exposure. Although Navarre is
characterised by its heterogeneous climate, meteorological stations are distanced at most 50
kilometres from each other. Exposure to climate variability is similar for all farmer groups. This figure
also reveals the existence of a trade-off between sensitivity and adaptive capacity. Intensive farmers
are typically fully dedicated to large-scale agriculture, which is often characterised by crops with a high
demand of water and other inputs. These farmers have been able to counter climate related hazards
by installing modern irrigation systems, accessing all available subsidies, acquiring insurance and also
using cooperative networks services. Small-scale diversified farmers, thus, were more vulnerable in
comparison to other farming livelihoods, due to their lack of physical, financial, social and technical
knowledge-related assets.58
57 See Table VIII.4 in Appendix VIII. 58 See Table VIII.4 in Appendix VIII.
PHYSICAL ASSETS
SOCIAL ASSETS
CLIMATE VARIABILITY AND DROUGHT
SENSITIVITY
KNOWLEDGE AND EXPERIENCE ASSETS
SOCIODEMOGRAPHIC CHARACTERISTICS
FINANCIAL ASSETS
0
0.5
1
Cluster
Large-scale intenisve
Medium-scale intensive
Medium-scale rainfed organic
Small-scale diversified

CHAPTER 6: FARMERS’ VULNERABILITY TO EXTERNAL STRESSORS
- 137 -
6.4.2. Vulnerability to price volatility
The VI is now applied to analyse farmers’ vulnerability according to price fluctuations of their most
important crops. Table 6.4 VI to climate variability and drought contributing factors for the four
types of livelihoods (IPCC, 2001)Table 6.5 shows that small-scale diversified farmers, followed by
large-scale intensive farmers are the most vulnerable groups to this stressor. Large-scale intensive
farmers are more vulnerable, as they grow the largest amount of crops and therefore their exposure
to crops’ prices volatility is higher. This VI_prices is on a scale from -0.48 (least vulnerable) to 0.062
(most vulnerable). These values were the minimum and maximum results of VI when related to the
price volatility stressor.
Table 6.5 VI to price volatility contributing factors for the four types of livelihoods (IPCC, 2001)
IPCC
contributing
factors
Small-scale
diversified
farmers
Medium-scale
rainfed organic
farmers
Medium-scale
intensive farmers Large-scale
intensive farmers
Sensitivity 0.44 0.46 0.48 0.43
Adaptive
capacity 0.48 0.61 0.63 0.59
Exposure 0.01 0.02 0.07 0.05
VI_price -0.20 -0.27 -0.27 -0.24
Figure 6.7 illustrates the three dimensions of vulnerability when farmers are exposed to the volatility
of crop prices. Medium-scale intensive and medium-scale rainfed organic farmers are the least
vulnerable despite their high exposure and sensitivity in comparison to small-scale diversified farmers.
However, they still have the highest adaptive capacity. The low exposure of small-scale diversified
farmers is due to the fact that those farmers mainly cultivate ‘other crops’ and this category, which
was collected in an aggregated way encompassing several types of crops, was assigned a zero value in
its standard deviation (see Section 3.3.3) since they were normally reported as self-consumed crops
during the fieldwork. This was considered a realistic approach since farmers in this livelihood group
do not typically commercialise their crops, but instead sell their harvest locally or use them for
household consumption. The observed high exposure of medium-scale rainfed organic farmers was
anticipated given that the majority of these farmers grow vineyards and grapes, which have recently
experienced very unstable market prices (see Figure 6.2). In this case, the most intensive group is quite
sensitive but their adaptive capacity makes them the least vulnerable group.

CHAPTER 6: FARMERS’ VULNERABILITY TO EXTERNAL STRESSORS
- 138 -
Figure 6.7 Vulnerability trainagle for the four types of livelihoods when exposed to price volatility
Figure 6.8 provides more information in understanding what drives vulnerability relative to crop
prices’ fluctuation. Again, intensive and organic farmers are the most sensitive groups and also had
higher adaptive capacity in terms of physical, financial and human assets. Small-scale diversified
farmers are in a clear disadvantage in this regard, since their socio-demographic features and human
assets are lower than the rest of farmers.
Figure 6.8 Vulnerability diagram of the major components for the four types of livelihoods when
exposed to crop price volatility
SENSITIVITY
EXPOSURE TO PRICES VOLATILITY
ADAPTIVE CAPACITY
0
0.5
1
Cluster
Large-scale intenisve
Medium-scale intensive
Medium-scale rainfed organic
Small-scale diversified
PHYSICAL ASSETS
SOCIAL NETWORKS
PRICES VOLATILITY EXPOSURE
LIVELIHOOD STRATEGIES
KNOWLEDGE AND EXPERIENCE ASSETS
SOCIODEMOGRAPHIC CHARACTERISTICS
FINANCIAL ASSETS
0
0.5
1
Cluster
Large-scale intenisve
Medium-scale intensive
Medium-scale rainfed organic
Small-scale diversified

CHAPTER 6: FARMERS’ VULNERABILITY TO EXTERNAL STRESSORS
- 139 -
6.5. Discussion
This section discusses the main results of this chapter, complemented with information derived from
interviews and the focus group discussion. The argument focuses on how modern irrigation shapes
farmers’ vulnerability, and it also reflects the utility of vulnerability indexes.
6.5.1. Farmers’ vulnerability and the role of modern irrigation technology
The vulnerability analysis above suggests overall that small-scale diversified farmers are the most
vulnerable group in the case study region. They are the most vulnerable group to both climate
variability and drought, since they have not adopted modern irrigation and thus, most have lost their
traditional irrigation rights (revealed through participatory observations, see Chapter 0). Contrary to
what has been shown in other research (Eakin, 2005), small-landholders of this case study region have
been disinterested in adopting modern irrigation as a means to enter markets and diversify into
increased-value, higher-yielding crops.
Additionally, and contrary to my expectations, they were also the most vulnerable to crops’ prices
volatility, even if they do not tend to commercialise their crops. This can be explained by the fact that
their low sensitivity and exposure (represented as two single sub-components to explain households’
sensitivity and exposure) do not have much importance when compared to their available adaptation
options. Further, the VI results do not distinguish across relative levels of crops’ commercialisation,
since a variable to reflect so was not included in the index. The lack of adaptive capacity of these
farmers is grounded primarily on their constrained access to financial assets, technology and social
networks, which are key factors when addressing socio-economic and environmental change. The VI
calculations for both climate-related and price factors reflect the inability of small-scale diversified
farmers to accessing modern irrigation (physical asset) and the latter’s related subsidies (financial
assets) and water management cooperatives (social assets). In turn, the inability to access to these
key assets negatively affects their capability to participate in emerging agrarian institutions linked to
large-scale production (IPCC, 2014). Small-scale diversified farmers, thus, base their livelihoods on the
self-consumption of their crops and a diversified household economy.
Within the study area, farmers following principles of organic agriculture are the second most
vulnerable group to climate variability, but are not particularly vulnerable to prices volatility. Their
vulnerability is due to their high sensitivity (i.e. a high level of family-based dependency). Although
these farmers have the financial options to adapt, their social networks with mainstream
organisations are nearly non-existent. Moreover, the literature also suggests that their agency is lower
due to the high investment they make to plant their crops (often vineyards), including the necessary

CHAPTER 6: FARMERS’ VULNERABILITY TO EXTERNAL STRESSORS
- 140 -
time to reach fruition (Dwiartama and Rosin, 2014). This exposes these farmers to significant financial
risks during initial stages of vineyard establishment (Dwiartama and Rosin, 2014). The indexes utilised
within this dissertation do not accurately account for this issue, and thus do not reflect that intensive
agriculture can have cross-scalar negative impacts over organically managed fields, rendering their
land management procedures impractical. This insight was obtained through interviews and
participatory observation. Additionally, the management practices of this farming group are
misaligned with those promoted by existing institutions implementing modern irrigation. Despite
being young, educated and with access to financial subsidies, these farmers remain a minority, are not
well-connected with the existing local cooperatives, and furthermore, seem to lack influential power
over regional rural strategies and policies.
Finally, I found that the most intensive farmers were the least vulnerable farmers to climate variability,
drought and prices volatility. Their high adaptive capacity is associated with a particular collection of
key resources, including access to large tracks of land (owned or rented), education, relevant cash
flows and social connections (aligned with Eakin, 2005). Their adoption of the modern irrigation
system involves higher financial benefits through subsidies (e.g. CAP, modernisation and irrigation
subsidies). Interviews revealed that those adopting modern irrigation not only accessed most of the
available subsidies but also received higher amounts of such subsidies, precisely as a result of adopting
irrigation.
In fact, VI calculations reveal that these subsidies become a stable income supporting the livelihoods
of intensive farmers’ and provide them with the means to counteract income variability. This is driven
by crop price volatility or fluctuations of crop production due to adverse climatic conditions.
Moreover, participatory observation disclosed that the access to common lands by these farmers is
particularly facilitated if they are young or full-time, which are common characteristics of intensive
farmers. Additionally, interviews revealed that their affiliation to cooperatives and farming unions
allows them to acquire discounts for insurance, oil and fertilisers. Such financial incentives buffer crop
price fluctuations allowing them to store their harvest until selling prices become profitable.
Interviews and participatory observation also helped me to understand that farmers who belong to
cooperatives also receive better advice on agro-industry contracts, which include contracts between
farmers and the regional enterprises that transform crops into tinned food, feed, forages, and so on.
These contracts are common among the intensive farmers, as the VI_prices revealed. The VI results
also make evident that the direct selling of crops (thus circumventing intermediaries) and outgrower

CHAPTER 6: FARMERS’ VULNERABILITY TO EXTERNAL STRESSORS
- 141 -
schemes59 are also a common feature among intensive farmers. As Eakin (2005) points out, these
resources do not assure that the households will effectively manage the shifting patterns of climatic
and market risks, but they may offer those farmers an opportunity to flexibly negotiate new challenges
as they arise and evolve.
Throughout the interviews, survey responses, and the focus group, it also became evident that
irrigation had increased farmers’ yield security. Overall, with exception of small-scale diversified
farmers, the VI results suggest that modern irrigation plays a crucial role when facing both climate
variability and price volatility stressors. Aligned with Wilhelmi and Wilhite (2002), in most cases,
particularly during a short-term drought, irrigation farming provides increased security for crop
growers. Therefore, farmers who adapted modern irrigation are less vulnerable to both climate
variability and prices volatility. However, such technology shift is making small-scale diversified
farmers doubly vulnerable to climate variability, drought and prices fluctuations, which makes me
suggest that modern irrigation may indeed be a mal-adaptative option in the long term.
The analysis presented in this chapter also revealed an interesting trade-off related to climate-driven
vulnerability. Results suggest that when farmers increase their adaptive capacity, especially through
modern irrigation adoption, this causes them to become more sensitive to climate variability and crop
prices linked stressors and drought shock. The sensitivity of intensive farmers’ is directly related to
their larger plots of water-demanding crops, such as maize. Because they specialise in this kind of
agriculture, they have less diversified sources of income. Additionally, intensive farmers usually have
more family members who are economically dependent from the household head.
6.5.2. Strengths and weakness of using a vulnerability index
There are at least two important benefits of using an index such as the VI used in this chapter for a
better understanding of rural vulnerability to global change. First, and at a theoretical level, an index
contributes to the operationalisation of vulnerability theory by accounting for the interdependencies
of global (e.g. global market influences and climate change) and local mechanisms that create social
vulnerability (Lin and Polsky, 2015). Moreover, an index is useful to understand both the impacts and
the social capabilities in response to anticipatory or reactive modes (adaptive capacities) to reduce
59 Also known as contract farming. Through these contracts, the farmers’ crop harvest will be sold to large-scale agribusinesses (German et al., 2011). Farmers and future buyers agree on a price for the harvest, which may be either above or below future market price, so farmers may either lose or win money. They accept the potential loss because they are guaranteed the purchase of the harvest.

CHAPTER 6: FARMERS’ VULNERABILITY TO EXTERNAL STRESSORS
- 142 -
their sensitivity and exposure to threats (Eakin and Bojórquez-Tapia, 2008; Hahn et al., 2009; Lin and
Polsky, 2015).
Secondly, an index reveals useful information for policy-making. An index is a first step of recognising
farmers’ exposure to global stressors and shocks, and is helpful for understanding the suitability of
government actions to deal with such stressors (O’Brien et al., 2004). Specifically, in this case study,
the index used permits to reveal trade-offs between sensitivity and adaptive capacity in the
implementation of modern irrigation, which allow policy-makers to better understand the co-lateral
risks (increased sensitivity) that accompany technology adoption.
Moreover, an index allows for comparisons across farmer types. It indicates which livelihoods are in a
more disadvantaged position when reducing vulnerability and contending with certain stressors if they
have not adopted irrigation technology. Whereas some livelihoods (small-scale diversified farmers in
this case study) might degrade, others might increase their assets. Such patterns are expected to be
observed repeatedly across the European rural landscape (Rivera-Ferre, 2008). Without enough land
and a relatively stable source of subsistence, small-scale diversified farmers appear unlikely to enter a
large-scale agrarian model of production. The diversity of rural livelihoods is seemingly decreasing;
transitioning to a more intensive agriculture, leaving behind other alternatives such as subsistence
and organic farming or rural tourism.
However, the development and calculus of a vulnerability index is likely to be characterised by some
methodological flaws and caveats. For example, in this particular study, the index used does not reflect
the high investment made by intensive farmers and the uncertainty about whether government will
maintain economic aid to install modern irrigation and keep water prices quotas low. This could have
been addressed including in the index, for example, information about farmers’ income (e.g. salary),
expenditure (e.g. monthly water bills60) and investments, since participatory research revealed
uncertainty about their capacity to cope with the increasing financial commitments and loans
associated to the adoption of modern irrigation. However, this was not done because I found them
too personal questions.
I finally considered including other cognitive indicators (e.g. farmers’ views about their self-
confidence, trust to join other farmers etc.) that could disclose multiple degrees of difficulty when
60 Fieldwork revealed the continual increase of the water quota. The following source supports this, reporting that Canasa agreed on a 60% increase of the water irrigation tariff over a five-year period. Part of this increase (15%) had been previously applied in 2015. (Diario de Noticias de Navarra, 2016 < http://www.noticiasdenavarra.com/2016/02/18/economia/canasa-decidira-el-proximo-23-de-febrero-las-tarifas-que-se-aplicaran-a-los-usuarios-del-canal-de-navarra>).

CHAPTER 6: FARMERS’ VULNERABILITY TO EXTERNAL STRESSORS
- 143 -
adapting or discarding modern irrigation. Although I obtained some information through the survey, I
was unable to include it in the VI calculation due to their incomparability feature. Such information
was so subjective that I could not include it within the index to compare different household-types.
Such qualitative information is rather integrated through the insights of interviews and focus groups.
6.6. Summary
The findings in this chapter have made evident that farming livelihoods are unevenly exposed to
climate and market-related stressors and show differentiated abilities to adapt, with the most
powerful farmers (intensive farmers) being able to shift climate and market prices related threats to
less powerful groups (small-scale diversified farmers).
Small-scale diversified farmers are doubly vulnerable to 1) climate variability and drought and 2) crops’
price volatility, while intensive farmers are the best equipped to deal with such stressors. The latter
are more sensitive but are much more able to adapt to changing circumstances given their
participation in the modern irrigation project and their access to the project’s related benefits (i.e.
subsidies, access to social networks, etc.).
The chapter has also argued that a vulnerability index is a helpful tool to provide key information to
policy-makers and to evaluate the risks of new agricultural technologies from a vulnerability and
adaptation perspective. For example, an index can predict the disappearance of certain livelihoods at
the expense of the advancement of other livelihoods, a process that can be accelerated with the
adoption of such technologies (modern irrigation in this case).
The following chapter takes and institutional approach to assess how modern irrigation changes
existing norms that may further explain and exacerbate existing vulnerabilities of different farmers’
groups.

CHAPTER 7: AN INSTITUTIONAL APPROACH TO UNDERSTAND FARMERS’ VULNERABILITY
- 144 -
CHAPTER 7
“Often by confronting difficulties and details you confront reality”
Werner Herzog
7. An institutional approach to understand farmers’ vulnerability
7.1. Introduction
The previous chapter showed that small-scale diversified farmers were the most vulnerable group of
farmers to both climate variability and drought and crops’ price volatility in the case study area. The
chapter also showed that other farmer groups were less vulnerable to such stressors because they
had adopted modern irrigation and they could mobilise key financial and social assets in times of need.
As explained in Chapter 3, the Navarre’s government and other national organisations promoted
modern irrigation as as means to increase the territory’s competitiveness in a ‘free market’ context.
Modern irrigation and its associated intensive land management practices (Diez et al., 1997) are
geared towards obtaining higher yields. However, such transformation may also alter farmers’ access
to water and communal lands, particularly of the most vulnerable farmers (Vásquez-León et al., 2003;
Ford et al., 2007), potentially leading to socially unfair outcomes.
This chapter addresses Research Question 4, i.e. In which ways has the development of modern
irrigation transformed the ASES, especially in terms of the norms and rules-in use regarding irrigation
water, and in consequence farmers’ vulnerability? When certain groups of affected farmers and other
social actors are not recognised within irrigation related institutions and their participation in decision-
making is uneven, conflicts or behaviours related to lack of participation, free riding and rent seeking
may deteriorate social relations, which in turn can influence the adaptive capacity of such farmers and
consequently their vulnerability (Vatn, 2005; Barnett and Adger, 2007; Kloos et al., 2013).
Focusing on the village of Miranda de Arga, the chapter uses an ‘institutional robustness’ approach
(Ostrom, 1990; Anderies et al., 2003) and the lenses of equity and legitimacy (Corbera et al., 2007a;
McDermott et al., 2013) to explore these issues and respond to the chapter’s overarching question.
Specifically, it examines assess if and how intensive farmers61 - favoured by the dominant institutional
61 This consideration is due to intensive farmers’ livelihoods alignment with the public policy push for modern irrigation.

CHAPTER 7: AN INSTITUTIONAL APPROACH TO UNDERSTAND FARMERS’ VULNERABILITY
- 145 -
context - are able to exploit such circumstances for their own private benefit and if, in contrast, other
farmers become more vulnerable as a result of the institutional changes driven by modern irrigation.
Miranda de Arga is considered a representative example of the villages affected by the Itoiz-Canal de
Navarra project because there are both rainfed lands that have been transformed into irrigated lands
and there also traditionally irrigated areas that have been modernised (as it was the case for more
than 60% of the survey’s participants). Miranda de Arga is located in a semi-arid zone and
encompasses the majority of crops and livelihoods existing in the rest of the study area (to see location
see Figure 3.2 in Section 3.2.2).
The introduction of modern irrigation has had important effects over existing and new legal
institutions arbitrating the use of natural resources in this village and the study area as a whole (see
Section 3.2.2). Modern irrigation is transforming traditional water irrigation norms and therefore it is
critical to understand how the access mechanisms to assets (natural, financial, social), and particularly
irrigation water, vary so that some farmers are more vulnerable to specific climate shocks (e.g.
drought) and stressors (e.g. climate variability and crops’ price volatility) than others. This can be
attributed to, for instance, monitoring changes, lack of rights to organise or inappropriate/absence of
mechanisms to resolve conflicts over water use (Vatn, 2005; Adger, 2006; Paavola, 2007).
Methodologically, the chapter relies on secondary data, primary data through 22 semi-structured
interviews, and a focus group discussion with five key stakeholders, representing different interests
of Miranda de Arga’s farming population (see Section 3.3.1 and Appendix III and IV about semi-
structured interviews and Section 3.3.4 and Appendix IX for the methodology on focus groups).
It is structured as follows: the next section characterises the traditional and modern irrigation systems
so that the main features regarding water and land management practices can be understood. Section
7.3 introduces the socially alleged reasons behind the expansion of modern irrigation in Miranda de
Arga and Section 7.4 compares the robustness of traditional versus modern irrigation systems as a
result of the changes in the norms over access and use of irrigation water. Such analysis takes into
account the results of Chapter 0 and the overarching policy context (see Marsden et al. (2002)), to
understand how institutional changes may unevenly affect the different types of farmers in Miranda
de Arga. Section 7.5 focuses on the economic, social and ecological consequences of the modern
irrigation project, based on what has been experienced by farmers from Miranda de Arga, and it
highlights who actually benefits from irrigation water, through what processes, and in what
circumstances. Not only outcomes are considered but also procedural fairness in terms of how and
who is marginalised. Section 7.6 begins by assessing the arguments in which the project’s legitimacy
is grounded. It discusses whether its legitimacy is due to legality arguments, participative customs or
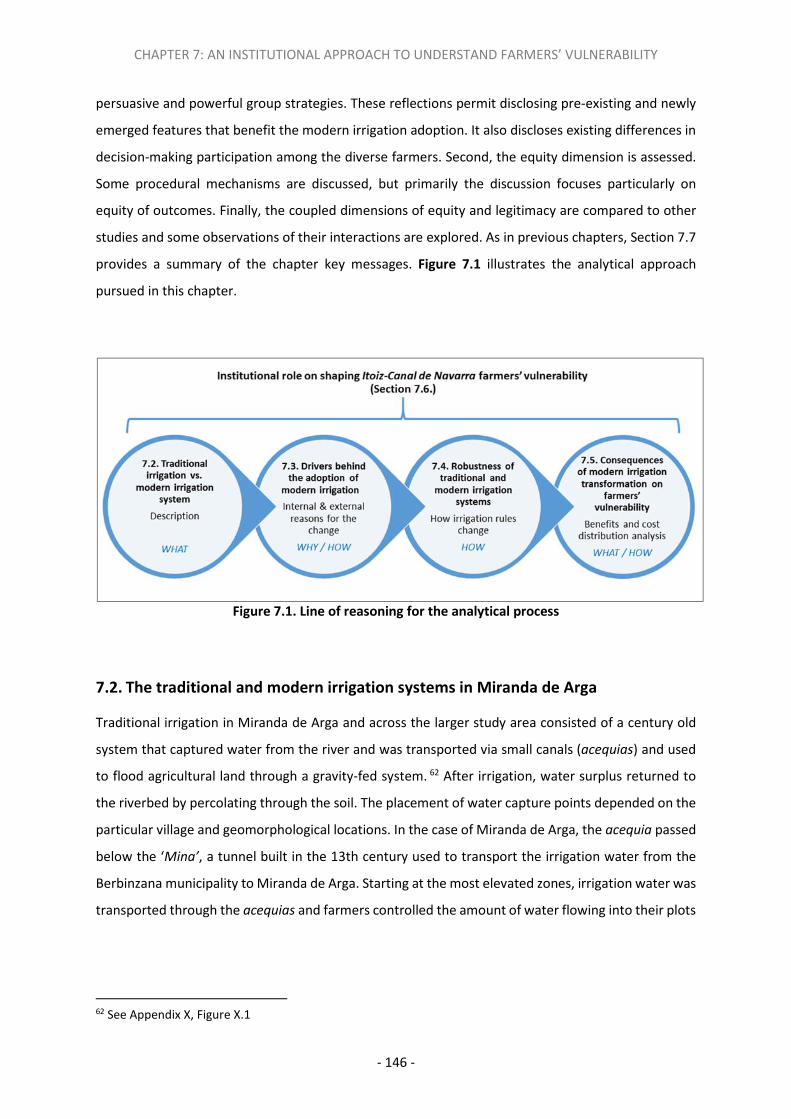
CHAPTER 7: AN INSTITUTIONAL APPROACH TO UNDERSTAND FARMERS’ VULNERABILITY
- 146 -
persuasive and powerful group strategies. These reflections permit disclosing pre-existing and newly
emerged features that benefit the modern irrigation adoption. It also discloses existing differences in
decision-making participation among the diverse farmers. Second, the equity dimension is assessed.
Some procedural mechanisms are discussed, but primarily the discussion focuses particularly on
equity of outcomes. Finally, the coupled dimensions of equity and legitimacy are compared to other
studies and some observations of their interactions are explored. As in previous chapters, Section 7.7
provides a summary of the chapter key messages. Figure 7.1 illustrates the analytical approach
pursued in this chapter.
Figure 7.1. Line of reasoning for the analytical process
7.2. The traditional and modern irrigation systems in Miranda de Arga
Traditional irrigation in Miranda de Arga and across the larger study area consisted of a century old
system that captured water from the river and was transported via small canals (acequias) and used
to flood agricultural land through a gravity-fed system. 62 After irrigation, water surplus returned to
the riverbed by percolating through the soil. The placement of water capture points depended on the
particular village and geomorphological locations. In the case of Miranda de Arga, the acequia passed
below the ‘Mina’, a tunnel built in the 13th century used to transport the irrigation water from the
Berbinzana municipality to Miranda de Arga. Starting at the most elevated zones, irrigation water was
transported through the acequias and farmers controlled the amount of water flowing into their plots
62 See Appendix X, Figure X.1
CHAPTER 7: AN INSTITUTIONAL APPROACH TO UNDERSTAND FARMERS’ VULNERABILITY
- 147 -
by operating lock-gates manually. At the time of the interviews, villagers did not access water through
this traditional system because the tunnel had sunk.
The Water Law (Royal Decree 1/2001) and the Hydraulic Public Realm Rules (Royal Decree 9/2008
amending the Hydraulic Public Domain rules) establish what should be included in traditional irrigation
norms. When the irrigator communities were created, they proposed their own irrigation norms, but
these norms had to be approved by a national government organisation –the Spanish River Basin
Agency, or the CHE63 in this case. The CHE established the amount of water that could be used in each
village and any modification of such irrigation norms had to be approved by the agency.
In the traditional system, irrigators were organised through irrigator communities at village level. Local
irrigators formulated a committee comprised of a president, a maintenance person, and an
administrator. It established simple written norms detailing irrigators’ rights and duties, including
advocating respect for each other’s irrigation turns and formulating maintenance procedures of the
acequias. Each irrigator was in charge of the maintenance of the acequia next to their plot. The role
of the maintenance person is to ensure proper rotation of turns, maintain the state of the acequias
and some communal canals, and to communicate potential rule breaking situations to the irrigator
committee and to also provide solutions to possible conflicts over the use of the irrigation water,
which had to be aligned with the community norms. A system of graduated sanctions was applied.
The level of sanctions depended on the severity and context of the offense. More than half of the
interviewees expressed that they were autonomous to self-organise and they highlighted that they
could make decisions at a local level for all issues.
The design of the plot determined the distribution of water when irrigating; if the area were not flat,
the distribution of water would not be uniform, leading to flooded zones after irrigation. According to
some interviewees this caused the land to become compacted, particularly when land had a higher
composition of clay. Consequently, the crops growth was negatively affected, resulting in lower yields
than those possible with modern irrigation. Traditional irrigators paid the River Basin Agency a low fee
for a long-term water use concession. Such historical fixed concession lasted for approximately 75
years. Small-scale farmers explained that such period was long enough to guarantee the continuity of
their agrarian livelihoods.
The modern irrigation system, which has completely substituted the traditional system in Miranda de
Arga as well as in most villages within the study area, consists of a network of new irrigation canals
63 CHE is the acronym for Confederación Hidrográfica del Ebro, translated to Ebro River Basin Agency. It is a national government organisation, controller and maintainer of water and irrigation of the Ebro basin (northeastern Spain). It was the first institution created in the world with the aim of managing an entire river basin unitarily.

CHAPTER 7: AN INSTITUTIONAL APPROACH TO UNDERSTAND FARMERS’ VULNERABILITY
- 148 -
distributed across a defined set of agrarian fields, including rainfed and traditionally irrigated lands.
Instead of collecting water directly from the river, these canals collect water from a main canal (e.g.
Canal de Navarra), which simultaneously departs from the Itoiz dam (see Section 3.2.2.2). Water for
irrigation is delivered to land plots that encompass at least five hectares.
INTIA, who designed the canal and placed hydrants in the land plots, is a public company affiliated
with the Navarre Government. These hydrants are equipped with a computer that allows farmers to
program irrigation as they wish (see Appendix X). With this new technology, farmers are now able to
check the correct water supply by remote control. Pressure sprinklers are the most widespread
practice to irrigate crops, but a drip irrigation system may also be installed when appropriate (e.g. with
crops such as vegetables, vineyards or trees). The farmers who did not adopt this new technology and
thus did not access water through the Itoiz-Canal de Navarra are now unable to access irrigation.
As in other villages farmers who obtain water through modern irrigation tend to be organised in
communities with farmers from several other villages. This is in contrast to the traditional system,
which consisted of one irrigation community per village. There is also a general irrigation community
for the entire Itoiz-Canal de Navarra area. For modern irrigation farmers, it is now unnecessary to take
turns to irrigate and maintain canals. When there are issues to discuss, complaints are directed to the
local community president, who represents them in the general community. Then, each president
conveys these decisions made by leaders in the general society/population (other presidents
representing each sector) back to their local irrigation farmers.
In the modern system, water consumption is measured through a meter located next to the hydrants,
and farmers pay for the water consumption and for the maintenance and conservation work carried
out by Aguacanal64, the concessionaire enterprise. The government committee invoices irrigators’ for
their water consumption levels. As most of the interviewees commented during fieldwork, they were
unhappy about how expensive the water quota was and that in the past, when there was no meter,
they had paid a very low rate for the water concession. Now they have to pay not only the fixed quota
but also for water consumption, the maintenance service and the canal construction.
Additionally, the concentración de tierras65 allows for an enlargement of the land plots being managed,
which facilitate in turn the cost-effective use of heavy machinery. With widespread application of
modern irrigation, larger infrastructure along with an increased amount of synthetic fertilisers and
pesticides are being adopted. Consequently, average yields are higher; winter-wheat increased on
64 Aguacanal shareholders are composed of seven companies. Acciona, a large construction group, holds the 35% and AGBAR, an international water management company, holds another 35%. 65 Concetración de tierras refers to the grouping of several plots belonging to different owners which are unified.

CHAPTER 7: AN INSTITUTIONAL APPROACH TO UNDERSTAND FARMERS’ VULNERABILITY
- 149 -
average 5900 Tm between 2013 and 2014 in the whole Ribera Alta (Gobierno de Navarra, 2016),66 but
irrigation is more expensive when compared to the traditional method. This type of modern irrigation
requires high investment, although it has been strongly subsidised by the introduction of the Foral
Law 7/1999, Navarre Irrigation Plan and the Foral Law 1/2002, regarding agrarian infrastructures
which established that the farmers willing to adopt this system would have part of their investment
cost covered (approximately 40-50% of an investment of 3900 euros/hectare)67 by the Navarre
government.
7.3. Drivers of the modern irrigation project
This section explores why the modern irrigation system has been adopted by an increasing number of
farmers in the study area68, despite its early and ongoing controversies (see Section 3.2.2).
Research in the context of this dissertation has revealed that the introduction and spread of modern
irrigation by Navarre’s government has been presented as a key rural development strategy (see also
De Vries, A, and Garcia M., 2012; MAGRAMA, 2013; INTIA, 2016), supported by legal frameworks (see
Section 3.2.2.2). The Navarre’s government and related official organisms, such as INTIA and local
agrarian cooperatives, concur with the view that Navarre had under-utilised hydric resources until
very recently and that modern irrigation would untap such hydrological potential and facilitate rural
development (De Vries, A, and Garcia M., 2012; Parlamento de Navarra/Nafarroako Parlamentua -
Noticias Presidencia, 2015).69 This view reinforced the view that the Canal de Navarra was a critical
infrastructure.
However, other groups such as some political parties (e.g. EH-Bildu)70, EHNE union and some of the
local small-scale farmers have contested such arguments and complained that the modern irrigation
would result in unexpected outcomes, such as an increase cost of water and a lower variety of crops
(interview SI2-18). Those against modern irrigation also used NGO reports (e.g. Greenpeace), expert
66 This data should be taken with caution since during the fieldwork some farmers explained that this amount varied between years, and despite that farmers were now able to have two crops per year, it was difficult that both were abundant. Moreover, they added that they were not permitted to cultivate as many crops as they wanted since agro-industry set limitations to the crops they were able to buy. Furthermore, some years the rainfed system was more profitable regarding costs and benefits. 67 Amounts were decreasing from one year to another. 68 Information is generalised to the whole case study area by using information from the represenative village of Miranda de Arga. 69Arguments consulted in May 2016 at <http://www.intiasa.es/es/comunidad-de-regantes/areas-de-interes/itoiz-canal-de-navarra/aspectos-generales.html>. 70 EH Bildu is a left-wing Basque nationalist and pro-independence political coalition active in the Spanish autonomous communities of Basque Autonomous Community and Navarre (Ugarriza, 2014).
CHAPTER 7: AN INSTITUTIONAL APPROACH TO UNDERSTAND FARMERS’ VULNERABILITY
- 150 -
advice (SEO, CSIC, Consejo de Europa) (Beaumont, 1997) and academic publications (Brinquis et al.,
2012) to build their own legitimate arguments against modern irrigation.
In the following paragraphs, I dissect such arguments in further detail, drawing on collected opinions
during the interviews and the focus group workshop performed in Miranda de Arga. There I found
divergent views regarding the motivations behind the development of the Itoiz-Canal de Navarra
modern irrigation project. Understanding such motivations is useful to shed light on the social
legitimacy of the Itoiz-Canal de Navarra project. Within this dissertation, these viewpoints are
classified in two main categories: external and global motivations (such as international market
prices); and internal and local motivations, which refer to drivers proceeding at the community level-
Miranda de Arga. Some of these local motivations cannot be extrapolated, as they are specific to that
village. Following, in this and successive sections of the chapter (i.e. Sections 7.3, 7.4and 7.5) I present
the interviews and focus group data analysis.
In reference to the question: ‘What socio-economic factors are the precursors of modern irrigation?’
(self-translation), approximately 30% of the interviewed farmers, who held distinct livelihood profiles,
expressed that globalisation, climatic features and water use efficiency were the main external drivers
of the irrigation project.71 Globalisation and climatic issues confirm Chapter 6 results regarding the
main stressors farmers faced in this area.
“The main cause for modern irrigation introduction here is the progress. Nowadays, we are
competing with countries that manage large extensions of crops and that obliges us to have large
extensions of lands” (SI.2-10)
Regarding the internal and local discursive arguments behind the adoption of modern irrigation, 30%
of interviewees and a majority of the focus group participants explained that large-scale farmers had
demanded modern irrigation and lobbied for it. Moreover, such interviewees added that one of the
primary reasons of modern irrigation in Miranda de Arga was due to the modification of the project
for Itoiz-Canal de Navarra Phase One. Since the construction proved to be more expensive than
expected and INTIA had decided to modify the original project and extend modern irrigation to the
western side of the area. One interviewee noted that:
71 Globalisation was reported by 35% of the interviewees but it was recognised as a share impression during the fieldwork; climatic reasons were reported by less than 20% of the interviewees and water efficiency by a 20% of the interviewees.

CHAPTER 7: AN INSTITUTIONAL APPROACH TO UNDERSTAND FARMERS’ VULNERABILITY
- 151 -
“They have a financial deficit and they need to sell water so, what have they done? They have
decided to extend the first phase, which is much cheaper than building the second phase... but they
are selling water where there is already water, in the traditional irrigation area” (SI.2-2)
The third local reason to install modern irrigation was related to the breakdown of the old traditional
irrigation system (see Section 7.2), was a shared argument in all the interviews and focus group
discussions. They explained that the ‘Mina’ had sunk on several occasions and the irrigation farmers
had long been asking for a solution that would modernise the traditional irrigation system. However,
a long-term solution was not reached between Miranda de Arga irrigation farmers and the Navarre
government.72 Irrigation farmers kept restoring small sections of the old system until it was not worth
repairing it being very expensive with no guarantee of endurance. Discussions in Navarre’s Parliament
(Parlamento de Navarra/Nafarroako Parlamentua - Iniciativas, Tramitación, 2013) and a few
interviewees revealed that the last collapse of the old tunnel was due to the modern irrigation
transformation in the former dry lands. The humidity in these areas was the cause of the land
movements in lower regions. Miranda de Arga had no water to irrigate for nearly a year when Itoiz-
Canal de Navarra project was proposed and it was this situation that influenced a positive vote from
the farmers regarding the modern irrigation project.
The fourth and final local motivation reported by a minority of interviewees and a few focus group
participants referred to uneven power relations emanating from the top-down character of the
modern irrigation project. In this regard, several examples were given with specificity to the particular
occurrences happening only in Miranda de Arga. The former mayor of Miranda de Arga’s village
council73 explained that all proposed alternatives to repair the destroyed tunnel (the Mina, see Section
7.2) had not been considered in recent years, as the Itoiz-Canal de Navarra project had already been
approved at higher administrative levels. Additionally, several interviewees noted that the first
referendum held in the village in 2013 to explore farmers’ willingness to adopt modern irrigation
already demonstated that the modern irrigation project was going to be implemented regardless of
local views. The statement considered in the referendum illustrates this fact:
“Now that a branch of Canal de Navarra is arriving to the traditionally irrigated lands and the
communal lands of Miranda de Arga are proposed to be transformed, my position is: 1) I keep
with the traditional system; 2) I choose to adopt the new irrigation system of Canal de
Navarra” (self- translation; underlined emphasis added)
72 They asked for subsidies to restore the ‘Mina’ but their claims were denied. 73 This was discussed during the workshop and documented in parliamentary debates, (Parlamento de Navarra/Nafarroako Parlamentua - Iniciativas, Tramitación, 2014).

CHAPTER 7: AN INSTITUTIONAL APPROACH TO UNDERSTAND FARMERS’ VULNERABILITY
- 152 -
Most residents of Miranda de Arga voted in favour of maintaining the traditional system (i.e. position
1 above). However, and despite the referendum results, the Miranda de Arga village council voted in
favour of modern irrigation installation. In December 2014, the irrigation community implemented a
second referendum that this time resulted in favour to the introduction of modern irrigation.
Participants clarified that although all irrigation workers could participate, their votes did not count
the same; the larger the land area an individual held, the higher the value of that person’s vote.
Approximately half of the participants, both interviewees and focus group participants, emphasised
that if the local council, who accounted for the communal land area, had not adopted a favourable
decision in 2013, modern irrigation would not have been implemented in Miranda de Arga. Moreover,
complaints about the land size based approach to votes’ value reveal legitimacy concerns as this
system furthered the preferences of landowners with larger plots of land.
Nearly half of the focus group participants and interviewees claimed there had been lack of
transparency and incomplete information when asked to vote. In contrast, the other half of
participants argued that the process was acceptable; otherwise the proceeding would be too long if
every decision had to be taken to assembly. A few interviewees also complained about INTIA
consultation periods, concentración de tierras and land re-distribution processes. As an example of
such complaints, I note below the views of an interviewed farmer:
“When land was re-distributed, after the “concentraciones de tierras”, not all the neighbors
were treated equally. If the quality of land that person owned was not high enough, INTIA did
not oblige owners to take part in this project. But when your land was good enough… they
tried to convince you. If possible, INTIA misled you (attempting to make an exchange with you
for worse quality and a less amount of land) otherwise they directly expropriated your lands.
This was notable when owners were older. They explained to elderly people the situation to
the extent they wanted to. In this way many people gave up resisting an undesired
transformation and adopted it. You know, ‘divide and rule’. That strategy was used here” (SI.2-
20)
A few interviewees also believed that the Itoiz-Canal de Navarra infrastructure was just a way to enrich
certain politicians and enterprises. They explained that this was evidenced by the contracts made to
politicians in such enterprises after retiring from their political careers. Examples included the creation
of CANASA74, which is the public company affiliated with the Navarre Government that designed the
canal. One of these interviewees argued that:
74 The Company "Canal de Navarra, SA" (CANASA) is the result of the collaboration agreement between the Ministry of Agriculture, Food and Environment and Navarra for Navarra Canal construction.

CHAPTER 7: AN INSTITUTIONAL APPROACH TO UNDERSTAND FARMERS’ VULNERABILITY
- 153 -
“The Itoiz-Canal de Navarra project was not promoted by farmers. Indeed, there are other
kinds of interests of other stakeholders... The canal is being payed through a 'shadow
payment'system75 for which we are paying more than if the Government had asked a credit to
a bank. In order to manage this payment there is a concessionarie enterprise and I do not think
it is by chance that the president of such enterprise is the Navarre government council (omit
name). There are placed these politicians, in revolving doors” (SI2-12).
From the perspective of the interviewees, construction companies and electric companies were two
key lobby interest groups. Also, the previously mentioned water management companies were
interested in water privatisation for a business venture. Water privatisation and speculation over
water and lands were vigorously discussed themes during the focus group workshop. INTIA
representative argued that water concession did not mean privatisation and the enterprise was
considered a service enterprise for the maintenance of the canals. In response, an ecologist
representative and some community members in favour of the traditional system argued that now
that farmers had to pay for their consumed water rather than a fixed quota, those in control of the
canal would make sure to increase their own benefits. The focus group participants were not in
agreement to whether there were already investors buying lands in the transformed area:
“In the modern system land is treated as money. You can be a mere investor searching for
benefit regardless of the consequences of your actions on the land” (FG-4)
Table 7.1 summarises the reasons provided by interviewees and focus group participants. It includes
an assessment of the level of (dis)agreement for each motivation (second and third columns). The
fourth column summarises which actors hold the correspondent viewpoint and the last column
explains how such reasons might influence farmers’ vulnerability.
75 Shadow payments are a type of payments made by the government to a private company that utilises private funding to construct and maintain infrastructure. The government pays these funds in installments with high interests.
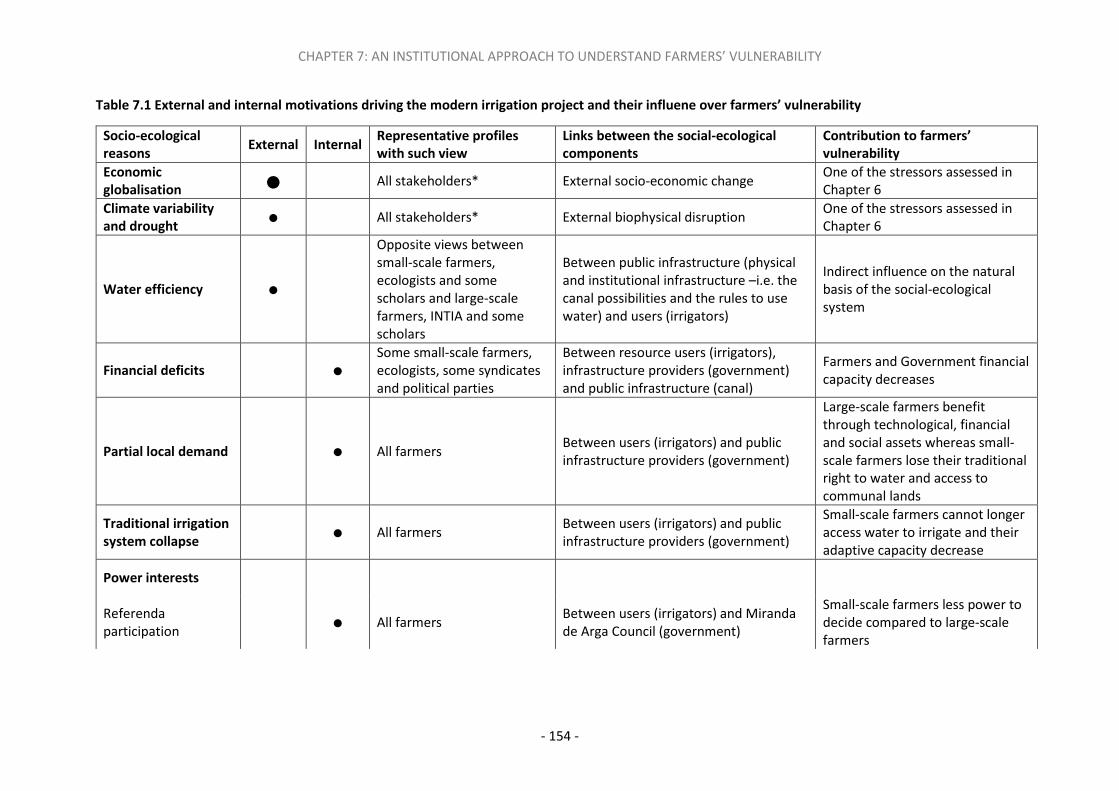
CHAPTER 7: AN INSTITUTIONAL APPROACH TO UNDERSTAND FARMERS’ VULNERABILITY
- 154 -
Table 7.1 External and internal motivations driving the modern irrigation project and their influene over farmers’ vulnerability
Socio-ecological
reasons External Internal
Representative profiles
with such view
Links between the social-ecological
components
Contribution to farmers’
vulnerability
Economic
globalisation ● All stakeholders* External socio-economic change One of the stressors assessed in Chapter 6
Climate variability
and drought ● All stakeholders* External biophysical disruption
One of the stressors assessed in Chapter 6
Water efficiency ●
Opposite views between small-scale farmers, ecologists and some scholars and large-scale farmers, INTIA and some scholars
Between public infrastructure (physical and institutional infrastructure –i.e. the canal possibilities and the rules to use water) and users (irrigators)
Indirect influence on the natural basis of the social-ecological system
Financial deficits ● Some small-scale farmers, ecologists, some syndicates and political parties
Between resource users (irrigators), infrastructure providers (government) and public infrastructure (canal)
Farmers and Government financial capacity decreases
Partial local demand ● All farmers Between users (irrigators) and public infrastructure providers (government)
Large-scale farmers benefit through technological, financial and social assets whereas small-scale farmers lose their traditional right to water and access to communal lands
Traditional irrigation
system collapse ● All farmers
Between users (irrigators) and public infrastructure providers (government)
Small-scale farmers cannot longer access water to irrigate and their adaptive capacity decrease
Power interests
Referenda participation
● All farmers Between users (irrigators) and Miranda de Arga Council (government)
Small-scale farmers less power to decide compared to large-scale farmers

CHAPTER 7: AN INSTITUTIONAL APPROACH TO UNDERSTAND FARMERS’ VULNERABILITY
- 155 -
Socio-ecological
reasons External Internal
Representative profiles
with such view
Links between the social-ecological
components
Contribution to farmers’
vulnerability
Nested enterprises to benefit powerful agents
○ Few small-scale farmers, EHNE syndicate, some ecologists and scholars
Between public infrastructure providers (government) and infrastructure (physical and institutional)
Farmers lose access to lands and water and political elites gain power
Water and land speculation
○ Few small-scale farmers, EHNE syndicate, some ecologists and scholars
Between infrastructure providers (government) and infrastructure (physical and institutional)
Farmers lose access to lands and water and political elites gain power
Based on the shared opinions, a qualitative estimate of relevance of the reasons is provided through the following symbols: ○ Shared by a minority, less than half of the participants
● Shared by approximately half of the participants; and
● Shared by the majority (interviewees and focus group participants).
* ‘All stakeholders’ refer to every kind of farmers and owners, politicians, syndicates, scholars and ecologists.

CHAPTER 7: AN INSTITUTIONAL APPROACH TO UNDERSTAND FARMERS’ VULNERABILITY
- 156 -
7.4. Comparing the robustness of traditional and modern irrigation systems
The confluence of these reasons eventually led to the implementation of modern irrigation in Miranda
de Arga. Through the comparison of the traditional system vis–à–vis the modern system norms, it is
possible to examine the consequences of such transformation for the robustness of the ASES under
study (see Section 2.5). Among the principles necessary for a system to be robust, there were several
which became evident during the interviews and the focus group: 1) the necessity to clearly define
the boundaries of the resource system; 2) the establishment of proportional benefits and costs that a
user is allocated; 3) collective-choice arrangements that individuals use to modify rules; 4) monitoring
and sanctioning means to secure proper use of resources, and; 6) conflict-resolution mechanisms
amongst users or within relationships of users and officials.
First, for ASES to be considered robust, there should be clearly defined natural resource boundaries,
as it allows for users’ rights and limits of resources appropriation to become more evident (Acheson,
2006; Agrawal, 2001; Anderies et al., 2004a; McKean, 2000; Ostrom, 2009a). In the Miranda de Arga
case, irrigation norms (both traditional and modern) are clearly defined as well as the area in which
irrigation can be used. Such area is determined by the existing infrastructure to distribute water, e.g.
acequias in the past and the current pipe-irrigation system. However, in quantitative terms,
interviewees revealed that they were more aware of the total water volume given by the CHE (see
Section 7.2) in the past than with the modern system. Nevertheless, in the modern system, financial
capital seems to gain importance since irrigation water is measured and paid for; thus consumption is
restricted according to the price of water. Consequently, only those farmers able or willing to pay such
costs have access to irrigation water.
A second principle behind the robustness of our ASES is the establishment of balanced benefits and
costs of water for irrigation (Acheson, 2006; Anderies et al., 2004a; Ostrom, 2009a). Farmers adopting
modern irrigation stated that the increase in crop yields compensated the newly acquired irrigation-
borne expenses (e.g. cost of modern irrigation installation and water quota). All participants added
that the traditional system did not allow commercialising crops in international markets due to
insufficient yields. However, the situation changed with the introduction of modern irrigation that
now allows farmers to compete more effectively in international markets. This was a shared
impression during the interviews and acknowledged by all participants in the focus group. However,
modern irrigation replaced the traditional access to water and those who did not or could not invest
in modern irrigation lost their water concession rights. This finding also allows for a better
understanding of results in Chapter 6, which suggested that small-scale diversified farmers were the
most vulnerable group to climatic and market related stressors. With the refusal to adopt modern

CHAPTER 7: AN INSTITUTIONAL APPROACH TO UNDERSTAND FARMERS’ VULNERABILITY
- 157 -
irrigation, this group of farmers has relinquished their historic water concession and consequently
they can no longer access irrigation water.
Small-scale farmers also stated that with the implementation of the new system, they had lost other
cultural services linked to the traditional land management practices, such as local traditional
knowledge and other benefits connected to their identity (see Chapter 0). In this regard, the
distribution of costs and benefits was rather skewed. Consequently, farmers who valued ES beyond
market-oriented ones were marginalised.
ASES’s robustness principles also encompass monitoring –i.e. the control of bio-physical conditions
and users’ behaviour (Agrawal and Chhatre, 2006; Anderies et al., 2004b; Gibson et al., 2000; Nee,
2005; Ostrom, 2009b). As noted in Section 7.2, monitoring is quite different in both systems. A few
participants complained about the fact that the maintenance person used to avoid conflict, and this
led some users to break norms.76 Focus group participants expressed that having external monitoring
could be translated into improved fulfillment of norms due to the lack of personal involvement of
those in charge of monitoring. Additionally, they also perceived higher control of water consumption
due to the meters and the new enterprises in charge of proper functioning of the irrigation systems.
Such examples suggest that in the past, positive social relations with other community members might
have allowed some farmers to take advantages from resources (Ribot and Peluso, 2003). Easier access
to authorities, and negotiations via friendship, trust and reciprocity influenced farmers’ water access
and management. As revealed in Chapter 6, social networks are crucial for social adaptive capacity
and reduction of vulnerability. Such social networks seem to have been more relevant in the past than
within the current situation. Among the existing livelihoods, small-scale diversified farmers already
lacked social networks (within syndicates and cooperatives), so this effect may have a stronger
influence on these farmers.
Fifth, users need to have the capacity to plan their own institutions in the long term (Agrawal, 2001;
Anderies et al., 2004b; Gibson et al., 2000; Ostrom, 2009b). In the modern system, decision-making
are not community decisions and this could endanger potential collective action in the future
(Anderies et al., 2003; Dakos et al., 2015). Some of interviewee farmers perceived bureaucracy as a
barrier to deal with immediate and envisioned obstacles:
“Irrigators do not have the same power as before. For example, to make this modern irrigation
extension we had no option to say how we wanted it” (SI2-14)
76 Statements provided by interviewees, citing the non-existence of sanctions, evidenced this. Some of the interviews explained that sanctioning was not necessary since users always paid the water quota and turns worked adequately.

CHAPTER 7: AN INSTITUTIONAL APPROACH TO UNDERSTAND FARMERS’ VULNERABILITY
- 158 -
Lastly, it is necessary to establish conflict-resolution mechanisms among users or within relationships
of users and officials (Acheson, 2006; Anderies et al., 2004a; Gibson et al., 2000; Ostrom, 2009b) for
ASES robustness. In this regard, nearly half of the interviewees expressed that in the past, there were
few conflicts and they were often due to not comply with irrigation turns, especially during drier
months. To solve these problems, dialogue was the primary method utilised and formal complaints
were avoided. In the modern system, participants were uncertain about how conflicts may be
monitored and addressed by the external company. This uncertainty also referred to other potential
conflicts in the future: for example, whether there would be enough water or pressure to irrigate, as
the initial design was misaligned with the current situation and water quota price was continuously
increasing.77
Table 7.2 summarises the principles78 to assess whether irrigation system was more robust with the
traditional system or after the transformation to modern irrigation.
77 The quota had been tripled in the last three years without justification and the farmers believed it was abusive. Despite the complaints, they did not explain which mechanisms they had used, if any, to protest a change in fee. 78 Only the principles that were identified as relevant by the interviewees and focus group participants within this case study are reported.

CHAPTER 7: AN INSTITUTIONAL APPROACH TO UNDERSTAND FARMERS’ VULNERABILITY
- 159 -
Table 7.2 Comparison between robustness of modern and traditional irrigation systems
Principles Traditional system Modern system Implications
1. Natural resources boundaries
Physical boundaries (-) Water directly accessed from the river, close to the place it was used (<10 km)
Water coming from Itoiz dam Physical boundaries are clear in both systems. Water volume boundary is blurred in both systems since in the past consumption was not controlled and in the modern system since its consumption would be restricted to an established price
Water volume (=) Volume: 1200-3000 m3/seg for about 75 years
Water consumption is paid
2. Equivalence between benefits and costs
Financial (+) Very low cost, low yields Higher cost, higher yields In financial terms, benefits and costs are balanced in both systems – i.e. if they invest more, they gain more. Traditional system did not allow large-scale farmers yields commercialisation. Modern system suppress some cultural services and leads to the abandonment of some small-scale farmers who lose their previous access to water
Cultural (-) High level of cultural services Lack of cultural services
Market options(+) No option to compete at international market level
They can compete in international markets
Irrigation water access by some farmers (-)
All kind of farmers had access Small-scale diversified farmers lose their access
3. Monitoring and graduated sanctions
Surveillance (+) A local surveillance and maintenance person at village level
External company at regional level
Access to authority was easier in the past and hence benefitted from easier water access. However, this could mean inadequate use of water. The scale at which water management is monitored increases along with the technology and employment of human resources
Control (+) No consumption meter boxes Consumed water measured
Sanctions (+) Sanctions were not made Higher control perceived
4. Recognition of rights to organise
Autonomy (-) Higher local autonomy Top-down bureaucratic functioning
Although local institutions are not removed, their decision-making autonomy is reduced
5. Conflict resolution mechanisms
Mechanisms (-) Dialogue was used when infractions occurred. They normally adopted strategies of reciprocity
External notification and legal processes when infractions occur
The mechanisms seem to be equal in the traditional and modern system and large-scale farmers are benefitted in both cases
Note: Symbols in the ‘principles’ categories refer to whether the new situation is more robust (+), less robust (-), equal (=) or unclear (?) after modern
irrigation introduction

CHAPTER 7: AN INSTITUTIONAL APPROACH TO UNDERSTAND FARMERS’ VULNERABILITY
- 160 -
7.5. A qualitative undertanding of the effects of modern irrigation on farmers’
livelihoods
All interviewed farmers expressed that modern irrigation would have uneven impacts on farmers.
Approximately half of the interviewees and most of the focus group participants remarked that the
Itoiz-Canal de Navarra project had left a ‘bitter taste’ between small and large landholders. This was
a shared impression during fieldwork conversations. Differences regarding the distribution of
irrigation water and communal land, if perceived unfairly, may lead to social conflict79 (Barnett and
Eakin, 2015). Uneven power relations and injustice are seen as fundamental drivers of vulnerability
and insecurity (Kloos et al., 2013). Additionally, farmers’ vulnerability may increase according to the
quality of resources and denied access to such resources which are important to sustain certain
livelihoods (Barnett and Adger, 2007).
The majority of the interviewees admitted that intensive farmers’ situation had improved under the
modern system since the harvests were larger, sometimes with two harvests per annum, which
translated into higher economic returns. A few even stated that modern irrigation was the future of
the sector in the area and without this transformation the sector would collapse. Moreover, during
the focus group discussions, people agreed that, in contrast, traditional irrigation did not permit large-
scale farmers compete in the international market and this made those farmers more vulnerable in
an economic global context.
“I can understand some landholders don't want Itoiz-Canal de Navarra, but that cannot
condition profitability for all the rest of farmers. In the past there was only cereal, wheat and
barley because that was all you could do at a reasonable cost” (SI2-4)
Modern irrigation, though, seemed to make other types of farmers more vulnerable to market and
climate-related stressors. Among other reasons, modern irrigation causes an uneven access to
communal lands by farmers, thus diminishing small-landholders’ access to natural assets, one of the
crucial capitals in vulnerability analysis. Around half of the interviewees explained that one condition
the council had for getting a higher subsidy to install modern irrigation in communal lands was to
allocate those lands to priority farms.8081 Consequently, in the new situation a larger percentage of
communal land is distributed among those farmers fully dedicated to the agrarian activity because of;
79 “A range [of] negative interactions that encompass mild verbally-expressed discord and cold interstate relationships, as well as hostile acts or declarations of war “(Kloos et al., 2013). 80 Priority farms are those whose owners are professionally engaged in agricultural activity, with revenues sourcing primarily from this activity, and who have a land hold of sufficient size to provide work for a person full time (see Foral Decree 150/2002, of July 2nd, which approves the Foral Law regarding agrarian farms register in Navarre). 81 A revision of the communal land norm modification confirms this (Boletín oficial de Navarra, 2015).
CHAPTER 7: AN INSTITUTIONAL APPROACH TO UNDERSTAND FARMERS’ VULNERABILITY
- 161 -
1) rents of communal lands were higher since council wanted to recover the investments made to
install modern irrigation and 2) those accessing these lands had longer contracts than in the past.
As a consequence of changes in communal land norms, the vast majority of the interviewees reported
the abandonment of agrarian activity by small-scale diversified farmers. Such abandonment was also
due to the industrialisation and the aging-out process of the remaining farmers (the majority of
farmers were older than 50 years)82, but modern irrigation transformation had accelerated the process
of relinquishing their lands. Several interviewees indicated that the number of landowners is
decreasinsg exponentially in the region. One interviewee explained that, “The land has gone from 60
to 6 plots. Moreover, before the average area was 0.6-0.5 hectares and now the average is around 7-
8 hectares” (SI2-1). Another interviewee (SI2-14) provided an internal list of Miranda de Arga irrigators
that showed that the number of landowners had decreased by 80 individuals in only one year. In the
words of one interviewee:
“In the end, multinationals will end up buying all the land. It is an industrial design that is
already happening in other places. The company that sells you the seed, fertiliser, herbicide- is
the owner of the land and the farmers, the few that remain, will be paid just for their labour”
(SI2-22)
About half of the interviewees did not welcome this new situation, arguing, for example, that “It is not
in the general interest when only a quarter of landowners remain” (SI2-2). Furthermore, they stressed
that small-landholders, due to modernisation, had to refuse their rights to irrigation water that were
not going to be recovered. Consequently, they would be more vulnerable during dry periods, if still
wanted to cultivate their lands.
Some focus group participants and interviewees pointed out that there were still unrevealed co-lateral
effects of small-scale diversified farmers’ abandonment of agriculture. For example, they explained
that some owners, who were unwilling to adopt modern irrigation, had decided to rent their land or
leave it to cooperatives under long-term contracts. Such decisions could encourage an over-
exploitation of land by cooperative members; the land would be returned when infrastructure was
obsolete and owners might have lost their work capacity (due to aging, machinery sold, loss of
traditional knowledge and experience). These concerns are reflected in the potential increase in
vulnerability by those (and their descendants) who are not willing to adopt modern irrigation:
“If my daughter wanted to become a farmer in the future, she would have access to three
hectares, but that is not enough to be competitive in comparison to others having 300
82 Thirty-seven percent of the population in Navarre in 2013 was older than 50 years. (Instituto de Estadística de Navarra. URL: http://www.cfnavarra.es/estadistica/redie.asp?qry=01 Last access 26/03/2014).

CHAPTER 7: AN INSTITUTIONAL APPROACH TO UNDERSTAND FARMERS’ VULNERABILITY
- 162 -
hectares. It can be said that I have access. Legally I have it, but access to what? We are talking
about another thing not about new entrepreneurs’ possibilities” (SI.2-18)
A third outcome of the uneven access to water and lands was the deterioration of social relations, an
impression shared just among a few of the interviewees. One individual gave relevant examples:
“Large-scale irrigators agreed on a price to buy good lands as they knew owners would sell
them anyway” … “I was told: If you don’t sell your land, you will be isolated there. We all are
going to do large-scale agriculture irrigating and fertilising and your land will be flooded as a
consequence. And you know what happens if land is flooded? Epidemics! You will not be able
to raise anything!” (SI.2-20)
Informal institutions, such as reciprocity and mutual understanding, are clearly deteriorated by such
personal threats, which may lead to the weakening of cooperative arrangements. Such weaking may
in turn lower adaptive capacity.
There were other relevant points highlighted in the interviews, though not directly linked to the norms
modifications, but that influenced social relation weaknesses. A few interviewees explained that
shifting to more intensive and irrigated land management may lead to cross-scale impacts, including
pollution of organic plots by intensive farmers’ practices. An interviewee indicated:
“I cannot afford an ecological garden if another person is fertilising with sulphates all the time
next to my plot. These products end up in my land. I need barriers; otherwise I will not be able
to sell my products as ecological products” (FG.1)
A fourth outcome, which is related to the previous idea, is that only a few interviewees highlighted
the negative environmental effects of modern irrigation. Those who did, however, mentioned the
disappearance of small plots full of vegetation and animals, which can also lead to an important
change of landscape and biodiversity. Moreover, although studies were conducted to delimit
adequate zones for irrigation83, field observation and local testimonies revealed concerns regarding
the suitability of converted areas due to land flooding. These fears indicate a vulnerability concern
related to the ecological dimension of the ASES. Moreover, such new practices associated to modern
irrigation imply higher input necessities, which influence farmers’ financial capacity so that their
adaptive capacity to deal with stressors and shocks is also influenced by these facts.
83 This information is in the ‘Delimitation of potential areas irrigated and currently under irrigation of the Mediterranean slopes of Navarre’ developed by the Institute for Soil and the ´Study of the demand of water for irrigation in 1986´ and the ´Irrigated areas of Navarre´ by the Institute for Territorial Studies and Riegos de Navarra, S.A. (Beaumont, 1997).
CHAPTER 7: AN INSTITUTIONAL APPROACH TO UNDERSTAND FARMERS’ VULNERABILITY
- 163 -
Finally, there was a shared perception of uncertainty regarding farmers’ and the state’s financial
situation after the adoption of modern irrigation. On the one hand, the current chapter reveals that
investments under modern irrigation systems were high, whereas Chapter 6 showed that global
markets’ prices volatility put large-scale intensive farmers’ activities at risk, since they normally
specialise in fewer crops and their exposure increases due to the large amounts of yields they produce.
Therefore, despite holding large surfaces of land and yields, they have no guarantee their crops would
be profitable.
Modern irrigation infrastructure funding was based on a non-compulsory agreement for only the first
phase of the project, but the second phase and the extension were not mentioned in such agreement.
Additionally, the study developed by Brinquis (2011) stated that Itoiz-Canal de Navarra project was
not profitable if the necessary time for revenues and the discount rate on investments were
considered. Furthermore, Beaumont, (1997) and syndicates meetings discussed that this project was
denying other irrigation cheaper and more local alternatives (alternatives for the cessation of Phase
Two) leading to ‘rigidity traps’84 (Robards et al., 2011). In contrast, supporters of the project argued
that toll payments allowed the government a ‘margin of manoeuvrability’ to invest in other aspects.
To address this, opponents to the canal explained that the first phase of the project supposed an
expenditure of 483.5 million euros, with an additional cost of 500 million euros. The irrigation zone
costs would be through 'shadow payments' and the Navarre government would have to pay 8.5 million
euros per year for 30 years. Combined with the 13 million per year of the first phase, this adds to 21.5
million per year, meaning the depletion of the public budget for other agrarian purposes.
7.6. Farmers’ vulnerability through the lens of legitimacy and equity
I use the lenses of legitimacy and equity to further discuss the effects of modern irrigation on farmers’
vulnerability. Equity and legitimacy have been largely absent in debates about agrarian intensification
and modern irrigation technology, which have focused instead on cost-effectiveness water use
efficiency arguments (Corbera et al., 2007b; McDermott et al., 2013). When farmers perceive decision-
making as legitimate and outcomes fair, it is more probable that such decisions will be effectively
implemented and conflicts avoided (Barnett and Eakin, 2015).
I do not assess participants’ perceptions of equity and legitimacy here but instead I try to understand
the context and the mechanisms used by farmers to access natural resources and make decisions
regarding how such resources should be managed and distributed (see Section 2.5). I postulate that
84 When institutions tend to remain highly connected, self-reinforcing, and inflexible despite changing circumstance, limiting the ability of actors within the system to reorganise (Robards et al 2011).

CHAPTER 7: AN INSTITUTIONAL APPROACH TO UNDERSTAND FARMERS’ VULNERABILITY
- 164 -
those most vulnerable are typically unable to take part in decision-making, or are not recognised by
irrigation-related norms, and consequently their values and preferences are underrepresented,
potentially leading to conflicts and an increase in their vulnerability condition.
At government policy level, modern irrigation decision-making grounds its legitimacy in the existing
legal framework, i.e. through the different norms that support the implementation of the Itoiz-Canal
de Navarra irrigation project. Since the construction of the dam, the modern irrigation project sought
to rest its legitimacy upon constitutional and legal processes at both the national and regional level
(see Section 3.2). A brief contextual review demonstrates that there are several formal norms (e.g.
Real Decree 22/1997 regarding the necessity of dam construction, Foral Order 186/2011 and Foral
Order 185/2015 about pressure irrigation financing investments) that are used by organisations (e.g.
Navarre’s government and its agencies in charge of building and managing the canal) to persuade
farmers and other social actors to get involved in such project. Such legal backing fits with the cultural
expectations and interpretations of what should be considered legitimate, where legitimacy is
equated to legality. Therefore, legality becomes a powerful argumentative tool for those both
defending and contesting the irrigation project.
In addition to the legal backing framework, both the state and regional governments, along with local
cooperatives, support and materialise the modern irrigation project on the grounds of financial and
employment motivations. Those orgnisations defend that this infrastructure will improve water urban
supply, develop agrarian sector through modernistaion, advance the flood control and produce
hydroelectric power. Therefore, there already existed economic, political and social arguments in
favor of modern irrigation made by powerful organiations, whereas opponents lacked legal support
and social networks to substantiate their arguments.
At local (village) level, participation in decision-making forums and processes related to the modern
irrigation project diverges across the different farmer typologies co-existing in the study area.
Although there was local participation in nearly all the steps advancing towards the change in the
irrigation system, findings from previous section demonstrate that some farmers, particularly small-
scale diversified ones, were unhappy about the project’s top-down nature and the lack of
opportunities to adequately voice their concerns. As Forbes, (2008) points out, the improvement of
information, transparency and accountability arises as a key challenge in the fostering of trust and the
improvement of adaptive capacity by all farmers and owners in Navarre, but primarily for small-scale
diversified farmers. Consultation should go beyond informing stakeholders and farmers should be
included in the preparation of irrigation-related norms. With that aim, broad advertising and
scheduling should favour all stakeholders’ in attendance, as those mechanisms are key elements to
recognise stakeholders’ diversity and make their participation possible.

CHAPTER 7: AN INSTITUTIONAL APPROACH TO UNDERSTAND FARMERS’ VULNERABILITY
- 165 -
This chapter, as well as Chapter 6, findings also suggest that affiliation with powerful social networks
(e.g. cooperatives and syndicates) can determine some type of livelihoods’ hegemony over others, i.e.
intensive farmers’ aims may eclipse those of small-scale diversified farmers. According to Adger
(2003), this confirms that the powerful actors within a society can maintain their privileged position
by legitimising it through a system of norms. Moreover, in line with Swyngedouw (2004), I focus on
power and strategies pushed through state-led modernisation projects, and align with Marsden et al.,
(2002) in the recognition that there is social exclusion within development programmes, mechanisms
and policy implementations; at times exclusion is used by local elites to reaffirm the legitimacy of their
development discourses.
My findings make evident also that older owners and less educated landholders are at a disadvantage
due to their lack of access to ‘privileged’ information, (i.e. education or social connections), which
limits their ability to participate effectively in the development of irrigation norms (Ribot and Peluso,
2003). An owner’s report also discloses coercive85 claims. Such claims are made by powerful groups of
farmers whose institutional discourses and practices influence other farmers’ behaviours making the
latter sell their land.
Furthermore, the conditions established by Navarre’s government concerning communal land access
and their related subsidies to install modern irrigation clearly benefit large-landowners and richer
farmers and promote a less frequent rotation of communal lands. Such an approach marginalises
small-scale farmers who are often older and less educated. Likewise, in regard to the referenda, small-
scale diversified farmers were again at a disadvantage in comparison to large landholders (as they had
lower levels of recognition and inclusion in the process), being therefore an unfair distribution of
decision-making power.
From an outcome distributional perspective (equity), findings reveal an uneven distribution of costs
and benefits from modern irrigation in the area. Large-scale farmers accessing modern irrigation get
increasing yields that permit them to be more competitive in international markets. Simultaneously
such technology facilitates their land management and their access to communal land is also
improved, since larger extensions of transformed lands that small-landholders cannot access become
available to them. Consequently their natural capital, a crucial asset in rural livelihoods, increases.
This, in turn, increases their adaptive capacity.
In contrast, small-scale diversified farmers do not perceive any benefit but rather several costs.
Modern irrigation adoption does not fit with their consolidate and adaptive livelihood and for this
85 Coercion is understood as ‘the injustice that can arise when people buy and sell things under conditions of severe inequality or dire economic necessity’ (Corbera, 2015, p. 156).

CHAPTER 7: AN INSTITUTIONAL APPROACH TO UNDERSTAND FARMERS’ VULNERABILITY
- 166 -
reason they do not invest in such modern irrigation system and lose access to traditionally irrigated
water. The fact that several of them decidd to sell their lands precludes the access of their future
generations to the rural landscape, including communal lands.
Therefore, access to land and water rights of small-landholders and how future opportunities would
be distributed among the farmers is an apparent challenge blurred by economic and development
narratives of the rural sector in Navarre. These threats contribute to reinforcing existing power
structures, inequities and vulnerabilities and therefore, modern irrigation institutions are perceived
as deficient for local decision-making arrangements.
I acknowledge that ‘there are multiple principles of equity such as principles of desert (i.e. who
deserves to win or lose), equality, or need’ (Adger et al., 2005, p. 84). In consequence, and considering
that large-scale intensive farmers’ income is sourced solely from agriculture, one could infer that they
deserve such technological improvement more than small-scale diversified farmers (whose livelihood
is already consolidate86, see Section 4.5.1). However, if we consider equality and need priciples, the
involvement of the maximum possible quantity and diversity of stakeholders would be prioritised, and
one could alternatively infer that the modern irrigation project should be more sensitive to the needs
of the disadvantaged – i.e. the double vulnerable group of small-scale diversified farmers (Corbera et
al., 2007a). However, the findings of this chapter and Chapter 6 demonstrate that modern irrigation
introduction, as a means to foster economic development and climate adaptation, reinforces
inequalities in access to water and land and do little to alleviate underlying vulnerabilities.
Overall, a legitimacy and equity perspective has deepened our understanding of the effects of modern
irrigation on farming groups, and has revealed striking differences in terms of participation and
distribution of costs and benefits across farmer groups. Considering such differing social and farming
profiles and power relations in the contexts where modern irrigation unfolds should be regarded as a
first critical step to avoid conflicts and guarantee a more socially just and environmentally responsible
technology adoption process. In the specific case of Miranda de Arga and the region affected by the
Itoiz-Canal de Navarra project, fostering more legitimate processes and a fairer distribution of modern
irrigation costs and benefits through action-research and public policy is urgent. This will require the
transformation of existing practices in a way that are more attentive to social diversity and cultural
values, and facilitate the co-existence of multiple types of farming livelihoods.
86 Consolidate here refers to those farmers who are no longer seeking the accumulation of assets, but are instead living from assets previously generated.

CHAPTER 7: AN INSTITUTIONAL APPROACH TO UNDERSTAND FARMERS’ VULNERABILITY
- 167 -
7.7. Summary
This chapter has shown that the Itoiz-Canal de Navarra modern irrigation increases farmers’ water
consumption control at the expense of them becoming more dependent on nested enterprises that
control irrigation water, which might be translated as an overall increase in farmers’ vulnerability due
to their decreases in adaptive capacity. In relation to the legitimacy of modern irrigation introduction
in the area and the distribution of natural resources and project-related information, this chapter has
demonstrated that small-landholders (elderly, retired or multi-income farmers) have been partially
excluded from the decision-making process of introducing modern irrigation. Consequently, land is
being transferred to larger-scale intensive farmers along with the privatisation of farmers’ previous
water-use rights, which is increasingly controlled by the state.
Intensive farmers’ adaptive capacity to climate and market fluctuations, assessed in Chapter 6, cannot
therefore be characterised as successful because it is affecting the ability of other farmer typologies,
i.e. it is increasing the vulnerability of small-scale diversified farmers. For this reason, modern irrigation
may be interpreted as a mal-adaptation. This chapter has also shown that within the context of rapid
economic growth and global economic integration, the current agricultural transformation pathways
create new vulnerabilities in populations that are either excluded from such growth, or whose
economic activities suffer as a consequence of such globalising trends.
CHAPTER 8: CONCLUSIONS
- 168 -
CHAPTER 8
“Imaginar la realidad sigue siendo tan importante como construirla”
Gioconda Belli
8. Conclusions
This PhD dissertation has analysed the social, ecological and institutional effects of agrarian
intensification by studying the adoption of modern irrigation in Navarre, Spain. In this last chapter, I
summarise its main findings, theoretical and methodological contributions, and I highlight key areas
of further research.
8.1. Summary of findings
8.1.1. Four typologies of farming livelihoods
In addressing the first research question, i.e. What combination of capital assets is associated with
particular livelihood strategies in Navarre?, this dissertation has shown that the rural livelihoods in
the study area are diverse and dynamic. The research has uncovered four distinct groups of farmers
regarding their land management practices: 1) small-scale diversified; 2) medium-scale rainfed
organic; 3) medium-scale intensive, and 4) large-scale intensive farmers. These groups are associated
to different combinations of available capital assets.
Medium-scale rainfed organic and medium-scale intensive farmers are mostly young farmers with
higher levels of education and with access to financial assets (e.g. subsidies). Both groups of farmers
are similar in such aspects, but their land management strategies diverge in terms of water
consumption and type of fertilisers used. Both follow an accumulative strategy and welcome modern
irrigation. Rainfed organic farmers also grow rainfed vineyards and always apply organic fertilisation,
whereas medium-scale intensive farmers mainly grow maize under highly irrigated and mineral
fertilised systems. The main difference between the two groups is that intensive farmers participate
primarily in the existing rural networks (agrarian cooperatives and syndicates), whereas organic
farmers do not, since they do not find any appeal in such social networks. Existing cooperatives and
the main rural syndicate support intensive farming practices, also promoted by the government of
Navarre. In contrast, small-scale diversified are older and their land management also differ within the
group. These farmers are also associated with more diversified income sources and they are the only
group who has not adopted modern irrigation. Furthermore, small-scale diversified farmers lack
access to social networks and financial assets.
CHAPTER 8: CONCLUSIONS
- 169 -
Regarding the impact of modern irrigation on livelihoods, the research has revealed that small-scale
diversified farmers are displaced from the agrarian landscape, since some of them have sold their
lands, partially due to their lack of land area. Both facts (lack of large plots and their tendency to sell
the small plots they have) influence their ability to adopt a more competitive strategy of agricultural
practices. The absence of social networks and financial assets also negatively impinge on the adaptive
capacity of this group. Small-scale diversified have been unable to improve their livelihoods, and
defend their existing assets effectively. In contrast, intensive livelihood farmers increased their
purchased and rented lands (survey data). Such reaffirmation of intensive livelihoods can be most
likely related to the decline of extensive livelihoods, since the former are buying the latter’s lands. This
justifies the need to further investigate the implications of a new technology for rural competitiveness.
8.1.2. Divergent perceptions and values of agrarian ecosystem services
This thesis has also shown that the access to key assets is vital for farmers’ land management
strategies and that such access determines their valuation of agrarian ES and their cognisance of their
own co-production of such services. In responding to the research question, i.e. Does agrarian
intensification influence people’s perception and valuation of multiple agrarian ES?, the thesis has
demonstrated that small-scale diversified farmers place a higher value on the recreation services
provided by agrarian ecosystems and attach greater importance to the benefits derived from
knowledge and identity compared to other farmers. Moreover, only small-scale diversified farmers
are significantly more aware of the effects of their land management on food quality. In contrast,
farmers who have installed modern irrigation systems place a greater value on the agrarian
ecosystem’s capacity to regulate plagues and absorb pollutants. Those with larger irrigated farms
assign a lower value on traditions and traditional knowledge associated with agrarian ES. These results
are in line to those of Kull et al. (2015), who state that converting to more intensively managed land
may jeopardise multifunctional agrarian land management and cultural services, such as those related
to traditional knowledge, landscape and traditions.
Additionally, the research has shown that small-scale diversified and medium-scale rainfed organic
farmers value cultural (traditions, landscape and traditional knowledge) and regulating (diseases,
erosion, climate and water regulation) services respectively more than intensive farmers. Sustaining
the livelihoods of such small-scale farmers could determine the continuity of these agrarian ES since
these two groups are the most conscious about the key role played by these services in ecological and
socio-cultural terms. If these two types of farmers disappeared from the region – as Chapters 4 and 7
suggest might happen in the near future -, the absence of cultural and regulating agrarian services
may be mistakenly taken for granted or disregarded by future generations.

CHAPTER 8: CONCLUSIONS
- 170 -
8.1.3. Double vulnerable livelihoods and trade-offs between vulnerability dimensions
In addressing the third research question, i.e. Which livelihoods are more vulnerable to 1) climate
variability and drought, and; 2) crop price volatility and why this may be the case?, the dissertation
has shown that small-scale diversified farmers are vulnerable to both climatic factors and crops’ price
volatility. The older age and lower level of formal education of some of these farmers complicate the
access to technologies, social networks and knowledge, which negatively impact their ability to adapt
to the combined effects of socio-economic and environmental changes. Other farmers’ strategies
(within the small-scale diversified livelihood) are grounded on multiple income sources but also lack
social networks and financial assets. Consequently, small-scale diversified farmers’ adaptive capacity
is the lowest, despite not being as sensitive to climate and market-related fluctuations as other farmer
groups.
Medium-scale rainfed organic farmers are also highly vulnerable to climate-related stressors. They
have a high sensitivity because they have on average more economically dependent members in the
household, and although they have financial options to aid in adaptation, their connections to
mainstream agricultural organisations are weak. Large-scale intensive farmers are the second most
vulnerable group (after small-scale diversified farmers) because they manage the largest areas of cash
crops and are thus highly exposed to commodity price volatility and climate variability. The research
has also revealed a trade-off between sensitivity and adaptive capacity. Intensive farmers grow large
extensions of water demanding crops, such as maize, and they have less diversified income sources
which renders them more sensitive to climate-relate stressors or price volatility. However, their access
to technology, subsidies, insurance products and cooperatives to manage stressors and shocks are the
highest in comparison to the rest of farmer groups.
The above results confirm the mal-adaption hypothesis, which refers to the actions taken to avoid or
reduce vulnerability that adversely impacts other systems, sectors or social groups (Barnett and
O’Neill, 2010, p. 211): modern irrigation negatively affects the most vulnerable farmers. Furthermore,
initial access to abundant resources, such as irrigation water, might reduce incentives to mitigate and
adapt; for example, by encouraging unnecessary dependence on water or by stimulating rent-seeking
behaviour. Such potential outcomes are also considered maladaptive. Moreover, as Robards et al.
(2011) suggest and became apparent through fieldwork, large infrastructural development typically
commits capital and institutions to trajectories that are difficult to change in the future (rigidity traps);
for this reason, modern irrigation may be again considered a mal-adaptation option.

CHAPTER 8: CONCLUSIONS
- 171 -
8.1.4. Modern irrigation institutions increase the vulnerability of non-adopters
In addressing the last research question, i.e. How has the development of modern irrigation
transformed traditionally irrigated systems and influenced irrigation regulation and farmers’
vulnerability?, this research has demonstrated that the robustness of the locally studied social-
ecological system varies depending on the system’s robustness principle one focuses on and on the
farmer’s typology. Chapter 7 reveals two different trade-offs. First, there is a trade-off between
effectiveness and equity. Modern irrigation allows increasing yields, which in the short term means
that the new system is effective in improving the productivity of large-scale farmers. However, it also
diminishes small-scale diversified farmers’ values regarding cultural benefits that are strongly
associated with the traditional irrigation system, which disappear with modern irrigation.
There is a second trade-off between the increased control of water consumption, which accompanies
modern irrigation, and a lower level of self-organisation mechanisms in the new institutional context.
Farmers adopting modern irrigation become more dependent on the state (e. g. CHE and the
government’s agriculture department) and related enterprises that control irrigation water when
stress factors such as market and climate fluctuations affect them. The increase in bureaucracy
associated with modern irrigation translates into a centralisation of decision-making, which shifts from
the local level to higher organisations such as the national state. This institutional change makes the
plural views concerning irrigation water and the management of communal lands existing in the case
study area invisible to civil society and policy-makers.
The research has also found that small landholders (older, retired or multi-task employment farmers)
have been partially excluded from decision-making processes during the introduction of modern
irrigation. For instance, in the Miranda de Arga referendum, the value of the vote was linked to the
farmer’s landholding size, which considerably reduced the power of small-scale farmers in comparison
to large-scale ones. Moreover, the village’s local council has taken a favourable stance to adopt
modern irrigation and to implement the removal of the traditional system, ignoring what the majority
of farmers – who were mostly small-scale- expressed in first referendum.
Modern irrigation has also brought about an unfair distribution of benefits, particularly among small-
scale diversified farmers and medium-scale rainfed organic farmers. It has been revealed that access
to communal land and water, and how future opportunities (e.g. land purchasing or organic farming
performance) would be distributed among farmers is a challenge incompatible to rural development
and competitive agriculture. Modern irrigation, as a state-driven modernisation process, lacks a
strategy that would prevent benefits being distributed only to certain types of farmers, and it does

CHAPTER 8: CONCLUSIONS
- 172 -
not include the means for small-scale diversified farmers to remain in such evolving agricultural
landscape.
Overall, this research has confirmed that large-scale agriculture finds the means to prosper with the
support of the state apparatus and at the expense of small-scale farmers, who become marginalised.
Current powerful institutions and existing organisations reward large-scale intensive farmers,
resulting in the remaining farmer groups and their related values being excluded from the modern
irrigation project. This critique however, is not incompatible with the recognition that some rural
actors can also benefit from the intensive land management practices that accompany modern
irrigation adoption, including an increased household income, higher rent extraction from common
lands, and the strengthening certain land management skills, among others.
8.2. Theoretical and practical implications
This dissertation revealed, first, the importance of acknowledging different social groups within a
context in order to recognise livelihoods diversity (White, 2016) and value pluralism. On one hand, the
dissertation, in line with Van der Ploeg et al. (2000), has demonstrated that rural livelihoods can
generally be classified following two dichotomies: modernisation vs. rural development and industrial
agriculture vs. organic or small-scale agriculture. Such recognition is important for policy making as a
first step to account for the different profiles of farmers and to discern that rural pluri-activity
represents a new form of social capital and makes it possible for farmers to remain in business
(Chapter 4).
Second, and in agreement with Chan et al., (2012), the research has also illustrated that more
comprehensive awareness and understanding of cultural and social values of ES is needed. Discoveries
regarding preferences and co-production awareness may increase the likelihood of engaging farmers’
participation in behavioural change (Chapter 5). As Gómez-Baggetum and Kelemen (2008) suggest,
this research finds that as a consequence of modern irrigation, there are unbalanced effects over
farmers’ values, such as the potential decrease of key cultural services (Eakin, 2005). Organisations
(e.g. INTIA) and policies promoting intensive agriculture deserve more attention since they may be
unwillingly influencing farmers’ sense of stewardship and belonging to agrarian landscapes. In line
with Orenstein and Groner (2014), the research has also shown that cultural services, such as
emotional attachment and cultural meanings, strongly influence local residents –particularly small-
scale and organic farmers- but have not yet been given the attention they deserve in academic and
policy areas.

CHAPTER 8: CONCLUSIONS
- 173 -
Third, the dissertation has also paid attention to the extent to which socio-demographic and
production strategies influence agrarian ES valuation by farmers (Chapter 5). This issue is important
at least from two perspectives. One the one hand, following Orenstein and Groner (2014), the
research has advocated for a greater role of social approaches in ES assessment and it has argued for
a more careful integration of farmers’ views and preferences over ES in rural planning and policy
(Mulder et al., 2015). On the other hand, at a methodological level, the dissertation has provided an
innovative approach to analyse trade-offs of agrarian ES through stakeholders’ stated preferences.
Regarding social vulnerability and institutional theory, the dissertation has found that there are critical
factors that can decisively enhance or decrease social vulnerability. Technological, financial, social
networks and natural assets are key assets allowing farmers to be less vulnerable to stressors and/or
subsequently adapt (Chapter 6). In line with Eakin and Luers (2006), the research has also shown that
the control that political elites exercise over community organisations inhibits the development of the
forms of social capital necessary to reduce small-scale diversified farmers’ sensitivity to climate and
market-related stressors (Chapter 7). Regarding the latter issue, the dissertation has highlighted the
importance of legal support and social networks to legitimatise large-scale agrarian projects and
decision-making processes, as part of stakeholders’ expectations. The research has found a path
dependency on existing norms and social organisations that obstruct other rural alternatives, which
are unable to flourish in such an unfavourable context (Chapter 7).
The dissertation has found that the most vulnerable group of farmers to climate and market related
fluctuations might not be able to sustain their livelihoods (Chapter 6). As Dakos et al., (2015) indicates,
the decline of famers’ diversity is prone to increase the vulnerability of the social-ecological system. If
those disappearing are the ones valuating other agrarian ES beyond yields and income, critical
traditional knowledge may be severely impacted, thus potentially augmenting the overall system
vulnerability in the long term.
As regards vulnerability, the dissertation hints at the fact that policy-oriented publications typically
attend to response (what to do) rather than causality (why the socio-ecological system is at risk), as if
causes were not a part of redressing vulnerability and its production causes and consequences. As
Ribot (2014) argues, policy-making blindness to existing vulnerabilities would imply that the causes of
risk are not understood. Considering ‘why’ also addresses the complexity and cost of short versus long-
term solutions to vulnerabilities. For this reason, this kind of approach may not be welcome by those
who have a role of responsibility and those benefitting, passively or actively (Ribot, 2014).

CHAPTER 8: CONCLUSIONS
- 174 -
Regarding the notion of equity, the dissertation has attempted to shed light on the contested nature
of the concept, but also on the analytical value of its application in the case study context. One should
understand the mechanisms that explain why some farmers are not recognized as subjects of policy
and, consequently, do not participate in decision-making. Furthermore, the existence of diverse
livelihoods (and values) requires more attention in policy planning and this thesis has shown that this
has not been the case so far in the Itoiz-Canal de Navarra irrigation project, where the conditions and
values of small-scale diversified and organic livelihoods have been marginalised. Indeed, the irrigation
transformation process has not accounted for local understandings of what is traditionally considered
to be fair, and has responded instead only to short-term economic criteria.
These findings suggest that Eurocentric scientific and political worldviews about intensification are
subordinating farmers who are not aligned with this perspective. As McDermott et al. (2013) also
suggest, large-scale farmers are aided by existing legal norms -e.g. irrigation and communal, in
addition to existing local, regional and state organisations- that enable them to control and maintain
access to water and land by influencing others’ ideas and by shaping institutions and practices that
further influence behaviours (Chapter 7). Thus, small-scale diversified farmers’ low adaptive capacity
is explained by their specific demographic and socio-economic features, as well as by a set of new
institutions that inhibit their access to common natural resources and therefore impede the decision-
making capabilities of these farmers.
8.3. Future research directions
Modern irrigation effects on ASES, and more generally technological shifts that endorse agrarian
intensification are aspects that require further scrutiny by scholars interested in agrarian systems and
sustainability science. First, there is a need to conduct more research on the relationship between
agrarian ES and human wellbeing, particularly in contexts where farmers are adopting new
technologies (e.g. irrigation, GMOs) that can substantially transform their land management practices
and even their worldviews. Although I have illuminated aspects of farmers’ perception about agrarian
ecosystems, including the influence to their wellbeing and awareness regarding farmers’ co-
production over agrarian ES, the interactions between agrarian practices and human wellbeing have
not been directly assessed in this dissertation. However, I have indirectly measured the effect of
farming intensification on human wellbeing through vulnerability analysis.
Second, it is important to go beyond the study of farmers’ vulnerability and combine it with analysis
of ASES resilience. Many immediate responses to vulnerability might only result in short-term,
potentially maladaptive outcomes, since there is a risk of locking in a pathway that decreases
CHAPTER 8: CONCLUSIONS
- 175 -
vulnerability in the short term but that it may increase it in the long term. Equally, a long-term
response to build resilience or transform may not provide rural people with sufficient adaptive
capacity in the short-term, although it may avoid maladaptation (Luers et al., 2003b; Maru et al.,
2014). Understanding and analysing vulnerability as performed in this dissertation essentially involves
an actor-oriented and short-term approach, which disregards the mid/long-term socio-ecological
dynamics (e.g. climate and market fluctuations) in which households are embedded. To counteract
this caveat, resilience thinking suggests a more system-level and long-term focused analysis with a
target on adaptive capacity and maintaining the ability to deal with future uncertain change. A
resilience approach recognises that vulnerability is inherent in the systems and rather than trying to
eliminate it, the challenge resides in identifying acceptable levels of vulnerability. Adopting a broader
spatial-temporal scale can thus be useful to investigate social-ecological systems’ vulnerability instead
of social vulnerability only. This dissertation has focused on a single-sector analysis of agrarian
intensification, thus providing an incomplete understanding of the general drivers of change (De Groot
et al., 2010).
Third, another area of further research enquiry concerns the scientific-policy nexus regarding how
policy-makers and farmers can make better and more informed rural development decisions in the
context of land-use systems, while seeking to optimise their services and avoid undesirable
consequences at the different geographical scales. At a global scale, the IPCC (2014) emphasises the
importance of including land systems planning, but much needs to be done. Adding agrarian ES
information and exisiting rural vulnerabilities to IPCC scenarios will make more tangible projections
possible, by better understanding the land-use and climate feedbacks at different geographic scales.
8.4. Final remarks
In response to the central objective of this PhD thesis which is to inform about the implications of
agrarian intensification for ES and social vulnerability, I postulate that the usually assumed positive
synergies between modern irrigation and rural development should be treated with due caution. If
modern irrigation is to help rather than hinder sustainable development, this kind of technology first
needs to recognise the competing views and diversity of stakeholders involved in rural livelihoods
decision-making. Moreover, the tendency to adopt more intensive land management practices as
those farmers embracing modern irrigation do and who were revealed to care less about cultural
services, suggests a potential long-term impact on the multi-functionality of ASES. However, this
research has made evident that modern irrigation, at least in Navarre, has been a blunt instrument
with respect to issues such as equitable inclusion and distribution of environmental outcomes leading
certain farmers to a highly vulnerable condition.

CHAPTER 8: CONCLUSIONS
- 176 -
The market-oriented nature of large-scale modern irrigation projects preclude them from paying
enough attention to local characteristics, ambiguous resource management conditions, and building
the necessary institutional arrangements to make agrarian productivity and other rural alternatives
compatible. It also limits local ability to increase the levels of representation and inclusion of the
diversity of existing farmers’ views and needs, in strategic decision-making at the local level in a way
that challenges existing institutional hierarchies.
Although it is still too early to fully evaluate the contribution of modern irrigation to rural development
in Navarre, it is critical that policy-makers, practitioners and researchers reflect on the implications of
this type of large-scale techno-projects for environmental justice and the precautionary principle.
Researchers may continue to investigate the role that new technologies in agriculture are likely to
have in rural people’s lives and in the ecosystems they live in. This may be a process of continuous
knowledge co-production through a never-ending process of observation, critical enquiry, reflective
action, and so on. Rural studies scholars might like to consider how it is possible to move towards a
more socially equitable and ecologically sustainable world. If the institutional mechanisms to achieve
such aims are not in place or they are based on the wrong premises, such scholars have a duty to
acknowledge it.

- 177 -
References
Acheson, J.M., 2006. Institutional failure in resource management. Annu.Rev.Anthropol. 35, 117–134.
Adger, Arnell, N., Tompkins, E., 2005. Successful adaptation to climate change across scales. Glob. Environ. Change 15, 77–86.
Adger, W.N., 2006. Vulnerability. Resil. Vulnerability Adapt. Cross-Cut. Theme Int. Hum. Dimens. Programme Glob. Environ. Change Resil. Vulnerability Adapt. Cross-Cut. Theme Int. Hum. Dimens. Programme Glob. Environ. Change 16, 268–281. doi:10.1016/j.gloenvcha.2006.02.006
Adger, W.N., Brown, K., Fairbrass, J., Jordan, A., Paavola, J., Rosendo, S., Seyfang, G., 2003. Governance for sustainability: towards athick’analysis of environmental decisionmaking. Environ. Plan. A 35, 1095–1110.
Agrawal, A., 2001. Common Property Institutions and Sustainable Governance of Resources. World Dev. 29, 1649–1672. doi:10.1016/S0305-750X(01)00063-8
Aguacanal, 2015. Sociedad concesionaria [WWW Document]. Aguacanal. URL http://www.aguacanal.es/index.php/aguacanal/sociedad-concesionaria/
Aguas, J.M.G., 2010. ¡Vivan los comunes!: movimiento comunero y sucesos corralicerios en Navarra (1896-1930). Txalaparta.
Aguilera, E., Lassaletta, L., Sanz-Cobena, A., Garnier, J., Vallejo, A., 2013. The potential of organic fertilizers and water management to reduce N2O emissions in Mediterranean climate cropping systems. A review. Agric. Ecosyst. Environ. 164, 32–52. doi:10.1016/j.agee.2012.09.006
Ahmed, S.A., Diffenbaugh, N.S., Hertel, T.W., 2009. Climate volatility deepens poverty vulnerability in developing countries. Environ. Res. Lett. 4, 34004.
Ahmed, S.A., Hertel, T.W., Martin, W.J., others, 2010. Climate volatility and trade policy in Tanzania, in: 13th Annual Conference on Global Economic Analysis.
Albizua, A., Williams, A., Hedlund, K., Pascual, U., 2015. Crop rotations including ley and manure can promote ecosystem services in conventional farming systems. Appsoils.
Albizua, A., Zografos, C., 2014. A Values-Based Approach to Vulnerability and Adaptation to Climate Change. Applying Q methodology in the Ebro Delta, Spain. Environ. Policy Gov.
Albrecht, G., Sartore, G.-M., Connor, L., Higginbotham, N., Freeman, S., Kelly, B., Stain, H., Tonna, A., Pollard, G., 2007. Solastalgia: The distress caused by environmental change. Australas. Psychiatry 15, S95–S98.
Allison, E.H., Ellis, F., 2001. The livelihoods approach and management of small-scale fisheries. Mar. Policy 25, 377–388.
Anderies, J.M., Janssen, M.A., Ostrom, E., 2004a. A framework to analyze the robustness of social-ecological systems from an institutional perspective. Ecol. Soc. 9, 1–28.
Anderies, J.M., Janssen, M.A., Ostrom, E., 2003. Design principles for robustness of institutions in social-ecological systems. Join. North. Commons Lessons World Lessons World 17–21.
Antwi-Agyei, P., Dougill, A.J., Fraser, E.D., Stringer, L.C., 2013. Characterising the nature of household vulnerability to climate variability: empirical evidence from two regions of Ghana. Environ. Dev. Sustain. 15, 903–926.
Ashley, C., 2000. Applying livelihood approaches to natural resource management initiatives: experiences in Namibia and Kenya. Overseas Development Institute London, UK.
Bacon, A.R., Megan, L.M., Richardson, C.J., Andrews, S.S., West, L., Wills, S., Billings, S., Cambardella, C.A., Cavallaro, N., DeMeester, J.E., others, 2011. Human–soil relations are changing rapidly: proposals from SSSA’s cross-divisional soil change working group. Soil Sci. Soc. Am. J. 75, 2079–2084.

- 178 -
Baldock, D., Dwyer, J., Petersen, J.-E., Sumpsi-Vinas, J., Varela-Ortega, C., Einschütz, S., 2000. The environmental impacts of irrigation in the European Union.
Barbour, R.S., 2005. Making sense of focus groups. Med. Educ. 39, 742–750. Barnett, A.J., Eakin, H.C., 2015. “We and us, not I and me”: Justice, social capital, and household
vulnerability in a Nova Scotia fishery. Appl. Geogr. 59, 107–116. doi:10.1016/j.apgeog.2014.11.005
Barnett, J., Adger, W.N., 2007. Climate change, human security and violent conflict. Polit. Geogr. 26, 639–655.
Barnett, J., O’Neill, S., 2010. Maladaptation. Glob. Environ. Change 20, 211–213. Barrett, C.B., Reardon, T., Webb, P., 2001. Nonfarm income diversification and household livelihood
strategies in rural Africa: concepts, dynamics, and policy implications. Food Policy 26, 315–331. doi:10.1016/S0306-9192(01)00014-8
Barrios, E., 2007. Soil biota, ecosystem services and land productivity. Ecol. Econ. 64, 269–285. Barros, C.B., V.., Mach, K.J., Mastrandrea, M.D., van Aalst, M., Adger, W.N., Arent, D.J., Barnett, J.,
Betts, R., Bilir, T.E., Birkmann, J., Carmin, J., 2014. Technical summary. In: Climate Change 2014: Impacts, Adaptation, and Vulnerability., Part A: Global and Sectoral Aspects. Contribution of Working Group II to the Fifth Assessment Report of the Intergovernmental Panel on Climate Change.
Beaumont, M.J., 1997. El embalse de Itoiz, la razón o el poder: Ma José Beaumont...[et al.]. Bakeaz. Bebbington, A., 1999. Capitals and capabilities: a framework for analyzing peasant viability, rural
livelihoods and poverty. World Dev. 27, 2021–2044. Becker, G.S., 1962. Investment in human capital: A theoretical analysis. J. Polit. Econ. 9–49. Belin, D.L., Kittredge, D.B., Stevens, T.H., Dennis, D.C., Schweik, C.M., Morzuch, B.J., 2005. Assessing
private forest owner attitudes toward ecosystem-based management. J. For. 103, 28–35. Bennett, E.M., Peterson, G.D., Gordon, L.J., 2009. Understanding relationships among multiple
ecosystem services. Ecol. Lett. 12, 1394–1404. Berbel, J., Mateos, L., 2014. Does investment in irrigation technology necessarily generate rebound
effects? A simulation analysis based on an agro-economic model. Agric. Syst. 128, 25–34. doi:10.1016/j.agsy.2014.04.002
Berbés-Blázquez, M., González, J.A., Pascual, U., 2016. Towards an ecosystem services approach that addresses social power relations. Curr. Opin. Environ. Sustain., Sustainability science 19, 134–143. doi:10.1016/j.cosust.2016.02.003
Birkmann, J., Wisner, B., 2006. Measuring the unmeasurable: the challenge of vulnerability. UNU-EHS.
Blaikie, P.M., 1985. The political economy of soil erosion in developing countries. Longman London; New York.
Boletín ofician de Navarra, 2015. Orden Foral 187/2015, de 15 de mayo, del Consejero de Desarrollo Rural, Medio Ambiente y Administración Local, que Modifica la Orden Foral 186/2011, de 11 de mayo, por la que se regula la financiación de las inversiones de distribución interior, mediante redes a presión, en los terrenos comunales o asimilados, en las zonas de actuación en infraestructuras agrícolas con transformación o modernización de regadío.
Brinquis, R., Arrojo, P., Bielsa, J., Jimenez, A., 2012. Itoiz 2012. Un análisis económico. Brondízio, E.S., Gatzweiler, F.W., Zografos, C., Kumar, M., Jianchu, X., McNeely, J., Kadekodi, G.K.,
Martinez-Alier, J., 2010. Socio-cultural context of ecosystem and biodiversity valuation. Brown, D.R., Stephens, E.C., Ouma, J.O., Murithi, F.M., Barrett, C.B., others, 2006. Livelihood
strategies in the rural Kenyan highlands. Cornell University. Brown, K., Corbera, E., 2003. Exploring equity and sustainable development in the new carbon
economy. Clim. Policy 3, S41–S56. Bruce, S., Yearley, S., 2006. The Sage dictionary of sociology. Sage. Bruckner, T., Chum, H., Jäger-Waldau, A., Killingtveit, A., Gutierrez-Negrin, L., Nyboer, W., Musial,
W., Verbruggen, A., Wiser, R., 2011. IPCC Special Report on Renewable Energy Sources and

- 179 -
Climate Change Mitigation. Annex III: Cost Table, in: IPCC Special Report on Renewable Energy Sources and Climate Change Mitigation. Cambridge University Press, Cambridge, United Kingdom and New York, NY, USA.
Bryan, B.A., Grandgirard, A., Ward, J.R., 2010. Quantifying and exploring strategic regional priorities for managing natural capital and ecosystem services given multiple stakeholder perspectives. Ecosystems 13, 539–555.
Calvet-Mir, L., Gómez-Baggethun, E., Reyes-García, V., 2012. Beyond food production: Ecosystem services provided by home gardens. A case study in Vall Fosca, Catalan Pyrenees, Northeastern Spain. Ecol. Econ.
Campos, M., Warren, R., Birkmann, J., Luber, G., O’Neill, B., Takahashi, K., 2014. Emergent Risks and Key Vulnerabilities, in: Climate Change 2014: Impacts, Adaptation, and Vulnerability. Part A: Global and Sectoral Aspects. Contribution of Working Group II to the Fifth Assessment Report of the Intergovernmental Panel on Climate Change. Cambridge University Press, Cambridge United Kingdom and New York, NY, USA, pp. 1039–1099.
Carney, D., 1999. Approaches to sustainable livelihoods for the rural poor. Overseas Development Institute ODI Poverty Briefing, Brighton, UK.
Carpenter, S.R., Mooney, H.A., Agard, J., Capistrano, D., DeFries, R.S., Díaz, S., Dietz, T., Duraiappah, A.K., Oteng-Yeboah, A., Pereira, H.M., 2009. Science for managing ecosystem services: Beyond the Millennium Ecosystem Assessment. Proc. Natl. Acad. Sci. 106, 1305.
Carricondo, A., Peiteado, C., 2010. Por una PAC de contenido ambiental: más subvenciones agrarias, menos naturaleza. Quercus 60–61.
Castillo, A., Magaña, A., Pujadas, A., Martínez, L., Godínez, C., 2005. Understanding the interaction of rural people with ecosystems: a case study in a tropical dry forest of Mexico. Ecosystems 8, 630–643.
Chambers, R., 1983. Rural Development. Putting the Last First. Longman Group Limited, New York, USA.
Chambers, R., Conway, G., 1992. Sustainable rural livelihoods: practical concepts for the 21st century. Institute of Development Studies (UK).
Chan, K., Satterfield, T., Goldstein, J., 2012. Rethinking ecosystem services to better address and navigate cultural values. Ecol. Econ. 74, 8–18.
Chan, K.M.A., Balvanera, P., Benessaiah, K., Chapman, M., Díaz, S., Gómez-Baggethun, E., Gould, R., Hannahs, N., Jax, K., Klain, S., Luck, G.W., Martín-López, B., Muraca, B., Norton, B., Ott, K., Pascual, U., Satterfield, T., Tadaki, M., Taggart, J., Turner, N., 2016. Opinion: Why protect nature? Rethinking values and the environment. Proc. Natl. Acad. Sci. 113, 1462–1465. doi:10.1073/pnas.1525002113
Chan, K.M., Guerry, A.D., Balvanera, P., Klain, S., Satterfield, T., Basurto, X., Bostrom, A., Chuenpagdee, R., Gould, R., Halpern, B.S., 2012. Where are cultural and social in ecosystem services? A framework for constructive engagement. BioScience 62, 744–756.
Chiesura, A., De Groot, R., 2003. Critical natural capital: a socio-cultural perspective. Ecol. Econ. 44, 219–231.
Clay, D., Reardon, T., Kangasniemi, J., 1998. Sustainable intensification in the highland tropics: Rwandan farmers’ investments in land conservation and soil fertility. Econ. Dev. Cult. Change 46, 351–377.
Colfer, C.J.P., 2005. The Equitable Forest: Diversity, Community and Resource Management. Resources for the Future. Cent. Int. For. Res. Wash. DC.
Collins English Dictionary, 2015. Definition of “wellbeing” [WWW Document]. URL http://www.collinsdictionary.com/dictionary/english/wellbeing (accessed 7.23.15).
Confederación Hidrográfica del Ebro, 2015. Embalses en explotación [WWW Document]. Portal CHEbro. URL http://www.chebro.es/contenido.visualizar.do?idContenido=4217&idMenu=2266
- 180 -
Corbera, E., 2015. Valuing nature, paying for ecosystem services and realizing social justice: A response to Matulis (2014). Ecol. Econ. 110, 154–157. doi:10.1016/j.ecolecon.2014.12.017
Corbera, E., Brown, K., Adger, W.N., 2007a. The equity and legitimacy of markets for ecosystem services. Dev. Change 38, 587–613.
Corbera, E., Kosoy, N., Martínez Tuna, M., 2007b. Equity implications of marketing ecosystem services in protected areas and rural communities: case studies from Meso-America. Glob. Environ. Change 17, 365–380.
Costanza, R., d’Arge, R., De Groot, R., Farber, S., Grasso, M., Hannon, B., Limburg, K., Naeem, S., O’Neill, R.V., Paruelo, J., 1997. The value of the world’s ecosystem services and natural capital. Nature 387, 253–260.
Costanza, R., Fisher, B., Ali, S., Beer, C., Bond, L., Boumans, R., Danigelis, N.L., Dickinson, J., Elliott, C., Farley, J., others, 2007. Quality of life: An approach integrating opportunities, human needs, and subjective well-being. Ecol. Econ. 61, 267–276.
Cutter, S.L., 2016. Resilience to What? Resilience for Whom? Geogr. J. doi:10.1111/geoj.12174 Daily, G.C., 1997. Nature’s services: societal dependence on natural ecosystems. Island Pr. Dakos, V., Quinlan, A., Baggio, J.A., Bennett, E., Bodin, Ö., BurnSilver, S., 2015. Principle 2–Manage
connectivity, in: Principles for Building Resilience: Sustaining Ecosystem Services in Social-Ecological Systems. p. 80.
Daniel, T.C., Muhar, A., Arnberger, A., Aznar, O., Boyd, J.W., Chan, K.M., Costanza, R., Elmqvist, T., Flint, C.G., Gobster, P.H., 2012a. Contributions of cultural services to the ecosystem services agenda. Proc. Natl. Acad. Sci. 109, 8812–8819.
Daniel, T.C., Muhar, A., Arnberger, A., Aznar, O., Boyd, J.W., Chan, K.M., Costanza, R., Elmqvist, T., Flint, C.G., Gobster, P.H., others, 2012b. Contributions of cultural services to the ecosystem services agenda. Proc. Natl. Acad. Sci. 109, 8812–8819.
Daw, T., Brown, K., Rosendo, S., Pomeroy, R., 2011. Applying the ecosystem services concept to poverty alleviation: the need to disaggregate human well-being. Environ. Conserv. 38, 370–379. doi:10.1017/S0376892911000506
De Groot, R.S., Fisher, B., Christie, M., Aronson, J., Braat, L., Haines-Young, R., Gowdy, J., Maltby, E., Neuville, A., Polasky, S., others, 2010. Integrating the ecological and economic dimensions in biodiversity and ecosystem service valuation, in: The Economics of Ecosystems and Biodiversity (TEEB): Ecological and Economic Foundations. Earthscan.
De Groot, R.S., Wilson, M.A., Boumans, R.M., 2002a. A typology for the classification, description and valuation of ecosystem functions, goods and services. Ecol. Econ. 41, 393–408.
De Groot, R.S., Wilson, M.A., Boumans, R.M., 2002b. A typology for the classification, description and valuation of ecosystem functions, goods and services. Ecol. Econ. 41, 393–408.
De Haan, L., Zoomers, A., 2005. Exploring the frontier of livelihoods research. Dev. Change 36, 27–47.
De Vries, A, and Garcia M., 2012. OTN Observaciones Teritoriales de Navarra. Gobierno de Navarra. Agricultura, Pamplona.
Definition of “commodity” | Collins English Dictionary [WWW Document], n.d. URL http://www.collinsdictionary.com/dictionary/english/commodity?showCookiePolicy=true (accessed 8.5.15).
DEFRA, 2011. An introductory guide to valuing ecosystem services (No. PB12852). DEFRA, London. Deressa, T.T., Hassan, R.M., Ringler, C., Alemu, T., Yesuf, M., 2009. Determinants of farmers’ choice
of adaptation methods to climate change in the Nile Basin of Ethiopia. Tradit. Peoples Clim. Change 19, 248–255. doi:10.1016/j.gloenvcha.2009.01.002
Diario de Noticias de Navarra, 2016. CANASA decidirá el próximo 23 de febrero las tarifas que se aplicarán a los usuarios del Canal de Navarra. Diario de Noticias de Navarra [WWW Document]. URL http://www.noticiasdenavarra.com/2016/02/18/economia/canasa-decidira-el-proximo-23-de-febrero-las-tarifas-que-se-aplicaran-a-los-usuarios-del-canal-de-navarra (accessed 2.19.16).

- 181 -
Díaz, F.J., 2004. Audiencia Nacional (Spain), in: La Transición a La Democracia En España, Actas de Las VI Jornadas de Castilla-La Mancha Sobre Investigación En Archivos. pp. 5–6.
Díaz, S., Demissew, S., Carabias, J., Joly, C., Lonsdale, M., Ash, N., Larigauderie, A., Adhikari, J.R., Arico, S., Báldi, A., Bartuska, A., Baste, I.A., Bilgin, A., Brondizio, E., Chan, K.M., Figueroa, V.E., Duraiappah, A., Fischer, M., Hill, R., Koetz, T., Leadley, P., Lyver, P., Mace, G.M., Martin-Lopez, B., Okumura, M., Pacheco, D., Pascual, U., Pérez, E.S., Reyers, B., Roth, E., Saito, O., Scholes, R.J., Sharma, N., Tallis, H., Thaman, R., Watson, R., Yahara, T., Hamid, Z.A., Akosim, C., Al-Hafedh, Y., Allahverdiyev, R., Amankwah, E., Asah, S.T., Asfaw, Z., Bartus, G., Brooks, A.L., Caillaux, J., Dalle, G., Darnaedi, D., Driver, A., Erpul, G., Escobar-Eyzaguirre, P., Failler, P., Fouda, A.M.M., Fu, B., Gundimeda, H., Hashimoto, S., Homer, F., Lavorel, S., Lichtenstein, G., Mala, W.A., Mandivenyi, W., Matczak, P., Mbizvo, C., Mehrdadi, M., Metzger, J.P., Mikissa, J.B., Moller, H., Mooney, H.A., Mumby, P., Nagendra, H., Nesshover, C., Oteng-Yeboah, A.A., Pataki, G., Roué, M., Rubis, J., Schultz, M., Smith, P., Sumaila, R., Takeuchi, K., Thomas, S., Verma, M., Yeo-Chang, Y., Zlatanova, D., 2015a. The IPBES Conceptual Framework — connecting nature and people. Curr. Opin. Environ. Sustain., Open Issue 14, 1–16. doi:10.1016/j.cosust.2014.11.002
Diaz, S., Demissew, S., Joly, C., Lonsdale, W.M., Larigauderie, A., Baptiste, B.L.G., Roué, M., Pascual, U., 2015. Biodiversity beyond babel. Reply to Soberón, J. and A.T Peterson: Biodiversity Governance: A Tower of Babel of Scales and Cultures. 13, e1002108. doi:10.1371/journal.pbio.1002108
Dominati, E., Patterson, M., Mackay, A., 2010. A framework for classifying and quantifying the natural capital and ecosystem services of soils. Ecol. Econ. 69, 1858–1868. doi:10.1016/j.ecolecon.2010.05.002
Duraiappah, A.K., Asah, S.T., Brondizio, E.S., Kosoy, N., O’Farrell, P.J., Prieur-Richard, A.-H., Subramanian, S.M., Takeuchi, K., 2014. Managing the mismatches to provide ecosystem services for human well-being: a conceptual framework for understanding the New Commons. Curr. Opin. Environ. Sustain. 7, 94–100.
Dwiartama, A., Rosin, C., 2014. Exploring agency beyond humans: the compatibility of Actor-Network Theory (ANT) and resilience thinking. Ecol. Soc. 19, 28.
Eakin, H., 2005. Institutional change, climate risk, and rural vulnerability: Cases from Central Mexico. World Dev. 33, 1923–1938. doi:10.1016/j.worlddev.2005.06.005
Eakin, H., Bojórquez-Tapia, L.A., 2008. Insights into the composition of household vulnerability from multicriteria decision analysis. Glob. Environ. Change 18, 112–127. doi:10.1016/j.gloenvcha.2007.09.001
Eakin, H., Luers, A.L., 2006. Assessing the vulnerability of social-environmental systems. Annu. Rev. Environ. Resour. 31, 365.
Eakin, H., Winkels, A., Sendzimir, J., 2009. Nested vulnerability: exploring cross-scale linkages and vulnerability teleconnections in Mexican and Vietnamese coffee systems. Environ. Sci. Policy 12, 398–412.
Edwards, F., Dixon, J., Friel, S., Hall, G., 2010. Food Systems, Climate Change Adaptation and Human Health in Australia. State Sci. Policy Discuss. Pap. Ser. Natl. Cent. Epidemiol. Popul. Health Aust. Natl. Univ. Canberra1324.
EEA, 2013. The Common International Classification of Ecosystem Services (CICES). FAO, 2015a. Trade [WWW Document]. FAOSTAT. URL http://faostat3.fao.org/home/E FAO, 2015b. Statistical Pocketbook 2015. Farber, S.C., Costanza, R., Wilson, M.A., 2002. Economic and ecological concepts for valuing
ecosystem services. Ecol. Econ. 41, 375–392. Farhad, S., Gual, M.A., Ruiz-Ballesteros, E., 2015. Linking governance and ecosystem services: The
case of Isla Mayor (Andalusia, Spain). Land Use Policy 46, 91–102. Felipe-Lucia, M.R., Comín, F.A., 2015. Ecosystem services–biodiversity relationships depend on land
use type in floodplain agroecosystems. Land Use Policy 46, 201–210.

- 182 -
Field, C.B., Barros, V.R., Mach, K., Mastrandrea, M., 2014. Climate change 2014: impacts, adaptation, and vulnerability. Contrib. Work. Group II Fifth Assess. Rep. Intergov. Panel Clim. Change.
Fisher, B., Kerry Turner, R., Morling, P., 2008. Ecosystem services: Classification for valuation. Biol. Conserv. 141, 1167–1169. doi:10.1016/j.biocon.2008.02.019
Fisher, B., Turner, R.K., Morling, P., 2009. Defining and classifying ecosystem services for decision making. Ecol. Econ. 68, 643–653.
Forbes, B.C., 2008. Equity, vulnerability and resilience in social-ecological systems: a contemporary example from the Russian Arctic. Res. Soc. Probl. Public Policy 15, 203–236.
Fu, B.-J., Su, C.-H., Wei, Y.-P., Willett, I.R., Lü, Y.-H., Liu, G.-H., 2010. Double counting in ecosystem services valuation: causes and countermeasures. Ecol. Res. 26, 1–14. doi:10.1007/s11284-010-0766-3
Gallejones, P., Castellon, A., Del Prado, A., Unamunzaga, O., Aizpurua, A., 2012. Nitrogen and sulphur fertilization effect on leaching losses, nutrient balance and plant quality in a wheat–rapeseed rotation under a humid Mediterranean climate. Nutr. Cycl. Agroecosystems 93, 337–355.
German, L., Schoneveld, G.C., Gumbo, D., 2011. The Local Social and Environmental Impacts of Smallholder-Based Biofuel Investments in Zambia. Ecol. Soc. 16. doi:10.5751/es-04280-160412
Gibson, C.C., McKean, M.A., Ostrom, E., 2000. People and forests: Communities, institutions, and governance. MIT Press.
Gobierno de Navarra, 2016. Estadísticas agrícolas. Producción agrícola - navarra.es [WWW Document]. URL http://www.navarra.es/home_es/Temas/Ambito+rural/Vida+rural/Observatorio+agrario/Agricola/Informacion+estadistica/produccion+agricola.htm (accessed 7.4.16).
Gobierno de Navarra, 2015a. Espárrago blanco Turismo Navarra [WWW Document]. URL http://www.turismo.navarra.es/esp/organice-viaje/recurso.aspx?o=3327 (accessed 10.29.15).
Gobierno de Navarra, 2015b. Fichas climáticas de estaciones manuales [WWW Document]. navarra.es. URL http://meteo.navarra.es/climatologia/fichasclimaticas.cfm
Gómez-Baggethun, E., de Groot, R., 2010. Natural capital and ecosystem services: the ecological foundation of human society. Ecosyst. Serv. Issues Environ. Sci. Technol. 30, 118–145.
Gómez-Baggethun, E., Kelemen, E., 2008. Linking Institutional Change and the Flows of Ecosystem Services: Case Studies from Spain and Hungary. Proc. 2nd THEMES Summer Sch. 118–145.
Gómez-Baggethun, E., Reyes-García, V., Olsson, P., Montes, C., 2012. Traditional ecological knowledge and community resilience to environmental extremes: A case study in Doñana, SW Spain. Glob. Environ. Change. doi:10.1016/j.gloenvcha.2012.02.005
Gorman, M., Mannion, J., Kinsella, J., Bogue, P., 2001. Connecting environmental management and farm household livelihoods: The Rural Environment Protection Scheme in Ireland. J. Environ. Policy Plan. 3, 137–147.
Hahn, M.B., Riederer, A.M., Foster, S.O., 2009. The Livelihood Vulnerability Index: A pragmatic approach to assessing risks from climate variability and change—A case study in Mozambique. Glob. Environ. Change 19, 74–88.
Haile, M.G., Kalkuhl, M., von Braun, J., others, 2013. Agricultural supply response to international food prices and price volatility: a crosscountry panel analysis, in: 2013 Annual Meeting, August. pp. 4–6.
Hall, P.A., Taylor, R.C., 1996. Political science and the three new institutionalisms*. Polit. Stud. 44, 936–957.
Hartel, T., Fischer, J., Câmpeanu, C., Milcu, A.I., Hanspach, J., Fazey, I., 2014. The importance of ecosystem services for rural inhabitants in a changing cultural landscape in Romania. Ecol. Soc. 19, 42.
Hausman, D.M., 1994. The philosophy of economics: an anthology. Cambridge University Press.

- 183 -
Hein, L., Van Koppen, K., De Groot, R.S., Van Ierland, E.C., 2006. Spatial scales, stakeholders and the valuation of ecosystem services. Ecol. Econ. 57, 209–228.
Henle, K., Alard, D., Clitherow, J., Cobb, P., Firbank, L., Kull, T., McCracken, D., Moritz, R.F., Niemelä, J., Rebane, M., 2008. Identifying and managing the conflicts between agriculture and biodiversity conservation in Europe–A review. Agric. Ecosyst. Environ. 124, 60–71.
Hinkel, J., 2011. “Indicators of vulnerability and adaptive capacity”: Towards a clarification of the science–policy interface. Glob. Environ. Change 21, 198–208.
Howe, C., Suich, H., Vira, B., Mace, G.M., 2014. Creating win-wins from trade-offs? Ecosystem services for human well-being: A meta-analysis of ecosystem service trade-offs and synergies in the real world. Glob. Environ. Change 28, 263–275.
Ifejika Speranza, C., Wiesmann, U., Rist, S., 2014. An indicator framework for assessing livelihood resilience in the context of social–ecological dynamics. Glob. Environ. Change 28, 109–119. doi:10.1016/j.gloenvcha.2014.06.005
Iniesta-Arandia, I., García-Llorente, M., Aguilera, P.A., Montes, C., Martín-López, B., 2014. Socio-cultural valuation of ecosystem services: uncovering the links between values, drivers of change, and human well-being. Ecol. Econ. 108, 36–48.
Instituto Nacional de Estadística, 2015. Precios e Índices Medios Nacionales Mensuales y Anuales Percibidos por los Agricultores [WWW Document]. URL http://www.ine.es/dyngs/IOE/es/fichaHistorica.htm?cid=1259930768969
INTIA, 2016. PREGUNTAS CLAVE SOBRE EL EMBALSE DE ITOIZ Y EL CANAL DE NAVARRA [WWW Document]. URL http://www.intiasa.es/es/comunidad-de-regantes/areas-de-interes/itoiz-canal-de-navarra.html
IPCC, 2007a. IPCC, 2007: summary for policymakers. Clim. Change 93–129. IPCC, 2007b. Climate Change 2007: Impacts, Adaptation and Vulnerability. Contribution of Working
Group II to the Fourth Assessment Report of the Intergovernmental Panel on Climate Change. Cambridge University Press, Cambridge, UK.
IPCC, 2001. Climate change 2001: impacts, adaptation, and vulnerability: contribution of Working Group II to the third assessment report of the Intergovernmental Panel on Climate Change. Cambridge University Press.
Isakson, S.R., 2014. Food and finance: the financial transformation of agro-food supply chains. J. Peasant Stud. 1–27.
Ishihara, H., Pascual, U., 2009. Social capital in community level environmental governance: A critique. Ecol. Econ. 68, 1549–1562. doi:10.1016/j.ecolecon.2008.11.003
Janssen, M.A., Ostrom, E., 2006. Empirically based, agent-based models. Ecol. Soc. 11, 37. Kaye-Zwiebel, E., King, E., 2014. Kenyan pastoralist societies in transition: varying perceptions of the
value of ecosystem services. Ecol. Soc. 19, 17. Kitayama, S., Markus, H.R., 2000. The pursuit of happiness and the realization of sympathy: Cultural
patterns of self, social relations, and well-being. Cult. Subj. Well-Being 113–161. Klain, S.C., Satterfield, T.A., Chan, K.M., 2014. What matters and why? Ecosystem services and their
bundled qualities. Ecol. Econ. 107, 310–320. Klapwijk, C., van Wijk, M., Rosenstock, T., van Asten, P., Thornton, P., Giller, K., 2014. Analysis of
trade-offs in agricultural systems: current status and way forward. Curr. Opin. Environ. Sustain., Sustainability challenges 6, 110–115. doi:10.1016/j.cosust.2013.11.012
Klein, A.-M., Vaissiere, B.E., Cane, J.H., Steffan-Dewenter, I., Cunningham, S.A., Kremen, C., Tscharntke, T., 2007. Importance of pollinators in changing landscapes for world crops. Proc. R. Soc. Lond. B Biol. Sci. 274, 303–313.
Kloos, J., Gebert, N., Rosenfeld, T., Renaud, F., 2013. Climate change, water conflicts and human security: regional assessment and policy guidelines for the Mediterranean, Middle East and Sahel.
Koczberski, G., Curry, G.N., 2005. Making a living: Land pressures and changing livelihood strategies among oil palm settlers in Papua New Guinea. Agric. Syst. 85, 324–339.
- 184 -
Kremen, C., 2005. Managing ecosystem services: what do we need to know about their ecology? Ecol. Lett. 8, 468–479.
Kremen, C., Williams, N.M., Thorp, R.W., 2002. Crop pollination from native bees at risk from agricultural intensification. Proc. Natl. Acad. Sci. 99, 16812–16816.
Kroeger, T., Casey, F., 2007. An assessment of market-based approaches to providing ecosystem services on agricultural lands. Spec. Sect. - Ecosyst. Serv. Agric. Ecosyst. Serv. Agric. 64, 321–332. doi:10.1016/j.ecolecon.2007.07.021
Kull, C.A., de Sartre, X.A., Castro-Larrañaga, M., 2015. The political ecology of ecosystem services. Geoforum 61, 122–134.
Langemeyer, J., Baró, F., Roebeling, P., Gómez-Baggethun, E., 2015. Contrasting values of cultural ecosystem services in urban areas: The case of park Montjuïc in Barcelona. Ecosyst. Serv. 12, 178–186. doi:10.1016/j.ecoser.2014.11.016
Lavelle, P., Decaëns, T., Aubert, M., Barot, S., Blouin, M., Bureau, F., Margerie, P., Mora, P., Rossi, J.-P., 2006. Soil invertebrates and ecosystem services. Eur. J. Soil Biol. 42, S3–S15.
Lele, S., Springate-Baginski, O., Lakerveld, R., Deb, D., Dash, P., others, 2013. Ecosystem services: origins, contributions, pitfalls, and alternatives. Conserv. Soc. 11, 343.
Lin, K.-H.E., Polsky, C., 2015. Indexing livelihood vulnerability to the effects of typhoons in indigenous communities in Taiwan. Geogr. J.
Luers, A.L., David Lobell, Sklard, C.Lee Addamsa, Pamela A Matsona, 2003a. A method for quantifying vulnerability, applied to the agricultural system of the Yaqui Valley, Mexico. Global Environmental Change 13, 255–267. doi:10.1016/S0959-3780(03)00054-2
MAGRAMA, 2014. Encuesta sobre Superficies y Rendimientos Cultivos (ESYRCE). Encuesta de Marco de Áreas de España. - ESYRCE (Encuesta de superficies y rendimientos de cultivos) - Agricultura - Estadísticas agrarias - Estadísticas - [WWW Document]. URL http://www.magrama.gob.es/es/estadistica/temas/estadisticas-agrarias/agricultura/esyrce/ (accessed 8.14.15).
MAGRAMA, 2013. Plan Estratégico Nacional - 2013 - Periodo de programación 2007 - Programas de Desarrollo Rural Cofinanciados por la UE - Desarrollo Rural - magrama.es (Informe de seguimiento estratégico 2014).
Marsden, T., Banks, J., Bristow, G., 2002. The social management of rural nature: understanding agrarian-based rural development. Environ. Plan. A 34, 809–826.
Martin, A., Coolsaet, B., Corbera, E., Dawson, N.M., Fraser, J.A., Lehman, I., Rodriguez, I., 2016. Justice and conservation: The need to incorporate recognition. Biological Conservation 197, 254–261. doi:10.1016/j.biocon.2016.03.021
Martín-López, B., Gómez-Baggethun, E., García-Llorente, M., Montes, C., 2014. Trade-offs across value-domains in ecosystem services assessment. Ecol. Indic. 37, 220–228.
Martín-López, B., Iniesta-Arandia, I., García-Llorente, M., Palomo, I., Casado-Arzuaga, I., Amo, D.G.D., Gómez-Baggethun, E., Oteros-Rozas, E., Palacios-Agundez, I., Willaarts, B., González, J.A., Santos-Martín, F., Onaindia, M., López-Santiago, C., Montes, C., 2012. Uncovering Ecosystem Service Bundles through Social Preferences. PLoS ONE 7, e38970. doi:10.1371/journal.pone.0038970
Martin-Lopez, B., Montes, C., Benayas, J., 2007. Influence of user characteristics on valuation of ecosystem services in Doñana Natural Protected Area (south-west Spain). Environ. Conserv. 34, 215–224.
Maru, Y.T., Stafford Smith, M., Sparrow, A., Pinho, P.F., Dube, O.P., 2014. A linked vulnerability and resilience framework for adaptation pathways in remote disadvantaged communities. Glob. Environ. Change.
Masanjala, W., 2007. The poverty-HIV/AIDS nexus in Africa: a livelihood approach. Soc. Sci. Med. 64, 1032–1041.
Matson, P.A., Parton, W.J., Power, A.G., Swift, M.J., 1997. Agricultural intensification and ecosystem properties. Science 277, 504–509.
- 185 -
McDermott, M., Mahanty, S., Schreckenberg, K., 2013. Examining equity: a multidimensional framework for assessing equity in payments for ecosystem services. Environ. Sci. Policy 33, 416–427.
McIntyre, B.D., Herren, H.R., Wakhungu, J., Watson, R.T., 2008. International Assessment of Agricultural Knowledge, Science and Technology for Development (IAASTD) - Synthesis Report -. Washington.
McKean, M.A., 2000. Common property: What is it, what is it good for, and what makes it work. People For. Communities Inst. Gov. 27–55.
McLaughlin, P., Dietz, T., 2008. Structure, agency and environment: Toward an integrated perspective on vulnerability. Glob. Environ. Change 18, 99–111.
McMichael, A., Scholes, R., Hefny, M., Pereira, E., Palm, C., Foale, S., 2005. Linking ecosystem services and human well-being. Ecosyst Hum Well-Being 5, 43–60.
MEA, 2005a. Ecosystems and Human Well-being: Synthesis. Island Press, Washington, DC. Accessed online at www. millenniumassessment. org.
MEA, 2005b. Ecosystems and human well-being. Island Press Washington, DC. MEA, 2005c. Ecosystems and Human Well-Being: Biodiversity Synthesis. World Resources Institute,
Washington D.C., USA. Mendelsohn, R.O., Seo, S.N., 2007. Changing farm types and irrigation as an adaptation to climate
change in Latin American agriculture. World Bank Policy Res. Work. Pap. Mendez, P., 2001. ALTERACIONES DE LA INTEGRIDAD DE LOS SISTEMAS ACUÁTICOS: LAS PRESAS. MINECO, 2010. Condiciones especiales del seguro integral y del seguro complementario de cereales
de invierno en secano [WWW Document]. URL http://www.dgsfp.mineco.es/SeguroAgrario/Documentos/CerealesInvierno/Int.%20Cereales%202010/Int.%20Cereales%20Invierno%202010.pdf (accessed 8.20.15).
Ministerio de Agricultura, Alimentación y Medio Ambiente, 2015. Inventario de Presas y Embalses [WWW Document]. Minist. Agric. Aliment. Medio Ambiente. URL http://origin.magrama.gob.es/es/agua/temas/seguridad-de-presas-y-embalses/inventario-presas-y-embalses/
Mulder, C., Bennett, E.M., Bohan, D.A., Bonkowski, M., Carpenter, S.R., Chalmers, R., Cramer, W., Durance, I., Eisenhauer, N., Fontaine, C., others, 2015. 10 Years Later: Revisiting Priorities for Science and Society a Decade After the Millennium Ecosystem Assessment. Adv. Ecol. Res.
Nenadic, O., Greenacre, M., 2007. Correspondence analysis in R, with two-and three-dimensional graphics: The ca package.
Newing, H., Eagle, C.M., Puri, R.K., Watson, C.W., 2011. Conducting research in conservation: social science methods and practice. Routledge.
Norgaard, R.B., 2010. Ecosystem services: From eye-opening metaphor to complexity blinder. Spec. Sect. - Paym. Environ. Serv. Reconciling Theory Pract. 69, 1219–1227. doi:10.1016/j.ecolecon.2009.11.009
Notenbaert, A., Karanja, S.N., Herrero, M., Felisberto, M., Moyo, S., 2013. Derivation of a household-level vulnerability index for empirically testing measures of adaptive capacity and vulnerability. Reg. Environ. Change 13, 459–470.
O’Brien, K., Leichenko, R., Kelkar, U., Venema, H., Aandahl, G., Tompkins, H., Javed, A., Bhadwal, S., Barg, S., Nygaard, L., West, J., 2004. Mapping vulnerability to multiple stressors: climate change and globalization in India. Glob. Environ. Change 14, 303–313. doi:10.1016/j.gloenvcha.2004.01.001
O’Brien, K.L., Leichenko, R.M., 2000. Double exposure: assessing the impacts of climate change within the context of economic globalization. Glob. Environ. Change 10, 221–232.
Ogunseitan, O.A., 2004. Topophilia and the Quality of Life. Environ. Health Perspect. 113, 143–148. doi:10.1289/ehp.7467

- 186 -
Orenstein, D.E., Groner, E., 2014. In the eye of the stakeholder: Changes in perceptions of ecosystem services across an international border. Ecosyst. Serv. 8, 185–196. doi:10.1016/j.ecoser.2014.04.004
Ostrom, E., 2009a. A General Framework for Analyzing Sustainability of Social-Ecological Systems. Science 325, 419–422. doi:10.1126/science.1172133
Ostrom, E., 2009b. Understanding Institutional Diversity. Princeton University Press. Oteros-Rozas, E., Ontillera-Sánchez, R., Sanosa, P., Gómez-Baggethun, E., Reyes-García, V., González,
J.A., 2013. Traditional ecological knowledge among transhumant pastoralists in Mediterranean Spain. Ecol. Soc. 18, 33.
Paavola, J., 2007. Institutions and environmental governance: A reconceptualization. Ecol. Econ. 63, 93–103.
Palomo, I., Felipe-Lucia, M.R., Bennett, E.M., Martín-López, B., Pascual, U., 2016. Disentangling the Pathways and Effects of Ecosystem Service Co-Production, in: Advances in Ecological Research. Elsevier, pp. 245–283.
Palomo, I., Martín-López, B., Potschin, M., Haines-Young, R., Montes, C., 2013. National Parks, buffer zones and surrounding lands: mapping ecosystem service flows. Ecosyst. Serv. 4, 104–116.
Palomo, I., Martín-López, B., Zorrilla-Miras, P., Del Amo, D.G., Montes, C., 2014. Deliberative mapping of ecosystem services within and around Doñana National Park (SW Spain) in relation to land use change. Reg. Environ. Change 14, 237–251.
Paris, R., 2001. Human Security: Paradigm Shift or Hot Air? Int. Secur. 26, 87–102. doi:10.1162/016228801753191141
Parlamento de Navarra/Nafarroako Parlamentua - Iniciativas, Tramitación, 2014. Moción por la que se insta al Gobierno de Navarra a realizar los estudios pertinentes a fin de plantear y ejecutar una alternativa a la Mina de Miranda de Arga que garantice el mantenimiento y mejora del regadío tradicional y a realizar las actuaciones que sean necesarias para preservar la Mina [WWW Document]. URL http://www.parlamentodenavarra.es/135/section.aspx?id=22938 (accessed 2.24.16).
Parlamento de Navarra/Nafarroako Parlamentua - Iniciativas, Tramitación, 2013. Sesión de Trabajo para que representantes del Ayuntamiento de Miranda de Arga expliquen la situación del regadío en el municipio [WWW Document]. URL http://www.parlamentodenavarra.es/135/section.aspx?id=22397 (accessed 2.24.16).
Parlamento de Navarra/Nafarroako Parlamentua - Noticias Presidencia, 2015. Inicio de la ampliación de la zona regable de la primera fase del Canal de Navarra [WWW Document]. URL http://www.parlamentodenavarra.es/501/section.aspx?idnoticia=6337 (accessed 2.23.16).
Pascual, M., Borja, A., Galparsoro, I., Ruiz, J., Mugerza, E., Quincoces, I., Murillas, A., Arregi, L., 2013. Total fishing pressure produced by artisanal fisheries, from a Marine Spatial Planning perspective: A case study from the Basque Country (Bay of Biscay). Fish. Res. 147, 240–252. doi:10.1016/j.fishres.2013.06.010
Pascual, U., Phelps, J., Garmendia, E., Brown, K., Corbera, E., Martin, A., Gomez-Baggethun, E., Muradian, R., 2014. Social Equity Matters in Payments for Ecosystem Services. BioScience biu146. doi:10.1093/biosci/biu146
Poe, M.R., Norman, K.C., Levin, P.S., 2013. Cultural dimensions of socioecological systems: key connections and guiding principles for conservation in coastal environments. Conserv. Lett.
Porta, J., López-Acevedo, M., Roquero, C., 2003. Edafología para la agricultura y el medio ambiente. Power, A.G., 2010. Ecosystem services and agriculture: tradeoffs and synergies. Philos. Trans. R. Soc.
B Biol. Sci. 365, 2959–2971. Pritchard, L., Folke, C., Gunderson, L., 2000. Valuation of ecosystem services in institutional context.
Ecosystems 3, 36–40. Rakodi, C., 1999. A capital assets framework for analysing household livelihood strategies:
Implications for policy. Dev. Policy Rev. 17, 315–342.
- 187 -
Raudsepp-Hearne, C., Peterson, G., Bennett, E., 2010. Ecosystem service bundles for analyzing tradeoffs in diverse landscapes. Proc. Natl. Acad. Sci. 107, 5242–5247.
Raudsepp-Hearne, C., Peterson, G.D., Tengö, M., Bennett, E.M., Holland, T., Benessaiah, K., MacDonald, G.K., Pfeifer, L., 2010. Untangling the environmentalist’s paradox: Why is human well-being increasing as ecosystem services degrade? Bioscience 60, 576–589.
Ribot, J., 2014. Cause and response: vulnerability and climate in the Anthropocene. J. Peasant Stud. 1–39.
Ribot, J.C., Peluso, N.L., 2003. A theory of access*. Rural Sociol. 68, 153–181. Rivera-Ferre, M.G., 2008. The future of agriculture. EMBO Rep. 9, 1061–1066.
doi:10.1038/embor.2008.196 Robards, M.D., Schoon, M.L., Meek, C.L., Engle, N.L., 2011. The importance of social drivers in the
resilient provision of ecosystem services. Spec. Issue Polit. Policy Carbon Capture Storage 21, 522–529. doi:10.1016/j.gloenvcha.2010.12.004
Rodríguez, J.P., Beard, T.D., Bennett, E.M., Cumming, G.S., Cork, S.J., Agard, J., Dobson, A.P., Peterson, G.D., 2006. Trade-offs across space, time, and ecosystem services. Ecol. Soc. 11, 28.
Salafsky, N., Wollenberg, E., 2000. Linking livelihoods and conservation: a conceptual framework and scale for assessing the integration of human needs and biodiversity. World Dev. 28, 1421–1438.
Saldana, J., 2012. The Coding Manual for Qualitative Researchers, Edición: Second Edition. ed. SAGE Publications Ltd, Los Angeles.
Sandhu, H.S., Wratten, S.D., Cullen, R., 2010. Organic agriculture and ecosystem services. Environ. Sci. Policy 13, 1–7.
Sanjuán, Y., others, 2013. La Política Agraria Común en el alto Guadiana: Evolución de recursos hídricos y de cultivos. Cuad. Investig. Geográfica 39, 359–389.
Scheba, A., 2014. Commodifying forest carbon: How local power, politics and livelihood practices shape REDD+ in Lindi Region, Tanzania.
Schlosberg, D., 2004. Reconceiving environmental justice: global movements and political theories. Environ. Polit. 13, 517–540.
Schwartz, S.H., 1994. Are there universal aspects in the structure and contents of human values? J. Soc. Issues 50, 19–45.
Scoones, I., 1998. Sustainable rural livelihoods: a framework for analysis. Sen, A., others, 1993. Capability and well-being. na. Seppelt, R., Dormann, C.F., Eppink, F.V., Lautenbach, S., Schmidt, S., 2011. A quantitative review of
ecosystem service studies: approaches, shortcomings and the road ahead. J. Appl. Ecol. 48, 630–636.
Spangenberg, J.H., von Haaren, C., Settele, J., 2014. The ecosystem service cascade: Further developing the metaphor. Integrating societal processes to accommodate social processes and planning, and the case of bioenergy. Ecol. Econ. 104, 22–32.
Suich, H., 2008. Poverty Alleviation and Community Based Natural Resource Management in Southern Africa.
Sukhdev, P., Kumar, P., 2008. The economics of ecosystems and biodiversity (TEEB). Wesseling Ger. Eur. Communities.
Summers, J., Smith, L., Case, J., Linthurst, R., 2012. A Review of the Elements of Human Well-Being with an Emphasis on the Contribution of Ecosystem Services. AMBIO J. Hum. Environ. 1–14.
Swinton, S.M., Lupi, F., Robertson, G.P., Hamilton, S.K., 2007. Ecosystem services and agriculture: Cultivating agricultural ecosystems for diverse benefits. Spec. Sect. - Ecosyst. Serv. Agric. Ecosyst. Serv. Agric. 64, 245–252. doi:10.1016/j.ecolecon.2007.09.020
Swyngedouw, E., 2009. The Political Economy and Political Ecology of the Hydro-Social Cycle. J. Contemp. Water Res. Educ. 142, 56–60. doi:10.1111/j.1936-704X.2009.00054.x

- 188 -
Swyngedouw, E., 2004. Scaled geographies: Nature, place, and the politics of scale. Scale Geogr. Inq. Nat. Soc. Method 129–153.
Tang, Q., Bennett, S.J., Xu, Y., Li, Y., 2013. Agricultural practices and sustainable livelihoods: Rural transformation within the Loess Plateau, China. Appl. Geogr. 41, 15–23.
Tarjuelo, J.M., Rodriguez-Diaz, J.A., Abadía, R., Camacho, E., Rocamora, C., Moreno, M.A., 2015. Efficient water and energy use in irrigation modernization: Lessons from Spanish case studies. Agric. Water Manag. 162, 67–77. doi:10.1016/j.agwat.2015.08.009
Tengberg, A., Fredholm, S., Eliasson, I., Knez, I., Saltzman, K., Wetterberg, O., 2012. Cultural ecosystem services provided by landscapes: assessment of heritage values and identity. Ecosyst. Serv. 2, 14–26.
Thomas, D.S.G., Twyman, C., 2005. Equity and justice in climate change adaptation amongst natural-resource-dependent societies. Adapt. Clim. Change Perspect. Scales 15, 115–124. doi:10.1016/j.gloenvcha.2004.10.001
Turner, B.S., 2006. The Cambridge dictionary of sociology. Cambridge university press New York, NY. Turner, R.K., Daily, G.C., 2008. The ecosystem services framework and natural capital conservation.
Environ. Resour. Econ. 39, 25–35. Turner, R.K., Paavola, J., Cooper, P., Farber, S., Jessamy, V., Georgiou, S., 2003. Valuing nature:
lessons learned and future research directions. Ecol. Econ. 46, 493–510. Urama, K.C., 2005. Land-use intensification and environmental degradation: empirical evidence from
irrigated and rain-fed farms in south eastern Nigeria. J. Environ. Manage. 75, 199–217. doi:10.1016/j.jenvman.2004.11.018
Van der Ploeg, J.D., Renting, H., Brunori, G., Knickel, K., Mannion, J., Marsden, T., De Roest, K., Sevilla-Guzmán, E., Ventura, F., 2000. Rural development: from practices and policies towards theory. Sociol. Rural. 40, 391–408.
Vatn, A., 2007. Institutions and the Environment. Edward Elgar Publishing. Vatn, A., 2005. Rationality, institutions and environmental policy. Ecol. Econ. 55, 203–217.
doi:10.1016/j.ecolecon.2004.12.001 Viglizzo, E., Paruelo, J., Laterra, P., Jobbágy, E., 2011. Ecosystem service evaluation to support land-
use policy. Agric. Ecosyst. Environ. Vincent, 2004. Creating an index of social vulnerability to climate change for Africa [WWW
Document]. Watson, R.T., 2012. The science-policy interface: the role of scientific assessments--UK National
Ecosystem Assessment. Proc. R. Soc. Math. Phys. Eng. Sci. 468, 3265–3281. doi:10.1098/rspa.2012.0163
Weber, J.-L., 2007. Implementation of land and ecosystem accounts at the European Environment Agency. Ecol. Econ. 61, 695–707.
White, P.C.L., 2016. Networking Our Way to Better Ecosystem Service Provision. Trends Ecol. Evol. 105–115.
Wilhelmi, O.V., Wilhite, D.A., 2002. Assessing vulnerability to agricultural drought: a Nebraska case study. Nat. Hazards 25, 37–58.
Yagiz, S., Gokceoglu, C., 2010. Application of fuzzy inference system and nonlinear regression models for predicting rock brittleness. Expert Syst. Appl. 37, 2265–2272.
Zhang, W., Ricketts, T.H., Kremen, C., Carney, K., Swinton, S.M., 2007. Ecosystem services and dis-services to agriculture. Ecol. Econ. 64, 253–260.

- 189 -
Appendixes
I. Template for the first round of semi-structured interviews87
Hello, my name is Amaia Albizua and I am developing a PhD about agrarian ecosystem benefits. This
PhD program is coursed at the Institut de Ciència i Tecnologia Ambientals (ICTA), Universitat
Autònoma de Barcelona (UAB) and developed in the BC3 (Basque Centre for Climate Change), in
Bilbao.
The PhD study encompasses two goals: 1) understanding agrarian ecosystems’ contribution to human
wellbeing, and 2) a vulnerability assessment of Navarre’s farmers and how such vulnerability is
influenced by modern irrigation.
The information obtained from the interviews will be used confidentially. Only myself will have access
to the data and the interview contents will not be published online. Your personal information is only
retained for potential follow-up procedures in the future, if necessary. The interview will last
approximately one and a half hours. I ask for your permission to record the interview. Thank you.
Interview number: Sector: Place:
Could you please tell me?
1. Your name and birth year (I also indicated gender):
2. Literacy level of number of years studied:
3. Your profession:
4. How do you connect your work to the agrarian sector?
5. How long have you been working in the agrarian sector?
6. How would you classify farmers in this area?
7. Could you tell me four types of agrarian practices common in the area?
8. How happy would you say you are regarding your livelihood? Why?
(Self-esteem / security / happiness / stress / vulnerability / power / exclusion)
87 Though the interviews were conducted in Spanish, I am publishing the final questions as translated to English. If interested in reviewing the originals, they are available via the author.

- 190 -
Agrarian ES perceptions and link with HWB
9. Have you ever heard about ES?
10. Could you tell me, apart from crops, the other benefits that the agrarian ecosystem provides
you with?
11. For every identified service, could you tell me how it affects your wellbeing? How are those
services useful in your life? How do they benefit you?
12. Why are those benefits important for you? (the mentioned services)
Vulnerability analysis and identification of key institutions
Stress factors
13. Please tell me about main problems within the rural sector (processes, changes, challenges)
you have had to face in the last decade
14. Would you consider climatic stressors to be especially important, such as floods, droughts,
rainfall volatility?
15. Please, specify the frequency, intensity, length and main effects on the land and farmers (such
as crop lost)
16. Please tell me which are the two or three most important stressors from what we have
discussed; why do you consider these the most important?
The following questions are linked to the two or three most important stressors mentioned:
Exposure and sensitivity
17. How often do stressors occur? (Length of the phenomena/magnitude/scope) (If relevant)
18. Do these problems affect all the crops equally? Which stressors are more impactful for cereals
and vineyards?
19. From the previous classifications regarding farmer typologies within the zone, which type of
farmer would you say is most exposed to the aforementioned challenges?
20. Would you say farmers with land in irrigated systems are less exposed? Which farmers are
more sensitive? Why?
21. For the different types of farmers discussed, what were the outcomes of the stressors? Would
you say those changes affected the existing relationships among the different farmers?
22. Do you know if affected farmers received any kind of help (financial, physical) to face the
impacts of the stressors? If so, who gave this aid? What was this aid for, exactly?

- 191 -
23. Do you know if some of those climatic or environmental changes were beneficial for the
communities? Why or why not? Can you provide an example?
Adaptive response
24. How did you react against those challenges? Could you avoid their effects? (selling, buying,
emigrating) If so, how did you resist? (intensifying practices, diversifying crops, buying
insurances, joining cooperatives, syndicates, asking for a credit)
25. Did you use rural knowledge to avoid being affected by stressors? Can you give me an
example?
26. Have you started any additional activity (entrepreneurial) to absorb or ameliorate stressor’s
effect? Which one(s)?
27. Would you like to change any of your current activities to be less affected by the mentioned
stressors?
28. Do you think that adopting modern irrigation could improve your situation? How? (More crop
production and therefore higher economic gains, stronger social networks) Why? Could you
tell me differences (accessing the market, legal rights and general advantages) between
having either rainfed or irrigated systems?
29. Was adopting modern irrigation autonomous/assisted; automatic/planned; active/passive; a
strategic reaction?
30. Did you foresee the problem (e.g. stressors)? How did you react once it had happened?
31. Do you think your reaction was effective? Efficient? Fair for you and for the rest of farmers?
32. Do you think your actions and modern irrigation have effects on the environment and for
other people living in his area? Which effects and why? (Trade-offs)
33. Do you think some of the mentioned actions and modern irrigation could be mal-adaptation
measures? Why? (Examples to prompt discussion: Do you think this may displace some
farmers? Do you agree with your current cost of water? Do you think this transformation is
displacing less costly, better options? Do you think modern irrigation creates more
dependencies such as technological dependencies?)
Adaptive capacity
34. Which factors determine your actions? Are they determined by ecological features such as
soil type? Personal knowledge and skills? Personal problem formulation? Social networks?
Family? Personal financial situation (savings, debts, subsidies)?
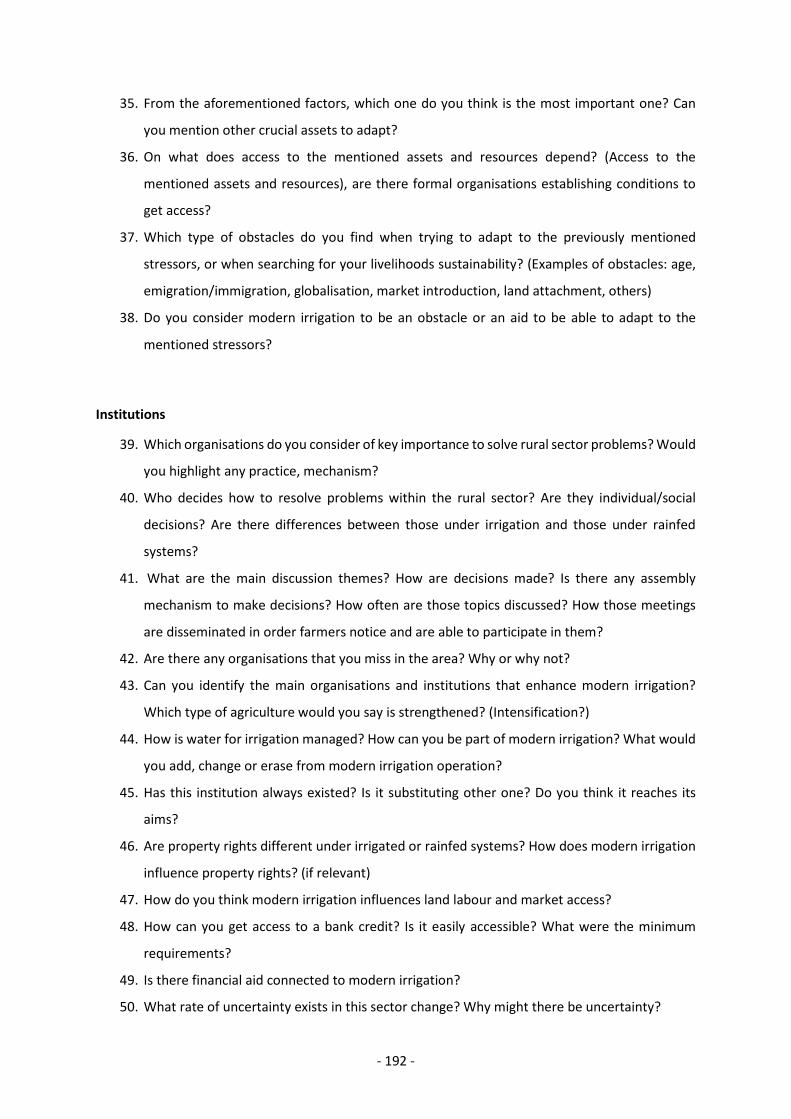
- 192 -
35. From the aforementioned factors, which one do you think is the most important one? Can
you mention other crucial assets to adapt?
36. On what does access to the mentioned assets and resources depend? (Access to the
mentioned assets and resources), are there formal organisations establishing conditions to
get access?
37. Which type of obstacles do you find when trying to adapt to the previously mentioned
stressors, or when searching for your livelihoods sustainability? (Examples of obstacles: age,
emigration/immigration, globalisation, market introduction, land attachment, others)
38. Do you consider modern irrigation to be an obstacle or an aid to be able to adapt to the
mentioned stressors?
Institutions
39. Which organisations do you consider of key importance to solve rural sector problems? Would
you highlight any practice, mechanism?
40. Who decides how to resolve problems within the rural sector? Are they individual/social
decisions? Are there differences between those under irrigation and those under rainfed
systems?
41. What are the main discussion themes? How are decisions made? Is there any assembly
mechanism to make decisions? How often are those topics discussed? How those meetings
are disseminated in order farmers notice and are able to participate in them?
42. Are there any organisations that you miss in the area? Why or why not?
43. Can you identify the main organisations and institutions that enhance modern irrigation?
Which type of agriculture would you say is strengthened? (Intensification?)
44. How is water for irrigation managed? How can you be part of modern irrigation? What would
you add, change or erase from modern irrigation operation?
45. Has this institution always existed? Is it substituting other one? Do you think it reaches its
aims?
46. Are property rights different under irrigated or rainfed systems? How does modern irrigation
influence property rights? (if relevant)
47. How do you think modern irrigation influences land labour and market access?
48. How can you get access to a bank credit? Is it easily accessible? What were the minimum
requirements?
49. Is there financial aid connected to modern irrigation?
50. What rate of uncertainty exists in this sector change? Why might there be uncertainty?

- 193 -
51. Is modern irrigation and the subsequent access to irrigation water a discussion topic in the
area? Between the existing livelihoods? Are there any conflicts linked to this topic? Why are
there conflicts? Which parties are involved and what are their positions?
52. How do you think modern irrigation influences farmers’ vulnerability to climatic and other
types of stressors?
Extra questions if time permits
How is land redistributed, after the concetración de tierras?
How the definition of the irrigated zone was initially made?
Please tell me your opinion about the questions; what would you change and why?
Who else would you suggest to speak with?
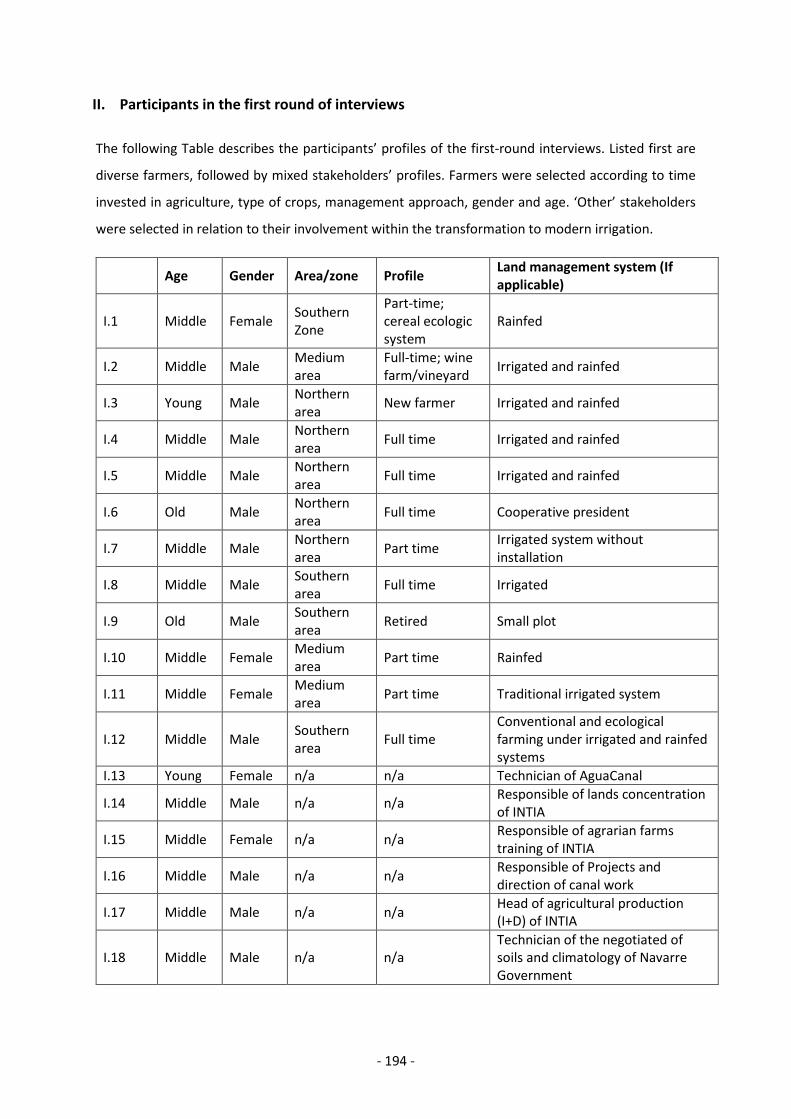
- 194 -
II. Participants in the first round of interviews
The following Table describes the participants’ profiles of the first-round interviews. Listed first are
diverse farmers, followed by mixed stakeholders’ profiles. Farmers were selected according to time
invested in agriculture, type of crops, management approach, gender and age. ‘Other’ stakeholders
were selected in relation to their involvement within the transformation to modern irrigation.
Age Gender Area/zone Profile Land management system (If
applicable)
I.1 Middle Female Southern Zone
Part-time; cereal ecologic system
Rainfed
I.2 Middle Male Medium area
Full-time; wine farm/vineyard
Irrigated and rainfed
I.3 Young Male Northern area
New farmer Irrigated and rainfed
I.4 Middle Male Northern area
Full time Irrigated and rainfed
I.5 Middle Male Northern area
Full time Irrigated and rainfed
I.6 Old Male Northern area
Full time Cooperative president
I.7 Middle Male Northern area
Part time Irrigated system without installation
I.8 Middle Male Southern area
Full time Irrigated
I.9 Old Male Southern area
Retired Small plot
I.10 Middle Female Medium area
Part time Rainfed
I.11 Middle Female Medium area
Part time Traditional irrigated system
I.12 Middle Male Southern area
Full time Conventional and ecological farming under irrigated and rainfed systems
I.13 Young Female n/a n/a Technician of AguaCanal
I.14 Middle Male n/a n/a Responsible of lands concentration of INTIA
I.15 Middle Female n/a n/a Responsible of agrarian farms training of INTIA
I.16 Middle Male n/a n/a Responsible of Projects and direction of canal work
I.17 Middle Male n/a n/a Head of agricultural production (I+D) of INTIA
I.18 Middle Male n/a n/a Technician of the negotiated of soils and climatology of Navarre Government

- 195 -
Age Gender Area/zone Profile Land management system (If
applicable)
I.19 Middle Male n/a n/a
Head of re-parceling negotiation of Rural development and environment department of Navarre Government
I.20 Middle Female n/a n/a Member of Nueva cultura del agua NGO
I.21 Middle Male n/a n/a Manager of Artajona cooperative
I.22 Middle Female n/a n/a Technical head of the CPAEN Ecological Agriculture Council of Navarre
I.23 Middle Male Northern area
Part time Worker of a city council, councilor of agriculture
I.24 Young Female n/a n/a Member of a consumption group
I.25 Young Male n/a n/a Member of a consumption group
I.26 Middle Male n/a n/a Technician of UAGN agrarian union in Navarre
I.27 Middle Male n/a n/a Technician of EHNE agrarian union in Navarre
I.28 Middle Female n/a n/a Member of a traditional irrigation community
I.29 Middle Male n/a n/a Agrarian economist professor at the University of Navarre
<35: Young; 35-55: Middle-aged; >55: Old

- 196 -
III. Template for the second round of semi-structured interviews
Introduction88
Hello, my name is Amaia Albizua and I am developing a PhD about agrarian ecosystem benefits. This
PhD program is coursed at the Institut de Ciència i Tecnologia Ambientals (ICTA), Universitat
Autònoma de Barcelona (UAB) and developed in the BC3 (Basque Centre for Climate Change), in
Bilbao.
In one of the chapters, I am researching the governance and access to irrigation water. I analyse the
evolution of the traditional irrigation to new irrigation from the Navarre Canal and the determinants
of this transformation, as well as the effects of the Canal on irrigators and non-irrigators’ livelihoods.
The information obtained from the interviews will be used confidentially. Only myself will have access
to the data; they will not be published online. Your personal information is only retained for potential
follow-up procedures in the future, if necessary. The data will be utilised as part of the doctoral thesis
and to further understand the role that institutions have on the vulnerability of socio-ecological
systems. The obtained information will be potentially published in a scientific journal which addresses
these issues. The interview will last approximately one hour. I ask for your permission to record the
interview Thank you.
Interview Questions
In the following questions I aim to understand how the system of irrigation in Miranda de Arga has
changed over time; what are the causes of this evolution and the effects that it has on the farmers
and/or affected owners’ lives.
1. Please tell how the access to water has changed with the new modern irrigation system
compared to the traditional one (20 min)
a. Are the same people obtaining access to water (resource and users boundaries)?
b. How many users (before and now); for how long time do they have the concession;
which is the main use given; what are the conditions for access to modern irrigation
water? Is there any relevant change you would mention?
c. How were/are the irrigation costs and benefits?
d. How are water-use decisions made (in both systems)? (Is there any assembly?)
88 Though the interviews were conducted in Spanish, I am publishing the final questions as translated to English. If interested in reviewing the originals, they are available via the author.
- 197 -
e. How was/is the surveillance of the proper use of resources performed? Are there
sanctions in case of infractions?
f. Who does the water originally belong to? Who manages it?
g. How were/are conflicts solved? (before and currently)
h. How were/are existing enterprises nested? (Irrigation community, AguaCANAL,
INTIA, CHE etc.)
2. What socio-economic factors have addressed the change into modern irrigation?
a. Why have these changes been adopted, instead of an alternative?
b. Which other processes/external institutions, have enhanced the shift from traditional
irrigation to modernisation?
c. What are some advantages and disadvantages of the transformation to modern
irrigation? (Who are the beneficiaries? Who are disadvantaged?)
d. Why is there conflict in the village? Could you explain contrasting
narratives/viewpoints?
3. Which implications do those changes have on the farmers and owners’ vulnerability?
a. What are some of the effects/changes have on your life, on your land management
practices, on your yield, to your family structure…
b. Which other factors (global) affect your livelihood sustainability
i. Crop selection and climate, price fluctuations, exposure
ii. Financial assets (insurances, subsidies, on property and rented land);
knowledge (literacy and working experience)
Interview tools
Table III.1 was used as an aid while stakeholders reported traditional and modern irrigation
differences regarding the management of the organisations in charge and also concerning the rights
and duties of the irrigation farmers.
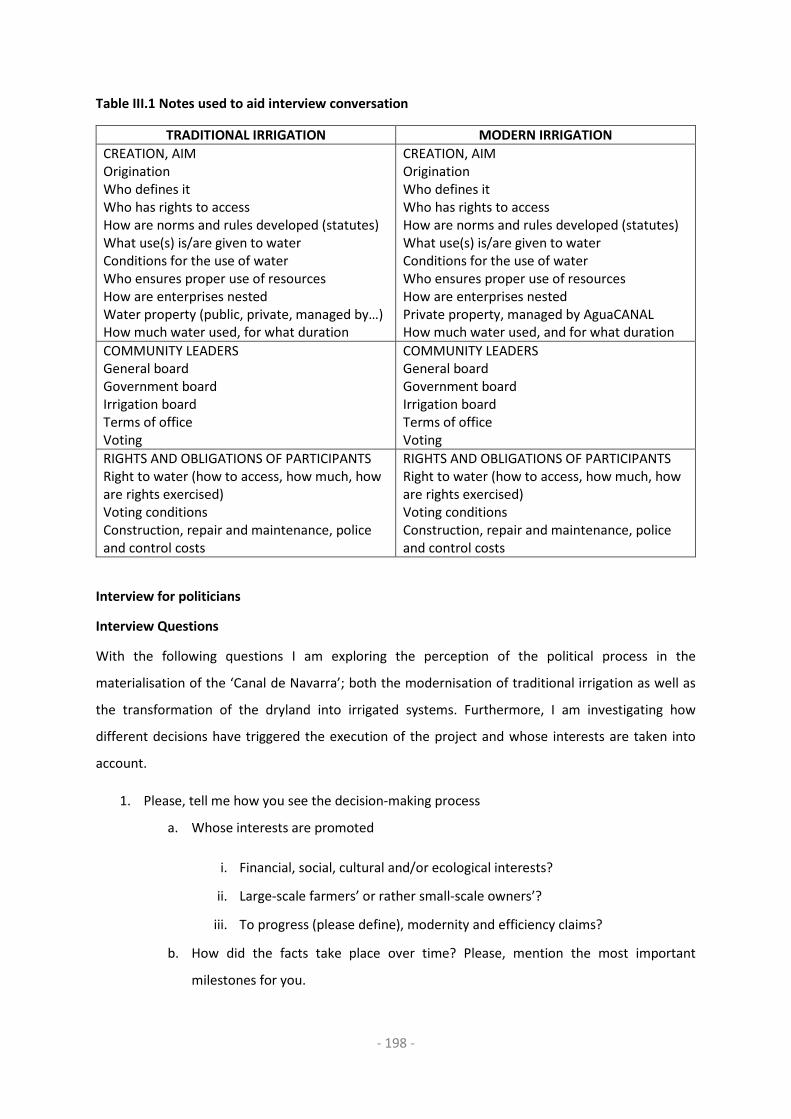
- 198 -
Table III.1 Notes used to aid interview conversation
TRADITIONAL IRRIGATION MODERN IRRIGATION
CREATION, AIM Origination Who defines it Who has rights to access How are norms and rules developed (statutes) What use(s) is/are given to water Conditions for the use of water Who ensures proper use of resources How are enterprises nested Water property (public, private, managed by…) How much water used, for what duration
CREATION, AIM Origination Who defines it Who has rights to access How are norms and rules developed (statutes) What use(s) is/are given to water Conditions for the use of water Who ensures proper use of resources How are enterprises nested Private property, managed by AguaCANAL How much water used, and for what duration
COMMUNITY LEADERS General board Government board Irrigation board Terms of office Voting
COMMUNITY LEADERS General board Government board Irrigation board Terms of office Voting
RIGHTS AND OBLIGATIONS OF PARTICIPANTS Right to water (how to access, how much, how are rights exercised) Voting conditions Construction, repair and maintenance, police and control costs
RIGHTS AND OBLIGATIONS OF PARTICIPANTS Right to water (how to access, how much, how are rights exercised) Voting conditions Construction, repair and maintenance, police and control costs
Interview for politicians
Interview Questions
With the following questions I am exploring the perception of the political process in the
materialisation of the ‘Canal de Navarra’; both the modernisation of traditional irrigation as well as
the transformation of the dryland into irrigated systems. Furthermore, I am investigating how
different decisions have triggered the execution of the project and whose interests are taken into
account.
1. Please, tell me how you see the decision-making process
a. Whose interests are promoted
i. Financial, social, cultural and/or ecological interests?
ii. Large-scale farmers’ or rather small-scale owners’?
iii. To progress (please define), modernity and efficiency claims?
b. How did the facts take place over time? Please, mention the most important
milestones for you.
- 199 -
i. Norms and orders declarations
1. At what scale (local, meso-level, macro-level (European and national)
2. Are subsidies/incentives included?
3. Co-lateral effects of the interventions
c. Justice vs. efficiency
i. Does the process sacrifice democratic governance at the expense of
financial efficiency while maintaining the equality of the current power
relations?
d. Certain groups ability to acquire benefits from resources (compared to other groups
or livelihoods)
e. Restrictions and barriers identification to sustainable livelihoods opportunities
i. Delivered information (how was it executed)
ii. Time allotted for decision-making
iii. Recognition of livelihood diversity
iv. Decision-making participation (how, solely inform, voting)
v. Results of geographical conditions; technical elections and political
agreements
vi. Appropriation, accumulation, transferability and resource distribution
vii. Particular actors’ ability to influence others’ ideas and practices
viii. Rights: ownership, heritage, use ...
ix. Individual vs. collective petitions
x. Conflict and cooperation over the benefits; previously constituted laws or
resulting laws
xi. Influence over the access due to:
1. Technology
2. Market access
3. Financial capital
4. Knowledge
5. Authority (legal systems that benefit some and harm others, how are
they articulated)
6. Social relations: friendship, trust, reciprocity, dependency and
responsibility)
2. What is your opinion regarding the project aim and how it has actually been conducted?

- 200 -
3. What opinion do you think others have regarding the project? Regarding the process of the
decision-making groups with opposing interests to yours (what do they think and why)

- 201 -
IV. Participants in the second round of interviews
The following Table describes the participants’ profiles of the second-round interviews. Listed first are
diverse farmers and owners of Miranda de Arga village, which correspond to the existing livelihoods.
Next are multi-scale formal organisation representatives with diverse political stances toward the
modern irrigation project. Farmers were selected according to the survey cluster results, which
categorised participants consistent with their land management practices and diverse viewpoints.
Age Gender Profile Position towards modern
irrigation
I.1 Young Female Large scale intensive farmer In favour
I.2 Young Male Large scale intensive farmer In favour
I.3 Experienced young
Male Large scale intensive farmer In favour
I.4 Experienced young
Male Large scale intensive farmer In favour
I.5 Middle Male Full time farmer In favour
I.6 Middle Male Full time farmer In favour
I.7 Old Male Retired farmer In favour
I.8 Old Male Retired farmer In favour
I.9 Middle Female Small scale diversified Against and denied to sell
I.10 Middle Male Part time farmer Against and displaced
I.11 Middle Male Part time farmer Against and displaced
I.12 Old Male Retired farmer Against and displaced
I.13 Old Male Part time farmer In favour
I.14 Middle Male Part time farmer organic farmers Against
I.15 Middle Female Former Miranda de Arga council major
?
I.16 Middle Male Worker of Miranda de Arga cooperative
In favour
I.17 Middle Male Personal in charge of the maintenance of the traditional irrigation system
In favour
I.18 Middle Male Member of Navarre parliament belonging to BILDU
Against
I.19 Middle Male Member of Navarre parliament belonging to UPN i
In favour
<35: Young; 35-55: Middle-aged; >55: Old

- 202 -
V. Survey template
Introduction89
Hello, my name is Amaia Albizua and I am developing a PhD about agrarian ecosystem benefits. This
PhD program is coursed at the Institut de Ciència i Tecnologia Ambientals (ICTA), Universitat
Autònoma de Barcelona (UAB) and developed in the BC3 (Basque Centre for Climate Change), in
Bilbao.
I will start with an exercise to valuate ES. I will read several sentences and I ask you to give me a
number between 0 and 5, being 0 a complete disagreement and 5 a complete agreement. Later we
will make a relative valuation exercise in which I will show you different cards/photos and I will ask
you to distribute 15 pebbles among them depending on which card has more importance for you. We
will do this in two phases. I will explain this later. Afterwards questions about your livelihood
(strategies, socio-demographic information etc.) and your opinion about modern irrigation project
and related institutions will be made.
The information obtained from the survey will be used confidentially. Only myself will have access to
the data and it will not be published online. Your personal information is only retained for potential
follow-up procedures in the future, if necessary. The survey will last approximately one hour. I ask for
your permission to record the conversation while filling the survey. Thank you.
89Though the interviews were conducted in Spanish, I am publishing the final questions as translated to English. If interested in reviewing the originals, they are available via the author.

- 203 -
Likert Scale valuation
Survey Number: ____Date: (dd/mm/yyyy):______Sector: ______ Recording #: _____ Survey taker:
_______
Agrarian soil ES valuation
Services (0-5)
1 Agricultural land is important because it is the support of life on Earth.
2 Agricultural land is not important to provide structure to the territory. It does not address population issues in villages nor does it offer employment opportunities in the area.
3 Agricultural soils are important because they offer a source of inspiration (art, culture).
4 Agricultural land is important because it gives employment to the agro-food (Not just for personal use, but also for larger-scale)
5 Agricultural soil is important because it is the heritage of the past and the future.
6 Agricultural land is important because it provides a source of income.
7 Agricultural land is important because it transcends your personal needs. It is constructive, it gives hope and strength to continue.
8 Agricultural soil is important for the regulation of pests.
9 Agricultural land is important because it allows a direct connection to nature.
10 Agricultural land is important because it acts as a filter that cleans the water, providing a number of necessary salts.
11 Agricultural land is not important in the formation of ties and social relations.
12 Agricultural land is important because it maintains and exhibits traditional rural activities, and a cultural environment of wealth and wisdom.
13
Agricultural land is important because it absorbs waste that would otherwise be problematic. (Clarification: substances which in excess or due to their characteristics can cause damage on land. I am referring to the ability of the soil to absorb, retain, or immobilise these substances)
14 Agricultural soils are important because they offer a place to relax and space for
leisure time activities (walks, birdwatching, etc.).
15 Agricultural land is important because it regulates erosion caused by water.
16 Agricultural land is important because it offers a good environment for the
education of children about the cycles of nature.
17 Agricultural land is not important for the regulation of water. Water is filtered and
is not retained in the soil.
18 Agrarian soils are important because they allow freedom and autonomy for the
farmers.
19 The soil is important, but not essential for agriculture, because technology allows
crops to grow without soil.

- 204 -
Services (0-5)
20 Agricultural land is important because it is part of family tradition.
21 The quality of the soil is important because quality food provision depends on it.
22 Agrarian soils are important because they offer unique and attractive landscapes.
23 Agrarian land is important because it provides raw material for industry and
livestock.
24 Agrarian land is important because it captures CO2 and thus helps mitigate climate change.
25 Agrarian soil is important because it provides a refuge for wildlife, such as Roe deer, wild boar.
26 Agrarian land is important because it provides nutrients which ensure crop production.
27 Agrarian land is important because its landscape tells a story, speaks of the people
who live there and work it.
Notes taken during the exercise:
- Co-production awareness - Soil definition - Etc.
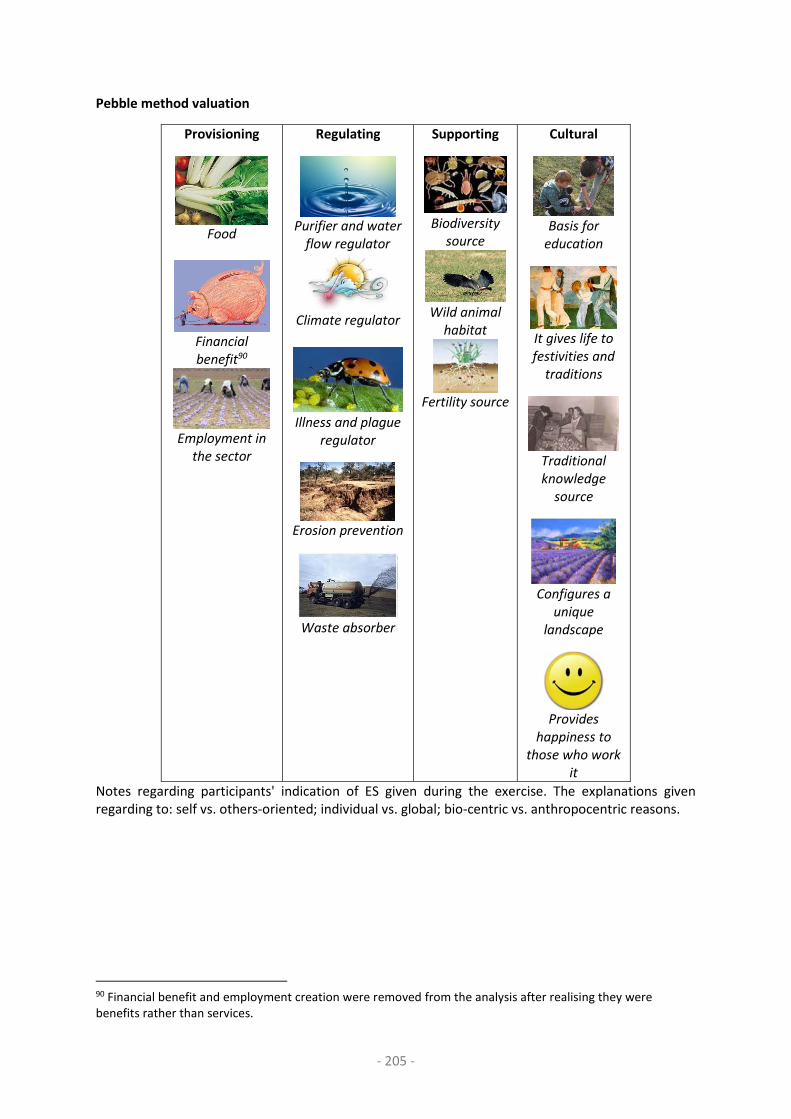
- 205 -
Pebble method valuation
Provisioning
Food
Financial
benefit90
Employment in
the sector
Regulating
Purifier and water
flow regulator
Climate regulator
Illness and plague
regulator
Erosion prevention
Waste absorber
Supporting
Biodiversity
source
Wild animal
habitat
Fertility source
Cultural
Basis for
education
It gives life to
festivities and
traditions
Traditional
knowledge
source
Configures a
unique
landscape
Provides
happiness to
those who work
it
Notes regarding participants' indication of ES given during the exercise. The explanations given regarding to: self vs. others-oriented; individual vs. global; bio-centric vs. anthropocentric reasons.
90 Financial benefit and employment creation were removed from the analysis after realising they were benefits rather than services.
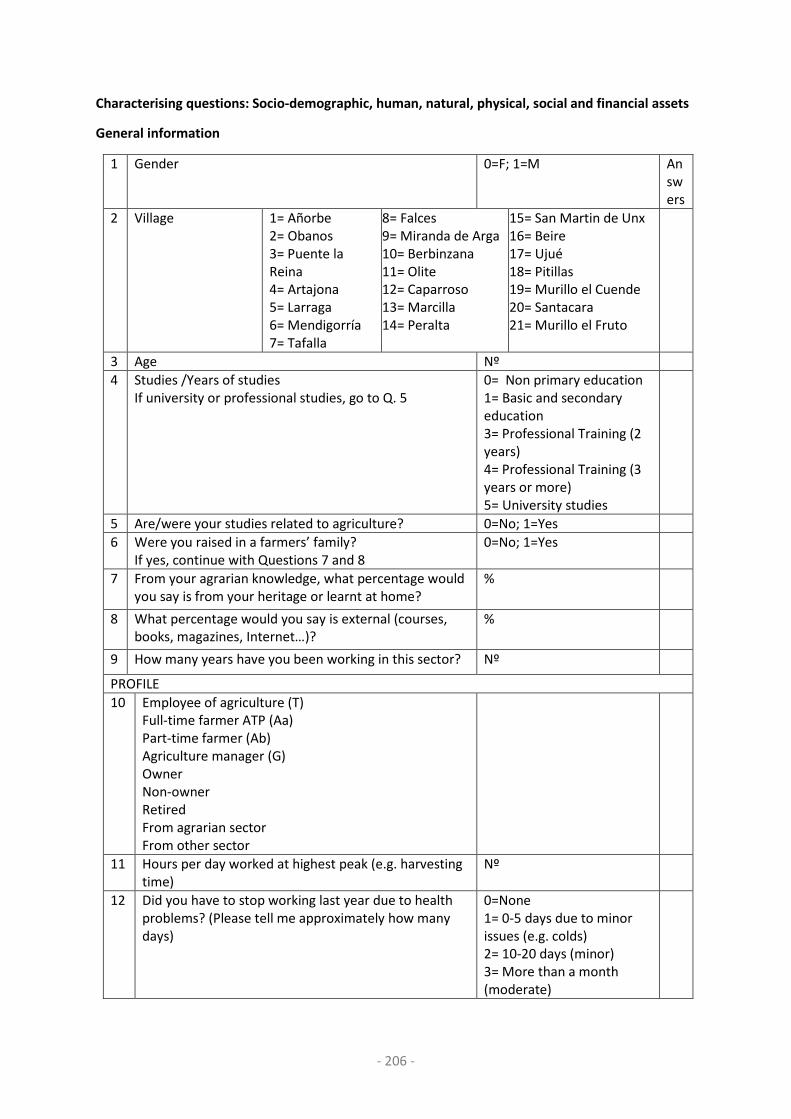
- 206 -
Characterising questions: Socio-demographic, human, natural, physical, social and financial assets
General information
1 Gender 0=F; 1=M Answers
2 Village 1= Añorbe 2= Obanos 3= Puente la Reina 4= Artajona 5= Larraga 6= Mendigorría 7= Tafalla
8= Falces 9= Miranda de Arga 10= Berbinzana 11= Olite 12= Caparroso 13= Marcilla 14= Peralta
15= San Martin de Unx 16= Beire 17= Ujué 18= Pitillas 19= Murillo el Cuende 20= Santacara 21= Murillo el Fruto
3 Age Nº
4 Studies /Years of studies If university or professional studies, go to Q. 5
0= Non primary education 1= Basic and secondary education 3= Professional Training (2 years) 4= Professional Training (3 years or more) 5= University studies
5 Are/were your studies related to agriculture? 0=No; 1=Yes
6 Were you raised in a farmers’ family? If yes, continue with Questions 7 and 8
0=No; 1=Yes
7 From your agrarian knowledge, what percentage would you say is from your heritage or learnt at home?
%
8 What percentage would you say is external (courses, books, magazines, Internet…)?
%
9 How many years have you been working in this sector? Nº
PROFILE
10 Employee of agriculture (T) Full-time farmer ATP (Aa) Part-time farmer (Ab) Agriculture manager (G) Owner Non-owner Retired From agrarian sector From other sector
11 Hours per day worked at highest peak (e.g. harvesting time)
Nº
12 Did you have to stop working last year due to health problems? (Please tell me approximately how many days)
0=None 1= 0-5 days due to minor issues (e.g. colds) 2= 10-20 days (minor) 3= More than a month (moderate)

- 207 -
4= More than two months (serious)
13 Do you have any chronic illness(es) that may negatively affect your work?
0=No; 1=Yes
14 Number of members in the household Nº
15 Is agriculture the only source of income in the household?
0=No; 1=Yes
16 How many household members work with you in agriculture?
Nº
17 How many household members are economically dependent on you?
Nº
18 Has any member of the household recently emigrated in search of work elsewhere? (to another city or country)?
0=No; 1=Yes
19 Do you have generational replacement to continue your work?
0=No; 1=Yes
20 Total land extension of the worked land Nº of Hectares:
21 Are you owner of the land you work? If partially, continue to Questions 22-24 (profiles A and G)
0=No; 1=Yes; 2=Partially
22 Percentage of worked land that you own Nº
23 Percentage of worked land that you rent (indicate if communal land)
Nº
24 How many hectares do you work that are owned by others
Nº
25 Do you have CAP rights? 0=No; 1=Yes; 2=Partially (%); -9=Don’t know
26 Do you have land that is not worked by you personally? If yes, continue with Questions 27-32 (Profiles A and G)
Nº
27 Is someone else working that land? 0=No 1= Family or friends 2= Services enterprise 3= Cooperative
28 Do you receive rent? 0=No; 1=Yes
29 Do you receive a proportional benefit regarding the land area your land area transfer?
0=No; 1=Yes
30 Do you decide which crops to grow? 0=No; 1=Yes
31 Do you decide on the land management practices? 0=No; 1=Yes
32 Do you invest in the infrastructure? 0=No; 1=Yes
33 How many hectares do you own/rent in the modern irrigation transformed area? If >0, continue with Questions 35-39
Nº of hectares:
34 Before modern irrigation installation, did you have any other source of water access that permitted you to irrigate? Which one(s)?
0=No; 1=Yes (well, raft, traditional irrigation)
35 Have you installed modern irrigation in your plots? 0=No; 1=Yes
36 Which type of irrigation do you perform? 1=Sprinkling 2=Dropping

- 208 -
3=Others
37 Do you share irrigation tanks with any neighbours? If yes, continue with Questions 38-39
0=No; 1=Yes
38 With how many? Nº of neighbours
39 Do you take turns to irrigate? 0=No; 1=Yes
40 Do you rent agrarian machinery?
(Profiles A and G) 0=No; 1=Tractor 2=Harvester 3=Small tools (e.g. hoe, etc.)
41 Do you share machinery due to not owning all the necessary tools? (Profiles A and G)
0=No; 1= Tractor 2= Harvester 3= Small tools (e.g. hoe, etc.)
42 What is your degree of participation within the cooperative?
0= Non-member 1= Very low 2= Low
3=Medium 4=High 5=Very high
43 What is your degree of participation degree within the syndicate? If affiliated with a syndicate, go to Question 44
0= Non-member 1= Very low 2= Low
3=Medium 4=High 5=Very high
44 To which syndicate do you belong? 1=UAGN 2=EHNE
3=UCAN 4=Other
45 Have you applied for any of the following subsidies? Which one(s)?
0=No; 1= FEADER (Rural development European agrarian funds) (CAP) 2= FEAGA (Guarantee European agrarian funds) (CAP) 3= Subsidies for agrarian farms modernisation (Navarre Government) 4= Subsidies for inversions on modern irrigation (Navarre Government) 5= Cooperative credit aids 6= CUMAS 7= Young farmers installation aids 8= Others (specify)
46 Do you contract any agrarian insurance? Please specify.
0= No; 1= Climatic and other insurance (integral)
2= Hail insurance 3= Others (specify)
47 Do you sell your products directly (without intermediaries)?
0=No; 1=Yes (% of the total produced crops)
48 Do you have any contracts with agro-industry? 0=No; 1=Yes
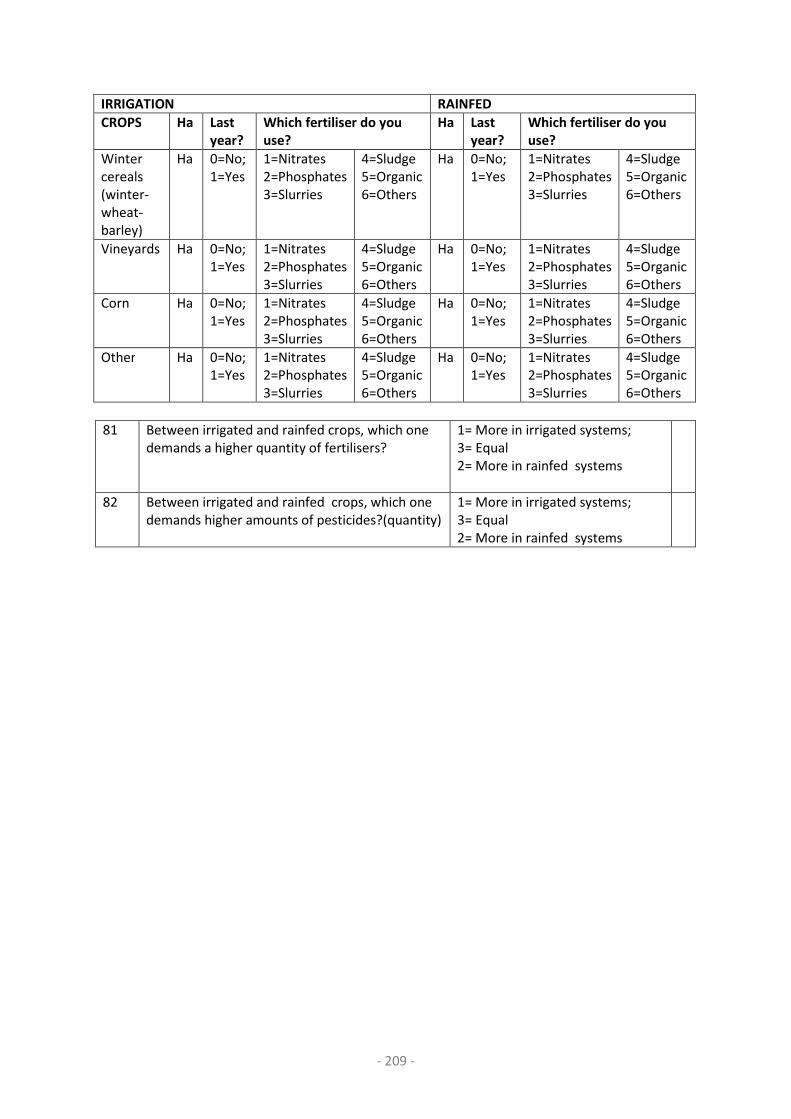
- 209 -
IRRIGATION RAINFED
CROPS Ha Last
year?
Which fertiliser do you
use?
Ha Last
year?
Which fertiliser do you
use?
Winter cereals (winter-wheat-barley)
Ha 0=No; 1=Yes
1=Nitrates 2=Phosphates 3=Slurries
4=Sludge 5=Organic 6=Others
Ha 0=No; 1=Yes
1=Nitrates 2=Phosphates 3=Slurries
4=Sludge 5=Organic 6=Others
Vineyards Ha 0=No; 1=Yes
1=Nitrates 2=Phosphates 3=Slurries
4=Sludge 5=Organic 6=Others
Ha 0=No; 1=Yes
1=Nitrates 2=Phosphates 3=Slurries
4=Sludge 5=Organic 6=Others
Corn Ha 0=No; 1=Yes
1=Nitrates 2=Phosphates 3=Slurries
4=Sludge 5=Organic 6=Others
Ha 0=No; 1=Yes
1=Nitrates 2=Phosphates 3=Slurries
4=Sludge 5=Organic 6=Others
Other Ha 0=No; 1=Yes
1=Nitrates 2=Phosphates 3=Slurries
4=Sludge 5=Organic 6=Others
Ha 0=No; 1=Yes
1=Nitrates 2=Phosphates 3=Slurries
4=Sludge 5=Organic 6=Others
81 Between irrigated and rainfed crops, which one demands a higher quantity of fertilisers?
1= More in irrigated systems; 3= Equal 2= More in rainfed systems
82 Between irrigated and rainfed crops, which one demands higher amounts of pesticides?(quantity)
1= More in irrigated systems; 3= Equal 2= More in rainfed systems

- 210 -
Changes and challenges
83/
84
Has irrigation changed your life? If yes, continue to Questions 85-88 (+) / (-)
0=Not at all 1= Very low 2= Low 3= Medium 4= High 5=Very high
85
How does the change affect your land management practices?
0=Not at all 1= Very low 2= Low 3= Medium 4= High 5=Very high
86 How does irrigation affect the crops production level?
0=Not at all 1= Very low 2= Low 3= Medium 4= High 5=Very high
87 How does irrigation affect your income?
0=Not at all 1= Very low 2= Low 3= Medium 4= High 5=Very high
88
Do you work longer hours since the change to modern irrigation?
0=Not at all 1= Very low 2= Low 3= Medium 4= High 5=Very high
89
Is the absence of
control over prices an important challenge for you? If yes, continue to Questions 90-91
0=Not at all 1= Very low 2= Low 3= Medium 4= High 5=Very high
90
How much does the absence of control over prices affect your income?
0=Not at all 1= Very low 2= Low 3= Medium 4= High 5=Very high
91
How much does the absence of control over prices affect your happiness levels?
0=Not at all 1= Very low 2= Low 3= Medium 4= High 5=Very high
92
Is drought an important challenge you have to face? If yes, continue to Questions 93-96
0=Not at all 1= Very low 2= Low 3= Medium 4= High 5=Very high
93
How much does drought affect your land management practices?
0=Not at all 1= Very low 2= Low 3= Medium 4= High 5=Very high
94 How much does drought affect the production level?
0=Not at all 1= Very low 2= Low 3= Medium 4= High 5=Very high
95 How much does drought affect to your income?
0=Not at all 1= Very low 2= Low 3= Medium 4= High 5=Very high
96 How much does it affect your happiness?
0=Not at all 1= Very low 2= Low 3= Medium 4= High 5=Very high
97
Which years, among the last ten years, were the hardest in this regard?
98
Is the absence of
official support an important challenge you have to face? If yes, continue to Questions 99-100
0=Not at all 1= Very low 2= Low 3= Medium 4= High 5=Very high
99 How much does it affect to your income?
0=Not at all 1= Very low 2= Low 3= Medium 4= High 5=Very high

- 211 -
100
How much does it affect your happiness?
0=Not at all 1= Very low 2= Low 3= Medium 4= High 5=Very high
Adaptation strategies after modern irrigation transformation
101 Did you change your lands to a rainfed area after the transformation?
0=No; 1=Yes; (Nº Hectares)
102 Have you decided to leave the agrarian sector to begin a new profession?
0=No; 1=Yes
103 Have you sold all or a portion of your lands? 0=No; 1=Yes (Nº Hectares)
104 Have you rented all or a portion of your lands? If yes, continue to Question 105
0=No; 1=Yes (Nº Hectares)
105 Who do you rent your lands to? 1= Family / Friends 2= Cooperative 3= Others
106 Have you partially left the agrarian sector? If yes, continue to Questions 107-108
0=No; 1=Yes
107 Please indicate the percentage of time dedicated to land labour
0 = None 1 = Very low 2= Low
3= Medium 4= High 5= Very high
108 Please indicate the percentage of rent obtained from agrarian land
0 = None 1 = Very low 2= Low
3= Medium 4= High 5= Very high
109 Have you purchased new land under modern irrigation system?
0=No; 1=Yes (Nº Hectares)
110 Have you rented new land under modern irrigation system?
0=No; 1=Yes (Nº Hectares)
111 How much do you use INTIA advice aid? 0 = Not at all 1 = Very low 2= Low
3= Medium 4= High 5= Very high
112 Have you diversified your crops after modern irrigation transformation? If yes, continue to Question 113
0=No; 1=Yes
113 How many additional crops do you have currently compared to previous years?
Nº of crops
114 Have you completed any training course to use modern irrigation?
0=No; 1=Yes
115 Have you joined with any other organisation that provides aid for the modern irrigation use?
0=No; 1=Yes
116 Have you joined with other farmers to create a CUMA?
0=No; 1=Yes
117 Have you asked for credit from any bank? 0=No; 1=Yes
118 Once the transformation is made, how much money can you save financially?
0= None 1= Very low 2= Low
3=Medium 4=High 5=Very high

- 212 -
119 Have you changed land management practices in search of increased soil quality?
0=No; 1=Yes
120 Do you have any other project in mind to improve your livelihood in a near future?
0=No; 1=Yes (If yes, please specify) -9=Don’t know
Cognitive capacities
121 Please rate your satisfaction levels with agrarian
activity.
0= None 1= Very low 2= Low
3=Medium 4=High 5=Very high
122 Do you trust joining other farmers to perform agrarian
activity?
0= Not at all 1= Very low 2= Low
3=Medium 4=High 5=Very high
123 Please rate the level of difficulty in learning how to use
the new technology.
0= None 1= Very low 2= Low
3=Medium 4=High 5=Very high
124 Is age a factor when considering the adoption of new
land management options, i.e. modern irrigation?
0= Not at all 1= Very low 2= Low
3=Medium 4=High 5=Very high
125 Please rate your level of conservatism regarding land
management practices?
0= None 1= Very low 2= Low
3=Medium 4=High 5=Very high
126 Please rate the importance in which you attribute to
your freedom; i.e. the power of decision-making and
ability to work for yourself.
0= None 1= Very low 2= Low
3=Medium 4=High 5=Very high
127 Please indicate your level of attachment toward your
land
If answered Medium, High, or Very High, please
continue to Question 128
0= No 1= Very low 2= Low
3=Medium 4=High 5=Very high
128 Does your (high) level of attachment toward your land
influence your decision to sell it?
0=No; 1=Yes; -9 Don’t know
129 What level would you rate your trust Science? 0= None 1= Very low 2= Low
3=Medium 4=High 5=Very high
130 Do you think administrative bureaucracy is an obstacle
in maintaining your livelihood?
0= No 1= Very low 2= Low
3=Medium 4=High 5=Very high
131 Do you share information regarding the climate,
favourable land management practices, etc. with your
neighbours?
0= No 1= Very low 2= Low
3=Medium 4=High 5=Very high
132 Do you have Internet access? 0=No; 1=Yes
133 Do you use the Internet to obtain information about
agrarian related topics? (Seed prices, Climate forecasts,
subsidies, etc.)
0=No; 1=Yes
134 If necessary, would you trust getting financial aid from
your family or friends?
0=No; 1=Yes

- 213 -
Local perception about modern irrigation transformation process
135 Do you think that the ‘Canal de Navarra’ modern irrigation transformation is necessary?
0= No 1= Very low 2= Low
3=Medium 4=High 5=Very high
136 Do you think the transformation is being executed in an adequate way? (write down comments)
0= No 1= Very low 2= Low
3=Medium 4=High 5=Very high
137 Do you agree with the Phase One extension in the traditional irrigation lands?
0= No 1= Very low 2= Low
3=Medium 4=High 5=Very high
138 Do you think adopting modern irrigation is necessary to avoid becoming obsolete in the sector?
0= No 1= Very low 2= Low
3=Medium 4=High 5=Very high
139 Do you think your election to use modern irrigation was influenced by outside agencies?
0= No 1= Very low 2= Low
3=Medium 4=High 5=Very high
140 Do feel this decision makes you less vulnerable to climatic factors?
0= No 1= Very low 2= Low
3=Medium 4=High 5=Very high
141 Do you think a consequence of modern irrigation transformation is that there are now less farmers for the same land-area? (write down reasons if commented)
0= No 1= Very low 2= Low
3=Medium 4=High 5=Very high
142 Do you think this kind of transformation only benefits the ‘professional’ farmer?
0=No; 1=Yes; 2=to all but this one specially; -9 Don’t know
143 Are you satisfied with the concentración de tierras process?
0=No; 1= Yes; -9 Don’t know
144 Do you know what your options are if you do not agree with the concetracion de tierras process?
0=No; 1= Yes; -9 Don’t know; 2= Yes, but it might not make a difference
145 Do you think there are favouritisms in the ‘concentracion de tierras’ and re-distribution processes?
0=No; 1= Yes; -9 Don’t know
146 Have you missed out on procedural information regarding the process?
0= No 1= Very low 2= Low
3=Medium 4=High 5=Very high
146b
Do you feel as if you were given an appropriate amount of time to decide if you wanted to be included within the modern irrigation transformation?
0= No 1= Very low 2= Low
3=Medium 4=High 5=Very high
147 From your perspective, how has agriculture changed with the introduction of modern irrigation?
Please specify.
148 Do you agree with the modern irrigation taxes? (Specify.) 0= No 1= Very low 2= Low
3=Medium 4=High 5=Very high
149 Do you think modern irrigation will make you more competitive in the market?
0=No; 1= Yes; -9 Don’t know
150 Have you had any trouble with the plots’ ownership deeds when the concentracion de tierras was made?
0=No; 1= Yes; -9 Don’t know
151 Please indicate how. 1=I was the owner but I have no certificate to
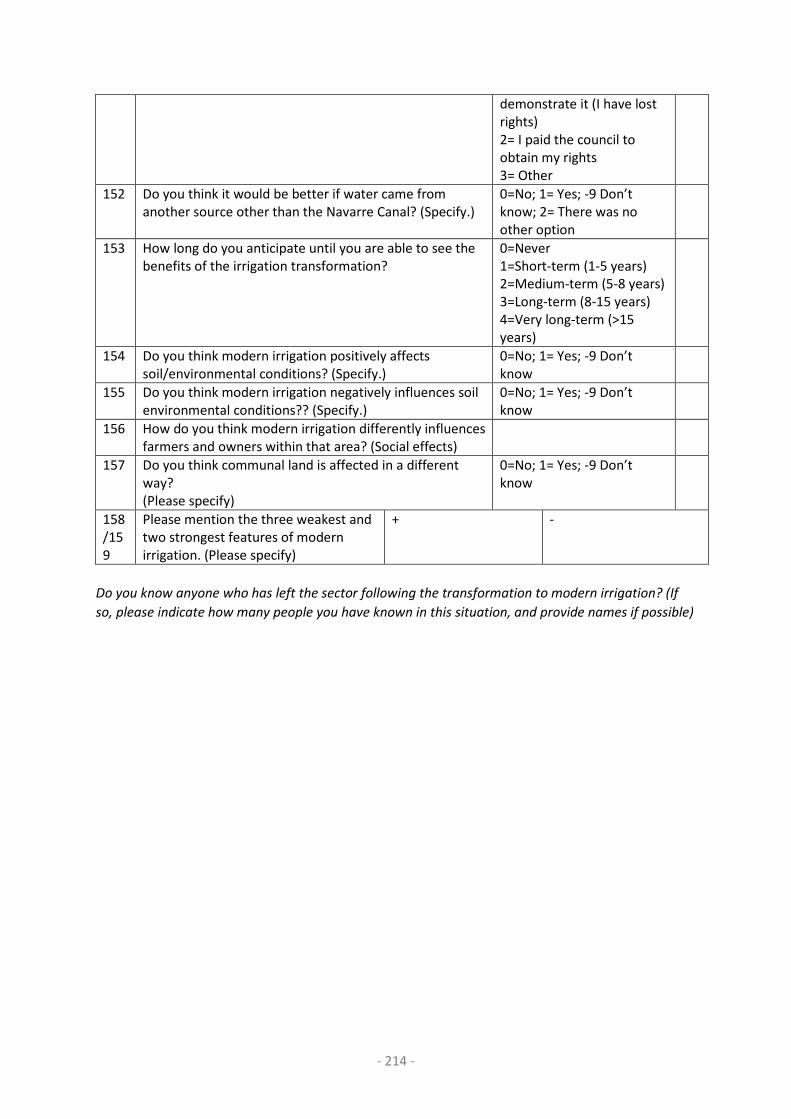
- 214 -
demonstrate it (I have lost rights) 2= I paid the council to obtain my rights 3= Other
152 Do you think it would be better if water came from another source other than the Navarre Canal? (Specify.)
0=No; 1= Yes; -9 Don’t know; 2= There was no other option
153 How long do you anticipate until you are able to see the benefits of the irrigation transformation?
0=Never 1=Short-term (1-5 years) 2=Medium-term (5-8 years) 3=Long-term (8-15 years) 4=Very long-term (>15 years)
154 Do you think modern irrigation positively affects soil/environmental conditions? (Specify.)
0=No; 1= Yes; -9 Don’t know
155 Do you think modern irrigation negatively influences soil environmental conditions?? (Specify.)
0=No; 1= Yes; -9 Don’t know
156 How do you think modern irrigation differently influences farmers and owners within that area? (Social effects)
157 Do you think communal land is affected in a different way? (Please specify)
0=No; 1= Yes; -9 Don’t know
158/159
Please mention the three weakest and two strongest features of modern irrigation. (Please specify)
+ -
Do you know anyone who has left the sector following the transformation to modern irrigation? (If
so, please indicate how many people you have known in this situation, and provide names if possible)

- 215 -
Institutions
160 Due to its subsidies, do you view CAP positively? 0= No 1= Very low 2= Low
3=Medium 4=High 5=Very high
161 Due to its subsidies, do you view CAP negatively? 0= No 1= Very low 2= Low
3=Medium 4=High 5=Very high
162 Do you think the state government is of key importance to aid the rural sector?
0= No 1= Very low 2= Low
3=Medium 4=High 5=Very high
163 Do you think the Navarre government is of key importance to aid the rural sector?
0= No 1= Very low 2= Low
3=Medium 4=High 5=Very high
163 Do you think the existence of the organic agriculture board is important to commercialise these types of products?
0= No 1= Very low 2= Low
3=Medium 4=High 5=Very high
165 Please indicate the level of involvement you perceive the agrarian syndicates have for the defence of farmers’ interests?
0= None 1= Very low 2= Low
3=Medium 4=High 5=Very high
166 Please indicate the level of trust you have for agrarian syndicates
0= None 1= Very low 2= Low
3=Medium 4=High 5=Very high
167 To what extent do you think URA-Nueva Cultura del Agua is of key importance for farmers’ interests’ defence?
0= None 1= Very low 2= Low
3=Medium 4=High 5=Very high
168 To what extent do you think INTIA INTIA helps promote the sustainability of the Navarre agrarian sector?
0= Non-member 1= Very low 2= Low
3=Medium 4=High 5=Very high
169 To what extent do you think the role of the irrigation community plays in negotiating irrigation conditions?
0= Non-member 1= Very low 2= Low
3=Medium 4=High 5=Very high
170 To what extent do you think the agrarian cooperative is a key representative organisation for the farmers?
0= Non-member 1= Very low 2= Low
3=Medium 4=High 5=Very high
171 To what extent do you think CHE helps the agrarian sector?
0= Non-member 1= Very low 2= Low
3=Medium 4=High 5=Very high
172 To what extent are you satisfied with the council you belong to?
0= Non-member 1= Very low 2= Low
3=Medium 4=High 5=Very high
173 Do you think the village farmers are united? 0= Non-member 1= Very low 2= Low
3=Medium 4=High 5=Very high

- 216 -
174 Do you think there is union between farmers from different villages?
0= Non-member 1= Very low 2= Low
3=Medium 4=High 5=Very high
175/ 176
Please, mention the three laws, norms, organisations you consider most important for helping farmers. And the three worst? (Please specify why.)
+ -

- 217 -
VI. Livelihood assets and socio-demographic features
Introduction
Table VI.1 shows the indicator variables for the five types of capital assets, context dependent socio-demographic variables and livelihood strategies collected
during fieldwork. The first column indicates the type of variable. The second column, labeled ‘abbreviation’ is how the variable is coded for the analysis. The
third column expresses the unit of each variable and the fourth column indicates whether it was used in Chapter 4 for the livelihood description.
Table VI.1 List of all the indicator variables for the five types of capital assets, context dependent socio-demographic variables and livelihood strategies
collected in the fieldwork.
Indicator categorized by form of
capital Abbreviation Unit
Educational variables:
Farmer studies level Studies Illiterate, Basic, Professional training, High Professional training, University
Agrarian studies Agrarian_Studies Yes, No
Percentage of heritage knowledge Inherited_Knowledge Low < 20%, medium = 20–70%, high > 70%
Work experience Years_Working Very Low (0-5 years), Low (5-15 years), Medium (16-30 years), High (30-50years), Very High >50years
Farming effort Harvesting_Hours None (1); Low (0-5�2); Medium (5-9�3), High (9-12�4), Very high (>12�5)
Family members Family_Members Nº people
Number of family member emigrated Family_Members_Emigrant Nº people
Family structure of farms Family_Members_Working_With_You Nº people � high > 70%, medium = 20–70%, low < 20%
Family members economic dependent Family_members_Economic_Dependent Low < 20%, medium = 20–70%, high > 70%
Generational Replacement Generational_Replacement Yes, No, Don’t Know
Health
Missing working days due to illness Not_Work_Illness Nº days
Chronic illnesses Chronic_Illness Yes, No
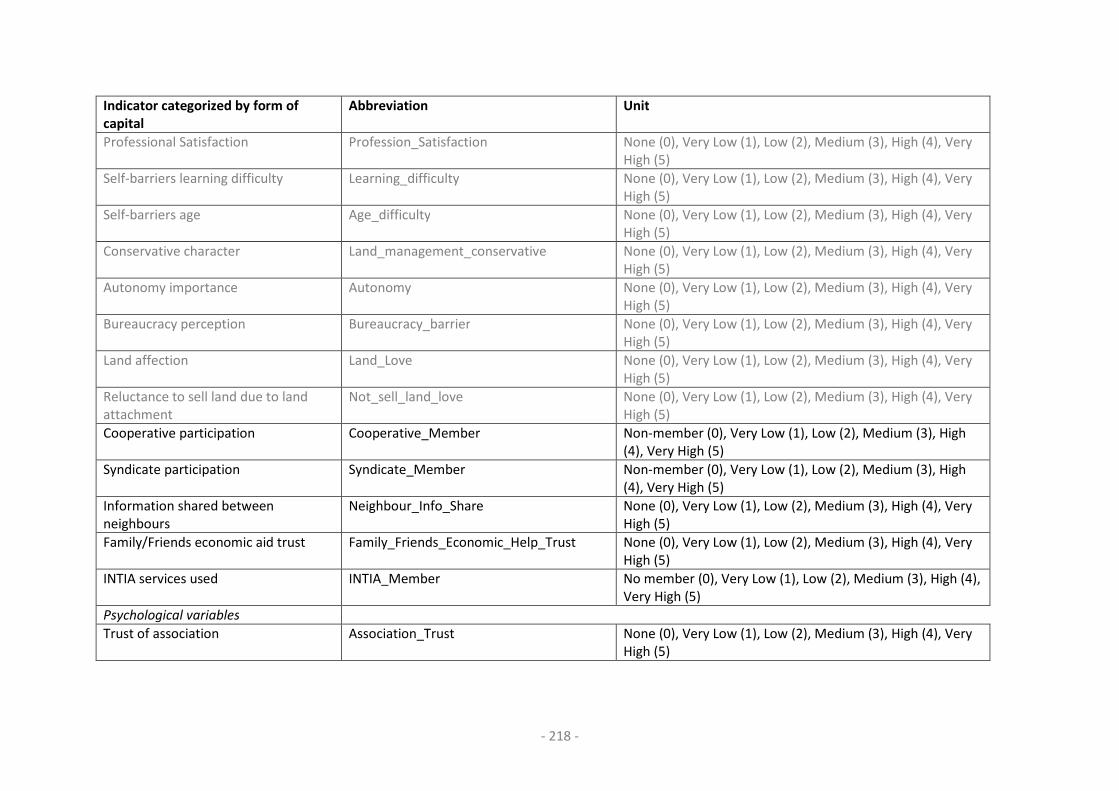
- 218 -
Indicator categorized by form of
capital Abbreviation Unit
Professional Satisfaction Profession_Satisfaction None (0), Very Low (1), Low (2), Medium (3), High (4), Very High (5)
Self-barriers learning difficulty Learning_difficulty None (0), Very Low (1), Low (2), Medium (3), High (4), Very High (5)
Self-barriers age Age_difficulty None (0), Very Low (1), Low (2), Medium (3), High (4), Very High (5)
Conservative character Land_management_conservative None (0), Very Low (1), Low (2), Medium (3), High (4), Very High (5)
Autonomy importance Autonomy None (0), Very Low (1), Low (2), Medium (3), High (4), Very High (5)
Bureaucracy perception Bureaucracy_barrier None (0), Very Low (1), Low (2), Medium (3), High (4), Very High (5)
Land affection Land_Love None (0), Very Low (1), Low (2), Medium (3), High (4), Very High (5)
Reluctance to sell land due to land attachment
Not_sell_land_love None (0), Very Low (1), Low (2), Medium (3), High (4), Very High (5)
Cooperative participation Cooperative_Member Non-member (0), Very Low (1), Low (2), Medium (3), High (4), Very High (5)
Syndicate participation Syndicate_Member Non-member (0), Very Low (1), Low (2), Medium (3), High (4), Very High (5)
Information shared between neighbours
Neighbour_Info_Share None (0), Very Low (1), Low (2), Medium (3), High (4), Very High (5)
Family/Friends economic aid trust Family_Friends_Economic_Help_Trust None (0), Very Low (1), Low (2), Medium (3), High (4), Very High (5)
INTIA services used INTIA_Member No member (0), Very Low (1), Low (2), Medium (3), High (4), Very High (5)
Psychological variables
Trust of association Association_Trust None (0), Very Low (1), Low (2), Medium (3), High (4), Very High (5)

- 219 -
Indicator categorized by form of
capital Abbreviation Unit
Trust of Science Science_Trust None (0), Very Low (1), Low (2), Medium (3), High (4), Very High (5)
Income source(s) in the household Unique_Income Yes, No
Agrarian Community Policy subsidies PAC Yes, No
Modernisation/irrigation subsidies Subs_Irrigg/Subs_Modern Yes, No
Crop insurance I/Crop insurance II/ Crop insurance III
Integral_Insurance/ Hail_Insurance/ Others Insurance
Yes, No
Credit access for farming uses Credit_Access Yes, No
Installation of the new irrigation Installation Yes, No
Type of irrigation Irrigation_Type Sprinkling, Dripping, Others
Mechanisation Machinery_Renting Level of mechanisation (% renting Tractor, harvester and others)
Access and use of Internet Internet_Use Yes, No
Land area worked (Land tenure + Land rented)
Worked_Land_Ha Very low (0-1Ha�1), Low (1-5Ha�2), Low Medium (5-10Ha�3), High Medium (10-50Ha�4), High (50-100Ha�5), Very High (100-200Ha�6), Very very high (>200Ha�7)
Village Village North (Añorbe, Obanos, Puente, Artajona, Larraga, mendi, Berbizana) Medium (Tafalla, Falces, Miranda, Olite, Beire, Ujue, San Martin Unx) South (Caparroso, Marcilla, Peralta, Pitillas, Murillo el Cuende, Santacara, Murillo el Fruto)
Average age of farmer Age Young < 35 yrs, Medium 35–55 yrs, Old > 55 yrs
Gender dominating farming Gender Male, Female
Agrarian family Agrarian_Family Yes, No
Land tenure Area Ha_Property High = ‘own’ land (>80%), medium = 20–80% own land, low < 20% own land
Land Rent Area Rented_Ha High = ‘own’ land (>80%), medium = 20–80% own land, low < 20% own land

- 220 -
Indicator categorized by form of
capital Abbreviation Unit
Shared Land Shared_Ha High = ‘own’ land (>80%), medium = 20–80% own land, low < 20% own land (Nº Ha)
Owner of the land Owner Yes, No, Partial
Rules about modern irrigation
New irrigation facilities shared Shared_Irrigation Yes, No
Number of people sharing irrigation How_Many_Irrig_Share Nº people
Necessity of turns for irrigation Irrigation_Turns Yes, No
Markets in practice
Own Market Access Direct_Sell High = >80%, medium = 20–80%, low < 20%
Agro-industry Access Agro-industry_Work Yes, No
Type of crops (Ha) Cereal (Winter-wheat and Barley), Maize, Vineyards, Others (vegetables, fruit, olive, almond trees)
0Ha, 0-5Ha�1; 5-10Ha-10�2; 10-50Ha�3; 50-75Ha�4; >75Ha�5
Irrigation system Irrigation/Rainfed Ha under each system
Type of fertiliser Fertiliser_type Conventional (N,P,K), Mixed, Organic (slurry and sludge included)
Profile Profile Farm worker (1), Full Time farmer (2), Part time farmer(3); Farm Manager/Owner (4), Retired Farmers (5)
Current crops diversification Diversify_Crops Number of crops
Displacement to rainfed lands Rainfed_Displacement 0-1Ha�1; 2-5�2; 5-10�3
Land was sold Sell_Land_Ha 0-1Ha�1; 2-5Ha�2; 5-10Ha�3; 10-20Ha�4; >20Ha�5
Land was rented to others Land_For_Rent 0-1Ha�1; 2-5Ha�2; 5-10Ha�3; 10-20Ha�4; >20Ha�5
Additional land was purchased Buy_More_Land 0-1Ha�1; 2-5Ha�2; 5-10Ha�3; 10-20Ha�4; >20Ha�5
Additional land was rented Rent_More_Land 0-1Ha�1; 2-5Ha�2; 5-10Ha�3; 10-20Ha�4; >20Ha�5
Increased number of crops after modern irrigation
Diversify_Crops Number of new crops after irrigation
Note: Variables in black are direct variables included in the analysis of Chapter4. Variables in grey were not used in analysis of Chapter 4 but they may be
included in other chapters.
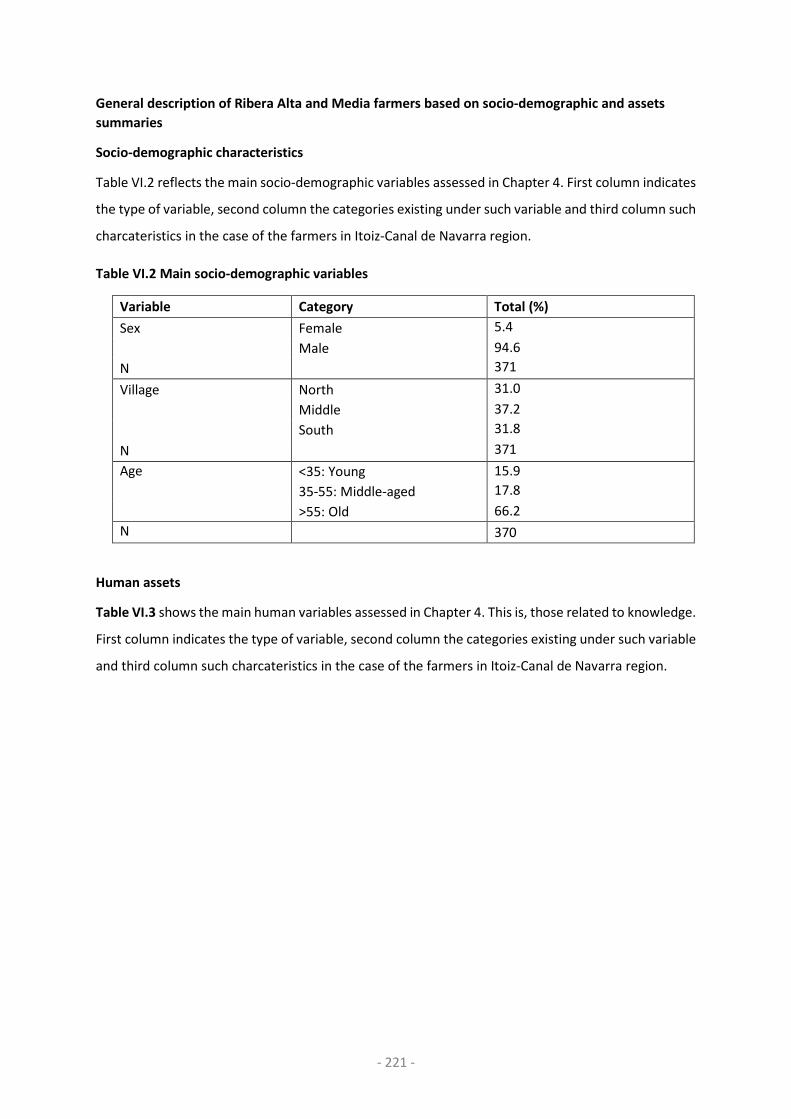
- 221 -
General description of Ribera Alta and Media farmers based on socio-demographic and assets
summaries
Socio-demographic characteristics
Table VI.2 reflects the main socio-demographic variables assessed in Chapter 4. First column indicates
the type of variable, second column the categories existing under such variable and third column such
charcateristics in the case of the farmers in Itoiz-Canal de Navarra region.
Table VI.2 Main socio-demographic variables
Variable Category Total (%)
Sex Female 5.4
Male 94.6
N 371
Village North 31.0
Middle 37.2
South 31.8
N 371
Age <35: Young 15.9
35-55: Middle-aged 17.8
>55: Old 66.2
N 370
Human assets
Table VI.3 shows the main human variables assessed in Chapter 4. This is, those related to knowledge.
First column indicates the type of variable, second column the categories existing under such variable
and third column such charcateristics in the case of the farmers in Itoiz-Canal de Navarra region.
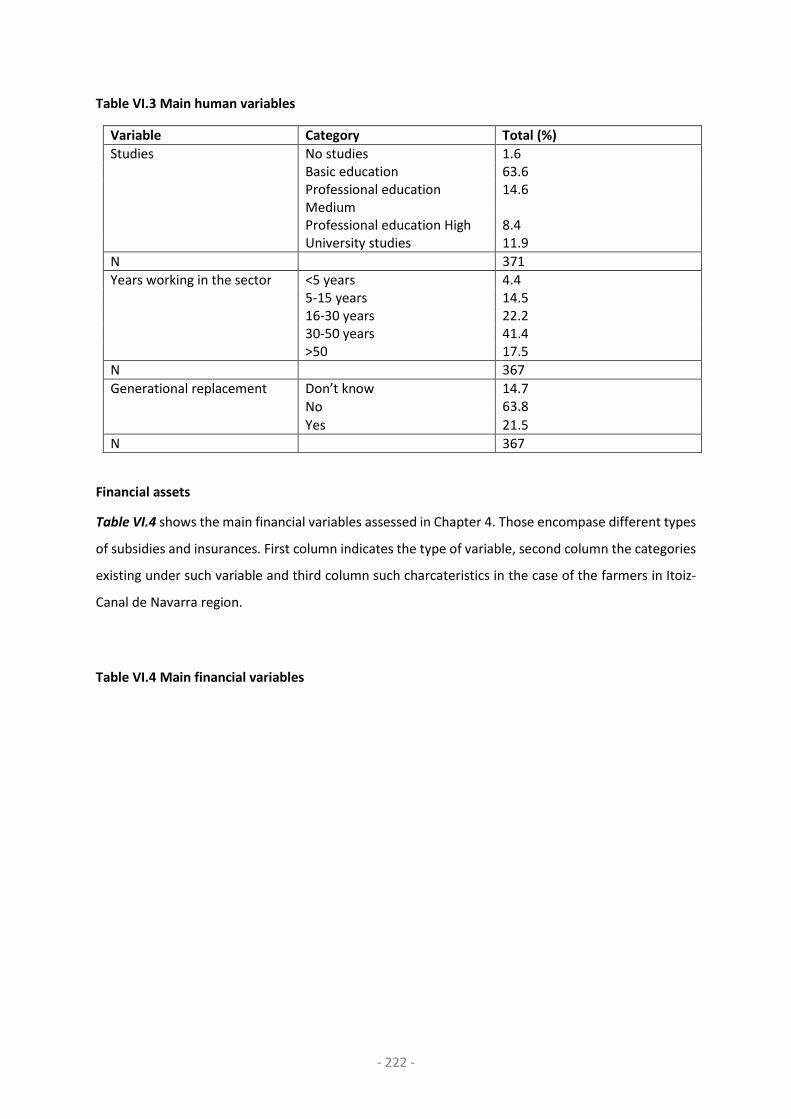
- 222 -
Table VI.3 Main human variables
Financial assets
Table VI.4 shows the main financial variables assessed in Chapter 4. Those encompase different types
of subsidies and insurances. First column indicates the type of variable, second column the categories
existing under such variable and third column such charcateristics in the case of the farmers in Itoiz-
Canal de Navarra region.
Table VI.4 Main financial variables
Variable Category Total (%)
Studies No studies 1.6 Basic education 63.6 Professional education Medium
14.6
Professional education High 8.4 University studies 11.9
N 371
Years working in the sector <5 years 4.4 5-15 years 14.5 16-30 years 22.2 30-50 years 41.4 >50 17.5
N 367
Generational replacement Don’t know 14.7 No 63.8
Yes 21.5
N 367

- 223 -
Variable Category Total (%)
PAC No 14.5 Yes 85.5
N 358
Subs_Modern Don’t know 2.3 No 68.4 Yes 29.4
N 354
Subs_Irrigation Don’t know 2.3 No 50.0 Yes 47.7
N 354
Integral_Insurance Don’t know 4.1 No 60.4 Yes 35.4 N 364
Hail_Insurance Don’t know 4.1 No 52.5 Yes 43.4 N 364
Other_Insurance Don’t know 4.1 No 84.6 Yes 11.3 N 364
Natural capital and institutions regulating its access
Table VI.5 shows the main farmers’ access to land features found in Chapter 4. They differentiate
mainly in the land are they work and ownership feature. First column indicates the type of variable,
second column the categories existing under such variable and third column provides such
information for the different types of farmers in Itoiz-Canal de Navarra region.

- 224 -
Table VI.5 Farmers’ access to land features
Farm
worker
Full-
time
Farmer
Part-
time
Farmer
Retired
Farmer
Total
Ha of worked land
< 1 Ha Count 4 20 28 18 70 % of Total .0 .1 .1 .1 .2
1-5 Ha Count 3 18 23 14 58 % of Total .0 .1 .1 .0 .2
5-10 Ha
Count 2 9 15 7 33 % of Total .0 .0 .0 .0 .1
10-50 Ha
Count 4 82 21 21 128 % of Total .0 .2 .1 .1 .4
50-100 Ha
Count 0 33 6 2 41 % of Total .0 .1 .0 .0 .1
100-200 Ha
Count 2 17 2 0 21 % of Total .0 .0 .0 .0 .1
>200-400 Ha
Count 0 6 1 0 7 % of Total .0 .0 .0 .0 .0
Total Count 15 185 96 62 358
% of Total .0 .5 .3 .2 1.0
Owner No Count 4 14 11 2 31 % of Total
.0 .0 .0 .0 .1
Yes Count 1 14 48 35 98 % of Total
.0 .0 .1 .1 .3
Partial Count 10 158 43 27 238 % of Total
.0 .4 .1 .1 .6
Total Count 15 186 102 64 367 % of Total
.0 .5 .3 .2 1.0
Livelihood strategies in Ribera Alta and Media in Navarre
Labour diversification
Table VI.6 shows the main farmers’ profiles found in Chapter 4. They differentiate mainly in the time
invested in agrarian activities. First column indicates the type of variable, second column the
categories existing under such variable and third column provides such information for the different
types of farmers in Itoiz-Canal de Navarra region.

- 225 -
Table VI.6 Labour diversification strategy description
Variable Category Frequency Valid %
Profile Farm workers 15 4 Full-time farmers 186 50 Part-time farmers 104 28 Retired farmers 65 17.4 Total 370 100
Land management
Table VI.7 shows the main farmers’ management strategies found in Chapter 4. They differentiate
mainly in type of crop grown, whether they irrigate or not and in the d¡fertiliser used. First column
indicates the type of variable, second column the categories existing under such variable and third
column provides such information for the different types of farmers in Itoiz-Canal de Navarra region.

- 226 -
Table VI.7 Land management (crops, irrigation technology and other inputs)
Land management Category Frequency Valid %
Type of Crops Cereal 295 79.5
Maize 199 53.63
Vineyard 94 25.3
Others 23 60.10
Type of system (Rainfed/Irrigated)
Irrigated Cereal 145 39
Rainfed Cereal 268 72.24
Irrigated Vineyard 58 14.25 Rainfed Vineyard 58 15.18
Irrigated Maize 198 52.99 Rainfed Maize 7 1.35
Irrigated others 186 49.60 Rainfed others 69 17.71
Total 371
Type of fertiliser Irrigated-Cereal-Conventional 77 20.8
Rainfed-Cereal-Conventional 162 43.7
Irrigated-Vineyard-Conventional
33 9
Rainfed-Vineyard-Conventional
19 5.1
Irrigated-Maize-Conventional 100 27.0 Rainfed-Maize-Conventional 1 .3 Irrigated-Others-Conventional 82 22.7 Rainfed-Others-Conventional 21 5.8
Irrigated-Cereal-Organic 2 .5 Rainfed-Cereal-Organic 15 4.3 Irrigated-Vineyard-Organic 24 6.5 Rainfed-Vineyard-Organic 9 2.4 Irrigated-Maize-Organic 8 2.2 Rainfed-Maize-Organic 1 .3 Irrigated-Others-Organic 26 7.2 Rainfed-Others-Organic 9 2.5
Irrigated-Cereal_Mix 2 .5 Rainfed-Cereal_Mix 59 16.8 Irrigated-Vineyard_Mix 9 2.4 Rainfed-Vineyard:mix 6 1.6 Irrigated-Maize_Mix 78 21.0 Rainfed-Maize_Mix 2 .5 Irrigated-Others_Mix 44 12.2 Rainfed-Others_Mix 8 2.2
Market elections
Table VI.8 shows the main farmers’ market strategies found in Chapter 4. They differentiate mainly in
whether they sell directly their crops and whether they have contracts with agor-industry. First column
indicates the type of variable, second column the categories existing under such variable and third
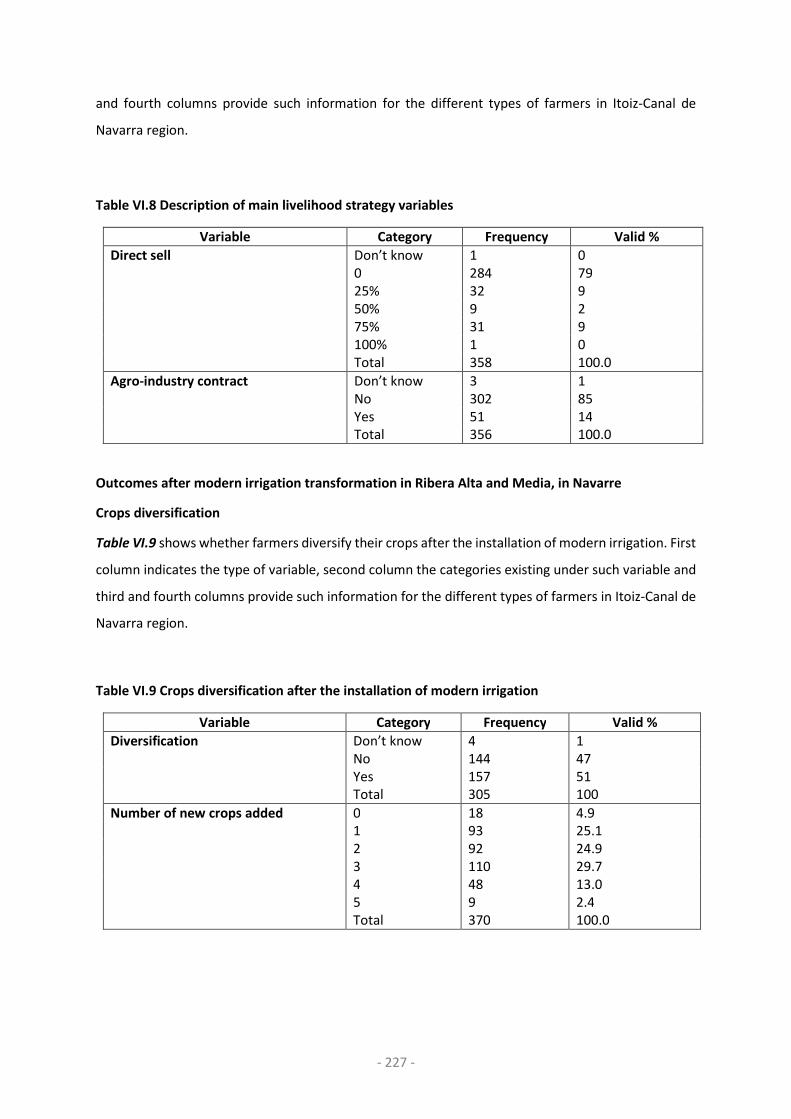
- 227 -
and fourth columns provide such information for the different types of farmers in Itoiz-Canal de
Navarra region.
Table VI.8 Description of main livelihood strategy variables
Variable Category Frequency Valid %
Direct sell Don’t know 1 0 0 284 79 25% 32 9 50% 9 2 75% 31 9 100% 1 0 Total 358 100.0
Agro-industry contract Don’t know 3 1 No 302 85 Yes 51 14 Total 356 100.0
Outcomes after modern irrigation transformation in Ribera Alta and Media, in Navarre
Crops diversification
Table VI.9 shows whether farmers diversify their crops after the installation of modern irrigation. First
column indicates the type of variable, second column the categories existing under such variable and
third and fourth columns provide such information for the different types of farmers in Itoiz-Canal de
Navarra region.
Table VI.9 Crops diversification after the installation of modern irrigation
Variable Category Frequency Valid %
Diversification Don’t know 4 1 No 144 47 Yes 157 51 Total 305 100
Number of new crops added 0 18 4.9 1 93 25.1 2 92 24.9 3 110 29.7 4 48 13.0 5 9 2.4 Total 370 100.0
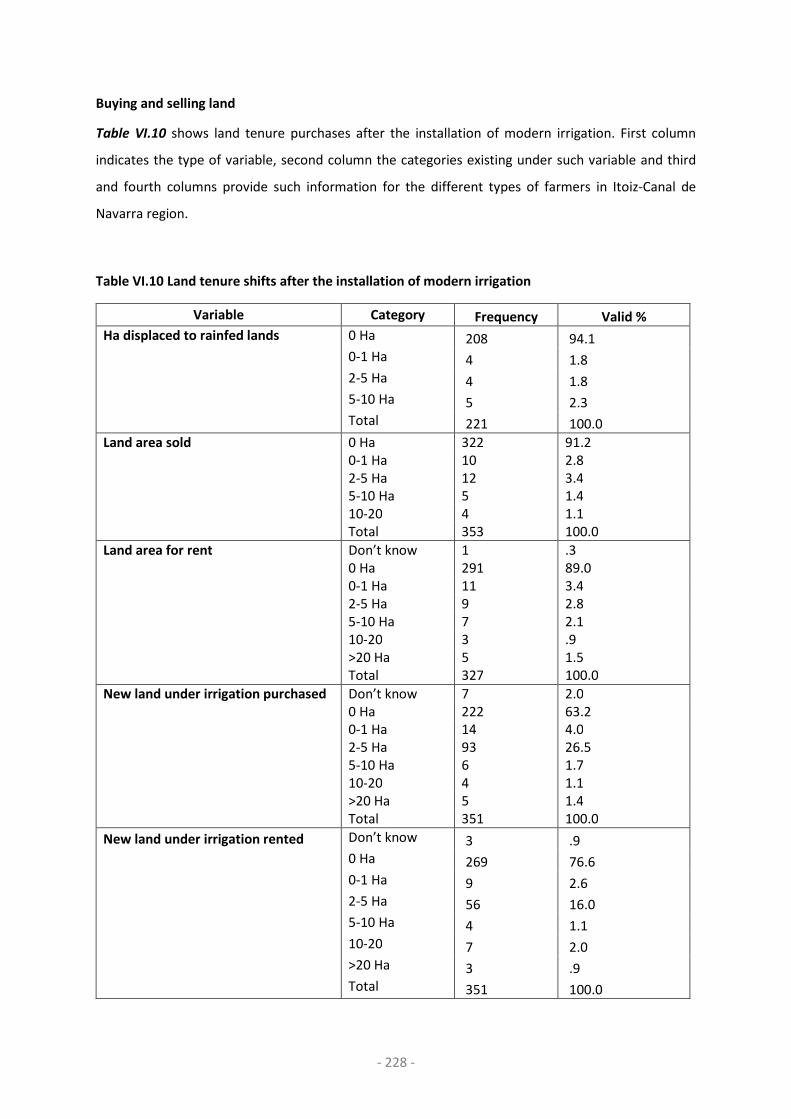
- 228 -
Buying and selling land
Table VI.10 shows land tenure purchases after the installation of modern irrigation. First column
indicates the type of variable, second column the categories existing under such variable and third
and fourth columns provide such information for the different types of farmers in Itoiz-Canal de
Navarra region.
Table VI.10 Land tenure shifts after the installation of modern irrigation
Variable Category Frequency Valid %
Ha displaced to rainfed lands 0 Ha 208 94.1 0-1 Ha 4 1.8 2-5 Ha 4 1.8 5-10 Ha 5 2.3 Total 221 100.0
Land area sold 0 Ha 322 91.2 0-1 Ha 10 2.8 2-5 Ha 12 3.4 5-10 Ha 5 1.4 10-20 4 1.1 Total 353 100.0
Land area for rent Don’t know 1 .3 0 Ha 291 89.0 0-1 Ha 11 3.4 2-5 Ha 9 2.8 5-10 Ha 7 2.1 10-20 3 .9 >20 Ha 5 1.5 Total 327 100.0
New land under irrigation purchased Don’t know 7 2.0 0 Ha 222 63.2 0-1 Ha 14 4.0 2-5 Ha 93 26.5 5-10 Ha 6 1.7 10-20 4 1.1 >20 Ha 5 1.4 Total 351 100.0
New land under irrigation rented Don’t know 3 .9
0 Ha 269 76.6
0-1 Ha 9 2.6
2-5 Ha 56 16.0
5-10 Ha 4 1.1
10-20 7 2.0
>20 Ha 3 .9
Total 351 100.0

- 229 -
Socio-demographic characterisation of farmers’ livelihoods in Navarre
I performed a chi-square test, when both variables (the livelihood typology to which they belonged
and the socio-demographic variables) compared were categorical. Only those that are significantly
different among the livelihoods are presented and explained in Table VI.11. The socio-demographic
features, assets, and other pursued strategies and outcomes after modern irrigation are presented
that are significantly different among the existing livelihood (p-value < 0.05).
Only one of the categories for each variable is represented in the Table VI.11. This information
endorses a broader description of the existing livelihoods. Values under each cluster represent the
mean value for chi-square test so that the first row corresponding to gender for example, means that
just the first livelihood (‘small scale diversified farmers’) are represented by females rather than males,
whereas the rest of livelihoods are overrepresented by men. This is performed for the rest of
significant variables.
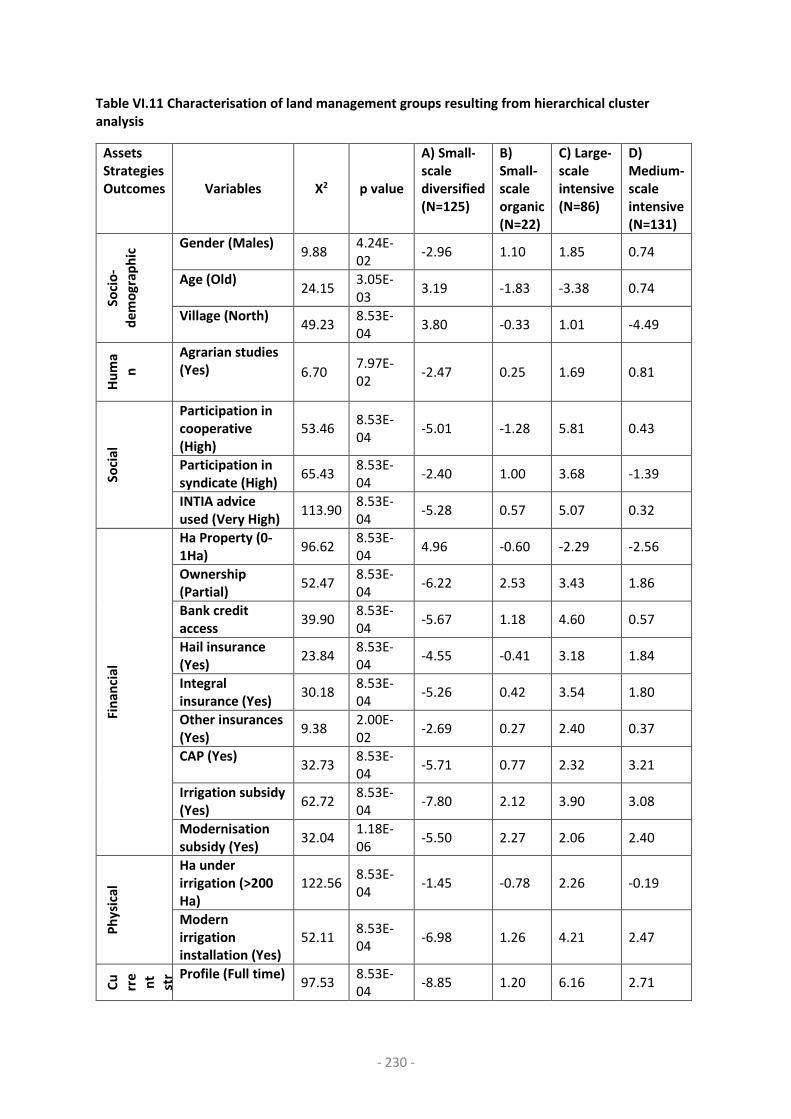
- 230 -
Table VI.11 Characterisation of land management groups resulting from hierarchical cluster
analysis
Assets
Strategies
Outcomes Variables X2 p value
A) Small-
scale
diversified
(N=125)
B)
Small-
scale
organic
(N=22)
C) Large-
scale
intensive
(N=86)
D)
Medium-
scale
intensive
(N=131)
So
cio
-
de
mo
gra
ph
ic Gender (Males)
9.88 4.24E-02
-2.96 1.10 1.85 0.74
Age (Old) 24.15
3.05E-03
3.19 -1.83 -3.38 0.74
Village (North) 49.23
8.53E-04
3.80 -0.33 1.01 -4.49
Hu
ma
n
Agrarian studies
(Yes) 6.70 7.97E-02
-2.47 0.25 1.69 0.81
So
cia
l
Participation in
cooperative
(High)
53.46 8.53E-04
-5.01 -1.28 5.81 0.43
Participation in
syndicate (High) 65.43
8.53E-04
-2.40 1.00 3.68 -1.39
INTIA advice
used (Very High) 113.90
8.53E-04
-5.28 0.57 5.07 0.32
Fin
an
cia
l
Ha Property (0-
1Ha) 96.62
8.53E-04
4.96 -0.60 -2.29 -2.56
Ownership
(Partial) 52.47
8.53E-04
-6.22 2.53 3.43 1.86
Bank credit
access 39.90
8.53E-04
-5.67 1.18 4.60 0.57
Hail insurance
(Yes) 23.84
8.53E-04
-4.55 -0.41 3.18 1.84
Integral
insurance (Yes) 30.18
8.53E-04
-5.26 0.42 3.54 1.80
Other insurances
(Yes) 9.38
2.00E-02
-2.69 0.27 2.40 0.37
CAP (Yes) 32.73
8.53E-04
-5.71 0.77 2.32 3.21
Irrigation subsidy
(Yes) 62.72
8.53E-04
-7.80 2.12 3.90 3.08
Modernisation
subsidy (Yes) 32.04
1.18E-06
-5.50 2.27 2.06 2.40
Ph
ysi
cal
Ha under
irrigation (>200
Ha)
122.56 8.53E-04
-1.45 -0.78 2.26 -0.19
Modern
irrigation
installation (Yes)
52.11 8.53E-04
-6.98 1.26 4.21 2.47
Cu
rre
nt
str Profile (Full time)
97.53 8.53E-04
-8.85 1.20 6.16 2.71

- 231 -
Assets
Strategies
Outcomes Variables X2 p value
A) Small-
scale
diversified
(N=125)
B)
Small-
scale
organic
(N=22)
C) Large-
scale
intensive
(N=86)
D)
Medium-
scale
intensive
(N=131)
Work for agro-
industry (Yes) 13.83
6.52E-03
-3.44 -0.76 1.67 2.24
Ou
tco
me
s
Purchased more
lands after
irrigation (10-20
Ha)
50.16 8.53E-04
-3.16 -1.18 3.01 1.02
Rent more lands
after irrigation
(>20 Ha)
49.41 1.61E-03
-2.68 -1.00 4.20 -0.61
Crops
diversification 60.26
1.31E-12
-7.49 0.25 4.77 3.06
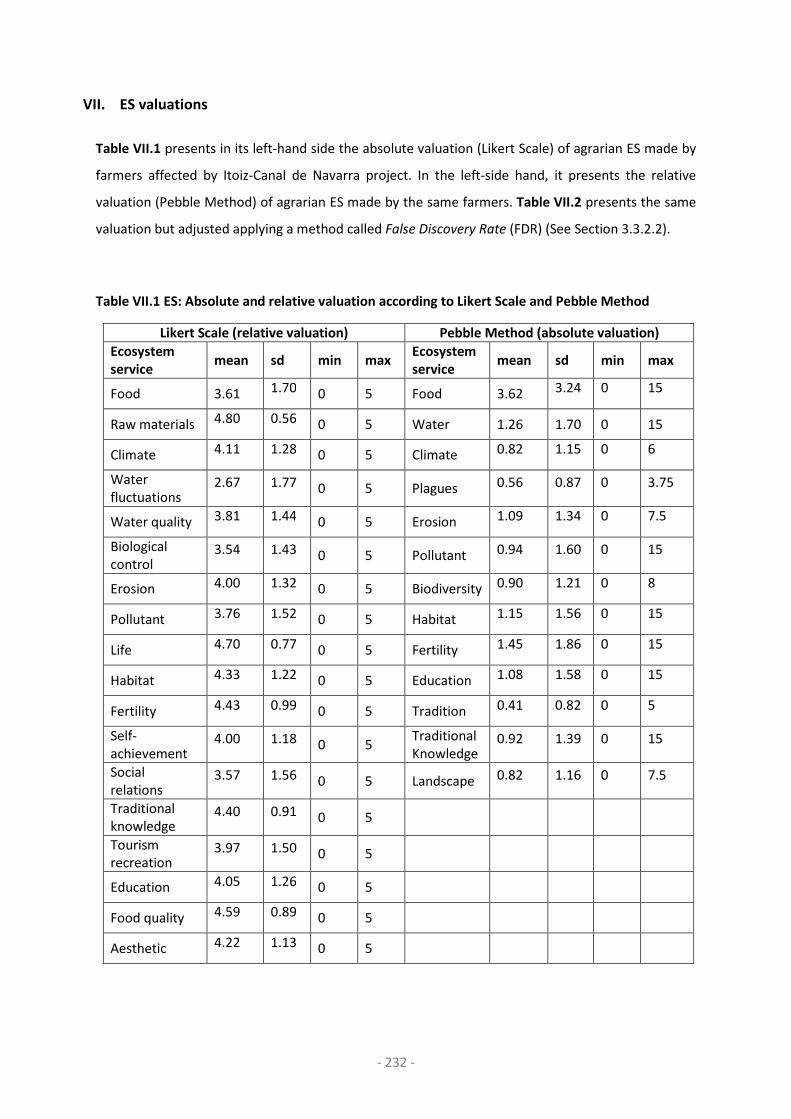
- 232 -
VII. ES valuations
Table VII.1 presents in its left-hand side the absolute valuation (Likert Scale) of agrarian ES made by
farmers affected by Itoiz-Canal de Navarra project. In the left-side hand, it presents the relative
valuation (Pebble Method) of agrarian ES made by the same farmers. Table VII.2 presents the same
valuation but adjusted applying a method called False Discovery Rate (FDR) (See Section 3.3.2.2).
Table VII.1 ES: Absolute and relative valuation according to Likert Scale and Pebble Method
Likert Scale (relative valuation) Pebble Method (absolute valuation)
Ecosystem
service mean sd min max
Ecosystem
service mean sd min max
Food 3.61 1.70 0 5 Food 3.62 3.24 0 15
Raw materials 4.80 0.56 0 5 Water 1.26 1.70 0 15
Climate 4.11 1.28 0 5 Climate 0.82 1.15 0 6
Water fluctuations
2.67 1.77 0 5 Plagues 0.56 0.87 0 3.75
Water quality 3.81 1.44 0 5 Erosion 1.09 1.34 0 7.5
Biological control
3.54 1.43 0 5 Pollutant 0.94 1.60 0 15
Erosion 4.00 1.32 0 5 Biodiversity 0.90 1.21 0 8
Pollutant 3.76 1.52 0 5 Habitat 1.15 1.56 0 15
Life 4.70 0.77 0 5 Fertility 1.45 1.86 0 15
Habitat 4.33 1.22 0 5 Education 1.08 1.58 0 15
Fertility 4.43 0.99 0 5 Tradition 0.41 0.82 0 5
Self-achievement
4.00 1.18 0 5 Traditional Knowledge
0.92 1.39 0 15
Social relations
3.57 1.56 0 5 Landscape 0.82 1.16 0 7.5
Traditional knowledge
4.40 0.91 0 5
Tourism recreation
3.97 1.50 0 5
Education 4.05 1.26 0 5
Food quality 4.59 0.89 0 5
Aesthetic 4.22 1.13 0 5

- 233 -
Table VII.2 Adjusted absolute (Likert Scale) and relative (Pebble Method) differences in valuation
among existing livelihood profiles
Likert absolute valuation Pebble relative valuation
ES SD MO MI LI p
value ES
SD MO MI LI p
value
Food 3.64 3.73 3.64 3.55 0.97 Food 3.58 3.66 3.21 3.92 0.81
Raw materials
4.79 4.59 4.77 4.87 0.75
Water 0.75 1.04 0.89 0.79 0.81
Climate 3.96 4.09 4.17 4.21 0.75 Climate 1.31 1.16 1.36 1.15 0.76
Water flux 2.58 2.23 2.81 2.74 0.75 Plagues 0.49 0.78 0.64 0.53 0.81
Water quality
3.87 4.32 3.73 3.72 0.66
Erosion 0.88 1.44 1.00 1.30 0.28
Biologic control
3.70 3.41 3.51 3.43 0.70
Pollutant 0.78 0.48 1.33 0.90 0.28
Erosion 3.94 3.91 4.14 3.98 0.75 Biodiversity 0.90 1.03 0.82 0.92 0.93
Pollutant 3.60 3.59 3.84 3.89 0.75 Habitat 1.27 0.57 1.23 1.07 0.28
Life 4.61 4.82 4.69 4.76 0.70 Fertility 1.24 2.12 1.39 1.59 0.54
Habitat 4.35 4.27 4.48 4.23 0.75 Education 1.20 0.67 1.20 0.94 0.81
Fertility 4.38 4.36 4.37 4.52 0.66 Tradition 0.61 0.17 0.34 0.30 0.20
Self-achievement
3.89 3.59 4.13 4.08 0.66
Traditional Knowledge
1.07 1.33 0.80 0.79 0.28
Social relations
3.56 3.95 3.44 3.61 0.75
Landscape 0.92 0.55 0.79 0.79 0.54
Traditional knowledge
4.42 3.95 4.43 4.45 0.66
Tourism recreation*
4.31 3.41 3.84 3.83 0.08
Education 4.17 4.14 4.03 3.92 0.85
Food quality 4.72 4.59 4.48 4.55 0.66
Aesthetic 4.21 4.09 4.29 4.21 0.90
SD: small-scale diversified farmers; O: medium-scale rainfed organic farmers; MI: medium-scale
intensive farmers; LI: large-scale intensive farmers

- 234 -
Table VII.3 presents the co-production of agrarian ecosystem service awareness of farmers in Itoiz-
Canal de Navarra region.
Table VII.3 Co-production awareness of ES
Co-production awareness Mean sd
Biological regulation 0.21978 0.414668
Pollutants 0.167582 0.374009
Aesthetic 0.142857 0.350409
Self-achievement 0.082418 0.275378
Fertility 0.07967 0.271155
Food quality 0.035714 0.185832
Tourism recreation 0.032967 0.178796
Social relations 0.013736 0.116554
Water flow 0.010989 0.104394
Education 0.010989 0.104394
Water quality 0.005495 0.074023
Habitat 0.005495 0.074023
Food 0.002747 0.052414
Raw materials 0.002747 0.052414
Life 0.002747 0.052414
Climate 0 0
Erosion prevention 0 0
Traditional knowledge 0 0
ES co-production awareness is calculated through the stated times mean over all the services valued
during the Likert scale discussions.
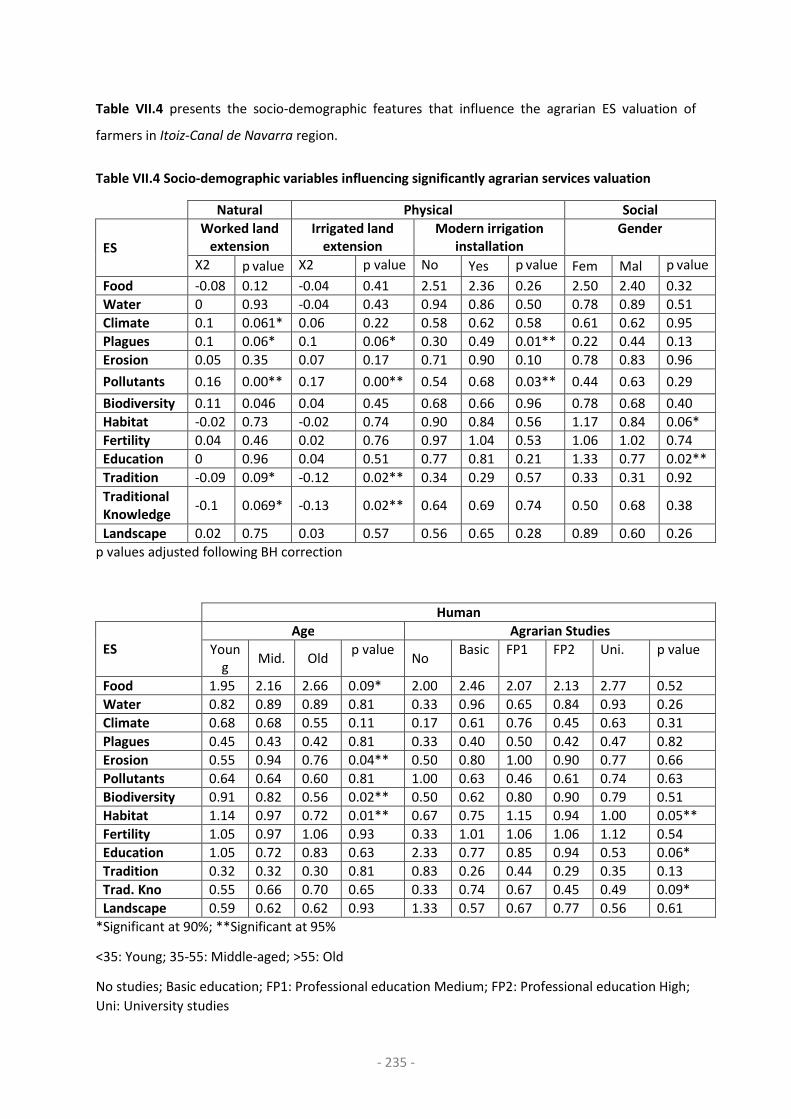
- 235 -
Table VII.4 presents the socio-demographic features that influence the agrarian ES valuation of
farmers in Itoiz-Canal de Navarra region.
Table VII.4 Socio-demographic variables influencing significantly agrarian services valuation
Natural Physical Social
ES
Worked land
extension
Irrigated land
extension
Modern irrigation
installation
Gender
X2 p value X2 p value No Yes p value Fem Mal p value
Food -0.08 0.12 -0.04 0.41 2.51 2.36 0.26 2.50 2.40 0.32
Water 0 0.93 -0.04 0.43 0.94 0.86 0.50 0.78 0.89 0.51
Climate 0.1 0.061* 0.06 0.22 0.58 0.62 0.58 0.61 0.62 0.95
Plagues 0.1 0.06* 0.1 0.06* 0.30 0.49 0.01** 0.22 0.44 0.13
Erosion 0.05 0.35 0.07 0.17 0.71 0.90 0.10 0.78 0.83 0.96
Pollutants 0.16 0.00** 0.17 0.00** 0.54 0.68 0.03** 0.44 0.63 0.29
Biodiversity 0.11 0.046 0.04 0.45 0.68 0.66 0.96 0.78 0.68 0.40
Habitat -0.02 0.73 -0.02 0.74 0.90 0.84 0.56 1.17 0.84 0.06*
Fertility 0.04 0.46 0.02 0.76 0.97 1.04 0.53 1.06 1.02 0.74
Education 0 0.96 0.04 0.51 0.77 0.81 0.21 1.33 0.77 0.02**
Tradition -0.09 0.09* -0.12 0.02** 0.34 0.29 0.57 0.33 0.31 0.92
Traditional
Knowledge -0.1 0.069* -0.13 0.02** 0.64 0.69 0.74 0.50 0.68 0.38
Landscape 0.02 0.75 0.03 0.57 0.56 0.65 0.28 0.89 0.60 0.26
p values adjusted following BH correction
Human
ES
Age Agrarian Studies
Young
Mid. Old p value
No Basic FP1 FP2 Uni. p value
Food 1.95 2.16 2.66 0.09* 2.00 2.46 2.07 2.13 2.77 0.52
Water 0.82 0.89 0.89 0.81 0.33 0.96 0.65 0.84 0.93 0.26
Climate 0.68 0.68 0.55 0.11 0.17 0.61 0.76 0.45 0.63 0.31
Plagues 0.45 0.43 0.42 0.81 0.33 0.40 0.50 0.42 0.47 0.82
Erosion 0.55 0.94 0.76 0.04** 0.50 0.80 1.00 0.90 0.77 0.66
Pollutants 0.64 0.64 0.60 0.81 1.00 0.63 0.46 0.61 0.74 0.63
Biodiversity 0.91 0.82 0.56 0.02** 0.50 0.62 0.80 0.90 0.79 0.51
Habitat 1.14 0.97 0.72 0.01** 0.67 0.75 1.15 0.94 1.00 0.05**
Fertility 1.05 0.97 1.06 0.93 0.33 1.01 1.06 1.06 1.12 0.54
Education 1.05 0.72 0.83 0.63 2.33 0.77 0.85 0.94 0.53 0.06*
Tradition 0.32 0.32 0.30 0.81 0.83 0.26 0.44 0.29 0.35 0.13
Trad. Kno 0.55 0.66 0.70 0.65 0.33 0.74 0.67 0.45 0.49 0.09*
Landscape 0.59 0.62 0.62 0.93 1.33 0.57 0.67 0.77 0.56 0.61
*Significant at 90%; **Significant at 95%
<35: Young; 35-55: Middle-aged; >55: Old
No studies; Basic education; FP1: Professional education Medium; FP2: Professional education High;
Uni: University studies

- 236 -
Figure VII.1 shows the valuation differences depending on the irrigated land areas farmers hold in
Itoiz-Canal de Navarra region.
Figure VII.1 Valuation differences regarding irrigated land areas (-0.13, min -0.17, max)
Figure VII.2 shows the valuation differences in regard to gender differences in Itoiz-Canal de Navarra
region.
Figure VII.2 Valuation differences in regard to gender differences
-0,15 -0,1 -0,05 0 0,05 0,1 0,15 0,2
Food
Water
Climate
Plagues*
Erosion
Pollutants**
Biodiversity
Habitat
Fertility
Educatio
Tradition**
T.Knowledge**
Landscape
X2
0 0,5 1 1,5 2 2,5 3
Food
Water
Climate
Plagues
Erosion
Pollutants
Biodiversity
Habitat*
Fertility
Education**
Tradition
T.Knowledge
Landscape
Male Female

- 237 -
Figure VII.3 shows the valuation differences in regard to age differences in Itoiz-Canal de Navarra
region.
Figure VII.3 Valuation differences in regard to age differences
0 0,5 1 1,5 2 2,5 3
Food*
Water
Climate
Plagues
Erosion**
Pollutants
Biodiversity**
Habitat**
Fertility
Education
Tradition
T.Knowledge
Landscape
Age Old (>55 years) Age Medium (35-55 years) Age Young (<35 years)
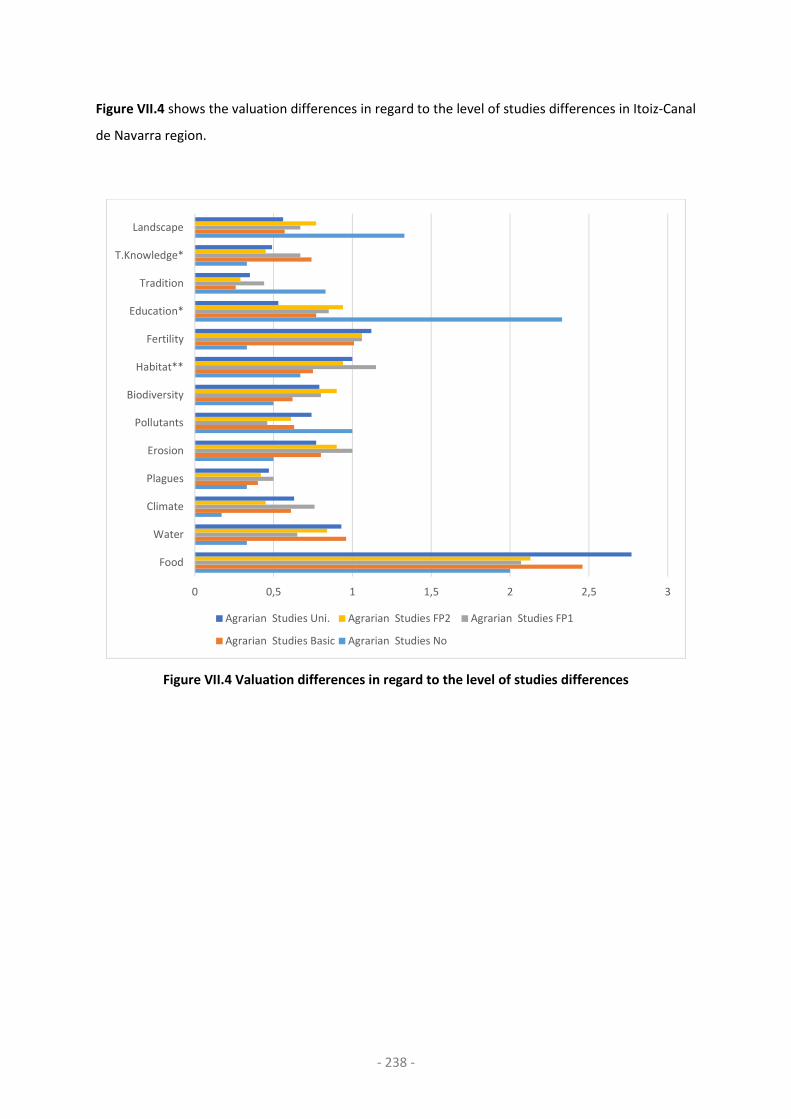
- 238 -
Figure VII.4 shows the valuation differences in regard to the level of studies differences in Itoiz-Canal
de Navarra region.
Figure VII.4 Valuation differences in regard to the level of studies differences
0 0,5 1 1,5 2 2,5 3
Food
Water
Climate
Plagues
Erosion
Pollutants
Biodiversity
Habitat**
Fertility
Education*
Tradition
T.Knowledge*
Landscape
Agrarian Studies Uni. Agrarian Studies FP2 Agrarian Studies FP1
Agrarian Studies Basic Agrarian Studies No
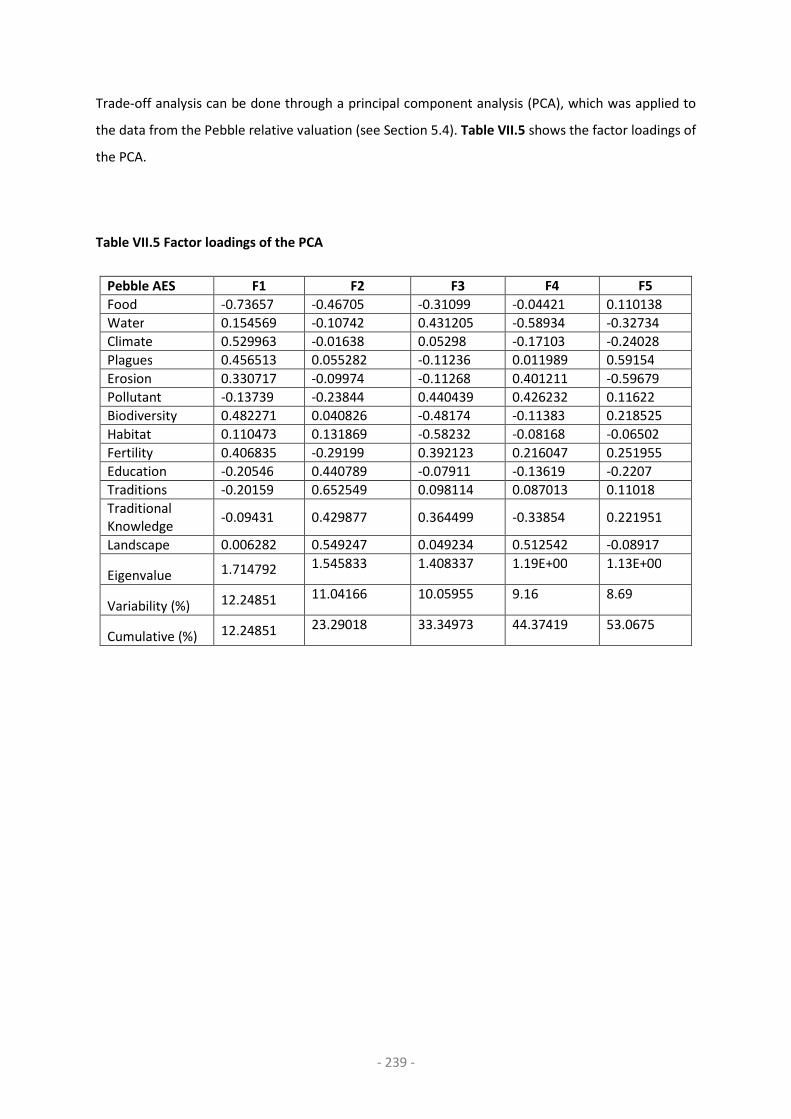
- 239 -
Trade-off analysis can be done through a principal component analysis (PCA), which was applied to
the data from the Pebble relative valuation (see Section 5.4). Table VII.5 shows the factor loadings of
the PCA.
Table VII.5 Factor loadings of the PCA
Pebble AES F1 F2 F3 F4 F5
Food -0.73657 -0.46705 -0.31099 -0.04421 0.110138
Water 0.154569 -0.10742 0.431205 -0.58934 -0.32734
Climate 0.529963 -0.01638 0.05298 -0.17103 -0.24028
Plagues 0.456513 0.055282 -0.11236 0.011989 0.59154
Erosion 0.330717 -0.09974 -0.11268 0.401211 -0.59679
Pollutant -0.13739 -0.23844 0.440439 0.426232 0.11622
Biodiversity 0.482271 0.040826 -0.48174 -0.11383 0.218525
Habitat 0.110473 0.131869 -0.58232 -0.08168 -0.06502
Fertility 0.406835 -0.29199 0.392123 0.216047 0.251955
Education -0.20546 0.440789 -0.07911 -0.13619 -0.2207
Traditions -0.20159 0.652549 0.098114 0.087013 0.11018
Traditional Knowledge
-0.09431 0.429877 0.364499 -0.33854 0.221951
Landscape 0.006282 0.549247 0.049234 0.512542 -0.08917
Eigenvalue 1.714792 1.545833 1.408337 1.19E+00 1.13E+00
Variability (%) 12.24851 11.04166 10.05955 9.16 8.69
Cumulative (%) 12.24851 23.29018 33.34973 44.37419 53.0675

- 240 -
VIII. Vulnerability analysis
Table VIII.1 shows in its first column the different stress factors and the shock farmers in Itoiz-Canal de Navarra region face. Second column refers to the
measure unit. Third column provides a definition of each stress factor and shock followed by a further definition in the fourth column; the potential
outcome for each livelihood in the sixth column and the references used are showed in the last column.
Table VIII.1 Exposure to climate variability and market prices volatility
Type of
stress
Unit of
meas.
Variable definition Definition Potential
outcome for
livelihood
Reference
Climate variability
Celsius Mean standard deviation of the daily average maximum T by month between 1925-2009
What changes imply for the distribution of inter-annual agricultural productivity changes in the distributions of temperature
Food/income insecurity
(Hahn et al., 2009; Ahmed et al., 2010)
Celsius Mean standard deviation of the daily average minimum T by month between 1925-2009
What changes imply for the distribution of inter-annual agricultural productivity changes in the distributions of temperature
Food/income insecurity
(Hahn et al., 2009; Ahmed et al., 2010)
Mm Mean standard deviation of the daily average precipitation by month between 1925-2009
What changes imply for the distribution of inter-annual agricultural productivity changes in the distributions of precipitation
Food/income insecurity
(Hahn et al., 2009; Ahmed et al., 2010)
Drought Mm Average number of drought in the last 10 years: Mean precipitation-ETP Potential of Thorntwaite
What changes imply for the distribution of inter-annual agricultural productivity changes in the distributions of hydric stress
Food/income insecurity Conflict over natural resources
(Hahn et al., 2009; Ahmed et al., 2010; Maru et al., 2014)
Prices volatility
Eur Mean standard deviation of the prices perceived by farmers for each crop (1995-2013) (sum of the STDEV of all the crops per farmer)
What changes imply for the distribution of inter-annual agricultural income changes in the distributions of prices
Income insecurity (O’Brien et al., 2004; Haile et al., 2013)

- 241 -
Table VIII.2 presents the variables, definition and how such variables mediate the intensity of climate related stressors as well as the references where
these ideas can be found.
Table VIII.2 Sensitivity and adaptive capacity to climate variability related stressors
Variable definition Unit of meas. Definition How it mediates the intensity of the stressor? Reference
Household members economically dependent (+)*
Ratio Number of incapable people who depend on the household
The effect of the climate hazard and consequent crop lost would be higher if more people is affected
(Hahn et al., 2009; Notenbaert et al., 2013; Ifejika Speranza et al., 2014)
Ha of grown crop sensitive to lack of precipitation (+)**
Ha Area of the most sensitive crop known in the area
The percentage of land that can be irrigated will suffer less from climate variability
(Ifejika Speranza et al., 2014)
Crop diversity (-) Number of crops
Number of different crops each farmers has
Number of different crops planted by a household make the household less sensitive since such crop will have different responses to hazards being variable their resistance to hazards
Hahn et al (2009) Eakin and Bojorquez-Tapia (2008)
* Confusion about who is an elder dependent and how many children are dependent when both parents worked
** Type of crops already account for this differences since they have different hydric necessities

- 242 -
Adaptive capacity
Variable Unit of
measurement Definition How the intensity of the
stressor is mediated
Reference
Human Education: Level of literacy (+)
0= No studies 1= Primary education 3= Secondary intermediate 4= Secondary up 5= University
An individual equipped with knowledge to respond to stressors and shocks
The level of education provides tools to react to climate hazards.
(Eakin and Bojórquez-Tapia, 2008; Hahn et al., 2009; Ifejika Speranza et al., 2014) (Notenbaert et al., 2013)
Education: Agrarian studies. (+)
No=0, Yes=1 An individual with a high level of knowledge about agricultural practices
This agrarian knowledge will better equip individuals against stressors and shocks
(Eakin and Bojórquez-Tapia, 2008; Ifejika Speranza et al., 2014) (Notenbaert et al., 2013)
Education: farming experience (+)
Ln(Years) Knowledge which provides a holistic perspective in response to stressors on farming
Experience in farming provides farmers with knowledge to react
(Ifejika Speranza et al., 2014)
Socio-
demogra
phic
Human workforce (+)
Number of relatives working in the farm
Human labour The higher the number, the higher the response
(Ifejika Speranza et al., 2014)(Notenbaert et al., 2013)
Female headed household (-)
0=F; 1=M Recognition of the negative role that gender plays on socio-political relations within the sector; females are more severely impacted by this inequality
In a female-lead household, she may encounter more obstacles in accessing information, thus able to react to stressors and shocks
(Hahn et al., 2009) (Notenbaert et al., 2013)
Age (-) Ln(Years) Age of the participant The older an individual, the less likely it is to develop adaptation strategies
(Eakin and Bojórquez-Tapia, 2008) (Notenbaert et al., 2013)
Financial Agrarian land ownership (+)
Percentage Percentage of land under legal right of possession
Ownership does not necessarily facilitate freedom of decision, the percentage
(Eakin and Bojórquez-Tapia, 2008)

- 243 -
Adaptive capacity
Variable Unit of
measurement Definition How the intensity of the
stressor is mediated
Reference
of owned land is also important for certain decisions
Rented agrarian land (-)
Percentage Percentage of rented land Renting land decreases decision capabilities
(Eakin and Bojórquez-Tapia, 2008)
CAP Subsidy access (+)
No=0, Yes=1 Communitarian Agrarian Policy subsides In the event of a climate hazard resulting in crop loss, extra income allows for replacement purchases appropriate for their livelihood practices
(Eakin and Bojórquez-Tapia, 2008)
Irrigation subsidy access (+)
No=0, Yes=1 Economic aid to promote irrigation Economic aid to ensure farms’ resistance to hazards
(Eakin and Bojórquez-Tapia, 2008)
Modernization subsidy access (+)
No=0, Yes=1 Economic aid to promote modernisation Economic aid to ensure farms’ resistance to hazards
(Eakin and Bojórquez-Tapia, 2008)
Integral agrarian insurance access (+)
No=0, Yes=1 Contracted coverage which protects the insured from financial loss from any meteorological hazard
Compensation in the event of a climate hazard
(Eakin and Bojórquez-Tapia, 2008)
Hail agrarian insurance (+)
No=0, Yes=1 Contracted coverage which protects the insured from financial loss from hail damage
Compensation in the event of hail
(Eakin and Bojórquez-Tapia, 2008)
Others agrarian insurance (+)
No=0, Yes=1 Contracted coverage which protects the insured from financial loss covering other risks affecting agricultural production
Compensation for other hazards
(Eakin and Bojórquez-Tapia, 2008)
Physical Percentage of the area of crops irrigated
No=0, Yes=1 Modern infrastructure for irrigation Competitive in terms of efficiency land management
(Eakin and Bojórquez-Tapia, 2008)
Social
networks Grade participation as cooperative member
0=No',1='Low',3='Medium',4='High
Cooperatives offer assistance with accessing subsidies, cheaper feed and
Integration within the cooperative provides
(Eakin and Bojórquez-Tapia, 2008; Ifejika Speranza et al., 2014)

- 244 -
Adaptive capacity
Variable Unit of
measurement Definition How the intensity of the
stressor is mediated
Reference
energy, crop commercialisation, management guidance, etc.
information and decision-making competence
(Notenbaert et al., 2013)
Grade participation as syndicate member
0=No',1='Low',3='Medium',4='High
Syndicates defend farmers and help with access to subsidies, etc.
Integration within the syndicate provides information and decision-making competence. This membership/participation in social networks can increase other assets (insurance, subsidies)
(Eakin and Bojórquez-Tapia, 2008; Ifejika Speranza et al., 2014) (Notenbaert et al., 2013)
Grade of information shared with friends or neighbours
0=No',1='Low',3='Medium',4='High
Recognition that an open communication with neighbours and friends facilitates response capacity and increases social cohesion
The more information shared, the higher adaptive capacity. Information and adaptive capacity are directly correlated
Speranza et al., 2014

- 245 -
Table VIII.3 presents the variables, definition and how such variables mediate the intensity of crop prices volatiliy effects over farmers’ vulnerability as well
as the references where these ideas can be found.
Table VIII.3 Sensitivity to crop prices volatility related stressors
Variable Unit of
meas.
Definition How it mediates the intensity of the stressor? Reference
Income diversification *
Yes / No Agriculture accounts for 100% of the expenses entering in the household
Those with a varied source of income are more financially protected against agricultural price volatility
Hahn et al (2009)
Household members economically dependent (+)
Ratio Number of individuals who are dependent on the household
The higher the amount of people are impacted by potential stressors and shocks, the more sensitive the household will be.
(Hahn et al., 2009; Ifejika Speranza et al., 2014; Notenbaert et al., 2013)
Crops diversification
Number of crops
Number of different crops hold by a household
The more diverse the crops, the less sensitive the farmers will be if one crop is negatively affected (price rate, climate stressors)
Hahn et al (2009) Eakin and Bojorquez-Tapia (2008)
Percentage of the crops directly sold
Percentage Percentage of the crops directly sold
When crops are directly commercialised (at local level), there is more stability, as international market fluctuations will only have indirect effects
(Isakson, 2014)
Contract with agro-industry **
Yes / No Contract with agro-industry Comparative advantage to other farmers; having the contracts and rights to grow and market particular vegetables
*Percentage of income unknown **We did not account for the area under contract

- 246 -
Adaptive capacity
Variable Unit of measurement Definition How the intensity of the
stressor is mediated
Reference
Human Education: Level of literacy
0= No studies 1= Primary education 3= Secondary intermediate 4= Secondary up 5= University
An individual with the knowledge to anticipate price volatility and crop suitability
Education level provides tools to better react against price volatility
(Eakin and Bojórquez-Tapia, 2008; Ifejika Speranza et al., 2014) (Notenbaert et al., 2013)
Education: farming experience
Ln(Years) Set of knowledge that provides a holistic perspective in response to farming stressors
Farming experience provides knowledge to react
(Ifejika Speranza et al., 2014)
Socio-
demogra
phic
Female headed household
0=F; 1=M Recognition of the negative role that gender plays on socio-political relations within the sector; females are more severely impacted by this inequality
In a female-lead household, she may encounter more obstacles in accessing information, thus able to react to stressors and shocks
(Hahn et al., 2009) (Notenbaert et al., 2013)
Age (-) Ln(Years) Age of the participant The older you are, less likely it is that you will be able to develop adaptation strategies
(Eakin and Bojórquez-Tapia, 2008) (Notenbaert et al., 2013)
Financial Owned agrarian land
Percentage Percentage of land under legal right of possession
Being owner facilitates freedom for decision
(Eakin and Bojórquez-Tapia, 2008)
Rented agrarian land (-)
Percentage Percentage of rented land Renting land decrease freedom for decision
(Eakin and Bojórquez-Tapia, 2008)
CAP Subsidy access Yes / No Communitarian Agrarian Policy subsides
If there is a climate hazard and they lose their crops their have an extra income entrance to buy new seeds or whatever strategy they follow
(Eakin and Bojórquez-Tapia, 2008)

- 247 -
Adaptive capacity
Variable Unit of measurement Definition How the intensity of the
stressor is mediated
Reference
Irrigation subsidy Yes / No Economic aid directed to irrigation promotion
They have economic aid to make their farm more resistant to hazards
(Eakin and Bojórquez-Tapia, 2008)
Modernization subsidy
Yes / No Economic aid directed to modernization promotion
They have economic aid to make their farm more resistant to hazards
(Eakin and Bojórquez-Tapia, 2008)
Social
networks
Grade participation as cooperative member
0= None; 1= Very low; 2= Low; 3=Medium; 4=High; 5=Very high
Cooperatives help on accessing subsidies, cheaper feed and energy, commercialize crops, management guiding etc.
The more integrated in the cooperative the more power to decide and be informed
(Eakin and Bojórquez-Tapia, 2008; Ifejika Speranza et al., 2014) (Notenbaert et al., 2013)
Grade participation as syndicate member
0= None; 1= Very low; 2= Low; 3=Medium; 4=High; 5=Very high
Syndicates defend farmers and help on access to subsidies etc.
The more integrated in the cooperative the more power to decide and be informed
(Eakin and Bojórquez-Tapia, 2008; Ifejika Speranza et al., 2014) (Notenbaert et al., 2013)
Grade of information shared with friends or neighbours
0= None; 1= Very low; 2= Low; 3=Medium; 4=High; 5=Very high
Recognition that an open communication with neighbours and friends facilitates response capacity and increase social cohesion
The more information shared, the higher adaptive capacity
Speranza et al., 2014

- 248 -
Table VIII.4 presents Chapter 6 results regarding the sub-components, components and overall VI to climate variability and drought.
Table VIII.4 Sub-components, major components and overall VI to climate variability and drought
Small-scale
diversified
farmers (SDi)
Medium-scale
rainfed organic
farmers (MRO)
Medium-scale
intensive
farmers (MI)
Large-scale
intensive farmers
(LI)
All
livelih
oods
All
livelih
oods
Major comp. Sub-components mean Major
comp. mean
Major
comp. mean
Major
comp. mean
Major
comp. Max. Min.
Sensitivity Family member economic dependent (number of people)
0.77 1.64 1.57 1.06 8.00 0.00
Crops diversity (inverse of number of different crops per farmers)
0.44 0.13 0.41 0.16 0.42 0.17 0.36 0.12 1.00 0.20
Area of land under maize (hectares) 0.52 10.68 33.16 27.81 1100 0.00
Human assets Studies (0=no; 1=yes) 0.97 1.00 1.00 0.98 1.00 0.00 Agrarian studies (0=no; 1=yes) 0.10 0.56 0.18 0.59 0.22 0.62 0.18 0.61 1.00 0.00
Work experience (1= 0-5 years), (2= 5-15 years), (3= 16-30 years), (4= 30-50years), (5 >50years)
3.43 3.33 3.52 3.71 5.00 1.00
Age91 (1)<35); (2=35-55 (3 >55 years) 4.08 3.94 3.91 4.02 4.51 3.09
Socio-demographic characteristics
Number of family member working other than the head of the household (number of people)
0.39 0.58 0.14 0.54 0.40 0.55 0.36 0.57 4.00 0.00
Gender (0=female; 1=male) 0.90 1.00 0.99 0.96 1.00 0.00
Access to CAP aid (0=no; 1=yes) 0.70 0.91 0.93 0.94 1.00 0.00
Access to modernisation subsidy (0=no; 1=yes)
0.11 0.52 0.40 0.38 1.00 0.00
91 Expressed as natural logarithm (ln) of the value.

- 249 -
Small-scale
diversified
farmers (SDi)
Medium-scale
rainfed organic
farmers (MRO)
Medium-scale
intensive
farmers (MI)
Large-scale
intensive farmers
(LI)
All
livelih
oods
All
livelih
oods
Major comp. Sub-components mean Major
comp. mean
Major
comp. mean
Major
comp. mean
Major
comp. Max. Min.
Access to irrigation subsidy (0=no; 1=yes)
0.19 0.71 0.68 0.60 1.00 0.00
Access to CUMA92 subsidy (0=no; 1=yes)
0.00 0.05 0.11 0.06 1.00 0.00
Financial assets
Access to integral Insurance (0=no; 1=yes)
0.17 0.18 0.41 0.36 0.53 0.38 0.43 0.34 1.00 0.00
Access to hail Insurance (0=no; 1=yes) 0.28 0.41 0.60 0.52 1.00 0.00
Access to other insurance (0=no; 1=yes)
0.05 0.14 0.19 0.13 1.00 0.00
Percentage of owned land (0=no; 1=yes)
0.68 0.84 0.41 0.97 66.67 0.00
Percentage of rented land (0=no; 1=yes)
0.18 1.85 0.46 0.44 30.00 0.00
Physical assets Internet Use (0=no; 1=yes) 0.39 0.40 0.62 0.70 0.76 0.80 0.56 0.64 1.00 0.00
Modern irrigation installation (0=no; 1=yes)
0.40 0.77 0.84 0.73 1.00 0.00
Information shared with neighbours (0=no; 1=yes)
0.88 1.00 0.97 0.91 1.00 0.00
Social assets Cooperative membership (0=no; 1=yes) 0.79 0.66 0.86 0.83 0.93 0.90 0.90 0.83 1.00 0.00 Syndicate membership (0=no; 1=yes) 0.32 0.64 0.79 0.68 1.00 0.00
Mean standard deviation of the daily average maximum Temp by month (ºC)
6.88 6.74 6.68 7.20 7.80 5.02
Climate variability
Mean standard deviation of the daily average minimum Temp by month (ºC)
5.01 0.65 4.92 0.62 4.82 0.61 5.08 0.56 5.38 3.32
92 Spanish acronym for ‘Cooperativas de utilización de maquinaria agrícola’ which means cooperatives to share agrarian machinery.

- 250 -
Small-scale
diversified
farmers (SDi)
Medium-scale
rainfed organic
farmers (MRO)
Medium-scale
intensive
farmers (MI)
Large-scale
intensive farmers
(LI)
All
livelih
oods
All
livelih
oods
Major comp. Sub-components mean Major
comp. mean
Major
comp. mean
Major
comp. mean
Major
comp. Max. Min.
Mean standard deviation of the daily average precipitation by month (mm)
131.0 131.1 131.6 119.8 147.20 108.10
Drought Hydric deficit (mm) -223.0 -223.3 -219.8 -268.5 -126.3 -325.6
VI_climate 0.53 0.43 0.40 0.42
Table VIII.5 presents Chapter 6 results regarding the sub-components, components and overall VI to price volatility.
Table VIII.5 Sub-components, major components, and overall VI to price volatility
Small-scale
diversified Organic Intensive
Large-scale
intensive
All
livelihoods
All
livelihoods
Major comp. Sub-components mean Major
comp. mean
Major
comp. mean
Major
comp. mean
Major
comp. Max. Min.
Livelihood strategies
Unique income 0.33
0.44
0.36
0.46
0.48
0.48
0.46
0.43
2.00 0.00
Family member economic dependent 0.77 1.64 1.57 1.06 8.00 0.00
Crops diversity 0.44 0.41 0.42 0.36 1.00 0.20
Direct Sell. 0.78 0.77 0.89 0.82 1.00 0.01
Agro industry Work 0.97 0.95 0.90 0.90 1.00 0.50
Human
Studies 0.97 0.79
1.00 0.80
1.00 0.81
0.98 0.83
1.00 0.00
Work experience 3.43 3.33 3.52 3.71 1.00 0.00
Socio-demographic
Age93 4.08 0.80
3.94 0.80
3.91 0.78
4.02 0.81
4.51 3.09
Gender 0.90 1.00 0.99 0.96 1.00 0.00
Financial PAC 0.70 0.18 0.91 0.38 0.93 0.35 0.94 0.33 1.00 0.00
93 Log age.

- 251 -
Small-scale
diversified Organic Intensive
Large-scale
intensive
All
livelihoods
All
livelihoods
Major comp. Sub-components mean Major
comp. mean
Major
comp. mean
Major
comp. mean
Major
comp. Max. Min.
Modernisation subsidy 0.11 0.52 0.40 0.38 1.00 0.00
Irrigation subsidy 0.19 0.71 0.68 0.60 1.00 0.00
CUMA subsidy 0.00 0.05 0.11 0.06 1.00 0.00
Percentage of owned land 0.68 0.84 0.41 0.97 66.67 0.00
Percentage of rented land 0.18 1.85 0.46 0.44 30.00 0.00
Physical Internet Use 0.39 0.39 0.62 0.62 0.76 0.76 0.56 0.56 1.00 0.00
Social
Information shared with neighbours 0.88 1.00 0.97 0.91 1.00 0.00
Cooperative membership 0.79 0.66 0.86 0.83 0.93 0.90 0.90 0.83 1.00 0.00
Syndicate membership 0.32 0.64 0.79 0.68 1.00 0.00
Price volatility Exposure to price volatility 39.27 0.01 133.45 0.02 402.13 0.07 279.59 0.05 5721.71 0.00
VI_prices 0.46 0.36 0.36 0.38

- 252 -
Table VIII.6 and Table VIII.7 present Chapter 6 results regarding the sub-components, components and overall VI to climate variability and drought and crop
prices volatility respectively after a standardisation process. I calculated the inverse of these variables when calculating the 7-component based VI since they
counteract vulnerability. The original values, however, were used for the VI index calculation when aggregated in three components, since adaptive capacity
is already included in the formula as a subtraction.
Table VIII.6 Indexed sub-components, major components, and overall VI to climate variability and drought
Vulnerability climate variability
Sub-component SDi Major
Comp MRO
Major
Comp MI
Major
Comp LMI
Major
Comp
Family members economic dependent 0.10
0.13
0.20
0.16
0.20
0.17
0.13
0.12 Crops diversification (inverse) 0.30 0.27 0.28 0.21
Ha of irrigated maize 0.00 0.01 0.03 0.03
Studies 0.97
0.56
1.00
0.59
1.00
0.62
0.98
0.61 Agrarian studies 0.10 0.18 0.22 0.18
Working experience 0.61 0.58 0.63 0.68
Age (log) 0.70
0.58
0.60
0.54
0.57
0.55
0.65
0.57 Family members working in the sector 0.10 0.03 0.10 0.09
Gender 0.90 1.00 0.99 0.96
PAC subsidy 0.70
0.18
0.91
0.36
0.94
0.38
0.93
0.34
Modernisation subsidy 0.11 0.52 0.38 0.40
Irrigation subsidy 0.19 0.71 0.68 0.60
CUMA subsidy 0.00 0.05 0.11 0.06
Integral Insurance 0.17 0.41 0.53 0.43
Hail Insurance 0.28 0.41 0.60 0.52
Other Insurance 0.05 0.14 0.19 0.13
Percentage of owned land 0.01 0.01 0.01 0.01
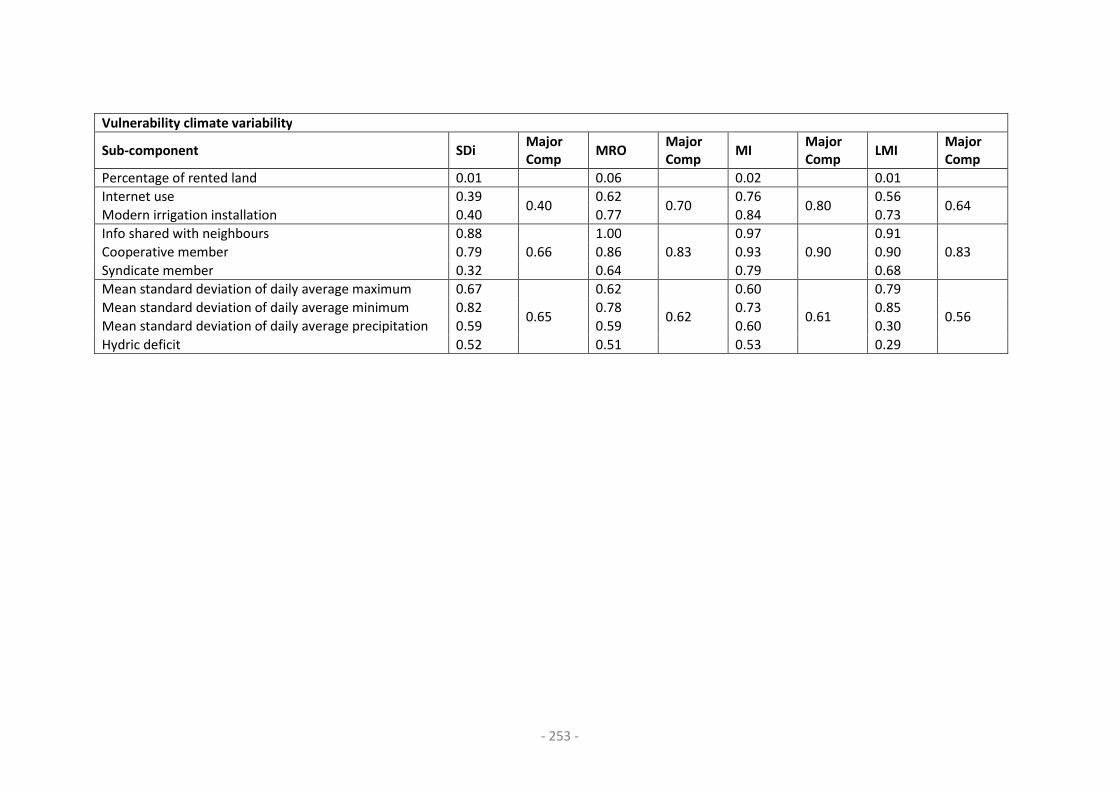
- 253 -
Vulnerability climate variability
Sub-component SDi Major
Comp MRO
Major
Comp MI
Major
Comp LMI
Major
Comp
Percentage of rented land 0.01 0.06 0.02 0.01
Internet use 0.39 0.40
0.62 0.70
0.76 0.80
0.56 0.64
Modern irrigation installation 0.40 0.77 0.84 0.73
Info shared with neighbours 0.88
0.66
1.00
0.83
0.97
0.90
0.91
0.83 Cooperative member 0.79 0.86 0.93 0.90
Syndicate member 0.32 0.64 0.79 0.68
Mean standard deviation of daily average maximum 0.67
0.65
0.62
0.62
0.60
0.61
0.79
0.56 Mean standard deviation of daily average minimum 0.82 0.78 0.73 0.85
Mean standard deviation of daily average precipitation 0.59 0.59 0.60 0.30
Hydric deficit 0.52 0.51 0.53 0.29

- 254 -
Table VIII.7 Indexed sub-components, major components, and overall VI to price volatility
Vulnerability price volatility
Sub-component SDi Major
Comp MRO
Major
Comp MI
Major Comp LMI Major Comp
Unique income 0.16
0.44
0.36
0.46
0.23
0.48
0.24
0.43
Family members economic dependent 0.26 0.33 0.18 0.20
Crops diversification (inverse) 0.25 0.27 0.21 0.23
Direct Sell (inverse) 0.78 0.77 0.82 0.89
Agro-industry work (inverse) 0.95 0.91 0.80 0.80
Studies 0.97 0.79
1.00 0.80
0.98 0.82
1.00 0.83
Working experience 0.61 0.44 0.68 0.63
Age (log) 0.66 0.80
0.44 0.80
0.68 0.78
0.56 0.81
Gender 0.90 1.00 0.96 0.99
PAC subsidy 0.70
0.18
0.91
0.38
0.94
0.35
0.93
0.33
Modernisation subsidy 0.11 0.52 0.38 0.40
Irrigation subsidy 0.19 0.71 0.60 0.68
CUMA subsidy 0.00 0.05 0.06 0.11
Percentage of owned land 0.35 0.09 0.01 0.19
Percentage of rented land 0.18 0.06 0.37 0.21
Internet use 0.39 0.39 0.62 0.62 0.56 0.75 0.76 0.56
Info shared with neighbours 0.88
0.66
1.00
0.83
0.91
0.90
0.97
0.83 Cooperative member 0.79 0.86 0.90 0.93
Syndicate member 0.32 0.64 0.68 0.79
Sum of all crops price volatility 0.06 0.01 0.30 0.02 0.05 0.07 0.15 0.05

- 255 -
IX. Focus group template
Introduction94
Thank you very much for your cooperation. I am sure each of you has much to contribute to this
workshop and hopefully we can have a discussion in which we can learn from each other.
Joining me today is Imanol Okiñena, a master student and collaborator in the centre where I
work, and Begoña Renteria, a social worker and friend.
The objective for the discussion is to better understand the access to irrigation water. To do this,
I am interested in the different viewpoints and perspectives regarding the modernisation of
irrigation in Miranda de Arga by analysing the comparison of traditional and modern irrigation.
There are rules for the discussion. It is very important to be respectful of taking turns in speaking
and adhering to the objectives of the workshop. It is particularly essential to maintain
compliance with all participants. Please, let us maintain an environment of respect to everyone
throughout the debate.
I would appreciate if each participant can take approximately two minutes to introduce
themselves and state the reason that each person is here today.
Thank you again for contributing.
Traditional and modern system characterisation
The first exercise consists of characterising each irrigation system. Please write down a brief
description on the provided card focusing on the given categories:
• Monitoring, surveillance and penalties regarding the proper management of irrigation water.
How is this influenced/will influence the behaviour of users/biophysical conditions and its effect
on irrigation farmer relations (cooperation, dependency).
• Is the distribution of benefits and cost (rights and duties) properly balanced between irrigation
farmers and/or external actors (concessionary company, Navarre Government, etc.)?
• Water consumption (efficiency and effectiveness of the irrigation system)
• Prices (commodification of land and water)
94 All the interviews were conducted in Spanish. Here, the questions are translated to English. If anyone wishes to view the original versions, they are available via the author.

- 256 -
• Community, insurance-related subsidies that may potentially favour some groups
• Others
Each participant will fill out their cards and place them with the corresponding topics, in the
panles of traditional and modern irrigation systems. We will compare both irrigation systems.
Finally, a brief descriptive summary will be made, followed by the debate.
Advantages and disadvantages of both modern and traditional systems
Now we will discuss some advantages and disadvantages of both systems. Respective to the
topics from the previous exercise, we will examine a few related variables: social, economic,
environmental, cultural and political aspects (empowerment, disempowerment).
In the following panel we will document the advantages and disadvantages of the ideas
discussed in the previous exercise. We must specify what kind of benefits they are (economic,
environmental, etc.) and which group (among the different types of farmers) is either positively
or negatively affected. Advantages and disadvantages may be related to three different types of
farmers95, which are representative of the different livelihoods in Itoiz-Canal de Navarra zone.
Everyone has 10 min to think and then participants will stand up to draw up your ideas
(represented by cards and placed at each point you want to discuss.
Break
Summary of the debate
Discussion focus on the effect of the advantages and disadvantages among the plurality of actors
involved: smallholders, intensive farmers, organic farmers.
95 I did not distinguish between large-scale and medium-scale intensive farmers and both were discussed as belonging to the same group.

- 257 -
List of participants and brief description
Here are the profiles of the focus group participants who were involved.
Name Profile
FG.1 Jesús Mari Isturiz Técnico de INTIA: technician in charge of the ‘concentración
parcelaria’
FG.2 Azucena Zabaleta Land-holder in favour of traditional irrigation
FG.3 Mónica Cárcar Miranda de Arga neighbour, sustainable fluvial manager and
member of the foundation Nueva Cultura del Agua
FG.4 Luis Mari Ibañez Miranda de Arga intensive farmer
FG.5 Vitorio Tápiz Miranda de Arga organic farmer
Note: This focus group was conducted in June 2015 in Miranda de Arga
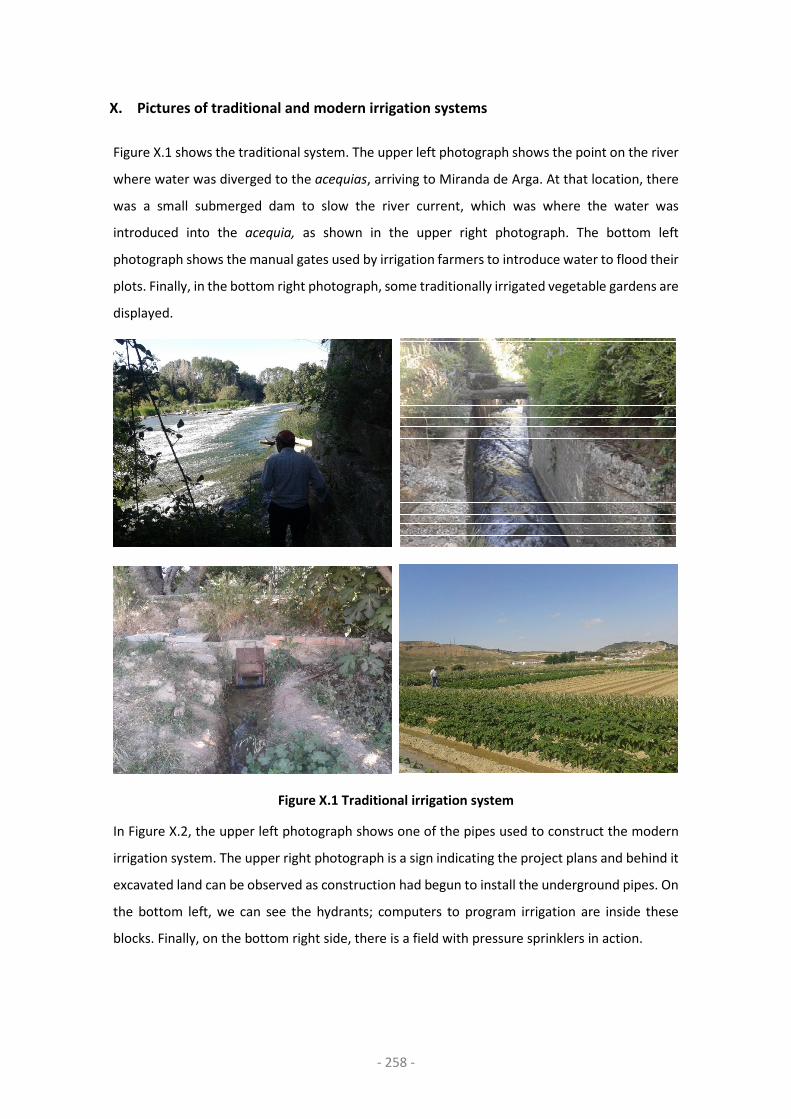
- 258 -
X. Pictures of traditional and modern irrigation systems
Figure X.1 shows the traditional system. The upper left photograph shows the point on the river
where water was diverged to the acequias, arriving to Miranda de Arga. At that location, there
was a small submerged dam to slow the river current, which was where the water was
introduced into the acequia, as shown in the upper right photograph. The bottom left
photograph shows the manual gates used by irrigation farmers to introduce water to flood their
plots. Finally, in the bottom right photograph, some traditionally irrigated vegetable gardens are
displayed.
Figure X.1 Traditional irrigation system
In Figure X.2, the upper left photograph shows one of the pipes used to construct the modern
irrigation system. The upper right photograph is a sign indicating the project plans and behind it
excavated land can be observed as construction had begun to install the underground pipes. On
the bottom left, we can see the hydrants; computers to program irrigation are inside these
blocks. Finally, on the bottom right side, there is a field with pressure sprinklers in action.

- 259 -
Figure X.2 Modern irrigation system

- 260 -
XI. Glossary
Technical terms
General
Soil
Natural tri-dimensional body which is part of an ecosystem (Porta et al., 2003). It is studied
through the soil profile which consists of a vertical cut of the land that permits the study of the
soil as whole –i.e. from surface to original matter. Soil is generally used to refer to soil sampling
for ecological indicators such as regulating services (e.g. water, climate and pests) and
supporting services (e.g. biodiversity). ‘Soil science’ discipline is typically used at this scale.
Land
Earths’ surface –i.e. a bi-dimensional body. Stakeholders, during the fieldwork for empirical data
collection, refer to ‘land’ as the surface where they labour.
Agrarian ecosystem
It covers the interaction of multiple scales (e.g. dead leaves, land surface and soil characteristics
at different horizon levels) and organisms of several size and complexity are included at those
scales, from microscopic to human. It is typically used when referring to larger scales (e.g.
landscape) and ‘geomorphology’ and ‘ecology’ disciplines, among others.
Agricultural area
The sum arable land, permanent crops, and permanent pastures (FAO, 2015b).
Arable land
The land under temporary agricultural crops (multiple-cropped areas are counted only once),
temporary meadows for mowing or pasture, land under market and kitchen gardens and land
temporarily fallow (less than five years). The abandoned land resulting from shifting cultivation
is not included in this category. Data for arable land are not meant to indicate the amount of
land that is potentially cultivable (FAO, 2015b).
Biofuel production (thousand kt of oil eq.)
Fuel that is produced through biological processes, including agriculture. They can be derived
directly from plants, or indirectly from agricultural, commercial, domestic, and/or industrial
wastes (FAO, 2015b).
Irrigated systems (Area equipped for irrigation)
Area equipped to provide water (via irrigation) to crops. It includes areas equipped for
full/partial control irrigation, equipped lowland areas, and areas equipped for spate irrigation
(FAO, 2015b).
Irrigated Area (%)
Percent of area equipped for irrigation that is actually irrigated in any given year, expressed in a
percentage. Irrigated land that is cultivated more than once a year is counted only once (FAO,
2015b).

- 261 -
Price volatility
Measure of the volatility in the relative price of food in a country. The indicator is calculated
from the monthly domestic food price level index using monthly consumer and general food
price indices and purchasing power parity data from the International Comparison Program
conducted by the World Bank (see the Relative Price of Food Indicator for more information).
Month-to-month growth rates are calculated, and the standard deviation of these growth rates
are calculated over the previous eight months (Eight month rolling standard deviation) (FAO,
2015b).
Fertilisers (kg/ha)
Inorganic form of the three types of fertilisers: nitrogen (N), phosphate (P205), potash (K2O) and
including complex fertilisers (NP, PK, NK and NPK) (FAO, 2015b).
Organic fertilisers
Derived from animals, plants and compost (FAO, 2015b).
Mineral fertilisers
Available for farmers in solid or liquid form, and are delivered to the farm either in bulk, in bags
or in pressurised containers (FAO, 2015b).
Pesticides
Insecticides, fungicides, herbicides, disinfectants and any substance or mixture of substances
intended for preventing, destroying or controlling any pest; including vectors of human or
animal disease, unwanted species of plants or animals causing harm during or otherwise
interfering with the production, processing, storage, transport or marketing of food, agricultural
commodities, wood and wood products or animal feedstuffs, or substances which may be
administered to animals for the control of insects, arachnids or other pests in or on their bodies
(FAO, 2015b).
Wheat
Triticum spp.: common (T. aestivum) durum (T. durum) spelt (T. spelta). Common and durum
wheat are the main types. Among common wheat, the main varieties are spring and winter,
hard and soft, and red and white (FAO, 2015b).
Value added from agriculture (% GDP)
Agriculture corresponds to ISIC divisions 1-5 and includes forestry, hunting, and fishing, as well
as cultivation of crops and livestock production. Value added is the net output of a sector after
adding up all outputs and subtracting intermediate inputs. It is calculated without making
deductions for depreciation of fabricated assets or depletion and degradation of natural
resources. The origin of value added is determined by the International Standard Industrial
Classification (ISIC), revision 3 (FAO, 2015b).
The agro-industrial model,
A model upheld and reinforced by an alliance of agricultural economists and biological scientists
who are still legitimating the intensification and scale economies imported from the American
and Australasian modernisation project (see Drummond et al., 2000) (Marsden et al., 2002).

- 262 -
The post-productivist model
A model, alternatively, associated with the social geographers and planners' concerns of rural
capacity and with the regulatory mechanisms needed for dealing with the ‘consumption
countryside’ (see Lowe et al., 1997) (Marsden et al., 2002).
The rural development dynamic,
Although originated among the largely ‘bottom-up' initiatives associated with the integration
and empowerment of ‘peripheral’ rural communities, is now a much broader and more diffuse
agrarian model. It is one which may be able to recentre the significance of agricultural practices
and social ecology (see Light, 1999). It holds the potential to reignite the social and
environmental role of agriculture as a major agent in the sustainment of rural economy and
culture (Marsden et al., 2002).
Modernisation paradigm,
Still the dominant agrarian model, consists of intensification through mechanisation,
fertilisers, pesticides and water consumption, but due to its associated environmental
damage, this paradigm evolved in the 1990s, into sustainable intensification and/or smart
climate agriculture.
Sustainable intensification
Model based on higher yields at the aggregate level with fewer negative impacts (Tilman et
al., 2011; Godfray and Garnet, 2014). However, the latter model has also been disputed
from several standpoints regarding whether those aims were balanced or not. Concerns
about whether it distracts attention from non-production sides; whether it is still part of the
productivist agenda, as well as whether it suggests ecosystems substitution (Godfray and
Garnet, 2014).
Rural development paradigm
Model that appears simultaneously in the 1990s but with a very different approach (Van der
Ploeg et al., 2000). It encompass rural residents, not only full time farmers and it ecompasses
shorter food chains and high quality products and aims of landscape and ES conservation
among other goals. These different pathways are already occurring. Their sustainability
however, will partly depend on the support and assistance from state policy (Marsden et
al., 2002).
ES for human wellbeing: perceptions and valuations
ES
Benefits that ecosystems provide to people (Viglizzo et al., 2011).
Ecosystem functions
Intermediate processes necessary to deliver a service which is known as the final benefit
provided to humans (Fu et al., 2010).
Management

- 263 -
Interphase between human and ecological systems through which humans influence and are
influenced by ecosystems (McMichael et al., 2005).
Intensification
Management practices used to increase yield per surface and time. Intensification typically
incorporates intensive tillage regimes, increased application of fertilisers, irrigation when
necessary (Baldock et al., 2000) and reductions in crop diversity both in time and space
(landscape) (Matson et al., 1997).
The Millennium Ecosystem Assessment (MEA, 2005),
A four-year study involving more than 1,300 scientists worldwide. These scientists developed ES
classifications through proxies to understand the multiple services ecosystems can offer.
Indirect service
Cognition process required due to the fact that many services (e.g. nutrients cycling) are not
intuitively perceived by humans as other services, such as food provisioning (Daniel et al.,
2012a).
Co-production
The influence of farmers’ labour on the delivery of agrarian ES (Seppelt et al., 2011).
Di-services
Negative effects of co-production, such as soil erosion, salinity and loss of water quality (Power,
2010; Bacon et al., 2011) .
Double-counting
Term originally used in economics to refer to the erroneous practice of counting a value more
than once (Fu et al., 2010).
Self-fulfilment
Fulfilment of one's hopes, dreams, goals, etc. Here this service is understood as the energy that
land ecosystem provides farmers through their labour, and allows them to feel good through a
metaphysical force and/or identity connected strength.
Recreation and tourism
Cultural services that provides many benefits such as physical exercise, aesthetic experiences,
intellectual stimulation, inspiration and other values connected to psychological wellbeing.
Local ecological knowledge
Cultural services transferred over generations and regenerated through practical engagements
with ecological components (Kitayama and Markus, 2000).
Social relations
Human relationships that are organised and maintained by cultural practices and common
understanding of a community (Kitayama and Markus, 2000).
Cultural heritage service,
- 264 -
Legacy of biophysical features, physical artefacts, and intangible attributes of a group or society
inherited from previous generations, maintained in the present and given for the benefit of
future generations (Daniel et al., 2012a).
Material benefits
Tangible products of ecosystems;
Aesthetic benefit
Cultural benefits related to beauty or appreciation of beauty;
Place/heritage benefit
Cultural benefits associated to the meaning or importance associated with a location;
Activity benefit
The intangible benefit associated with action (labouring);
Spiritual benefit
Cultural benefit related to metaphysical forces that exist beyond the individual;
Knowledge benefit
Cultural benefit that concerns theoretical and practical information and skills;
Existence/bequest benefits
Intangible non-use benefits associated to knowing that something exists or the satisfaction of
preserving for future generations;
Option benefit
Cultural benefit that applies to the predicted benefit of future use;
Social capital benefit
Cultural benefit that signifies the contribution to enhance relationships among people;
Identity benefit
Ideas, relationships and sense of belonging that shape people;
Employment
Contribution to work that provides monetary income.
Human wellbeing (HWB)
Positive physical, social and mental state of a person (Collins English Dictionary, 2015; MEA,
2005b). More specifically, the MEA (2005) defines wellbeing as a multivariate state comprising
of five dimensions: basic material for a good life, health, security, good social relations, and
freedom of choice and action.
The security dimension
Secure access to natural and other resources, personal safety, and security from natural and
human-made disasters (MEA, 2005).
- 265 -
Human security
Latest of a long line of neologisms; including common security, global security, cooperative
security, and comprehensive security that encourage policymakers and scholars to think about
international security as something more than military defence of state interests and territory.
Although definitions vary, most formulations emphasise the welfare of ordinary people (Paris,
2001).
Solastalgia
Distress caused by environmental change, such as mining or climate change.
Topophilia,
Someone’s affection to hometown, which often becomes mixed with the sense of cultural
identity among certain peoples and a love of certain aspects of such a place.
Affection and respect,
Someone’s sense of belonging to a given environment.
Freedom of choice and action
Ability of individuals to control what happens to them and to be able to achieve what they value
doing or being.
Valuation
Process of assigning a value to a particular action or object (Farber et al., 2002).
Interest conflict
When the concerned parties have the same understanding of an issue and there is a common
set of values involved (Vatn, 2007).
Value conflict,
When the parties involved do not agree on the basic understanding of the issue discussed, what
values are at risk and which should be given priority (Vatn, 2007).
Use values
Direct consumptive use assets such as the value of timber, fish or other resources that
ecosystems provide, and direct, non-consumptive use values such as those related to recreation
and aesthetic appreciation.
Indirect-use values
Services provided by nature, such as air and water purification, erosion prevention and
pollination of crops.
Non-use value
Importance attributed to an aspect of the environment in addition to, or irrespective of its use
value.
Option value
- 266 -
Value we place on maintaining the option to use ES in the future, either within our own lifetime,
or for future generations (the latter is referred to as ‘bequest value’).
Commodity
Exchangeable unit of economic wealth (‘Definition of ‘commodity’ | Collins English Dictionary,’
n.d.).
Livelihood strategies
Reactive,
Response to a stimulus, i.e. coping with stressors and shocks (Chambers and Conway, 1992).
Proactive,
Enhancing and exercising capabilities in adapting to, exploiting and creating change, and in
assuring continuity (Chambers and Conway, 1992).
Agency
Autonomous and purposive actor—which is attributed solely to humans (Dwiartama and Rosin,
2014). Whereas personal agency comes from everyday decision-making processes, political
agency entails the ability of humans (individuals or collectives) to affect social processes. Agency
goes beyond pure intentionality, and is reliant to some extent on the actor’s relationality to the
material components of society.
Vulnerability
Vulnerability
Propensity or predisposition to be adversely affected by a stressor (e.g. climate change) (IPCC,
2014).
Sensitivity
Degree to which a system is affected by or responsive to climate stimuli (IPCC, 2001, p. 894).
Socio-ecological sensitivity
Degree to which the socio-ecological is affected by or responsive to a/or multiple stressors. In
this dissertation, it is measured by assessing the current state of the household and stressors´
effect on the agro-ecological system
Sensitivity of a social system
Characterised by different factors such as household structure (e.g. the number of family
members who are economically dependent) and the existence of a broader livelihood portfolio,
i.e. the availability of alternative non-farm income as complementary strategies to buffer
vulnerability (Antwi-Agyei et al., 2013).
Stressors

- 267 -
Pressures that are continuous and cumulative, predictable and distressing, such as seasonal
shortages. Examples of stressors include declining yields of soils that degrade through
salinisation, declining common property resources, or declining rainfall (Chambers and Conway,
1992).
Shocks
Impacts that are typically sudden, unpredictable and traumatic. Example of shocks are droughts,
floods, pests, accidents and sudden sickness, or the unexpected death of a family member
(Chambers and Conway, 1992).
Agronomic drought,
Humidity deficit in the land that comes after a meteorology drought and has negative impacts
in crops production.
Exposure
Presence of people, livelihoods, species or ecosystems, environmental functions, services, and
resources, infrastructure, or economic, social, or cultural assets in places and settings that could
be adversely affected.
Adaptive capacity
Ability of a system to adjust to different hazards (including climate variability and extremes), to
moderate potential damages, to take advantage of opportunities, or to cope with the
consequences (IPCC, 2001 p. 982).
Conflict
Range of negative interactions that encompass mild verbally-expressed discord and cold
interstate relationships, as well as hostile acts (Kloos et al., 2013).
Institutions
Institutions
Formal and informal procedures, routines, norms and conventions embedded in organisational
structure of political economy (Hall and Taylor, 1996).
Group theory,
Two or more people who interact with one another, share similar characteristics, and have a
collective sense of unity.
Access
Ability to derive benefits from things (Ribot and Peluso, 2003).
Access control
Ability to mediate others’ access.
Control
Checking and direction of action,

- 268 -
Access maintenance
Expending resources or powers to keep a particular sort of resources access open (Ribot
and Peluso, 2003).
Monitoring rules
What is being monitored and by whom (Paavola, 2007).
Rules of exclusion
How effectively unauthorised users can be excluded and authorised resource use
(Paavola, 2007).
Property right
Right to benefit from a resource or economic good (Ribot and Peluso, 2003).
Establishing clear boundaries
Clear definition of natural resources and users’ rights (Anderies et al., 2004a).
Proportional equivalence between benefits and costs
Rights and duties of users and the distribution of impacts and benefits (Anderies et al., 2004a).
Collective-choice arrangements of the individual
Ability to modify the rules (Anderies et al., 2004a).
Monitoring
Control of bio-physical conditions and users behaviour (Anderies et al., 2004a).
Graduated Sanctions
Users who violate rules-in-use are likely to receive graduated sanctions (depending on the
seriousness and context of the offense) from other users, from officials accountable to these
users, or from both (Anderies et al., 2004a).
Conflict-Resolution Mechanisms
Users and their officials have rapid access to low-cost, local arenas to resolve conflict among
users or between users and officials (Anderies et al., 2004a).
Minimal Recognition of Rights to Organise
The rights of users to devise their own institutions are not challenged by external governmental
authorities; users have long-term tenure rights to the resource (Anderies et al., 2004a).
Nested Enterprises
Appropriation, provision, monitoring, enforcement, conflict resolution, and governance
activities are organised in multiple layers of nested enterprises (Anderies et al., 2004a).
Equity
Criterion for the distribution of costs and benefits in an institutional setting and the analysis of
participatory processes in such setting (Corbera, 2007).

- 269 -
Legitimacy
The way in which livelihoods’ outcomes are negotiated, accomplished and accepted by
stakeholders. This is, the extent to which decisions are acceptable to participants and non-
participants that are affected by decisions (Adger et al., 2005).
Foreign languages terms
Itoiz-Canal de Navarra
Name of the area affected by the modern irrigation introduction project.
Concentración de tierras
The term can best be translated as land consolidation and consists of grouping small plots of an
owner or diverse owners into a smaller number of plots
Acequias
A community-operated watercourse used in Spain and former Spanish colonies in the Americas
for irrigation. Acequias are usually historically engineered canals that carry river water to distant
fields.
La Nueva Cultura del Agua
New Culture of Water is a social movement that emerged in the mid-1990s. It promotes a change
in water management policy in favour of more rational and sustainable actions. Members are
professionals from various fields (business, academic, cultural, social, etc.).
Audiencia Nacional (National Court)
A special and exceptional high court in Spain.
Solidari@s con Itoiz collective
Collective born to cover a battle front of direct, public and non-violent action, within a strategy
of civil disobedience in defense of land.