
'Artiphysiology' reveals V4-like shape tuning in a deep ... - eLife
Shape Representation in V4:Investigating Position-SpecificTuning for BoundaryConformation with theStandard Model of ObjectRecognitionCharles Cadieu, Minjoon Kouh, Maximilian Riesenhuber & Tomaso Poggio
AI Memo 2004-024 November 2004CBCL Memo 241
© 2 0 0 4 m a s s a c h u s e t t s i n s t i t u t e o f t e c h n o l o g y, c a m b r i d g e , m a 0 2 1 3 9 u s a — w w w . c s a i l . m i t . e d u
m a ss a c h u se t t s i n st i t u t e o f t e c h n o l o g y — co m p u t e r sc i e n ce a n d a r t i f ic ia l i n t e l l ig e n ce l a b o ra t o r y

Shape Representation in V4: InvestigatingPosition-Specific Tuning for Boundary Conformation
with the Standard Model of Object Recognition
Charles Cadieu1, Minjoon Kouh1,Maximilian Riesenhuber2 & Tomaso Poggio1
1McGovern Institute for Brain Research,Center for Biological and Computational Learning,
Computer Sciences & Artificial Intelligence Laboratoryand
Department of Brain and Cognitive SciencesMassachusetts Institute of Technology
2Department of Neuroscience,Georgetown University Medical Center
Abstract
The computational processes in the intermediate stages of the ventral pathway responsible for visual objectrecognition are not well understood. A recent physiological study by A. Pasupathy and C. Connor inintermediate area V4 using contour stimuli, proposes that a population of V4 neurons display object-centered, position-specific curvature tuning [18]. The “standard model” of object recognition, a recentlydeveloped model [23] to account for recognition properties of IT cells (extending classical suggestionsby Hubel, Wiesel and others [9, 10, 19]), is used here to model the response of the V4 cells described in[18]. Our results show that a feedforward, network level mechanism can exhibit selectivity and invarianceproperties that correspond to the responses of the V4 cells described in [18]. These results suggest howobject-centered, position-specific curvature tuning of V4 cells may arise from combinations of complexV1 cell responses. Furthermore, the model makes predictions about the responses of the same V4 cellsstudied by Pasupathy and Connor to novel gray level patterns, such as gratings and natural images. Thesepredictions suggest specific experiments to further explore shape representation in V4.
Copyright c© Massachusetts Institute of Technology, 2004
This report describes research done at the Center for Biological & Computational Learning, which is in the McGovern Institutefor Brain Research at MIT, as well as in the Dept. of Brain & Cognitive Sciences, and which is affiliated with the ComputerSciences & Artificial Intelligence Laboratory (CSAIL).
This research was sponsored by grants from: Office of Naval Research (DARPA) Contract No. N00014-00-1-0907, Office ofNaval Research (DARPA) Contract No. N00014-02-1-0915, National Science Foundation (ITR/IM) Contract No. IIS-0085836,National Science Foundation (ITR/SYS) Contract No. IIS-0112991, National Science Foundation (ITR) Contract No. IIS-0209289,National Science Foundation-NIH (CRCNS) Contract No. EIA-0218693, National Science Foundation-NIH (CRCNS) ContractNo. EIA-0218506, and National Institutes of Health (Conte) Contract No. 1 P20 MH66239-01A1.
Additional support was provided by: Central Research Institute of Electric Power Industry, Center for e-Business (MIT), Daim-lerChryslerAG, Compaq/Digital Equipment Corporation, Eastman Kodak Company, Honda R&D Co., Ltd., ITRI, Komatsu Ltd.,Eugene McDermott Foundation, Merrill-Lynch, Mitsubishi Corporation, NEC Fund, Nippon Telegraph & Telephone, Oxygen,Siemens Corporate Research, Inc., Sony MOU, Sumitomo Metal Industries, Toyota Motor Corporation, and WatchVision Co.,Ltd..
1

1 Introduction
Many physiological studies have shed some light onthe ventral stream in primate visual cortex [4, 11, 31],but most computational issues have yet to be resolved.Cells in the early stages of the ventral pathway havesmall receptive fields and are selective to simple fea-tures, such as edge orientation [1, 8], while cells faralong the pathway in inferotemporal cortex (IT) havelarge receptive fields and are selective to complex ob-jects like faces and hands [2, 7, 14, 20, 30]. The generalselectivity at these two stages of the ventral pathwayis relatively well understood. However, cells at inter-mediate stages, between V1 and IT, have not been fullycharacterized.
In one recent study of V4, Pasupathy and Connor[18] investigated the nature of shape representation inV4 cells of the primate ventral pathway. Building on aprevious study [17] in which they found tuning in V4cells to angle orientation, Pasupathy and Connor ex-amined shape representation of V4 cells using a set ofsimple closed shapes formed by combining convex andconcave boundary elements [18] (see Figure 2). Theycharacterized a subpopulation of V4 cells as having se-lectivity for object-centered position-specific boundaryconformation, such as cells that were tuned to multi-ple curvatures at specific angular positions from the ob-ject’s center of mass.
In this paper we report that the “standard model,”a recently developed computational model of objectrecognition [23], can reproduce the quantitative datadescribed by Pasupathy and Connor in [18]. Modelunits can display the same object-centered, position-specific curvature tuning measured by Pasupathy andConnor in a subpopulation of V4 cells. These modelunits represent a translation invariant combination ofcomplex V1-like subunits that may be described as“curvature filters.” These results suggest that V4 selec-tivity is a result of the combination of complex V1 cellresponses. Furthermore, the model can make quanti-tative predictions, yet to be verified, of how cells mea-sured by Pasupathy and Connor will respond to novelstimuli. Such predictions can provide the basis for fur-ther experiments to explore shape representation in V4.
1.1 Physiological Results
There have been many experiments in intermediatearea V4 using a variety of stimulus sets [3, 5, 6, 22], butnone has been able to fully characterize V4 selectivity.In one attempt to describe V4 cell shape representation,Pasupathy and Connor systematically combined con-vex and concave boundary elements to produce simpleclosed shapes with shared boundary components [18].They then quantified the raw responses of prescreenedV4 cells to the stimulus set using Gaussian functions ina number of tuning domains: boundary conformation,edge orientation and axial orientation. Gaussian func-
tions fit in the boundary conformation space (specifi-cally, curvature × angular position from the object cen-ter) were found to best characterize V4 responses. Pa-supathy and Connor concluded that these results, “sug-gest a parts-based representation of complex shape inV4, where the parts are boundary patterns defined bycurvature and position relative to the rest of the object.”[18]
2 Methods
2.1 The Standard Model
The standard model combines many data about theventral stream [9, 10, 19] into a hierarchical computa-tional model of object recognition [23–25]. The two ba-sic cognitive requirements of object recognition, invari-ance and specificity, are evident at the earliest and high-est stages within the ventral stream. Within the ear-liest stages, recordings in cat striate cortex using ori-ented bars show that simple cells display strong phasedependence, while complex cells display tuning that isindependent of phase [9]. Hubel and Wiesel proposedthat the invariance of complex cells could be created bypooling together simple cells with similar selectivitiesbut translated receptive fields [10]. Perrett and Oramproposed a similar mechanism within IT [19], the high-est layer of the ventral stream, that described invarianceto any transformation as pooling over afferents tuned totransformed versions of the same stimuli. Riesenhuberand Poggio extended these proposals in a quantitativemodel to describe the mechanisms that achieve invari-ance and specificity throughout the ventral stream [23].
The resulting model is a hierarchical framework thatconsists of units analogous to simple and complex cellsin V1, and leads to view dependent and view invariantneurons analogous to IT cells. The model layers are or-ganized to mirror the layers from V1 to IT in the ventralstream and can be extended up to prefrontal cortex [25].The view-based module leads to complex feature selec-tive units that are scale and translation invariant [23].Through the layers of the model, increasingly complexfeature representations are achieved by combining in-termediate features using template matching Gaussiantransfer function (see Appendix A.1). Scale and trans-lation invariance are achieved by using a max-poolingoperation over similar features with different scales andtranslations.
Tuning within the model can generally be inter-preted as representing a conjunction of non-linear fil-ters that is translation invariant within a unit’s receptivefield. Simulations using the methodology of Pasupathyand Connor in [18], show that units within the stan-dard model correspond to V4 cells and exhibit object-centered, position-specific boundary conformation tun-ing.
2

2.2 Model Implementation
The model used in this paper is an extension of original,simplified version described by Riesenhuber and Pog-gio [23] in three ways: the combination of afferents byS2 units is less rigid, S2 units are tuned to a target stim-ulus (possibly by learning, see [29]), and the C2 layerpooling range is set to match the invariance propertiesof a V4 cell. These changes are natural (and planned,see [23]) extensions of the original model. They weremade possible in a quantitative way as a consequenceof the results found by Pasupathy and Connor in [18].In this paper we will refer to S2 and C2 units that incor-porate these changes. A comparison of the new units tothe original model units is presented in Appendix A.2.
The present version of the model, as used here, isshown in Figure 1 and consists of five layers: S1, C1,S2, C2, and VTU. The ’S’ layers perform the templatematching function and the ’C’ layers perform the max-pooling operation. The S1 layer units perform a con-volution on regions of the raw input image using Ga-bor filters at different orientations and sizes. The entirepopulation of S1 units represents a convolution map ofGabor filters of different sizes and orientations with theentire raw image.
The C1 layer performs a max-pooling operation onthe S1 convolution maps of the same orientation. Themax-pooling function provides some scale and trans-lation invariance that is characteristic of complex cellsin V1. S2 units perform Gaussian tuning in a multi-dimensional space created from the outputs of C1 units.
In general, we expect a variety of cells tuned in dif-ferent ways within V4, possibly by a process of passivelearning based on visual experience. In this study wecreated specific units by the following procedure. S2units are tuned to a particular set of C1 inputs with aGaussian function. A target stimulus is presented to themodel and the outputs of the C1 layer form the centerof the S2 Gaussian tuning function. Feature tuning maybe considered as a type of learning in that the S2 unitlearns an optimal input pattern. This method is a depar-ture from the hard-wired tuning of the original model[23]. A similar method follows the original intents ofthe model and was in fact used recently to successfullyrecognize objects in real world settings [28, 29].
The S2 units were tuned to a target stimuli taken fromthe main stimulus set, (see Figure 2). The target stimu-lus spanned a 3×3 arrangement of C1 unit spatial lo-cations, creating 9 spatially distinct C1 locations. 2 or 3of these spatial locations were chosen as inputs to the S2unit (the spatial locations in the 3×3 map will be consid-ered as: top left, top middle, top right, left middle, mid-dle, right middle, lower left, lower middle, and lowerright). C1 unit outputs from all Gabor filter orientations(in this case 4 orientations : 0◦, 45◦, 90◦, and 135◦) areincluded as input from each spatial location. This re-sults in S2 units that take either 8 or 12 C1 inputs (2 or 3
spatial locations × 4 Gabor orientations).The units in the C2 layer then perform the max-
pooling operation over a spatial region of shifted S2units with identical tuning properties. The size of thespatial pooling region is set to match the invarianceproperties of the V4 cell shown in Figure 6A of [18]. C2units are directly compared to V4 cells. To complete themodel for object recognition, VTUs are tuned to objectviews as in the original model [23]. The VTU layer willonly be used here for object recognition benchmarks(see Appendix A.4). Further details of the model im-plementation are described in Appendix A.1.
2.3 Response Characterization
The methodology used to characterize C2 units followsthe methodology used by Pasupathy & Connor to char-acterize V4 cells [18]. The stimulus set is shown in Fig-ure 2 and is reproduced using code kindly supplied byAnitha Pasupathy. The construction of the stimulus setsand the data analysis methods used to characterize re-sponses in various tuning spaces are described in detailin [18].
2.4 V4 Cell Raw Responses
The raw responses of V4 cells described in Figures 2, 4,5, and 6 of [18] were extracted from digital images ofthe Figures. Raw V4 cell responses were then scaled be-tween 0 and 1. Correlation coefficients were computedbetween a cell’s scaled response to the 366 stimuli andthe response of the model C2 unit to the same 366 stim-uli to determine how well the model response matchedthe cell response.
2.5 Tuning Spaces
In addition, model unit tuning was also characterizedusing the same shape space analysis used by Pasupathy& Connor [18]. Multi-dimensional Gaussian functionswere fit for each model unit in a shape space based onthe stimuli. The multi-dimensional functions used tocharacterize model responses are: 2-D boundary con-formation, 4-D boundary conformation, edge orienta-tion, and edge orientation + contrast polarity.
The 2-D boundary conformation domain representsthe contour elements of each stimuli in a curvature ×angular position space. The 4-D boundary conforma-tion domain not only contains the same curvature× an-gular position space as the 2-D boundary conformationspace but also includes two adjacent curvature dimen-sions (i.e. the central curvature is augmented by the cur-vatures of the contour segments that are counterclock-wise and clockwise adjacent).
An edge orientation shape space analysis was usedto determine if responses were selective for flat contoursegments at specific orientations. For this space eachcontour segment of a stimulus was parameterized bythe angle between the tangent line and the horizontal.
3

Figure 1: Schematic diagram of the implementation of the standard model of object recognition used in this paper,which is an extension of the model described in [23]. S1 filters come in four different orientations (0◦, 45◦, 90◦, 135◦),and each S2 unit is tuned to a unique combination of C1 afferents. C2 units perform max-pooling over S2 units ofthe same feature. C2 units of each type provide inputs to the view-tuned units with tuning properties as foundin inferotemporal cortex [14, 23]. This study focuses on the units in the C2 layer that are analogous to cells in V4recorded by Pasupathy and Connor [18].
The edge orientation space was represented by a Gaus-sian function over the 180 degree range of edge orienta-tions.
2.6 Stimulus Translation
Model units were tested for invariance to stimulustranslation. One optimal stimulus and one non-optimalstimulus was tested over a grid of multiple positions.The grid consisted of a 5×5 square centered on the re-ceptive field with a translation of 0.5× S2 receptive fieldradius for each location on the grid.
2.7 Feature Translation Test
An additional stimulus set was used from [18] that var-ied the orientation and offset of a convex projection of atear dropped stimuli. This set was used to test the de-pendence on angular position and orthogonal offset byfitting the response to this stimulus set to a 1-D Gaus-sian in either tuning space. The response to this stimu-lus set was used by Pasupathy and Connor as evidencefor relative position tuning (a higher dependence on an-gular position would indicate relative position tuning).Further details are described in [18].
3 Results
3.1 Shape Tuning
Figure 3 shows the responses to the main stimulus set ofa V4 cell and a C2 unit. The V4 cell response is adaptedfrom Figure 4 of [18]. Both responses are linearly scaledbetween 0 and 1. The C2 unit was tuned to the stimulusshown in the lower left portion of the same figure andtakes inputs from upper right and middle right spatiallylocated C1 units. The V4 cell response is plotted againstthe C2 unit response in the lower right portion of Figure3.
There is a good correspondence between the V4 re-sponse and the C2 response. Generally, both exhibithigh responses to stimuli with concave curvature to theright of the object. Many subtleties of the responsesmatch, such as the many stimuli that exhibit approxi-mately half maximum responses. These similarities re-sult in a high correlation coefficient of 0.77 between theV4 cell response and the C2 unit response. The C2 unitalso shows shape space tuning similar to the V4 cell.Correlation coefficients of 0.67 in the 4-D boundary con-formation tuning space and 0.32 in the edge orientationspace both agree with the correlation coefficients found
4

Figure 2: Stimulus set used for computational simulations based on [18]. Each closed white shape represents oneindividual stimulus. The background is uniform black and fills the receptive field.
for the V4 cell.Other C2 units achieved good fits for the specific V4
cells shown in Figures 2 and 5 from [18]. A C2 unitconstructed with spatial locations of the C1 subunitsat middle, middle right and lower left and tuned to astimuli with a sharp convex projection to the lower leftshowed a correlation coefficient of 0.67 to the V4 cellin Figure 2 of [18]. This unit also exhibited a high cor-relation in 4-D boundary conformation tuning space of0.72 and a low correlation in edge orientation tuningspace of 0.32. Another C2 unit, constructed with C1 spa-tial locations at upper right and lower left and tuned toa stimuli with a sharp convex projection to the upperright, showed a correlation coefficient of 0.70 to the V4cell in Figure 5 of [18]. The 4-D boundary conformationcorrelation for this unit was 0.75 and the edge orienta-tion correlation was 0.28.
The results for the three C2 units described here aresummarized in Table 1.
3.2 Invariance
Figure 4 shows the responses to an optimal and non-optimal stimuli for a V4 cell, adapted from Figure 6A of[18], and a C2 unit over a 5×5 translation grid. The C2unit shows high responses to the optimal stimuli overa translation range that is comparable to the V4 cell.For the non-optimal stimuli, the C2 unit shows low re-sponse over all translations. This shows that stimulusselectivity is preserved over translation for the C2 unit.
The degree of translation invariance is comparable tothe invariance range of the V4 cell.
Figure 4: Translation response to an optimal and non-optimal stimulus for a V4 cell and a C2 unit. Responsesare scaled between 0 and 1. (V4 cell response adaptedfrom Figure 6A of [18])
Figure 5 shows the responses of a V4 cell and an ex-ample C2 unit to the feature translation stimulus set.The C2 unit shows a response pattern that is nearlyidentical to the V4 cell, adapted from Figure 6B of [18].The C2 response is highly correlated with the angularposition of the convex extremity and poorly correlated
5

Figure 3: V4 cell (top) and C2 model unit (bottom) responses to the main stimulus set. (V4 cell response adaptedfrom Figure 4 of [18]) The response to each stimulus is plotted in terms of the shading surrounding the stimulusand has been linearly scaled between 0 and 1. The darker the background the higher the response exhibited to thatstimulus. The tuned stimulus for the S2 inputs for this C2 unit is shown in the lower left. The V4 cell response isplotted against the C2 unit response in the lower right.
6

V4 Cell C2 Unit V4 Cell C2 Unit V4 Cell C2 UnitFigure from [18] 4 - 2 - 5 -Correlation Coefficient 0.77 0.67 0.724-D Boundary 0.81 0.67 0.82 0.72 0.85 0.75Edge Orientation 0.38 0.32 0.25 0.32 0.31 0.28
Table 1: Comparison of V4 cells to C2 units showing: correlation coefficient between V4 cell response and C2 unitresponse to the main stimulus set, 4-D boundary correlation coefficient for the response to the main stimulus set,and edge orientation correlation coefficient for the response to the main stimulus set.
Figure 5: V4 cell and C2 unit response to the feature translation stimulus set. Responses are scaled between 0 and1. V4 cell response is adapted from Figure 6B of [18].
with the orthogonal offset of the extremity (correlationcoefficients of 0.74 and 0.04, respectively) with nearlyidentical results for the V4 cell (correlation coefficientsof 0.72 and 0.08, respectively).
4 Discussion
The ability of C2 units to model V4 cell responses sug-gests an explanation of V4 cell tuning that is based ona conjunction of complex V1 cell responses. The modelrepresents a biologically plausible mechanism that dis-plays the same curvature and object centered tuningfound by Pasupathy and Connor in a subpopulation ofV4 cells. The model may be extended to predict the re-sponses of these V4 cells to novel stimuli.
The standard model will also allow the integrationand comparison of findings across physiological V4studies. An additional set of constraints is imposed byeach V4 study, limiting possible model connections andselectivities. For example, a previous study has foundconstraints on standard model units based on V4 find-ings [12]. Through such studies, a unified model of V4connectivity and selectivity can be achieved.
C2 model units demonstrate how a local feature com-bination can create object-centered tuning (as definedin [18]). C2 units demonstrate selectivity that is depen-dent on the relative spatial locations of the C1 unit in-puts combined at the S2 layer. The max-pooling oper-ation between the S2 units and the C2 unit producestuning that is independent of the stimulus translationand is thus independent of absolute receptive field po-sition. As a result, C2 units demonstrate tuning for therelative spatial position of their sub-features. These re-
sults indicate that invariance mechanisms at differentstages within the ventral stream may be closely associ-ated with the tuning properties of V4 cells. For furtheranalysis see Appendix A.3.
The specific C2 units described here display selectiv-ity to curvature segments and therefore, may approx-imately be described as curvature filters. In much thesame way that simple V1 cells can be thought of as fil-ters selective for orientation [15, 16, 26, 27], some V4cells can be thought of as filters selective for curvature.For example, C2 units show selectivity within a stimu-lus set of polar, hyperbolic and Cartesian gratings. Theresponse of the C2 unit shown in Figure 3 was found fora stimulus set of 40 polar, 20 hyperbolic and 30 Carte-sian gratings (similar to stimuli used in [5]). The re-sponse to the individual grating stimuli and the max-imum response within each grating class is shown inFigure 6. This type of grating selectivity is consistentwith reported V4 responses [5].
More generally, C2 units are tuned in a high dimen-sional space of C1 filters. Thus, C2 units show high se-lectivity to a wide range of stimuli that are not presentin the closed shape stimuli sets of [18] and are not eas-ily described as containing curvature or contours. Forexample, the natural image (from [13]) shown in Fig-ure 7 elicits high responses from the C2 unit shown inFigure 3. Figure 7 shows a natural image, the responsemap of the C2 unit shifted over the image, and an im-age patch that produces a high C2 response. The C2 re-sponse to this image patch is 0.75 (the highest and low-est responses in Figure 3 are 1.0 and 0.0, respectively).Note that this image patch does not obviously contain
7
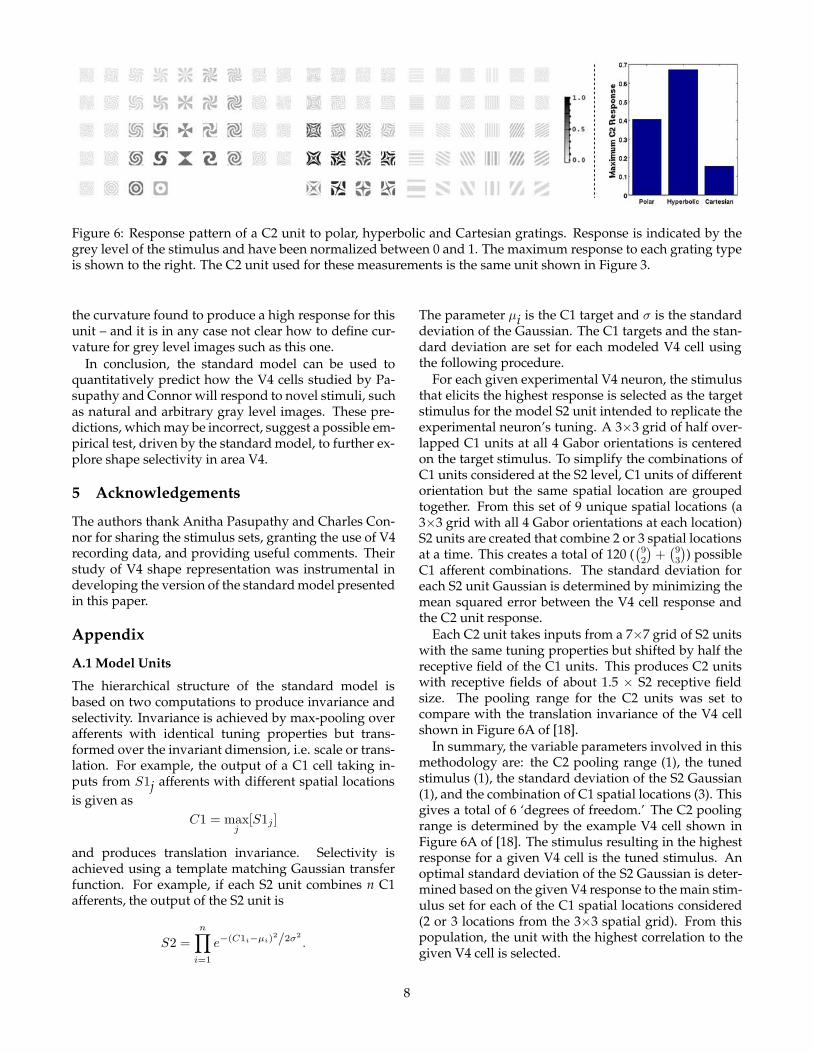
Figure 6: Response pattern of a C2 unit to polar, hyperbolic and Cartesian gratings. Response is indicated by thegrey level of the stimulus and have been normalized between 0 and 1. The maximum response to each grating typeis shown to the right. The C2 unit used for these measurements is the same unit shown in Figure 3.
the curvature found to produce a high response for thisunit – and it is in any case not clear how to define cur-vature for grey level images such as this one.
In conclusion, the standard model can be used toquantitatively predict how the V4 cells studied by Pa-supathy and Connor will respond to novel stimuli, suchas natural and arbitrary gray level images. These pre-dictions, which may be incorrect, suggest a possible em-pirical test, driven by the standard model, to further ex-plore shape selectivity in area V4.
5 Acknowledgements
The authors thank Anitha Pasupathy and Charles Con-nor for sharing the stimulus sets, granting the use of V4recording data, and providing useful comments. Theirstudy of V4 shape representation was instrumental indeveloping the version of the standard model presentedin this paper.
Appendix
A.1 Model Units
The hierarchical structure of the standard model isbased on two computations to produce invariance andselectivity. Invariance is achieved by max-pooling overafferents with identical tuning properties but trans-formed over the invariant dimension, i.e. scale or trans-lation. For example, the output of a C1 cell taking in-puts from S1j afferents with different spatial locationsis given as
C1 = maxj
[S1j ]
and produces translation invariance. Selectivity isachieved using a template matching Gaussian transferfunction. For example, if each S2 unit combines n C1afferents, the output of the S2 unit is
S2 =n∏
i=1
e−(C1i−µi)2/2σ2
.
The parameter µi is the C1 target and σ is the standarddeviation of the Gaussian. The C1 targets and the stan-dard deviation are set for each modeled V4 cell usingthe following procedure.
For each given experimental V4 neuron, the stimulusthat elicits the highest response is selected as the targetstimulus for the model S2 unit intended to replicate theexperimental neuron’s tuning. A 3×3 grid of half over-lapped C1 units at all 4 Gabor orientations is centeredon the target stimulus. To simplify the combinations ofC1 units considered at the S2 level, C1 units of differentorientation but the same spatial location are groupedtogether. From this set of 9 unique spatial locations (a3×3 grid with all 4 Gabor orientations at each location)S2 units are created that combine 2 or 3 spatial locationsat a time. This creates a total of 120 (
(92
)+
(93
)) possible
C1 afferent combinations. The standard deviation foreach S2 unit Gaussian is determined by minimizing themean squared error between the V4 cell response andthe C2 unit response.
Each C2 unit takes inputs from a 7×7 grid of S2 unitswith the same tuning properties but shifted by half thereceptive field of the C1 units. This produces C2 unitswith receptive fields of about 1.5 × S2 receptive fieldsize. The pooling range for the C2 units was set tocompare with the translation invariance of the V4 cellshown in Figure 6A of [18].
In summary, the variable parameters involved in thismethodology are: the C2 pooling range (1), the tunedstimulus (1), the standard deviation of the S2 Gaussian(1), and the combination of C1 spatial locations (3). Thisgives a total of 6 ‘degrees of freedom.’ The C2 poolingrange is determined by the example V4 cell shown inFigure 6A of [18]. The stimulus resulting in the highestresponse for a given V4 cell is the tuned stimulus. Anoptimal standard deviation of the S2 Gaussian is deter-mined based on the given V4 response to the main stim-ulus set for each of the C1 spatial locations considered(2 or 3 locations from the 3×3 spatial grid). From thispopulation, the unit with the highest correlation to thegiven V4 cell is selected.
8
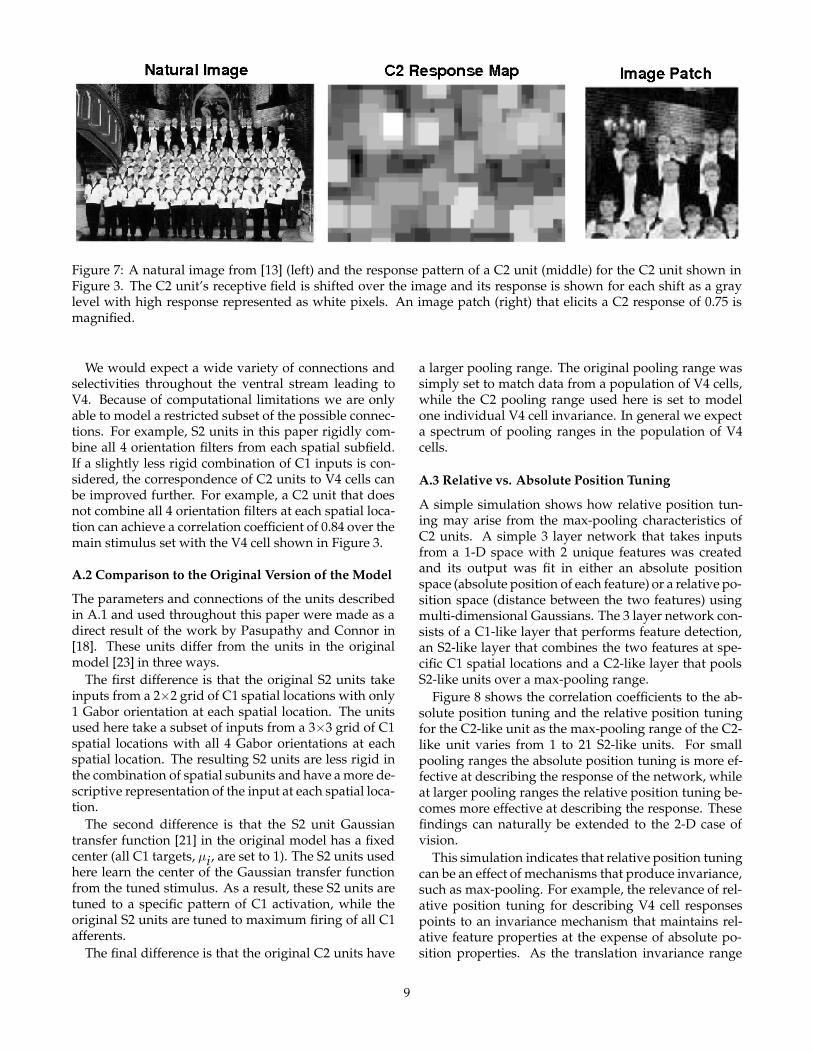
Figure 7: A natural image from [13] (left) and the response pattern of a C2 unit (middle) for the C2 unit shown inFigure 3. The C2 unit’s receptive field is shifted over the image and its response is shown for each shift as a graylevel with high response represented as white pixels. An image patch (right) that elicits a C2 response of 0.75 ismagnified.
We would expect a wide variety of connections andselectivities throughout the ventral stream leading toV4. Because of computational limitations we are onlyable to model a restricted subset of the possible connec-tions. For example, S2 units in this paper rigidly com-bine all 4 orientation filters from each spatial subfield.If a slightly less rigid combination of C1 inputs is con-sidered, the correspondence of C2 units to V4 cells canbe improved further. For example, a C2 unit that doesnot combine all 4 orientation filters at each spatial loca-tion can achieve a correlation coefficient of 0.84 over themain stimulus set with the V4 cell shown in Figure 3.
A.2 Comparison to the Original Version of the Model
The parameters and connections of the units describedin A.1 and used throughout this paper were made as adirect result of the work by Pasupathy and Connor in[18]. These units differ from the units in the originalmodel [23] in three ways.
The first difference is that the original S2 units takeinputs from a 2×2 grid of C1 spatial locations with only1 Gabor orientation at each spatial location. The unitsused here take a subset of inputs from a 3×3 grid of C1spatial locations with all 4 Gabor orientations at eachspatial location. The resulting S2 units are less rigid inthe combination of spatial subunits and have a more de-scriptive representation of the input at each spatial loca-tion.
The second difference is that the S2 unit Gaussiantransfer function [21] in the original model has a fixedcenter (all C1 targets, µi, are set to 1). The S2 units usedhere learn the center of the Gaussian transfer functionfrom the tuned stimulus. As a result, these S2 units aretuned to a specific pattern of C1 activation, while theoriginal S2 units are tuned to maximum firing of all C1afferents.
The final difference is that the original C2 units have
a larger pooling range. The original pooling range wassimply set to match data from a population of V4 cells,while the C2 pooling range used here is set to modelone individual V4 cell invariance. In general we expecta spectrum of pooling ranges in the population of V4cells.
A.3 Relative vs. Absolute Position Tuning
A simple simulation shows how relative position tun-ing may arise from the max-pooling characteristics ofC2 units. A simple 3 layer network that takes inputsfrom a 1-D space with 2 unique features was createdand its output was fit in either an absolute positionspace (absolute position of each feature) or a relative po-sition space (distance between the two features) usingmulti-dimensional Gaussians. The 3 layer network con-sists of a C1-like layer that performs feature detection,an S2-like layer that combines the two features at spe-cific C1 spatial locations and a C2-like layer that poolsS2-like units over a max-pooling range.
Figure 8 shows the correlation coefficients to the ab-solute position tuning and the relative position tuningfor the C2-like unit as the max-pooling range of the C2-like unit varies from 1 to 21 S2-like units. For smallpooling ranges the absolute position tuning is more ef-fective at describing the response of the network, whileat larger pooling ranges the relative position tuning be-comes more effective at describing the response. Thesefindings can naturally be extended to the 2-D case ofvision.
This simulation indicates that relative position tuningcan be an effect of mechanisms that produce invariance,such as max-pooling. For example, the relevance of rel-ative position tuning for describing V4 cell responsespoints to an invariance mechanism that maintains rel-ative feature properties at the expense of absolute po-sition properties. As the translation invariance range
9

Figure 8: Correlation coefficients of relative and abso-lute position tuning as a function of max-pooling rangefor a simplified network. As the max-pooling range in-creases, relative position tuning becomes more effectiveat describing the network response.
increases for a V4 cell, relative position tuning shouldbecome a better predictor of neuron response.
A.4 Paperclip Benchmark
A test is necessary to show that the extension of theoriginal model [23] used here produces quantitativelysimilar selectivity and invariance at the VTU level. Abenchmark borrowed from [23] compares the singleVTU object recognition performance in both modelson a set of paperclip stimuli under rotation, scale andtranslation transformations.
For the benchmark, a population of S2 units was con-structed by selecting 3 C1 spatial locations from a 3×3grid at a time (ignoring redundancies) and then ran-domly sampling the center of the S2 Gaussian functionfor each unit five times to achieve an S2 population of250 units (50 spatial location groupings × 5 randomsamples). The C2 pooling range was set to match therange of the original model. Therefore, this benchmarkcompares the original S2 units to the new S2 units pre-sented in this paper. The results for the paperclip bench-mark, shown in Figure 9, indicate that the model withthe new S2 units achieves a similar degree of rotation,scale and translation invariance and selectivity againstdistractors as the original model.
References
[1] J. Baizer, D. Robinson, and B. Dow. Visual re-sponses of Area 18 neurons in awake, behavingmonkey. Journal of Neurophysiology, 40:1024–1037,1977.
[2] R. Desimone, T. Albright, C. Gross, and C. Bruce.
Stimulus-selective properties of inferior temporalneurons in the Macaque. Journal of Neuroscience,4:2051–2062, 1984.
[3] R. Desimone and S. Schein. Visual properties ofneurons in Area V4 of the Macaque: Sensitivity tosimulus form. Journal of Neurophysiology, 57:835–868, 1987.
[4] D. Felleman and D. Van Essen. Distributed hier-archical processing in the primate cerebral cortex.Cereb. Cortex, 1:1–47, 1991.
[5] J. Gallant, C. Connor, S. Rakshit, J. Lewis, andD. Van Essen. Neural responses to polar, hy-perbolic, and Cartesian gratings in Area V4 ofthe Macaque monkey. Journal of Neurophysiology,76:2718–2739, 1996.
[6] T. Gawne and J. Martin. Responses of primatevisual cortical V4 neurons to simultaneously pre-sented stimuli. Journal of Neurophysiology, 88:1128–1135, 2002.
[7] C. Gross, C. Rocha-Miranda, and D. Bender. Visualproperties of neurons in inferotemporal cortex ofthe Macaque. Journal of Neurophysiology, 35:96–111,1972.
[8] D. Hubel and M. Livingstone. Segregation of form,color, and steropsis in primate Area 18. Journal ofNeuroscience, 7:3378–3415, 1987.
[9] D. Hubel and T. Wiesel. Receptive fields, binoc-ular interaction and functional architecture in thecat’s visual cortex. Journal of Physiology (London),160:106–154, 1962.
[10] D. Hubel and T. Wiesel. Receptive fields and func-tional architecture in two nonstriate visual ares(18 and 19) of the cat. Journal of Neurophysiology,28:229–289, 1965.
[11] E. Kobatake and K. Tanaka. Neuronal selectivi-ties to complex object features in the ventral visualpathway of the Macaque cerebral cortex. Journal ofNeurophysiology, 71:856–867, 1994.
[12] M. Kouh and M. Riesenhuber. Investigating shaperepresentation in Area V4 with HMAX: Orienta-tion and grating selectivities. MIT AI Memo, 021,2003.
[13] F.F. Li. 100 natural photographdataset, July 2002. Available online:www.vision.caltech.edu/feifeili/Datasets.htm.
[14] N. Logothetis, J. Pauls, and T. Poggio. Shape rep-resentation in the inferior temporal cortex of mon-keys. Current Biology, 5:552–563, 1995.
[15] L. Mahon and R. De Valois. Cartesian and non-Cartesian responses in LGN, V1, and V2 cells. Vi-sual Neuroscience, 18:973–981, 2001.
10

Figure 9: Paperclip benchmark comparing the model using original units to the model using a novel S2 unit pop-ulation. Note that the original and new units show similar degree of invariance (view point rotation, scale, andtranslation) and selectivity against distractors (indicated by horizontal line). See [23] for more details.
[16] F. Mooser, W. Bosking, and D. Fitzpatrick. A mor-phological basis for orientation tuning in primaryvisual cortex. Nature Neuroscience, 7:872–879, 2004.
[17] A. Pasupathy and C. Connor. Responses to contourfeatures in Macaque Area V4. Journal of Neurophys-iology, 82:2490–2502, 1999.
[18] A. Pasupathy and C. Connor. Shape representationin Area V4: Position–specific tuning for boundaryconformation. Journal of Neurophysiology, 86:2505–2519, 2001.
[19] D. Perrett and M. Oram. Neurophysiology ofshape processing. Imaging Vis. Comput., 11:317–333, 1993.
[20] D. Perrett, E. Rolls, and W. Caan. Visual neuronsresponsive to faces in the monkey temporal cortex.Exp. Brain Res., 47:329–342, 1982.
[21] T. Poggio and E. Bizzi. Generalization in visionand motor control. Nature, 431:768–774, 2004.
[22] D. Pollen, A. Przybyszewski, M. Rubin, andW. Foote. Spatial receptive field organization ofMacaque V4 neurons. Cerebral Cortex, 12(6):601–616, 2002.
[23] M. Riesenhuber and T. Poggio. Hierarchical mod-els of object recognition in cortex. Nature Neuro-science, 2:1019–1025, 1999.
[24] M. Riesenhuber and T. Poggio. Neural mecha-
nisms of object recognition. Current Opinions inNeurobiology, 12:162–168, 2002.
[25] M. Riesenhuber and T. Poggio. How the visualcortex recognizes objects: The tale of the standardmodel. Visual Neuroscience, 2:1640–1653, 2003.
[26] D. L. Ringach. Spatial structure and symmetry ofsimple-cell receptive fields in Macaque V1. Journalof Neurophysiology, 88:455–463, 2002.
[27] T. Serre and M. Riesenhuber. Realistic modeling ofcortical cells for simulations with a model of objectrecognition in cortex. MIT AI Memo, 2003.
[28] T. Serre, M. Riesenhuber, J. Louie, and T. Pog-gio. On the role of object-specific features for realworld object recognition in biological vision. Bio-logically Motivated Computer Vision, Second Interna-tional Workshop (BMCV 2002):387–397, 2002.
[29] T. Serre, L. Wolf, and T. Poggio. High-performanceobject recognition with features inspired by visualcortex. Currently in submission, 2004.
[30] K. Tanaka, H. Saito, Y. Fukada, and M. Moriya.Coding visual images of objects in the inferotem-poral cortex of the Macaque monkey. Journal ofNeurophysiology, 66:170–189, 1991.
[31] L. Ungerleider and M. Mishkin. Two cortical visualsystems. MIT Press, 1982.
11
Copyright © 2022 FDOKUMEN