Sensors and Actuators A - nims l Nano & Information Materials ...
Upload
khangminh22Category
view
0download
0
Western University Western University
Scholarship@Western Scholarship@Western
Electronic Thesis and Dissertation Repository
9-29-2016 12:00 AM
Shape Memory Alloy Actuators and Sensors for Applications in Shape Memory Alloy Actuators and Sensors for Applications in
Minimally Invasive Interventions Minimally Invasive Interventions
Amit Srivastava, The University of Western Ontario
Supervisor: Dr. Rajni V. Patel, The University of Western Ontario
A thesis submitted in partial fulfillment of the requirements for the Master of Engineering
Science degree in Electrical and Computer Engineering
© Amit Srivastava 2016
Follow this and additional works at: https://ir.lib.uwo.ca/etd
Part of the Biomedical Commons
Recommended Citation Recommended Citation Srivastava, Amit, "Shape Memory Alloy Actuators and Sensors for Applications in Minimally Invasive Interventions" (2016). Electronic Thesis and Dissertation Repository. 4119. https://ir.lib.uwo.ca/etd/4119
This Dissertation/Thesis is brought to you for free and open access by Scholarship@Western. It has been accepted for inclusion in Electronic Thesis and Dissertation Repository by an authorized administrator of Scholarship@Western. For more information, please contact [email protected].

Abstract
Reduced access size in minimally invasive surgery and therapy (MIST) poses several re-striction on the design of the dexterous robotic instruments. The instruments should be devel-oped that are slender enough to pass through the small sized incisions and able to effectivelyoperate in a compact workspace. Most existing robotic instruments are operated by big actu-ators, located outside the patient’s body, that transfer forces to the end effector via cables ormagnetically controlled actuation mechanism. These instruments are certainly far from optimalin terms of their cost and the space they require in operating room. The lack of adequate sens-ing technologies make it very challenging to measure bending of the flexible instruments, andto measure tool-tissue contact forces of the both flexible and rigid instruments during MIST.Therefore, it requires the development of the cost effective miniature actuators and strain/forcesensors. Having several unique features such as bio-compatibility, low cost, light weight, largeactuation forces and electrical resistivity variations, the shape memory alloys (SMAs) showpromising applications both as the actuators and strain sensors in MIST. However, highly non-linear hysteretic behavior of the SMAs hinders their use as actuators. To overcome this prob-lem, an adaptive artificial neural network (ANN) based Preisach model and a model predictivecontroller have been developed in this thesis to precisely control the output of the SMA actu-ators. A novel ultra thin strain sensor is also designed using a superelastic SMA wire, whichcan be used to measure strain and forces for many surgical and intervention instruments. Ada Vinci R© surgical instrument is sensorized with these sensors in order to validate their forcesensing capability.
Keywords: Shape memory alloys (SMAs), hysteresis, artificial neural network (ANN),extended Kalman filter (EKF), Preisach model, strain sensor, force sensor, minimally invasivesurgery and therapy (MIST).
i
Statement-of Co-Authorship
The thesis presented here has been written by Amit Srivastava under the supervision of Dr.Rajni V. Patel. Parts of the content of the thesis have been published in the proceedings ofa refereed conference (mostly from Chapter 3), or will be submitted for publication shortly.The research published in the thesis has been primarily conducted by Amit Srivastava and thepublished paper has also been written by him. The research has been guided, supported andreviewed by Dr. Patel as the research supervisor.
The material presented in Chapter 2 is to be submitted as,
• Amit Srivastava, Christopher Ward, and Rajni V. Patel, “Adaptive Neural Preisach Modeland Model Predictive Control of Shape Memory Alloy Actuators”, (To be submitted toIEEE/ASME Transactions On Mechatronics)
– A. Srivastava - developed the model, designed the control system and the experi-ments, designed the electrical and imaging part of the experimental set-up, collecteddata and analyzed the results and wrote the manuscript.
– C. Ward - designed the mechanical part of the experimental set-up and reviewedthe manuscript.
A version of the material presented in Chapter 2 has been published as
• A. Srivastava, R. Xu, A. Escoto, C. Ward, and R. V. Patel, “Design of an Ultra Thin StrainSensor Using Superelastic Nitinol for Applications in Minimally Invasive Surgery”, in2016 IEEE International Conference on Advanced Intelligent Mechatronics (AIM), Banff,Alberta, 12-15 July, 2016.
– A. Srivastava - designed the strain sensor and strain gauge amplifier, analyze thesensor characteristics, calibrated and validated the strain sensors for use with theda Vinci surgical instrument, collected data and analyzed the results and wrote themanuscript.
ii

– R. Xu - helped in designing the strain sensor, suggested sensorizing the da Vincisurgical instrument and helped in planning the experimental set-up for calibrationand validation of the sensorized instrument. He also reviewed the manuscript.
– A. Escoto and C. Ward - helped in the design of the experimental set-up and re-viewed the manuscript.
iii

Acknowledgements
First of all, I would like to express my deepest gratitude to my supervisor, Dr. Rajni Patel,for giving me the opportunity to work with him. This thesis project would not have beenpossible without his consistent support, guidance and patience. It is impossible to adequatelyacknowledge him for the help and the suggestions that he provided me throughout my graduatestudies. I would like to thank him from the bottom of my heart for being very kind to me. Ifeel myself fortunate to have him as my supervisor.
I would like to extend my thanks to my uncle Mohan for encouraging me to pursue mygraduate studies here at the Western University. Without his motivation, I would have neverthought of studying abroad. I am also very thankful to him and Aruna aunty for providing mewith a home away from home.
I would like to thank all of my colleagues at CSTAR for their help and suggestions. Inparticular, I would like to thank Christopher Ward and Abelardo Escoto for providing theirassistance throughout my stay at CSTAR. I am also very grateful to Ran Xu for helping meduring the most struggling period of my research and providing me a different perspective tolook at my research problems. My sincere thanks goes to Farokh Atashzar for never hesitatingsharing his knowledge and valuable experiences with me which have always been very helpfulto achieve my project goals. I would like to acknowledge Farshad Anooshahpour for havingseveral good discussions with him related to the first part of my project. I also want to appre-ciate his helping nature and a good sense of humor. I am thankful to Dr. Peyman Yadmellatfor proofreading some of the chapters of this thesis and providing me the feedback to improvethem. I would also like to thank my friends Saeed, Aaron, Venky and Nikita for being verysupportive throughout my time here.
Finally, last but by no means least, I wish to express my sincere gratitude to my parents andmy two lovely sisters, Nammo and Shweta didi for their unconditional love, constant supportand faith in me. I will be forever indebted to them for all the sacrifices they made to provideme a good life.
iv

Dedicated to
My parents
andMohan uncle & Aruna aunty
v

Contents
Abstract i
Co-Authorship Statement ii
Acknowledgements iv
Dedication v
List of Figures ix
List of Tables xii
List of Abbreviations xiii
1 Introduction 11.1 Minimally Invasive Surgery and Therapy (MIST) . . . . . . . . . . . . . . . . 11.2 Robot-Assisted MIST: Actuation and Sensing Technologies . . . . . . . . . . . 2
1.2.1 State-of-the-Art Actuation Technologies . . . . . . . . . . . . . . . . . 31.2.1.1 Tendon Based Power Transmission . . . . . . . . . . . . . . 31.2.1.2 Magnetically Controlled Actuation . . . . . . . . . . . . . . 31.2.1.3 Bevel-tip Flexible Needle Steering . . . . . . . . . . . . . . . 41.2.1.4 Concentric-Tube-Robot (CTR) . . . . . . . . . . . . . . . . . 5
1.2.2 State of the Art Strain/Force Sensing Technologies . . . . . . . . . . . 61.2.2.1 Strain Gauges . . . . . . . . . . . . . . . . . . . . . . . . . 61.2.2.2 Optical Sensors . . . . . . . . . . . . . . . . . . . . . . . . . 81.2.2.3 Electromagnetic Sensors . . . . . . . . . . . . . . . . . . . . 8
1.3 Shape Memory Alloys (SMAs) . . . . . . . . . . . . . . . . . . . . . . . . . . 91.3.1 SMAs as Actuators . . . . . . . . . . . . . . . . . . . . . . . . . . . . 12
1.3.1.1 Active Catheter . . . . . . . . . . . . . . . . . . . . . . . . . 121.3.1.2 Active Needle . . . . . . . . . . . . . . . . . . . . . . . . . 131.3.1.3 Neurosurgical robot . . . . . . . . . . . . . . . . . . . . . . 13
vi

1.3.2 SMAs as Self Sensing Actuators . . . . . . . . . . . . . . . . . . . . . 141.3.2.1 Active Endoscope . . . . . . . . . . . . . . . . . . . . . . . 151.3.2.2 Active Laparoscpic Instrument . . . . . . . . . . . . . . . . . 15
1.3.3 SMAs as Strain Sensors . . . . . . . . . . . . . . . . . . . . . . . . . . 161.4 Project Goals . . . . . . . . . . . . . . . . . . . . . . . . . . . . . . . . . . . 161.5 Significant Challenges . . . . . . . . . . . . . . . . . . . . . . . . . . . . . . . 171.6 Contributions . . . . . . . . . . . . . . . . . . . . . . . . . . . . . . . . . . . 181.7 Outline of the Thesis . . . . . . . . . . . . . . . . . . . . . . . . . . . . . . . 18
Bibliography 19
2 Hysteresis Modeling and Control of Shape Memory Alloy Actuator 252.1 Introduction . . . . . . . . . . . . . . . . . . . . . . . . . . . . . . . . . . . . 252.2 Classical Preisach Model . . . . . . . . . . . . . . . . . . . . . . . . . . . . . 272.3 An Artificial Neural Network (ANN) . . . . . . . . . . . . . . . . . . . . . . . 322.4 Hysteresis Modeling of the SMA Actuator . . . . . . . . . . . . . . . . . . . . 34
2.4.1 Temperature versus current modeling . . . . . . . . . . . . . . . . . . 342.4.2 Strain versus temperature modeling . . . . . . . . . . . . . . . . . . . 35
2.4.2.1 Neural Preisach Model (NPM) . . . . . . . . . . . . . . . . . 352.4.2.2 Adaptive Neural Preisach Model (ANPM) . . . . . . . . . . 36
2.5 Experimental Setup . . . . . . . . . . . . . . . . . . . . . . . . . . . . . . . . 392.6 Strain Measurement Using Camera . . . . . . . . . . . . . . . . . . . . . . . . 402.7 Model Identification and Validation . . . . . . . . . . . . . . . . . . . . . . . . 43
2.7.1 NPM Identification . . . . . . . . . . . . . . . . . . . . . . . . . . . . 432.7.2 NPM and ANPM Validation . . . . . . . . . . . . . . . . . . . . . . . 44
2.8 Adaptive Neural Preisach Model Predictive Control . . . . . . . . . . . . . . . 482.9 ANPMPC Simulations and Experiments . . . . . . . . . . . . . . . . . . . . . 512.10 Conclusion . . . . . . . . . . . . . . . . . . . . . . . . . . . . . . . . . . . . 52
Bibliography 53
3 Design of an Ultra Thin Superelastic Shape Memory Alloy Strain Sensor 593.1 Introduction . . . . . . . . . . . . . . . . . . . . . . . . . . . . . . . . . . . . 593.2 Nitinol Sensor Design . . . . . . . . . . . . . . . . . . . . . . . . . . . . . . . 61
3.2.1 Nickel-Titanium Alloy Properties . . . . . . . . . . . . . . . . . . . . 613.2.2 Nitinol as a Strain Sensor . . . . . . . . . . . . . . . . . . . . . . . . . 613.2.3 Sensor Selection Criteria . . . . . . . . . . . . . . . . . . . . . . . . . 623.2.4 Lead Wire Connection . . . . . . . . . . . . . . . . . . . . . . . . . . 62
vii

3.2.5 Signal Conditioning . . . . . . . . . . . . . . . . . . . . . . . . . . . . 633.3 Force Measurement for Surgical Instruments using Nitinol Sensors . . . . . . . 643.4 Experiments . . . . . . . . . . . . . . . . . . . . . . . . . . . . . . . . . . . . 66
3.4.1 Gauge Factor Calculation . . . . . . . . . . . . . . . . . . . . . . . . . 663.4.2 Sensor Calibration . . . . . . . . . . . . . . . . . . . . . . . . . . . . 663.4.3 Sensor Performance Assessment . . . . . . . . . . . . . . . . . . . . . 67
3.5 Results . . . . . . . . . . . . . . . . . . . . . . . . . . . . . . . . . . . . . . . 693.6 Conclusion . . . . . . . . . . . . . . . . . . . . . . . . . . . . . . . . . . . . 72
Bibliography 72
4 Conclusion and Future Work 764.1 Conclusion . . . . . . . . . . . . . . . . . . . . . . . . . . . . . . . . . . . . 764.2 Future Work . . . . . . . . . . . . . . . . . . . . . . . . . . . . . . . . . . . . 77
Curriculum Vitae 78
viii

List of Figures
1.1 A tendon-pulley actuation mechanism [14]. . . . . . . . . . . . . . . . . . . . 41.2 Bevel tip flexible needle steering. [22] . . . . . . . . . . . . . . . . . . . . . . 51.3 A concentric tube robot comprising of four concentric curved tubes [27]. . . . 61.4 (a) Force sensor components, (b) assembled force sensor and (c) microsurgical
instrument integrated with force sensor. [30] . . . . . . . . . . . . . . . . . . . 71.5 TacticathTM contact force catheter [34]. . . . . . . . . . . . . . . . . . . . . . 91.6 THERMOCOOL R© SMARTTOUCHTM catheter [37]. . . . . . . . . . . . . . . 101.7 Shape memory effect. . . . . . . . . . . . . . . . . . . . . . . . . . . . . . . 111.8 Superelastic/ pseudoelastic effect. . . . . . . . . . . . . . . . . . . . . . . . . 111.9 SMA springs actuated active catheter [41]. . . . . . . . . . . . . . . . . . . . 131.10 SMA actuated steerable cannula [44]. . . . . . . . . . . . . . . . . . . . . . . 141.11 SMA actuated MRI compatible neurosurgical robot developed by Ho et al.
[46]. . . . . . . . . . . . . . . . . . . . . . . . . . . . . . . . . . . . . . . . . 141.12 An active endoscope designe by Ikuta et al. [47] . . . . . . . . . . . . . . . . . 151.13 (a) SMA actuated laparoscopic forcep and (b) active joint [48, 49]. . . . . . . . 16
2.1 Preisach triangle and triangle subdivision due to (a) increasing input, (b) de-creasing input. . . . . . . . . . . . . . . . . . . . . . . . . . . . . . . . . . . . 28
2.2 Subdevision of the Preisach triangle and the staircase formation due to the (a)decreasing input, and (b) increasing input. . . . . . . . . . . . . . . . . . . . . 29
2.3 Major curves and first order reversal curves. . . . . . . . . . . . . . . . . . . . 302.4 A sub-triangle inside a Preisach triangle. . . . . . . . . . . . . . . . . . . . . . 302.5 A static feedforward neural network. . . . . . . . . . . . . . . . . . . . . . . 332.6 First order reversal curves. . . . . . . . . . . . . . . . . . . . . . . . . . . . . 352.7 Block diagram of the adaptive current to strain hysteresis modeling of the SMA
actuator using NPM. . . . . . . . . . . . . . . . . . . . . . . . . . . . . . . . 382.8 Experimental setup. . . . . . . . . . . . . . . . . . . . . . . . . . . . . . . . 402.9 Schematic diagram of the circuit. . . . . . . . . . . . . . . . . . . . . . . . . 412.10 Validation of the displacement measurement using camera with respect to the
linear stage position displacement . . . . . . . . . . . . . . . . . . . . . . . . 43
ix

2.11 Experimental (dotted blue) and ANN approximated (solid green) (a) FOD and(b) FOA curves. . . . . . . . . . . . . . . . . . . . . . . . . . . . . . . . . . . 44
2.12 Input current for the validation of the NPM and the ANPM. . . . . . . . . . . 452.13 (a) Comparison of the NPM predicted strain (dashed red line) and the measured
strain (solid blue line), (b) error in the predicted strain. . . . . . . . . . . . . . 462.14 (a) Comparison of the ANPM predicted strain (dashed red line) and the mea-
sured strain (solid blue line), (b) error in the predicted strain. . . . . . . . . . . 472.15 ANPM predicted strain with respect to the temperature in comparison to the
experimental strain. . . . . . . . . . . . . . . . . . . . . . . . . . . . . . . . . 472.16 Open-loop response of the SMA actuator in the presence of uncertainties in
cooling rate. (a) Applied input current, (b) measured and predicted strain. . . . 482.17 Block diagram of the ANPMPC. . . . . . . . . . . . . . . . . . . . . . . . . . 492.18 Simulation results: closed-loop control response to the 0.1 Hz sinusoidal refer-
ence input of different DC offset. . . . . . . . . . . . . . . . . . . . . . . . . . 512.19 Simulation results: closed-loop control response to a 0.05 Hz sinusoidal refer-
ence input. . . . . . . . . . . . . . . . . . . . . . . . . . . . . . . . . . . . . . 512.20 Simulation results: closed-loop control response to the step reference inputs. . . 522.21 Experimental results: (a) closed-loop control response for step reference inputs
(b) magnified view for the first 80 seconds. . . . . . . . . . . . . . . . . . . . . 532.22 Experimental results: closed-loop control response for 0.05 Hz sinusoidal ref-
erence input. . . . . . . . . . . . . . . . . . . . . . . . . . . . . . . . . . . . . 542.23 Experimental results: closed-loop control response for 0.1 Hz sinusoidal refer-
ence inputs at different DC offsets. . . . . . . . . . . . . . . . . . . . . . . . . 542.24 Experimental results: (a) Closed-loop response of the SMA to the sinusoidal
reference input in the presence of cooling rate uncertainties and load distur-bances, (b) displacement of the linear stage. . . . . . . . . . . . . . . . . . . . 55
3.1 Nitinol strain sensor vs commercial metallic foil strain gauge. . . . . . . . . . . 603.2 Overview of the sensor data flow. . . . . . . . . . . . . . . . . . . . . . . . . . 633.3 Cantilever model of a da Vinci shaft integrated with strain sensors at two cross-
sections. Sensors opposite to S1x1 and S2
x1 are not shown. . . . . . . . . . . . 653.4 Experimental setup for calculating the gauge factor of Nitinol wire. . . . . . . . 663.5 (a) Left: A F/T sensor with a handle and a sensor interface, right: F/T sen-
sor mounted on a sensorized da Vinci instrument. (b) Cross-section of thesensorized da Vinci instrument shaft, showing Nitinol sensors orientation withrespect to x-y axes of F/T sensor. . . . . . . . . . . . . . . . . . . . . . . . . . 67
3.6 Data for calibration (a) the applied force, and (b) the sensor output. . . . . . . . 68
x

3.7 6 different orientations of the tip used for validating the sensor measurementwhen forces are acting at different orientations of the tip. . . . . . . . . . . . . 69
3.8 Normalized change in resistance with respect to strain in Nitinol wire (for 5repetitive cycles). . . . . . . . . . . . . . . . . . . . . . . . . . . . . . . . . . 69
3.9 Force measured by F/T sensor versus force measured by Nitinol strain sensor. . 713.10 Resultant force measured by the Nitinol sensors for a series of weights placed
at the tip for different orientations (see Figure 3.7). . . . . . . . . . . . . . . . 723.11 Nitinol sensor resolution characterization. . . . . . . . . . . . . . . . . . . . . 733.12 No-load signal drift in the force measurement, (a) immediately after turning on
the sensor and (b) 20 minutes after turning on the sensor. . . . . . . . . . . . . 73
xi

List of Tables
1.1 Different functions of SMAs . . . . . . . . . . . . . . . . . . . . . . . . . . . 12
2.1 Specifications of the SMA Parameters . . . . . . . . . . . . . . . . . . . . . . 342.2 Camera Intrinsic Parameters . . . . . . . . . . . . . . . . . . . . . . . . . . . 422.3 Camera Distortion Coefficients . . . . . . . . . . . . . . . . . . . . . . . . . . 42
3.1 Comparison of Nitinol sensor with commercial strain sensors . . . . . . . . . . 70
xii

List of Abbreviations
ANN Artificial Neural NetworkANPM Adaptive Neural Preisach ModelANPMPC Adaptive Neural Preisach Model Predictive ControlCTR Concentric-Tube RobotDAQ Data Acquisition CardDOF Degrees of FreedomEKF Extended Kalman FilterER Electrical ResistivityFBG Fiber Bragg GratingFDA U.S. Food and Drug AdministrationFG Field GeneratorFOA First Order AscendingFOD First Order DescendingFOR First Order ReversalGF Gauge FactorLMS Least Mean SquaresLM Levenberg-MarquardtMIST Minimally Invasive Surgery and TherapyMLP Multi-Layered PerceptronMPC Model Predictive ControlMRI Magnetic Resonance ImagingNOTES Natural Orifice Transluminal Endoscopic SurgeryNPM Neural Preisach ModelSMA Shape Memory AlloySME Shape Memory EffectSNR Signal-to-Noise ratioSPLS Single Port Laparoscopic SurgeryTSM Tendon Sheath Mechanisms
xiii

TPM Tendon Pulley MechanismsWCE Wireless Capsule Endoscopy
xiv

Chapter 1
Introduction
1.1 Minimally Invasive Surgery and Therapy (MIST)
MIST involves procedures that require a few small incisions on a patient’s body and specializedinstruments inserted through these incisions in order to access the surgical site. An endoscopeor some other form of imaging technique, such as ultrasound, magnetic resonance imaging(MRI) or X-Ray fluoroscopy, is also used to visualize the operating site during these proce-dures. The most commonly performed MIST involves needle and catheter based interventions.Over the past two decades, technological advances in MIST have led to the development ofmore innovative approaches for medical interventions, e.g, natural orifice transluminal endo-scopic surgery (NOTES) [1, 2] and single port (incision) laparoscopic surgery (SPLS) [3, 4],with the aim of further reducing trauma to the patient. In comparison to open procedures,MIST offers several advantages to the patient, such as less trauma, quicker recovery, shorterhospital stay and better cosmesis [5, 6]. However, MIST has several drawbacks:
1. Since laparoscopic procedures are performed using long slender instruments throughsmall access points, controlling the end effector of the instruments inside the patient’sbody becomes very counter-intuitive due to the fulcrum effect [7]. Because of the limiteddegrees of freedom of the instruments, dexterity is also impaired.
2. The organs cannot be directly manipulated by the clinician’s hands. Therefore the senseof touch that is available during open surgery is lost. This means that the clinician cannotreally feel how much force is being applied to the tissue. The ability to feel this force canhelp to improve the efficiency and accuracy in performing tasks such as suturing, bluntdissection and various needle and catheter based interventions.
1

1.2. ROBOT-ASSISTED MIST: ACTUATION AND SENSING TECHNOLOGIES 2
1.2 Robot-Assisted MIST: Actuation and SensingTechnologies
Over the past two decades, it has been clinically shown and accepted that with robotic assis-tance in MIST, the problems stated above can be overcome. One such robotic surgical systemthat has revolutionized the way MIST is performed is the da Vinci R© surgical system (Intu-itive Surgical Inc., Mountain View, CA) [8]. This is a commercially available system that hasbeen approved by the U.S. Food and Drug Administration (FDA) for several minimally inva-sive procedures. With robotic assistance, MIST can be performed with much higher accuracyand enhanced dexterity than with manual procedures. However, this brings with it several en-gineering design challenges for robotic researchers. The reduced access condition in MISTposes several restriction on the design of an appropriate robotic instrument. One major prob-lem is that, in addition to high dexterity, the instruments designed for these procedures must beminiaturized which impedes the use of traditional actuation mechanisms to manipulate the endeffector in a confined surgical environment. Incorporating strain and force sensing technologyin these instruments is another big challenge. In order to measure the deflection or bendingof the flexible instruments (such as needles, catheters and flexible endoscopes) during medicalinterventions, adequate strain sensors need to be developed which are small enough to passthrough the access port, and are able to measure large strains. Similarly, miniature force sensorare needed that can measure tool-tissue contact forces in order to restore the sense of forcefeedback for the surgeons during the procedures. The sensors and the part of the actuators thatremain inside the body during the procedure should also be bio-compatible and sterilizable ifthey are to be re-used.
The purpose of this section is to provide a brief overview of the state-of-the-art actua-tion and strain/force sensing mechanisms that are used in the instruments designed for varioustypes of robot-assisted MIST. First, different kinds of actuation mechanisms that are used tomanipulate the distal end of the instruments are discussed followed by a discussion of currentstrain/force sensing technologies. The reason that strain and force sensing technologies arediscussed together is that in most cases, forces are calculated by measuring strains in someparts of the instruments; so the basic technology remains the same. Along with the workingprinciple of these technology, examples of a few notable commercial products and researchworks are also presented in following sections.

1.2. ROBOT-ASSISTED MIST: ACTUATION AND SENSING TECHNOLOGIES 3
1.2.1 State-of-the-Art Actuation Technologies
Le et al. [9] have reviewed the different actuation mechanism used in many surgical and diag-nostic instruments except those required for needle-based intervention. In this section, a briefoverview of some important actuation mechanisms including those for needle-based interven-tions are provided.
1.2.1.1 Tendon Based Power Transmission
Tendon (or cable) based power transmission is the most commonly implemented actuationmechanism to manipulate the end effector of the instruments used for MIST. In a tendon basedforce transmission mechanism, the instrument’s end effector which remains inside the patient’sbody during the procedure, can be easily manipulated by actuators located far apart at the prox-imal end of the instrument and outside the patient’s body. Cable driven actuation mechanismscan be divided into two groups: tendon-pulley mechanisms (TPM) and tendon-sheath mech-anisms (TSM) [9]. In TPM, a cable is routed around at-least two pulleys: one at the distalend connected to the end effector, and another at the proximal end connected to the actuator(see Figure 1.1). Thus, the rotation of the actuator at the instrument’s base can make the endeffector to rotate in the same direction. The pulleys and the cables are self contained in a longand sufficiently thin shaft to pass through a small incision. The TPM is generally utilized inrigid surgical instruments, for example, laparoscopic instruments design for the da Vinci andthe RAVEN surgical robots [10, 11]. The TSM on the other hand consists of a cable insidea hollow sheath (such as a hellical coil) where one end of the cable is connected to the dis-tal end of the instrument. To actuate the end effector of the instruments, another end of thecable is pulled using an external actuator, thus, the cable slides inside the hollow sheath andforces are transmitted to the distal end of the sheath. This type of actuation mechanism ismostly utilized in flexible instruments such as flexible endoscopes and catheters. The two mostnotable flexible endoscopic robotic systems that use TSM for their instruments are ViaCath(Hansen Medical, Mountain View, CA, United States) [12] and MASTER (Nanyang Tech-nological University, Singapore) [13]. The two commercially available robotic systems havebeen designed mainly for NOTES procedure. Artisan ExtendTM (Hansen Medical, MountainView, CA, United States) is an example of an FDA approved robotic catheter that uses TSM tonavigate it inside the blood vessels during the vascular procedures.
1.2.1.2 Magnetically Controlled Actuation
Magnetically controlled actuation is another very attractive way of actuation which has gainedpopularity in the last decade for use in medical interventions. Unlike the tendon driven actua-

1.2. ROBOT-ASSISTED MIST: ACTUATION AND SENSING TECHNOLOGIES 4
Figure 1.1: A tendon-pulley actuation mechanism [14].
tion mechanism (described in the previous section), a magnetically controlled actuation mech-anism does not require any kind of mechanical link between the end-effector and the actuator.In this type of mechanism, a small magnetic component is usually embedded near/inside theend effector of the instrument. The position or/and the orientation of this magnetic componentis then controlled by externally moving permanent magnets or electromagnets. An extensivereview on magnetically controlled medical devices is given in [15]. Some notable examplesof magnetically controlled robotic catheter systems are Niobe R© magnetic navigation system(Stereotaxis, Inc., St. Louis, MO, United States) [16] and catheter guidance control and imag-ing (CGCI) system (Magnetecs Corp., Inglewood, CA) [17]. The Niobe R© system uses two largepermanent magnets, located on both sides of the patient’s bed, to guide the catheter inside theheart. The catheter tip integrated with a small magnet is precisely oriented and positioned byrotating and moving the two permanent magnets mounted on robotic arms. The CGCI systemon the other hand uses eight electromagnets, located around the patient’s bed and mounted onfour robotic arms, to control and navigate the catheter inside blood vessels. The Niobe R© mag-netic system has been approved by FDA for several cardiovascular interventional procedures,and is currently commercially available.
Another potential application of magnetically controlled actuation is in wireless capsuleendoscopy (WCE) for visual examination of the gastrointestinal track (specially small intes-tine). The Niobe R© system (mentioned above) has been proposed for WCE as well [18] and itsperformance has been evaluated through in-vivo experiments in [19].
1.2.1.3 Bevel-tip Flexible Needle Steering
Bevel-tip flexible needle steering is a type of actuation mechanism that is used in needle-basedinterventions where the needle has to continuously maneuver within tissues, such as duringbiopsy and therapy. In these kind of procedures, the needle has to be steered inside the tissuein order to avoid anatomical obstacles or to compensate for errors in reaching specific targets.A bevel-tip flexible needle (with or without a pre-bend near the tip) when inserted into tissue,bends in the direction of the tip asymmetry. Thus, by rotating and translating the base of the

1.2. ROBOT-ASSISTED MIST: ACTUATION AND SENSING TECHNOLOGIES 5
needle, using rotational and linear stages, the needle can be steered to reach its target whileavoiding collision with some anatomical obstacles [20]. This type of actuation mechanismdepends on needle-tissue interaction forces, needle deflection and tissue deformation, whichhave been studied by several researchers, e.g., [20–23].
Figure 1.2: Bevel tip flexible needle steering. [22]
1.2.1.4 Concentric-Tube-Robot (CTR)
CTRs are a relatively new type of robotic systems that have been specifically designed forminimally invasive needle-based interventions [24]. The main motive behind developing theserobots is to enhance the steering capability of the needles during needle-based interventions re-gardless of the type of tissue, i.e. soft tissue or hard tissue or fluid-filled body cavity. In order toachieve this goal, CTRs are comprised of two or more pre-curved superelastic metal/metal al-loy tubes of different stiffness inserted concentrically (Figure 1.3). Thus, by inserting/retractingand rotating each tube with respect to the other using linear and rotary stages the needle can besteered to follow complex 3D trajectories [24–26].
It should be noted that all these mechanisms require heavy actuators at the base of theinstruments or close outside the patient body. These actuators transmit power to the end-effector of the instrument (which remains inside the patient’s body) via cables, thin flexible

1.2. ROBOT-ASSISTED MIST: ACTUATION AND SENSING TECHNOLOGIES 6
Figure 1.3: A concentric tube robot comprising of four concentric curved tubes [27].
needles or magnetically controlled actuation mechanisms in order to manipulate them insidethe body. In most cases, for every additional degree of freedom of the end-effector insidethe patient’s body, the number of actuators outside the body has to be increased. Therefore,enhancing the dexterity of an instruments usually results in increased cost of the instrumentand the space required for them. Although, these robotic instruments have greatly improvedthe way MIST was performed two decades ago, they are still nowhere close to their optimaldesign in terms of the cost and the space they acquire in the operating room.
1.2.2 State of the Art Strain/Force Sensing Technologies
A good literature survey of existing force sensing technologies is given in [28]. This sectionprovides a brief overview of some important strain/force sensing technologies and a few exam-ples.
1.2.2.1 Strain Gauges
Strain gauges are the most commonly used strain sensors that convert mechanical strain that isbeing applied to them into measurable electrical voltages. The working principle of the straingauge is that their electrical resistance changes when strain is applied to them. This changein resistance can be measured by a quarter, half or full Wheatstone bridge circuit[29]. It isimportant to mention that if the resistance of a strain gauge is very low, even a small excitationvoltage may cause significant temperature drift in the sensor output as a result of Joule heating[29]. Existing strain gauges can be divided into two main categories: metallic foil strain gaugesand semiconductor strain gauges. Most of the metallic foil strain gauges have a maximumstrain measurement range of 1.5% to 5%, whereas semiconductor strain gauges can measurestrain up to only 0.5%. However, semiconducor strain gauges are 10 to 20 times more sensitivethan metallic foil strain gauges. Therefore, semiconductor strain gauges are preferred over foilgauges in those applications where low measuring strains and high sensitivity are required.For example, in [30], a miniature force sensor is designed to measure three dimensional forces
1.2. ROBOT-ASSISTED MIST: ACTUATION AND SENSING TECHNOLOGIES 7
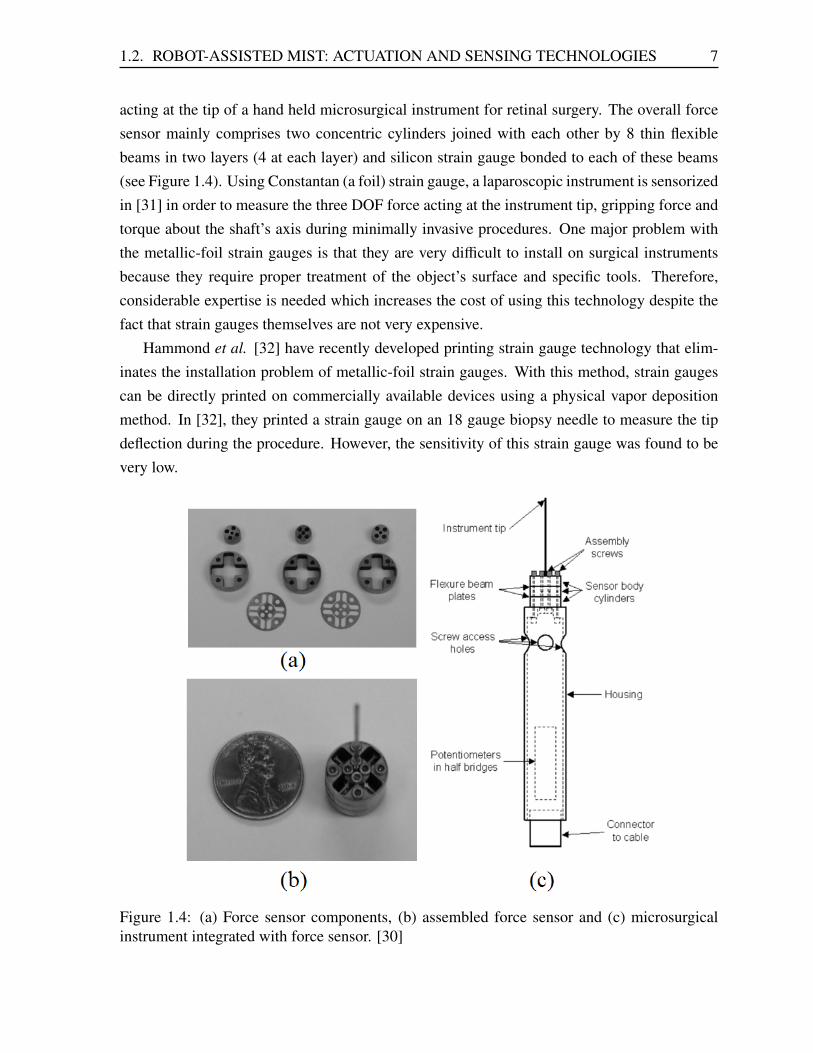
acting at the tip of a hand held microsurgical instrument for retinal surgery. The overall forcesensor mainly comprises two concentric cylinders joined with each other by 8 thin flexiblebeams in two layers (4 at each layer) and silicon strain gauge bonded to each of these beams(see Figure 1.4). Using Constantan (a foil) strain gauge, a laparoscopic instrument is sensorizedin [31] in order to measure the three DOF force acting at the instrument tip, gripping force andtorque about the shaft’s axis during minimally invasive procedures. One major problem withthe metallic-foil strain gauges is that they are very difficult to install on surgical instrumentsbecause they require proper treatment of the object’s surface and specific tools. Therefore,considerable expertise is needed which increases the cost of using this technology despite thefact that strain gauges themselves are not very expensive.
Hammond et al. [32] have recently developed printing strain gauge technology that elim-inates the installation problem of metallic-foil strain gauges. With this method, strain gaugescan be directly printed on commercially available devices using a physical vapor depositionmethod. In [32], they printed a strain gauge on an 18 gauge biopsy needle to measure the tipdeflection during the procedure. However, the sensitivity of this strain gauge was found to bevery low.
Figure 1.4: (a) Force sensor components, (b) assembled force sensor and (c) microsurgicalinstrument integrated with force sensor. [30]
1.2. ROBOT-ASSISTED MIST: ACTUATION AND SENSING TECHNOLOGIES 8
1.2.2.2 Optical Sensors
The basic working principle of the optical sensing technology is the change in properties (suchas intensity or wavelength) of the light being passed through the optical fiber in response tochange in the physical properties (such as temperature or strain) of the fiber. Fiber BraggGrating (FBG) sensors are a popular type of optical sensing technology. They are manufacturedby inscribing periodic/aperiodic variations of refractive index into the fiber core. As a result,when an FBG sensor experience some strain, the wavelength of the reflected light is changed.By measuring the shift in the reflected wavelength, strain can be measured up to 1 µ strainof accuracy. TacticathTM (EndosenseTM, SA, Geneva, Switzerland) [33] is an FDA approvedablation catheter that uses FBG sensors to measure contact forces applied by the catheter tipto the heart wall during a cardiac ablation procedure. The force sensor at the distal end of thecatheter consists of a deformable body made of some elastic polymer and three optical fibreswith FBG sensors on the deformable body (Figure 1.5) [34]. The force at the tip of the cathetercauses strain in the optical fibres which in turn changes the wavelength of the reflected light bythe FBG sensors. Thus, by measuring these change in wavelength both axial and lateral forcesare computed. An application of the FBG sensors in needle-based interventions can be foundin [35]. In [35], the FBG sensors are used to measure 3D deflection of an 18 gauge needleduring MRI based interventions. Instead of embedding FBGs on a hollow outer needle, theauthors modified the inner stylet of the needle by making grooves on it at 120 intervals alongits axis, and then attached FBG sensors inside the three grooves. Assuming a cantilever beammodel for the needle, the tip deflection is then calculated by measuring strain values from thesesensors.
Although, FBG sensors can provide high accuracy and resolution of strain measurements,they are not desirable to be used for disposable instruments because of their high manufacturingcost. In addition, the interrogator system for measuring the wavelength reflected by them is alsovery expensive (around $20,000 CAD). Therefore, using FBG sensors for strain-measurementalways results in a cost-ineffective instrument.
1.2.2.3 Electromagnetic Sensors
Electromagnetic sensors consist of at least two main components: a field generator (FG) and asensing coil. The FG generates a position varying electromagnetic field which induces currentin the sensing coil. The current induced in the sensing coil depends upon the angle and distanceof the sensing coil from the FG. Thus, by measuring the electrical signals from the sensing coil,the relative position between the two is calculated. THERMOCOOL R© SMARTTOUCHTM
(Biosense Webster, Inc., Diamond Bar, CA, United States) is the first FDA approved commer-

1.3. SHAPE MEMORY ALLOYS (SMAS) 9
Figure 1.5: TacticathTM contact force catheter [34].
cially available cardiac ablation catheter [36] that has contact force sensor at the tip. The forcesensor at the distal end of this catheter is comprised of a tiny spring, transmission coil and threelocation (receiver/sensing) coils (see Figure 1.6). The spring allows small bending in it whenthe catheter tip comes in contact with tissues. The transmission coil emits electromagneticreference signals, and based on the signals received by the three location coils, bending in thespring is computed in order to estimate the magnitude and angle of the contact forces.
1.3 Shape Memory Alloys (SMAs)
SMAs are metallic alloys that exist in two stable phases: a high temperature Austenite phase,and a low temperature Martensite phase. A reversible solid-solid diffusionless transition be-tween these two phases leads to some unique properties of SMAs [38], which are describedbelow.a) Shape Memory Effect (SME): The ability of SMAs to remember their original shape isknown as SME. This property of SMAs can be illustrated by Figure 1.7. At high temperatures,SMAs exist in the Austenite phase which has a compact and uniform cubic crystal structure.Upon cooling them below the Austenite to Martensite transition temperature (TA→M), theyare transformed into a relatively softer and easily deformable phase which is referred to as“twinned Martensite” phase. When the external stress is applied at this phase, the twinnedMartensite phase undergoes some deformation. This deformed phase is known as “detwinned

1.3. SHAPE MEMORY ALLOYS (SMAS) 10
Figure 1.6: THERMOCOOL R© SMARTTOUCHTM catheter [37].
Martensite” phase. At this stage, if the SMAs are subjected to heating, a reverse transformationoccurs above Martensite to Austenite transition temperature (TM→A), and they are transformedback to their parent Austenite phase, thus returning to their original shape.b) Superelasticity/ pseudoelasticity: Superelasticity is another important property that resultsfrom stress induced Austenite to Martensite transformation of SMAs. At their high temperatureAustenite phase when external load is applied to SMAs, they are directly transformed into thedetwinned Martensite phase and show large deformations. But, they quickly return to theiroriginal shape as soon as the load is removed. This occurs without any application of heat(Figure 1.8). This property of SMAs is known as superelasticity or pseudoelasticity.c) Electrical resistivity (ER) variations: Besides the SME and the superelasticity, SMAsalso show very interesting behavior in their electrical resistance in response to the thermo-mechanical loadings. Several thermo-mechanical tests have been conducted in [39] to studythe variations in the SMAs’ ER when they are transformed from one phase to another. And, Itis clearly evident from the literature that apart from having two different crystalline structures,SMAs also have noticeably different ER in their respective phases (Austenite and Martensitephase). In general, the ER in the Martensite phase is higher than that in the Austenite phase.Therefore, unlike other metals or metallic alloys, the electrical resistance of SMAs varies notonly due to the direct effects of the stress and temperature but also due to stress and temperatureinduced Austenite-Martensite transformation.

1.3. SHAPE MEMORY ALLOYS (SMAS) 11
Figure 1.7: Shape memory effect.
Figure 1.8: Superelastic/ pseudoelastic effect.
By utilizing the combinations of these properties, i.e. SME, superelasticity and ER vari-ations, the SMAs have found a number of biomedical and non-biomedical applications, andhave been made to function in many different ways. However, in the next few sections, onlythose minimally invasive biomedical applications are discussed where they are used either asactuators, as self sensing actuators or simply as strain sensors.
The property of remembering their original shape (i.e. the SME) enables SMAs to producelarge force and strain when they are transformed from their deformed Martensite phase to theAustenite phase on application of heating. A typical 5 cm long Nitinol shape memory wire of0.25 mm diameter can generate up to 8.9 N force over a 2 mm displacement [40] on heating.Thus, by controlling the temperature of SMAs, they can be used as actuators.
As mentioned earlier the SME in SMAs is the result of temperature induced Austenite-
1.3. SHAPE MEMORY ALLOYS (SMAS) 12
Martensite transformation whereas superelasticity is the result of stress induced Austenite-Martensite transformation. Moreover, the two phases have different ER. Therefore, when thetemperature induced Austenite-Martensite transformation occurs and the change in the resis-tance is used to estimate strain, the SMAs are know to work as the self sensing actuators. And,when the stress induced Austenite-Martensite transformation occurs and the resistance is usedto estimate strain, the SMAs act purely as strain sensors.
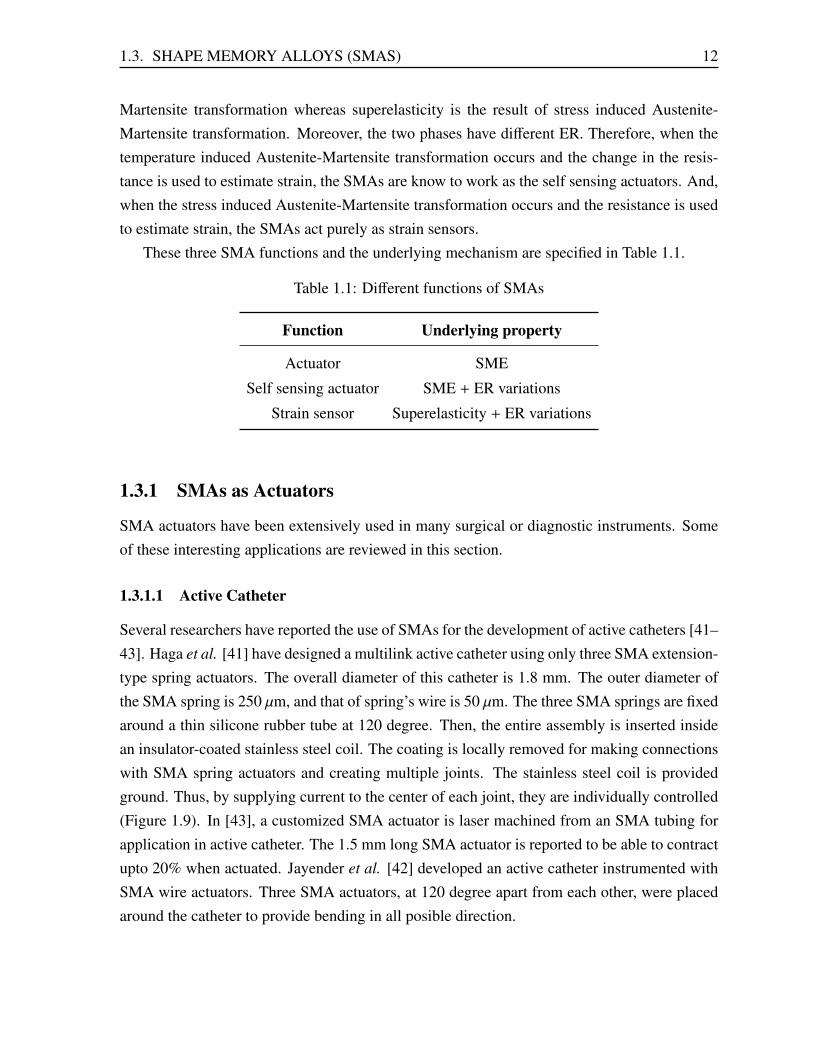
These three SMA functions and the underlying mechanism are specified in Table 1.1.
Table 1.1: Different functions of SMAs
Function Underlying property
Actuator SME
Self sensing actuator SME + ER variations
Strain sensor Superelasticity + ER variations
1.3.1 SMAs as Actuators
SMA actuators have been extensively used in many surgical or diagnostic instruments. Someof these interesting applications are reviewed in this section.
1.3.1.1 Active Catheter
Several researchers have reported the use of SMAs for the development of active catheters [41–43]. Haga et al. [41] have designed a multilink active catheter using only three SMA extension-type spring actuators. The overall diameter of this catheter is 1.8 mm. The outer diameter ofthe SMA spring is 250 µm, and that of spring’s wire is 50 µm. The three SMA springs are fixedaround a thin silicone rubber tube at 120 degree. Then, the entire assembly is inserted insidean insulator-coated stainless steel coil. The coating is locally removed for making connectionswith SMA spring actuators and creating multiple joints. The stainless steel coil is providedground. Thus, by supplying current to the center of each joint, they are individually controlled(Figure 1.9). In [43], a customized SMA actuator is laser machined from an SMA tubing forapplication in active catheter. The 1.5 mm long SMA actuator is reported to be able to contractupto 20% when actuated. Jayender et al. [42] developed an active catheter instrumented withSMA wire actuators. Three SMA actuators, at 120 degree apart from each other, were placedaround the catheter to provide bending in all posible direction.

1.3. SHAPE MEMORY ALLOYS (SMAS) 13
Figure 1.9: SMA springs actuated active catheter [41].
1.3.1.2 Active Needle
Ayvali et al. [44] have developed a discretely actuated cannula using a customized Nitinolshape memory actuators for applications in percutaneous and intravascular procedures. Thesteerable cannula has three straight segments of stainless steel which are then joined by twoNitinol wires (Figure 1.10). The Nitinol wires are annealed to achieve arc shape at high tem-perature Austenite phase. This design provides local actuation at each joint of the cannula tosteer it and guide to the target location. The overall outer diameter of the final prototype is3 mm.
1.3.1.3 Neurosurgical robot
Ho et al. have developed an MRI compatible SMA actuated neurosurgical robot in [45]. Thisrobot has nine serially connected pivot joints where each joint is locally actuated by two antag-onistic SMA wires. With some improvements, they redesigned the robot in [46]. In this design,instead of locally actuating using SMA wires, tendon-sheath mechanism is used and the freeend of the two tendons were pulled by two antagonistically connected SMA springs. The mainadvantage of using tendon-sheath mechanism is that SMA actuator can be placed sufficiently

1.3. SHAPE MEMORY ALLOYS (SMAS) 14
Figure 1.10: SMA actuated steerable cannula [44].
away from the actuating robot and outside the imaging region of MRI scanner. This helps inproducing less artifacts in the MR images which is caused by energy dissipated by SMA wires.In addition, the current version of the robot is also shown to be capable of producing largerange of motion and large output forces.
Figure 1.11: SMA actuated MRI compatible neurosurgical robot developed by Ho et al. [46].
1.3.2 SMAs as Self Sensing Actuators
As a self sensing actuators, SMAs have been used to design an active endoscope in [47], andan active laparoscopic instrument in [48], which are discussed as follows.

1.3. SHAPE MEMORY ALLOYS (SMAS) 15
1.3.2.1 Active Endoscope
In [47], Ikuta et al. designed a 13 mm diameter active flexible endoscope using SMA springactuators. The endoscope consists of five segments; four of them have flexibility in the samedirection, and the one close to the tip has flexibility in an orthogonal direction. Each segmentcomprises a stainless steel coil and a pair of antagonistically connected SMA spring actuators(Figure 1.12). The outer diameter of the SMA spring actuators is 1 mm and the diameter of itswire is 0.2 mm. The bending of each segment is obtained by electrically heating the SMAs,while their resistance is used as a feedback to control it.
Figure 1.12: An active endoscope designe by Ikuta et al. [47]
1.3.2.2 Active Laparoscpic Instrument
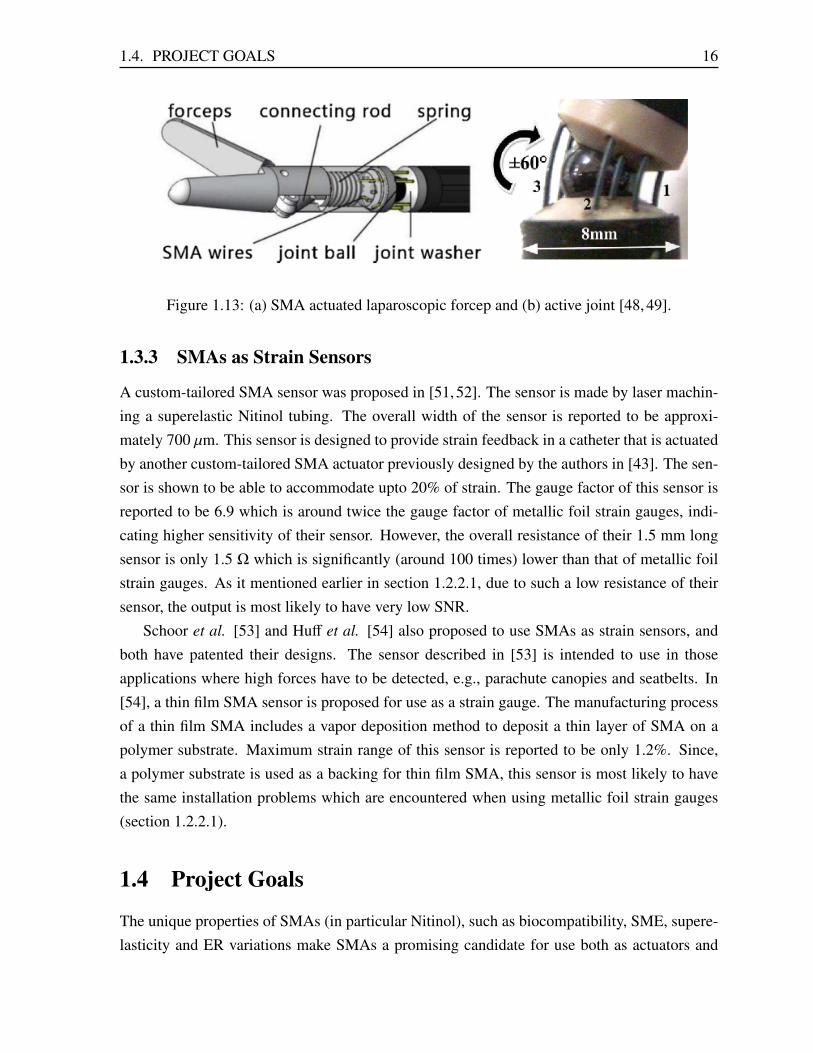
In [48, 49], an SMA actuated laparoscopic surgical instrument, with 8 mm of outer diameter,is described. The end-effector of the instrument has three degrees of freedom (pitch, yaw andgrip). The end-effector is composed of a ball-joint link, that can be rotated around two axesusing 3 pairs of SMA wires, and another pair of SMA wires along with one spring is used tooperate the forceps. Using SMA wires’ own resistance as feedback, a closed-loop control isimplemented to control the wrist motion [50] in all three degrees of freedom. Several in vitroand in vivo experiments are conducted to evaluate the device’s performance such as maximumforce, velocity and end-effector inclination. It is shown that the proposed design method issufficient for the assistance task such as clamping, pulling and holding tissue.
1.4. PROJECT GOALS 16
Figure 1.13: (a) SMA actuated laparoscopic forcep and (b) active joint [48, 49].
1.3.3 SMAs as Strain Sensors
A custom-tailored SMA sensor was proposed in [51, 52]. The sensor is made by laser machin-ing a superelastic Nitinol tubing. The overall width of the sensor is reported to be approxi-mately 700 µm. This sensor is designed to provide strain feedback in a catheter that is actuatedby another custom-tailored SMA actuator previously designed by the authors in [43]. The sen-sor is shown to be able to accommodate upto 20% of strain. The gauge factor of this sensor isreported to be 6.9 which is around twice the gauge factor of metallic foil strain gauges, indi-cating higher sensitivity of their sensor. However, the overall resistance of their 1.5 mm longsensor is only 1.5 Ω which is significantly (around 100 times) lower than that of metallic foilstrain gauges. As it mentioned earlier in section 1.2.2.1, due to such a low resistance of theirsensor, the output is most likely to have very low SNR.
Schoor et al. [53] and Huff et al. [54] also proposed to use SMAs as strain sensors, andboth have patented their designs. The sensor described in [53] is intended to use in thoseapplications where high forces have to be detected, e.g., parachute canopies and seatbelts. In[54], a thin film SMA sensor is proposed for use as a strain gauge. The manufacturing processof a thin film SMA includes a vapor deposition method to deposit a thin layer of SMA on apolymer substrate. Maximum strain range of this sensor is reported to be only 1.2%. Since,a polymer substrate is used as a backing for thin film SMA, this sensor is most likely to havethe same installation problems which are encountered when using metallic foil strain gauges(section 1.2.2.1).
1.4 Project Goals
The unique properties of SMAs (in particular Nitinol), such as biocompatibility, SME, supere-lasticity and ER variations make SMAs a promising candidate for use both as actuators and
1.5. SIGNIFICANT CHALLENGES 17
strain sensors for applications in minimally invasive interventions. Therefore, the objective ofreducing cost and design complexity of the actuation mechanism in existing robotic surgicalinstruments while cost-effectively providing force and/or strain feedback to the user (clinician),leads to the two main goals of this research project:
1. To develop a framework in order to control the output of the SMA actuators in real-timeso that they can be used for position or force control. To achieve this goal, a model ofstrain in an SMA actuator with respect to input current is required. Then, using thismodel, a real-time control strategy needs be developed to appropriately control the SMAactuators.
2. To explore the use of SMAs as strain sensors for instrumentation of minimally invasiveinterventions. In order to achieve this goal, the use of superelastic SMAs as strain sensorsneed to be studied in order to develop a design that is simple and can be easily integratedon existing surgical instruments.
1.5 Significant Challenges
The main drawback of using SMA actuators is the nonlinear hysteretic behavior of strain withrespect to input current which makes them difficult to control in real-time. In particular, forapplications in minimally invasive interventions where accurate positioning of the instrument isrequired, this problem becomes challenging. Therefore, there is a need to develop an accuratemodel for SMA actuators which can be used to precisely control an SMA actuated end-effector.The Preisach model is a phenomenological model that can accurately describe the behavior ofhysteresis in SMAs based on offline stored experimental data. However, using offline data toimplement real-time control is not very convenient. Additionally, updating the offline data inorder to adapt to changes in the operating condition is also challenging. Therefore, there is aneed to develop an accurate model that can overcome these challenges.
Another major challenge is associated with the development of an SMA strain sensor suit-able for thin, possibly flexible, surgical instruments. The sensor should be sensitive enoughto accurately measure the forces, and have a large recoverable strain range to avoid saturationwhen measuring bending strain in flexible instruments. The sensor must also be far thinnerthan the instruments itself in order to accurately measure strain while maintaining the maxi-mum allowable size of the instrument. In addition, due to low space constraints in MIST, issuesin sensor installation and lead wire connections should also be properly addressed.

1.6. CONTRIBUTIONS 18
1.6 Contributions
The main contributions of this thesis can be summarized as follows.
1. A highly accurate adaptive ANN based Preisach model is proposed in this thesis. Theproposed model can effectively deal with uncertainties and can be easily used in a real-time control. Thus, the proposed model overcomes the major drawbacks of the Preisachmodel while keeping its underlying characteristics. Furthermore, a novel control frame-work is also presented that uses this adaptive model and a model predictive control tech-nique to control the SMA actuator.
2. A novel ultra thin strain sensor is also introduced in this thesis. With the advantage ofthin size (15 µm), low cost, high sensitivity and large strain measurement range, thissensor provides a good practical alternative to current strain sensing technologies. Therelatively higher sensitivity and larger strain measurement range of this sensor make itsuitable for both rigid and flexible instruments. To the best of our knowledge, thereis no commercially available strain sensor that is as thin as the sensor proposed in thisthesis with similar sensitivity and range. The ultra thin size in addition to the designingsimplicity of the sensor make it easy to install on almost all kinds of surgical instruments.
1.7 Outline of the Thesis
The thesis consists of four chapters.Chapter 1 - Introduction
This chapter presents an overview of the state-of-the-art for actuation and sensing technolo-gies used in current robotic surgical instruments, and discusses their major drawbacks. Theunique properties of the SMAs in the context of specific applications are discussed that help inidentifying SMAs as a potential alternative to existing actuation and sensing technologies.
Chapter 2 - Hysteresis Modeling and Control of Shape Memory Alloy Actuators
In this chapter, we developed a model and a control strategy to control the strain in an SMAactuator. For this purpose, the Preisach model is modified by using ANNs to replace the ex-perimentally stored data required for the Preisach model with the ANN’s weight parameters.Then, the extended Kalman filter (EKF) algorithm is used to update these weight parametersonline in order to model the disturbances present in the system. Based on this adaptive model,a model predictive controller is implemented to control the strain in a shape memory Nitinol

1.7. OUTLINE OF THE THESIS 19
wire actuator. The performance of the proposed model and the controller is verified throughseveral experiments.
Chapter 3 - Design of an Ultra Thin Superelastic Shape Memory Alloy Strain Sensor
This chapter presents the design of a novel ultra thin strain sensor using a superelastic Niti-nol wire. Before using Nitinol as a strain sensor, some important properties of Nitinol arediscussed in the first section followed by the sensor selection criteria and a method for leadwire connection. Then, a method to use this sensor for measuring forces acting at the tip of arigid surgical instrument is presented. To validate the force sensing capability of the proposedsensor, a da Vinci surgical instrument is sensorized using these sensors. Several experimentsare performed to characterize different features such as force measurement accuracy, resolutionand temperature drift.
Chapter 4 - Conclusion and Future Works
Chapter 4 provides concluding remarks followed by some suggestions for future works.

Bibliography
[1] T. Arulampalam, S. Paterson-Brown, A. Morris, and M. Parker, “Natural orifice trans-luminal endoscopic surgery,” The Annals of The Royal College of Surgeons of England,vol. 91, no. 6, pp. 456–459, 2009.
[2] G. Sebastian, E. J. DeMaria, J. D. Reynolds, D. D. Portenier, and A. D. Pryor, “New de-velopments in surgery: natural orifice transluminal endoscopic surgery (notes),” Archives
of Surgery, vol. 142, no. 3, pp. 295–297, 2007.
[3] T. E. Udwadia et al., “Single-incision laparoscopic surgery: An overview,” Journal of
Minimal Access Surgery, vol. 7, no. 1, p. 1, 2011.
[4] A. Cuschieri, “Single-incision laparoscopic surgery,” Journal of Minimal Access Surgery,vol. 7, no. 1, p. 3, 2011.
[5] M. Ohgami, S. Ishii, Y. Arisawa, T. Ohmori, K. Noga, T. Furukawa, and M. Kitajima,“Scarless endoscopic thyroidectomy: breast approach for better cosmesis,” Surgical La-
paroscopy Endoscopy & Percutaneous Techniques, vol. 10, no. 1, pp. 1–4, 2000.
[6] E. Kilger, F. Weis, A. Goetz, L. Frey, K. Kesel, A. Schutz, P. Lamm, P. Uberfuhr, A. Knoll,T. Felbinger, et al., “Intensive care after minimally invasive and conventional coronarysurgery: a prospective comparison,” Intensive Care Medicine, vol. 27, no. 3, pp. 534–539, 2001.
[7] A. Gallagher, N. McClure, J. McGuigan, K. Ritchie, and N. Sheehy, “An ergonomicanalysis of the fulcrum effect in the acquisition of endoscopic skills,” Endoscopy, vol. 30,no. 07, pp. 617–620, 1998.
[8] “Intuitive Surgical Inc.”. [Online]. Available: http://http://www.intuitivesurgical.com
[9] H. M. Le, T. N. Do, and S. J. Phee, “A survey on actuators-driven surgical robots,” Sensors
and Actuators A: Physical, 2016.
20
BIBLIOGRAPHY 21
[10] T. Murphy and M. Nixon, “Surgical instrument wrist,” Sept. 24 2013, US Patent8,540,748.
[11] M. J. Lum, D. C. Friedman, G. Sankaranarayanan, H. King, K. Fodero, R. Leuschke,B. Hannaford, J. Rosen, and M. N. Sinanan, “The raven: Design and validation of atelesurgery system,” The International Journal of Robotics Research, vol. 28, no. 9, pp.1183–1197, 2009.
[12] D. J. Abbott, C. Becke, R. I. Rothstein, and W. J. Peine, “Design of an endoluminal notesrobotic system,” in 2007 IEEE/RSJ International Conference on Intelligent Robots and
Systems, Oct 2007, pp. 410–416.
[13] S. J. Phee, S. C. Low, V. Huynh, A. P. Kencana, Z. Sun, and K. Yang, “Master andslave transluminal endoscopic robot (master) for natural orifice transluminal endoscopicsurgery (notes),” in 2009 Annual International Conference of the IEEE Engineering in
Medicine and Biology Society. IEEE, 2009, pp. 1192–1195.
[14] S. C. Jacobsen, H. Ko, E. K. Iversen, and C. C. Davis, “Control strategies for tendon-driven manipulators,” IEEE Control Systems Magazine, vol. 10, no. 2, pp. 23–28, Feb1990.
[15] L. Sliker, G. Ciuti, M. Rentschler, and A. Menciassi, “Magnetically driven medical de-vices: a review,” Expert Review of Medical Devices, vol. 12, no. 6, pp. 737–752, 2015.
[16] “Stereotaxis, Inc.”. [Online]. Available: http://www.stereotaxis.com
[17] “Magnetecs Corp.”. [Online]. Available: http://www.magnetecs.com
[18] F. Carpi and C. Pappone, “Stereotaxis niobe magnetic navigation system for endocar-dial catheter ablation and gastrointestinal capsule endoscopy,” Expert Review of Medical
Devices, vol. 6, no. 5, pp. 487–498, 2009.
[19] F. Carpi, N. Kastelein, M. Talcott, and C. Pappone, “Magnetically controllable gas-trointestinal steering of video capsules,” IEEE Transactions on Biomedical Engineering,vol. 58, no. 2, pp. 231–234, 2011.
[20] N. Abolhassani, R. Patel, and M. Moallem, “Needle insertion into soft tissue: A survey,”Medical Engineering & Physics, vol. 29, no. 4, pp. 413 – 431, 2007.
[21] R. J. Webster, J. S. Kim, N. J. Cowan, G. S. Chirikjian, and A. M. Okamura, “Nonholo-nomic modeling of needle steering,” The International Journal of Robotics Research,vol. 25, no. 5-6, pp. 509–525, 2006.
BIBLIOGRAPHY 22
[22] K. B. Reed, A. Majewicz, V. Kallem, R. Alterovitz, K. Goldberg, N. J. Cowan, andA. M. Okamura, “Robot-assisted needle steering,” IEEE Robotics & Automation Maga-
zine, vol. 18, no. 4, pp. 35–46, 2011.
[23] A. Asadian, M. R. Kermani, and R. V. Patel, “Robot-assisted needle steering using acontrol theoretic approach,” Journal of Intelligent & Robotic Systems, vol. 62, no. 3, pp.397–418, 2011.
[24] P. Sears and P. Dupont, “A steerable needle technology using curved concentric tubes,”in 2006 IEEE/RSJ International Conference on Intelligent Robots and Systems. IEEE,2006, pp. 2850–2856.
[25] H. B. Gilbert, D. C. Rucker, and R. J. Webster III, “Concentric tube robots: The state ofthe art and future directions,” in Robotics Research. Springer, 2016, pp. 253–269.
[26] R. Xu, A. Asadian, S. F. Atashzar, and R. V. Patel, “Real-time trajectory tracking for exter-nally loaded concentric-tube robots,” in 2014 IEEE International Conference on Robotics
and Automation (ICRA). IEEE, 2014, pp. 4374–4379.
[27] P. E. Dupont, J. Lock, B. Itkowitz, and E. Butler, “Design and control of concentric-tuberobots,” IEEE Transactions on Robotics, vol. 26, no. 2, pp. 209–225, 2010.
[28] A. Trejos, R. Patel, and M. Naish, “Force sensing and its application in minimally invasivesurgery and therapy: a survey,” Proceedings of the Institution of Mechanical Engineers,
Part C: Journal of Mechanical Engineering Science, vol. 224, no. 7, pp. 1435–1454,2010.
[29] D. Patranabi, Sensors and Transducers, 2nd ed. PHI Learning Pvt. Ltd., 2003.
[30] P. Berkelman, L. Whitcomb, R. Taylor, and P. Jensen, “A miniature microsurgical instru-ment tip force sensor for enhanced force feedback during robot-assisted manipulation,”IEEE Transactions on Robotics and Automation, vol. 19, no. 5, pp. 917–921, Oct. 2003.
[31] A. L. Trejos, R. V. Patel, M. D. Naish, A. C. Lyle, and C. M. Schlachta, “A sensorizedinstrument for skills assessment and training in minimally invasive surgery,” ASME. J.
Med. Devices, vol. 3, no. 4, pp. 041 002–12, Nov. 2009.
[32] F. L. Hammond, M. J. Smith, and R. J. Wood, “Estimating surgical needle deflectionwith printed strain gauges,” in the 36th Annual International Conference of the IEEE
Engineering in Medicine and Biology Society, Aug. 2014.
BIBLIOGRAPHY 23
[33] “St. Jude Medical, Inc.”. [Online]. Available: http://www.sjm.com
[34] K. Yokoyama, H. Nakagawa, D. C. Shah, H. Lambert, G. Leo, N. Aeby, A. Ikeda, J. V.Pitha, T. Sharma, R. Lazzara, et al., “Novel contact force sensor incorporated in irri-gated radiofrequency ablation catheter predicts lesion size and incidence of steam popand thrombus,” Circulation: Arrhythmia and Electrophysiology, vol. 1, no. 5, pp. 354–362, 2008.
[35] Y.-L. Park, S. Elayaperumal, B. Daniel, S. C. Ryu, M. Shin, J. Savall, R. J. Black,B. Moslehi, and M. R. Cutkosky, “Real-time estimation of 3-d needle shape and deflec-tion for mri-guided interventions,” IEEE/ASME Transactions On Mechatronics, vol. 15,no. 6, pp. 906–915, 2010.
[36] “Biosense Webster, Inc.”. [Online]. Available: http://www.sjm.com
[37] S. P. Page and M. Dhinoja, “SmarttouchTM the emerging role of contact force technologyin complex catheter ablation,” Arrhythmia & electrophysiology review, vol. 1, no. 1, p. 59,2012.
[38] E. Patoor, D. C. Lagoudas, P. B. Entchev, L. C. Brinson, and X. Gao, “Shape memory al-loys, part i: General properties and modeling of single crystals,” Mechanics of Materials,vol. 38, no. 5-6, pp. 391–429, 2006.
[39] V. Novak, P. Sittner, G. Dayananda, F. Braz-Fernandes, and K. Mahesh, “Electric resis-tance variation of niti shape memory alloy wires in thermomechanical tests: Experimentsand simulation,” Materials Science and Engineering: A, vol. 481, pp. 127–133, 2008.
[40] Dynalloy Inc., “Technical characteristics of flexinol actuator wires,” CA: Tustin, 2011.[Online]. Available: http://www.dynalloy.com/pdfs/TCF1140.pdf
[41] Y. Haga, T. Mineta, and M. Esashi, “Multi-functional active catheter,” Sensors Update,vol. 8, no. 1, pp. 147–186, 2000.
[42] J. Jayender, R. V. Patel, and S. Nikumb, “Robot-assisted active catheter insertion: algo-rithms and experiments,” The International Journal of Robotics Research, vol. 28, no. 9,pp. 1101–1117, 2009.
[43] A. T. Tung, B.-H. Park, G. Niemeyer, and D. H. Liang, “Laser-machined shape memoryalloy actuators for active catheters,” IEEE/ASME Transactions on Mechatronics, vol. 12,no. 4, pp. 439–446, 2007.

BIBLIOGRAPHY 24
[44] E. Ayvali, C.-P. Liang, M. Ho, Y. Chen, and J. P. Desai, “Towards a discretely actuatedsteerable cannula for diagnostic and therapeutic procedures,” The International Journal
of Robotics Research, vol. 31, no. 5, pp. 588–603, 2012.
[45] M. Ho, A. B. McMillan, J. M. Simard, R. Gullapalli, and J. P. Desai, “Toward a meso-scale sma-actuated mri-compatible neurosurgical robot,” IEEE Transactions on Robotics,vol. 28, no. 1, pp. 213–222, Feb 2012.
[46] M. Ho, Y. Kim, S. S. Cheng, R. Gullapalli, and J. P. Desai, “Design, development, andevaluation of an mri-guided sma spring-actuated neurosurgical robot,” The International
Journal of Robotics Research, vol. 34, no. 8, pp. 1147–1163, 2015.
[47] K. Ikuta, M. Tsukamoto, and S. Hirose, “Shape memory alloy servo actuator systemwith electric resistance feedback and application for active endoscope,” in 1988 IEEE
International Conference on Robotics and Automation. IEEE, 1988, pp. 427–430.
[48] X. Yuan, D. Liu, and M. Gong, “Design and research on a shape memory alloy-actuatedsingle-port laparoscopic surgical robot,” in 2014 IEEE International Conference on
Mechatronics and Automation, Aug 2014, pp. 1654–1658.
[49] Z. Y. Shi, D. Liu, and T. M. Wang, “A shape memory alloy-actuated surgical instrumentwith compact volume,” The International Journal of Medical Robotics and Computer
Assisted Surgery, vol. 10, no. 4, pp. 474–481, 2014.
[50] T.-M. Wang, Z.-Y. Shi, D. Liu, C. Ma, and Z.-H. Zhang, “An accurately controlled an-tagonistic shape memory alloy actuator with self-sensing,” Sensors, vol. 12, no. 6, pp.7682–7700, 2012.
[51] A. T. Tung, B.-H. Park, D. H. Liang, and G. Niemeyer, “Laser-machined shape mem-ory alloy sensors for position feedback in active catheters,” Sensors and Actuators A:
Physical, vol. 147, no. 1, pp. 83–92, 2008.
[52] A. Tung, G. Niemeyer, D. Liang, B. Park, F. Prinz, and B. Hu, “Sensors and control foran interventional catheter,” Jan. 8 2013, US Patent 8,347,738.
[53] M. van Schoor, A. Lengyel, G. Muller, and A. du Plessis, “Method and device for mea-suring strain using shape memory alloy materials,” Apr. 22 2003, US Patent 6,550,341.
[54] M. Huff, W. Benard, F. Lisy, and T. Prince, “Method and sensor for detecting strain usingshape memory alloys,” Sept. 23 2003, US Patent 6,622,558.

Chapter 2
Hysteresis Modeling and Control of ShapeMemory Alloy Actuator
2.1 Introduction
Due to their high power-to-weight ratio, low cost, silent actuation and biocompatibility, SMAactuators have been preferred over conventional actuators in many applications such as inaerospace [1], robotics [2, 3] and surgical tools [4–6]. The working principle of these actu-ators is the reversible diffusionless solid-state transition between a low temperature Martensite(M) phase and a high temperature Austenite (A) phase. At low temperatures, when SMAs aredeformed with the help of some external means such as biased springs, they can regain theiroriginal shape when heated above the M to A transition temperature (TM→A). Further, whenthey are cooled below the A to M transformation temperature (TA→M), they are again easily de-formed. This property enables SMAs to produce a large amount of force and strain (3-5%) onactuation. However, SMAs exhibit highly nonlinear temperature-strain behavior. In addition,the hysteresis caused by the difference between (TM→A) and (TA→M) makes them very difficultto use in real-time control applications. Therefore, the need arises for developing an accuratemodel that can be used to implement a real-time control system to control the strain in SMAactuators.
In the past, there have been many attempts to model the hysteresis behavior of SMA ac-tuators ([7–11]). Among them, one of the most popular approaches is using Preisach model.In contrast to the models that are derived from first principles of physics, the Preisach modelis a phenomenological approach that can accurately describe the hysteresis behavior (includ-ing minor loops in the input-output graph) of many physical systems (such as SMA actua-tors, piezoceramic actuators, cable-driven instruments and magnetostrictive actuators) without
25

2.1. INTRODUCTION 26
providing physical insight into it ([9, 12, 13]). Thus, using the inverse Preisach model in afeedforward control loop, the output of a hysteretic system can be controlled [14]. However,this approach has very limited use because the Preisach model makes predictions based onthe experimental measurements (first order reversal (FOR) curves) which are obtained offline.Therefore, apart from the complexity of finding the numerical inverse, it is also very difficult toupdate the tabulated experimental data that is needed to adapt to changes in the environmentalconditions and modeling uncertainties [15, 16]. To overcome this problem, in [15], each of theFOR curves are approximated by a second order polynomial and the coefficients of the poly-nomials are stored in a table. These coefficients are then recursively updated using the leastmean squares (LMS) algorithm to model the uncertainties in the system. The drawback of thisapproach is that the accuracy of the predicted output is limited by how good the polynomials fitthe FOR curves. In [16], a single two-inputs (increasing temperature and decreasing tempera-ture) one-output ANN with two hidden layers was used to approximate all of the FOR curvestogether. Although, open-loop results demonstrate the accuracy of this model, due to the highinterconnections of neurons, it is difficult to identify which parameters should be updated inreal-time when input is increasing or decreasing. If all of the weights are updated in case ofmonotonically changing inputs, the weights may converge to the values which could produceundesirable predictions when switching occurs.
In this paper, a new control framework for controlling the strain in the SMA actuators isproposed and experimentally validated. The numerical Preisach model described in [10] ismodified so that it can be easily used in a real-time control system to determine the appropriatecontrol signal as well as can adapt to changes in the operating conditions. In this regard, boththe first order descending (FOD) and first order ascending (FOA) curves are used and each ofthese curves are approximated by an ANN. This modification not only improves the accuracy ofthe predictions but also makes the Preisach model useful for real-time control without changingthe underlying properties of the Preisach model itself. The EKF algorithm is used to make themodel adaptive by recursively updating the weight parameters of the ANN approximating thecorresponding FOR curve. Furthermore, a model predictive controller is implemented that usesthe temperature dynamics of the SMA actuator followed by the adaptive neural Preisach model(ANPM) to predict the future behavior of the SMA actuator. Then, the Levenberg-Marquardt(LM) algorithm iteratively computes the optimal control current to achieve the desired strain.Simulations and experimental results demonstrate the performance of the adaptive hysteresismodeling of an SMA wire actuator and the performance of the proposed controller to achievethe desire strain in the actuator.

2.2. CLASSICAL PREISACH MODEL 27
2.2 Classical Preisach Model
This section describes the classical Preisach model. The major content and all the derivationshere are adopted from the book “Mathematical Model of Hysteresis And Their Applications”written by Isaak Mayergoyz [10].
The classical Preisach model is described as an infinite number of parallely connectedtwo-position relays with α and β being “up” and “down” switching values respectively [10].Mathematically, the output ( f (t)) of the Preisach model, at any time instant t, can be written as
f (t) =
"α>β
µ(α, β)γαβ[u(t)] dα dβ (2.1)
where u(t) is the input and γαβ (α > β) is the output of the elemental relay operator which hasa value of +1, when the input is greater than α, and 0 ( -1 for some models), when the input islower than β. For inputs between α and β, the value of γαβ remains the same as in the previousstate. µ(α, β) is an arbitrary weight function, also known as the Preisach function or Preisachdensity function.
Geometrically, the Preisach model can be defined on a half plane (α > β), where each point(α, β) in the plane corresponds to an elemental hysteresis operator with a specific Preisach func-tion value (µ(α, β)). Consider a right angle triangle (Figure 2.1(a) and (b)) with its hypotenuseat line α = β, and its vertex at (α0, β0) where α0 and β0 are the maximum and minimum valueof the input (u(t)) that can be applied to the system. The value of µ(α, β) outside of this trian-gle is assumed to be zero. At any time instant t, if the input (u(t)) is monotonically increasedfrom β0, a horizontal line α = u(t), in the triangle, starts moving upwards as shown in Figure2.1(a), and all of the hysteresis operators with α value less than u(t) are switched to the “up”position whereas all of the other hysteresis operators with α value greater that u(t) remain inthe “down” position. Now, after reaching a value α1, if u(t) starts monotonically decreasing, avertical line β = u(t) starts moving towards the left as shown in Figure 2.1(b). This results inall of the hysteresis operators with β value greater than u(t) being turned back into the “down”position. When the input is increased again from the last minimum value β1, the horizontal lineu(t) again moves upwards. Generalizing this pattern at any time instant t, the triangle is alwaysdivided into two subsets: S +(t), consisting of the points (α, β) for which γαβ value is +1, andS 0(t), consisting of the points (α, β) for which γαβ value is 0, as shown in Figure (2.2). Thus,(2.1) can be rewritten as
f (t) =
"S +(t)
µ(α, β)γαβ[u(t)] dα dβ +
"S 0(t)
µ(α, β)γαβ[u(t)] dα dβ (2.2)

2.2. CLASSICAL PREISACH MODEL 28
Figure 2.1: Preisach triangle and triangle subdivision due to (a) increasing input, (b) decreasinginput.
where
γαβ[u(t)] = +1, if(α, β) ∈ S +(t)
and γαβ[u(t)] = 0, if(α, β) ∈ S 0(t)(2.3)
Therefore,
f (t) =
"S +(t)
µ(α, β) dα dβ (2.4)
The vertices of the staircase formed by the horizontal and vertical lines (in Figure 2.2) representthe local extremums of the previous inputs.
From (2.4), it can be observed that µ(α, β) is the only unknown to fully describe the hystere-sis model of a system. Therefore, the problem of the hysteresis identification using Preisachmodel is in fact a problem of the Preisach function (µ(α, β)) identification, which needs tobe determined experimentally. For this purpose, a basic approach, as described in [10], is todirectly compute µ(α, β) by differentiating (2.4) with respect to α and β, then, µ(α, β) can bewritten as
µ(α, β) =d2 fα,βdαdβ
(2.5)
where fα,β is the output of the hysteretic system along the FOR curves. It can be either FODor FOA curves. These FOD (or FOA) curves are formed after the first reversal of the inputfrom the major ascending (or major descending) curve as shown in Figure 2.3. Once (µ(α, β))is identified, the output of the Preisach model can be predicted using (2.4). However, this

2.2. CLASSICAL PREISACH MODEL 29
Figure 2.2: Subdevision of the Preisach triangle and the staircase formation due to the (a)decreasing input, and (b) increasing input.
approach suffers from two major limitations: first, it requires the numerical evaluation of thedouble integrals (2.4) which is a time consuming process and may significantly hinders the useof the Preisach model in real-time applications; and second, the double differentiation requiredfor the identification of the Preisach function may amplify the noise inherently present in theexperimental data. Therefore, to avoid these limitations, a numerical approach, also called a“numerical Preisach model” is derived in [10]. If we consider a function F(αk, βk), describedby
F(αk, βk) = fαk ,αk − fαk ,βk (2.6)
then, on a Preisach triangle, this function can be realized as the integral over the area of the

2.2. CLASSICAL PREISACH MODEL 30
Figure 2.3: Major curves and first order reversal curves.
triangle T (αk, βk) (Figure 2.4), and can be expressed as follows.
Figure 2.4: A sub-triangle inside a Preisach triangle.
F(αk, βk) =
"T (αk ,βk)
µ(α, β) dα dβ (2.7)
Moreover, at any time instant t, if the input (u(t)) is decreasing, the output can be realized as

2.2. CLASSICAL PREISACH MODEL 31
the integral over the area of the n trapezoids, formed in Figure 2.2 (a), and can be written as
f (t) =
n(t)∑k=1
"Qk
µ(α, β) dα dβ (2.8)
Similarly, if the input (u(t)) is increasing, the output can be realized as the integral over thearea of the n − 1 trapezoids and one triangle T (u(t), βn−1), formed in Figure 2.2 (b), and can bewritten as
f (t) =
n(t)−1∑k=1
"Qk
µ(α, β) dα dβ +
"T (u(t),βk−1)
µ(α, β) dα dβ (2.9)
Now, each trapezoid Qk can be written as the difference of the two sub-triangles T (αk, βk−1)and T (αk, βk)."
Qk
µ(α, β) dα dβ =
"T (αk ,βk−1)
µ(α, β) dα dβ −"
T (αk ,βk)µ(α, β) dα dβ (2.10)
Using (2.6), (2.7) and (2.10), the model output in (2.8) for a decreasing input can be rewrittenas
f (t) =
n(t)−1∑k=1
(F(αk, βk−1) − F(αk, βk)) + (F(αn, βn−1) − F(αn, u(t))) (2.11)
or
f (t) =
n(t)−1∑k=1
( fαk ,βk − fαk ,βk−1) + ( fαn,u(t) − fαn,βn−1) (2.12)
and the model output in (2.9) for an increasing input can be rewritten as
f (t) =
n(t)−1∑k=1
(F(αk, βk−1) − F(αk, βk)) + F(u(t), βn−1) (2.13)
or
f (t) =
n(t)−1∑k=1
( fαk ,βk − fαk ,βk−1) + ( fu(t),u(t) − fu(t),βn−1) (2.14)
The two important properties that result from the Preisach model are the “congruency”property and the “wiping out” property [10]. According to the “congruency” property, whenthe input is varied back and forth between two fixed extremum values, the change in the output

2.3. AN ARTIFICIAL NEURAL NETWORK (ANN) 32
remains the same and does not depend upon the past history of the extremum values. Accordingto the “wiping out” property, when the input is increased, all of the vertices whose α value islower than the current input, and while being decreased, all of the vertices whose β valueis greater than the current input, are wiped out. These vertices no longer contribute to theprediction of the hysteresis output.
To implement the numerical Preisach model, the entire input range [β0, α0] is first dividedinto N levels. The data for the N FOR curves, fαi,β j , such that β0 6 αi 6 α0, i = 1 : N andβ0 6 β j 6 αi, j = 1 : i are recorded and stored in a table. Then the output of the modelis evaluated using (2.12) or (2.14). The value of fαi,β j is obtained by looking up the table.If a point (αi, β j) coincides with the stored point in the table, that the value is directly used;otherwise, linear interpolation of the neighboring samples is performed to approximate thisvalue.
2.3 An Artificial Neural Network (ANN)
An ANN is a type of machine learning method that can be used to approximate any smoothmultidimensional nonlinear function. An ANN is described as a system of highly intercon-nected neurons with one or more layers. In general, a multilayer feedforward neural network,also referred to as a multilayer perceptron (MLP), has one input layer, one or more hiddenlayers and one output layer [17]. The input-layer neurons receive inputs and produce the samevalue at their output without any modifications; however, the hidden layer(s) and output layerneurons calculate the weighted sum of the values, received from the previous layer neurons, adda bias to it and then pass it through some predefined activation function (such as log-sigmoid,tangent-sigmoid or purely linear) to produce their output. Figure 2.5 shows the structure of atwo-inputs (x1 and x2) and single-output (y) feedforward neural network with two hidden layersand having three neurons in each hidden layer. The neurons in the hidden layers have a log-sigmoid activation function and the neuron in the output layer has a linear activation function.For this neural network, the output of the first hidden layer neurons (Y1
j ) and second hiddenlayer neurons (Y2
j ) is written as
Y1j =
11 + exp((
∑2i=1 IWi, jxi) + IB j)
for j = 1, 2, 3. (2.15)
Y2j =
11 + exp((
∑3i=1 LWi, jY1
i ) + LB j)for j = 1, 2, 3. (2.16)

2.3. AN ARTIFICIAL NEURAL NETWORK (ANN) 33
Figure 2.5: A static feedforward neural network.
where IWi, j denotes the weight connecting the output of the ith neuron of the input layer to theinput of the jth neuron of the first hidden layer and IB j denotes the bias applied to the jth neuronof the first hidden layer. Similarly LWi, j and LB j denote the weight connecting the output ofthe ith neuron of the first hidden layer to the input of the jth neuron of the second hidden layer,and the bias applied to the jth neuron of the second hidden layer respectively.
The output of the neural network is given by
y = (3∑
i=1
WiY2i ) + B (2.17)
where Wi and B denote the weight connecting the output of the ith neuron of the second hiddenlayer to the input of the output neuron, and the bias applied to the output neuron respectively.
It should be noted that the number of input layer neurons is always equal to the numberof inputs to the neural network and the number of the output layer neurons is always equal tothe number of outputs of the neural network. Thus, to model an unknown input-output systemusing neural networks, the neural network is trained to find the optimum weights and bias val-ues such that the mean-squared sum of the errors between the experimentally measured outputand the ANN predicted output is minimized. The commonly used ANN training algorithmsare the Levenberg-Marquardt (LM) algorithm, the Quasi-Newton algorithm and the Resilientbackpropagation algorithm.

2.4. HYSTERESIS MODELING OF THE SMA ACTUATOR 34
2.4 Hysteresis Modeling of the SMA Actuator
To model the strain in the SMA wire actuator with respect to the current flowing through it,this section first describes the temperature dynamics to simulate the temperature of the SMA.Then, the rate-independent hysteresis between the strain and the temperature of the SMA wireis modeled using the Neural Preisach Model (NPM).
2.4.1 Temperature versus current modeling
The strain in an SMA actuator directly depends on its temperature which in turn can be con-trolled by the process of Joule heating and natural convection. The temperature dynamics ofthe SMA wire actuator, used in this chapter, can be described as follows,
T =u2R − hAl(T − Ta)
mcp(2.18)
where u is the current being passed through the SMA wire, R is the resistance, m is the mass,l is the length, cp is the specific heat capacity, A = πd is the circumferential area, d is thediameter, T is the temperature, Ta is the ambient temperature, and h is the cooling rate coeffi-cient. To reflect the higher convection rate at higher temperatures, we model h as the quadraticpolynomial of T as described in [8].
h = (h0 + h2T 2) (2.19)
All of these SMA parameters used in this work are specified in Table 2.1
Table 2.1: Specifications of the SMA Parameters
SMA Parameter Value
Mass (m) 0.03166 g
Specific heat capacity (cp) 0.8368 J.g−1K−1
Length (l) 0.1 m
Diameter (d) 0.254e-3 m
Ambient temperature (Ta) 21C
Cooling rate coefficient (h0) 55 J.m−2.s−1.K−1
Cooling rate coefficient (h2) 6e-5 J.m−2.s−1.K−3

2.4. HYSTERESIS MODELING OF THE SMA ACTUATOR 35
2.4.2 Strain versus temperature modeling
2.4.2.1 Neural Preisach Model (NPM)
To model the strain versus temperature hysteresis in the SMA wire actuator, the numericalPreisach model was modified in following aspects.
• Both, the FOD and FOA curves were used instead of only one of the two.
• Instead of storing actual sample values, the ANN is used to approximate each of the FODand FOA curves, then the weights and bias values of the ANNs corresponding to FODand FOA curves are stored in two separate tables.
Figure 2.6: First order reversal curves.
From Figure 2.6, utilizing the “congruency” property of the Preisach model the prediction

2.4. HYSTERESIS MODELING OF THE SMA ACTUATOR 36
equation of the strain yp(t) can be written in terms of FOD (or FOA) curves as follows,
yp(t) = yMem + yNNTMem
(T,W) − yNNTMem
(TMem,W) (2.20)
where TMem and yMem represent the temperature and strain memory at the local extremum re-spectively. yNN
TMem(T,W) represents the output value of the ANN approximated FOD (or FOA)
curve, which starts from the temperature TMem, at current temperature T , and W denotes theweight parameters of the ANN. Note that the history of the extremums must be stored, andupdated according to the “wipe out” property of the Preisach model.
To implement the NPM, the entire input range is first divided into N levels (Ti, i = 1, 2...N).The data for FOD and FOA curves that start from these N input values are recorded. A single-input and single-output feedforward ANN is trained offline for each of these FOR curves andthe weight parameters of the ANNs corresponding to the FOD and FOA curves are stored intwo separate tables. If the temperature at the local extremum (TMem) coincides with the sampledinput value, the output can be predicted using (2.20). Most often it is not the case, thereforeyNN
TMem(T ) in (2.20) is calculated by linear interpolation of the two nearest FOR curves as follows,
yNNTMem
(T ) = c1.yNNT1
(T,Wc1) + c2.yNNT2
(T,Wc2) (2.21)
c1 =T2 − TMem
T2 − T1and c2 =
TMem − T1
T2 − T1(2.22)
where T1 and T2 are the two nearest input samples to TMem, Wc1 and Wc2 are the weight param-eters of the two nearest FOR curves, and c1 and c2 are their weighting coefficients.
Thus, the NPM reduces the required memory resources because only a few weighting pa-rameters need to be stored instead of all of the actual experimental measurements while alsoimproving the accuracy of the predictions. Another advantage of this method is that an an-alytical expression is obtained which has a similar functional form for both decreasing andincreasing inputs, that can easily be used in real-time control system using any nonlinear con-trol method such as a nonlinear model predictive control as described in section 2.8.
2.4.2.2 Adaptive Neural Preisach Model (ANPM)
Since the ANNs used in NPM for the approximation of FOD and FOA curves, are trainedoffline, in order to model the uncertainties in real-time, an adaptive NPM is described in thissection. The block diagram of the overall adaptive hysteresis modeling (current to strain) of theSMA actuator is shown in Figure 2.7, which consists of the temperature dynamics described in

2.4. HYSTERESIS MODELING OF THE SMA ACTUATOR 37
section 2.4.1, prediction equation (2.20), a memory block; and the EKF algorithm block thatupdates the NPM model parameters. The memory block in the ANPM performs the followingfunctions:
• Determines whether the SMA wire is heating or cooling by comparing its temperatureat the current and previous state. Based on this, selects one of the two tables: one, thatcontains the weight parameters of the FOD curves, or other that contains the weightparameters of the FOA curves.
• Based on the “congruency” and “wiping out” property, the block stores and updates thelocal extrema, calculates TMem, and based on TMem, determines T1, T2, c1, c2, Wc1 andWc2 .
• Updates the Wc1 and Wc2 values in the table which are returned from the EKF algorithm.
In [18], the EKF was used to train a multilayered neural network in real-time. In this workwe also use the EKF to update the weights parameters of the ANN realized FOD and FOAcurves in real-time. Writing the descrete state-space representation of the NPM as
Wc(k + 1) = Wc(k) + ω(k) (2.23)
yp(k) = c1[yNNT1
(T,Wc1(k)) − yNNT1
(TMem,Wc1(k))] + c2[yNNT2
(T,Wc2(k)) − yNNT2
(TMem,Wc2(k))]
+yMem + ν(k)
(2.24)
where
Wc(k) =
Wc1(k)Wc2(k)
and ω(k) and ν(k) are zero mean-Gaussian noise with covariance matrices Q and R respec-tively. Then, using the formulation as described in [19], at each sampling instant k, the updateequations for the ANPM weights can be written as
W1c (k) = Wc(k − 1) (2.25)
P1(k) = P(k − 1) + Q (2.26)
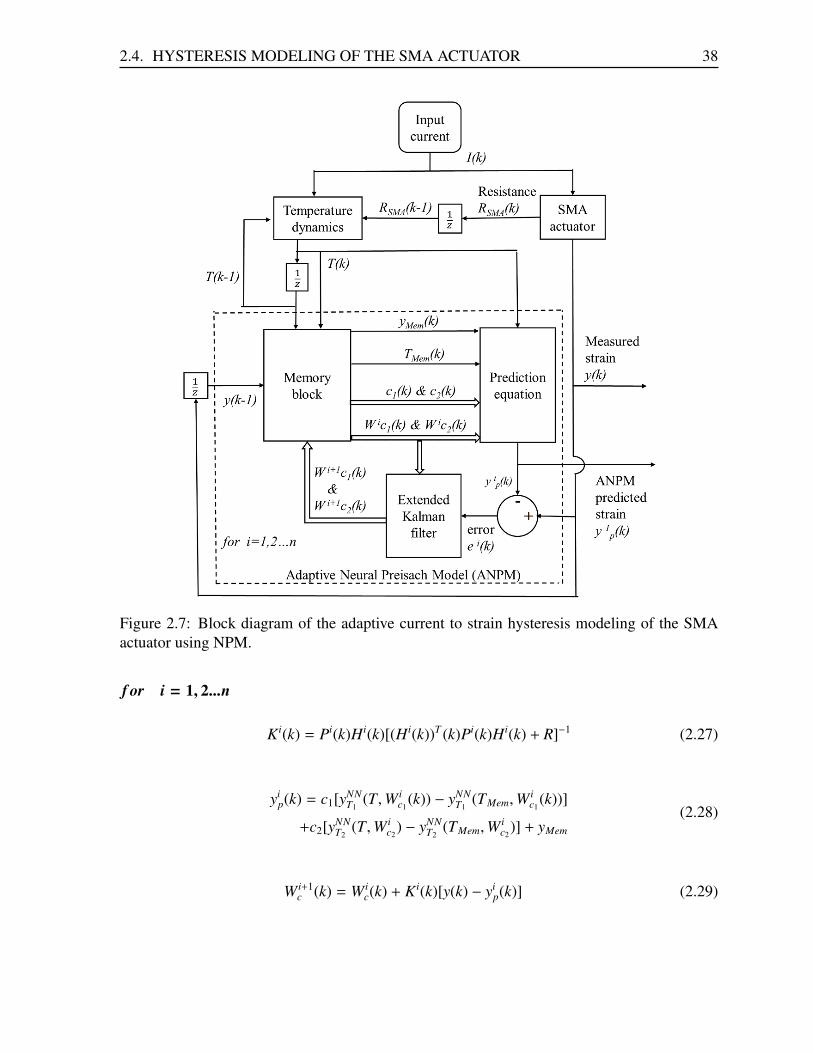
2.4. HYSTERESIS MODELING OF THE SMA ACTUATOR 38
Figure 2.7: Block diagram of the adaptive current to strain hysteresis modeling of the SMAactuator using NPM.
f or i = 1, 2...n
Ki(k) = Pi(k)Hi(k)[(Hi(k))T (k)Pi(k)Hi(k) + R]−1 (2.27)
yip(k) = c1[yNN
T1(T,W i
c1(k)) − yNN
T1(TMem,W i
c1(k))]
+c2[yNNT2
(T,W ic2
) − yNNT2
(TMem,W ic2
)] + yMem
(2.28)
W i+1c (k) = W i
c(k) + Ki(k)[y(k) − yip(k)] (2.29)
2.5. EXPERIMENTAL SETUP 39
Pi+1(k) = [I − Ki(k)Hi(k)T ]Pi(k) (2.30)
P(k) = Pn(k) (2.31)
Wc(k) = Wnc (k) (2.32)
where
Hi(k) =[ ∂y∂Wc
]Wc=W i
c(k)(2.33)
P is the state error covariance matrix, K is the Kalman gain, yp and y are the predicted andmeasured outputs respectively. The superscript i denotes the iteration number, and n denotesthe total number of iterations for the weights update algorithm at each sampling instant.
2.5 Experimental Setup
The experimental setup used for the model identification, validation and real-time control isshown in Figure 2.8. In this setup a 10 cm long SMA wire with a diameter of 0.254 mm(Flexinol R©, Dynalloy Inc., Irvine, CA, United States) was used. Electrical lead wires wereattached to the ends of the SMA wire using screw clamps. One end of the wire was suspendedon a wooden stand with the help of a custom made block. The other end was connectedvia a tether to a low friction slide to restrict the motion to the vertical direction. To isolatethe SMA wire from the external environmental conditions, it was shielded with a cylindricalplastic tube. To measure the strain, a high resolution (1032 x 776) camera (Dragonfly R©2 DR2-HICOL, Point Grey Research Inc., Richmond, BC, Canada) with an adjustable focal length lens(T4Z2813CS-IR, computar R©, Cary, NC, US) was used to track the displacement of a markerattached to the front of the slide. The marker consists of the two black dots accurately printed1 mm apart on a white paper. To increase the resolution of the measured displacement, thecamera was placed as close as possible to the marker. To maximize the attainable frame rate,the camera was used in a custom (format 7) mode such that only the selected region of interest(1032 x 250) was read out. The slide was also attached to an extension spring that provides arecovering force to the SMA actuator as it cools. The tension of the spring was adjusted usinga linear stage (TLSM050A, Zaber Technologies Inc., Vancouver, BC, Canada). A schematicdiagram of the circuit to provide the current in the SMA actuator and to measure its resistanceis shown in Figure 2.9. In this figure, a power amplifier (UPM 2405, Quanser Inc., Markham,
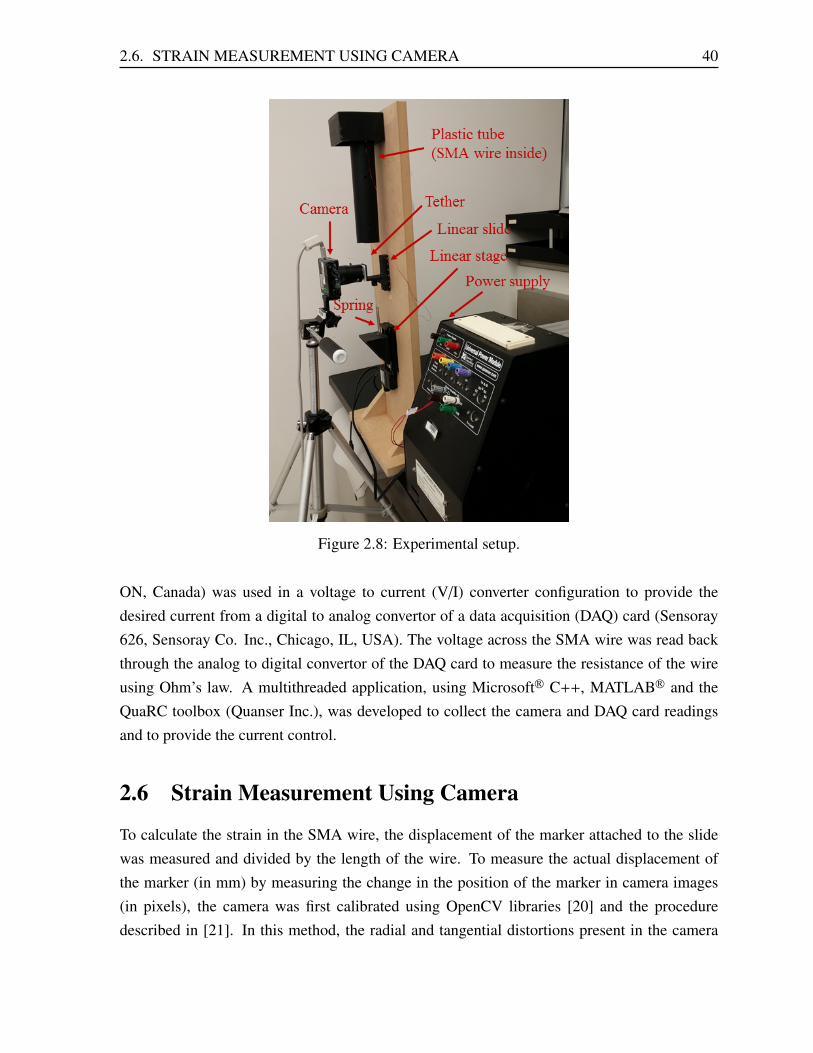
2.6. STRAIN MEASUREMENT USING CAMERA 40
Figure 2.8: Experimental setup.
ON, Canada) was used in a voltage to current (V/I) converter configuration to provide thedesired current from a digital to analog convertor of a data acquisition (DAQ) card (Sensoray626, Sensoray Co. Inc., Chicago, IL, USA). The voltage across the SMA wire was read backthrough the analog to digital convertor of the DAQ card to measure the resistance of the wireusing Ohm’s law. A multithreaded application, using Microsoft R© C++, MATLAB R© and theQuaRC toolbox (Quanser Inc.), was developed to collect the camera and DAQ card readingsand to provide the current control.
2.6 Strain Measurement Using Camera
To calculate the strain in the SMA wire, the displacement of the marker attached to the slidewas measured and divided by the length of the wire. To measure the actual displacement ofthe marker (in mm) by measuring the change in the position of the marker in camera images(in pixels), the camera was first calibrated using OpenCV libraries [20] and the proceduredescribed in [21]. In this method, the radial and tangential distortions present in the camera

2.6. STRAIN MEASUREMENT USING CAMERA 41
Figure 2.9: Schematic diagram of the circuit.
were modeled using following equations:
x = x(1 + k1r2 + k2r4 + k3r6) + 2ρ1xy + ρ2(r2 + 2x2)
y = y(1 + k1r2 + k2r4 + k3r6) + 2ρ2xy + ρ1(r2 + 2y2)(2.34)
where (x, y) is the coordinate of a point in the original (undistorted) image; (x, y) is the coordi-nate of the same point in the distorted image; r =
√x2 + y2; k1, k2, k3 are the radial distortion
coefficients; and ρ1, ρ2 are the tangential distortion coefficients. The transformation of a point(X,Y,Z) of a 3D object in the object reference frame to the point (x, y) in its image in the camerareference frame can be described by following equation:
x
y
1
= s
fx 0 cx
0 fy cy
0 0 1
︸ ︷︷ ︸Intrinsic matrix
[R γ]︸ ︷︷ ︸
Extrinsic matrix
X
Y
Z
1
(2.35)
where fx and fy are the focal length of the camera lens in the x and y direction of the camerareference frame; (cx, cy) are the coordinates of the principal point of the image; R and γ are a3 x 3 rotation matrix and a 3 x 1 translation vector, respectively, that transform the coordinatesof the points in the object reference frame to the camera reference frame.
Now, in order to estimate the intrinsic matrix, extrinsic matrix and the distortion coeffi-cients, a planar 6 x 4 black-white chessboard pattern is captured with different nonparallelviews. The corners of the chessboard pattern are detected for each of these views, and theunknown parameters are then computed using (2.34) and (2.35). It is important to mention
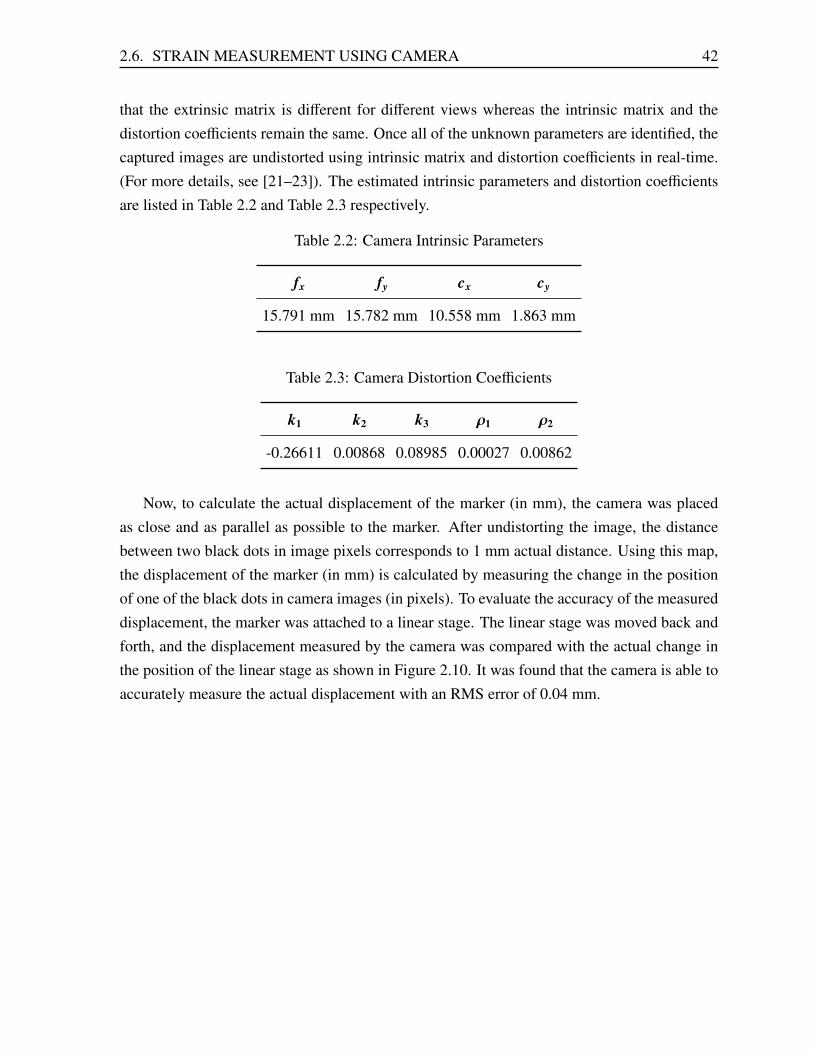
2.6. STRAIN MEASUREMENT USING CAMERA 42
that the extrinsic matrix is different for different views whereas the intrinsic matrix and thedistortion coefficients remain the same. Once all of the unknown parameters are identified, thecaptured images are undistorted using intrinsic matrix and distortion coefficients in real-time.(For more details, see [21–23]). The estimated intrinsic parameters and distortion coefficientsare listed in Table 2.2 and Table 2.3 respectively.
Table 2.2: Camera Intrinsic Parameters
fx fy cx cy
15.791 mm 15.782 mm 10.558 mm 1.863 mm
Table 2.3: Camera Distortion Coefficients
k1 k2 k3 ρ1 ρ2
-0.26611 0.00868 0.08985 0.00027 0.00862
Now, to calculate the actual displacement of the marker (in mm), the camera was placedas close and as parallel as possible to the marker. After undistorting the image, the distancebetween two black dots in image pixels corresponds to 1 mm actual distance. Using this map,the displacement of the marker (in mm) is calculated by measuring the change in the positionof one of the black dots in camera images (in pixels). To evaluate the accuracy of the measureddisplacement, the marker was attached to a linear stage. The linear stage was moved back andforth, and the displacement measured by the camera was compared with the actual change inthe position of the linear stage as shown in Figure 2.10. It was found that the camera is able toaccurately measure the actual displacement with an RMS error of 0.04 mm.

2.7. MODEL IDENTIFICATION AND VALIDATION 43
Figure 2.10: Validation of the displacement measurement using camera with respect to thelinear stage position displacement
2.7 Model Identification and Validation
2.7.1 NPM Identification
Data for 13 FOD and 13 FOA curves were collected by applying the current at the rate of5mA/s with minimum and maximum current of 150 mA and 500 mA respectively. Using(2.18), the temperature of the wire was simulated and a single-input, single-output feedforwardANN having one hidden layer was trained for each of these curves with temperature as aninput and strain as an output. The hidden layer has two neurons which have a “log-sigmoid”activation function. The output layer neuron has a linear activation function. The network wasthen trained using the LM algorithm in MATLAB R©. The weight parameters obtained after thetraining of the ANNs were stored in two different tables for FOD and FOA curves separately.Figure 2.11 shows good approximation of the experimentally obtained FOR curves with theANN realized FOR curves.
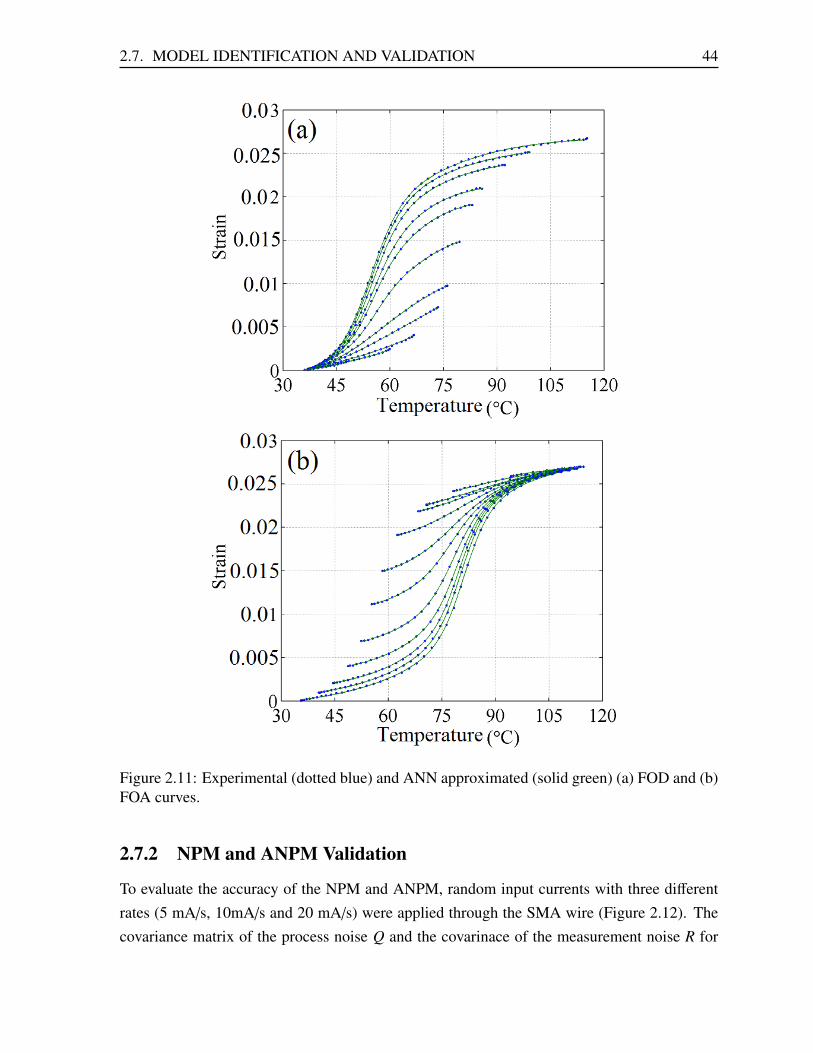
2.7. MODEL IDENTIFICATION AND VALIDATION 44
Figure 2.11: Experimental (dotted blue) and ANN approximated (solid green) (a) FOD and (b)FOA curves.
2.7.2 NPM and ANPM Validation
To evaluate the accuracy of the NPM and ANPM, random input currents with three differentrates (5 mA/s, 10mA/s and 20 mA/s) were applied through the SMA wire (Figure 2.12). Thecovariance matrix of the process noise Q and the covarinace of the measurement noise R for

2.7. MODEL IDENTIFICATION AND VALIDATION 45
the EKF were chosen as:
Q = 0.1 ∗ I14 and R = 0.05 (2.36)
where I14 is a 14 x 14 identity matrix. The number of iterations (n), the EKF is applied toupdate the weight parameters was set 2.
The NPM predicted output when no feedback is available and ANPM predicted outputwhen strain feedback is available was compared with the measured output as shown in Figure2.13 and Figure 2.14, respectively. Although, NPM can accurately predict the output strainwith an RMS error of 0.0085 strain, ANPM significantly improves the performance as is clearfrom Figure 2.14. The RMS error of ANPM predicted output is 0.0001 strain. The strain-temperature behavior of the ANPM and the measured data is also shown in Figure 2.15 whichillustrates the hysteresis modeling performance of the proposed model.
To validate the ANPM capability to predict the output under varying environmental con-ditions, the plastic tube covering the SMA wire was removed that causes disturbances in thecooling rate due to uncontrollable air circulation in the environment. An increasing and de-creasing the input current at a rate of 5 mA/s (Figure 2.15(a)) was then applied through thewire. Figure 2.15(b) shows how the disturbances in cooling rate affect the output strain; how-ever, the ANPM is still able to predicted the output with good accuracy (0.00012 strain of RMSerror).
Figure 2.12: Input current for the validation of the NPM and the ANPM.

2.7. MODEL IDENTIFICATION AND VALIDATION 46
Figure 2.13: (a) Comparison of the NPM predicted strain (dashed red line) and the measuredstrain (solid blue line), (b) error in the predicted strain.
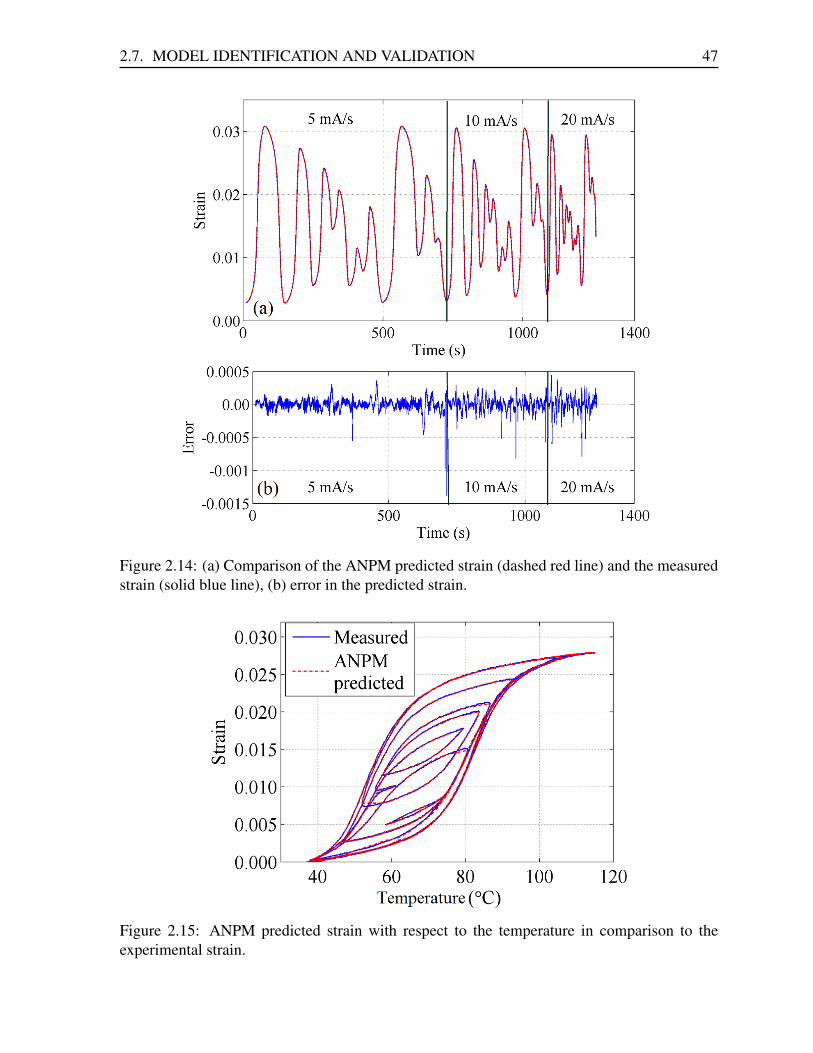
2.7. MODEL IDENTIFICATION AND VALIDATION 47
Figure 2.14: (a) Comparison of the ANPM predicted strain (dashed red line) and the measuredstrain (solid blue line), (b) error in the predicted strain.
Figure 2.15: ANPM predicted strain with respect to the temperature in comparison to theexperimental strain.

2.8. ADAPTIVE NEURAL PREISACH MODEL PREDICTIVE CONTROL 48
Figure 2.16: Open-loop response of the SMA actuator in the presence of uncertainties in cool-ing rate. (a) Applied input current, (b) measured and predicted strain.
2.8 Adaptive Neural Preisach Model Predictive Control
Model predictive control, also called as “receding horizon control”, is a type of adaptive con-trol strategy which uses a plant’s dynamic model to predict its future behavior over a specified
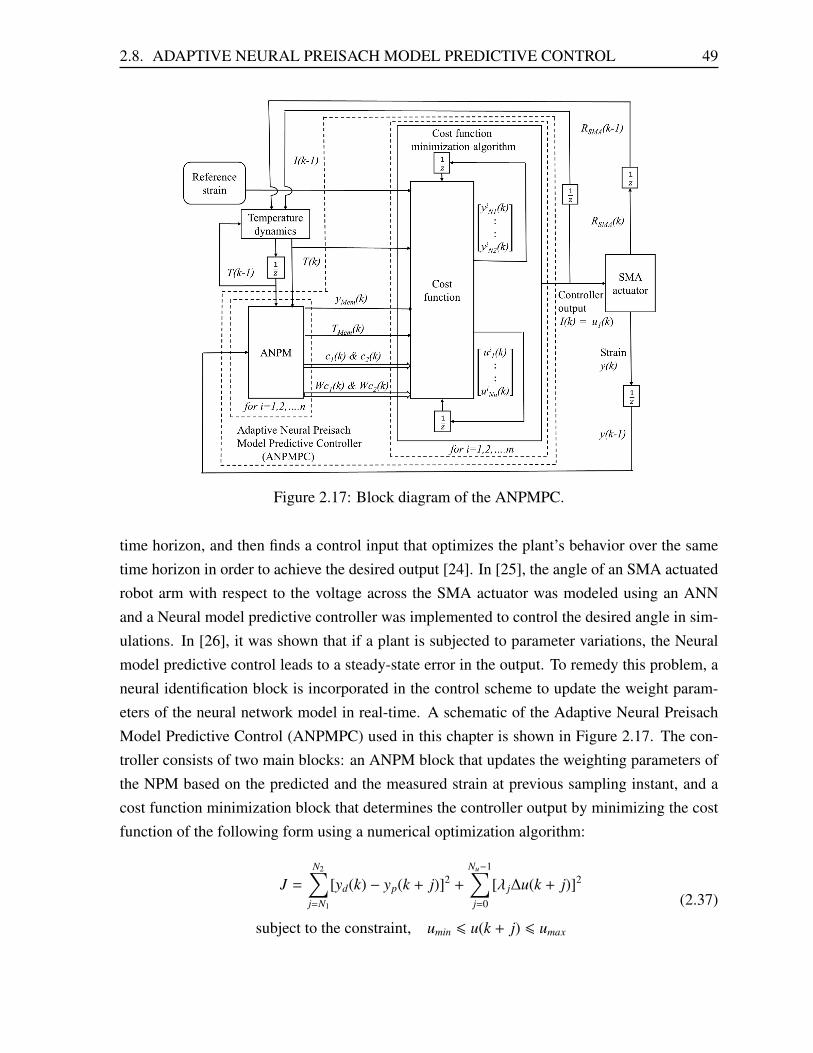
2.8. ADAPTIVE NEURAL PREISACH MODEL PREDICTIVE CONTROL 49
Figure 2.17: Block diagram of the ANPMPC.
time horizon, and then finds a control input that optimizes the plant’s behavior over the sametime horizon in order to achieve the desired output [24]. In [25], the angle of an SMA actuatedrobot arm with respect to the voltage across the SMA actuator was modeled using an ANNand a Neural model predictive controller was implemented to control the desired angle in sim-ulations. In [26], it was shown that if a plant is subjected to parameter variations, the Neuralmodel predictive control leads to a steady-state error in the output. To remedy this problem, aneural identification block is incorporated in the control scheme to update the weight param-eters of the neural network model in real-time. A schematic of the Adaptive Neural PreisachModel Predictive Control (ANPMPC) used in this chapter is shown in Figure 2.17. The con-troller consists of two main blocks: an ANPM block that updates the weighting parameters ofthe NPM based on the predicted and the measured strain at previous sampling instant, and acost function minimization block that determines the controller output by minimizing the costfunction of the following form using a numerical optimization algorithm:
J =
N2∑j=N1
[yd(k) − yp(k + j)]2 +
Nu−1∑j=0
[λ j∆u(k + j)]2
subject to the constraint, umin 6 u(k + j) 6 umax
(2.37)
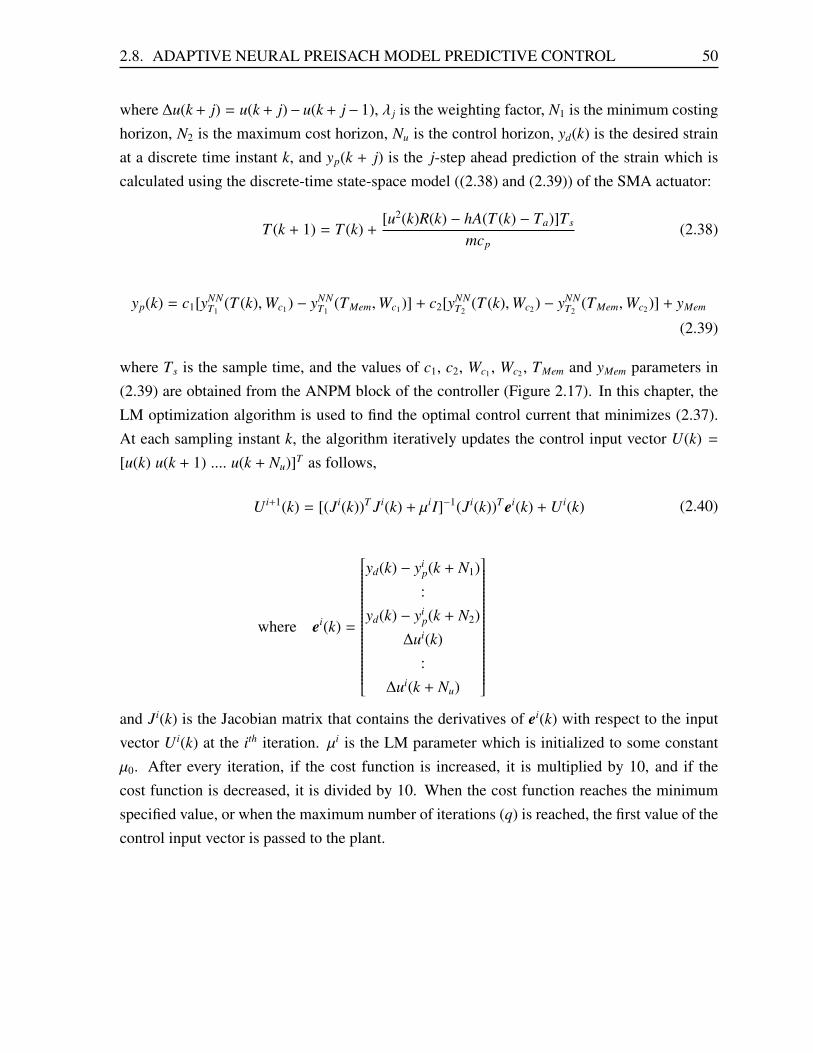
2.8. ADAPTIVE NEURAL PREISACH MODEL PREDICTIVE CONTROL 50
where ∆u(k + j) = u(k + j)− u(k + j− 1), λ j is the weighting factor, N1 is the minimum costinghorizon, N2 is the maximum cost horizon, Nu is the control horizon, yd(k) is the desired strainat a discrete time instant k, and yp(k + j) is the j-step ahead prediction of the strain which iscalculated using the discrete-time state-space model ((2.38) and (2.39)) of the SMA actuator:
T (k + 1) = T (k) +[u2(k)R(k) − hA(T (k) − Ta)]Ts
mcp(2.38)
yp(k) = c1[yNNT1
(T (k),Wc1) − yNNT1
(TMem,Wc1)] + c2[yNNT2
(T (k),Wc2) − yNNT2
(TMem,Wc2)] + yMem
(2.39)
where Ts is the sample time, and the values of c1, c2, Wc1 , Wc2 , TMem and yMem parameters in(2.39) are obtained from the ANPM block of the controller (Figure 2.17). In this chapter, theLM optimization algorithm is used to find the optimal control current that minimizes (2.37).At each sampling instant k, the algorithm iteratively updates the control input vector U(k) =
[u(k) u(k + 1) .... u(k + Nu)]T as follows,
U i+1(k) = [(Ji(k))T Ji(k) + µiI]−1(Ji(k))T ei(k) + U i(k) (2.40)
where ei(k) =
yd(k) − yip(k + N1):
yd(k) − yip(k + N2)
∆ui(k):
∆ui(k + Nu)
and Ji(k) is the Jacobian matrix that contains the derivatives of ei(k) with respect to the inputvector U i(k) at the ith iteration. µi is the LM parameter which is initialized to some constantµ0. After every iteration, if the cost function is increased, it is multiplied by 10, and if thecost function is decreased, it is divided by 10. When the cost function reaches the minimumspecified value, or when the maximum number of iterations (q) is reached, the first value of thecontrol input vector is passed to the plant.

2.9. ANPMPC SIMULATIONS AND EXPERIMENTS 51
2.9 ANPMPC Simulations and Experiments
To investigate the performance of the proposed controller, simulations were first carried outin MATLAB R©, then the experiments were performed using the setup described in section 2.5.The values of Q, R and n were chosen to be the same as in section 2.7.2. N1, N2, Nu, λ j and µ0
were chosen as 2, 3, 2, 0.025 and 10, respectively. The maximum number of iterations of theLM algorithm for searching the optimal control current was set to 6.
Figure 2.18 shows the simulation results of the sinusoidal reference input of 0.1 Hz atdifferent DC offsets and Figure 2.19 shows the simulation results of the sinusoidal referenceinput of 0.05 Hz. Figure 2.20 shows the simulation results for different step reference inputs.
Figure 2.18: Simulation results: closed-loop control response to the 0.1 Hz sinusoidal referenceinput of different DC offset.
Figure 2.19: Simulation results: closed-loop control response to a 0.05 Hz sinusoidal referenceinput.

2.10. CONCLUSION 52
Figure 2.20: Simulation results: closed-loop control response to the step reference inputs.
Experimental verification of the ANPMPC was done at 30 ms sampling period. Figure 2.21shows the closed-loop response of the SMA while tracking the step input reference. The fig-ure shows acceptable performance of the controller with an RMS error of 0.0007 strain in themeasured strain over the entire range of operation. The response of the SMA while trackingthe sinusoidal reference input of 0.05 Hz is shown in Figure 2.22 and tracking the sinusoidalreference input of 0.1 Hz at different DC offsets is shown in Figure 2.23. To evaluate theperformance of the controller under varying environmental conditions and in the presence ofdisturbances, the plastic tube covering the SMA wire was removed, and perturbations wereintroduced by changing the linear stage position. Removing the plastic tube covering the SMAwire causes disturbances in the cooling rate due to uncontrollable air circulation in the envi-ronment, and changing the linear stage position causes changes in the wire stress. Figure 2.24shows the result of the closed-loop response to the sinusoidal reference input of 0.05 Hz fre-quency under these conditions. The controller is able to track the reference trajectory with anRMS error of 0.0012 strain.
2.10 Conclusion
This chapter presents a new control framework to control the strain in the SMA wire actua-tor using a model predictive control technique. For this purpose, strain versus current in theSMA actuator was modeled using a temperature dynamics and a modified Preisach model. Incontrast to the classical Preisach model, an ANN based Preisach model is presented whichutilizes both FOD and FOA curves. To model the uncertainties and parameter variations, the

2.10. CONCLUSION 53
Figure 2.21: Experimental results: (a) closed-loop control response for step reference inputs(b) magnified view for the first 80 seconds.
EKF algorithm was used to update the weight parameters of the ANNs representing the ap-propriate FOR curves. Experiments were performed to evaluate the accuracy of the modelpredictions. Experiments were performed to investigate the performance of the controller thatuses the temperature dynamics and the ANPM to predict the future behavior of the SMA, andthe LM algorithm to optimize a cost function in order to achieve the desired strain. Resultsshowed that the controller performed well while tracking various reference trajectories evenin the presence of external disturbances. Although the proposed modeling method and controlscheme is validated through simulations and experiments for the SMA actuator only, the samecan be used for other hysteretic systems such as piezoelectric actuators, piezoceramic actuatorsand cable-driven instruments as well.

2.10. CONCLUSION 54
Figure 2.22: Experimental results: closed-loop control response for 0.05 Hz sinusoidal refer-ence input.
Figure 2.23: Experimental results: closed-loop control response for 0.1 Hz sinusoidal referenceinputs at different DC offsets.

2.10. CONCLUSION 55
Figure 2.24: Experimental results: (a) Closed-loop response of the SMA to the sinusoidal refer-ence input in the presence of cooling rate uncertainties and load disturbances, (b) displacementof the linear stage.
Bibliography
[1] D. J. Hartl and D. C. Lagoudas, “Aerospace applications of shape memory alloys,” Pro-
ceedings of the Institution of Mechanical Engineers, Part G: Journal of Aerospace Engi-
neering, vol. 221, no. 4, pp. 535–552, 2007.
[2] M. M. Ali and K. Takahata, “Frequency-controlled wireless shape-memory-alloy mi-croactuators integrated using an electroplating bonding process,” Sensors and Actuators
A: Physical, vol. 163, no. 1, pp. 363 – 372, 2010.
[3] T. Tao, Y.-C. Liang, and M. Taya, “Bio-inspired actuating system for swimming usingshape memory alloy composites,” International Journal of Automation and Computing,vol. 3, no. 4, pp. 366–373, 2006.
[4] Y. Haga, Y. Tanahashi, and M. Esashi, “Small diameter active catheter using shape mem-ory alloy,” in The Eleventh Annual International Workshop on Micro Electro Mechanical
Systems, 1998. (MEMS 98), Jan 1998, pp. 419–424.
[5] Y. Nakamura, A. Matsui, T. Saito, and K. Yoshimoto, “Shape-memory-alloy active for-ceps for laparoscopic surgery,” in Proceedings of IEEE International Conference on
Robotics and Automation, 1995., vol. 3, May 1995, pp. 2320–2327 vol.3.
[6] J. Jayender, R. Patel, and S. Nikumb, “Robot-assisted active catheter insertion: Algo-rithms and experiments,” The International Journal of Robotics Research, vol. 28, no. 9,pp. 1101–1117, may 2009.
[7] K. Arai, S. Aramaki, and K. Yanagisawa, “Continuous system modeling of shape memoryalloy (sma) for control analysis,” in Proceedings of the 5th International Symposium on
Micro Machine and Human Science, 1994. IEEE, 1994, p. 97.
[8] J. Jayender, R. V. Patel, S. Nikumb, and M. Ostojic, “Modelling and gain scheduledcontrol of shape memory alloy actuators,” in 2005 IEEE International Conference on
Control Applications (CCA), Aug 2005, pp. 767–772.
56

BIBLIOGRAPHY 57
[9] D. Hughes and J. T. Wen, “Preisach modeling of piezoceramic and shape memory alloyhysteresis,” in Proceedings of the 4th IEEE International Conference on Control Appli-
cations, 1995., Sep 1995, pp. 1086–1091.
[10] I. Mayergoyz, Mathematical Model of Hysteresis And Their Applications. Elsevier Sci-ence Inc., 2003.
[11] F. Auricchio and L. Petrini, “A three-dimensional model describing stress-temperatureinduced solid phase transformations: solution algorithm and boundary value problems,”International Journal for Numerical Methods in Engineering, vol. 61, no. 6, pp. 807–836,Sep 2004.
[12] Z. Li, C. Y. Su, and T. Chai, “Compensation of hysteresis nonlinearity in magnetostrictiveactuators with inverse multiplicative structure for preisach model,” IEEE Transactions on
Automation Science and Engineering, vol. 11, no. 2, pp. 613–619, April 2014.
[13] F. Anooshahpour, I. G. Polushin, and R. V. Patel, “Classical preisach model of hystereticbehavior in a da vinci instrument,” IEEE International Conference on Advanced Intelli-
gent Mechatronics, 2016.
[14] K. K. Ahn and N. B. Kha, “Improvement of the performance of hysteresis compensationin sma actuators by using inverse preisach model in closed loop control system,” Journal
of Mechanical Science and Technology, vol. 20, no. 5, pp. 634–642, 2006.
[15] V. T. Liu, W. C. Yang, and H. Y. Wing, “Realization of preisach model using adaptivepolynomial approximation method,” in 5th IEEE Conference on Industrial Electronics
and Applications, June 2010, pp. 1258–1263.
[16] M. R. Zakerzadeh, M. Firouzi, H. Sayyaadi, and S. B. Shouraki, “Hysteresis nonlinearityidentification using new preisach model-based artificial neural network approach,” Jour-
nal of Applied Mathematics, vol. 2011, pp. 1–22, 2011.
[17] S. Haykin, Neural Networks: A Comprehensive Foundation, 2nd ed. Prentice-Hall Inc.,1999.
[18] Y. Iiguni, H. Sakai, and H. Tokumaru, “A real-time learning algorithm for a multilay-ered neural network based on the extended kalman filter,” IEEE Transactions on Signal
Processing, vol. 40, no. 4, pp. 959–966, Apr 1992.
[19] M. S. Grewal and A. P. Andrews, Kalman Filtering: Theory and Practice Using MATLAB.Willy-IEEE Press, 2008.

BIBLIOGRAPHY 58
[20] G. Bradski, “The opencv library,” Dr. Dobb’s Journal of Software Tools, 2000.
[21] G. Bradski and A. Kaehler, Learning OpenCV, 1st ed. OReilly Media, Inc., 2008.
[22] Z. Zhang, “Flexible camera calibration by viewing a plane from unknown orientations,”in Proceedings of the 7th IEEE International Conference on Computer Vision, 1999, pp.666–673.
[23] ——, “A flexible new technique for camera calibration,” IEEE Transactions on Pattern
Analysis and Machine Intelligence, vol. 22, no. 11, pp. 1330–1334, 2000.
[24] E. F. Camacho and C. Bordons, Model Predictive Control, 2nd ed. Springer-Verlag,2004.
[25] N. Nikdel, P. Nikdel, M. A. Badamchizadeh, and I. Hassanzadeh, “Using neural networkmodel predictive control for controlling shape memory alloy-based manipulator,” IEEE
Transactions on Industrial Electronics, vol. 61, no. 3, pp. 1394–1401, March 2014.
[26] R. Hedjar, “Adaptive neural network model predictive control,” International Journal of
Innovative Computing, Information and Control, vol. 9, no. 3, pp. 1245–1257, 2013.

Chapter 3
Design of an Ultra Thin SuperelasticShape Memory Alloy Strain Sensor
3.1 Introduction
Force information plays a significant role in surgical procedures, for example, when perform-ing tasks such as blunt dissection [1] and suturing [2, 3], and in general to prevent damageto tissue as a result of applying excessive force. This information is available to surgeonsduring open surgery as a result of their direct access to tissue. However, in minimally inva-sive surgery (MIS) which is performed with long slender instruments, either manually or withrobotic assistance, this force information is very inaccurate (for manual MIS) or is not avail-able (for current robotic MIS systems). Therefore for MIS, alternative means of obtaining theforce of tool-tissue interaction is necessary. One approach is the sensorization of surgical toolswith force/torque sensors. The resulting force information can then be presented to surgeonsdirectly via a haptic interface or visually on a monitor as a force value.
Strain gauges and fibre optic sensors (such as Fiber Bragg Grating (FBG) sensors) havebeen used in recent research work to measure tool-tissue interaction forces in minimally in-vasive surgical tools [4]. Trejos et al. [5] sensorized a custom laparoscopic instrument usingConstantan foil strain gauges to measure tool-tissue interaction forces and torques in 5 degreesof freedom (DOF). These strain gauges have a gauge factor (GF) of 2 and measure strain upto 3%; however, their installation is complex and they require frequent re-calibration. Re-cently Hammond et al. [6] developed a method to directly print strain gauges on commerciallyavailable medical devices. Their method does not require precise surface treatments that arerequired for conventional foil strain gauges; however the GF of this sensor was reported to be1.16, which is not as high as commonly used metallic foil strain gauges, limiting its resolu-
59

3.1. INTRODUCTION 60
Figure 3.1: Nitinol strain sensor vs commercial metallic foil strain gauge.
tion and accuracy. In [7], 0.2 mm wide silicon strain gauges were used for the design of amicrosurgical instrument tip force sensor for measuring contact forces during retinal surgery.Silicon strain gauges show much higher GF (50-200) than metallic foil gauges, but due to thevery low measurement range (<0.5%), these strain gauges work better for applications wherelower strains have to be measured and high sensitivity is required such as in [7]. FBG sensorsare a better alternative to strain gauges in terms of sensitivity, magnetic resonance compatibil-ity and low space requirement. These sensors were used in [8] to sensorize an arthroscopictool, in [9] to measure lateral forces at the tip of a da Vinci surgical instrument, in [10] forforce, torsion and shape sensing of a continuum robot, and in [11] to measure contact forces ofan ablation catheter during radiofrequency ablation. However, the process of FBG inscriptiongreatly increases the manufacturing cost of these sensors which hinders their use in commercialapplications such as for da Vinci surgical tools, ablation catheters and surgical needles wherethe instruments are disposable or limited in the number of uses.
Strain sensors can also be made using SMAs. Schoor et al. [12] have a patent for an SMAstrain gauge to measure large strains in fabrics (up to 20%). These gauges are relatively largeand intended for high force applications (seatbelts and parachute canopies). In [13], Tung et
al. fabricated a laser machined SMA sensor for position feedback in active catheters. Theirsensor has a GF of 6.9 and can be elongated up to 30%; however, this sensor has only 1.5Ω ofelectrical resistance, which limits the maximum allowable voltage across the sensor in order toavoid thermal drift in the sensor output, thus, reducing the SNR of the measurements.
This chapter presents a novel-high performance ultra thin strain sensor (15 µm diameter)that uses a single superelastic Nitinol wire (Figure 3.1), and is suitable for use in a variety of

3.2. NITINOL SENSOR DESIGN 61
surgical instruments. In comparison to existing metallic foil strain gauges, the proposed sensorhas higher sensitivity (GF = 3.56), larger measurement range (4.25%) and higher flexibilitywhich make this sensor applicable to both rigid surgical instruments (such as laparoscopictools) and flexible surgical instruments (such as catheters and surgical needles). As opposedto the SMA sensor, used in [13], which has a complex geometric structure, the simplicity ofthe sensor, described in this chapter, significantly reduces its manufacturing and installationcost. Therefore, this sensor has the advantage that it can be easily and cost effectively usedin disposable surgical instruments where the use of expensive sensors such as FBGs may bedifficult to justify. In this chapter, a da Vinci surgical instrument was sensorized using 8 ofthese sensors to demonstrate their force sensing capability in MIS. The design and validationof this technology is presented in the following sections.
3.2 Nitinol Sensor Design
3.2.1 Nickel-Titanium Alloy Properties
Nitinol is a Nickel-Titanium alloy that exhibits two unique properties: shape memory effect,and pseudoelasticy/superelasticy. Nitinol’s shape memory characteristic allows deformationat a low temperature to be recovered when heated above its transition temperature. Abovethis transition temperature, Nitinol also exhibits pseudoelastic characteristics; allowing it toregain its original shape after being deformed with strains as high as 6-7%. Since its discoveryin 1962, these characteristics have led to Nitinol being used extensively in many biomedicalapplications, such as active catheters, vascular stents and orthodontic wires [14].
3.2.2 Nitinol as a Strain Sensor
Two important characteristics of a strain sensor are its stretchability and sensitivity. These twocharacteristics for Nitinol are discussed below.1) Stretchability: The Young’s modulus for Nitinol is around 75 GPa, which when comparedto the most common strain gauge material, Constantan, with a Young’s modulus of 160 GPasuggests that Nitinol is flexible enough for use as a strain gauge. In addition, the pseudoelasticproperty of Nitinol enlarges the region of recoverable strain which makes Nitinol better thanconventional strain gauges for those applications requiring measurement of higher strains.2) Sensitivity: The sensitivity of a strain sensor is defined in terms of GF which is the ratio ofthe normalized change in resistance to strain in the sensor. If a Nitinol wire has length l and

3.2. NITINOL SENSOR DESIGN 62
cross-sectional area A, then the resistance R of wire is defined as
R =ρlA
(3.1)
where ρ is the resistivity of the wire. By taking derivatives on both sides (3.1) with respect tolength, we can write ([15])
dRR
=dρρ
+ (1 + 2ν)ε (3.2)
where ν is the Poisson’s ratio and ε is strain in the wire. The Poisson’s ratio of Nitinol is 0.33,so the GF of Nitinol is defined as
GF =dR/Rε
=dρ/ρε
+ 1.66 (3.3)
Based on this, the GF also depends on the normalized change in resistivity with respectto strain, also known as the piezoresistive effect. It was found experimentally that the GF ofNitinol was 3.5, indicating that the resistivity of Nitinol increases when strain is increased.Hence, in terms of sensitivity, Nitinol performs better than most conventional strain gauges.
3.2.3 Sensor Selection Criteria
The most widely used method for measuring the output of strain gauges is using a Wheatstonebridge. The change in the output of a Wheatstone bridge with respect to strain is directlyproportional to the excitation voltage (3.6). Therefore, the excitation voltage should be kept ashigh as possible to increase the signal-to-noise ratio (SNR) of the sensor; however, in practicalapplications the maximum excitation voltage is limited because Joule heating causes the sensortemperature to increase, resulting in a change in resistance and generating a drift in the sensoroutput. To reduce the Joule heating and increase the allowable excitation voltage, the resistanceof the sensor should be maximized by selecting a long wire with a smaller diameter (3.1).Therefore, a superelastic Nitinol wire with a diameter of 15 µm (the thinnest currently availableon the market) was used in this work.
3.2.4 Lead Wire Connection
The Nitinol wire is commonly connected to electrical lead wires using crimps, laser weldingor soldering. Crimping requires an additional part which is not desirable in medical devicesbecause it increases the size of the sensor. Laser welding can produce a clean connection, but inour experience, this is very difficult to achieve with Nitinol wire less than 100 µm in diameter.

3.2. NITINOL SENSOR DESIGN 63
Soldering Nitinol wires can also be challenging because the thin layer of titanium oxide on thesurface of Nitinol makes it difficult to wet the surface with solder; however, good results can beobtained using a combination of solder (96.5 Sn/3.5 Ag) and flux (Flux #2, Indium, Chicago,IL, USA) as shown in [16].
3.2.5 Signal Conditioning
Figure 3.2: Overview of the sensor data flow.
A Wheatstone bridge is used to measure the voltage output of the Nitinol sensor (Figure3.2). In order to balance the bridge, a trimmer potentiometer (Rc) is shunted with one of thefixed leg (Ra) of the Wheatstone bridge. The differential output of the Wheatstone bridge isthen amplified by a programmable instrumentation amplifier (PGA 281, Texas Instruments,Dallas, TX, United States) with a gain (G) set to 176. To remove high frequency noise, thesignal is passed through an RC low-pass filter with a 60 Hz cut-off frequency. Finally, theoutput signal is sent to the computer via an analog-to-digital converter of a data acquisitionboard (Sensoray 626, Sensoray Co. Inc., Chicago, IL, USA) at 250 Hz sampling rate.
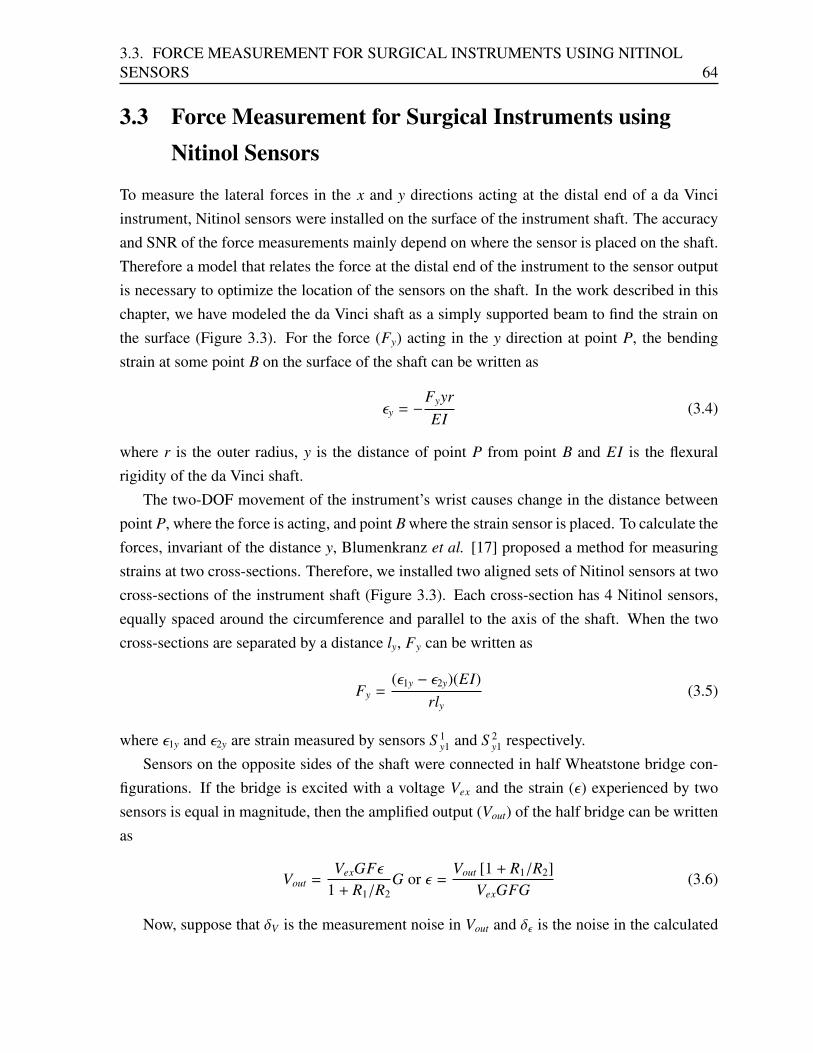
3.3. FORCE MEASUREMENT FOR SURGICAL INSTRUMENTS USING NITINOLSENSORS 64
3.3 Force Measurement for Surgical Instruments usingNitinol Sensors
To measure the lateral forces in the x and y directions acting at the distal end of a da Vinciinstrument, Nitinol sensors were installed on the surface of the instrument shaft. The accuracyand SNR of the force measurements mainly depend on where the sensor is placed on the shaft.Therefore a model that relates the force at the distal end of the instrument to the sensor outputis necessary to optimize the location of the sensors on the shaft. In the work described in thischapter, we have modeled the da Vinci shaft as a simply supported beam to find the strain onthe surface (Figure 3.3). For the force (Fy) acting in the y direction at point P, the bendingstrain at some point B on the surface of the shaft can be written as
εy = −FyyrEI
(3.4)
where r is the outer radius, y is the distance of point P from point B and EI is the flexuralrigidity of the da Vinci shaft.
The two-DOF movement of the instrument’s wrist causes change in the distance betweenpoint P, where the force is acting, and point B where the strain sensor is placed. To calculate theforces, invariant of the distance y, Blumenkranz et al. [17] proposed a method for measuringstrains at two cross-sections. Therefore, we installed two aligned sets of Nitinol sensors at twocross-sections of the instrument shaft (Figure 3.3). Each cross-section has 4 Nitinol sensors,equally spaced around the circumference and parallel to the axis of the shaft. When the twocross-sections are separated by a distance ly, Fy can be written as
Fy =(ε1y − ε2y)(EI)
rly(3.5)
where ε1y and ε2y are strain measured by sensors S 1y1 and S 2
y1 respectively.Sensors on the opposite sides of the shaft were connected in half Wheatstone bridge con-
figurations. If the bridge is excited with a voltage Vex and the strain (ε) experienced by twosensors is equal in magnitude, then the amplified output (Vout) of the half bridge can be writtenas
Vout =VexGFε
1 + R1/R2G or ε =
Vout [1 + R1/R2]VexGFG
(3.6)
Now, suppose that δV is the measurement noise in Vout and δε is the noise in the calculated

3.3. FORCE MEASUREMENT FOR SURGICAL INSTRUMENTS USING NITINOLSENSORS 65
Figure 3.3: Cantilever model of a da Vinci shaft integrated with strain sensors at two cross-sections. Sensors opposite to S1
x1 and S2x1 are not shown.
strain, such that
Vmeasured = Vout + δV and εmeasured = ε + δε (3.7)
then from (3.6),
δε =δV[1 + R1/R2]
VexGFG(3.8)
and the force measured can be written as below.
Fmeassured =(ε1y − ε2y)(EI)
rly︸ ︷︷ ︸Signal
+(δε1y − δε2y)(EI)
rly︸ ︷︷ ︸Noise
(3.9)
From (3.9), the SNR would be
SNR =PS ignal
PNoise=
(ε1y − ε2y)2
(δε1y)2 + (δε2y)2 (3.10)
The denominator of (3.10) is independent of the sensor position. Hence, in order to maximizeSNR, the numerator of (3.10) should be maximized, i.e., εy1 should be large and εy2 shouldbe small. This suggests that the cross-section 1 should be selected as far as possible from thetip and cross-section 2 should be selected as close as possible to the tip. For this work, wehave placed cross-section 1 at a distance of 80 mm from the instrument tip; however, to avoidfrictional forces and torques created by the trocar and abdominal wall, this distance should bemodified according to the application to ensure that cross-section 1 is always inside the bodyduring use. Additionally, cross-section 2 should be set back from the instrument tip such thatthere are no forces acting on the instrument between cross-sections 1 and 2 (i.e. tool-tissueinteraction should be distal to cross-section 2). For this work, we have placed cross-section 2

3.4. EXPERIMENTS 66
at a distance of 20 mm from the instrument tip.
3.4 Experiments
3.4.1 Gauge Factor Calculation
The GF was found experimentally using the setup shown in Figure 3.4. A 15 µm diameterNitinol wire of length 40 mm was fixed at both ends using custom made clamps. The wire wasthen repeatedly stretched to a strain of 4.25% and relaxed using a linear stage (TLSM050A,Zaber Technologies Inc, Vancouver, BC, Canada) at a speed of 40 µm/s for 5 cycles. Theresistance of the wire was computed continuously from the output of a quarter Wheatstonebridge.
Figure 3.4: Experimental setup for calculating the gauge factor of Nitinol wire.
3.4.2 Sensor Calibration
Figure 3.5(a) shows the experimental setup used for calibrating the Nitinol sensors installedon the da Vinci instrument. In the setup, a force/torque (F/T) sensor (Nano-43, ATI IndustrialAutomation, Apex, NC, USA) was mounted on the distal end of the tool shaft using a custommade sensor interface. Nitinol sensor pairs at cross-section 1 were assumed to be perfectlyaligned with sensor pairs at cross-section 2, while the pair S 1
x1, S 1x2 are at an angle of θx with the
x-axis and the pair S 1y1, S 1
y2 at an angle of θy with the y-axis of the F/T sensor as shown in Figure3.5(b). A transformation matrix (T 2x4) that relates voltage values from 4 half Wheatstonebridges to force values in the x and y direction can be written as (3.11), using (3.5), (3.6) and

3.4. EXPERIMENTS 67
Figure 3.5: (a) Left: A F/T sensor with a handle and a sensor interface, right: F/T sensormounted on a sensorized da Vinci instrument. (b) Cross-section of the sensorized da Vinciinstrument shaft, showing Nitinol sensors orientation with respect to x-y axes of F/T sensor.
rotational transformations. Fx
Fy
= T
∆Vx1
∆Vx2
∆Vy1
∆Vy2
(3.11)
where ∆V is the change in the sensor output voltage with respect to a no-load output voltage.For the calibration, random forces were applied to the handle connected to the F/T sensor. Thefx and fy values from the F/T sensor (Figure 3.6(a)) and the voltage values from the Nitinolsensors (Figure 3.6(b)) were used to estimate the parameters of the transformation matrix usingthe lsqnonlin function in MATLAB R©. The resulting transformation matrix parameters were:
T =
35.9399 −40.3963 −11.4245 12.7828−10.5195 11.8238 −36.3261 40.6450
3.4.3 Sensor Performance Assessment
The performance of the sensorized da Vinci instrument was assessed experimentally as follows.(i) The lateral forces acting at the distal end of the instrument shaft were validated by using thesame setup used for sensor calibration (Figure 3.5(a)). The handle attached to the F/T sensor
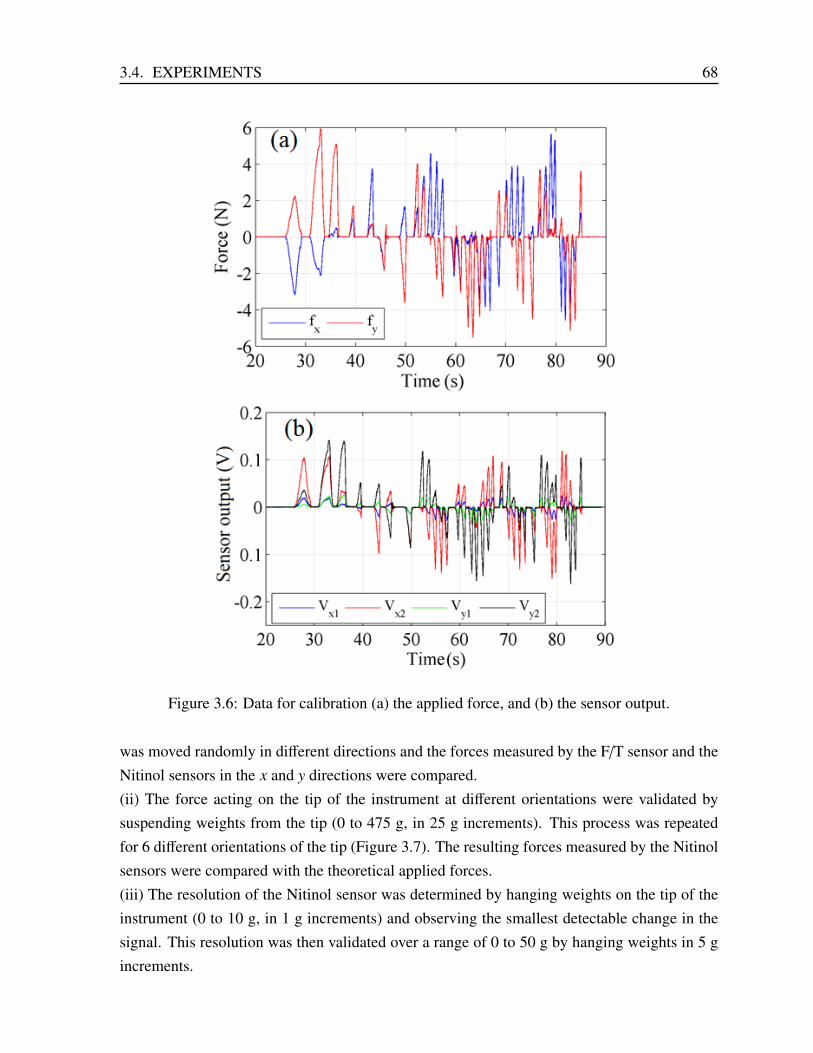
3.4. EXPERIMENTS 68
Figure 3.6: Data for calibration (a) the applied force, and (b) the sensor output.
was moved randomly in different directions and the forces measured by the F/T sensor and theNitinol sensors in the x and y directions were compared.(ii) The force acting on the tip of the instrument at different orientations were validated bysuspending weights from the tip (0 to 475 g, in 25 g increments). This process was repeatedfor 6 different orientations of the tip (Figure 3.7). The resulting forces measured by the Nitinolsensors were compared with the theoretical applied forces.(iii) The resolution of the Nitinol sensor was determined by hanging weights on the tip of theinstrument (0 to 10 g, in 1 g increments) and observing the smallest detectable change in thesignal. This resolution was then validated over a range of 0 to 50 g by hanging weights in 5 gincrements.

3.5. RESULTS 69
Figure 3.7: 6 different orientations of the tip used for validating the sensor measurement whenforces are acting at different orientations of the tip.
(iv) To measure no-load signal drift, force measurements were recorded after the system hadbeen turned off for 2 hours, and then again after the system had been running for 20 minutes.
3.5 Results
The normalized change in resistance versus strain for the Nitinol wire is plotted in Figure 3.8for all five cycles. From (3.3), the GF of the Nitinol wire was found to be 3.56 by calculatingthe slope of the best linear fit of the plotted data. In addition, the sensor showed a linearresponse, good repeatability and negligible hysteresis. The sensor also performed well duringmeasurement of the lateral forces acting near the distal end of the da Vinci instrument. Figure3.9 shows the forces measured by the Nitinol sensors and a commercially available F/T sensor.
Figure 3.8: Normalized change in resistance with respect to strain in Nitinol wire (for 5 repet-itive cycles).

3.5. RESULTS 70
Table 3.1: Comparison of Nitinol sensor with commercial strain sensors
Properties Nitinolsensor
Silicon straingauge [18]
Metallic foil strain gauges [19] FBGsensor
Con-stan-tan
Isoelastic KarmaAlloy
Gauge factor 3.56 50-200 2.1 3.2 2.0 N/AMaximumpositive strain
4.25% <0.5 % 3-5% 1.5% (Nonlinearabove 0.5%)
1.5% <1 %
Cost of 1sensor
<2 $ 10-25 $ 10-25 $ 10-25 $ 10-25 $ 100 $
Professionalinstallation
Notrequired
Required Re-quired
Required Re-quired
Not re-quired
The Nitinol sensors are able to accurately measure the two-DOF forces with an RMS error of0.027 N in the x direction and 0.031 N in the y direction. Figure 3.10 shows the force measuredby the Nitinol sensors when a series of weights are placed at the tip of the instrument fordifferent orientations. The Nitinol sensors identified properly the applied forces independentlyof the tip orientation, with an RMS error of 0.032 N.
The force resolution of the sensorized tool was characterized based on the peak-peak noisepresent in the measured signal when a constant load is applied. Figure 3.11 shows force mea-surements from 0 to 50 g, in 5 g increments. Based on the experiments the resolution of thesensor was found to be at least 55 mN. Significant drift in the sensor force reading was ob-served when the system was just turned on (Figure 3.12(a)). The mean of the measuredforce for 1 second in the x and y directions drifted up to 91 mN and -76 mN after 500 secondsrespectively. This drift occurs because the temperature of the sensors is increased due to Jouleheating. After a few minutes, the sensor temperature becomes stable, and the signal drift isalmost negligible as shown in Figure 3.12(b).
Table 3.1 shows a comparison between the Nitinol sensor under study and commerciallyavailable strain sensors such as silicon strain gauges (from Micron Instruments, Simi Valley,CA, USA), metallic foil strain gauges (from Vishay Precision Group, Raleigh, NC, USA) andFBG sensors (from Technica, Beijing, China). The Nitinol sensor has a better combinationof high sensitivity and large strain measurement range than the compared metallic foil straingauges. Unlike the metallic foil strain gauges, the Nitinol sensor does not require any back-ing material, which combined with its ultra thin structure significantly increases its flexibility.Therefore high flexibility in addition to high sensitivity and large strain range allows this sen-

3.5. RESULTS 71
Figure 3.9: Force measured by F/T sensor versus force measured by Nitinol strain sensor.
sor to be used in both rigid and flexible surgical instruments. Although the sensitivity of theNitinol sensor is lower than that of silicon strain gauges and FBG sensors, our results showedacceptable performance of the sensors for most of the surgical applications. Furthermore, theNitinol sensor can be easily glued on objects without any sophisticated surface preparationwhereas often a professional is required to install the silicon and metallic foil strain gaugeson objects which significantly increases the overall cost of using these technologies Therefore,because of its low cost, relatively high sensitivity and large strain measurement range, the pro-posed Nitinol sensor is an attractive alternative to other strain sensors for variety of surgicalinstruments. It is worth mentioning, that in order to use this sensor on conductive surfaces, aninsulation coating would be required.

3.6. CONCLUSION 72
Figure 3.10: Resultant force measured by the Nitinol sensors for a series of weights placed atthe tip for different orientations (see Figure 3.7).
3.6 Conclusion
This chapter presented a novel, ultra thin strain sensor made of superelastic Nitinol wire. Thesesensors were installed on a da Vinci surgical tool in order to demonstrate their capability offorce sensing in a surgical instrument. The results showed that the Nitinol sensor technologyperforms well for rigid surgical instruments and has low cost and space requirements. Giventhe fact that Nitinol sensors also have large strain measurement range and good sensitivity, itcan be concluded that they are excellent cost effective sensors for strain/force measurementof thin surgical instruments such as laparoscopes as well as more flexible instruments such ascatheters and surgical needles.

3.6. CONCLUSION 73
Figure 3.11: Nitinol sensor resolution characterization.
Figure 3.12: No-load signal drift in the force measurement, (a) immediately after turning onthe sensor and (b) 20 minutes after turning on the sensor.

Bibliography
[1] C. Wagner, N. Stylopoulos, and R. Howe, “The role of force feedback in surgery: anal-ysis of blunt dissection,” in Proceedings of the 10th Symposium on Haptic Interfaces for
Virtual Environment and Teleoperator Systems, Mar. 2002, pp. 68–74.
[2] M. Tavakoli, R. V. Patel, and M. Moallem, “Robotic suturing forces in the presence ofhaptic feedback and sensory substitution,” in Proceedings of 2005 IEEE Conference on
Control Applications, 2005. CCA 2005., Aug. 2005, pp. 1–6.
[3] B. T. Bethea, A. M. Okamura, M. Kitagawa, T. P. Fitton, S. M. Cattaneo, V. L. Gott, W. A.Baumgartner, and D. D. Yuh, “Application of haptic feedback to robotic surgery,” Journal
of Laparoendoscopic & Advanced Surgical Techniques, vol. 14, no. 3, pp. 191–195, June2004.
[4] A. L. Trejos, R. V. Patel, and M. D. Naish, “Force sensing and its application in minimallyinvasive surgery and therapy: A survey,” Proceedings of the Institution of Mechanical
Engineers, Part C: Journal of Mechanical Engineering Science, vol. 224, no. 7, pp. 1435–1454, July 2010.
[5] A. L. Trejos, R. V. Patel, M. D. Naish, A. C. Lyle, and C. M. Schlachta, “A sensorizedinstrument for skills assessment and training in minimally invasive surgery,” ASME. J.
Med. Devices, vol. 3, no. 4, pp. 041 002–12, Nov. 2009.
[6] F. L. Hammond, M. J. Smith, and R. J. Wood, “Estimating surgical needle deflectionwith printed strain gauges,” in the 36th Annual International Conference of the IEEE
Engineering in Medicine and Biology Society, Aug. 2014.
[7] P. Berkelman, L. Whitcomb, R. Taylor, and P. Jensen, “A miniature microsurgical instru-ment tip force sensor for enhanced force feedback during robot-assisted manipulation,”IEEE Transactions on Robotics and Automation, vol. 19, no. 5, pp. 917–921, Oct. 2003.
[8] D. Yurkewich, A. Escoto, A. Trejos, M.-E. LeBel, R. Patel, and M. Naish, “Low-costforce-sensing arthroscopic tool using threaded fiber bragg grating sensors,” in 5th IEEE
74

BIBLIOGRAPHY 75
RAS EMBS International Conference on the Biomedical Robotics and Biomechatronics,Aug. 2014, pp. 28–33.
[9] K. S. Shahzadaa, A. Yurkewich, R. Xu, and R. V. Patel, “Sensorization of a surgicalrobotic instrument for force sensing,” in SPIE BiOS. 2016 (In Press), 2016.
[10] R. Xu, A. Yurkewich, and R. V. Patel, “Curvature, torsion and force sensing in continuumrobots using helically-wrapped fbg sensors,” IEEE Robotics and Automation Letters (In
press), 2016.
[11] K. Yokoyama, H. Nakagawa, D. C. Shah, H. Lambert, G. Leo, N. Aeby, A. Ikeda, J. V.Pitha, T. Sharma, R. Lazzara, and W. M. Jackman, “Novel contact force sensor incorpo-rated in irrigated radiofrequency ablation catheter predicts lesion size and incidence ofsteam pop and thrombus,” Circulation. Arrhythmia and electrophysiology, vol. 1, no. 5,pp. 354–362, Dec. 2008.
[12] M. van Schoor, A. Lengyel, G. Muller, and A. du Plessis, “Method and device for mea-suring strain using shape memory alloy materials,” U.S. Patent 6 550 341 B2, Apr. 22,2003.
[13] A. T. Tung, B.-H. Park, D. H. Liang, and G. Niemeyer, “Laser-machined shape mem-ory alloy sensors for position feedback in active catheters,” Sensors and Actuators A:
Physical, vol. 147, no. 1, pp. 83–92, Sept. 2008.
[14] L. Petrini and F. Migliavacca, “Biomedical applications of shape memory alloys,” Journal
of Metallurgy, vol. 2011, pp. 1–15, Sept. 2011.
[15] D. Patranabi, Sensors and Transducers, 2nd ed. PHI Learning Pvt. Ltd., 2003.
[16] “Soldering nitinol: Determining the best flux / solder combination,”Fort Wayne Metals. [Online]. Available: www.fwmetals.com/default/assets/File/
DesignofExperimentforSolderProject(1).pdf
[17] S. J. Blumenkranz and D. Q. Larkin, “Force and torque sensing for surgical instruments,”U.S. Patent 8 945 095 B2, Feb. 3, 2015.
[18] “Semiconductor strain gages.” [Online]. Available: https://www.microninstruments.com/
descriptions/document/StrainGageVolume2014v1.pdf
[19] “Strain gage selection: Criteria, procedures, recommendations.” [Online]. Available:http://www.vishaypg.com/docs/11055/tn505.pdf

Chapter 4
Conclusion and Future Work
This chapter presents the concluding remarks of this thesis research work and suggests possiblearea of future research on this topic based on the work presented in Chapters 2 and 3.
4.1 Conclusion
The research described in this thesis shows that SMAs have good potential for applicationboth as actuators and strain sensors for instruments used in miniamally invasive interventions.When they are used as actuators, they help in significantly reducing the cost of the actuatingthe instrument while reducing the amount of space required to implement them. When they areused as strain sensors they provide a cost-effective solution to measure tool-tissue interactionforces and the large bending strains in flexible instruments. Therefore, in this thesis we havestudied some of the major issues involved in using SMAs as actuators and strain sensors forapplications in MIST.
In Chapter 2, our focus was developing an accurate model to precisely control SMAs whenused as actuators. An adaptive model based model predictive controller was developed tocontrol the strain in an SMA actuators. Several experiments were conducted in order to evaluatethe performance of both the model and the controller. The results showed high accuracy of themodel in describing the hysteretic behavior of SMAs in response to input current, and highaccuracy of the controller in tracking various reference trajectories even in the presence of thedisturbances.
Chapter 3 focused on designing a highly miniaturized strain sensor using superelastic Niti-nol wire. The ultra thin strain sensor designed in this chapter comprised a single 15µm diameterof Nitinol wire and two lead wires connected to its two ends. The sensor was shown to havea GF of 3.5 which is better than most metallic foil strain gauges. In addition, the sensor also
76

4.2. FUTURE WORK 77
had a large strain measurement range. These two properties make this sensor well suited foruse in in both rigid and flexible surgical instruments. The sensor performance was validated bysensorizing a da Vinci surgical tool to measure the lateral forces acting near the distal end ofthe instrument. The results showed good accuracy and resolution of the force measurements.
4.2 Future Work
The research presented in this thesis has prepared the framework for implementing low-costaccurate sensors and actuators for the slender flexible instruments that are used in minimallyinvasive interventions. As part of the future work in this area, some important applications thatare envisaged include sensing and actuation of the flexible instruments such as active cathetersand endoscopes. The intention is to use SMA- based actuators and sensors in a feedbackcontrol stratgey to guide these instruments through the appropriate lumen. The sensors couldbe implemented near the instruments so as to measure the forces acting at the tip when itcomes in contact with tissues. Using the model and control framework presented in Chapter 2,it should be posible to develop a closed-loop control scheme to control the tip contact force.This would be particularly useful applications such as catheter-based cardiac ablation wherecontrol of tip contact force plays an important role in the success of the treatment.
Another possible application of the technology resulting from this research is in the sen-sorizing of slender flexible needles to measure needle bending and tip deflection during needle-based intervention such as in biopsy and brachytherapy (localized radiotherapy for cancer treat-ment by implantation of small radioactive pellets in tumors). In this thesis, an application tosensorization of a da Vinci instrument was discussed. Along the same lines, conventionallaparoscopic tools can also be sensorized with similar Nitinol SMAs. These can provide tool-tissue interaction forces during MIS.
Lastly, it should be noted that for clinical use of the instruments in the above mentioned ap-plications, it will be necessary to first demonstrate that the SMA sensors and actuators would beable to withstand a conventional sterilization procedure used for surgical instruments. There-fore future work would address this issue from the point of view of development of appropriatepackaging and implementation of sensors and actuators. Since the cost would be relatively low,it should be feasible to consider using this technology on single-use instruments.

Curriculum Vitae
Name: Amit Srivastava
Post-Secondary The University of Western OntarioEducation and London, Ontario, CanadaDegrees: 2013 - 2016 M.E.Sc (Electrical and Computer Engineering)
Indian Institute of Technology JodhpurJodhpur, Rajasthan, India2009 - 2013 B.Tech (Electrical Engineering)
Related Work Teaching AssistantExperience: The University of Western Ontario
2013 - 2015
Research AssistantThe University of Western Ontario2013 - 2016
Publications:
A. Srivastava, R. Xu, A. Escoto, C. Ward, and R. V. Patel, “Design of an Ultra Thin StrainSensor Using Superelastic Nitinol for Applications in Minimally Invasive Surgery”, in 2016
IEEE International Conference on Advanced Intelligent Mechatronics (AIM), Banff, Alberta,12-15 July, 2016.
78
Copyright © 2022 FDOKUMEN