Collagen extract obtained from Nile tilapia (Oreochromis ...
Upload
independentCategory
view
0download
0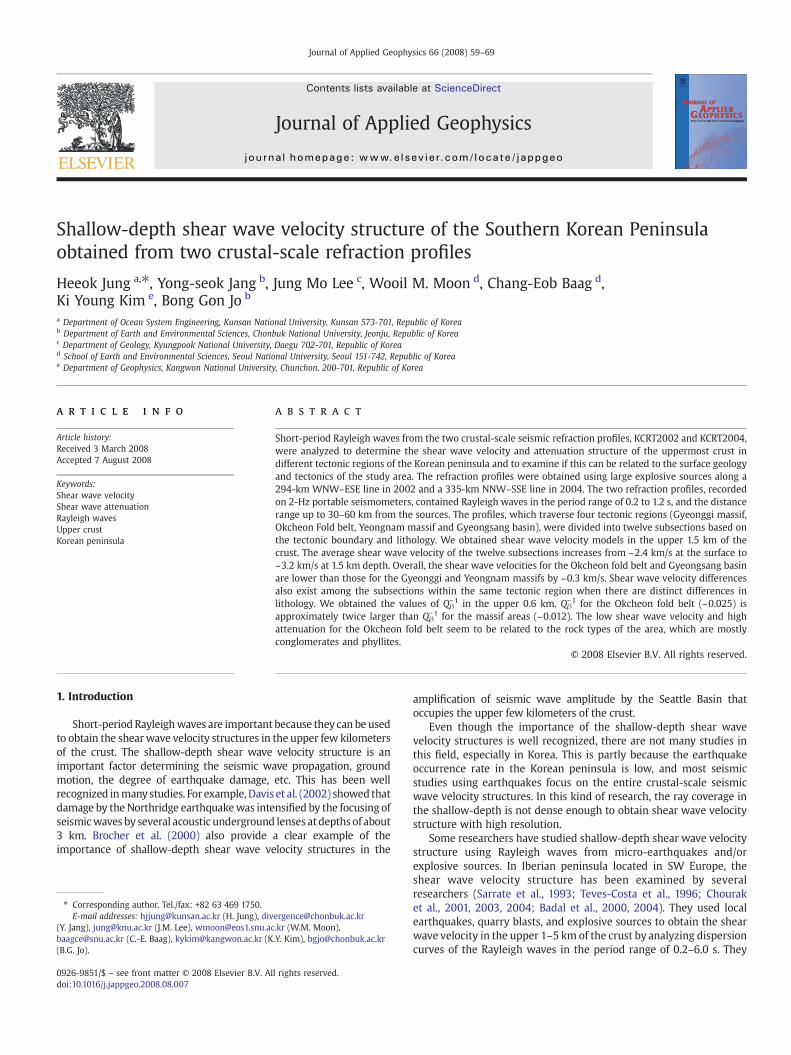
Journal of Applied Geophysics 66 (2008) 59–69
Contents lists available at ScienceDirect
Journal of Applied Geophysics
j ourna l homepage: www.e lsev ie r.com/ locate / jappgeo
Shallow-depth shear wave velocity structure of the Southern Korean Peninsulaobtained from two crustal-scale refraction profiles
Heeok Jung a,⁎, Yong-seok Jang b, Jung Mo Lee c, Wooil M. Moon d, Chang-Eob Baag d,Ki Young Kim e, Bong Gon Jo b
a Department of Ocean System Engineering, Kunsan National University, Kunsan 573-701, Republic of Koreab Department of Earth and Environmental Sciences, Chonbuk National University, Jeonju, Republic of Koreac Department of Geology, Kyungpook National University, Daegu 702-701, Republic of Koread School of Earth and Environmental Sciences, Seoul National University, Seoul 151-742, Republic of Koreae Department of Geophysics, Kangwon National University, Chunchon, 200-701, Republic of Korea
⁎ Corresponding author. Tel./fax: +82 63 469 1750.E-mail addresses: [email protected] (H. Jung), div
(Y. Jang), [email protected] (J.M. Lee), [email protected]@snu.ac.kr (C.-E. Baag), [email protected] (K(B.G. Jo).
0926-9851/$ – see front matter © 2008 Elsevier B.V. Aldoi:10.1016/j.jappgeo.2008.08.007
a b s t r a c t
a r t i c l e i n f oArticle history:
Short-period Rayleigh wave Received 3 March 2008Accepted 7 August 2008Keywords:Shear wave velocityShear wave attenuationRayleigh wavesUpper crustKorean peninsula
s from the two crustal-scale seismic refraction profiles, KCRT2002 and KCRT2004,were analyzed to determine the shear wave velocity and attenuation structure of the uppermost crust indifferent tectonic regions of the Korean peninsula and to examine if this can be related to the surface geologyand tectonics of the study area. The refraction profiles were obtained using large explosive sources along a294-km WNW–ESE line in 2002 and a 335-km NNW–SSE line in 2004. The two refraction profiles, recordedon 2-Hz portable seismometers, contained Rayleigh waves in the period range of 0.2 to 1.2 s, and the distancerange up to 30–60 km from the sources. The profiles, which traverse four tectonic regions (Gyeonggi massif,Okcheon Fold belt, Yeongnam massif and Gyeongsang basin), were divided into twelve subsections based onthe tectonic boundary and lithology. We obtained shear wave velocity models in the upper 1.5 km of thecrust. The average shear wave velocity of the twelve subsections increases from ~2.4 km/s at the surface to~3.2 km/s at 1.5 km depth. Overall, the shear wave velocities for the Okcheon fold belt and Gyeongsang basinare lower than those for the Gyeonggi and Yeongnam massifs by ~0.3 km/s. Shear wave velocity differencesalso exist among the subsections within the same tectonic region when there are distinct differences inlithology. We obtained the values of Qβ
−1 in the upper 0.6 km. Qβ−1 for the Okcheon fold belt (~0.025) is
approximately twice larger than Qβ−1 for the massif areas (~0.012). The low shear wave velocity and high
attenuation for the Okcheon fold belt seem to be related to the rock types of the area, which are mostlyconglomerates and phyllites.
© 2008 Elsevier B.V. All rights reserved.
1. Introduction
Short-period Rayleighwaves are important because theycan be usedto obtain the shearwave velocity structures in the upper few kilometersof the crust. The shallow-depth shear wave velocity structure is animportant factor determining the seismic wave propagation, groundmotion, the degree of earthquake damage, etc. This has been wellrecognized inmany studies. For example, Davis et al. (2002) showed thatdamage by the Northridge earthquakewas intensified by the focusing ofseismicwaves by several acoustic underground lenses atdepthsof about3 km. Brocher et al. (2000) also provide a clear example of theimportance of shallow-depth shear wave velocity structures in the
[email protected] (W.M. Moon),.Y. Kim), [email protected]
l rights reserved.
amplification of seismic wave amplitude by the Seattle Basin thatoccupies the upper few kilometers of the crust.
Even though the importance of the shallow-depth shear wavevelocity structures is well recognized, there are not many studies inthis field, especially in Korea. This is partly because the earthquakeoccurrence rate in the Korean peninsula is low, and most seismicstudies using earthquakes focus on the entire crustal-scale seismicwave velocity structures. In this kind of research, the ray coverage inthe shallow-depth is not dense enough to obtain shear wave velocitystructure with high resolution.
Some researchers have studied shallow-depth shear wave velocitystructure using Rayleigh waves from micro-earthquakes and/orexplosive sources. In Iberian peninsula located in SW Europe, theshear wave velocity structure has been examined by severalresearchers (Sarrate et al., 1993; Teves-Costa et al., 1996; Chouraket al., 2001, 2003, 2004; Badal et al., 2000, 2004). They used localearthquakes, quarry blasts, and explosive sources to obtain the shearwave velocity in the upper 1–5 km of the crust by analyzing dispersioncurves of the Rayleigh waves in the period range of 0.2–6.0 s. They
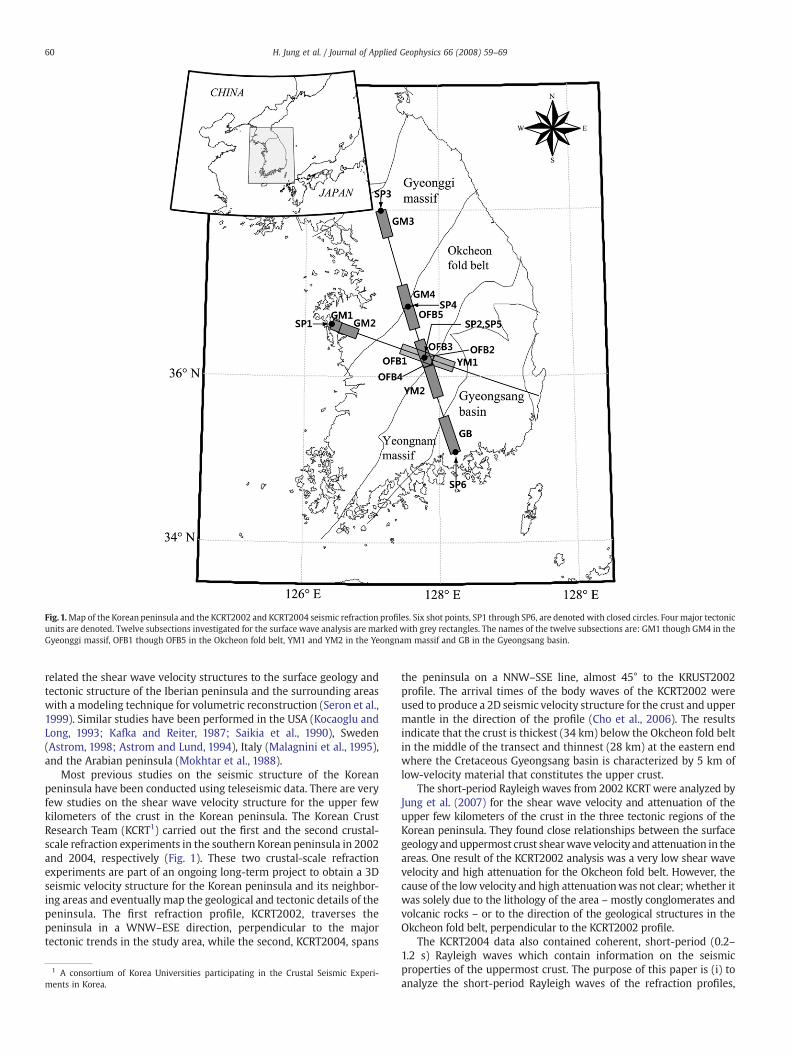
Fig. 1.Map of the Korean peninsula and the KCRT2002 and KCRT2004 seismic refraction profiles. Six shot points, SP1 through SP6, are denoted with closed circles. Fourmajor tectonicunits are denoted. Twelve subsections investigated for the surface wave analysis are marked with grey rectangles. The names of the twelve subsections are: GM1 though GM4 in theGyeonggi massif, OFB1 though OFB5 in the Okcheon fold belt, YM1 and YM2 in the Yeongnam massif and GB in the Gyeongsang basin.
60 H. Jung et al. / Journal of Applied Geophysics 66 (2008) 59–69
related the shear wave velocity structures to the surface geology andtectonic structure of the Iberian peninsula and the surrounding areaswith a modeling technique for volumetric reconstruction (Seron et al.,1999). Similar studies have been performed in the USA (Kocaoglu andLong, 1993; Kafka and Reiter, 1987; Saikia et al., 1990), Sweden(Astrom, 1998; Astrom and Lund, 1994), Italy (Malagnini et al., 1995),and the Arabian peninsula (Mokhtar et al., 1988).
Most previous studies on the seismic structure of the Koreanpeninsula have been conducted using teleseismic data. There are veryfew studies on the shear wave velocity structure for the upper fewkilometers of the crust in the Korean peninsula. The Korean CrustResearch Team (KCRT1) carried out the first and the second crustal-scale refraction experiments in the southern Korean peninsula in 2002and 2004, respectively (Fig. 1). These two crustal-scale refractionexperiments are part of an ongoing long-term project to obtain a 3Dseismic velocity structure for the Korean peninsula and its neighbor-ing areas and eventually map the geological and tectonic details of thepeninsula. The first refraction profile, KCRT2002, traverses thepeninsula in a WNW–ESE direction, perpendicular to the majortectonic trends in the study area, while the second, KCRT2004, spans
1 A consortium of Korea Universities participating in the Crustal Seismic Experi-ments in Korea.
the peninsula on a NNW–SSE line, almost 45° to the KRUST2002profile. The arrival times of the body waves of the KCRT2002 wereused to produce a 2D seismic velocity structure for the crust and uppermantle in the direction of the profile (Cho et al., 2006). The resultsindicate that the crust is thickest (34 km) below the Okcheon fold beltin the middle of the transect and thinnest (28 km) at the eastern endwhere the Cretaceous Gyeongsang basin is characterized by 5 km oflow-velocity material that constitutes the upper crust.
The short-period Rayleigh waves from 2002 KCRT were analyzed byJung et al. (2007) for the shear wave velocity and attenuation of theupper few kilometers of the crust in the three tectonic regions of theKorean peninsula. They found close relationships between the surfacegeology and uppermost crust shearwave velocity and attenuation in theareas. One result of the KCRT2002 analysis was a very low shear wavevelocity and high attenuation for the Okcheon fold belt. However, thecause of the low velocity and high attenuationwas not clear; whether itwas solely due to the lithology of the area – mostly conglomerates andvolcanic rocks – or to the direction of the geological structures in theOkcheon fold belt, perpendicular to the KCRT2002 profile.
The KCRT2004 data also contained coherent, short-period (0.2–1.2 s) Rayleigh waves which contain information on the seismicproperties of the uppermost crust. The purpose of this paper is (i) toanalyze the short-period Rayleigh waves of the refraction profiles,
61H. Jung et al. / Journal of Applied Geophysics 66 (2008) 59–69
KCRT2004, (ii) to combine the results from the two refraction profiles,and (iii) to interpret them in terms of surface geology and tectonicfeatures in the four major tectonic regions of the Korean peninsula.
2. Previous studies
Most studies of the velocity and attenuation of seismic waves in theKorean peninsula have been conducted using earthquake data. Thefollowing summary of the seismic structure of the Korean peninsula isbased on thework of Kim et al. (2000, 2007). The first velocity model ofcrustal structure in the Koreanpeninsula (Lee,1979)was based on traveltime data from the 1936Mt. Jiri earthquake and included a 35-km thickcrustwith a P-wave velocity of 5.8 km/s overlyingmantle (Vp=7.7 km/s).A recent 2Dvelocitymodel of the southernKoreanpeninsula (Park et al.,2003) indicates that the crust is generally thinner toward the east coastof the Korean peninsula. The thickness varies from greater than 33 kmnear Mt. Jiri in the south-central to less than 31 km in the Gyeongsangsedimentary basin in the southwestof thepeninsula. Three-dimensional
Fig. 2. Seismic record sections from the six shot points, SP1 though SP6, low-pass filtered aplotted seismic traces are normalized with respect to the maximum amplitude of each trac
velocity models for the lower crust, using multiphase inversion, showrelatively small lateral variation in the central Korean peninsula (Kim,1995). In the south, a distinct mid-crust interface exists in the depthrange of 14.5–26.0 km, and the Moho is shallower in the Gyeongsangbasin than in theYeongnammassif area (Park et al., 2003). According to arecent 3D velocity model of the southern Korean peninsula (Kang andPark, 2003), the distinctmid-crust interface at ~22.5 kmdepth is deeperin the central interior of the peninsula than near the eastern coast.Presently, there are few studies on the shear wave attenuation in theKorean peninsula. A one-dimensional shear wave attenuation model(Kim et al., 2000) based onQp andQc (quality factor calculated from codawaves) indicates aQ5 value of ~200 in the upper 3 kmof the crust in thesoutheastern Korean peninsula.
3. Seismic data
Our two seismic experiments were performed along a 294-kmWNW–ESE line (Profile KCRT2002) and a 335-km NNW–SSE line
t 5 Hz. Subsection names are shown at the bottom of each seismic record section. Thee.
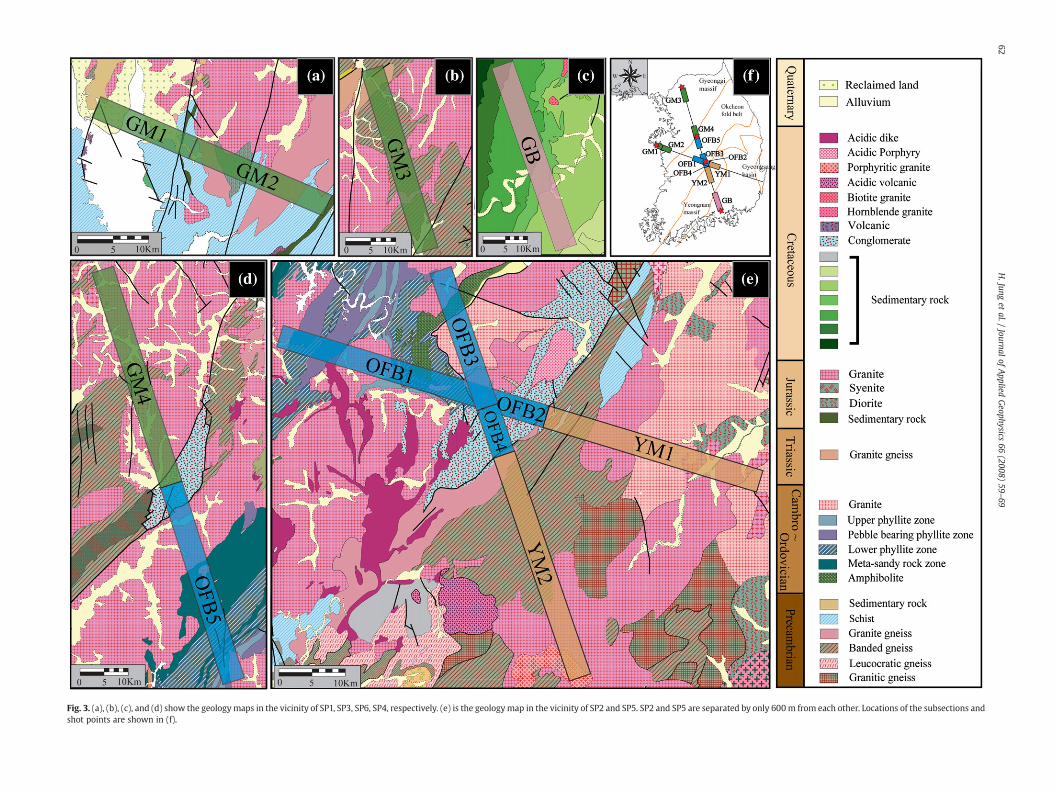
Fig. 3. (a), (b), (c), and (d) show the geology maps in the vicinity of SP1, SP3, SP6, SP4, respectively. (e) is the geologymap in the vicinity of SP2 and SP5. SP2 and SP5 are separated by only 600m from each other. Locations of the subsections andshot points are shown in (f).
62H.Jung
etal./
Journalof
Applied
Geophysics
66(2008)
59–69
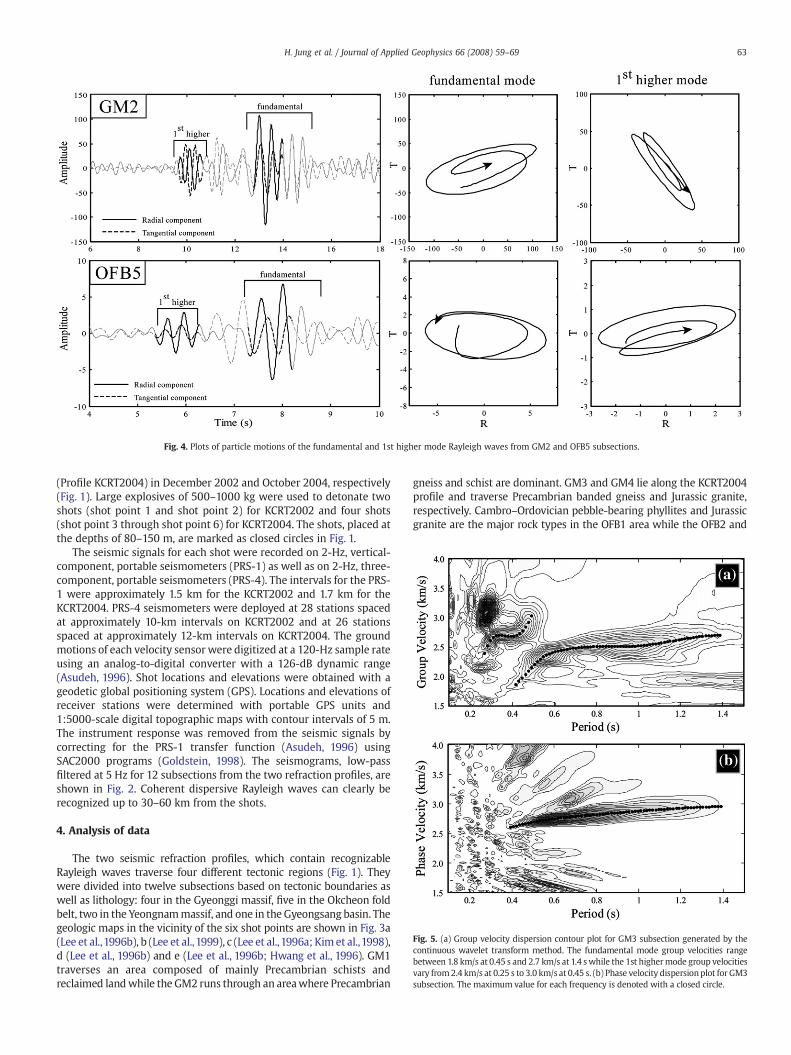
Fig. 4. Plots of particle motions of the fundamental and 1st higher mode Rayleigh waves from GM2 and OFB5 subsections.
Fig. 5. (a) Group velocity dispersion contour plot for GM3 subsection generated by thecontinuous wavelet transform method. The fundamental mode group velocities rangebetween 1.8 km/s at 0.45 s and 2.7 km/s at 1.4 swhile the 1st highermode group velocitiesvary from2.4 km/s at 0.25 s to 3.0 km/s at 0.45 s. (b) Phase velocity dispersionplot for GM3subsection. The maximum value for each frequency is denoted with a closed circle.
63H. Jung et al. / Journal of Applied Geophysics 66 (2008) 59–69
(Profile KCRT2004) in December 2002 and October 2004, respectively(Fig. 1). Large explosives of 500–1000 kg were used to detonate twoshots (shot point 1 and shot point 2) for KCRT2002 and four shots(shot point 3 through shot point 6) for KCRT2004. The shots, placed atthe depths of 80–150 m, are marked as closed circles in Fig. 1.
The seismic signals for each shot were recorded on 2-Hz, vertical-component, portable seismometers (PRS-1) as well as on 2-Hz, three-component, portable seismometers (PRS-4). The intervals for the PRS-1 were approximately 1.5 km for the KCRT2002 and 1.7 km for theKCRT2004. PRS-4 seismometers were deployed at 28 stations spacedat approximately 10-km intervals on KCRT2002 and at 26 stationsspaced at approximately 12-km intervals on KCRT2004. The groundmotions of each velocity sensor were digitized at a 120-Hz sample rateusing an analog-to-digital converter with a 126-dB dynamic range(Asudeh, 1996). Shot locations and elevations were obtained with ageodetic global positioning system (GPS). Locations and elevations ofreceiver stations were determined with portable GPS units and1:5000-scale digital topographic maps with contour intervals of 5 m.The instrument response was removed from the seismic signals bycorrecting for the PRS-1 transfer function (Asudeh, 1996) usingSAC2000 programs (Goldstein, 1998). The seismograms, low-passfiltered at 5 Hz for 12 subsections from the two refraction profiles, areshown in Fig. 2. Coherent dispersive Rayleigh waves can clearly berecognized up to 30–60 km from the shots.
4. Analysis of data
The two seismic refraction profiles, which contain recognizableRayleigh waves traverse four different tectonic regions (Fig. 1). Theywere divided into twelve subsections based on tectonic boundaries aswell as lithology: four in the Gyeonggi massif, five in the Okcheon foldbelt, two in the Yeongnammassif, and one in the Gyeongsang basin. Thegeologic maps in the vicinity of the six shot points are shown in Fig. 3a(Lee et al.,1996b), b (Lee et al.,1999), c (Lee et al.,1996a; Kim et al.,1998),d (Lee et al., 1996b) and e (Lee et al., 1996b; Hwang et al., 1996). GM1traverses an area composed of mainly Precambrian schists andreclaimed landwhile the GM2 runs through an areawhere Precambrian
gneiss and schist are dominant. GM3 and GM4 lie along the KCRT2004profile and traverse Precambrian banded gneiss and Jurassic granite,respectively. Cambro–Ordovician pebble-bearing phyllites and Jurassicgranite are the major rock types in the OFB1 area while the OFB2 and
64 H. Jung et al. / Journal of Applied Geophysics 66 (2008) 59–69
OFB4 areas are covered entirely by Cretaceous conglomerates. OFB3 andOFB5 traverse Mesozoic granite and an area composed of Mesozoicgranite and Cambrianmeta-sandstone, respectively. YM1 in the Young-nam massif traverses Precambrian gneiss and Mesozoic granite, whileYM2 runs through Precambrian banded gneiss and Mesozoic granite.
4.1. Group and phase velocity determination
The methods used to determine the group and phase velocity andanelastic attenuation are fully described in the analysis of KCRT2002by Jung et al. (2007). Here, we present a brief review. To obtain thegroup velocity of the twelve subsections, we used a continuouswavelet transformation. Many different versions of the multiplefiltering technique have been proposed to obtain the group velocitydispersion since Dziewonski et al. (1969) introduced it almost fourdecades ago. We employed a continuous wavelet transform methodbecause the coverage of time and frequency can be uniquely defined,and measurement errors can be set in both time and frequencydomains without ambiguity; as contrasted with windowed Fourieranalysis, where the resolution in frequency depends on the arbitrarychoice of the width of band-pass filter (Pyrak-Nolte and Nolte, 1995).
The definition of the continuous wavelet transform of a seismicsignal (xn′) is:
Wn sð Þ ¼ ∑N−1
n0¼0xn0
ffiffiffiffiffiδts
rW⁎
0nV−nð Þδt
s
� �ð1Þ
where n is the time index of the location of the window, s the waveletscale, and Ψ the mother wavelet. We use a Gaussian derivativefunction as the mother wavelet. The real component of Ψ function is:
W0 ηð Þ ¼ −1ð Þmþ1ffiffiffiffiffiffiffiffiffiffiffiffiffiffiffiffiffiffiffiffiC mþ 1
2
� �q dm
dηme−η
2=2� �
ð2Þ
where Γ is the gamma function andm the derivative order. The complexwavelet is generated by the addition of a Heaviside function in thefrequency domain. The Gaussian derivative wavelet produced the
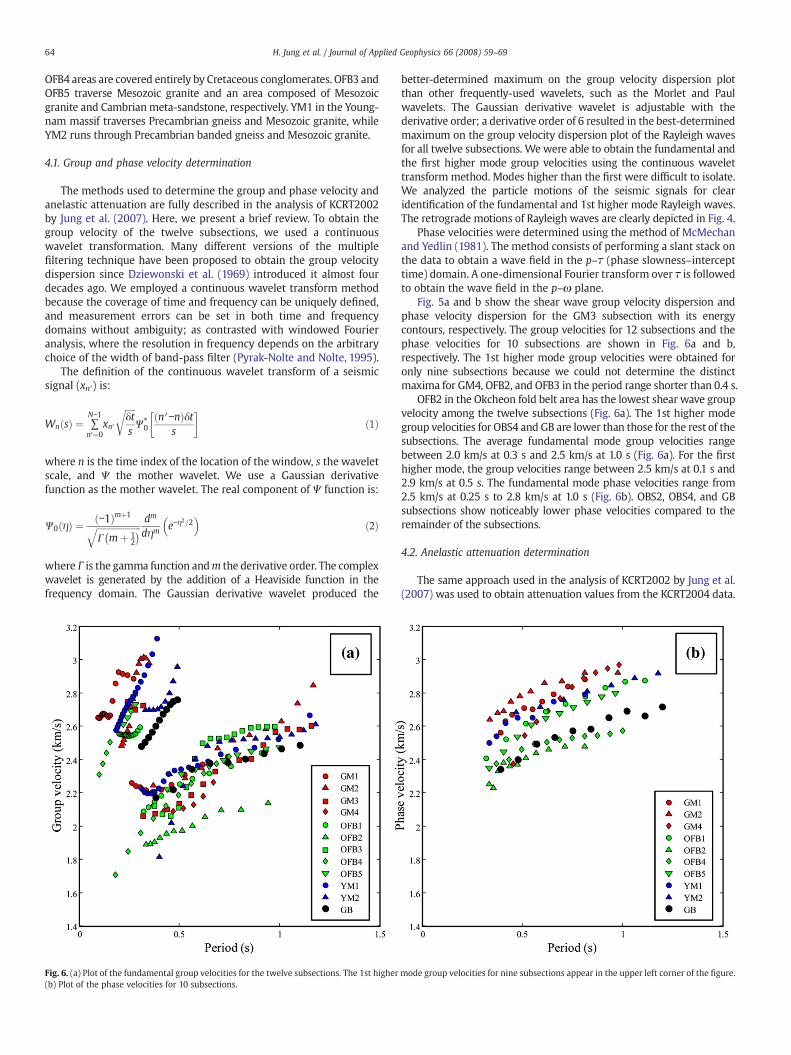
Fig. 6. (a) Plot of the fundamental group velocities for the twelve subsections. The 1st higher(b) Plot of the phase velocities for 10 subsections.
better-determined maximum on the group velocity dispersion plotthan other frequently-used wavelets, such as the Morlet and Paulwavelets. The Gaussian derivative wavelet is adjustable with thederivative order; a derivative order of 6 resulted in the best-determinedmaximum on the group velocity dispersion plot of the Rayleigh wavesfor all twelve subsections. We were able to obtain the fundamental andthe first higher mode group velocities using the continuous wavelettransform method. Modes higher than the first were difficult to isolate.We analyzed the particle motions of the seismic signals for clearidentification of the fundamental and 1st higher mode Rayleigh waves.The retrograde motions of Rayleigh waves are clearly depicted in Fig. 4.
Phase velocities were determined using the method of McMechanand Yedlin (1981). The method consists of performing a slant stack onthe data to obtain a wave field in the p–τ (phase slowness–intercepttime) domain. A one-dimensional Fourier transform over τ is followedto obtain the wave field in the p–ω plane.
Fig. 5a and b show the shear wave group velocity dispersion andphase velocity dispersion for the GM3 subsection with its energycontours, respectively. The group velocities for 12 subsections and thephase velocities for 10 subsections are shown in Fig. 6a and b,respectively. The 1st higher mode group velocities were obtained foronly nine subsections because we could not determine the distinctmaxima for GM4, OFB2, and OFB3 in the period range shorter than 0.4 s.
OFB2 in the Okcheon fold belt area has the lowest shear wave groupvelocity among the twelve subsections (Fig. 6a). The 1st higher modegroup velocities for OBS4 and GB are lower than those for the rest of thesubsections. The average fundamental mode group velocities rangebetween 2.0 km/s at 0.3 s and 2.5 km/s at 1.0 s (Fig. 6a). For the firsthigher mode, the group velocities range between 2.5 km/s at 0.1 s and2.9 km/s at 0.5 s. The fundamental mode phase velocities range from2.5 km/s at 0.25 s to 2.8 km/s at 1.0 s (Fig. 6b). OBS2, OBS4, and GBsubsections show noticeably lower phase velocities compared to theremainder of the subsections.
4.2. Anelastic attenuation determination
The same approach used in the analysis of KCRT2002 by Jung et al.(2007) was used to obtain attenuation values from the KCRT2004 data.
mode group velocities for nine subsections appear in the upper left corner of the figure.
65H. Jung et al. / Journal of Applied Geophysics 66 (2008) 59–69
Due to factors such as local site effects, lateral inhomogeneity, andscattering, it is difficult to measure the decay of surface wave amplitudewithdistance in the uppermost crust. To obtain ameaningful estimate ofamplitude decay, it is necessary to have accurate amplitude data atclosely spaced stations over a considerable distance range. Of the twelvesubsections used for the shearwave velocity analysis,we examined onlysix subsections (GM2, GM3, and GM4 in the Gyeonggi massif, YM1 andYM2 in the Yeongnammassif, and OFB1 in theOkcheon fold belt) for theattenuation structure because of the short distance and/or the lowsignal-to-noise ratio of theother 6 subsections. All signalswere analyzedfor each center filter frequency in the frequency range of 1 to 5 Hz usingthe Gaussian derivative mother wavelet. Spectral amplitudes were thendetermined at each center filter frequency andmultiplied by the squarerootof thedistance to correct for geometrical spreading. Thedecayof thecorrected amplitude spectrum with distance was used to estimate theanelastic attenuation coefficient of Rayleigh waves, γR, in the frequencyrange of 1 to 5 Hz, using a linear regression analysis:
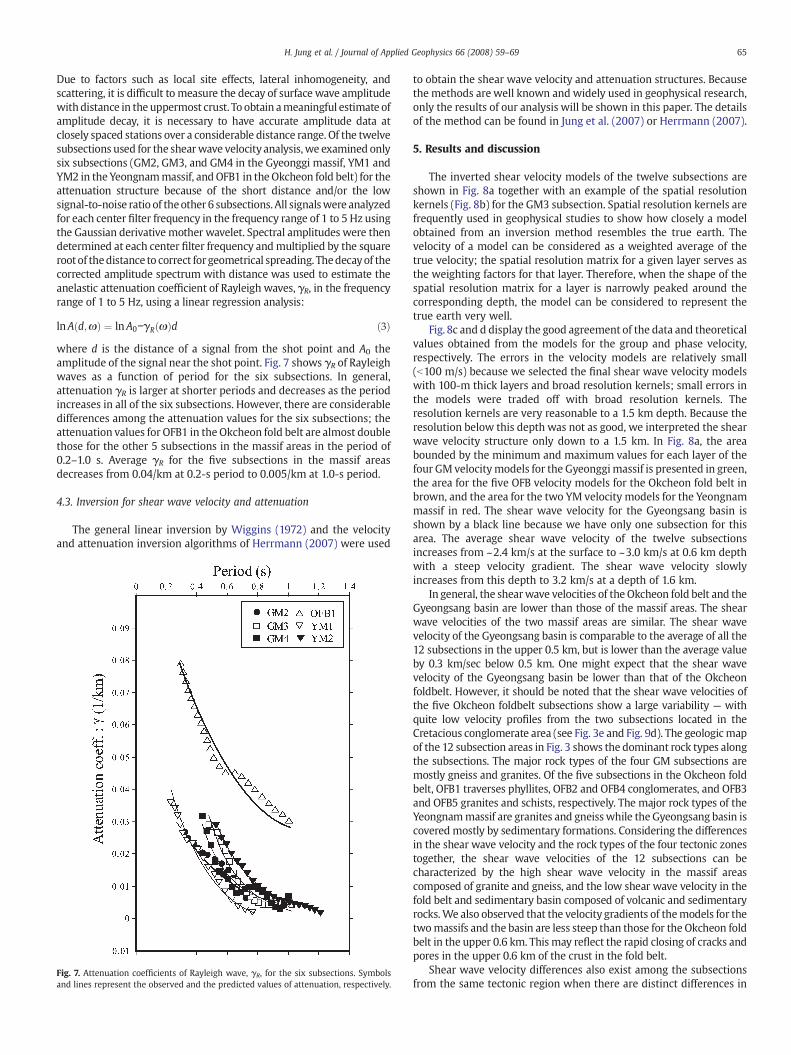
lnA d;ωð Þ ¼ lnA0−γR ωð Þd ð3Þwhere d is the distance of a signal from the shot point and A0 theamplitude of the signal near the shot point. Fig. 7 shows γR of Rayleighwaves as a function of period for the six subsections. In general,attenuation γR is larger at shorter periods and decreases as the periodincreases in all of the six subsections. However, there are considerabledifferences among the attenuation values for the six subsections; theattenuation values for OFB1 in the Okcheon fold belt are almost doublethose for the other 5 subsections in the massif areas in the period of0.2–1.0 s. Average γR for the five subsections in the massif areasdecreases from 0.04/km at 0.2-s period to 0.005/km at 1.0-s period.
4.3. Inversion for shear wave velocity and attenuation
The general linear inversion by Wiggins (1972) and the velocityand attenuation inversion algorithms of Herrmann (2007) were used
Fig. 7. Attenuation coefficients of Rayleigh wave, γR, for the six subsections. Symbolsand lines represent the observed and the predicted values of attenuation, respectively.
to obtain the shear wave velocity and attenuation structures. Becausethe methods are well known and widely used in geophysical research,only the results of our analysis will be shown in this paper. The detailsof the method can be found in Jung et al. (2007) or Herrmann (2007).
5. Results and discussion
The inverted shear velocity models of the twelve subsections areshown in Fig. 8a together with an example of the spatial resolutionkernels (Fig. 8b) for the GM3 subsection. Spatial resolution kernels arefrequently used in geophysical studies to show how closely a modelobtained from an inversion method resembles the true earth. Thevelocity of a model can be considered as a weighted average of thetrue velocity; the spatial resolution matrix for a given layer serves asthe weighting factors for that layer. Therefore, when the shape of thespatial resolution matrix for a layer is narrowly peaked around thecorresponding depth, the model can be considered to represent thetrue earth very well.
Fig. 8c and d display the good agreement of the data and theoreticalvalues obtained from the models for the group and phase velocity,respectively. The errors in the velocity models are relatively small(b100 m/s) because we selected the final shear wave velocity modelswith 100-m thick layers and broad resolution kernels; small errors inthe models were traded off with broad resolution kernels. Theresolution kernels are very reasonable to a 1.5 km depth. Because theresolution below this depth was not as good, we interpreted the shearwave velocity structure only down to a 1.5 km. In Fig. 8a, the areabounded by the minimum and maximum values for each layer of thefour GM velocitymodels for the Gyeonggimassif is presented in green,the area for the five OFB velocity models for the Okcheon fold belt inbrown, and the area for the two YM velocity models for the Yeongnammassif in red. The shear wave velocity for the Gyeongsang basin isshown by a black line because we have only one subsection for thisarea. The average shear wave velocity of the twelve subsectionsincreases from ~2.4 km/s at the surface to ~3.0 km/s at 0.6 km depthwith a steep velocity gradient. The shear wave velocity slowlyincreases from this depth to 3.2 km/s at a depth of 1.6 km.
In general, the shearwave velocities of the Okcheon fold belt and theGyeongsang basin are lower than those of the massif areas. The shearwave velocities of the two massif areas are similar. The shear wavevelocity of the Gyeongsang basin is comparable to the average of all the12 subsections in the upper 0.5 km, but is lower than the average valueby 0.3 km/sec below 0.5 km. One might expect that the shear wavevelocity of the Gyeongsang basin be lower than that of the Okcheonfoldbelt. However, it should be noted that the shear wave velocities ofthe five Okcheon foldbelt subsections show a large variability — withquite low velocity profiles from the two subsections located in theCretacious conglomerate area (see Fig. 3e and Fig. 9d). The geologicmapof the 12 subsection areas in Fig. 3 shows the dominant rock types alongthe subsections. The major rock types of the four GM subsections aremostly gneiss and granites. Of the five subsections in the Okcheon foldbelt, OFB1 traverses phyllites, OFB2 and OFB4 conglomerates, and OFB3and OFB5 granites and schists, respectively. The major rock types of theYeongnammassif are granites and gneisswhile the Gyeongsang basin iscovered mostly by sedimentary formations. Considering the differencesin the shear wave velocity and the rock types of the four tectonic zonestogether, the shear wave velocities of the 12 subsections can becharacterized by the high shear wave velocity in the massif areascomposed of granite and gneiss, and the low shear wave velocity in thefold belt and sedimentary basin composed of volcanic and sedimentaryrocks.We also observed that the velocity gradients of themodels for thetwomassifs and the basin are less steep than those for the Okcheon foldbelt in the upper 0.6 km. This may reflect the rapid closing of cracks andpores in the upper 0.6 km of the crust in the fold belt.
Shear wave velocity differences also exist among the subsectionsfrom the same tectonic region when there are distinct differences in
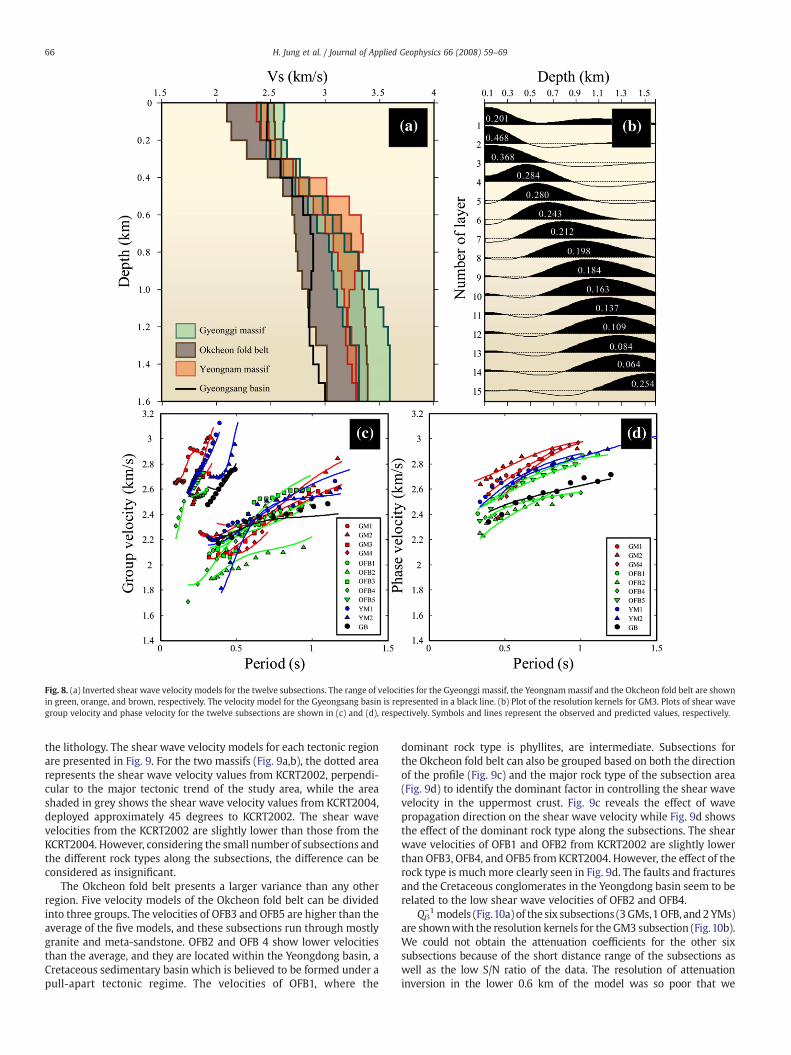
Fig. 8. (a) Inverted shear wave velocity models for the twelve subsections. The range of velocities for the Gyeonggi massif, the Yeongnammassif and the Okcheon fold belt are shownin green, orange, and brown, respectively. The velocity model for the Gyeongsang basin is represented in a black line. (b) Plot of the resolution kernels for GM3. Plots of shear wavegroup velocity and phase velocity for the twelve subsections are shown in (c) and (d), respectively. Symbols and lines represent the observed and predicted values, respectively.
66 H. Jung et al. / Journal of Applied Geophysics 66 (2008) 59–69
the lithology. The shear wave velocity models for each tectonic regionare presented in Fig. 9. For the two massifs (Fig. 9a,b), the dotted arearepresents the shear wave velocity values from KCRT2002, perpendi-cular to the major tectonic trend of the study area, while the areashaded in grey shows the shear wave velocity values from KCRT2004,deployed approximately 45 degrees to KCRT2002. The shear wavevelocities from the KCRT2002 are slightly lower than those from theKCRT2004. However, considering the small number of subsections andthe different rock types along the subsections, the difference can beconsidered as insignificant.
The Okcheon fold belt presents a larger variance than any otherregion. Five velocity models of the Okcheon fold belt can be dividedinto three groups. The velocities of OFB3 and OFB5 are higher than theaverage of the five models, and these subsections run through mostlygranite and meta-sandstone. OFB2 and OFB 4 show lower velocitiesthan the average, and they are located within the Yeongdong basin, aCretaceous sedimentary basin which is believed to be formed under apull-apart tectonic regime. The velocities of OFB1, where the
dominant rock type is phyllites, are intermediate. Subsections forthe Okcheon fold belt can also be grouped based on both the directionof the profile (Fig. 9c) and the major rock type of the subsection area(Fig. 9d) to identify the dominant factor in controlling the shear wavevelocity in the uppermost crust. Fig. 9c reveals the effect of wavepropagation direction on the shear wave velocity while Fig. 9d showsthe effect of the dominant rock type along the subsections. The shearwave velocities of OFB1 and OFB2 from KCRT2002 are slightly lowerthan OFB3, OFB4, and OFB5 from KCRT2004. However, the effect of therock type is muchmore clearly seen in Fig. 9d. The faults and fracturesand the Cretaceous conglomerates in the Yeongdong basin seem to berelated to the low shear wave velocities of OFB2 and OFB4.
Qβ−1 models (Fig.10a) of the six subsections (3GMs,1OFB, and2YMs)
are shownwith the resolution kernels for the GM3 subsection (Fig.10b).We could not obtain the attenuation coefficients for the other sixsubsections because of the short distance range of the subsections aswell as the low S/N ratio of the data. The resolution of attenuationinversion in the lower 0.6 km of the model was so poor that we
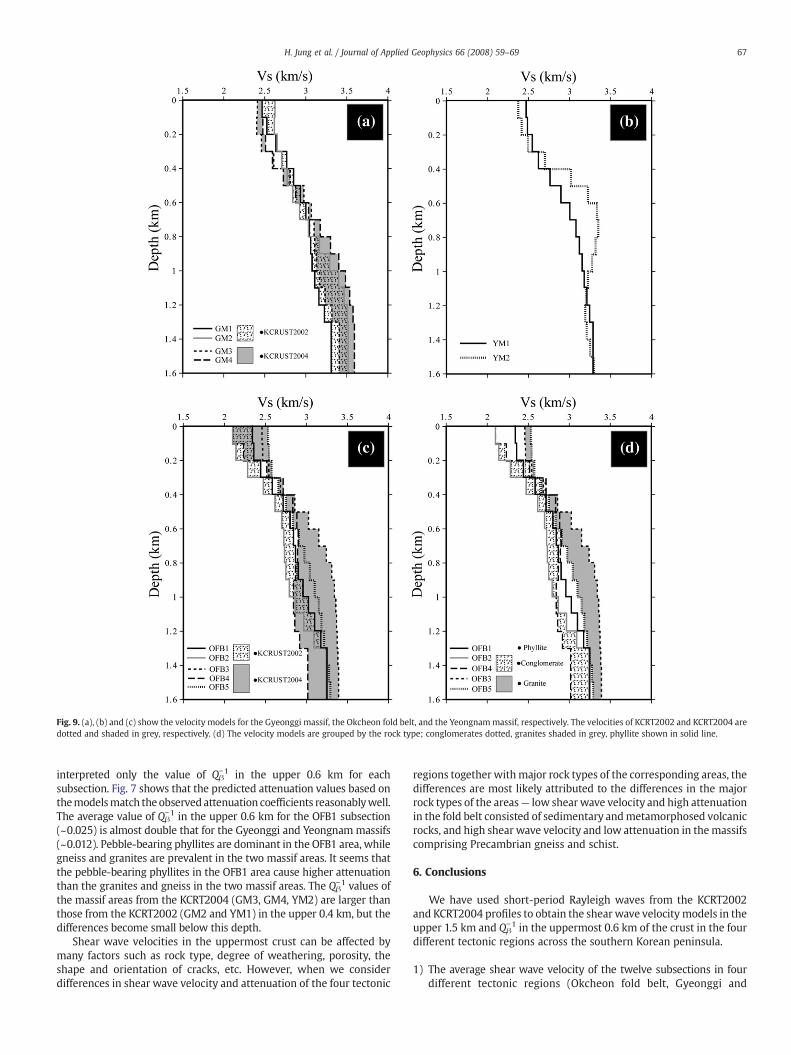
Fig. 9. (a), (b) and (c) show the velocity models for the Gyeonggi massif, the Okcheon fold belt, and the Yeongnammassif, respectively. The velocities of KCRT2002 and KCRT2004 aredotted and shaded in grey, respectively. (d) The velocity models are grouped by the rock type; conglomerates dotted, granites shaded in grey, phyllite shown in solid line.
67H. Jung et al. / Journal of Applied Geophysics 66 (2008) 59–69
interpreted only the value of Qβ−1 in the upper 0.6 km for each
subsection. Fig. 7 shows that the predicted attenuation values based onthemodelsmatch the observedattenuation coefficients reasonablywell.The average value of Qβ
−1 in the upper 0.6 km for the OFB1 subsection(~0.025) is almost double that for the Gyeonggi and Yeongnammassifs(~0.012). Pebble-bearing phyllites are dominant in the OFB1 area, whilegneiss and granites are prevalent in the two massif areas. It seems thatthe pebble-bearing phyllites in the OFB1 area cause higher attenuationthan the granites and gneiss in the two massif areas. The Qβ
−1 values ofthe massif areas from the KCRT2004 (GM3, GM4, YM2) are larger thanthose from the KCRT2002 (GM2 and YM1) in the upper 0.4 km, but thedifferences become small below this depth.
Shear wave velocities in the uppermost crust can be affected bymany factors such as rock type, degree of weathering, porosity, theshape and orientation of cracks, etc. However, when we considerdifferences in shear wave velocity and attenuation of the four tectonic
regions together withmajor rock types of the corresponding areas, thedifferences are most likely attributed to the differences in the majorrock types of the areas— low shearwave velocity and high attenuationin the fold belt consisted of sedimentary andmetamorphosed volcanicrocks, and high shear wave velocity and low attenuation in themassifscomprising Precambrian gneiss and schist.
6. Conclusions
We have used short-period Rayleigh waves from the KCRT2002and KCRT2004 profiles to obtain the shear wave velocity models in theupper 1.5 km and Qβ
−1 in the uppermost 0.6 km of the crust in the fourdifferent tectonic regions across the southern Korean peninsula.
1) The average shear wave velocity of the twelve subsections in fourdifferent tectonic regions (Okcheon fold belt, Gyeonggi and
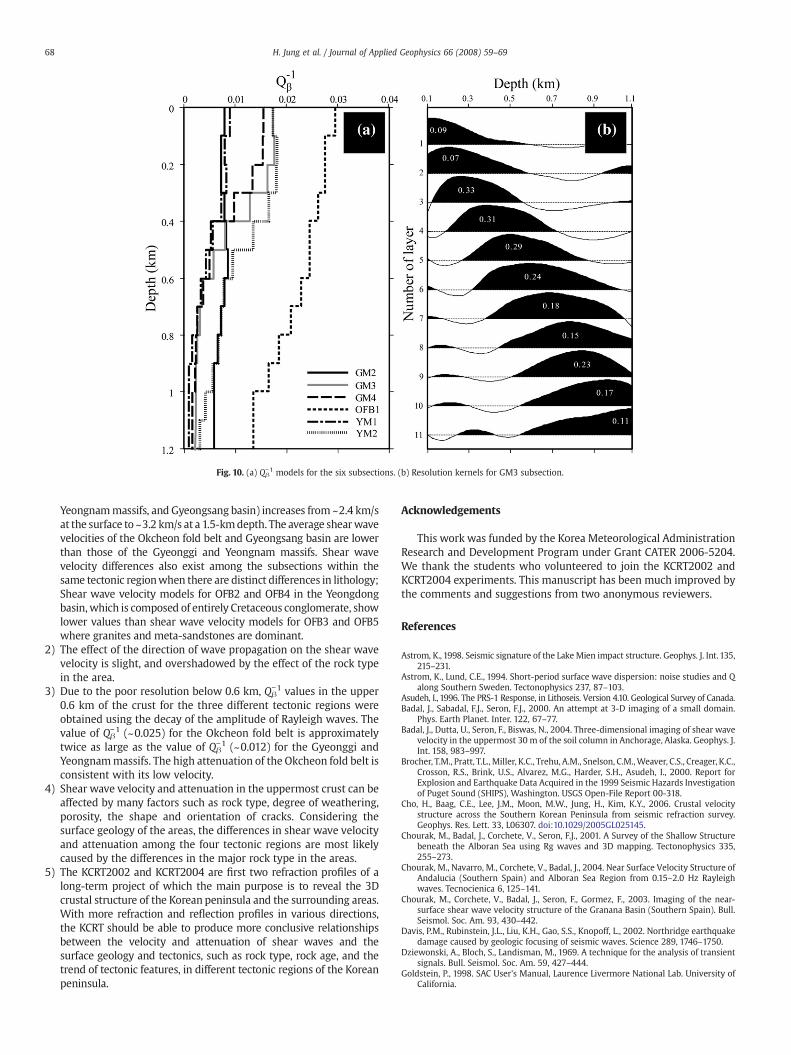
Fig. 10. (a) Qβ−1 models for the six subsections. (b) Resolution kernels for GM3 subsection.
68 H. Jung et al. / Journal of Applied Geophysics 66 (2008) 59–69
Yeongnammassifs, and Gyeongsang basin) increases from ~2.4 km/sat the surface to ~3.2 km/s at a 1.5-kmdepth. The average shearwavevelocities of the Okcheon fold belt and Gyeongsang basin are lowerthan those of the Gyeonggi and Yeongnam massifs. Shear wavevelocity differences also exist among the subsections within thesame tectonic regionwhen there are distinct differences in lithology;Shear wave velocity models for OFB2 and OFB4 in the Yeongdongbasin, which is composed of entirely Cretaceous conglomerate, showlower values than shear wave velocity models for OFB3 and OFB5where granites and meta-sandstones are dominant.
2) The effect of the direction of wave propagation on the shear wavevelocity is slight, and overshadowed by the effect of the rock typein the area.
3) Due to the poor resolution below 0.6 km, Qβ−1 values in the upper
0.6 km of the crust for the three different tectonic regions wereobtained using the decay of the amplitude of Rayleigh waves. Thevalue of Qβ
−1 (~0.025) for the Okcheon fold belt is approximatelytwice as large as the value of Qβ
−1 (~0.012) for the Gyeonggi andYeongnammassifs. The high attenuation of the Okcheon fold belt isconsistent with its low velocity.
4) Shear wave velocity and attenuation in the uppermost crust can beaffected by many factors such as rock type, degree of weathering,porosity, the shape and orientation of cracks. Considering thesurface geology of the areas, the differences in shear wave velocityand attenuation among the four tectonic regions are most likelycaused by the differences in the major rock type in the areas.
5) The KCRT2002 and KCRT2004 are first two refraction profiles of along-term project of which the main purpose is to reveal the 3Dcrustal structure of the Korean peninsula and the surrounding areas.With more refraction and reflection profiles in various directions,the KCRT should be able to produce more conclusive relationshipsbetween the velocity and attenuation of shear waves and thesurface geology and tectonics, such as rock type, rock age, and thetrend of tectonic features, in different tectonic regions of the Koreanpeninsula.
Acknowledgements
This work was funded by the Korea Meteorological AdministrationResearch and Development Program under Grant CATER 2006-5204.We thank the students who volunteered to join the KCRT2002 andKCRT2004 experiments. This manuscript has been much improved bythe comments and suggestions from two anonymous reviewers.
References
Astrom, K., 1998. Seismic signature of the LakeMien impact structure. Geophys. J. Int. 135,215–231.
Astrom, K., Lund, C.E., 1994. Short-period surface wave dispersion: noise studies and Qalong Southern Sweden. Tectonophysics 237, 87–103.
Asudeh, I., 1996. The PRS-1 Response, in Lithoseis. Version 4.10. Geological Survey of Canada.Badal, J., Sabadal, F.J., Seron, F.J., 2000. An attempt at 3-D imaging of a small domain.
Phys. Earth Planet. Inter. 122, 67–77.Badal, J., Dutta, U., Seron, F., Biswas, N., 2004. Three-dimensional imaging of shear wave
velocity in the uppermost 30 m of the soil column in Anchorage, Alaska. Geophys. J.Int. 158, 983–997.
Brocher, T.M., Pratt, T.L., Miller, K.C., Trehu, A.M., Snelson, C.M.,Weaver, C.S., Creager, K.C.,Crosson, R.S., Brink, U.S., Alvarez, M.G., Harder, S.H., Asudeh, I., 2000. Report forExplosion and Earthquake Data Acquired in the 1999 Seismic Hazards Investigationof Puget Sound (SHIPS), Washington. USGS Open-File Report 00-318.
Cho, H., Baag, C.E., Lee, J.M., Moon, M.W., Jung, H., Kim, K.Y., 2006. Crustal velocitystructure across the Southern Korean Peninsula from seismic refraction survey.Geophys. Res. Lett. 33, L06307. doi:10.1029/2005GL025145.
Chourak, M., Badal, J., Corchete, V., Seron, F.J., 2001. A Survey of the Shallow Structurebeneath the Alboran Sea using Rg waves and 3D mapping. Tectonophysics 335,255–273.
Chourak, M., Navarro, M., Corchete, V., Badal, J., 2004. Near Surface Velocity Structure ofAndalucia (Southern Spain) and Alboran Sea Region from 0.15–2.0 Hz Rayleighwaves. Tecnocienica 6, 125–141.
Chourak, M., Corchete, V., Badal, J., Seron, F., Gormez, F., 2003. Imaging of the near-surface shear wave velocity structure of the Granana Basin (Southern Spain). Bull.Seismol. Soc. Am. 93, 430–442.
Davis, P.M., Rubinstein, J.L., Liu, K.H., Gao, S.S., Knopoff, L., 2002. Northridge earthquakedamage caused by geologic focusing of seismic waves. Science 289, 1746–1750.
Dziewonski, A., Bloch, S., Landisman, M., 1969. A technique for the analysis of transientsignals. Bull. Seismol. Soc. Am. 59, 427–444.
Goldstein, P., 1998. SAC User’s Manual, Laurence Livermore National Lab. University ofCalifornia.
69H. Jung et al. / Journal of Applied Geophysics 66 (2008) 59–69
Hwang, J., Kim, D., Cho, D., Song, K., 1996. Geological Report of Andong Sheet(1:250000). Korea Institute of Geology, Mining and Materials, Daejeon, Korea.
Herrmann, R.B., 2007. Computer Programs in Seismology. Saint Louis University, SaintLouis, USA.
Jung, H., Jang, Y., Lee, J.M., Moon, W.M., Baag, C.E., Kim, K.Y., Jo, B.G., 2007. Shear wavevelocity and attenuation structure for the shallow crust of the Southern KoreanPeninsula from short-period Rayleigh waves. Tectonophysics 429, 253–265.
Kafka, A.L., Reiter, E.C., 1987. Dispersion of Rg waves in Southeastern Maine: evidencefor lateral anisotropy in the shallow crust. Bull. Seismol. Soc. Am. 77, 925–941.
Kang, I.B., Park, J.H., 2003. Application of 3-D Tomographic Inversion to Korea forImproving Event Location in Far-east Asia: Presented at the 2nd InternationalSeminar on Seismic Tomography of Far-east Asia and Related Works, held inDeajeon, Korea. December 2, 2003.
Kim, D., Hwang, J., Park, K., Song, K., 1998. Geological Report of Pusan Sheet (1:250000).Korea Institute of Geology, Mining and Materials, Daejeon, Korea.
Kim, K.Y., Lee, J.M., Moon, W.M., Park, C.E., Jung, H., 2007. Crustal structure of theSouthern Korean Peninsula from seismic waves generated by large explosions in2002 and 2004. Pure Appl. Geophys. 164, 97–113.
Kim, S.K., 1995. A study on the crustal structure of the Korean Peninsula. J. Geol. Soc.Korea 31, 393–403.
Kim, S.K., Park, Y.K., Jun, M.S., 2000. Quality factor structure of the southeastern part ofthe Korean Peninsula. J. Geol. Soc. Korea 36, 529–544.
Kocaoglu, A., Long, L.T., 1993. Tomographic inversion of Rg wave group velocities forregional near-surface velocity structure. J. Geophys. Res. 98, 6579–6587.
Lee, B., Kim, D., Cho, D., Song, G., 1996a. Geological Report of Kwangju Sheet (1:250000).Korea Institute of Geology, Mining and Materials, Daejeon, Korea.
Lee, B., Kim, D., Choi, H., Ki, W., Park, K., 1996b. Geological Report of Daejeon Sheet(1:250000). Korea Institute of Geology, Mining and Materials, Daejeon, Korea.
Lee, B., Kim, Y., Lee, S., Kim, J., Kang, P., Choi, H., Jin, M., 1999. Geological Report of Seoul–Namcheon Sheet (1:250000). Korea Institute of Geology, Mining and Materials,Daejeon, Korea.
Lee, K., 1979. On the crustal structure of the Korean Peninsula. J. Geol. Soc. Korea 15,253–258.
Malagnini, L., Herrmann, R.B., Biella, G., Franco, R., 1995. Rayleigh waves in Quaternaryalluvium from explosive sources: determination of shear wave velocity and Qstructure. Bull. Seismol. Soc. Am. 85, 900–922.
McMechan, G.A., Yedlin, M.J., 1981. Analysis of dispersive waves by wave fieldtransformation. Geophysics 46, 869–874.
Mokhtar, T.A., Herrmann, R.B., Russel, D.R., 1988. Seismic velocity and Q model for theshallow structure of the Arabian Shield from short-period Rayleigh waves.Geophysics 53, 1379–1387.
Park, J.C., Ham, I.K., Kim, W., Choi, K.S., 2003. A study on the crustal thickness of theSouthern Korean Peninsula using travel times of PmP phase. J. Geol. Soc. Korea 39,225–234.
Pyrak-Nolte, L.J., Nolte, D.D., 1995. Wavelet analysis of velocity dispersion of elasticinterface waves propagating along a fracture. Geophys. Res. Lett. 22, 1329–1332.
Saikia, C.K., Kafka, A.L., Gnewuch, S.C., Mctigue, J.W., 1990. Shear velocity and intrinsic Qstructure of the shallow crust in Southeastern New England from Rg wavedispersion. J. Geophys. Res. 95, 8527–8541.
Sarrate, J., Canas, J.A., Pujades, L., Badal, J., Corchete, V., Payo, G., 1993. Shallow structureof part of Northern Iberia from short-period Rayleigh wave observations.Tectonophysics 221, 95–105.
Seron, F.J., Sabadal, F.J., Badal, J., Martin, J.M., 1999. Modeling techniques for volumetricreconstruction of earth structures. Phys. Chem. Earth (a) 24, 261–268.
Teves-Costa, P., Matias, L., Oliveira, C.S., Mendez-Victor, L.A., 1996. Shallow crustalmodels in the Lisbon area from explosion data using body and surface waveanalysis. Tectonophysics 258, 171–193.
Wiggins, R.A.,1972. The general inverse problems: implication of surface waves and freeoscillation for earth structure. Rev. Geophys. Space Phys. 10, 251–285.
Copyright © 2022 FDOKUMEN