shading and air flow analysis on - Near East University Docs
73
SHADING AND AIR FLOW ANALYSIS ON SELECTED RESIDENTIAL BUILDINGS IN AL - BAYDA CITY, LIBYA A THESIS SUBMITTED TO THE GRADUATE SCHOOL OF APPLIED SCIENCES OF NEAR EAST UNIVERSITY By MOHAMMED ALI SALEH ALI In Partial Fulfillment of the Requirements for the Degree of Master of Science in Architecture NICOSIA, 2019 MOHAMMED ALI SALEH SHADING AND AIR FLOW ANALYSIS ON SELECTED NEU ALI RESIDENTIAL BUILDINGS IN AL - BAYDA CITY, LIBYA 2019
-
Upload
khangminh22 -
Category
Documents
-
view
1 -
download
0
Transcript of shading and air flow analysis on - Near East University Docs

SHADING AND AIR FLOW ANALYSIS ON
SELECTED RESIDENTIAL BUILDINGS IN
AL - BAYDA CITY, LIBYA
A THESIS SUBMITTED TO THE GRADUATE
SCHOOL OF APPLIED SCIENCES
OF
NEAR EAST UNIVERSITY
By
MOHAMMED ALI SALEH ALI
In Partial Fulfillment of the Requirements for
the Degree of Master of Science
in
Architecture
NICOSIA, 2019
MO
HA
MM
ED
AL
I SA
LE
H S
HA
DIN
G A
ND
AIR
FL
OW
AN
AL
YS
IS O
N S
EL
EC
TE
D N
EU
AL
I R
ES
IDE
NT
IAL
BU
ILD
ING
S IN
AL
- BA
YD
A C
ITY
, LIB
YA
2019
SHADING AND AIR FLOW ANALYSIS ON
SELECTED RESIDENTIAL BUILDINGS IN
AL - BAYDA CITY, LIBYA
A THESIS SUBMITTED TO THE GRADUATE
SCHOOL OF APPLIED SCIENCES
OF
NEAR EAST UNIVERSITY
By
MOHAMMED ALI SALEH ALI
In Partial Fulfillment of the Requirements for
the Degree of Master of Science
in
Architecture
NICOSIA, 2019

i
I hereby declare that all information in this document has been obtained and presented in
accordance with academic rules and ethical conduct. I also declare that as required by these
rules and conduct. I have fully cited and referenced all material and results that are not
original to this work.
Name, Last name:
Signature:
Date:

ii
ACKNOWLEDGMENTS
I would like to express my sincere gratitude to my supervisors, Assist. Prof. Dr. Kozan
Uzunoglo, Dr. Cimen.Ozburak, from whom I learned so much, and for their constant
efforts which led to the success of this work.
Finally, I wish to thank my parents and family for loving me, and for supporting me every
step in my life.

iii
To my parents…

iv
ABSTRACT
An enormous quantity of residential properties were recently constructed in Libya offers a
poor quality interior. A lot of energy is required to provide a comfortable interior with air
conditioning systems. Furthermore, the use of high energy in buildings has made an
important contribution to climate change and air pollution. It is crucial for energy
efficiency to reduce energy consumption. Thermal comfort in residential buildings can be
provided by applying the architectural principles of climatic design.
In order to reduce the energy consumption, some domestic buildings in Al Bayda Libya are
studied. The study provides detailed survey of these buildings. The building plans are
analyzed according to their shading and air movement opportunities
In this research, an analytical study was conducted on the climate factors that affect the
energy consumption in the residential buildings in the city of Al-Bayda Libya. Nine
buildings were randomly selected. The impact of solar energy, orientation and wind factors
that affect the climatic comfort on the selected residential buildings are considered as the
main indicators for improving energy consumption. These topics are studied
comprehensively on the selected samples and outcomes of the analysis are evaluated. At
the end, simple constructional applications which can prevent high energy use are
recommended for future architectural designs. By this way, extensive use of air
conditioners and thus air pollution which has become one of the major problems in the
cities of Libya can be reduced to a certain extend.
Keywords: Air conditioners; energy consumption; orientation; climate design; shadow
analysis

v
ÖZET
Libya'da yakın zamanda inşa edilen çok sayıda konut tipi binada, konforsuz bir iç ortam
sunulmakta ve bununla beraber iklimlendirme için de çok miktarda enerji gerektiren
klimalar kullanılmaktadır. Doğal olarak, binalarda kullanılan yoğun enerji hem hava
kirliliğine hem de iklim değişikliğine yol açmaktadır. Bu çalışmada, iklim faktörlerini
dikkate alarak yapılan mimari tasarımların önemine ve buna bağlı olarak, enerji
tüketiminin azaltılmasıyla, konut binalarında ısıl konfor sağlanabileceğinin önemine vurgu
yapılmıştır.
Tezde, Libya'daki konutlarda enerji tüketiminin azaltılması amacıyla incelemeler
yapılmıştır. Alan çalışması olarak, Al Bayda Libya kentinde bir dizi bina seçilerek,
oluşturulan kriterler çerçevesinde analiz ve değerlendirmeler yapılmıştır.
Çalışma kapsamında, Al-Bayda, Libya kentinde dokuz adet tek katlı bina rastgele kent
dokusu içerisinden seçilmiştir. Bu binalar, doğal konfor ortamının oluşmasında önemli rol
oynayan, güneş enerjisi, yönlenme, ve iç – dış hava akımlarının etkenleri esasında
incelenmiştir. İnceleme sonunda enerji korunumunu sağlayacak basit ve çevreye uygun
mimari çözümlemelere dayalı öneriler yapılmıştır. Böylelikle, Al-Bayda kenti özelinde ve
Libya genelinde klimalar dolayısıyla yoğun enerji tüketimi sorununa ve dolaylı olarak hava
kirliliğine belirli oranda çözüm getirilmesi hedeflenmiştir.
Anahtar Kelimeler: Klimalar; enerji tüketimi; yönlenme; iklim tasarımı; gölge analizi

vi
TABLE OF CONTENTS
ACKNOWLEDGMENTS ................................................................................................... ii
ABSTRACT.........................................................................................................................iv
ÖZET.....................................................................................................................................v
LIST OF TABLES ............................................................................................................ viii
LIST OF FIGURES ............................................................................................................ ix
CHAPTER 1:INTRODUCTION
1.1 Background About Research ........................................................................................... 1
1.2 Statement of the Problem ................................................................................................ 2
1.3 Aim of the Thesis ............................................................................................................ 2
1.4 Methodology .................................................................................................................... 2
CHAPTER 2: THEORETICAL FRAMEWORK
2.1 Passive Design Strategies in General .............................................................................. 6
2.1.1 Orientation ............................................................................................................... 7
2.1.2 Solar shading .......................................................................................................... 10
2.1.2.1 Shading by overhangs .................................................................................... 10
2.1.1.2 Shading of the roof ......................................................................................... 12
2.1.1.3 Shading by trees and vegetation ..................................................................... 13
2.1.3 Building form ......................................................................................................... 14
2.2. Climatic Elements ........................................................................................................ 16
2.2.1 Solar radiation ........................................................................................................ 16
2.2.1.1 Sun path and shading devices ........................................................................ 18
2.2.1.2 Types of shading devices ............................................................................... 19
2.2.1.3 Shadow angles ................................................................................................ 20
2.2.2 Temperature ........................................................................................................... 21

vii
2.2.3 Winds ..................................................................................................................... 21
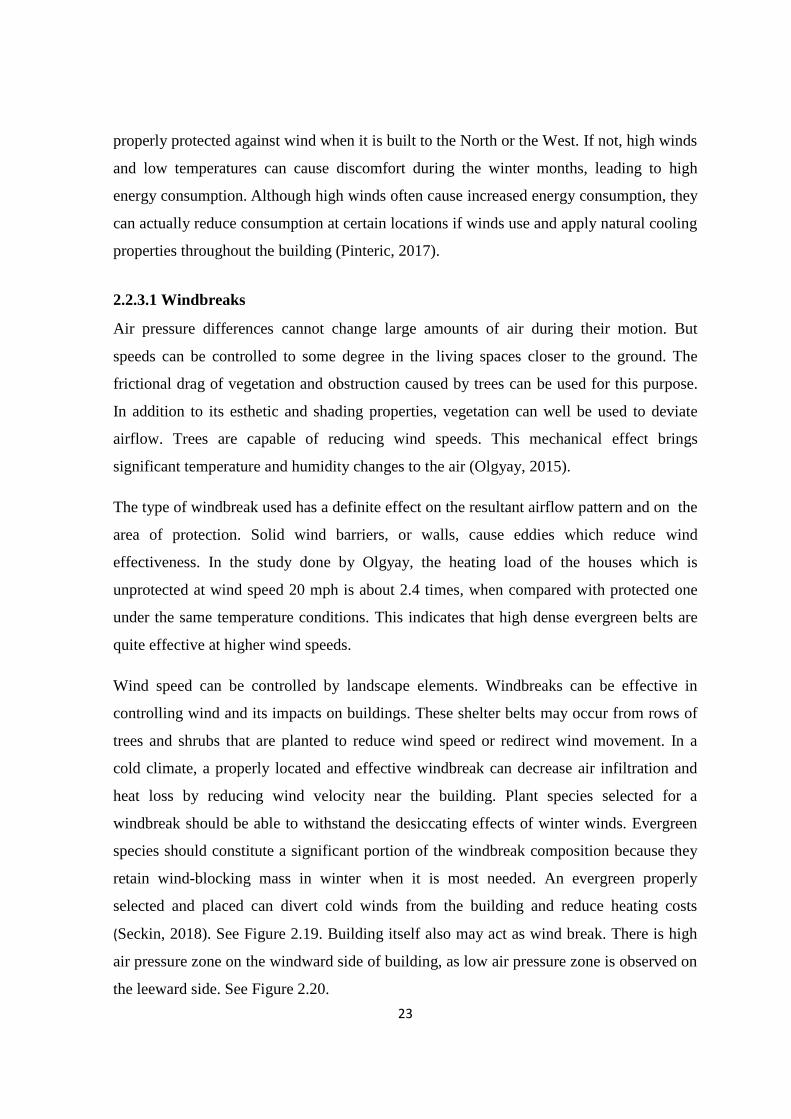
2.2.3.1 Windbreaks .................................................................................................... 23
2.2.3.2 Ventilation ...................................................................................................... 25
CHAPTER 3: THE AL BAYDA CITY IN LIBYA
3.1 Location Libya .............................................................................................................. 29
3.2. Location of the City of Al Bayda, Libya ...................................................................... 30
3.3 Climate of Al Bayda ...................................................................................................... 31
3.3.1 Temperature ........................................................................................................... 31
3.3.3 Winds .................................................................................................................... 32
CHAPTER 4:CASE STUDY: SHADING AND AIR FLOW ANALYSIS ON
SELECTED RESIDENTIAL BUILDINGS IN AL - BAYDA CITY
4.1 Survey Methods ............................................................................................................. 33
4.2 Survey Results ............................................................................................................... 35
4.3 Analysis of Research ..................................................................................................... 42
CHAPTER 5
CONCLUSION AND RECOMMENDATIONS ............................................................... 52
REFERENCES .................................................................................................................. 56

viii
LIST OF TABLES
Table 1.1: Framework for shading and air movement analysis.............................................3
Table 2. 1: The topics of the passive design strategies are presented by some
researchers...........................................................................................................5
Table 4.1: The age .............................................................................................................. 35
Table 4.2: Heat insulation on walls .................................................................................... 36
Table 4.3: Heat insulation on glazing ................................................................................. 36
Table 4.4: The construction system .................................................................................... 36
Table 4.5: Cooling devices ................................................................................................. 36
Table 4.6: Heating used ...................................................................................................... 37
Table 4.7: The pay to monthly for electricity ..................................................................... 37
Table 4.8: Estimate the energy consumption ...................................................................... 38
Table 4.9: Know that energy consumption is harmful to the environment ....................... 38
Table 4.10: The use natural ventilation in summer ............................................................ 38
Table 4.11: The use mechanical ventilation in summer ..................................................... 39
Table 4.12: The reaching time of solar radiation the bedrooms ........................................ 39
Table 4.13: The reaching time of solar radiation the living room ..................................... 39
Table 4.14: The shading devices available in the home ..................................................... 40
Table 4.15: Grade level of satisfaction in terms of ventilation in a home .......................... 40
Table 4.16: Grade level of satisfaction in terms of gaining the sun's energy in the home . 41
Table 4.17: The difference in the thermal comfort between rooms in the home................ 41
Table 4.18: Prevent buildings adjacent to the wind ............................................................ 41
Table 4.19: Case Study 1 .................................................................................................... 43
Table 4.20: Case Study 2 .................................................................................................... 44
Table 4.21: Case Study 3 .................................................................................................... 45
Table 4.22: Case Study 4 .................................................................................................... 46
Table 4.23: Case Study 5 .................................................................................................... 47
Table 4.24: Case Study 6 .................................................................................................... 48
Table 4.25: Case Study 7 .................................................................................................... 49
Table 4.26: Case Study 8 .................................................................................................... 50
Table 4.27: Case Study 9 .................................................................................................... 51

ix
LIST OF FIGURES
Figure 1.1: The plan shows the study's methodology .......................................................... 4
Figure 2.1: Effect of Passive Design on Energy Intensity ................................................... 6
Figure 2.2: Orientation and solar gain .................................................................................. 7
Figure 2.3: Types of daylighting .......................................................................................... 8
Figure 2.4: Orientation to the south ...................................................................................... 9
Figure 2.5: Overhangs function in summer and winter ...................................................... 11
Figure 2.6: Different types of shading devices ................................................................... 11
Figure 2.7: Roof shading by solid cover ............................................................................ 12
Figure 2.8: Roof shading by plant cover ............................................................................ 12
Figure 2.9: Deciduous trees which provide shade in summer and allow sun rays during
winter ................................................................................................................................... 14
Figure 2.10: Basic forms and shapes from Victor Olgyay in several regions .................... 15
Figure 2.11: Effect of the shape of the building on the amount of fallen shadows ............ 16
Figure 2.12: Lococentric view of the sky hemisphere, with sun-paths for the main dates
............................................................................................................................................. 17
Figure 2.13: Azimuth and Altitude ..................................................................................... 17
Figure 2.14: Shading devices in North, East, South and west direction of openings in
building in Lucknow .......................................................................................................... 18
Figure 2. 15: Internal shading devices (Improving the Thermal Performance of the
Building Envelope, 2016) .................................................................................................... 19
Figure 2.16: Horizontal and vertical shadow devices ........................................................ 20
Figure 2. 17: Vertical shadow devices and horizontal shading devices ............................. 20
Figure 2.18: Wind speed profiles: depth of the boundary layer ......................................... 22
Figure 2.19: wind control by trees ...................................................................................... 24
Figure 2.20: Wind-induced natural ventilation .................................................................. 24
Figure 2.21: Cross ventilation ............................................................................................ 26
Figure 2.22: Different amounts of ventilation and air mixing with different window
openings ............................................................................................................................... 27
Figure 2.23: The size effect, number, and location of the openings on airflow ................. 28

x
Figure 2. 24: Good distance between buildings for natural ventilation ............................. 28
Figure 3.1: Map showing Location of Libya ...................................................................... 29
Figure 3.2: Map showing location of the city of Al Bayda, Libya ..................................... 30
Figure 3.3: Average High and Low Temperature .............................................................. 31
Figure 3.4: Hourly temperature average ............................................................................. 32
Figure 3.5: Annual Wind performance ............................................................................... 32
Figure 4.1: Google map showing Location of case studies. ............................................... 34

1
CHAPTER 1
INTRODUCTION
1.1 Background About Research
In order to achieve the equation of energy-saving housing, have to reconcile with the
environment, which is one of the most important sources concern for the modern man and
the source of danger that threatens mankind in the continuing terrible increase, and so we
cannot Ignore them and the need to avoid collisions with them because they are the
strategic choice to preserve the future of humanity. In our approach to the environment and
its preservation of pollutants, do not only provide energy consumption, but create a healthy
climate free of pollution, both outside and inside the building because pollution inside the
house is more dangerous than external pollution. Human beings live in temporal intervals
inside buildings rather than outside and windows are closed most of the time. Frequent use
of air conditioning as a contributes to reduce the entry of the sun and air flow inside the
building, which contributes to the spread some diseases.
The return to nature and the environment balance and stability and the presence of long-
lived buildings that contribute to the preservation of the heritage and identity of the
architecture belonging to the place and reduce the cloned buildings of one model has not
changed for years, is the model that was adopted in the convenience and security and
beauty on the mechanization and that function has been depleted our economy and waste
our energy and return to laziness and help spread diseases.
This call for reconciliation with the environment does not mean that we return to the old
thought and adopt it as it is because it was found in a time other than our time and with a
simple technique and limited use materials, the scientific, technological and industrial
revolution contributes to the expansion of our horizons and provides us with the facilities
that enable us to take all that is good in the old thought and employ it in line with our time
in order to create an architecture with a temporal, local, authentic and rooted identity,
Historical.

2
1.2 Statement of the Problem
A large number of recently built residential buildings in Libya provide an environment of a
poor quality that requires a great deal of energy to provide a comfortable internal
environment. Unpredictable power consumption in Libya has led to the need for a pause to
correct the way energy is treated, which can lead to many problems. In addition, increase
in population correspondingly increases energy consumption. Therefore, energy is the
problem of the future, making it the top scientific and applied research in various parts of
the world.
So, the need arises to try to find out ways of creating a comfortable natural environment
with passive systems. As known, passive systems are a kind of architectural layout
focusing on energy efficiency, which aims to create a climatically comfortable
environment for people without the use of any mechanical and electrical system.
1.3 Aim of the Thesis
The aim of this thesis is to analyze single – storey houses in residential areas of Al-Bayda -
Libya, in terms of orientation, shadow areas, natural ventilation and site plan decisions
which are important criteria of passive system design and also, to put forward positive and
negative design decisions on selected examples.
Thus, within the framework of the analysis criteria discussed, it is aimed to make
suggestions for future architectural layouts, in order to increase energy efficiency.
1.4 Methodology
The study was carried out in three main phases. The theoretical framework for this study
was defined in the first stage. Furthermore, the analysis methodology and the issues
investigated in the case study were identified. The first phase included extensive book
reviews, journal papers, investigations and documents to identify the energy efficiency of
the principles of a residential building to be utilized.
The second phase includes a field consists of the field visit and is working on an interview
and examination of nine buildings. A case study of the building collects quantitative and

3
qualitative data. During this phase, all information will be analyzed to meet the
architecture described in the conceptual framework.
In the third stage, analyze and produce results (as regards integration in the thesis
structure) and discuss the objectives and recommendations, Table 1.1. A framework
developed for shading and air movement analysis of the buildings. The framework was
divided into three basic parts. In the first part, general information about building location,
plans, sections, elevations, sizes, materials etc. are mentioned. In the second part, shading
analysis (by using Autodesk Revit) and airflow analysis of buildings are done on a
theoretical basis. In this part, user's responds to solar and ventilation effects is also
reflected. By this way, the compatibility relation between analysis and user's responds
could also be seen.
The third part of the framwork used for the evaluation of the shading and air movement
facilities of the building.
Table 1.1: Framework for shading and air movement analysis

4
Figure 1.1: The plan shows the study's methodology
Literary Review
Stage 1
The context of past research and work served the
purpose of the thesis
Low energy and climate analysis
Field Study
Stage 2
Framework study on people's environmental
satisfaction in homes in terms of understanding the
consumption of energy and thermal consumption
comfort
Field Study
Stage 3
Analysis on selected buildings and recommendations
Future Work Suggestions

5
CHAPTER 2
THEORETICAL FRAMEWORK
In this chapter, the importance of passive design strategies is emphasized. As it is known;
orientation of buildings, solar control, choice and use of materials, use of water elements
and form of building, air-movement control and daylight control are the main factors
which are considered in passive design strategies. The strategies are interpreted in several
ways. Some of them are mentioned in Table 2.1.
Table 2. 1: The topics of the passive design strategies are presented by some researchers (Altan et
al, 2016; California sustainability alliance, 2016; Passive design, 2019; Whang, 2014)
PASSIVE DESIGN STRATEGIES
Hasim Altan et al Passive design
handbook
Passive solar design
strategies Passive Design Toolkit
Orientation Climactic
considerations
Use of mechanical
Systems
Passive Solar Power
Building Shape
(Massing)
Passive cooling and
ventilation
South-Facing glass Orientation.
Choice of Materials Passive Heating Thermal mass Interior Layout
Landscaping (Heat
Island Effect)
Lighting controls
and dayligting
Orientation Insulation
Water bodies and
vegetation (Micro-
climate)
Passive water
strategies
Site planning for
solar access
Windows (glazing)
Daylighting Space Planning Lighting
Space Conditioning
Passive Cooling
Preventive Techniques
Natural Ventilation
Radiative
Evaporative
Earth Coupling
Passive Heating
Ventilation
Thermal mass

6
Ramos, at all. (2014), mentions that “orientation” is one of the most important factors to be
addressed in passive design. This is because orientation influences; air movements in and
around buildings, solar radiation loads, topography, nearby buildings, etc. In this context,
the chapter is structured on importance of orientation, solar shading and air movements.
Daylight effect is not included in the chapter as it is not considered in the analysis of
selected buildings.
2.1 Passive Design Strategies in General
Some passive construction components have intrinsic synergies and can be joined together
to improve comfort and power efficiency in distinct ways.
The incorrect combination of components or the use of certain in-isolation components can
have negative effects on thermal comfort and energy efficiency. In order for large south-
west windows for passive solar heat to achieve the desired overall building efficiency
gains, for example, they must be used in conjunction with high-performance windows or
external shading, in order to protect the interior from excessive solar thermal gain during
the summer. Figure 2.1 below demonstrates an illustration of how multiple passive
components can be combined in a typical Vancouver construction in order to ensure
continuous heat comfort. The baseline complies with ASHRAE 90.1 minimum criteria. As
each extra component is integrated, the annual energy consumption is further decreased so
that the effectiveness is ultimately high (Robertson, 2009).
Figure 2.1: Effect of Passive Design on Energy Intensity (Robertson, 2009)

7
2.1.1 Orientation
In the passive house, the first basic principle is the orientation towards the equator in the
north hemisphere (and the northern façade to the west in the southern hemisphere).
The longer dimensions of the home faces are more probable to achieve the highest solar
radiation by facing the long east-west axis of the construction. Therefore, in this portion of
the construction there should be places that are most frequently used, like kitchens and
living rooms.
It is also beneficial for cooling summer situations since the East-West facades are
minimized in the morning and evening (Esru, 2019). See Figure 2.2.
Figure 2.2: Orientation and solar gain (Esru, 2019)
Orientation is also important in terms of air movement for indoor and outdoor spaces.
Spaces should be prevented from undesirable winds during winter, while benefited from
desirable winds in summer.
At the same time, orientation is important for natural daylighting. When making lighting
choices, it is essential to take into account the fact that proper design and orientation of the
construction can decrease the artificial lighting requirement and thus enhance occupant
convenience. The structure must react to the sun's route, which provides adequate natural
light through windows.

8
The windows to the South offer plenty of light and energy benefits, while the windows to
the North offer a diffuse light with minimal solar gain.
In order to balance the interior lighting needs, a good passive structure should place
windows in various directions. The right approach allows for varying light levels and light
quality in accordance with the lighting needs of every room; direct lighting in kitchens,
offices and workshops as well as reflecting or diffusing light in each living room or
bedroom (Wimmers, 2009)
Use various screen orientation for balanced rates of lighting
Choose room-based lighting systems, see Figure 2.3.
Figure 2.3: Types of daylighting (Wimmers, 2009)
As mentioned before, construction orientation is an important factor in design, particularly
as far as wind and solar radiation are concerned (Al-Tamimi et al. 2011). The orientation
has an effect on some of the variables, such as daylight, ventilation and air conditioning
that contribute directly to total energy consumption, and thus achieve an optimized
orientation plays a key role in reducing energy conservation.

9
The sun is rising in the east and setting in the west. The side of the building used to achieve
solar efficiency must face to the south in order to maximize the potential energy of the sun.
If the building's axis is located east – west with its longest size faced to the South, the
building will absorb the heat energy of the sun more effectively. Passive solar structures
with a lengthy side to the south of the building are typically rectangular. The distance from
the input thermal source (south) to the absorption location (typically a northern wall) must
be kept to a minimum. It is rectangular in form (Green Passive Solar Magazine, 2019).
South facing windows and orientation: As the difference from the real south increases, the
structure's general solar potential reduces. In other words, the more southern degrees vary,
the less solar gain the building has. Consequently, the construction may require big
quantities of additional energy in winter. As the glass of the building faces further
southwest, more energy may be necessary for summer refrigeration Figure 2.4 (Green
Passive Solar Magazine, 2019). See Figure 2.4.
Figure 2.4: Orientation to the south (Green Passive Solar Magazine, 2019)
In the summer the sun penetrates only marginally into the interfaces and openings, while in
the winter solar energy can be accessed when the sun's way is less so (Rosenlund, 2000)
There are several methods which tries to find out the optimum orientation of buildings
depending on their climatic zones and local climatic data such as (Varoglu et al., 2017);
“Sun method” which consider mainly solar radiation from windows
“Rogers et al, method” that considers cooling loads
“Shewiv method” which focuses on desired shading periods
10
“Etzion method” that considers better design for shading
“Ok method” which interpreted mathematical formulas to find out the shading
areas of shaded parts.
Already there are many methods to find out ideal orientation, but this is not the main aim
of this thesis, as effect of sun and wind will be studied on the existing buildings.
2.1.2 Solar shading
Solar shading is important for cooling structures and also preventing excess heat gains.
Solar shading must be designed very carefully so that it will protect building in summer
but allow sunlight in winter (Kamal, 2012).
2.1.2.1 Shading by overhangs
Overhangs and shading in a passive house are significant equipment because they
contribute to decreasing overheating over the summertime. Consequently, it is extremely
essential to size the equipment correctly. To prevent overheating and keep house cool in
summer months, the southern façade through which the Sun mainly flows must be properly
shaded or fitted with size hangings. The device should be carefully designed to ensure that
the size and inclination (if needed) satisfy the need for sunlight during winter and to shade
the building in summer. The shade type and degree is always related to the sun and the
building's geometry. Simple overhangs are, for example, very effective when sunshine is
high in the sky to shade the building in the south façade during the summer (Gheorghe et
al. 2013).
However, for the south-west façade, this sort of shading device is not effective to prevent
the morning and the evening, if the sun's in the sky. The highest sun angles occur during
the solstice in the summer on the 21st of June, but the high temperature and humidity most
often occur in August.
Well-designed sun control and shading equipment can dramatically reduce building heat
gain and cooling requirements as a part of a building or separately from a building façade
and enhance the natural lighting quality of indoor buildings. Depending on the solar
orientation of an individual construction facade, efficient shading systems can be

11
developed. For instance, easy, fixed overhangs are very useful in summer when sun angles
are high when shading south-facing windows (Kamal 2012). See Figure 2.5.
Figure 2.5: Overhangs function in summer and winter (Improving the Thermal
Performance of the Building Envelope, 2016)
Figure 2.6: Different types of shading devices (Kamal, 2012)
However, the same horizontal device does not work if the low morning sun is blocked
from entering windows to the west during peak summer heat gain times (Figure2.6).

12
2.1.1.2 Shading of the roof
Roof shading is a key way of decreasing heat gain. The roof can be shaded with a cement
or plants roof, canvas or pots of earth etc. External shading should not interfere with
cooling at night. A cement or galvanized sheet over the ceiling offers protection against
direct radiation. This system's disadvantage is that it does not allow the heat to escape to
the sky in the evening (Kamal, 2012). See Figure 2.7.
Figure 2.7: Roof shading by solid cover (Kamal, 2012)
A cloak and gravel of leafy crops are a better alternative. It reduces the roof temperature to
a point below the daily air temperature. In the evening the temperature is even smaller than
in the sky Figure 2.8.
Figure 2.8: Roof shading by plant cover (Kamal, 2012)

13
2.1.1.3 Shading by trees and vegetation
Proper land-use can be one of the key variables in building energy conservation. In specific
vegetation and trees shade and decrease of heat gain is very efficiently. Trees can
beneficially be used for shading roof, walls and windows. The process by which a plant
actively releases water vapor from the trees can reduce surrounding air temperatures as
much as 5 ° C by the shading and evapotranspiration. Different plant kinds (beams, shrubs,
vines) can be chosen for the required degree of shading for different window and
conditions based on their growing habit (tall, small, dense, light permeable). For the
summer shading (Kamal, 2012), we should look at the following points.
1. Summer shade is provided by deciduous trees and breezes but winter access is
possible. On the south and south west side of the building are the best places for
feeding trees. In winter the sunlight can reach indoors if these trees drop their leaves.
2. Trees with high foliage obstruct the rays of the sun and cast a thick shadow. The roof,
walls and windows can be shaded with high branching canopy trees. On the south
and the west, evergreen trees provide optimal safeguards against the environment of
summer sun and cold winter winds.
3. For east and west walls and windows in the summer, the vertical shading is best
suited in order to safeguard against intense sunlight at small angles, for instance
screening by thick tree trunks, feeding wines with frame support and bushes
combined with trees. See Figure 2.9.
4. Wall-sticking crops like English Ivy or wall support crops such as jasmine may
provide shade and insulation for the walls.
5. Horizontal shading is best for windows facing south. For instance caduceus plants
such as decorative grape or wisteria can be cultivated on a pergola for summer
shading (which loses foliage in the winter).

14
Figure 2.9: Deciduous trees which provide shade in summer and allow sun rays during
winter (Esru, 2019)
2.1.3 Building form
The shape is an important factor in construction because of its considerable effect on
energy efficiency and construction expenses. In the conceptual phase of building design,
building shape is one of the key factors. Building shapes can influence construction
performance in many ways: power efficiency, price and esthetic aspects, because the
exterior envelopes can be oriented to the outdoor setting. However, too often construction
choices are based solely on esthetic aspects, which are obviously detrimental to limit the
potential for improved results. Formal optimisation can contribute to overcoming this
disadvantage by explore additional design options for particular requirements such as
environmental and financial results at the conceptual design level (Wang et al., 2006).
A number of prior research have been carried out on the optimisation of construction form.
The grammar of design and genetic algorithm of Rosenman and Gero have merged to
develop two-dimensional buildings. The entire construction scheme is built by applying
sequentially the design grammatics to the construction, including space units, of
hierarchical components (Caldas, 2002). In Hemsath et al., journal article The impact of

15
energy use, the enhanced volume-to-surface ratios indicates that thermal transfer across the
building envelope is increasing. Analysis of sensitivity Assessments of the base building
architecture The equilibrium between shape, quantity, light and shell is crucial for the
design of an energy-free structure (Hemsath et al., 2015).
Brown et al., book authors of “Sun, Wind, and Light”, recommend east-west rectangular
construction. Shortened east and west façade will thake less sun’s energy as the sun angle
is very low during morning and afternoon times. It is difficult to control low sun angle on
west during summer time. On the other hand, south side is widened to allow low winter
angles, while prevent high summer angles easily with the help of overhangs (Dekay and
Brown, 2013).
Philip Steadman discusses the use of the low-energy surface area and that the walls with
the greatest solar radiation are on the west side in his Energy, environment, and Building
book (Steadman, 1975). He discusses the optimal form of buildings by Victor Olgyay,
which are calculated by low heat in the winter and heat gain during the summer months,
and rectangular shapes extending to the east and to the west become effective forms. See
Figure 2.10.
Figure 2.10: Basic forms and shapes from Victor Olgyay in several regions (Olgyay,
2015)

16
It can be said, the shape and structure of the building are of great importance in
determining the amount of shadows. Shows, Figure 2.11 the difference in the amount of
shade between buildings with a flat surface.
Figure 2.11: Effect of the shape of the building on the amount of fallen shadows (Olgyay,
2015)
2.2. Climatic Elements
In order to guarantee a better organization and judicious use of space, users convenience
and operational functionality of the entire setting is needed. Satisfaction of physiological,
protection and social needs, must be considered in architectural designs together with
climate parameters (Agboola, 2011).
2.2.1 Solar radiation
The sun is crossing the seasonal paths from east to west in the southern hemisphere. As
known, higher angle in summer and lower angle in winter is observed. These solar angles
influence the level of solar radiation obtained on the horizontal and vertical surfaces
directly. The lower angles tend to concentrate on vertical surfaces and the radiation is
concentrated on horizontal surfaces at higher solar angles (Bahrami 2008). See Figure 2.12.

17
Figure 2.12: Lococentric view of the sky hemisphere, with sun-paths for the main dates
(Szokolay, 2012)
In order to measure the sun's angle through the sky, incident and azimuth angles must be
read. The solar altitude is the angle between the sun’s rays and horizontal plane. At zenith,
which is an overhead point, it has a peak value of 90°. Azimuth, measured in a clockwise
direction along the horizon (Math, 2019).
Azimuth begins at 0 degrees from north precisely, increasing in the clockwise direction.
The following instance shows the sun angles to North (Northern Hemisphere) 56 degrees
latitude. The altitude as seen from the figure above is symbolical of β from the horizon,
while α from the South Pole and horizontally is symbolic of the azimuth. Even in a latitude
of 65, during the winter and the summer solstice, the Sun rises more south eastwards and
west eastwards (Mulyansaka, 2013). See Figure 2.13.
Figure 2.13: Azimuth and Altitude (Mirdanies, 2015)

18
2.2.1.1 Sun path and shading devices
Bioclimatic chart, Psychometric chart and Mahoney’s table suggest the shading of
windows almost throughout the year through. March till October. Sun path diagram of
Lucknow is used to create a shading mask with the help of shading protractor for the
months in which shading of windows is required. Figure 2.14 From this shading mask we
get a horizontal shading angle and vertical shading angle. Figure 2.14 North have only
morning and evening sun that can be shaded by approximately 400mm vertical fins.
Maximum sun is in south direction, shading mask is created so that it shades the summer
sun and allows the winter sun to come in. For that purpose overhang with small fins would
work. Designing of shading devices for east and west direction is the most difficult task,
the sun rays are almost vertical and the intensity of radiation is also high. Therefore,
vertical fins designed for that direction are almost parallel to windows. (Bano and Tahseen,
2017). See Figure 2.14.
Figure 2.14: Shading devices in North, East, South and west direction of openings in
building in Lucknow (Bano, Tahseen, 2017)
Shading equipment can considerably decrease building solar thermal gains while
preserving daylight, view and natural ventilation possibilities. Conversely, carefully
designed shading device can allow direct solar radiation at certain times of the year, when
Sun path diagram

19
such energy is wanted, especially at mountain highlands, to passively heat buildings.
(Priatman and Loekita, 2015). Shading equipments have principal objectives as:
Physical function: Reduces sunlight, reduces radiation effect on building, provides
rain protection for openings
Aesthetic function: To express architectural aesthetic by façade appearance.
2.2.1.2 Types of shading devices
Internal shading devices: They limit the glare caused by sunlight. Normally the occupants
can adjust and the direct light easily. Illumination level can be regulated in the space.
(Improving the Thermal Performance of the Building Envelope, 2016). See Figure 2.15.
Figure 2. 15: Internal shading devices (Improving the Thermal Performance of the
Building Envelope, 2016)
External sun shading devices: Thermal efficiency, in terms of heat gain by radiation can be
controlled effectively by horizontal and vertical shading devices. Horizontal shading
devices are better on south facades for the hot summer to shade a window, but for a winter
time they must let the sun shine through a window to warm a building. Vertical shading
devices on the other hand are mainly helpful to enhance the isolation value of glass in
winter months for east and west exposures (Improving the Thermal Performance of the
Building Envelope, 2016). See Figure 2.16

20
Figure 2.16: Horizontal and vertical shadow devices (Nzeb, 2019)
2.2.1.3 Shadow angles
Shadow angles describe the position of sun in relation to shadow angles on the face of the
construction. On the vertical surface, the vertical shadow angle is described as the corner
of the dropping radiation between the surface and the vertical perpendicular on the ground.
When an edge of the shade is located at the view (see Figure 2.17), the horizontal shade
angle differs from the azimuth from the position of the sun and the viewing orientation
(Szokolay, 2012).
.
Figure 2. 17: Vertical shadow devices and horizontal shading devices (Subhashini and
Thirumaran, 2018)
With the passing of time, specialists have noticed that shades can affect heating loads as
the used solar gains are reduced during the winter. Many studies have shown that the most

21
energy-efficient shading approaches are used in heating-dominated climates. In these
buildings use of shading systems create shaded areas with high percentages (Priatman and
Loekita, 2015).
2.2.2 Temperature
Temperature (T) is an indication of the heat being in the substance. The Celsius size is
based on water: its point of freezing and its point of boiling (at standard atmospheric
pressure) (100 Co). With "absolute zero," the kelvin scale starts without total heat. S
o 0
drafts C = 273.15 drafts K. Thus, 50C o − 10 C
o = 40 K and likewise 50 C
o O–25 C
o is 30
K, but 15 Co as a scale point, the grade of notation of difference of density is 288.15 K
(Szokolay, 2012). Temperature range is 30 K, but the grade of scale is 15 Co. (Kelvin).
Annual temperature values of the places are important in finding out the overheated
periods, so that shading time for the building walls and windows can be decided. On macro
scale temperature is affected according to the zone of the location due to changing altitude
and latitude.
Altitude: Altitude is called the measured height above the sea level. A dense mass of air at
low altitude has capability of absorbing sufficient heat from the sun. However, the
temperature also reduces gradually as the altitude rises. Thus, a very thin body of air at
elevated altitude cannot absorb sufficient heat from the sun, so it is cool at high altitudes.
When the height goes up to 160 meters to 165 meters (Simplified 2019) the temperature
falls by 10 degrees Celsius.
Latitude: The further away from the equator, colder is felt, because the places near the
equator receive direct sun rays while away from the equator receive slanted sun rays. So,
high concentration of heat is absorbed by the atmosphere near the equator and less heat is
absorbed as away from the equator (Coura, 2019).
2.2.3 Winds
The reasons for wind development are very manifold and complex phenomenon. However,
the main reason is the unequal distribution of solar radiation worldwide. It results from

22
different surface heating and temperatures. This causes differences in air pressure and as a
result, air moves from high pressure side to lower pressure side (Fmlink, 2019).
The wind is retarded and the turbulent flow near the earth forms a limit layer. The wind is
slowed down as it is closer to ground. It can range between approximately 270 m and over
500 m across the city (Szokolay, 2012). See Figure 2.18.
Figure 2.18: Wind speed profiles: depth of the boundary layer (Olgyay, 2015)
The strategic orientation, configuration and building envelopes and energy use affect wind
speed and direction. Wind disturbs the silent air membrane around and isolates a building
and increases heating and refreshing loads. In order to cool the surface below ambient air
temperatures, wind can also evaporate moisture on the wet building rooves. The northern
and western sides of the building face high winds in the northern hemisphere. In order to
minimize air flow from doors and windows, the buildings must have the most vulnerable
areas, such as entrances and glazed areas, away of prevalent winds. The entrance must be
23
properly protected against wind when it is built to the North or the West. If not, high winds
and low temperatures can cause discomfort during the winter months, leading to high
energy consumption. Although high winds often cause increased energy consumption, they
can actually reduce consumption at certain locations if winds use and apply natural cooling
properties throughout the building (Pinteric, 2017).
2.2.3.1 Windbreaks
Air pressure differences cannot change large amounts of air during their motion. But
speeds can be controlled to some degree in the living spaces closer to the ground. The
frictional drag of vegetation and obstruction caused by trees can be used for this purpose.
In addition to its esthetic and shading properties, vegetation can well be used to deviate
airflow. Trees are capable of reducing wind speeds. This mechanical effect brings
significant temperature and humidity changes to the air (Olgyay, 2015).
The type of windbreak used has a definite effect on the resultant airflow pattern and on the
area of protection. Solid wind barriers, or walls, cause eddies which reduce wind
effectiveness. In the study done by Olgyay, the heating load of the houses which is
unprotected at wind speed 20 mph is about 2.4 times, when compared with protected one
under the same temperature conditions. This indicates that high dense evergreen belts are
quite effective at higher wind speeds.
Wind speed can be controlled by landscape elements. Windbreaks can be effective in
controlling wind and its impacts on buildings. These shelter belts may occur from rows of
trees and shrubs that are planted to reduce wind speed or redirect wind movement. In a
cold climate, a properly located and effective windbreak can decrease air infiltration and
heat loss by reducing wind velocity near the building. Plant species selected for a
windbreak should be able to withstand the desiccating effects of winter winds. Evergreen
species should constitute a significant portion of the windbreak composition because they
retain wind-blocking mass in winter when it is most needed. An evergreen properly
selected and placed can divert cold winds from the building and reduce heating costs
(Seckin, 2018). See Figure 2.19. Building itself also may act as wind break. There is high
air pressure zone on the windward side of building, as low air pressure zone is observed on
the leeward side. See Figure 2.20.

24
Figure 2.19: wind control by trees (Chawla, 2017)
Figure 2.20: Wind-induced natural ventilation (Kumar, 2017)
+
-

25
2.2.3.2 Ventilation
Use of natural ventilation in the arrangement of living spaces is a very important tool as it
reduces energy demand for cooling. Natural ventilation can be obtained in several ways. If
space has window opening on one side, this is known as single – sided ventilation. If space
has opening on different walls, then we can obtain cross ventilation which is more efficient
than one-sided ventilation. It is used to generate airflow routes from inlets to outlets that go
through the occupied construction stage. Cross ventilation up to a maximum depth of five
times the height of the space is efficient. They can be moved by a wind effect or by a stack
effect, as in the case of wall openings or atrium ventilation, where the resulting flux is
vertical (Kumar, 2017).
The excellent distribution of openings must also be planned. Openings on the opposite
walls are more efficient than on neighboring walls for cross ventilation. In regards to the
occupied level of the room the vertical position of the inlet should also be. Low inlets for
cooling are generally suggested and elevated inlets for ventilation stacks are suggested.
With the use of trickle ventilation, minimal flow rate should be guaranteed at the minimum
window zone of approximately 5 percent of the floor area (Smith, 2001). The window area
should in any event be sufficient to satisfy the necessary ventilation rate, which depends on
the construction. See Figure 2.21.

26
Figure 2.21: Cross ventilation (Services, 2019)
In general, openings should not be positioned in a room precisely across them. Although
this gives efficient ventilation, it may lead to good cooling and ventilation in some areas of
the space as long as other sections do not. When openings are placed across but not
immediately opposed, the air in the room is mixed and coolers and fresh air are better
distributed. Air inlets must be put on the high-pressure areas and outlets at low-pressure
areas of a building. This creates effective cross ventilation (Mondal, 2015). Various
ventilation types and air mixtures with different windows are shown in Figure 2.22.

27
Figure 2.22: Different amounts of ventilation and air mixing with different window
openings (Mondal, 2015)
Window characteristics that affect air flow
Airflow impact depends on the type and positions of windows, skylights and roof
windows. Typically, casement and windows that project can be opened completely to
allow more ventilation. An external sash can assist, guide the air into a space. However,
the inward planning sashes may be more viable if the wind is harder. Sliding windows
have less than half of the total window region with restricted openings. Skylights or roof
windows that are mechanically or manually operated enable warm air to go out and replace
it by warmer outside air, which enters the opening windows at a reduced rate. If the air
moves quickly enough, window positioning (location and opening size) will influence the
occupant's cooling. The average air speed is determined by:
The exterior wind velocity.
The angle at which the wind strikes the opening.
The size of the opening.
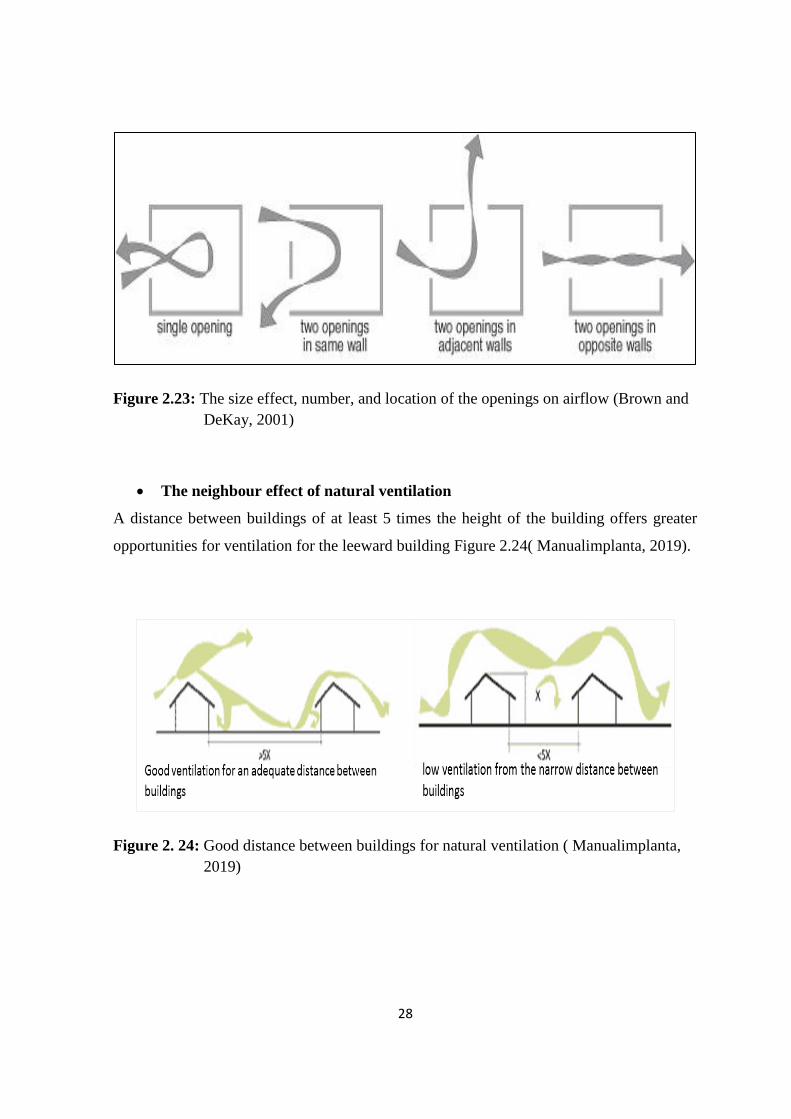
The Figure 2.23 demonstrates how the size, number, and location of the openings will
affect the air flow (Brown and DeKay, 2001).
28
Figure 2.23: The size effect, number, and location of the openings on airflow (Brown and
DeKay, 2001)
The neighbour effect of natural ventilation
A distance between buildings of at least 5 times the height of the building offers greater
opportunities for ventilation for the leeward building Figure 2.24( Manualimplanta, 2019).
Figure 2. 24: Good distance between buildings for natural ventilation ( Manualimplanta,
2019)

29
CHAPTER 3
THE AL BAYDA CITY IN LIBYA
3.1 Location Libya
Libya is located in central North Africa. The Northern Mediterranean border and the
coastline are some 2,000 km, Figure 3.1. The country ranges from latitude (20° - 34°N ) to
length (10° - 25°E), which is approximately 90.5 percent of the region classified as arid
(Ben Mahmoud, 1993). The topography is normally robust, with the exception of two areas
between 500 and 1000 meters over sea level (Al-Haram 1995). The wet winter and hot and
dry summers characterize the climate of Libya, and arid climate is evident in the transition
from the Mediterranean to the tempestuous climate. The population of Libya has been
approximately 5,323,991 in 2006, and the projected 2025 population is approximately 10
million.
Figure 3.1: Map showing Location of Libya (Al-Haram 1995)

30
3.2. Location of the City of Al Bayda, Libya
The city of Al-Bayda in the north east of Libya is the highest peak of the Green Mountain
at the junction of the latitude 21.44 North and the longitude 32.76 east (WorldAtlas, 2019).
It is bordered to the east by the city of Qurena, to the west by the village of Massa, to the
south of the village of Aslanta, and to the north by the intermediate forests, making it the
middle of the green mountain.
Due to the mediation of the city's location between the governors of Darnah, Marj, Qubba
and Benghazi; its location in the middle of Al-Jabal Al-Akhdar has become an urban
complex of commercial nature and a shopping center for its neighboring towns and
villages. It is close to the sea by 20 km and surrounded by forests.
Figure 3.2: Map showing location of the city of Al Bayda, Libya
31
3.3 Climate of Al Bayda
In white, summer long, warm, arid, clear, winter is cool, windy, often clear. The
temperature typically varies from one year to the next 42o Fahrenheit to 83
o Fahrenheit,
rarely below 38o Fahrenheit or above 93
o Fahrenheit (Climatestotravel, 2019).
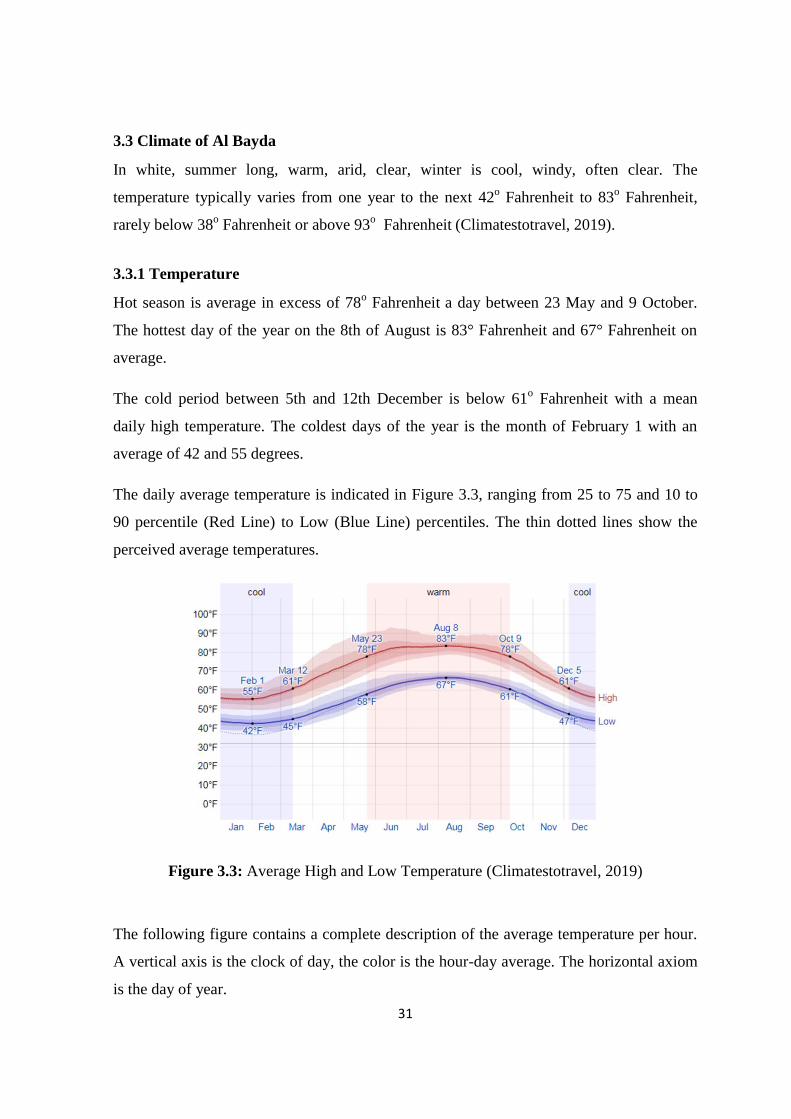
3.3.1 Temperature
Hot season is average in excess of 78o Fahrenheit a day between 23 May and 9 October.
The hottest day of the year on the 8th of August is 83° Fahrenheit and 67° Fahrenheit on
average.
The cold period between 5th and 12th December is below 61o Fahrenheit with a mean
daily high temperature. The coldest days of the year is the month of February 1 with an
average of 42 and 55 degrees.
The daily average temperature is indicated in Figure 3.3, ranging from 25 to 75 and 10 to
90 percentile (Red Line) to Low (Blue Line) percentiles. The thin dotted lines show the
perceived average temperatures.
Figure 3.3: Average High and Low Temperature (Climatestotravel, 2019)
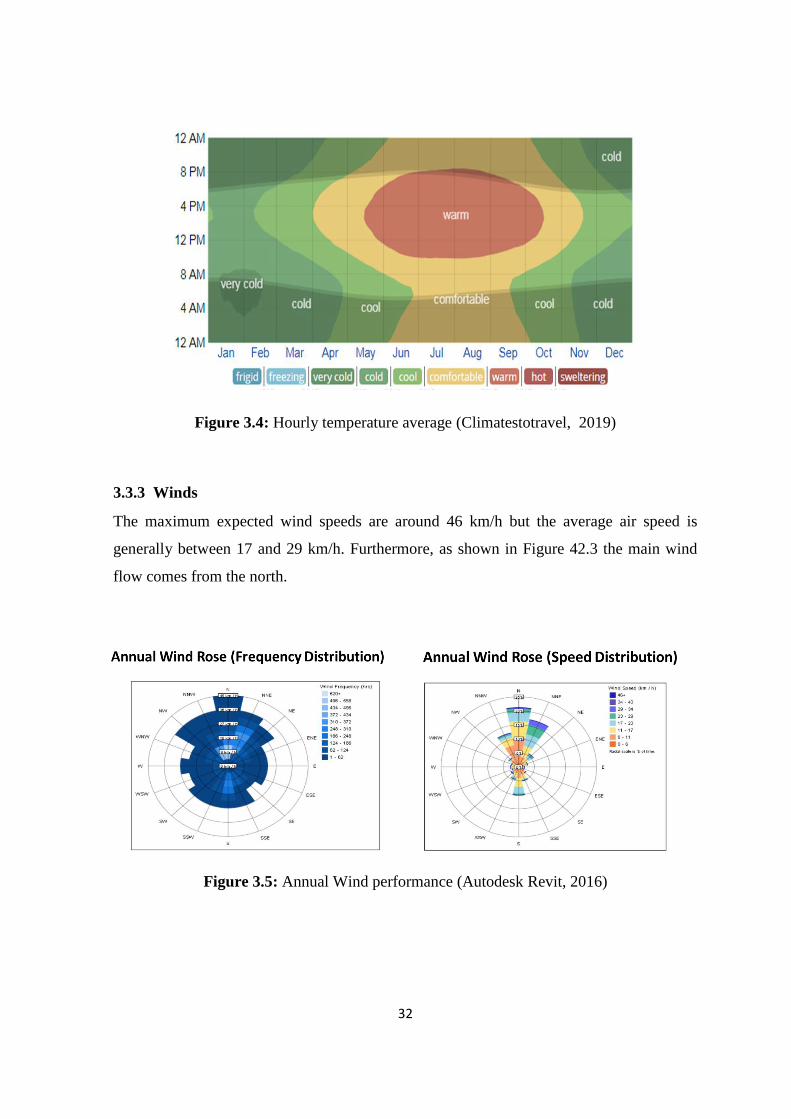
The following figure contains a complete description of the average temperature per hour.
A vertical axis is the clock of day, the color is the hour-day average. The horizontal axiom
is the day of year.
32
Figure 3.4: Hourly temperature average (Climatestotravel, 2019)
3.3.3 Winds
The maximum expected wind speeds are around 46 km/h but the average air speed is
generally between 17 and 29 km/h. Furthermore, as shown in Figure 42.3 the main wind
flow comes from the north.
Figure 3.5: Annual Wind performance (Autodesk Revit, 2016)

33
CHAPTER 4
CASE STUDY: SHADING AND AIR FLOW ANALYSIS ON SELECTED
RESIDENTIAL BUILDINGS IN AL - BAYDA CITY
This chapter demonstrates the analysis of energy efficiency strategies in residential
buildings in the AL Bayda City, Libya. Research and findings for 9 from Residential
Buildings are discussed in this chapter, in terms of orientation and solar energy in the
summer and winter solstice and the study of the main winds and its effect on natural
ventilation.
In addition, an interview is done with the owners of the houses selected for the study and
the results are evaluated.
4.1 Survey Methods
A domestic building survey was carried in Al-Bayda city to reduce energy consumption.
The study includes a range of buildings in terms of orientation, energy efficiency and the
impact of solar radiation on buildings by simulating a computer (Autodesk Revit 2016).
The prevailing winds and levels of ventilation were studied in order to reach the
consumption of buildings for energy and their impact on the environment.
Nine houses were selected randomly in Downtown city in Al-Bayda for the study .It is
shown in, Figure 4.1.

34
Figure 4.1: Google map showing location of case studies.
An interview was conducted with the residents of the selected houses. And asked major
questions to begin the interview with the residents.
1. Do you have heat insulation on walls?
2. Do you have heat insulation on glazing?
3. What kind of construction system is used in your building?
4. What are the cooling devices used in the home?
5. What kind of heating is used in the home?
6. How much do you pay monthly for electricity ranges?
7. How can you estimate the energy consumption in your home?
8. Do you know that energy consumption is harmful to the environment?
9. How often do you use natural ventilation in summer?
10. How often do you use mechanical ventilation in summer?
11. How often solar radiation reaches the bedrooms?
12. How often solar radiation reaches into the living room?
13. What are the shading devices available in your home?

35
14. How do you grade level of satisfaction in terms of ventilation in your home?
15. How do you grade level of satisfaction in terms of gaining sun's energy in your
home?
16. Is there a difference in the thermal comfort between rooms in your home?
17. According to you, Are buildings adjacent to the building prevent the winds into the
house?
At the end of the interview with the residents, was thanked and the data were recorded
and later discussed.
4.2 Survey Results
Following up with the interview of the respondents from the owners of the selected houses,
the following results were analyzed as:
Seventeen questions were asked for the owner of the houses in the interview, and it's worth
mentioning that the interview was added with a house owner who was not chosen his
house for the study to complete the number of the respondents for ten residents of the city
of Al-Bayda.
Responses are given below:
Table 4.1: The age
Frequency Percent Valid Percent Cumulative Percent
Valid 30-40 3 30.0 30.0 30.0
41-50 3 30.0 30.0 60.0
51-60 3 30.0 30.0 90.0
More than 60 1 10.0 10.0 100.0
Total 10 100.0 100.0
The age of the respondents was 30-40, 30%, 41-50, 30%, 51-60, 30% and more than 60
were the lowest, 10%.

36
Table 4.2: Heat insulation on walls
Frequency Percent Valid Percent Cumulative Percent
Valid No 10 100.0 100.0 100.0
In Table 4.2, 100% of the respondents agreed that there was no heat insulation of the walls.
Table 4.3: Heat insulation on glazing
Frequency Percent Valid Percent Cumulative Percent
Valid No 9 90.0 90.0 90.0
Yes 1 10.0 10.0 100.0
Total 10 100.0 100.0
In Table 4.3., 90 % of the respondents agreed (Case Study 2,3,4,5,6,7,8,9) that there was
no heat insulation of the glazing.
Table 4.4: The construction system
Frequency Percent Valid Percent Cumulative Percent
Valid Load bearing system 2 20.0 20.0 20.0
Frame system 8 80.0 80.0 100.0
Total 10 100.0 100.0
In Table 4.4., 80 % of the respondents agreed (Case Study 1,2,3,4,5,6,8) that the
construction systems in the buildings used are frame system and the remaining percentage,
20% (Case Study, 9) for load bearing system.
Table 4.5: Cooling devices
Frequency Percent Valid Percent Cumulative Percent
Valid Air conditioning 8 80.0 80.0 80.0
Fans 2 20.0 20.0 100.0
Total 10 100.0 100.0

37
This question asked about the cooling devices which are used in the home. Two main types
of air conditioning are mentioned in the survey to determine which type is the most
popular. The results reveal that air conditioning in the house is very common, with 80% of
those surveyed (Case Study 1,2,4,5,6,8,9) is using this type of cooling, and 20% (Case
Study 3,7) used the fans.
Table 4.6: Heating used
Frequency Percent Valid Percent Cumulative Percent
Valid Electric heater 8 80.0 80.0 80.0
Air conditioning 2 20.0 20.0 100.0
Total 10 100.0 100.0
This question asked about the heating devices used in the home. The results reveal that the
heating devices used in the home 80% are electric heater of those surveyed (Case Study
3,4,5,6,7,8,9), and 20% used Air conditioning (Case Study 1,2).
Table 4.7: The pay to monthly for electricity
Frequency Percent Valid Percent Cumulative Percent
Valid Less than 50 $ 1 10.0 10.0 10.0
150-200 $ 3 30.0 30.0 40.0
200-250 $ 1 10.0 10.0 50.0
250-300 $ 5 50.0 50.0 100.0
Total 10 100.0 100.0
This table shows, how much do you pay monthly for electricity ranges. 50% these largest
percentage of those surveyed (Case Study 2,3,4,6,8), they pay monthly 250-300 $, and
30% (Case Study 1,5) they pay 150-200 $ monthly ،and 10% (Case Study 9) they pay
monthly 200-250 $ and 10% of those surveyed (Case Study 7) they pay monthly less than
50 $.

38
Table 4.8: Estimate the energy consumption
Frequency Percent Valid Percent Cumulative Percent
Valid Average cost 4 40.0 40.0 40.0
High-cost 6 60.0 60.0 100.0
Total 10 100.0 100.0
This table shows, the results of the survey revealed that 60% of the house surveyed (Case
Study 1,2,5,6,7 ), it has a high-cost and 40% have Average cost (Case Study 3,4,8,9).
Table 4.9: Know that energy consumption is harmful to the environment
Frequency Percent Valid Percent Cumulative Percent
Valid No 10 100.0 100.0 100.0
This question asked respondents their knowledge of the environmental damage caused by
energy consumption. The survey revealed that 100% of the respondents were not aware of
the damage caused by energy consumption.
Table 4.10: The use natural ventilation in summer
Frequency Percent Valid Percent Cumulative Percent
Valid Sometimes 5 50.0 50.0 50.0
Most of the time 5 50.0 50.0 100.0
Total 10 100.0 100.0
This table indicates, the results of the survey showed that 50% of the respondents (Case
Study 3,4,6,8,9) use the natural ventilation opportunities sometimes and 50% of the
respondents (Case Study 1,2,5,7) use natural ventilation opportunities very often.

39
Table 4.11: Use of mechanical ventilation in summer
Frequency Percent Valid Percent Cumulative Percent
Valid Never 2 20.0 20.0 20.0
Sometimes 1 10.0 10.0 10.0
Most of the time 7 70.0 70.0 100.0
Total 10 100.0 100.0
This question was included in this survey in order to understand people’s behavior
regarding the use of mechanical ventilation in summer. The survey asked about, how often
do you use mechanical ventilation in summer. 70% of them which is the largest percentage
of those surveyed (Case Study 1,2,6,7,8,9) mentioned that they use mechanical ventilation
frequently and 20% of those surveyed (Case Study 3,5) said that they did not use
mechanical ventilation.
Table 4.12: The aceess of solar radiation to the bedrooms
Frequency Percent Valid Percent Cumulative Percent
Valid Rarely 30 30.0 30.0 30.0
Sometimes 5 50.0 50.0 80.0
Most of the time 2 20.0 20.0 100.0
Total 10 100.0 100.0
This table shows, how frequent the solar radiation reaches to the bedrooms. The results
showed that 50% (Case Study 1,4,5, 8,9) mentioned as sometimes, 30 %, mentioned (Case
Study 2,6,7) rarely, 20% mentioned (Case Study 3) as most of the time.
Table 4.13: The access of solar radiation to the living room
Frequency Percent Valid Percent Cumulative Percent
Valid Never 2 20.0 20.0 20.0
Rarely 3 30.0 30.0 30.0
Sometimes 2 20.0 20.0 70.0
Most of the time 30 30.0 30.0 100.0
Total 10 100.0 100.0

40
This table shows, how often solar radiation reaches the living room. The results showed
that 20% (Case Study 4,6) said “sometimes”, 30 %, (Case Study 2,7) said “rarely”, 20%
(Case Study 8,9) said “never” and 30% (Case Study 1,5 ) said “most of the time”.
Table 4.14: The shading devices available in the home
Frequency Percent Valid Percent Cumulative Percent
Valid Curtains 60 60.0 60.0 60.0
Nothing 40 40.0 40.0 100.0
Total 10 100.0 100.0
In Table 4.14, 40 % of the respondents agreed that no shading devices are available in the
house (Case Study 3,4,5) and 60% use the curtains (Case Study 1,2, 6,7,8,9 ).
Table 4.15: Grade level of satisfaction in terms of ventilation at home
Frequency Percent Valid Percent Cumulative Percent
Valid Very poor 2 20.0 20.0 20.0
Poor 3 30.0 30.0 50.0
Good 3 30.0 30.0 80.0
Very good 2 20.0 20.0 100.0
Total 10 100.0 100.0
Table 4.15 shows the results of the survey revealed the grade level of satisfaction in terms
of ventilation. 30% Poor (Case Study 4,5,9), 30% Good (Case Study 6,8), 20% Very good
(Case Study 1,2), 20% very poor (Case Study 3,7).

41
Table 4.16: Grade level of satisfaction in terms of gaining the sun's energy in the home
Frequency Percent Valid Percent Cumulative Percent
Valid Very poor 4 40.0 40.0 40.0
Poor 2 20.0 20.0 60.0
Good 3 30.0 30.0 90.0
Very good 1 10.0 10.0 100.0
Total 10 100.0 100.0
Table 4.15 shows the results of the survey revealed a grade level of satisfaction in terms of
gaining the sun's energy, 40% very poor (Case Study 3,7,5,9), good 30% (Case Study 2,8),
20% Poor (Case Study 4,6), 10% very good (Case Study 1).
Table 4.17: The difference in the thermal comfort between rooms in the home
Frequency Percent Valid Percent Cumulative Percent
Valid No 4 40.0 40.0 40.0
Yes 6 60.0 60.0 100.0
Total 10 100.0 100.0
Table 4.17 shows the results of the survey abut a difference in the thermal comfort between
rooms in the home. 60% of those surveyed (Case Study 1,2,5,6,8,9) confirmed that there is
difference in the thermal comfort between rooms in the house and 40% (Case Study 3,4,7)
mentioned that there isn't difference.
Table 4.18: Adjacent buildings prevention for the wind
Frequency Percent Valid Percent Cumulative Percent
Valid No 5 50.0 50.0 50.0
Yes 5 50.0 50.0 100.0
Total 10 100.0 100.0

42
This table shows the results of the survey revealed that 50% of buildings adjacent to the
building prevent the winds into the house (Case Study 1,2,5,6,8), and 50% does not
prevent winds (Case Study 3,4,7,9).
4.3 Analysis of Research
A total of 9 random buildings was selected in the city of Al-Bayda. Analysis of energy
efficient strategies of these residential buildings in AL Bayda City are done according to
the selecter criteria. Several buildings have been observed that they contribute to high
energy consumption and cause environmental damage.
The buildings were analyzed in terms of climatic elements that affect the thermal comfort
of the internal environment of the building. Basicly, summer and winter outdoor shading
conditions and air movements that happened indoor and outdoor spaces are examined and
criticized.

43
Table 4.19: Case Study 1

44
Table 4.20: Case Study 2

45
Table 4.21: Case Study 3

46
Table 4.22: Case Study 4

47
Table 4.23: Case Study 5

48
Table 4.24: Case Study 6

49
Table 4.25: Case Study 7

50
Table 4.26: Case Study 8

51
Table 4.27: Case Study 9

52
CHAPTER 5
CONCLUSION AND RECOMMENDATIONS
This study was conducted to analyze the energy efficiency strategies of residential
buildings in the city of Al-Bayda, the research discussed the principles of climate design
which plays an important role in the internal environment quality and energy consumption
of residential buildings.
Nine houses in Al-Bayda city were selected and conducted with climate analysis based on
shading and air movement. Orientation and solar radiation effects are examined through
computer simulation (Autodesk Revit 2016) to find out the suitability of homes with their
local environment. The impact on energy consumption can be summarized as follows;
• Buildings are affected by solar radiation in the summer in large quantities and roof
becomes the dominant building element which absorbs radiation and transfers into
the living spaces. This initiates wide use of air – conditioners together and causing
high energy costs.
• Unappropriate orientation of buildings are not in harmony with their surroundings
and cannot benefit or prevent themselves from climatic factors on the required time
of seasons.
• Generally, wind movement is negatively affected by adjacent buildings and causes
low natural ventilation.
• Lack of interest in the outer space of the buildings are observed. Plants and/or
landscape elements are not used as an architectural tool for solar control and
windbreak purposes.
All of these factors have affected houses to pay high energy costs and indirectly increased
CO2 emissions. Through the interview and respondents of the house owners, it has been
observed that there is no heat insulation in the walls of buildings which are studied. Also
almost no insulation on windows (90% of buildings have no double glazing) is observed.
There is also a large consumption of air conditioners (80%). The highest monthly bill cost
for electricity consumption is found $250-$300. On the other hand, 100% of respondents

53
were unaware that the environmental damage is caused by energy consumption. On Table
5.1., general recommendations are expressed on the studied buildings.
Table 5.1: General recommendations for the studied buildings
Existing Recommendations
Deciduous trees on the south and south-west site
increase shadow area during summer, which
allows sun's radiation during winter
During summer Although overhang will protect
the harsh radiation effect on walls, heat transfer
through slabs cannot be prevented because of
lack of insulation.
A flat roof can be insulated with several
methods of earth, gravel fill may be the cheapest
and effective way of obtaining heat insulation
No cross-ventilation
Cross-ventilation can be created through indoor
spaces by introducing openings over the internal
doors.
Hard Surface
Conduction heat Transfer towards building
Deciduous tree
More shadow
Less hard surface
Insulation
layer less heat
transfer High heat
transfer

54
S
u
m
m
e
r
An opening or mechanical fan at the top of
staircase can exhaust dirty air outside, while
stacking relatively cool air. Thus convective air
movement will create a cooling effect.
For facades direction facing south
The slab prevents solar radiation in the summer
and allows to through in the winter.
Area for living rooms, outdoor terraces can be
located on the south-east corner of the building
where shaded area and the desirable wind is
available
The table is organized in such a way that, existing negative situations of buildings, in terms
of solar radiation and natural air movement behavior are reflected together with
recommended positive architectural sections. One of the important outcomes of the
research is that for the city of Al – Bayda, architects can consider location of living rooms
Moving air cooling effect
Hot air is trapped
Stagnant hot air
55
and outdoor terraces on the south-east corner of the buildings where shaded area and the
desirable wind is available (See Table 5.1). It is also recommended to use thermal
insulation for buildings and to exploit outer space with plants and water bodies.
After the evaluation of these results, it can be adviced that there should be an awareness
campaign for the population about the damage to energy consumption. Architects must be
well educated with seminars about climate – responsive building design. Chamber of
architects must encourage life long learning seminars on climatic design.

56
REFERENCES
Agboola, O. P. (2011). Importance of climate to architectural designs in Nigeria. Journal of
Environmental Issues and Agriculture in Developing Countries, 3(1), 15-28.
Al-Haram F. (1995) Topography and Geomorphology In: Abo-Lohmah A. and Al-
Ghazeree M. (Eds), Geography of Libya. Al-Dar Al-Jamahiriya L-Anashir- Libya,
101-120.
Al-Tamimi, N. A. M., Fadzil, S. F. S., & Harun, W. M. W. (2011). The effects of
orientation, ventilation, and varied WWR on the thermal performance of residential
rooms in the tropics. Journal of Sustainable development, 4(2), 142.
Altan, H., Hajibandeh, M., Aoul, K. A. T., & Deep, A. (2016). Passive Design. In
ZEMCH: Toward the Delivery of Zero Energy Mass Custom Homes (pp. 209-236).
Springer, Cham.
Aminoroayaei, N., & Shahedi, B. (2018). Study of effective factors in the design of zero
energy buildings in arid climate (case of Isfahan City). Ukrainian Journal of
Ecology, 8(1), 211-221.
Asfour, O. (2015). Natural ventilation in buildings: An overview. Natural Ventilation:
Strategies, Health Implications and Impacts on the Environment, 1-26.
Bahrami, S. (2008). Energy efficient buildings in warm climates of the Middle East.
Bano, F., & Tahseen, M. (2017). Bioclimatic Building Design Guidelines For Lucknow
City: Use Of Various Climate Analysis Methods. Int. J. Res. Appl. Sci. Eng.
Technol.(IJRASET), 5(XI), 330-341.
Caldas, L. (2002). Evolving three-dimensional architecture form. In Artificial Intelligence
in Design’02 (pp. 351-370). Springer, Dordrecht.
California sustainability alliance. (2016 ). Passive design handbook. Retrieved from
https://sustainca.org/sites/default/files/publications/Passive_Design_Guidebook_De
signed_2015-12-31_0.pdf
57
Climatestotravel.com. (2019). Libya climate: average weather, temperature, precipitation,
best time. Available at: https://www.climatestotravel.com/climate/libya, Accessed
19 Jan. 2019.
Coura .(2019). Retrieved from https://www.quora.com/What-factors-affect-the-climate-of-
a-place
DeKay, M., & Brown, G. Z. (2013). Sun, wind, and light: architectural design strategies.
John Wiley & Sons.
Designingbuildings.co.uk. (2018). Heat transfer in buildings - Designing Buildings Wiki.
Available at:
https://www.designingbuildings.co.uk/wiki/Heat_transfer_in_buildings
Dubois, M. C. (2001). Solar shading for low energy use and daylight quality in offices:
simulations, measurements and design tools (Doctoral dissertation, Lund Institute
of Technology, Department of Building Science).
Esru.strath.ac.uk. (2019). Available at: http://www.esru.strath.ac.uk/EandE/Web_sites/09-
10/Hybrid_systems/passivedesign.pdf 15 Jun. 2019.
FMLink. (2019). Climate Factors Affecting the Maintenance of Your Interior Building
Conditions and Energy Consumption. Retrieved from
https://fmlink.com/articles/climate-factors-affecting-the-maintenance-of-your-
interior-building-conditions-and-energy-consumption/
Gheorghe, A. V., Masera, M., & Katina, P. F. (Eds.). (2013). Infranomics: sustainability,
engineering design and governance (Vol. 24). Springer Science & Business Media.
Green Passive Solar Magazine. (2019). Southern Facing Windows in Passive Solar
Houses Retrieved from https://greenpassivesolar.com/passive-solar/building-
characteristics/orientation-south-facing-windows
Hemsath, T. L., & Bandhosseini, K. A. (2015). Sensitivity analysis evaluating basic
building geometry's effect on energy use. Renewable Energy, 76, 526-538.

58
Improving the Thermal Performance of the Building Envelope ,Global CCS Institute.
(2016). Retrieve 16 2019 june from https://www.slideshare.net/RohitKumar79/7-
shading
Kamal, M. A. (2012). An overview of passive cooling techniques in buildings: design
concepts and architectural interventions. Acta Technica Napocensis: Civil
Engineering & Architecture, 55(1), 84-97.
Kumar, S. (2017). Natural ventilation for Building Artitechture. Retrieved from
https://www.slideshare.net/sarathkumar388/natural-ventilation-for-building-
artitechture
Lecture presentation of Climatology subject presented at the MBS School of Planning and
Architecture.
Manzan, M. (2014). Genetic optimization of external fixed shading devices. Energy and
Buildings, 72, 431-440.
Math.nus.edu.sg. (2019). Available at: http://www.math.nus.edu.sg/~mathelmr/gem-
projects/hm/0304-1-66-sun_and_architecture.pdf 15 Jun. 2019
Mirdanies, M. (2015). Astronomy algorithm simulation for two degrees of freedom of
solar tracking mechanism using Clanguage. Energy Procedia, 68, 60-67.
Mulyansaka, P. (2013). Evaluation of Energy and Enivironment conservation measures for
an office building: Case Study: Kampala-Uganda, National Environmental
Management Authority House.
NZEB. (2019). Shading Retrieved from http://www.nzeb.in/knowledge-centre/passive-
design/shading
Olgyay, V. (2015). Design with Climate: Bioclimatic Approach to Architectural
Regionalism-New and expanded Edition. Princeton university press.
Passive Design. (2019). Retrieved from ttp://www.esru.strath.ac.uk/EandE/Web_sites/09-
10/Hybrid_systems/passivedesign.pd

59
Passive design. (2019). Retrieved from http://www.esru.strath.ac.uk/EandE/Web_sites/09-
10/Hybrid_systems/passivedesign.pdf
Pinterić, M. (2017). Building Physics. Fakulteta za gradbeništvo, prometno inženirstvo in
arhitekturo UM, Springer.
Priatman, J., Soegihardjo, O., & Loekita, S. (2015). Towards energy efficient facade
through solar-powered shading device. Procedia-Social and Behavioral
Sciences, 179, 266-275.
Ramos Ruiz, G., & Fernández Bandera, C. Importance of orientation in building energy-
savings.
Robertson, G. (2009). Passive Design Toolkit for The City Vancouver.
Robertson, G. (2009). Passive Design Toolkit for The City Vancouver.
Services, U. (2019). UT Knoxville | CoAD | UT Zero | Natural Ventilation. Retrieved
from http://utzero.utk.edu/SmartLab/ventilation.shtml
Simplified, L. (2019). Factors Affecting Temperature. Retrieved from
https://www.kullabs.com/classes/subjects/units/lessons/notes/note-detail/1198
Smith, P. F. (2001). Architecture in a climate of change. Oxford: Architectural Press
Subhashini, S., & Thirumaran, K. (2018). A passive design solution to enhance thermal
comfort in an educational building in the warm humid climatic zone of
Madurai. Journal of Building Engineering, 18, 395-407.
Szokolay, S. (2012). Introduction to architectural science. Routledge.
Varoğlu, S. E., & Altın, M. (2017). A Method Developed for Determining the Optimum
Orientation and the Optimum Shading of School Buildings in Warm Climatic
Regions. Eurasia Journal of Mathematics, Science and Technology
Education, 13(12), 7637-7649.
Wang, W., Rivard, H., & Zmeureanu, R. (2006). Floor shape optimization for green
building design. Advanced Engineering Informatics, 20(4), 363-378.

60
Whang, S. W., & Kim, S. (2014). Determining sustainable design management using
passive design elements for a zero emission house during the schematic design.
Energy and Buildings, 77, 304-312
Wimmers, G. (2009). Passive Design Toolkit, for homes. Light House Sustainable
Building Centre.
WorldAtlas. (2019). Where is Al Bayda', Libya. Available at:
https://www.worldatlas.com/af/ly/ja/where-is-al-bayda.html, Accessed 20 Jan.
2019.