Serum Levels and Removal by Haemodialysis and ...
19
International Journal of Molecular Sciences Communication Serum Levels and Removal by Haemodialysis and Haemodiafiltration of Tryptophan-Derived Uremic Toxins in ESKD Patients Joosep Paats 1, *, Annika Adoberg 2 , Jürgen Arund 1 , Annemieke Dhondt 3 , Anders Fernström 4 , Ivo Fridolin 1, * , Griet Glorieux 3 , Liisi Leis 2 , Merike Luman 1,2 , Emilio Gonzalez-Parra 5 , Vanessa Maria Perez-Gomez 5 , Kristjan Pilt 1 , Didier Sanchez-Ospina 5 , Mårten Segelmark 4 , Fredrik Uhlin 1,4 and Alberto Arduan Ortiz 5 1 Department of Health Technologies, Tallinn University of Technology, 19086 Tallinn, Estonia; [email protected] (J.A.); [email protected] (M.L.); [email protected] (K.P.); [email protected] (F.U.) 2 Centre of Nephrology, North Estonia Medical Centre, 13419 Tallinn, Estonia; [email protected] (A.A.), [email protected] (L.L.) 3 Nephrology Division, Ghent University Hospital, 9000 Ghent, Belgium; [email protected] (A.D.); [email protected] (G.G.) 4 Department of Nephrology and Department of Medicine and Health Science, Linköping University, 58185 Linköping, Sweden; [email protected] (A.F.); [email protected] (M.S.) 5 Fundación Jiménez Díaz University Hospital Health Research Institute, 28040 Madrid, Spain; [email protected] (E.G.-P.); [email protected] (V.M.P.-G.); [email protected] (D.S.-O.); [email protected] (A.A.O.) * Correspondence: [email protected] (J.P.); [email protected] (I.F.) Received: 5 February 2020; Accepted: 21 February 2020; Published: 23 February 2020 Abstract: Tryptophan is an essential dietary amino acid that originates uremic toxins that contribute to end-stage kidney disease (ESKD) patient outcomes. We evaluated serum levels and removal during haemodialysis and haemodiafiltration of tryptophan and tryptophan-derived uremic toxins, indoxyl sulfate (IS) and indole acetic acid (IAA), in ESKD patients in different dialysis treatment settings. This prospective multicentre study in four European dialysis centres enrolled 78 patients with ESKD. Blood and spent dialysate samples obtained during dialysis were analysed with high-performance liquid chromatography to assess uremic solutes, their reduction ratio (RR) and total removed solute (TRS). Mean free serum tryptophan and IS concentrations increased, and concentration of IAA decreased over pre-dialysis levels (67%, 49%, -0.8%, respectively) during the first hour of dialysis. While mean serum total urea, IS and IAA concentrations decreased during dialysis (-72%, -39%, -43%, respectively), serum tryptophan levels increased, resulting in negative RR (-8%) towards the end of the dialysis session (p < 0.001), despite remarkable Trp losses in dialysate. RR and TRS values based on serum (total, free) and dialysate solute concentrations were lower for conventional low-flux dialysis (p < 0.001). High-efficiency haemodiafiltration resulted in 80% higher Trp losses than conventional low-flux dialysis, despite similar neutral Trp RR values. In conclusion, serum Trp concentrations and RR behave differently from uremic solutes IS, IAA and urea and Trp RR did not reflect dialysis Trp losses. Conventional low-flux dialysis may not adequately clear Trp-related uremic toxins while high efficiency haemodiafiltration increased Trp losses. Keywords: uremic toxins; tryptophan; tryptophan-derived uremic toxins; indoxyl sulfate; indole-3 acetic acid; end-stage kidney disease; chronic kidney disease; haemodialysis; haemodiafiltration Int. J. Mol. Sci. 2020, 21, 1522; doi:10.3390/ijms21041522 www.mdpi.com/journal/ijms
-
Upload
khangminh22 -
Category
Documents
-
view
7 -
download
0
Transcript of Serum Levels and Removal by Haemodialysis and ...

International Journal of
Molecular Sciences
Communication
Serum Levels and Removal by Haemodialysis andHaemodiafiltration of Tryptophan-Derived UremicToxins in ESKD Patients
Joosep Paats 1,*, Annika Adoberg 2, Jürgen Arund 1, Annemieke Dhondt 3, Anders Fernström 4,Ivo Fridolin 1,* , Griet Glorieux 3 , Liisi Leis 2, Merike Luman 1,2, Emilio Gonzalez-Parra 5,Vanessa Maria Perez-Gomez 5, Kristjan Pilt 1, Didier Sanchez-Ospina 5, Mårten Segelmark 4,Fredrik Uhlin 1,4 and Alberto Arduan Ortiz 5
1 Department of Health Technologies, Tallinn University of Technology, 19086 Tallinn, Estonia;[email protected] (J.A.); [email protected] (M.L.); [email protected] (K.P.);[email protected] (F.U.)
2 Centre of Nephrology, North Estonia Medical Centre, 13419 Tallinn, Estonia;[email protected] (A.A.), [email protected] (L.L.)
3 Nephrology Division, Ghent University Hospital, 9000 Ghent, Belgium; [email protected] (A.D.);[email protected] (G.G.)
4 Department of Nephrology and Department of Medicine and Health Science, Linköping University,58185 Linköping, Sweden; [email protected] (A.F.); [email protected] (M.S.)
5 Fundación Jiménez Díaz University Hospital Health Research Institute, 28040 Madrid, Spain;[email protected] (E.G.-P.); [email protected] (V.M.P.-G.); [email protected] (D.S.-O.);[email protected] (A.A.O.)
* Correspondence: [email protected] (J.P.); [email protected] (I.F.)
Received: 5 February 2020; Accepted: 21 February 2020; Published: 23 February 2020�����������������
Abstract: Tryptophan is an essential dietary amino acid that originates uremic toxins that contributeto end-stage kidney disease (ESKD) patient outcomes. We evaluated serum levels and removal duringhaemodialysis and haemodiafiltration of tryptophan and tryptophan-derived uremic toxins, indoxylsulfate (IS) and indole acetic acid (IAA), in ESKD patients in different dialysis treatment settings. Thisprospective multicentre study in four European dialysis centres enrolled 78 patients with ESKD. Bloodand spent dialysate samples obtained during dialysis were analysed with high-performance liquidchromatography to assess uremic solutes, their reduction ratio (RR) and total removed solute (TRS).Mean free serum tryptophan and IS concentrations increased, and concentration of IAA decreasedover pre-dialysis levels (67%, 49%, −0.8%, respectively) during the first hour of dialysis. Whilemean serum total urea, IS and IAA concentrations decreased during dialysis (−72%, −39%, −43%,respectively), serum tryptophan levels increased, resulting in negative RR (−8%) towards the end ofthe dialysis session (p < 0.001), despite remarkable Trp losses in dialysate. RR and TRS values based onserum (total, free) and dialysate solute concentrations were lower for conventional low-flux dialysis(p < 0.001). High-efficiency haemodiafiltration resulted in 80% higher Trp losses than conventionallow-flux dialysis, despite similar neutral Trp RR values. In conclusion, serum Trp concentrations andRR behave differently from uremic solutes IS, IAA and urea and Trp RR did not reflect dialysis Trplosses. Conventional low-flux dialysis may not adequately clear Trp-related uremic toxins while highefficiency haemodiafiltration increased Trp losses.
Keywords: uremic toxins; tryptophan; tryptophan-derived uremic toxins; indoxyl sulfate; indole-3acetic acid; end-stage kidney disease; chronic kidney disease; haemodialysis; haemodiafiltration
Int. J. Mol. Sci. 2020, 21, 1522; doi:10.3390/ijms21041522 www.mdpi.com/journal/ijms

Int. J. Mol. Sci. 2020, 21, 1522 2 of 19
1. Introduction
Tryptophan (Trp) is an essential amino acid that is obtained through diet. However dietary Trpuptake is among the lowest for amino acids [1]. Besides contributing to proteins structure, Trp is theonly amino acid that binds to a protein—albumin [2–4]. Thus, serum includes both albumin-boundTrp and free Trp, with the latter pool being available for tissue uptake [2,4]. Trp is mainly used forprotein synthesis, but also for synthesis of important bioactive molecules such as kynurenine, serotonin,tryptamine, and melatonin [5]. In contrast to other amino acids, healthy kidney excretion of Trp isnegligible (around 0.5% of creatinine clearance), leading to quite stable serum Trp concentrations [1,6,7].While an oral Trp overload may transiently increase serum Trp, this does not result in increased kidneyexcretion of Trp [6,8]. Rather, Trp metabolites are increased in urine.
Ingested Trp is metabolized by gut microbiota to kynurenine, serotonin, and indole with itsderivates [9]. Indole derivates from the gut microbiota include several solutes classified as uremictoxins, such as indoxyl sulfate (IS) and indole acetic acid (IAA), based on their biological effectsand associations with outcome in ESKD patients [10]. ESKD is usually treated with haemodialysis.However, haemodialysis does not selectively remove toxic uremic solutes, it removes also neutraland necessary solutes, including amino acids [11] such as Trp [12–17], potentially contributing tothe negative impact of haemodialysis. In addition, uraemia-associated disruption of biochemicalhomeostasis (e.g., low concentrations of Trp due to malnutrition and removal by haemodialysis),are also suspected to negatively contribute to patient well-being [18–20].
Haemodialysis has been reported to be a low-efficient method to remove protein-bound uremictoxins, as only free solute is available for removal [21]. Protein-bound uremic toxins include Trpmetabolites and the albumin-bound indole derivates IS and IAA [22–24]. Both solutes are widelyacknowledged as uremic toxins that impair biological pathways and patient outcome [10,25,26]. To ourknowledge, there are no published studies reporting both total and free uremic serum levels, removaland rebound-effect of Trp combined with indolic protein-bound uremic toxins, and the multicentrehaemodialysis studies are scarce [26–31].
The aim of this multicentre clinical study was to evaluate serum levels and removalduring haemodialysis and haemodiafiltration of Trp and Trp-derived uremic toxins, IS and IAA,in ESKD patients.
2. Results
A total of 78 haemodialysis patients were studied. As detailed in “Material and Methods”, 78%were male and mean age was 63 ± 16 years. Table 1 presents the total and free pre-dialysis soluteconcentrations by centre for all dialysis sessions.
Table 1. Mean pre-dialysis serum solute concentrations and standard deviations of patients by centre(in µmol/L, except for urea in mmol/L) 1.
Solutes All (n = 78) Centre 1(n = 22)
Centre 2(n = 21)
Centre 3(n = 15)
Centre 4(n = 20)
Total Trp 29.3 ± 8.0 29.00 ± 6.28 32.6 ± 9.7 ** 27.7 ± 8.8 ◦◦ 27.3 ± 6.0 ◦◦◦
IS 107.6 ± 51.2 94.8 ± 47.6 121.4 ± 57.0 ** 98.5 ± 55.5 ◦ 113.6 ± 40.0 **IAA 11.8 ± 9.2 13.5 ± 13.8 11.4 ± 5.9 11.3 ± 7.3 10.9 ± 6.7
Free Trp 6.41 ± 2.07 6.22 ± 2.02 6.30 ± 1.63 5.54 ± 1.57 */◦◦ 7.39 ± 2.50 **/◦◦/§
IS 14.7 ± 8.7 11.3 ± 5.8 15.0 ± 9.1 12.7 ± 7.8 19.4 ± 9.4 ***/◦◦/§
IAA 2.91 ± 2.00 3.08 ± 2.55 2.72 ± 1.68 2.61 ± 1.30 3.18 ± 2.06Urea 19.1 ± 5.9 21.2 ± 7.3 16.8 ± 4.1 *** 18.7 ± 6.5 */◦ 19.6 ± 4.4 ◦◦◦
1 The statistical differences are marked as *** p < 0.001; ** p < 0.01; * p < 0.05 vs. Centre 1; ◦◦◦ p < 0.001; ◦◦ p < 0.01;◦ p < 0.05 vs. Centre 2; § p < 0.001 vs. Centre 3.
The pre-dialysis levels of total and free IAA are comparable among the four different dialysiscentres, being significantly lower than levels of IS. Pre-dialysis Trp, IS and urea levels seem to have

Int. J. Mol. Sci. 2020, 21, 1522 3 of 19
rather nonsystematic differences between the centres. Centre 2 had the highest levels of Trp and IS.The largest differences correspond to free Trp levels. However, free Trp levels were similar in patientsdialysed in centre 1 and in centre 2. In general, the free:total Trp ratio (mean 0.23 ± 0.08) was higherthan the 0.15 previously reported for healthy populations [8].
Mean total and free serum concentrations and total dialysate concentrations of Trp, IS, IAAand urea at different time points during the dialysis are shown in Figure 1. During dialysis, totaland dialysate IS, IAA and urea levels decrease. Contrary to other uremic solutes, mean total Trpconcentration increased towards the end of the session (p < 0.001). Interestingly, the mean free serumTrp and IS concentrations increased during the first hour of the dialysis sessions compared to the initialpre-dialysis levels (Figure 1b) (p < 0.001). Generally, dialysate values (Figure 1c) followed the totalserum concentration pattern.
Int. J. Mol. Sci. 2020, 20, x FOR PEER REVIEW 3 of 20
The pre-dialysis levels of total and free IAA are comparable among the four different dialysis centres, being significantly lower than levels of IS. Pre-dialysis Trp, IS and urea levels seem to have rather nonsystematic differences between the centres. Centre 2 had the highest levels of Trp and IS. The largest differences correspond to free Trp levels. However, free Trp levels were similar in patients dialysed in centre 1 and in centre 2. In general, the free:total Trp ratio (mean 0.23 ± 0.08) was higher than the 0.15 previously reported for healthy populations [8].
Mean total and free serum concentrations and total dialysate concentrations of Trp, IS, IAA and urea at different time points during the dialysis are shown in Figure 1. During dialysis, total and dialysate IS, IAA and urea levels decrease. Contrary to other uremic solutes, mean total Trp concentration increased towards the end of the session (p < 0.001). Interestingly, the mean free serum Trp and IS concentrations increased during the first hour of the dialysis sessions compared to the initial pre-dialysis levels (Figure 1b) (p < 0.001). Generally, dialysate values (Figure 1c) followed the total serum concentration pattern.
(a)
(b)
Figure 1. Cont.

Int. J. Mol. Sci. 2020, 21, 1522 4 of 19
Int. J. Mol. Sci. 2020, 20, x FOR PEER REVIEW 4 of 20
(c)
Figure 1. Mean ± SD concentrations at different time points during the dialysis sessions for Trp, IS, IAA (µmol/L) and urea (mmol/L) for (a) total serum values (n = 310); (b) free serum values (n = 310); and (c) dialysate values (n = 257). *** p < 0.001; ** p < 0.01; * p < 0.05 vs. previous timepoint value.
The mean total and free serum and dialysate Trp, IS, IAA and urea concentrations normalized for the baseline pre-dialysis value at different time points during the dialysis sessions are shown in appendix A. The normalized concentrations show similar trends to absolute values shown in Figure 1, however the increase of free serum Trp and IS during the first hour of the dialysis sessions compared to the initial pre-dialysis levels is accentuated.
Reduction ratios (RR) at different time points during the dialysis sessions for Trp, IS, IAA and urea were calculated for total and free serum concentration (Figure 2). The mean RR for Trp behaved significantly different from other uremic solutes. The variability in RR was largest for total and free Trp. As expected, urea RR were higher than RR for Trp and its derivatives. The rebound effect based on the 30 min post-dialysis serum value for the different solutes significantly affected the RR value (p < 0.001 and p < 0.05 for Trp).
(a)
Figure 1. Mean ± SD concentrations at different time points during the dialysis sessions for Trp, IS,IAA (µmol/L) and urea (mmol/L) for (a) total serum values (n = 310); (b) free serum values (n = 310);and (c) dialysate values (n = 257). *** p < 0.001; ** p < 0.01; * p < 0.05 vs. previous timepoint value.
The mean total and free serum and dialysate Trp, IS, IAA and urea concentrations normalizedfor the baseline pre-dialysis value at different time points during the dialysis sessions are shown inAppendix A. The normalized concentrations show similar trends to absolute values shown in Figure 1,however the increase of free serum Trp and IS during the first hour of the dialysis sessions comparedto the initial pre-dialysis levels is accentuated.
Reduction ratios (RR) at different time points during the dialysis sessions for Trp, IS, IAA andurea were calculated for total and free serum concentration (Figure 2). The mean RR for Trp behavedsignificantly different from other uremic solutes. The variability in RR was largest for total and freeTrp. As expected, urea RR were higher than RR for Trp and its derivatives. The rebound effect basedon the 30 min post-dialysis serum value for the different solutes significantly affected the RR value(p < 0.001 and p < 0.05 for Trp).
Int. J. Mol. Sci. 2020, 20, x FOR PEER REVIEW 4 of 20
(c)
Figure 1. Mean ± SD concentrations at different time points during the dialysis sessions for Trp, IS, IAA (µmol/L) and urea (mmol/L) for (a) total serum values (n = 310); (b) free serum values (n = 310); and (c) dialysate values (n = 257). *** p < 0.001; ** p < 0.01; * p < 0.05 vs. previous timepoint value.
The mean total and free serum and dialysate Trp, IS, IAA and urea concentrations normalized for the baseline pre-dialysis value at different time points during the dialysis sessions are shown in appendix A. The normalized concentrations show similar trends to absolute values shown in Figure 1, however the increase of free serum Trp and IS during the first hour of the dialysis sessions compared to the initial pre-dialysis levels is accentuated.
Reduction ratios (RR) at different time points during the dialysis sessions for Trp, IS, IAA and urea were calculated for total and free serum concentration (Figure 2). The mean RR for Trp behaved significantly different from other uremic solutes. The variability in RR was largest for total and free Trp. As expected, urea RR were higher than RR for Trp and its derivatives. The rebound effect based on the 30 min post-dialysis serum value for the different solutes significantly affected the RR value (p < 0.001 and p < 0.05 for Trp).
(a)
Figure 2. Cont.

Int. J. Mol. Sci. 2020, 21, 1522 5 of 19
Int. J. Mol. Sci. 2020, 20, x FOR PEER REVIEW 5 of 20
(b)
Figure 2. Reduction ratios (RR) at different time points during the dialysis sessions for Trp, IS, IAA and urea calculated from (a) total serum values (n = 309) and (b) free serum values (n = 309). *** p < 0.001; ** p < 0.01; * p < 0.05 vs. previous timepoint value.
RR at different time points during the dialysis sessions for Trp, IS, IAA and urea calculated based on the dialysate concentrations are shown on Figure 3.
Figure 3. Reduction ratios (RR) at different time points during the dialysis sessions for Trp, IS, IAA and urea calculated from the dialysate values (n = 244). *** p < 0.001; ** p < 0.01; * p < 0.05 vs. previous timepoint value.
The mean RRs for Trp are significantly different from other uremic solutes. The trends in RR based on dialysate values are similar to RRs based on total and free serum concentrations, except for negative displacer effect at 60 min for free Trp and free IS. For urea, which is not bound to protein, RRs at 240 min, calculated based on the dialysate values, are similar to RR based on serum concentration.
Figure 2. Reduction ratios (RR) at different time points during the dialysis sessions for Trp, IS, IAA andurea calculated from (a) total serum values (n = 309) and (b) free serum values (n = 309). *** p < 0.001;** p < 0.01; * p < 0.05 vs. previous timepoint value.
RR at different time points during the dialysis sessions for Trp, IS, IAA and urea calculated basedon the dialysate concentrations are shown on Figure 3.
Int. J. Mol. Sci. 2020, 20, x FOR PEER REVIEW 5 of 20
(b)
Figure 2. Reduction ratios (RR) at different time points during the dialysis sessions for Trp, IS, IAA and urea calculated from (a) total serum values (n = 309) and (b) free serum values (n = 309). *** p < 0.001; ** p < 0.01; * p < 0.05 vs. previous timepoint value.
RR at different time points during the dialysis sessions for Trp, IS, IAA and urea calculated based on the dialysate concentrations are shown on Figure 3.
Figure 3. Reduction ratios (RR) at different time points during the dialysis sessions for Trp, IS, IAA and urea calculated from the dialysate values (n = 244). *** p < 0.001; ** p < 0.01; * p < 0.05 vs. previous timepoint value.
The mean RRs for Trp are significantly different from other uremic solutes. The trends in RR based on dialysate values are similar to RRs based on total and free serum concentrations, except for negative displacer effect at 60 min for free Trp and free IS. For urea, which is not bound to protein, RRs at 240 min, calculated based on the dialysate values, are similar to RR based on serum concentration.
Figure 3. Reduction ratios (RR) at different time points during the dialysis sessions for Trp, IS, IAA andurea calculated from the dialysate values (n = 244). *** p < 0.001; ** p < 0.01; * p < 0.05 vs. previoustimepoint value.
The mean RRs for Trp are significantly different from other uremic solutes. The trends in RRbased on dialysate values are similar to RRs based on total and free serum concentrations, except fornegative displacer effect at 60 min for free Trp and free IS. For urea, which is not bound to protein, RRsat 240 min, calculated based on the dialysate values, are similar to RR based on serum concentration.

Int. J. Mol. Sci. 2020, 21, 1522 6 of 19
Figure 4 illustrates RRs at 240 min (Figure 4a–c) and total solute removal of urea, Trp, IS and IAAcalculated as average over all dialysis sessions (Figure 4d) for different dialysis modalities and settings.
Int. J. Mol. Sci. 2020, 20, x FOR PEER REVIEW 6 of 20
Figure 4 illustrates RRs at 240 min (Figure 4a–c) and total solute removal of urea, Trp, IS and IAA calculated as average over all dialysis sessions (Figure 4d) for different dialysis modalities and settings.
(a)
(b)
Figure 4. Cont.

Int. J. Mol. Sci. 2020, 21, 1522 7 of 19Int. J. Mol. Sci. 2020, 20, x FOR PEER REVIEW 7 of 20
(c)
(d)
Figure 4. Reduction ratios (RR) and total removal of solute (TRS) calculated for urea, Trp, IS and IAA from the start and end (240 min) of the dialysis session for different dialysis modalities and settings: (a) RRs assessed from total serum concentrations (n = 77); (b) RRs assessed from free serum concentrations (n = 77); (c) RRs assessed from spent dialysate concentrations (n = 53); and (d) TRS of urea (in mmol), Trp, IS and IAA (in µmol) (n = 74). *** p < 0.001; ** p < 0.01; * p < 0.05 vs. previous modality value.
RR and TRS values for urea, IS and IAA for different dialysis modalities and settings behave similarly (Figure 4): mean RR and TRS values are significantly lower for the conventional low-flux dialysis than for other dialysis settings (p < 0.001). However, Trp RR values were close to, equal or even below zero and especially the latter two are not representative of real removal of Trp measured by TRS. TRS of Trp was remarkable, given that urine excretion in healthy subjects is negligible, and was very responsive to dialysis modality, with losses being 80% higher on highHDF than on lowHD.
Figure 4. Reduction ratios (RR) and total removal of solute (TRS) calculated for urea, Trp, IS and IAAfrom the start and end (240 min) of the dialysis session for different dialysis modalities and settings: (a)RRs assessed from total serum concentrations (n = 77); (b) RRs assessed from free serum concentrations(n = 77); (c) RRs assessed from spent dialysate concentrations (n = 53); and (d) TRS of urea (in mmol),Trp, IS and IAA (in µmol) (n = 74). *** p < 0.001; ** p < 0.01; * p < 0.05 vs. previous modality value.
RR and TRS values for urea, IS and IAA for different dialysis modalities and settings behavesimilarly (Figure 4): mean RR and TRS values are significantly lower for the conventional low-fluxdialysis than for other dialysis settings (p < 0.001). However, Trp RR values were close to, equal oreven below zero and especially the latter two are not representative of real removal of Trp measured byTRS. TRS of Trp was remarkable, given that urine excretion in healthy subjects is negligible, and wasvery responsive to dialysis modality, with losses being 80% higher on highHDF than on lowHD (seeTable 3 for dialysis settings).

Int. J. Mol. Sci. 2020, 21, 1522 8 of 19
3. Discussion
This multicentre clinical study reports the total and free serum levels, removal by haemodialysisand haemodiafiltration and rebound-effect of Trp and indolic protein-bound uremic toxins, IS andIAA, in ESKD patients. The main findings of the study were: (1) Pre-dialysis serum Trp, IS and urealevels had nonsystematic variability but there was no statistically significant difference in pre-dialytictotal and free serum IAA levels of ESKD patients from participating clinical centres. (2) Total serumand dialysate Trp do not decrease at the end of haemodialysis, and may even increase, contrary touremic solutes. This results in negative RR values for the total serum Trp or almost constant RR valuesfor dialysate Trp at the end of treatment, respectively, which are not representative of real removal ofTrp as assessed by TRS. (3) In this regard, Trp removal was remarkable and very responsive to dialysismodality. (4) Free serum Trp and IS concentrations increase over pre-dialysis levels during the firsthour of dialysis sessions. (5) The RR values calculated from dialysate values reflect RR trends for totaland free urea, IS and IAA calculated from serum samples.
Standard dialysis regimes applied to different populations with potentially different dietaryhabits, genetic background, microbiota or even standards of care in different centres may explainthe differences in baseline pre-dialysis Trp, IS and urea levels between centres. These differencesemphasize the need to perform multicentre studies including geographically dispersed and culturallyand genetically different centres. Subjects with residual renal function excrete Trp metabolites althoughin healthy subjects urinary Trp excretion is negligible and in dialysis patients only 0.3% of dietaryTrp intake was excreted in urine [6,12]. In healthy subjects, an oral Trp overload leads to a transientincrease in serum Trp [6]. However, earlier studies did not find any associations between plasma Trpconcentration and Trp intake in dialysis patients, suggesting a key role for gut microbiota and liver inmetabolizing dietary Trp [12,32]. Since our study enrolled participants from different centres acrossEurope, different dietary habits and differences in gut microbiota can be considered. It is noteworthythat the highest levels of total Trp and IS were observed in the centre with highest total serum proteinlevels, although free Trp was not higher.
Dietary Trp is metabolized by gut bacteria and the liver and incorporated into proteins and isexcreted in urine as Trp metabolites. Gut bacteria Trp metabolism leads to the production of indoleand IAA, which behave as or are precursors of uremic toxins [9,33]. Indole biosynthesis from dietaryTrp is catalysed by a single-step reaction involving a specific Trpase (EC 4.1.99.1) [34]. The keyenzyme for the production of IAA is indolepyruvate decarboxylase (EC 4.1.1.74), which catalyses theconversion of indolepyruvate to indole-3-acetaldehyde [35]. Trp, indole and IAA are absorbed intothe circulation where indole is metabolised at the liver to IS and indoxyl glucuronide, while Trp isfurther metabolised mostly to kynurenine, but in small fraction also to the important neurotransmitterserotonin in the brain [7]. Trp metabolism is regulated by plasma free Trp levels [36]. In the presentstudy, total serum Trp levels were comparable to recent reports in dialysis patients and lower thanin healthy populations [12]. In this regard, plasma Trp levels are nearly 60% lower at stage 5 CKDthan at stage 1 [37]. Interestingly, low serum Trp has been associated with adverse cardiovascularoutcomes and mortality in the general population [38,39] and dialysis patients are at an increased riskof cardiovascular disease and death.
Trp depletion is common in haemodialysis patients. Factors potentially contributing to Trpdepletion are reduced dietary Trp intake; increased catabolism due to an inflammatory status andlosses during dialysis. Currently, little is known about Trp homeostasis in haemodialysis patients [12].Although we do not have data on Trp intake, Trp intake was reported to be well above the dietaryrecommendations in Dutch haemodialysis patients and only 5% of dietary Trp intake was removed byhaemodialysis when normalized for 24 h. While most Trp is metabolized and excreted as metabolites,haemodialysis Trp removal is unregulated and well above kidney excretion and takes place withina brief time frame. Thus, it was recently reported that 10% of dietary Trp was removed in a singlehaemodialysis session [12]. We now report that this may be influenced by dialysis modality, and,

Int. J. Mol. Sci. 2020, 21, 1522 9 of 19
assuming similar dietary Trp as previously reported for haemodialysis patients, Trp removal during asingle high efficiency HDF session may reach 16% of 24 h dietary intake.
We now confirm in a larger study of more heterogeneous patients that the high Trp removal rateduring haemodialysis is not accompanied by decreased serum Trp levels. Indeed, mean total serum Trpincreased during dialysis. The cause of this phenomenon is currently unknown [12]. An associationbetween increased plasma Trp during the haemodialysis session and a lower risk of mortality wasfound in a small study of 40 patients [12]. While the authors speculated that increased serum Trp duringdialysis appears to be protective, causality is difficult to assign in observational studies. Thus, increasein serum Trp during dialysis may represent a strong impact of the dialysis procedure and/or Trp removalduring dialysis that drive profound changes in Trp generation, metabolism and/or transport acrossmembranes. Thus, in contrast to indole and IAA, which only originate from the intestine, Trp may beingested or generated endogenously from muscle proteolysis and released into the circulation [40,41].In this regard, an alternative hypothesis is that the phenomenon is not necessarily protective, but mayidentify individuals capable of mounting such a response and these may be the healthier individuals.
It can be speculated whether dialysis itself may modify Trp binding to albumin, perhaps causinga shift or binding competition between Trp and its indolic metabolites, similarly to that described foruremic serum 40 years ago [42]. In this regard, an early (60 min) increase in free Trp is observed but itis not maintained during the full dialysis session. The early increase in free solute was also observedfor IS. The reason could be a modified albumin binding capacity during dialysis due to administeredheparin [43]. Thus, heparin provokes the release of lipolytic enzymes [44], leading to hydrolysis oftriglycerides and release of free fatty acid and increasing their plasma concentrations. It has beenshown that free fatty acids displace drugs and ligands (also for IS, IAA and Trp) from their proteinbinding sites [45,46] and that Trp increases displacement of IS and IAA [47]. IS, IAA and Trp primarilybind to Sudlow site II on albumin, with IS having the highest affinity [47–50]. The effect may differbetween patients due to different plasma levels of ligands and uremic toxins that compete for the samebinding site on albumin.
The RR and TRS values behaved similarly for different dialysis modalities and settings for urea,IS and IAA as mean RR and TRS values were significantly lower for conventional low-flux dialysisthan for other dialysis settings for all solutes (p < 0.001), which is in good relation with results of theprevious studies [51,52]. However, Trp RR values were not influenced by dialysis modality. Thus,despite Trp being removed by dialysis, as TRS was well over zero, Trp RR values remained close to zeroor even negative with all dialysis modalities. In different studies, the same has been noted [12,42,53,54].This means that to assess Trp removal, only TRS provides an adequate estimation, while serum Trplevels and Trp RR do not.
The major strength of this study is the prospective, multicentre and interventional design testinga larger and more diverse sample size than prior studies. Nevertheless, some limitations should beacknowledged. Thus, dietary Trp data were not available and enrolled patients and dialysis centresmay not be fully representative of the countries represented. Additionally, no attempts were made atdisplacing uremic solutes from proteins by administering displacers to patients, since this does notrepresent routine clinical care.
The Trp findings should be put in context with the behaviour of other amino acids duringhaemodialysis and haemodiafiltration. Haemodialysis patients have lower plasma total andnonessential amino acid concentrations than controls and similar essential and branched amino acidconcentrations [55]. Loss of amino acids during haemodialysis is thought to potentially contribute tomalnutrition. Thus, in a recent study, a single haemodialysis session resulted in the loss of 11.95 ± 0.69 gamino acids via the dialysate, of which 8.26 ± 0.46 g were nonessential amino acids, 3.69 ± 0.31 gwere essential amino acids, and 1.64 ± 0.17 g were branched-chain amino acids. As a consequence,plasma total and essential amino acids concentrations declined significantly from 2.88 ± 0.15 and0.80 ± 0.05 mmol/L to 2.27 ± 0.11 and 0.66 ± 0.05 mmol/L, respectively [56]. Haemodiafiltrationincreased total amino acid losses by 2.5% versus high efficiency haemodialysis and this was statistically

Int. J. Mol. Sci. 2020, 21, 1522 10 of 19
significant [55]. In acute kidney injury, additional modalities of renal replacement therapy are usedthat increase amino acid loses. Thus, continuous veno-venous hemofiltration resulted in threefoldhigher amino acid losses that haemodialysis and sustained low-efficiency diafiltration in 50% higherlosses than haemodialysis [13].
In conclusion, in a multicentre study encompassing patients from diverse European countries,serum Trp concentrations and RR during haemodialysis behaved differently from uremic solutesIS, IAA and urea, and Trp RR did not reflect dialysis Trp losses. Trp losses during dialysis mayrepresent up to 16% of daily intake and occur in the course of a few hours. This appears to triggeradaptive mechanisms that maintain serum Trp levels and, thus, aggravate dialysis Trp losses. Sincethe response of serum Trp during dialysis has been associated to outcomes in a prior study [12],unravelling the molecular mechanisms involved in maintaining serum Trp levels during dialysismay provide further insights into ESKD pathophysiology. In this regard, we will follow the presentprospective cohort long-term to assess the impact of the findings on outcomes. As additional findings,conventional low-flux dialysis may not adequately clear Trp-related uremic toxins while high efficiencyhaemodiafiltration increased Trp losses. The potential consequences of this differential impact ofdialysis modalities on Trp removal merits further studies.
4. Materials and Methods
Clinical study data was acquired from four separate dialysis centres from countries with diverse lifeexpectancy, renal replacement therapy incidence and kidney transplant rates: (1) centre 1: North EstoniaMedical Centre, in Tallinn, Estonia (22 patients), (2) centre 2: Linköping University Hospital, in Linköping,Sweden, (21 patients) (3) centre 3: Ghent University Hospital, in Ghent, Belgium (15 patients). (4) centre 4:Fundación Jiménez Díaz University Hospital Health Research Institute, in Madrid, Spain (20 patients). Allstudies were performed after approval of the protocol by local ethics committees (Tallinn Medical ResearchEthics Committee at the National Institute for Health Development, Estonia, decision no. 2205 (issued27 Dec. 2017); Linköping Regional Medical Research Ethics Committee, Linköping, Sweden, decision no.2017/593-31 (issued 17 Jan. 2018); Ghent University Hospital, Commissie voor Medische Ethiek, Ghent,Belgium, decision no. B670201938627 (issued 15 Feb. 2019); Fundación Jiménez Díaz Clinical ResearchEthics Committee, Madrid, Spain, decisions (no. 9/18, issued 8 May 2018) and (no. 13/18, issued 10 Jul. 2018)(Figure 5). Informed consent was obtained from all participating patients. The informed consent templatesin local languages were developed for all dialysis centres. To assure the confidentiality, accuracy and securityof data and data management, all clinical information and biological samples and tissues obtained from theclinical networks were transmitted only after anonymization/blinding.
Int. J. Mol. Sci. 2020, 20, x FOR PEER REVIEW 10 of 20
higher amino acid losses that haemodialysis and sustained low-efficiency diafiltration in 50% higher losses than haemodialysis [13].
In conclusion, in a multicentre study encompassing patients from diverse European countries, serum Trp concentrations and RR during haemodialysis behaved differently from uremic solutes IS, IAA and urea, and Trp RR did not reflect dialysis Trp losses. Trp losses during dialysis may represent up to 16% of daily intake and occur in the course of a few hours. This appears to trigger adaptive mechanisms that maintain serum Trp levels and, thus, aggravate dialysis Trp losses. Since the response of serum Trp during dialysis has been associated to outcomes in a prior study [12], unravelling the molecular mechanisms involved in maintaining serum Trp levels during dialysis may provide further insights into ESKD pathophysiology. In this regard, we will follow the present prospective cohort long-term to assess the impact of the findings on outcomes. As additional findings, conventional low-flux dialysis may not adequately clear Trp-related uremic toxins while high efficiency haemodiafiltration increased Trp losses. The potential consequences of this differential impact of dialysis modalities on Trp removal merits further studies.
4. Materials and Methods
Clinical study data was acquired from four separate dialysis centres from countries with diverse life expectancy, renal replacement therapy incidence and kidney transplant rates: (1) centre 1: North Estonia Medical Centre, in Tallinn, Estonia (22 patients), (2) centre 2: Linköping University Hospital, in Linköping, Sweden, (21 patients) (3) centre 3: Ghent University Hospital, in Ghent, Belgium (15 patients). (4) centre 4: Fundación Jiménez Díaz University Hospital Health Research Institute, in Madrid, Spain (20 patients). All studies were performed after approval of the protocol by local ethics committees (Tallinn Medical Research Ethics Committee at the National Institute for Health Development, Estonia; Linköping Regional Medical Research Ethics Committee, Linköping, Sweden; Ghent University Hospital, Commissie voor Medische Ethiek, Ghent, Belgium Fundación Jiménez Díaz Clinical Research Ethics Committee, Madrid, Spain) (Figure 5). Informed consent was obtained from all participating patients. The informed consent templates in local languages were developed for all dialysis centres. To assure the confidentiality, accuracy and security of data and data management, all clinical information and biological samples and tissues obtained from the clinical networks were transmitted only after anonymization/blinding.
Figure 5. Location of centres and country life expectancy (GBD 2017 study) [57], renal replacement therapy (RRT) incidence and transplant rate (data from ERA-EDTA Registry, Belgium data correspond to Dutch-speaking Belgium) [58].
Figure 5. Location of centres and country life expectancy (GBD 2017 study) [57], renal replacementtherapy (RRT) incidence and transplant rate (data from ERA-EDTA Registry, Belgium data correspondto Dutch-speaking Belgium) [58].
Int. J. Mol. Sci. 2020, 21, 1522 11 of 19
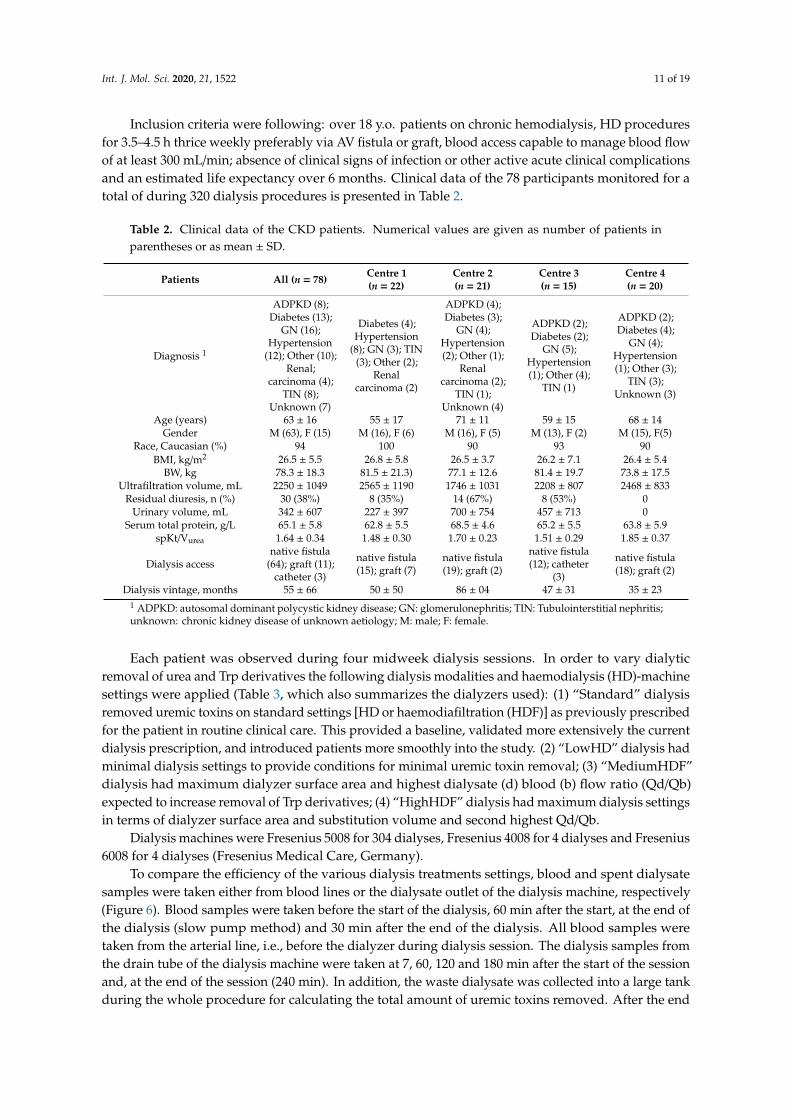
Inclusion criteria were following: over 18 y.o. patients on chronic hemodialysis, HD proceduresfor 3.5–4.5 h thrice weekly preferably via AV fistula or graft, blood access capable to manage blood flowof at least 300 mL/min; absence of clinical signs of infection or other active acute clinical complicationsand an estimated life expectancy over 6 months. Clinical data of the 78 participants monitored for atotal of during 320 dialysis procedures is presented in Table 2.
Table 2. Clinical data of the CKD patients. Numerical values are given as number of patients inparentheses or as mean ± SD.
Patients All (n = 78) Centre 1(n = 22)
Centre 2(n = 21)
Centre 3(n = 15)
Centre 4(n = 20)
Diagnosis 1
ADPKD (8);Diabetes (13);
GN (16);Hypertension
(12); Other (10);Renal;
carcinoma (4);TIN (8);
Unknown (7)
Diabetes (4);Hypertension
(8); GN (3); TIN(3); Other (2);
Renalcarcinoma (2)
ADPKD (4);Diabetes (3);
GN (4);Hypertension(2); Other (1);
Renalcarcinoma (2);
TIN (1);Unknown (4)
ADPKD (2);Diabetes (2);
GN (5);Hypertension(1); Other (4);
TIN (1)
ADPKD (2);Diabetes (4);
GN (4);Hypertension(1); Other (3);
TIN (3);Unknown (3)
Age (years) 63 ± 16 55 ± 17 71 ± 11 59 ± 15 68 ± 14Gender M (63), F (15) M (16), F (6) M (16), F (5) M (13), F (2) M (15), F(5)
Race, Caucasian (%) 94 100 90 93 90BMI, kg/m2 26.5 ± 5.5 26.8 ± 5.8 26.5 ± 3.7 26.2 ± 7.1 26.4 ± 5.4
BW, kg 78.3 ± 18.3 81.5 ± 21.3) 77.1 ± 12.6 81.4 ± 19.7 73.8 ± 17.5Ultrafiltration volume, mL 2250 ± 1049 2565 ± 1190 1746 ± 1031 2208 ± 807 2468 ± 833
Residual diuresis, n (%) 30 (38%) 8 (35%) 14 (67%) 8 (53%) 0Urinary volume, mL 342 ± 607 227 ± 397 700 ± 754 457 ± 713 0
Serum total protein, g/L 65.1 ± 5.8 62.8 ± 5.5 68.5 ± 4.6 65.2 ± 5.5 63.8 ± 5.9spKt/Vurea 1.64 ± 0.34 1.48 ± 0.30 1.70 ± 0.23 1.51 ± 0.29 1.85 ± 0.37
Dialysis accessnative fistula
(64); graft (11);catheter (3)
native fistula(15); graft (7)
native fistula(19); graft (2)
native fistula(12); catheter
(3)
native fistula(18); graft (2)
Dialysis vintage, months 55 ± 66 50 ± 50 86 ± 04 47 ± 31 35 ± 231 ADPKD: autosomal dominant polycystic kidney disease; GN: glomerulonephritis; TIN: Tubulointerstitial nephritis;unknown: chronic kidney disease of unknown aetiology; M: male; F: female.
Each patient was observed during four midweek dialysis sessions. In order to vary dialyticremoval of urea and Trp derivatives the following dialysis modalities and haemodialysis (HD)-machinesettings were applied (Table 3, which also summarizes the dialyzers used): (1) “Standard” dialysisremoved uremic toxins on standard settings [HD or haemodiafiltration (HDF)] as previously prescribedfor the patient in routine clinical care. This provided a baseline, validated more extensively the currentdialysis prescription, and introduced patients more smoothly into the study. (2) “LowHD” dialysis hadminimal dialysis settings to provide conditions for minimal uremic toxin removal; (3) “MediumHDF”dialysis had maximum dialyzer surface area and highest dialysate (d) blood (b) flow ratio (Qd/Qb)expected to increase removal of Trp derivatives; (4) “HighHDF” dialysis had maximum dialysis settingsin terms of dialyzer surface area and substitution volume and second highest Qd/Qb.
Dialysis machines were Fresenius 5008 for 304 dialyses, Fresenius 4008 for 4 dialyses and Fresenius6008 for 4 dialyses (Fresenius Medical Care, Germany).
To compare the efficiency of the various dialysis treatments settings, blood and spent dialysatesamples were taken either from blood lines or the dialysate outlet of the dialysis machine, respectively(Figure 6). Blood samples were taken before the start of the dialysis, 60 min after the start, at the end ofthe dialysis (slow pump method) and 30 min after the end of the dialysis. All blood samples weretaken from the arterial line, i.e., before the dialyzer during dialysis session. The dialysis samples fromthe drain tube of the dialysis machine were taken at 7, 60, 120 and 180 min after the start of the sessionand, at the end of the session (240 min). In addition, the waste dialysate was collected into a large tankduring the whole procedure for calculating the total amount of uremic toxins removed. After the end

Int. J. Mol. Sci. 2020, 21, 1522 12 of 19
of the procedure, the dialysate collection tank was weighed, and one sample was taken from it aftercareful stirring.
Table 3. Dialysis treatment settings.
Standard LowHD MediumHDF HighHDF
Modality HD/HDF HD HDF HDFVs, L 23.0 ± 3.5 0 16.4 ± 3.0 24.6 ± 4.0
Time, min 240 240 240 240Qb, mL/min 323 ± 40 200 ± 10 306 ± 62 378 ± 30Qd, mL/min 458 ± 63 301 ± 11 793 ± 57 793 ± 47
Filter area 1, m2 1.90 ± 0.20 1.62 ± 0.19 2.13 ± 0.13 2.13 ± 0.14Number of dialyses, n 78 78 78 78
1 Dialysis 1: FX60 (n = 6), FX80 (n = 6), FX800 (n = 30), FX1000 (n = 12), Polyflux210H (n = 12), Solacea 19H (n = 1),Elisio-19H (n = 9). Dialysis 2: Lo15 (n = 20), FX60 (n = 37), FX1000 (n = 1), Revaclear300 (n = 19), Solacea 15H(n = 1). Dialysis 3: FX800 (n =9), FX1000 (n =56), Polyflux210H (n =12), Solacea 21H (n =1). Dialysis 4: FX800(n =11), FX1000 (n =56), Solacea 21H (n =1), Polyflux210H (n =10). The effective membrane area of dialyzers werethe following: FX8 1.4 m2, FX60 1.4 m2, FX80 1.8 m2, FX800 1.8 m2, FX1000 2.2 m2, Solacea 15H 1.5 m2, Solacea 19H1.9 m2, Solacea 21H 1.9 m2, Elisio 19H 1.9 m2, Polyflux 210H 2.1 m2, Revaclear 300 1.4 m2, Xevonta LO 15 1.5 m2.
Int. J. Mol. Sci. 2020, 20, x FOR PEER REVIEW 13 of 20
Figure 6. The schematic clinical set-up, sample collection, and analysis during the clinical studies.
All samples collected during the haemodialysis session were divided into two sets (Figure 6): the first set of samples was directly sent to clinical laboratory and the second set of samples was separated for the analytical laboratory analyses (Lab Tallinn University of Technology (TUT)). Prior to transportation or storage in an ultrafreezer, samples were processed as follows: (A) spent dialysate samples for the clinical laboratory were drawn into the Becton Dickinson Vacutainer SST II Advanced 5 mL (Franklin Lakes, NJ, USA) vacuum tubes. For analytical chemistry analysis, spent dialysate samples were transported in 120 mL Becton Dickinson Vacutainer urine collection cups (Franklin Lakes, NJ, USA) in centre 1. In centre 2, centre 3 and centre 4 the spent dialysate samples were placed into 5 mL Brand cryogenic tubes (Brand GMBH + CO KG, Wertheim, Germany) for freezing; (B) serum samples were kept still for 30 min to allow clotting and were centrifuged for 20 min with swing-out buckets at 3000 g, followed by transportation to the clinical lab for the first tube of serum while the second tube of serum was placed into 2 mL cryotubes for freezing; (C) plasma samples were gently shaken and left still until transportation to the clinical laboratory analysis.
The first sample set was directly taken to the clinical chemistry laboratories for standard analysis in all centres (Synlab Eesti OÜ in Estonia, Clinical Chemistry Laboratory at Linköping University Hospital in Sweden, Clinical Biochemistry Laboratory at Fundación Jiménez Díaz University Hospital Health Research Institute, in Madrid, Spain, and Laboratory of Clinical Chemistry and Clinical Analysis at Ghent University Hospital, in Ghent, Belgium) in order to measure serum and dialysate urea concentration using standardized methods.
The second sample set was directly sent to the analytical laboratory without freezing in centre 1 and stored in ultrafreezers (–75 °C) until sent to centre 1 in centres 2, 3 and 4. After collection of samples from 30 dialysis sessions, samples were sent to Tallinn in thermally insulated containers that were filled with dry ice to secure that they remain frozen. In Tallinn, they were unfrozen, processed according to the sample preparation methods and analysed in the analytical chemistry laboratory Tallinn University of Technology using high-performance liquid chromatography (HPLC) to measure Trp and its derivatives (IS, IAA). In order to assess serum total and free concentrations of Trp and its derivates, serum samples were prepared in two separate groups as follows: (1) To measure total concentrations of protein-bound solutes, samples in group one were diluted 1:3 with normal saline in Eppendorf Protein LoBind 1.5 mL tubes (Hamburg, Germany), followed by vortexing at 1500 rpm for 1 min, heating for 30 min at 95 °C and rapid cooling in ice-cooled water bath, followed by centrifugation at 30.000 g for 10 min at 37 °C, the resulting supernatant was filtered by centrifugation. (2) To measure unbound (free) concentrations of protein-bound solutes, samples
Figure 6. The schematic clinical set-up, sample collection, and analysis during the clinical studies.
All samples collected during the haemodialysis session were divided into two sets (Figure 6):the first set of samples was directly sent to clinical laboratory and the second set of samples wasseparated for the analytical laboratory analyses (Lab Tallinn University of Technology (TUT)). Prior totransportation or storage in an ultrafreezer, samples were processed as follows: (A) spent dialysatesamples for the clinical laboratory were drawn into the Becton Dickinson Vacutainer SST II Advanced5 mL (Franklin Lakes, NJ, USA) vacuum tubes. For analytical chemistry analysis, spent dialysatesamples were transported in 120 mL Becton Dickinson Vacutainer urine collection cups (FranklinLakes, NJ, USA) in centre 1. In centre 2, centre 3 and centre 4 the spent dialysate samples were placedinto 5 mL Brand cryogenic tubes (Brand GMBH + CO KG, Wertheim, Germany) for freezing; (B) serumsamples were kept still for 30 min to allow clotting and were centrifuged for 20 min with swing-outbuckets at 3000 g, followed by transportation to the clinical lab for the first tube of serum while thesecond tube of serum was placed into 2 mL cryotubes for freezing; (C) plasma samples were gentlyshaken and left still until transportation to the clinical laboratory analysis.

Int. J. Mol. Sci. 2020, 21, 1522 13 of 19
The first sample set was directly taken to the clinical chemistry laboratories for standard analysis inall centres (Synlab Eesti OÜ in Estonia, Clinical Chemistry Laboratory at Linköping University Hospitalin Sweden, Clinical Biochemistry Laboratory at Fundación Jiménez Díaz University Hospital HealthResearch Institute, in Madrid, Spain, and Laboratory of Clinical Chemistry and Clinical Analysisat Ghent University Hospital, in Ghent, Belgium) in order to measure serum and dialysate ureaconcentration using standardized methods.
The second sample set was directly sent to the analytical laboratory without freezing in centre1 and stored in ultrafreezers (−75 ◦C) until sent to centre 1 in centres 2, 3 and 4. After collection ofsamples from 30 dialysis sessions, samples were sent to Tallinn in thermally insulated containers thatwere filled with dry ice to secure that they remain frozen. In Tallinn, they were unfrozen, processedaccording to the sample preparation methods and analysed in the analytical chemistry laboratoryTallinn University of Technology using high-performance liquid chromatography (HPLC) to measureTrp and its derivatives (IS, IAA). In order to assess serum total and free concentrations of Trp andits derivates, serum samples were prepared in two separate groups as follows: (1) To measure totalconcentrations of protein-bound solutes, samples in group one were diluted 1:3 with normal saline inEppendorf Protein LoBind 1.5 mL tubes (Hamburg, Germany), followed by vortexing at 1500 rpm for1 min, heating for 30 min at 95 ◦C and rapid cooling in ice-cooled water bath, followed by centrifugationat 30.000 g for 10 min at 37 ◦C, the resulting supernatant was filtered by centrifugation. (2) To measureunbound (free) concentrations of protein-bound solutes, samples in group two were only filtered byultracentrifugation. For filtering by centrifugation Sartorius Vivacon 30 kDa cut-off filters (Göttingen,Germany) were used at 14.000 g for 3 h at 37 ◦C. Prior to filtering by ultracentrifugation cut-off filterswere washed through with 400 µL type I ultrapure water (Millipore Synergy UV, Burlington, MA,USA) by centrifugation at 14.000 g for 15 min at 37 ◦C. One µL of formic acid (Sigma-Adrich, St. Louis,MO, USA) was added to the filtrate in order to stabilize uric acid to undissociated form in filtrate. Thefiltrate was placed into 200 µL vial inserts which were kept at 1◦C until HPLC analysis for a maximumof 72 h. Before HPLC analysis of dialysis samples, 10 µL of formic acid was added to the dialysate inorder to solubilize uric acid.
The HPLC system consisted of a quaternary gradient pump unit, a thermostated autosampler,a column oven, a diode array spectrophotometric detector (DAD), and a fluorescence detector (FLD),all Ultimate 3000 Series instruments from Dionex a division of Thermo Scientific company (Sunnyvale,CA, USA). Two continuous columns of Poroshell 120 C18 4.6 x 150 mm with a security guard Poroshell120 C18 4.6 x 3 mm were from Agilent Instruments (Santa Clara, CA, United States). The eluent wasmixed with 0.05 M formic acid adjusted to pH 4.25 with ammonium hydroxide (A), and organic solventmixture of HPLC grade methanol and HPLC-S grade acetonitrile, both from Honeywell (Charlotte, NC,USA) in ratio of 9:1 with 0.05 M ammonium formiate salt (B). The three-step linear gradient elutionprogram was used with the total flow rate of 0.6 mL/min at the column temperature of 40 ◦C. Thechromatographic data was processed by Chromeleon 7.1 software by Thermo Scientific.
Aqueous calibration standards were prepared from reagents purchased from Sigma-Aldrich(St. Louis, MO, USA) with purity of assay >98% (TLC) diluted in type I ultrapure water (MilliporeSynergy UV, Burlington, MA, USA), followed by ultrasonic bath for 30 min to ensure completedissolution of the reagents. The standard solutions were analysed with the same HPLC method as theserum and the spent dialysate samples. Peak areas were plotted in function of concentrations and allconcentrations were expressed as micromoles per litre.
All the results were assessed for possible errors and data conformity. The errors and problemswere related with sample drawing, correct sample labelling and clinical laboratory analysis. The240-min spent dialysate samples were drawn after the end of dialysis at 8 dialysis sessions. As thesesamples were comparable with clean dialysate, these datapoints were not included to the data analysis.As spent dialysate samples are highly diluted biologic fluids, some analyte concentrations were belowquantification limit with clinical laboratory methods, especially in the case of urea. These datapoints

Int. J. Mol. Sci. 2020, 21, 1522 14 of 19
were not included to the data analysis. In case the concentration of the analyte exceeded the upperlimit of quantification, the analysis was repeated with diluted sample of lower volume of that sample.
Statistical evaluation was performed with MATLAB R2019b (Mathworks, Natick, MA, USA).Parametric statistical tests were used for differences between subjects via an unpaired t-test, and fordifferences between related samples of the same patients via a paired t-test. A p-value of <0.05 wasconsidered significant.
To assess uremic retention solute removal during a dialysis session the reduction ratio (RR) inpercentage was calculated from the solute concentrations as:
RR =C0 −Ct
C0100% (1)
where C0 is a serum sample before and Ct after dialysis procedure, or at the predetermined time pointsafter start of the dialysis. For spent dialysate, a sample taken after 7 min from the start and at the endof dialysis procedure was utilized as C0 and Ct, respectively.
The total removed solute (TRS) of a substance was calculated based on total dialysate collection(TDC) as follows:
TRS = CT ×WT (2)
where CT is the substance concentration in total dialysate collection tank (µmol/L) and WT is theweight of the dialysate collection tank (kg). It was assumed that average density of spent dialysate is1008 ± 0.001 kg/L [59].
Author Contributions: Conceptualization, A.F., I.F., G.G., M.L., M.S., F.U., A.A.O.; methodology, A.A., J.A.,A.D.,A.F., I.F., G.G., L.L., M.L., E.G.-P., V.M.P-G., M.S., F.U., A.A.O; investigation, J.P., A.A., J.A.,A.D., G.G., L.L., V.M.P-G,D.S.-O., E.G.-P., F.U.; data curation, J.P., A.A., J.A.,A.D., L.L., V.M.P-G, D.S.-O., K.P., F.U.; validation, J.A., J.P., K.P.and I.F.; formal analysis, J.P., J.A., I.F. and K.P.; writing—original draft preparation, J. P., A.A., J.A.,A.D., I.F., G.G.,L.L., M.L., K.P., F.U.; writing—review and editing, J. P., A.A., J.A.,A.D., A.F., I.F., G.G., L.L., M.L., V.M.P-G, K.P., M.S., F.U., A.A.O.; visualization, J.P., K.P, and A.A.O. All authors have read and agreed to the published version ofthe manuscript.
Funding: This research was funded partly by the European Union through the European Regional DevelopmentFund H2020-SMEINST-2-2017, OLDIAS2—Online Dialysis Sensor Phase2 project, Grant Agreement nr 767572,the Estonian Ministry of Education and Research under institutional research financing, grant nr IUT 19-2, andby Estonian Centre of Excellence in IT (EXCITE) funded by European Regional Development Fund. Financialsupport for some of the Swedish portion of the study from the collection Foundation, Njurfonden (2017 and2018), Sweden. MVPG was funded by Programa Rio Hortega ISCIII FEDER funds. AO research was funded byPI19/00588, PI19/00815, DTS18/00032, ERA-PerMed-JTC2018 (KIDNEY ATTACK AC18/00064 and PERSTIGANAC18/00071, ISCIII-RETIC REDinREN RD016/0009 FEDER funds, Sociedad Española de Nefrología, FundacionRenal Iñigo Álvarez de Toledo (FRIAT), Comunidad de Madrid CIFRA2 B2017/BMD-3686.
Acknowledgments: The authors wish to thank all dialysis patients who participated in the experiments, RainKattai and Deniss Karai for their skilful technical assistance; Maris Alev, Mihkel Fridolin, Risto Tanner and RelikaToome for helping with the data collection and analysis; Kai Lauri for coordinating biochemical analyses inSYNLAB Eesti OÜ, and nurses at the Centre of Nephrology, North Estonia Medical Centre for assistance during theclinical experiments. The research nurses Kelly Stjernfelt and Micael Gylling for data collection; Mattias Ekströmand Mats Torvaldsson Tränk for technical assistance at the Department of Nephrology, University Hospital,Linköping. The research nurses Isabelle Dewettinck, Sabine Inion and Elsie De Man for their assistance duringthe experimental dialysis sessions and data collection, and Tom Mertens, Sophie Lobbestael and Bart Vaeyensfor their technical assistance at the Department of Nephrology, Ghent University hospital, Ghent, Belgium. Theresearch nurse Monica Pereira at the Fundación Jiménez Díaz University Hospital Health Research Institute inMadrid, Spain.
Conflicts of Interest: The authors declare no conflicts of interest. The funders had no role in the design of thestudy; in the collection, analyses, or interpretation of data; in the writing of the manuscript, or in the decision topublish the results.

Int. J. Mol. Sci. 2020, 21, 1522 15 of 19
Abbreviations
ESKD end-stage kidney diseaseHD haemodialysis (low flux)HDF haemodialfiltrationIAA indole acetic acidIS indoxyl sulfateRR reduction ratioTRS total removed soluteTrp tryptophan
Appendix A
Figure A1 shows the mean total and free serum and dialysate Trp, IS, IAA and urea concentrations normalizedfor the baseline predialysis value at different time points during the dialysis sessions. The mean normalized Trpconcentrations behave differently than other uremic solutes. The normalized mean total serum concentrations forIS and IAA and the normalized mean dialysate concentrations for IS, IAA and urea behave similarly. The increaseof free serum Trp and IS during the first hour of the dialysis sessions compared to the initial pre-dialysis levels isaccentuated (Figure A1b).Int. J. Mol. Sci. 2020, 20, x FOR PEER REVIEW 16 of 20
(a)
(b)
(c)
Figure A1. Cont.

Int. J. Mol. Sci. 2020, 21, 1522 16 of 19
Int. J. Mol. Sci. 2020, 20, x FOR PEER REVIEW 16 of 20
(a)
(b)
(c)
Figure A1. Mean concentrations normalized for the baseline pre-dialysis value, at different time pointsduring the dialysis sessions for Trp, IS, IAA and urea for (a) total serum values; (b) free serum values;and (c) dialysate values. P values are shown on Figure 1.
References
1. Schmidt, J.A.; Rinaldi, S.; Scalbert, A.; Ferrari, P.; Achaintre, D.; Gunter, M.J.; Appleby, P.N.; Key, T.J.;Travis, R.C. Plasma concentrations and intakes of amino acids in male meat-eaters, fish-eaters, vegetariansand vegans: A cross-sectional analysis in the epic-oxford cohort. Eur. J. Clin. Nutr. 2016, 70, 306–312.[CrossRef]
2. Cynober, L.A. Plasma amino acid levels with a note on membrane transport: Characteristics, regulation, andmetabolic significance. Nutrition 2002, 18, 761–766. [CrossRef]
3. McMenamy, R.H.; Lund, C.C.; Oncley, J.L. Unbound amino acid concentrations in human blood plasmas.J. Clin. Investig. 1957, 36, 1672–1679. [CrossRef] [PubMed]

Int. J. Mol. Sci. 2020, 21, 1522 17 of 19
4. Mingrone, G.; De Smet, R.; Greco, A.V.; Bertuzzi, A.; Gandolfi, A.; Ringoir, S.; Vanholder, R. Serum uremictoxins from patients with chronic renal failure displace the binding of l-tryptophan to human serum albumin.Clin. Chim. Acta 1997, 260, 27–34. [CrossRef]
5. Richard, D.M.; Dawes, M.A.; Mathias, C.W.; Acheson, A.; Hill-Kapturczak, N.; Dougherty, D.M. L-tryptophan:Basic metabolic functions, behavioral research and therapeutic indications. Int. J. Tryptophan Res. 2009, 2,IJTR–S2129. [CrossRef]
6. Møller, S.E. Pharmacokinetics of tryptophan, renal handling of kynurenine and the effect of nicotinamide onits appearance in plasma and urine following l-tryptophan loading of healthy subjects. Eur. J. Clin. Pharmacol.1981, 21, 137–142. [CrossRef]
7. Bender, D.A. Biochemistry of tryptophan in health and disease. Mol. Asp. Med. 1983, 6, 101–197. [CrossRef]8. Green, A.R.; Aronson, J.K.; Curzon, G.; Woods, H.F. Metabolism of an oral tryptophan load. I: Effects of dose
and pretreatment with tryptophan. Br. J. Clin. Pharmacol. 1980, 10, 603–610. [CrossRef]9. Agus, A.; Planchais, J.; Sokol, H. Gut microbiota regulation of tryptophan metabolism in health and disease.
Cell Host Microbe 2018, 23, 716–724. [CrossRef]10. Cosola, C.; Rocchetti, M.T.; Cupisti, A.; Gesualdo, L. Microbiota metabolites: Pivotal players of cardiovascular
damage in chronic kidney disease. Pharmacol. Res. 2018, 130, 132–142. [CrossRef]11. Vanholder, R.C.; Eloot, S.; Glorieux, G.L.R.L. Future avenues to decrease uremic toxin concentration. Am. J.
Kidney Dis. 2016, 67, 664–676. [CrossRef] [PubMed]12. Adrian, P.; Marleen, H.; Enya, P.; Martijn van, F.; Ido, P.K.; Steffie, V.; Johanna, M.G.; Ralf, W.; Karin, J.R.I.;
Stephan, J.L.B.; et al. Tryptophan intake and tryptophan losses in hemodialysis patients: A balance study.Nutrients 2019, 11. [CrossRef]
13. Weng, C.O.; Bruno, M.; Mark, R.; Daniel, H.; Andrew, S.; Jennifer, C.A.; Ravi, M.; David, S.G.; Mark, A.J.D.Micronutrient and amino acid losses during renal replacement therapy for acute kidney injury. Kidney Int. Rep.2019, 4, 1094–1108. [CrossRef]
14. Stapel, S.N.; de Boer, R.J.; Thoral, P.J.; Vervloet, M.G.; Girbes, A.R.J.; Oudemans-van Straaten, H.M. Aminoacid loss during continuous venovenous hemofiltration in critically ill patients. Blood Purif. 2019, 48, 321–329.[CrossRef] [PubMed]
15. Chua, H.R.; Baldwin, I.; Fealy, N.; Naka, T.; Bellomo, R. Amino acid balance with extended daily diafiltrationin acute kidney injury. Blood Purif. 2012, 33, 292–299. [CrossRef]
16. Davies, S.P.; Reaveley, D.A.; Brown, E.A.; Kox, W.J. Amino acid clearances and daily losses in patients withacute renal failure treated by continuous arteriovenous hemodialysis. Crit. Care Med. 1991, 19, 1510–1515.[CrossRef] [PubMed]
17. Bellomo, R.; Tan, H.K.; Bhonagiri, S.; Gopal, I.; Seacombe, J.; Daskalakis, M.; Boyce, N. High protein intakeduring continuous hemodiafiltration: Impact on amino acids and nitrogen balance. Int. J. Artif. Organs 2002,25, 261–268. [CrossRef]
18. Sainio, E.-L.; Pulkki, K.; Young, S.N. L-tryptophan: Biochemical, nutritional and pharmacological aspects.Amino Acids 1996, 10, 21–47. [CrossRef]
19. Alp Ikizler, T.; Flakoll, P.J.; Parker, R.A.; Hakim, R.M. Amino acid and albumin losses during hemodialysis.Kidney Int. 1994, 46, 830–837. [CrossRef]
20. Le Floc’h, N.; Otten, W.; Merlot, E. Tryptophan metabolism, from nutrition to potential therapeuticapplications. Amino Acids 2011, 41, 1195–1205. [CrossRef]
21. Meert, N.; Eloot, S.; Schepers, E.; Lemke, H.D.; Dhondt, A.; Glorieux, G.; Van Landschoot, M.; Waterloos, M.A.;Vanholder, R. Comparison of removal capacity of two consecutive generations of high-flux dialysers duringdifferent treatment modalities. Nephrol. Dial. Transplant. 2011, 26, 2624–2630. [CrossRef]
22. Duranton, F.; Cohen, G.; De Smet, R.; Rodriguez, M.; Jankowski, J.; Vanholder, R.; Argiles, A.; EuropeanUremic Toxin Work Group. Normal and pathologic concentrations of uremic toxins. J. Am. Soc. Nephrol.2012, 23, 1258–1270. [CrossRef] [PubMed]
23. Itoh, Y.; Ezawa, A.; Kikuchi, K.; Tsuruta, Y.; Niwa, T. Protein-bound uremic toxins in hemodialysispatients measured by liquid chromatography/tandem mass spectrometry and their effects on endothelial rosproduction. Anal. Bioanal. Chem. 2012, 403, 1841–1850. [CrossRef]
24. Florens, N.; Yi, D.; Juillard, L.; Soulage, C.O. Using binding competitors of albumin to promote the removalof protein-bound uremic toxins in hemodialysis: Hope or pipe dream? Biochimie 2018, 144, 1–8. [CrossRef]

Int. J. Mol. Sci. 2020, 21, 1522 18 of 19
25. Dou, L.; Sallée, M.; Cerini, C.; Poitevin, S.; Gondouin, B.; Jourde-Chiche, N.; Fallague, K.; Brunet, P.; Calaf, R.;Dussol, B.; et al. The cardiovascular effect of the uremic solute indole-3 acetic acid. J. Am. Soc. Nephrol. 2015,26, 876–887. [CrossRef]
26. Leong, S.C.; Sirich, T.L. Indoxyl sulfate-review of toxicity and therapeutic strategies. Toxins (Basel) 2016, 8,358. [CrossRef] [PubMed]
27. Meert, N.; Waterloos, M.-A.; Van Landschoot, M.; Dhondt, A.; Ledebo, I.; Glorieux, G.; Goeman, J.; Vander Eycken, J.; Vanholder, R. Prospective evaluation of the change of predialysis protein-bound uremicsolute concentration with postdilution online hemodiafiltration. Artif. Organs 2010, 34, 580–585. [CrossRef][PubMed]
28. Krieter, D.H.; Hackl, A.; Rodriguez, A.; Chenine, L.; Moragues, H.L.; Lemke, H.D.; Wanner, C.;Canaud, B. Protein-bound uraemic toxin removal in haemodialysis and post-dilution haemodiafiltration.Nephrol. Dial. Transplant. 2010, 25, 212–218. [CrossRef] [PubMed]
29. Deltombe, O.; Van Biesen, W.; Glorieux, G.; Massy, Z.; Dhondt, A.; Eloot, S. Exploring protein bindingof uremic toxins in patients with different stages of chronic kidney disease and during hemodialysis.Toxins (Basel) 2015, 7, 3933–3946. [CrossRef]
30. Camacho, O.; Rosales, M.C.; Shafi, T.; Fullman, J.; Plummer, N.S.; Meyer, T.W.; Sirich, T.L. Effect of asustained difference in hemodialytic clearance on the plasma levels of p-cresol sulfate and indoxyl sulfate.Nephrol. Dial. Transplant. 2016, 31, 1335–1341. [CrossRef]
31. Madero, M.; Cano, K.B.; Campos, I.; Tao, X.; Maheshwari, V.; Brown, J.; Cornejo, B.; Handelman, G.;Thijssen, S.; Kotanko, P. Removal of protein-bound uremic toxins during hemodialysis using a bindingcompetitor. Clin. J. Am. Soc. Nephrol. 2019, 14, 394–402. [CrossRef] [PubMed]
32. de Brito, J.S.; Borges, N.A.; Dolenga, C.J.R.; Carraro-Eduardo, J.C.; Nakao, L.S.; Mafra, D. Is there a relationshipbetween tryptophan dietary intake and plasma levels of indoxyl sulfate in chronic kidney disease patientson hemodialysis? Braz. J. Nephrol. 2016, 38, 396–402. [CrossRef] [PubMed]
33. Fernandez-Prado, R.; Esteras, R.; Perez-Gomez, M.V.; Gracia-Iguacel, C.; Gonzalez-Parra, E.; Sanz, A.B.;Ortiz, A.; Sanchez-Niño, M.D. Nutrients turned into toxins: Microbiota modulation of nutrient properties inchronic kidney disease. Nutrients 2017, 9, 489. [CrossRef] [PubMed]
34. Snell, E.E. Tryptophanase: Structure, catalytic activities, and mechanism of action. Adv. Enzymol. Relat. AreasMol. Biol. 1975, 42, 287–333. [CrossRef]
35. Schütz, A.; Sandalova, T.; Ricagno, S.; Hübner, G.; König, S.; Schneider, G. Crystal structure ofthiamindiphosphate-dependent indolepyruvate decarboxylase from enterobacter cloacae, an enzymeinvolved in the biosynthesis of the plant hormone indole-3-acetic acid. Eur. J. Biochem. 2003, 270,2312–2321. [CrossRef]
36. Hoshino, Y.; Yamamoto, T.; Kaneko, M.; Kumashiro, H. Plasma free tryptophan concentration in autisticchildren. Brain Dev. 1986, 8, 424–427. [CrossRef]
37. Debnath, S.; Velagapudi, C.; Redus, L.; Thameem, F.; Kasinath, B.; Hura, C.E.; Lorenzo, C.; Abboud, H.E.;O’Connor, J.C. Tryptophan metabolism in patients with chronic kidney disease secondary to type 2 diabetes:Relationship to inflammatory markers. Int. J. Tryptophan Res. 2017, 10, 1178646917694600. [CrossRef]
38. Murr, C.; Grammer, T.B.; Kleber, M.E.; Meinitzer, A.; März, W.; Fuchs, D. Low serum tryptophan predictshigher mortality in cardiovascular disease. Eur. J. Clin. Investig. 2015, 45, 247–254. [CrossRef]
39. Yu, E.; Ruiz-Canela, M.; Guasch-Ferré, M.; Zheng, Y.; Toledo, E.; Clish, C.B.; Salas-Salvadó, J.; Liang, L.;Wang, D.D.; Corella, D.; et al. Increases in plasma tryptophan are inversely associated with incidentcardiovascular disease in the prevención con dieta mediterránea (predimed) study. J. Nutr. 2017, 147, 314–322.[CrossRef]
40. Garibotto, G.; Bonanni, A.; Verzola, D. Effect of kidney failure and hemodialysis on protein and amino acidmetabolism. Curr. Opin. Clin. Nutr. Metab. Care 2012, 15, 78–84. [CrossRef]
41. Raj, D.S.C.; Moseley, P.; Dominic, E.A.; Onime, A.; Tzamaloukas, A.H.; Boyd, A.; Shah, V.O.; Glew, R.;Wolfe, R.; Ferrando, A. Interleukin-6 modulates hepatic and muscle protein synthesis during hemodialysis.Kidney Int. 2008, 73, 1054–1061. [CrossRef] [PubMed]
42. Saito, A.; Niwa, T.; Maeda, K.; Kobayashi, K.; Yamamoto, Y.; Ohta, K. Tryptophan and indolic tryptophanmetabolites in chronic renal failure. Am. J. Clin. Nutr. 1980, 33, 1402–1406. [CrossRef] [PubMed]
43. Dromgoole, S.H. The effect of haemodialysis on the binding capacity of albumin. Clin. Chim. Acta 1973, 46,469–472. [CrossRef]

Int. J. Mol. Sci. 2020, 21, 1522 19 of 19
44. Shibasaki, T.; Matsuda, H.; Ohno, I.; Gomi, H.; Nakano, H.; Misawa, T.; Abe, S.; Ishimoto, F.; Kisugi, R.;Ikeda, K.; et al. Significance of serum lipase in patients undergoing hemodialysis. Am. J. Nephrol. 1996, 16,309–314. [CrossRef] [PubMed]
45. Horiuchi, T.; Johno, I.; Kitazawa, S.; Goto, M.; Hata, T. Plasma free fatty acids and protein binding ofdisopyramide during haemodialysis. Eur. J. Clin. Pharmacol. 1987, 33, 327–329. [CrossRef]
46. Anguizola, J.; Debolt, E.; Suresh, D.; Hage, D.S. Chromatographic analysis of the effects of fatty acids andglycation on binding by probes for sudlow sites i and ii to human serum albumin. J. Chromatogr. B 2016,1021, 175–181. [CrossRef]
47. Tao, X.; Thijssen, S.; Kotanko, P.; Ho, C.H.; Henrie, M.; Stroup, E.; Handelman, G. Improved dialytic removalof protein-bound uraemic toxins with use of albumin binding competitors: An in vitro human whole bloodstudy. Sci. Rep. 2016, 6, 23389. [CrossRef]
48. Sakai, T.; Takadate, A.; Otagiri, M. Characterization of binding site of uremic toxins on human serum albumin.Biol. Pharm. Bull. 1995, 18, 1755–1761. [CrossRef]
49. Cunningham, V.J.; Hay, L.; Stoner, H.B. The binding of l-tryptophan to serum albumins in the presence ofnon-esterified fatty acids. Biochem. J. 1975, 146, 653–658. [CrossRef]
50. Deltombe, O.; de Loor, H.; Glorieux, G.; Dhondt, A.; Van Biesen, W.; Meijers, B.; Eloot, S. Exploring bindingcharacteristics and the related competition of different protein-bound uremic toxins. Biochimie 2017, 139,20–26. [CrossRef]
51. Lauri, K.; Arund, J.; Holmar, J.; Tanner, R.; Kalle, S.; Luman, M.; Fridolin, I.; Tanner, R.; Kalle, S.; Luman, M.;et al. Removal of urea, β2-microglobulin, and indoxyl sulfate assessed by absorbance and fluorescence in thespent dialysate during hemodialysis. ASAIO J. 2019. [CrossRef] [PubMed]
52. Eloot, S.; Dhondt, A.; Van Landschoot, M.; Waterloos, M.A.; Vanholder, R. Removal of water-solubleand protein-bound solutes with reversed mid-dilution versus post-dilution haemodiafiltration.Nephrol. Dial. Transplant. 2012, 27, 3278–3283. [CrossRef] [PubMed]
53. Arund, J.; Luman, M.; Uhlin, F.; Tanner, R.; Fridolin, I. Is fluorescence valid to monitor removal of proteinbound uremic solutes in dialysis? PLoS ONE 2016, 11, e0156541. [CrossRef] [PubMed]
54. Lesaffer, G.; De Smet, R.; Lameire, N.; Dhondt, A.; Duym, P.; Vanholder, R. Intradialyticremoval of protein-bound uraemic toxins: Role of solute characteristics and of dialyser membrane.Nephrol. Dial. Transplant. 2000, 15, 50–57. [CrossRef] [PubMed]
55. Murtas, S.; Aquilani, R.; Deiana, M.L.; Iadarola, P.; Secci, R.; Cadeddu, M.; Salis, S.; Serpi, D.; Bolasco, P.Differences in amino acid loss between high-efficiency hemodialysis and postdilution and predilutionhemodiafiltration using high convection volume exchange-a new metabolic scenario? A pilot study.J. Renal Nutr. 2019, 29, 126–135. [CrossRef] [PubMed]
56. Hendriks, F.K.; Smeets, J.S.J.; Broers, N.J.H.; van Kranenburg, J.M.X.; van der Sande, F.M.; Kooman, J.P.; vanLoon, L.J.C. End-stage renal disease patients lose a substantial amount of amino acids during hemodialysis.J. Nutr. 2020. [CrossRef]
57. GBD 2017 DALYs and HALE, Collaborators. Global, regional, and national disability-adjusted life-years(dalys) for 359 diseases and injuries and healthy life expectancy (hale) for 195 countries and territories,1990-2017: A systematic analysis for the global burden of disease study 2017. Lancet 2018, 392, 1859–1922.[CrossRef]
58. Kramer, A.; Pippias, M.; Noordzij, M.; Stel, V.S.; Andrusev, A.M.; Aparicio-Madre, M.I.; Arribas Monzón, F.E.;Åsberg, A.; Barbullushi, M.; Beltrán, P.; et al. The european renal association – european dialysis andtransplant association (era-edta) registry annual report 2016: A summary. Clin. Kidney J. 2019, 12, 702–720.[CrossRef]
59. Eloot, S.; Dhondt, A.; Vierendeels, J.; De Wachter, D.; Verdonck, P.; Vanholder, R. Temperature andconcentration distribution within the genius® dialysate container. Nephrol. Dial. Transplant. 2007, 22,2962–2969. [CrossRef]
© 2020 by the authors. Licensee MDPI, Basel, Switzerland. This article is an open accessarticle distributed under the terms and conditions of the Creative Commons Attribution(CC BY) license (http://creativecommons.org/licenses/by/4.0/).