Sequence of the domestic duck (Anas platyrhynchos) growth hormone-encoding gene and genetic...
58
IMPACT OF ADDICTIONAND OTHER FACTORS ON ACADEMIC PERFORMANCE OF STUDENTS IN ARAB MINCH UNIVERSITY: ACASE STUDY IN ABAYA CAMPUS. \ ASINIOR RESEARCH PROJECT PREPARED BY EYO EYO EL LOMBORE EL LOMBORE ADVISOR: ADVISOR: GEZAHEGN M. (M.Sc.) GEZAHEGN M. (M.Sc.) A SENIOR RESEARCH SUMITED TO: A SENIOR RESEARCH SUMITED TO:
Transcript of Sequence of the domestic duck (Anas platyrhynchos) growth hormone-encoding gene and genetic...

IMPACT OF ADDICTIONAND OTHER FACTORS ON ACADEMIC PERFORMANCE
OF STUDENTS IN ARAB MINCH UNIVERSITY: ACASE STUDY IN ABAYA
CAMPUS.
\
ASINIOR RESEARCH
PROJECT
PREPARED
BY
EYO EYO
EL LOMBOREEL LOMBORE
ADVISOR: ADVISOR:
GEZAHEGN M. (M.Sc.)GEZAHEGN M. (M.Sc.)
A SENIOR RESEARCH SUMITED TO:A SENIOR RESEARCH SUMITED TO:

DEPARTMENT OF STASISTICS, COLLEGE OF NATURAL SCIENCEARBADEPARTMENT OF STASISTICS, COLLEGE OF NATURAL SCIENCEARBA
MINCH UNIVERSITYMINCH UNIVERSITY
IN PARTIAL FULFILLMENT OF THE REQUIREMENT FORIN PARTIAL FULFILLMENT OF THE REQUIREMENT FOR
THE B.SC. DEGREE IN STATISTICS THE B.SC. DEGREE IN STATISTICS
JUNE, 2013JUNE, 2013
ARBAMINCH, ETHIOPIAARBAMINCH, ETHIOPIA
Approval Sheet of B.Sc. Research Proposal
Submitted by:
_EYOEL LOMBORE____ _07/06/2005
E.C_________________ Name of Student
Signature Date
Approved by:
___ GEZAHEGN M GEZAHEGN M . . _____________
___________________ Name of Advisor
Signature Date

________________ ___________________
__________________
Name of Dep’t Head Signature
Date
Approval sheet 1
This is to certify that the proposal entitled “Impact of
Addiction on Academic Performance of Students in Arab Minch
University: A case Study in Abaya Campus.
”submitted in partial fulfillment of bachelor degree in
Statistics of undergraduate program at Department of
Statistics Collage of Natural Science, Arba Minch

University, and is a record of the original proposal carried
out by__EYOEL LOMBORE_Id. No__678/02 under my supervision
and no part of this proposal has been submitted for any
degree or diploma away
The assistance and the help received during thecourse of this investigation have been duly acknowledged.
Therefore, I recommend that it would be accepted as
fulfilling the B.Sc. research project requirement.
___________________ ___________________
__________________
Name of Advisor Signature
Date
___________________ __________________
_________________
Name of Dep’t Head Signature
Date

APPROVAL SHEET-2
We, the undersigned, members of the board of examiners of
the final open defense by __EYOEL LOMBORE_Id. No__678/02
have read and evaluated his senior research entitled “IMPACT
OF ADDICTIONAND OTHER FACTORS ON ACADEMIC PERFORMANCE OF
STUDENTS IN ARAB MINCH UNIVERSITY: ACASE STUDY IN ABAYA
CAMPUS.” and examined the candidate. This is therefore to
certify that the senior research has been accepted in
partial fulfillment of the requirements for the B.Sc. degree
in Statistics.
_____________________ ____________
________________
Name of Main Advisor Signature
Date
_____________________ ____________
________________
Name of Examiner (1) Signature
Date

______________________ ____________
_________________
Name of Examiner (2) Signature
Date
ACKNOWLEDGEMENT
First of all, I would like to give my heart full thank to my
God who helped me to come up with this research.
Next I would like to thank my Advisor GEZAHEGN MOKONENGEZAHEGN MOKONEN
(M.sc) whose professional advice was not separated from me
until the completion of this research paper, and who helped
me all his best through his knowledge by sharing different
ideas and follows me by devoting his valuable time.

Thirdly I am interested to thank all staff members of
statistics department who directly or indirectly
participated for the accomplishment of the paper.
Finally, I would like to thank my parent and friend for
their valuable suggestions and financial support.
.
ABSTRACT
This study was focused on the depth study about the impact of addiction
on students academic. The main source of data for this study is primary as

a sample by using stratified-sampling techniques, and descriptive statistics
and multiple linear recreations model were used to analyze the data. From
the sample of 56.45%, 57.25% and37.6% of chat, alcohol and cigarette
respectively respondents are addictive, while the rest 43.5%, 42.5% and69%
are not addictive. Regression analysis result shows that those students who
are addicted are lower in academic performance.tha means the students
who denote use stimulants (addicted to the addiction than women) and
addicted students where associated with poorer not addicted) get a good
academic result then those who are addicted .
The result of these study allow campus to recognizes students who are
addicted or on the average of becoming addicted and stress risk factors
indicating need for intervention in order to prevent the appearance of
addiction.
Generally addiction seriously affects the academic performance of the
students. Data which is directly collected from students through
questionnaires that are selected.
Table of Contents
Page
1.INTRODUCTION............................................1
1.1 Back ground of the Study..............................1
1.2 Statement of the Problem...................................2
1.3 Objectives of The Study...............................2
1.4. Significance Of the Study.............................3
2. Literature review......................................4
3. Methodology............................................6

3.1 Description of the Study Area.........................6
3.2 Study Population......................................6
3.3 Sample Design.........................................6
3.4 Sample Size Determination.............................7
3.5Allocation of Sample Survey............................8
3.6 Method of Data Collection.............................9
3.7 Variable of the Study.................................9
3.7.1 Method of data Analysis.............................9
3.7.2 Descrptive Statistics...............................9
3.7.2.2 .................................................10
3.7.2.3 Multiple Linear Regression.......................11
4. RESULT AND DISCUSSION………………………………………………………..204.1 Descriptive Analysis
Results………………………………………………………………………………………………….20
4.2 Inferential Statistics
Analysis………………………………………………………………………………………………..24
4.2.2 Multiple Linear Regration
Results…………………………………………………………………………………….24
5 Conclusions and Recommendation
5.1 Conclusion………………………………………………………………………………………………………………………….34
5.2 Recommendations………………………………………………………………………………………………………………34
Reference……………………………………………………………………………………………………………………………….37
Appendix………………………………………………………………………………………………………………………………….37

1. Introduction

1.1. Background on Addiction
An addiction is an overpowering urge to abuse a particular
substance or engage in a particular activity. This physical
or emotional dependence causes addicts to seek fuel for
their addictions in compulsive ways, often sacrificing some
combination of health, safety, relationships, employment and
financial stability. Information on addiction, including
issues such as causes, diagnosis and treatment. Addiction is
a disease that affects both brain and behavior. Biological
and environmental factors have been identified and
scientists are beginning to search for the genetic variant
Addiction Background
not conducive to our health or general mental well being.
With an addiction there can be a psychological,
physiological, or even physical dependence of one particular
thing. When it comes to the possibility of an addiction
forming Addiction is dependence or a need to do something or
use something that in general is anyone is susceptible to
this. The addiction is usually something that interferes
with everyday life. The addicted person will start off
believing that they can control the scenario and the affects
that it has over their life, but as the addiction progresses
it begins to affect their work, their families, and all
other aspects of life.

There are many types of addiction that can form; addiction
to gambling is one of the most prominent addictions in the
United States. The addicted person can spend thousands of
dollars over a period of time, in hopes of trying to win
more money. This can be seen in people who buy scratch off
tickets and those who spend too much time at a casino.
One addiction that is becoming a more prominent issue in
the United States is Sex Addiction. The addicted person
is not able to control their sexual behavior. Often times
this causes impulsive and dangerous lengths for sexual
activity. There is much dispute in the between scientists
and sexologists when it comes to Sex
Addiction.http://www.google.com.et the impact of addiction on students on
their academic performance.The most well know addictions are
those of drug or alcohol dependency. In cases of alcohol
dependency, the addicted person will spend a great portion
of their earnings on alcohol. This addiction can lead to
various other issues within the family structure or the
work place. And drug addiction is based on the excessive
use of illegal narcotics or the abuse of over the counter
products.
When it comes to any addiction there are several symptoms or
warning signs that are indicative of this nature. The
addicted person will have a strong compulsion to engage in
their addictive activity often. This is typically a desire

that is hidden for quite a while, but eventually surfaces
noticeable level. The addicted person will display feelings
of regret or guilt about their participation, but the desire
to continue will often overpower them. If an addiction
becomes too powerful it can interfere with their everyday
lives including work and family time; this disruption can
often further the addiction even more.
If someone is addicted to a dangerous behavior like
promiscuous sexual activity, gambling, drugs, or alcohol, it
is important to get them the proper medical treatment.
Addictions are very dangerous because they can destroy
lives. In some cases there are therapies and programs that
can help to breakdown the rationale and need behind the
addiction. These programs offer support groups and gradual
movements towards healthier, non-addicted living. There are
also programs dedicated to helping the family as a whole
rebuild once an addiction is identified and treated.
Addictions are very serious issue that needs to be handled
with care.
ions that contribute to the development and progression of
the disease.
1.2 Statement of the Problem
Today large students are coming to use different kind of
stimulants as their means of satisfaction.Farther more,

economical, social, cultural and behavioral change and also
impacts on physical and mental change. It also shows the way
assure the quality of addicted with non addicted base on
academic performance by specifying the reason why addicted
students share large population of academic dismissal or
readmission
The study would end crucial to have good participant and
practicable young generation in order to insure that all
development efforts under taken for the future will apply by
a new generation with stable mental, physical, social and
cultural well being. Nevertheless, now a day adolescents
faced several treats and their future is hampered by various
negative impacts, especially for males, one of these
problems being many intelligent students caused by addictive
and consequences low CGPA, especially in developing
countries.
1.3 Objectives
General Objective
The general objective of this study was to assess the impact
of addiction on academic performance of students.
Specific Objectives
To determine the factors responsible for students academic
performance

To see weather addicted students have low performance or
not.
To investigate whether addiction and study time are
independent or not.
To assess the consequences of addiction on academic
performances of students by comparing CGPA of addictive and
students.
1.4. Significance of the Study
The study would end crucial to have good participant and
practicable young generation in order to insure that all
development efforts under taken for the future will apply by
a new generation with stable mental, physical, social and
cultural well being specifying the reason why addicted
students share large population of academic dismissal or
readmission. This study would be used to increase a good
attitude and decrement of the addiction would recognize
growing importance of development of the country.
1.6 Limitation of the study.
In any research there are different types of constraint that
depends on the availability of the resources and the area
where the research was taken place. In this investigation, I
encounter some limitation which is listed below:

Some respondents may not write the correct information
to all questions.
Shortage of time, money and computer service
It does not know the actual number of use stimulants.

2.
Literature Review
One of the recurrent proposal topics to be found in
education literature involves the attempt to isolate the
complex determinants of academic performance. A wide variety
of proposal topics has been drawing attention to the
importance of high school performance matriculate on result,
social and environmental factors as well as personality
characteristics and behaviors such as self perception, self
confidence, attitude, motivational drive and strategies in
studying.
Chat has direct effects on the cardiovascular system causing
clear increases in heart rate and blood pressure in humans
(Brenneisen et al., 1990). As an illustration of the
cardiovascular affects the results of Brenneisen et al.,
(1990) are reproduced in more detail.
In 1992 Bowman reported that measure academic ability
between addicted and non addicted students show significant
difference due to the difference in back ground educational
activities.

Kennedy et al (1983) noted over 25 years ago that few of the
allegations of health effects made against chat were
substantiated in controlled studies in humans.
Gaskin and Mironychev (1994) reported that up to 80% of the
adult population of Yemen use chat. Upon first chewing chat,
the initial effects were unpleasant and included dizziness,
lassitude, tachycardia, and sometimes epigastria pain.
Gradually more pleasant feelings replaced these inaugural
symptoms. The subjects had feelings of bliss, clarity of
thought, and became euphoric and overly energetic. Sometimes
chat produced depression, sleepiness, and then deep sleep.
In 1994, the hypothesis of equal response CG PA between
addictive and non addictive variable a student would rejects
by Gashed. He suggested that there are different factors
that are responsible for their difference in academic
performance. To sum up in this chapter we revised some
relate proposal that would be done on university students’
academic performance.
In 1995, Entwist showed that study methods attitudes the
most consistent predictors of academic performance in higher
education.
In 1999, Goldman and Hudson found the college student’s
abilities have no significance effect on the difference
between high, middle and low grade point groups, but they

did find significant difference among addicted and none
addicted based on studying strategies.
It is assume that intellectual and scholastic aptitude is
prerequisite to success in college.
The substance was often taken in larger amounts or over a
longer period than was intended 1. There is a persistent
desire or unsuccessful efforts to cut down or control
substance use 2. A great deal of time was spent in
activities to obtain the substance, use the substance, or
recover from its effects 3. Important social, occupational
or recreational activities ware given up or reduced because
of substance use 4. the substance use was continued despite
knowledge of having a persistent or recurrent physical or
psychological problem that was likely to have been caused or
exacerbated by the substance (e.g., continued chewing
despite recognition that an ulcer, depression, or loss of
appetite was made worse by chat consumption) The following
operational definitions are appropriate to this study Life
time prevalence of chat chewing: the proportion of youth who
had ever chewed chat life time prevalence of smoking: the
proportion of youth who had ever smoked cigarette Life time
prevalence of drinking: the proportion of youth who had ever
drunk alcohol Current prevalence of chat chewing: proportion
of youth who chew currently and have chewed

In a wide- Some authors estimate that 10 million people chew
chat daily, worldwide (Stefan & Mathew, 2005; Pinning’s et
al, 2008). Studies of chat consumption in the United Kingdom
suggest that the context of consumption (i.e. displacement
and social marginalization) may have significant effects in
shaping the outcomes from chat consumption (Griffiths et
al., 1997 Nabozoka & Badhadhe, 2000; UK Advisory Council on
the Misuse of Drugs, 2005; Patel, 2008; Pinning’s et al.,
2008).
3. Methodology
3.1 Description of the Study Area
The study was conducted in the Arab Minch University case
study in Ababa Campus. Arba Minch University was located in
SNNPR (Southern nation nationality people region in Gamo
Goff Zone at Arab Minch town in Addis Ababa road. From this
University Abaya has one of the Campuse which was located in
secha kifle kitema and contains eight
departments.
3.2 Study Population
The study on academic performance of students in Abaya
Campus” focuses in the total number of students in the

campus and the subclass of the total population can be
grouped as different departments and batches.
3.3 Sampling Design
There are many techniques of sampling designs in statistical
methods. Among these stratified random sampling techniques
was employed, because the nature of the population forced
them to used it and in order to increase the precision of
their findings. Thus, to assume that based on graduated
students at{ 7}departments in 2005 batch students as the
first stratum, Geology department, second stratum Mathis
department ,third stratum Metrology Department, fourth
stratum statistics Department and fifth stratum physics
Department, Sixth stratum Biology Department and Seventh
stratum Chemistry Department. Stratification itself has its
own advantages to keep homogeneity of the population to
achieve minimum variability among population for separate
estimation.
3.4 Sample size determination
Determining sample size has important issue in research
since samples that are too large may waste time, resource
and money whereas too small sample may lead under estimation
and an inaccurate result
Accordingly, determine the minimum required sample size
assuming the significance level at 95%, margin error to be

10% and study variable as categorical, using the following
formula as usual by using proportional allocation for
categorical data in stratification for any element in the
population in the sample. The total number of population in
each stratum is: N1, N2, N3, N4, N5, N6andN7 the proportion
of each stratum to the total population is computed by using
the formula, wh=NhN
As follows.
wh=NhN
W1= 49662
=0.074
W2=108662=0.1631
W3¿ 51662
=0.0770
W4=112662=0.1692
W5= 37662
=0.0559
W6=170662=0.2568

W7135662=0.2039
The Total Population In The Sven Stratums Is 0btained by
And the total sample size which represents the whole
population was calculated
The general formula of the sample size determination for
this case is follows
n=no/1+no/N
v=d2Z2=
Wh =NhN
no=1V∑ whSh2
n=∑Whsh2
V+1N∑ WhSh2
The total populations of each stratum are given below in the
table.

No Department Total1 Geology 492 State 1123 Metrology 514 Physics 375 Mathematics 1086 Chemistry 1357 Biology 170
Total population 662To determine the total sample size calculates the variance
of the strata by using preliminary survey method. But I take
the sample variance from previous research then the sample
variance is the following.
s12 =0.137s5
2 =0.038
s22 =0.113s6
2 =0.0179
s32 0.202 s7
2 =0.22
s42 =0.032
∑ whsh2 =W1s1
2+W2s22+…………………..+W7s7
2
∑ whsh2 = 0.074*0.137+0.169*0.113+………………∑
+0.20393*0.22=0.39586
V= 0.12
1.962=0.0026

no =whsh
2
v=0.395860.0026 =152
n=∑Whsh2
V+1N∑ WhSh2=
0.39586
0.0026+0.39586662
=124
n=no
1+noN=
152
1+152662
= 124
The total sample size is.
n=n1+n2+n3+n4+n5+n6+n7
Where N-is the total number of population, that is the sum
total of students in each batch
n=the required total sample size, no=the initial
sample size
sh2-is the sample variance of the population
wh - is the population proportion in each
batch
d-is the marginal error, i.e. d=10%=0.1
3.5Allocation of sample survey
An important consideration in stratified sampling has the
way in which the total sample size was allocated to each and
every stratum. A good allocation has one where there was a

reasonable balance between precision and resources. In this
stud I would tire to used proportional allocation since
there was different number of size in each stratum, from
other methods it has appropriate to this study in such a
way to achieve the least variance for the overall mean per
unit of cost, because of this researchers needed the
proportional allocation formula given by:
nh=n∗NhN , where nh be the sample drawn from hth stratum.
Nh be the population size in the h
th stratum.
Applying similar procedure the size from each stratum is
found as n1 from the geology, n2 from statistics, n3, from
Math’s, n4, from Physics, n5, from Metrology,n6, from Biology
andn7 , from chemistry batch students respectively as
follow. To allocate each department sample size, I used
proportional allocation method of sampling techniques.
nh=Nh∗nN Where, N total population
Where N= N1+N2+N3+N4+N5+N6+N7
n=no
1+noN=
152
1+152662
= 124
n1=N1∗nN =49∗124662 =9

n2=N2∗nN =112∗124662 =21
n3=N3∗nN =108∗124662 =20
n4=N4∗nN =37∗124662 =7
n5=N5∗nN =51∗124662 =10
n6=N6∗nN =170∗124662 =32
n7=N7∗nN =135∗124662 =25
The total sample size is: n=n1+n2+n3+n4+n5+n6+n7
n=9+21+20+7+10+32+25=1
24
3.6 Method of data Collection.
The main sources of data for this study was primary data was
directly collected from students through questionnaires that

are selected as a sample. Some secondary sources of data
were used for this study. This secondary source of data has
used as a literature to get more relevant information
related to this study. This data was collected from
different books, written documents associated with this
study, internet and other references related to this study.
The study was conduct by using primary data that has
collected by using self-administered questionnaire in both
closed and open-ended way, that was distributed to the
students of the selected department in Arab Minch University
case study in Abaya campus students and secondary data that
has revised from recorded documents in register department
records to find target population of the students (N).
3.7 Variables of the Study
Dependant variable
Student’s academic performance (CGPA).
Independent variables
Average monthly income of student’s
Alcohol (yes and no)
Chat (yes and no)
Cigarette (yes and no)

Departments
Sex (male and female)
Time spent on the study (2:00-3:00, 3:00-5:00, 5:00-7:00
and>7:00)
3.5. Method of data collection
For this study the primary data collection method used from
ARBA MINCH UNIVERSITY IN ABAY CAMPUS in grauguated student
in 2005 by using questionnaire and interviews from the
sample households of that area. And I could collect the data
from the sample is that using self administer questioners
and face-to-face interviewing methods.
3.6 Method of data Analysis
To summarize and analyze the data the descriptive and
inferential statistics were used. Descriptive statistics is
deal with the method used to collection, organization,
analyzing, and interpreting of data; such as mean, variance,
percentages, etc. Inferential statistics is a set of methods
used to make generalize from sample to population by
performing estimation and hypothesis testing; such as tests
for comparing means, test of association and regression
model are particular methods employed for this study.

3.6.1. Independent Sample T-test
T-tests used to compare two group’s score on the same
variables; the observation from the first sample must not
have any bearing on the observation from the second sample.
Moreover the scores must be continuous and follow normality.
It tests the equality of mean of two groups in such a way
that: H0:µ1=µ2 versus H1:µ1≠µ2, where µ1 is the mean of the
first group of population, and µ2 is the mean of the second
group of the population. Based on the independent sample
from the population we reject the null hypothesis if the
absolute value of the test statistic is greater than the
critical value at α= 5% (/T/>tα/2(n1+n2-2)), or we reject H0 if
p-value is less than α level of significance otherwise
retain. Where, test statistic
T=x̄1−x̄2
Spooled√ 1n1
+1n2
~t(n1+n2−2)
3.6.2. One-way ANOVAIt involves the comparison of several means of a treatment
based on independent random sample drawn from population
associated with the treatment. It used to study the effects
of some variables on the mean of the level of treatment.
Model: yij=µ+ti+εijfori=1,2………….a,j=1,2………….n
Where:yijis the jthobservation in the ith treatment, is the
overall mean, tiis the ithtreatment effect and εijis the
random error of the fixed effect model.

The used of ANOVA has to test the overall significance of
the regression model and by listing the individual
regressions coefficients used F-test to check if there was a
relationship between dependent variable and independent
variables.
Here ANOVA table construct like bellow:
Source
of
variatio
n
Sum of
square
Degree
of
freedo
m
Mean sum
square
F-test
statistic
s
Regressi
on
Error
SSR=(yi-
ŷi)2
SSE=(yi-
ŷi)2
k-1
n-k
MSR=SSRk−1
MSE=SSEn−k
F=MSRMSE
Total SST=SSR+SS
E
n-1
Hypothesis testing for the above two models
Step 1: state the hypothesis and identify the claim
Ho: the two regression models have the same
intercept

H1: the two regression models have different the
intercept
Step 2: compute the test statistics.
Step 3: Decision-making base on the test statistics.
Reject Ho where Fcal > Ftab (n, n-k-1) and p-value
less than the significant level of α, accept otherwise.
Remark: since the dummy variables are non-stochastic (at
least somewhat error free), they pose no especial problems
in the application of OLS. However, care must be exercised
in transforming data involving dummy variables. In
particular, the problem of autocorrelation and
multicolinearity need to be handled very carefully.
Model assumptions:
yij are normally and independently distributed
The model errors are normally and independently
distributed with mean zero and constant variance δ2.
Homogeneity of the variance (all treatments have equal
variances)
Linearity (Additive assumption)
Hypothesis testing:
H₀: µ1=µ2=…=µa (there is no difference between means of
treatments)

H1: there is at least one difference among the means of a
treatment.
From random samples of equal or unequal size the following
test statistic is computed make decision about the
hypothesis of equality of means.
Fcal=MST
MSE, which has F distribution with degree of freedom
(a-1) and (an-1). Reject H0, ifFcal>Fα¿ ¿, otherwise it is
accepted, or if P-value is less than α-level of
significance, reject Ho otherwise accept. If the null
hypothesis is rejected we make pair wise mean comparison
LSD, Turkey’s tests, etc.
3.7.2.2 Multiple linear regressions model
Multiple linear regression analysis is used to estimate
models to describe the distribution of a response variable
with the help of a number of independent (predictors). In
multiple linear regression analysis, we have several
explanatory variables (X’s) and one dependent variable Y,
and assume that the relationship between Y and X’s is
linear, then the model that indicate the linear relationship
between Y and X’s is given by:

yi=β0+β1x1i+…………+βkxki+εii=1,2…………n
Where,yiis theith observation of response variable.
x1i………..xkiare predictor variables corresponding to ith
observation
β0is the value of mean response when all predictor variables
are set to zero
β1………….βkis the change in average response for each unit
change in corresponding predictor variable
Model Assumptions are:
The relationship between yi¿xkiis linear.
The random errors are independently and normally
distributed with mean 0 and variance δ2.
There is no multicolinarity between predictor
variables.
Parameters of the model are estimated by fitting model to
the data using least square method or maximum likelihood
method; often coefficients are estimated by minimizing sum
of squares of the error with respect to parameters (Ordinary
Least Square method).Thus, the matrix notation of least
square estimator for parameter β is: β̂OLS=(X'X)−1X'Y.
To see significance of each independent variable (relative
importance) on dependent variable the hypothesis that could

be tested is given as H0:βi=0, for i=0,1,2...k with two tailed
alternative. T statistics is used for comparing with
critical value from T table or with its corresponding
probability of rejection (Type I error=α). To test
significance of overall model one test the null hypothesis
stated as: H0:β1 = β2= β3 = . . . = βk = 0 , meaning all explanatory
variables X1, X2,...,Xk do not have effect simultaneously on
the dependent variable versus alternative hypothesis stated
as at least one of the βi’s is different from zero. To test
this hypothesis we use F-test; the test statistic is given
asFcal =
SSR/ (k−1)SSE/ (n−k )
The decision to test overall significance of model is
rejecting H0 if Fcal>F(k−1, n−k )
(α) , where, α is level of
significance, k-1 and n-k are degree of freedoms
corresponding to SSR and SSE respectively, or we reject H0
if p-value is less than α.
The coefficient of determination shows how the explanatory
variable explains the dependent variable or measure goodness
of fit of the model. The larger value of the R2 indicates
the model is good, where R2=1−SSESST
Model Adequacy Checking

Model adequacy diagnostic procedures are intended to check
how well the assumptions of multiple linear regressions are
satisfied. Violation of these assumptions cast doubt on the
validity of the conclusions drawn on the basis of the
results. Here bivariate and scatter plot is used to test
linearity, P-P plot is used to test normality, and to test
multicollinearity variance inflation factor is used. The
assumption about autocorrelation among residuals is not
tested since our model is crossectional model. If one of the
assumptions is violet remedial are taken; like
transformation could be used to change the data in suitable
form for analysis.
Test of presence of multicolinarity
Multicolinsarity refers to the existence of high (perfect)
linear relationship among regress ores can test the presence
of multicolinarity by variance inflation factor,
If value of VIF less than 5 then there is no multicollinarity in the data .as we can see the value are ofVIF from Minitab out put on value are less 10,this indicatesthat there is no multicolinarity in the data
Homoskedasticity (Constant Variance)
The constancy of the variance of the dependent variable
(error variance) can be examined from plots of the residuals
against any of the independent variables, or against the
predicted value Assumption of Homoskedasticity


4. RESULT ANDDISCUSSION
4.1 DISCRIPTIVE ANALYSIS RESULT
From the table 4.1 among 124 students 28.2% are female and
71.8 % are male.
About 56.45% were chewing chat which is about 70 and 43.5%
respondents are non chewing chat which is about 54. Hence
majority of the respondents were found that chewing chat.
According to above result in table 4.1, I can conclude that
most of the respondents are drink alcohol (57.3%) which is
about 71 respondents when I compare those of respondents who
no drink alcohol (42.7%) from 53 respondents out of 124
samples. This implies that respondents are more participated
with drinking alcohol is more than the respondents of who
nondrinking alcohol.

According to the table 4.1, I can conclude that most of the
respondents are not smoke cigarette (69.4%) which is about
86 respondents when I compare those of respondents who
smoking cigarette (30.6%) or only 38 respondents out of 124
samples. This implies that the respondents are more
participated out of smoking cigarette is more than the
respondents of smoking cigarette.
The table 4.1 for sex, chewing chat, drinking alcohol and
smoking cigarette.
Codenameforcategoricalvariable
Frequency
Percent
ValidPercent
CumulativePercent

Sexofstudents
Female 3528.22581
28.22581
28.22581
Male89
71.77419
71.77419 100
Chewingchat
No 5443.54839
43.54839
43.54839
Yes 7056.45161
56.45161 100
Drinkalcohol
No 5342.74194
42.74194
42.74194
Yes 7157.25806
57.25806 100
Smokingcigarette
No 8669.35484
69.35484
69.35484
Yes 3830.64516
30.64516 100
. 4.2 INFRENTIAL ANALYSIS
The inferential analysis to examine the factors of our
questionnaire associated with addiction. degree of freedom
and levels of significance are reported. Next, we performed
academic performances as the dependent variable and time
students spent on the study as a independent variable. In
all calculations, p values under 0.05 were considered
significant. All figures and graphs were produced with SPSS
13.0
From Table 4. 3 the hypothesis equality of sex is rejected,
since p-value (0.004) is less than level of significance
(α=0.05). This tells us sex is related to CGPA in Arba

Minch, because the mean difference in sex is statistically
significant.
Table 4.3 t-test sex for CGPA
Independent Samples Test
3.164 122 .002 .307 .097 .115 .499
3.001 56.145 .004 .307 .102 .102 .512
Equal variancesassumedEqual variancesnot assumed
cgpat df Sig. (2-tailed)
MeanDifference
Std. ErrorDifference Lower Upper
95% ConfidenceInterval of the
Difference
t-test for Equality of Means
From result of Table4.4 the hypothesis equality of chewing
chat is rejected, since p-value (0.000) is less than level
of significance (α=0.05). This tells us chewing chat is
related to CGPA in Arba Minch, because the mean difference
in chewing chat is statistically significant.
Table 4.3 t-test chewing chat for CGPA

Independent Samples Test
-5.653 122 .000 -.461 .081 -.622 -.299
-5.710 117.952 .000 -.461 .081 -.620 -.301
Equal variancesassumedEqual variancesnot assumed
cgpat df Sig. (2-tailed)
MeanDifference
Std. ErrorDifference Lower Upper
95% ConfidenceInterval of the
Difference
t-test for Equality of Means
From result of Table 4.5 the hypothesis equality of alcohol
is rejected, since p-value (0.002) is less than level of
significance (α=0.05). This tells us alcohol is related to
CGPA in Arba Minch, because the mean difference in chewing
alcohol is statistically significant.
Table4.5 t-test alcohol for CGPA
Independent Samples Test
-3.103 122 .002 -.274 .088 -.449 -.099
-3.113 113.376 .002 -.274 .088 -.449 -.100
Equal variancesassumedEqual variancesnot assumed
cgpat df Sig. (2-tailed)
MeanDifference
Std. ErrorDifference Lower Upper
95% ConfidenceInterval of the
Difference
t-test for Equality of Means

From result of Table4.6 the hypothesis equality of smoking
cigarette is rejected, since p-value (0.002) is less than
level of significance (α=0.05). This tells us smoking
cigarette is related to CGPA in Arba Minch, because the mean
difference in smoking cigarette is statistically
significant.
Table4.5 t-test smoke cigarette for CGPA
Independent Samples Test
.883 122 .379 .087 .098 -.108 .281
.844 64.050 .002 .087 .103 -.118 .292
Equal variancesassumedEqual variancesnot assumed
cgpat df
Sig.(2-tailed)
MeanDifference
Std. ErrorDifference Lower Upper
95% ConfidenceInterval of the
Difference
t-test for Equality of Means
As we observed from table 4.7 the p-value less than the α
level of significance we reject the null hypothesis,
Therefore from the above table output indicating that p
value< 0.05 or (0.000<0.05) reject Ho , since we can
conclude that all the above variables have p-value less than

α level it is statistically significant effect on CGPA
(student academic performance) at 5% level of significance

4.2.2. ONE-WAY ANOVA
Table 4: One Way ANOVA Results of Students academic
performance on Different Independent Variables
Sum of Squares df
Mean Square F Sig.
DEPARTEMENT
Between Groups 3.531165 6
0.588528
2.491985
0.026382
Within Groups 27.63167 117
0.236168
Sum of Squares df
Mean Square F Sig.
AVERAGE TIME
Between Groups 2.990944 3
0.996981
4.246706
0.006861
Within Groups 28.1719 120
0.234766
MONTHLY INCOM
Sum of Squares df
Mean Square F Sig.
Between Groups 3.921719 10
0.392172
1.626784
0.107758
Within Groups 27.24112 113
0.241072
cgpa
CHEWING CHAT
Sum of Squares df
Mean Square F Sig.
Between Groups 6.467909 1
6.467909
31.95331
1.06E-07
Within Groups 24.69493 122
0.202417
Total 31.16284 123
DRINKING ALCHOL
Sum of Squares df
Mean Square F Sig.
Between Groups 2.279985 1
2.279985
9.630565
0.002379
Within Groups 28.88285 122
0.236745
Total 31.16284 123 SMOKING CIGARET
Sum of Squares df
Mean Square F Sig.
Between 0.198085 1 0.19808 0.7804 0.3787

Groups 5 46 42Within Groups 30.96475 122
0.253809
31.16284 123
4.2.2Multiple Linear Regression Analysis
Multiple regression analysis has been viewed only as away to
describe the relationship between a dependent variable and
several independent variables.
Ŷ=β0ˆ+β1
ˆX1+β2ˆX2+β3
ˆX3+β4ˆX4+β5
ˆX5+β6ˆX6+β7
ˆX7+β8ˆX8
Co linearity statistics tells as whether multicollinearity
exists in in the model or not. From the result, we see that
the variance inflation factor (VIF) is very small; hence, I
can conclude that there is no problem of multicolinearity
presents in the data. Of course, Tolerance of all variables
is closer to one, which implies that the variables are not
collinear with each others.
β0= 2.298 indictes that the value of CGPA when the
explanatory variables (assume are zero. βo is posative
indicate that there is effect of independent variables on
the dependent variable ( CGPA )
β1 = 0.335 is greater than zero this indicates that there is
positive (direct) relationship between sex of student and

CGPA .
β2 = 0.080 is greater than zero this indicates that there
is positive (direct) relationship between CGPA and
department of the students.
β3 = 0.057 is greater than zero this indicates that there is
positive(direct) relationship between CGPA and average time
.
β4 = 0.001 greater than zero this indicates that there is
positive (direct) relationship between CGPA and monthly
income.
Β5 = -0.421 is less than zero this indicates that there is
negative (indirect) relationship between chewing chat and
CGPA.
β6 =-0.276 is less than zero this indicates that there is
negative (indirect) relationship between drinking alcohol
and CGPA.
β7 = 0.122 is greater than zero this indicates that there is
positive (direct) relationship between smoking cigarette and
CGP.
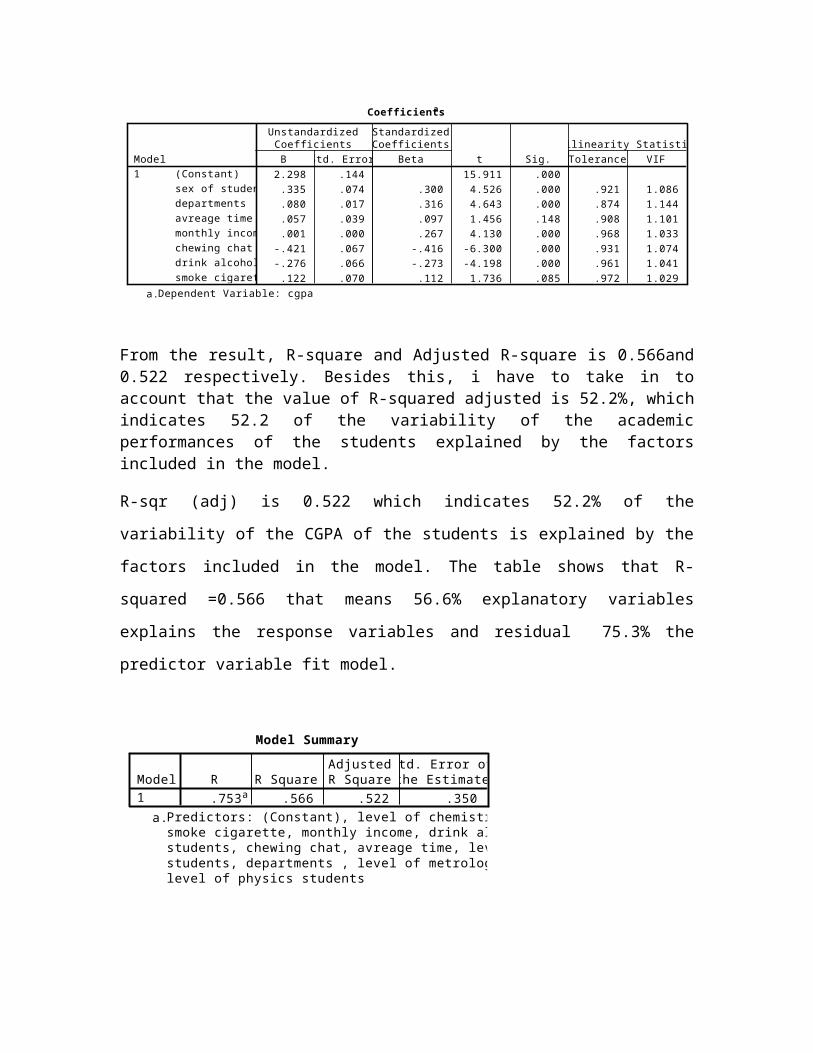
Coefficientsa
2.298 .144 15.911 .000.335 .074 .300 4.526 .000 .921 1.086.080 .017 .316 4.643 .000 .874 1.144.057 .039 .097 1.456 .148 .908 1.101.001 .000 .267 4.130 .000 .968 1.033
-.421 .067 -.416 -6.300 .000 .931 1.074-.276 .066 -.273 -4.198 .000 .961 1.041.122 .070 .112 1.736 .085 .972 1.029
(Constant)sex of studentsdepartmentsavreage timemonthly incomechewing chatdrink alcoholsmoke cigarette
Model1
B Std. Error
UnstandardizedCoefficients
Beta
StandardizedCoefficients
t Sig. Tolerance VIFCollinearity Statistics
Dependent Variable: cgpaa.
From the result, R-square and Adjusted R-square is 0.566and0.522 respectively. Besides this, i have to take in toaccount that the value of R-squared adjusted is 52.2%, whichindicates 52.2 of the variability of the academicperformances of the students explained by the factorsincluded in the model.
R-sqr (adj) is 0.522 which indicates 52.2% of the
variability of the CGPA of the students is explained by the
factors included in the model. The table shows that R-
squared =0.566 that means 56.6% explanatory variables
explains the response variables and residual 75.3% the
predictor variable fit model.
Model Summary
.753a .566 .522 .350Model1
R R SquareAdjustedR Square
Std. Error ofthe Estimate
Predictors: (Constant), level of chemistry students,smoke cigarette, monthly income, drink alcohol, sex ofstudents, chewing chat, avreage time, level of geologystudents, departments , level of metrology students,level of physics students
a.

From the result, I can decide that whether accepting or
rejected HO. This is depend on p_value and α =0.05 level of
significance. Since p-value=0.000 is less than F-value which
12.703 at given level of sign.
From the decision rule it can be conclude that the model of
the estimated (ANOVA) model are significance. This also
indicates that there is a linear relationship between
dependant and independents variables. Therefore, I have
enough evidence to reject the null hypothesis.
From the below decision, I can decide whether accepting or
rejected HO: This is depending on p_value and α =5% level of
significance. Since the p-value=0.000 is less than α=0.05
level of significance. Therefore, there is no significance
evidence to accept the null hypothesis.
From the below decision rule, it can be concluding that the
academic performances of the students that caused by
addiction are different from the academic performances of
students that do not caused by addiction. That means two
regression model have different intercept.

ANOVAb
17.086 11 1.553 12.703 .000a13.084 107 .12230.170 118
RegressionResidualTotal
Model1
Sum ofSquares df Mean Square F Sig.
Predictors: (Constant), level of chemistry students, smoke cigarette, monthlyincome, drink alcohol, sex of students, chewing chat, avreage time, level of geologystudents, departments , level of metrology students, level of physics students
a.
Dependent Variable: cgpab.
Dependent variable: Academic performance of students
Normality check of the response variable: Cumulative grade
point.
The p.p plot of regression standardized residual is
normal .it shows that there is a linear relationship between
response &explanatory variables and there is no outliers, if
there is no outliers, no hetroscedacity problem exist;
The error term is normally distributed mean zero andvariance sigma square.
i.e. ~ N (0, б2)

1.00.80.60.40.20.0
Observed Cum Prob
1.0
0.8
0.6
0.4
0.2
0.0
Expected Cum
Prob
Dependent Variable: cgpa
Norm al P-P Plot of Regression Standardized Residual
This scatter plot of regression Residual Versus theFitted values shows that there is Homosecandcity ofvariance relationship between the academic performancesof students and observed (explanatory) variable.
This scatter plot of regression Residual Versus the
Fitted values shows that there is Homosecandcity of
variance relationship between Average family size
(person per households) and observed (explanatory)
variables.


5. CONCLUSSION ANDRECOMMENDATION
5.1 CONCLUSSIONSBased on above statistical analysis we can forward followingconclusion as below;
Smoke cigarette has a positive effect on the academic
performance of students.
Among 124 respondents 56.5% of the students caused by
chewing chat and the other 43.5% of the students do not
caused by chewing chat.
Among 124 respondents, 56.5% of the students use chewing
chat which is 70and 57.3use drink alcohol which is about
71and 30.6 smoke cigarette which is about 38 .The
respondent do not use the above stimulants 43.5% not
chewing chat which is about 54 and the respondent do not
drink alcohol42.7% which is about 53and also the
respondents who not smoke cigarette is 69.4% which is
about 86. The academic performances of the students that
use stimulants are less than the academic performances
of the students that do not use stimulants. That means
the students who do not use stimulants (not addicted)
get a good academic result then those who are addicted.
Drinking alcohol has an effect on the academic
performance of students or stimulants of alcohol have
independent on academic performances of students

The magnitude of the ANOVA indicates CGPA affect by somevariables. About the factors of alcohols, sex, chewingchat, smoking cigarette, average time, monthly income,and department was statically significant in regressionmodel.
5.2 RECOMENDATIONS Based on the result and discussion, the following
recommendations are forwarded;
Since from the addiction chewing chat has a side effect
on students academic performances, the students should
not use chewing chat for increasing reading and
understanding to improve their academic performances
In order to avoid the impact of addiction, the students
should be developing different techniques in order to
avoid the impact of addiction on their academic
performance by learning and advice to use time properly
and systematically and increasing their CGPA.
All students and Governments or other educated person
should give attention for impact of addiction on academic
performance because; this factor has a great effect on
academic performance of the students.
Overall, Addiction is a serious impact on student’s
academic performances. There is a need for a campaign to
inform parents, teachers and state officials about the
dangers of the addiction.

REFERENCE
1. Adam Kediri Gelato, (2005), “Introduction to basic statistics& its
applications”, 1st edition, Ethiopia printing press.
2. Cochran, W.G (1977), “Sampling techniques”, 3rd edition, John Wiley &sons,
inc.., New York.
3. D.N. Gujarati (2005), “Basic Econometrics”, 3rd/4th editions. (McGraw-Hill:
New York.
4. George. W. (1881), “Statistical Methods”, 7th edition, Iowa state university.
5. Gubta S.C, Kapoor U. K. (1995),”Fundamentals of applied statistics”, 3rd
edition, Sultan Chanda and Sons. , New Delhi
6. Lwanga SK and Lemeshow.S (1991). The impact of addiction on society in
Health studies: A practical Manual. Geneva: World Health Organization.
7. http://www.google.com.et/, the impact of addiction on students on their
academic performance.
Arab MinchUniversity Collegeof Natural Science

Departmentof Statistics
Questionnaires
Dear respondent this questionnaire is prepared to collectdata about the impacts of addiction on academic performance,in Arba-MinchUniversity the case study in Abay campusstudents. So, I would like to thank your collaboration andwillingness to give me correct information kindly.
Instruction: please give responses to the question by mark athick (√) marks on the boxes are provided and write thenecessary information in the space provided.
1. Sex Male Female
2. Your department ________________________
3. Average time of study per day
2:00-3:00hrs 3:00-5:00hrs 5:00-7:00hrs
>7:00hrs
4. Your CGPA ___________________
5. Your average monthly income in Birr________________
6. Do you chewing chat? Yes No
7. When you start chewing chat?
In elementary in high school in university
8. Who gives you the financial supported

Family Relative Friend Others
9. If your answer is “yes” in question 6 why you use chewing
chat?
Spending time To improve understanding
For refreshment By influencing of friends
others
10. After you have chew chat what is your motivation for
reading
Increase decrease no changed
11. Do you drink alcohol? Yes No
12. If you drink alcohol, how often do you drinking alcohol
Usually always sometimes
13. Do you smoke cigarette? Yes No
14. When you start smoking cigarette?
In elementary in high school in University
15. If your answer in 13 is “yes”, how much cigarette you
smoke per day?
One cigarette Two cigarette Three
More than cigarette
16. How often you smoke cigarette?

Usually always
sometimes
Thank you for your
cooperation!!