SEPARATION OF n-PARAFFIN HYDROCARBONS ... - ShareOK
86
SEPARATION OF n-PARAFFIN HYDROCARBONS BY THE UREA ADDUCTION PROCESS BY MOHAMMED REZA ARSHADI " Bachelor of Science Missouri School of Mines and Metallurgy Rolla, Missouri 1959 Submitted to the faculty of the Graduate School of the Oklahoma State University in partial fulfillment of the requirements of the degree of MASTER OF SCIENCE August, 1961
-
Upload
khangminh22 -
Category
Documents
-
view
2 -
download
0
Transcript of SEPARATION OF n-PARAFFIN HYDROCARBONS ... - ShareOK

SEPARATION OF n-PARAFFIN HYDROCARBONS
BY THE UREA ADDUCTION PROCESS
BY
MOHAMMED REZA ARSHADI "
Bachelor of Science
Missouri School of Mines and Metallurgy
Rolla, Missouri
1959
Submitted to the faculty of the Graduate School of the Oklahoma State University in partial fulfillment
of the requirements of the degree of MASTER OF SCIENCE
August, 1961

SEPARATION OF n-PARAFFIN HYDROCARBONS
BY THE UREA ADDUCTION PROCESS
Thesis Approved:
/ Dean of the Graduate School
472713
ii
OKLAHOMA STATE UNIVERSITY
LIBRARY
OCT 11 1961

PREFACE
One of the newest separation techniques is the formation
of the crystalline inclusion complexes, adducts as they are
commonly called,of urea with straight chain saturated hydro
carbons. This technique has already become a useful and
powerful tool in petroleum and petrochemical industries.
Judging from the number of the patents being issued on
separation processes employing urea, it can be assumed that
considerable effort is being devoted by oil companies in this
direction. As a result, numerous cyclic processes have been
proposed. However, very little information is available on the
fundamental aspects of the mass transfer and the rate of crys
tal formation.
The basic purpose of this project was to study the
mass transfer and the kinetics aspects of the urea adducts
formation. However, there were some preliminary data, such
as the solubility of n-paraffins ln aqueous acetic acid
isobutanol solutions, which had to be determined. Although
a few experiments were performed on the mechanism of the
urea adduct formation, a great part of this work is con
cerned with the determination of the primary data.
I would like to take this opportunity to express my
gratitude to Dr. R. N. Maddox and other members of the
iii

Chemical Engineering Staff for their helpful and valuable
suggestions, and particularly a special debt of gratitude is
due Dr. J.M. Marchello for his kind guidance and professional
advice.
The author is grateful for the financial assistance rendered
by the Oklahoma State University and the National Science Founda
tion.
iv

TABLE OF CONTENTS
Chapter Page
Io INTRODUCTION" • o o • o •• o ••• o • • • • • • • • • • • • • • • • • • • • • • • • • • • • • 1
Application of Urea Adduction................... 2 Objectives...................................... 4
II. SURVEY OF LITERATURE.................................. 6
Mass Transfer Across Liquid-Liquid Interface.... 6 Nucleation or Formation of the Initial
Adduct Crystals........................... 8 Growth Kinetics of Complexes.................... 10
III. EXPERIMENTAL APPARATUS AND PROCEDURE.................. 12
Measurement of Solubilities of Pure Hydrocarbons in Water-Additives
Solution............................ 17 Determination of the Solubility of Urea
in Water-Additives Solution............... 18 Determination of Equilibrium Concentration
of n-Octane in Aqueous Urea Solution...... 19 Determination of Over-all Rate Constant......... 19 Chemicals. . . . . . . . . . . . . . . . . . . . . . . . . . . . . . . . . . . . • . • 20
IV. THEORETICAL CHARACTERISTICS OF THE EQUIPMENT •.••.•••••
V. RESULTS AND DISCUSSION .•.••••••.•••.•.•••••.••.••.•••• Determination of Solubility of Urea in
Water-Additives Solution ••••.•••••••.••••• Over-all Coefficient •••••••••.•••.•..•....•••••• Mass Transfer Coefficient, K , and
M h . ma e c an1 sm . .......................•.......•
VI. CONCLUSIONS AND RECOMMENDATIONS •••.•••••••••••••••••••
21
57
58 61
62
65
Restatement of the Problem...................... 65 Conclusionso.................................... 65 Reconunendat ions o.. . . • . . . . . . . . . . . . • . . . . . . • . . . . . • • 66
A SELECTED BIBLIOGRAPHY. • • . • • • • . . • . • • • • . • . • • • • • • • • • • • • • • • • • • • 67
APPENDIX A - DEFINITION OF TERMS............................. 69
V

TABLE OF CONTENTS (Continued)
APPENDIX B - DENSITY OF ISOBUTANOL........................... 72
APPENDIX C - SAMPLE CALCULATIONS............................. 74
vi

LIST OF TABLES
Table Page
I. OVER-ALL COEFFICIENT FOR n-OCTANE AVERAGE FLOW RATE 13.5 AT TEMPERATURE 25.0° C............... 25
II. OVER-ALL COEFFICIENT FOR n-OCTANE AVERAGE FLOW RATE 3.95 AT 25° C............................. 28
III. OVER-ALL COEFFICIENT FOR n-OCTANE AVERAGE FLOW RATE 19.8 AT 25° C............................. 30
IV. OVER-ALL COEFFICIENT FOR n-HEPTANE AVERAGE FLOW RATE 13.2 AT 25° C............................. 33
V. OVER-ALL COEFFICIENT FOR n-NONANE AVERAGE FLOW RATE 5.60 AT 25° C............................. 36
VI. EQUILIBRIUM CONCENTRATION OF OCTANE IN UREA SOLUTION AT 27.10° C........................... 41
VII. SOLUBILITY OF n-PARAFFIN HYDROCARBON IN WATER-ADDITIVES SOLUTIONS AT 27.10°C................. 42
VIII. SOLUBILITY OF n-PARAFFIN HYDROCARBONS IN ISO-BUTANOL SOLUTIONS AT 27.10° C.................. 45
IX. MASS TRANSFER COEFFICIENT FOR n-OCTANE AVERAGE INLET FLOW RATE 13.5 AT 25° C.................. 47
X. MASS TRANSFER COEFFICIENT FOR n-OCTANE AVERAGE INLET FLOW RATE 3.95 AT 25° C.................. 49
XI. MASS TRANSFER COEFFICIENT FOR n-HEPTANE AVERAGE FLOW RATE 13.2 AT 25° C........................ 51
XII. MASS TRANSFER COEFFICIENT FOR n-OCTANE AVERAGE INLET FLOW RATE 19.8 AT 25° C.................. 53
XIII. MASS TRANSFER COEFFICIENT FOR n-NONANE AVERAGE FLOW RATE 5.60 at 25° C........................ 55
XIV. SOLUBILITY OF UREA IN WATER-ADDITIVE SOLUTION AT 27.10° Coo•o•••••••••••••••••••••••••••••••• 59
XV. DENSITY OF ISOBUTANOL SOLUTION AT 27.10° C............ 73
vii

LIST OF ILLUSTRATIONS
Figures Page
1. Schematic Drawing of Agitated Reactor for Urea Complex Formation......................... 13
2. Schematic Drawing of Packed Column Used in the Studies of Urea Adduct Formation............... 15
3. Special Box Designed for Solubility Measurements. o..................................... 16
4. Rate of Absorption of n-Octane in Saturated Urea Solution, F1 = 13.5 cc/min.................... 26
5. Variation of Over-all Mass Transfer Coefficient for n-Octane, F1 = 13.5 cc/min..................... 27
6. Rate of Absorption of n-Octane in Saturated Urea Solution, F1 = 3.95 cc/min.................... 29
7. Rate of Absorption of n-Octane in Saturated Ure a Solution, F1 = 19.8 cc/min.................... 31
8. Variation of n-Octane Over-all Mass Transfer Coefficient with Flow Rate......................... 32
9. Rate of Absorption of n-Heptane in Saturated Urea Solution, F1 = 13.2................. 34
10. Over-all Mass Transfer Coefficient for n-Heptaneo••••••o•••o•••••••••••••••••••••••••••••• 35
11. Rate of Absorption of n-Nonane in Saturated Urea Solution, F1 = 5.60 cc/min.................... 37
12. Over-all Mass Transfer Coefficient for n-N onane. • . • . • . • . . . . . . . • . . . . . . . . . . . . . • . . . . . . . . . • • • . 38
13 . Variation of Over-all Mass Transfer Coefficient for n-Heptane, n-Octane, and n-Nonane.................. 39
14. Solubility of n-Heptane and n-Octane in Water Containing One Per Cent Acetic Acid and Varying Amounts of Isobutanol............... . .............. 43
viii

LIST OF ILLUSTRATIONS (Continued)
Figures Page
15. Solubility of n-Nonane and n-Decane in Water Containing One Per Cent Acetic Acid and
Varying Amounts of Isobutanol..................... 44
16. Solubility of n-Heptane, n-Octane, n-Nonane and n-Decane in Isobutanol-Water Solution Varying
the Amount of Isobutanol.......................... 46
17. Variation of n-Octane Mass Transfer Coefficient with Time F1 = 13.5 cc/min.......................... 48
18. Variation of n-Octane Mass Transfer Coefficient with Time F1 = 3.95 cc/min.......................... 50
19. Variation of n-Heptane Mass Transfer Coefficient with Time F1 = 13.2 cc/min.......................... 52
20. Variation of n-Octane Mass Transfer Coefficient with Time F1 = 19.8 cc/min.......................... 54
21. Variation of n-Nonane Mass Transfer Coefficient with Time F1 = 5.60 cc/min.......................... 56
22. Solubility of Urea in Water Containing Acetic Acid and Varying Amounts of Isobutanol................... 60
ix

CHAPTER I
INTRODUCTION
Urea selectively crystallizes with organic compounds that
have a long straight-chain group to produce a solid filterable
complex or adduct*. The principle of urea adducts formation is
that; urea molecules form a channel large enough to accommodate
straight-chain types of organic compounds, but not cyclic or
branched compounds. In some cases urea can form crystalline complexes
with long molecules that have an appropriately placed methyl group
t . t . 1 1 · ( 5 ) Th · · · or acer ain ermina mono-eye ic group • ere is a minimum
chain length for urea adducts formation at given temperature. At
25° C, for example, the minimum chain length for n-paraffins is
(30) six carbon atoms • Therefore the formation of urea adducts is
a function of the length of the straight-chain and the cross-
section of the organic molecules.
The urea adducts are stable at room temperature and yet they
can be decomposed to the original compounds without great diffi-
culty. Dissociation of the urea complexes can be accomplished
by heating the crystals to about 130° Corby dissolving the
• Complex is a substance, ordinarily in crystalline form, consisting of two or more compounds, each one capable of existing by itself. When one of the compounds is contained in the frame work of the other, the frame represents a channel or a cage and the complex is called an inclusion complex.
1

2
crystals in water at room temperature. In heating the complex,
a layer of hydrocarbon is formed over a layer of melted urea.
When the adducts are dissolved in water, a hydrocarbon phase and
aqueous urea solution is formed.
The solvent for urea in urea adduction processes is water
or some low molecular weight alcohols, such as methyl alcohol.
The aqueous solution has the advantage that little urea will dis-
solve in the organic phase, thus making the recovery of urea
. 1 d ff' . t( 6 ) T . th t f t 11 ' s1mp er an more e 1c1en • o improve era e o crys a 1-
zation of adducts from aqueous urea solution, the addition of
d 1 1 . t b d d( 6 )· some secon ary a coho such as 1sobu anol has een recommen e
Keeping the Ph of the solution below seven by addition of small
amount of acetic acid will also favor the rapid formation of urea
complexes. The use of methanol as a solvent for urea has been
suggested by some early investigators, as:
schield( 30), Redlich( 2l), and Schlank( 6 ).
B (1) z· engen , 1mmer-
The saturated methanol
urea solution process can be operated at a lower temperature than
the aqueous solution process. The problem of chemical recovery,
however, can be overcome by addition of water to methanol. The
use of satura ted methanol-urea solution has been particularly
recommended for laboratory investigations as well,as for treating
wax and heavy distillate.
Application of Urea Adduction
As one may expect, the most important application of urea
adduction is in separation of n-paraffin hydrocarbons from branched,
cyclic and aromatic compounds. Normal paraffins can be produced
free from branched type as well as oxygen, sulfur and nitrogen

3
compounds present in most crude oil, by the urea extractive
crystallization process. Subsequent fractional distillation
of the straight-chain saturated hydrocarbons yields individual
compounds.
So far there has not been a great demand for normal paraffins,
although in the future they may be considered for use as feed
stock in preparation of detergents, fatty acids, paint thinners
and as solvent in the extraction of vegetable oils(S~ The removal
of n-paraffins, however, from some petroleum fractions, such as
gasoline and kerosene is of great importance. At the present
time, from the economical standpoint, urea adduction cannot com-
pete with catalytic reforming.
Since normal paraffins have a low octane number and a
relatively high freezing point, the removal of these hydro-
carbons from gasoline fractions will improve the octane number.
The military requirement of low pour point of kerosene as jet
fuel can also be met by removal of n-paraffin from kerosene.
By definition, hexadecane has a cetane number of 100. The cetane
number of other straight-chain hydrocarbons is also high. Thus,
normal paraffin removed from gasoline and kerosene fractions may
be added to diesel fuel as a blend for improving the cetane
number of diesel fuel.
In thermally cracking heavy petroleum waxes, some straight-
h · 1 f" d d Garner(lg) descri"bes a method c ain o e ins are pro uce.
utilizing the urea adduction process for separating these olefin
hydrocarbons from cracking products.

4
Recently there has been considerable interest in the appli-
cation of urea adduct formation in the dewaxing process. Waxes
consisting of a high molecular weight hydrocarbon can be separated
from lubricating oil stock at room temperature avoiding the use
of refrigeration. Even those waxes from n-paraffin that can
escape the removal by low temperature dewaxing processes are
crystallized out by the urea adduction method. Therefore, the
urea adduction process can produce essentially wax free oil with
a low pour point formerly made only from rare wax free crude oil.
(11) . Deutche erdoel A.G. of Heide, Germany , applies the
urea adduction process in producing low pour point oil. An
equal volume of oil and aqueous urea (saturated at 160° F) with
methylene chloride (for temperature control) are vigorously
agitated. The heat of crystallization of urea adducts will vapor-
ize the methylene chloride, keeping the temperature of reaction
around 95° F to 115° F. The methylene chloride is condensed and
brought back into the reactor. The urea adducts are decomposed
by agitation with steam at 170° F giving molten wax and aqueous
urea. The Standard Oil Company of Indiana installed a plant in
1956 for production of refrigerator oils, transfer oils and special
oils for Arctic services.
Objectives
The primary purpose of this work was to study the mass trans-
fer and the kinetics aspects, and to determine the characteristics
of urea adducts formation in agitated suspensions. For this
purpose, the following objectives were set up:
1. Conduct a theoretical study of the factors governing

the urea adducts forma tion.
2. Measure equilibrium data pertaining to the urea
adduction.
3. Design a laboratory apparatus and experimentally
determine the urea adduction rate.
5

CHAPTER II
SURVEY OF THE LITERATURE
The rate of the urea adduct formation and the fundamental
aspects of the mass transfer across the liquid-liquid inter-
face and from liquid to solid phase has received relatively
little direct investigation. In general, for systems such
as those used in formation of urea complexes, there are three
important factors concerning the mechanism and the rate of
crystal formation. These are:
1. Mass transfer across the liquid-liquid interface.
2. Nucleation or formation of the initial adduct
crystals.
3. Growth kinetics of the complexes.
Mass Transfer Across the Liquid-Liquid Interface
Among the numerous concepts of mass transfer between two
. . (17)(28) phases, the film theory of Whitman and Lewis and renewal
(3) theory of Danckwerts are of great importance.
Whitman and Lewis assumed the existence of a stagment
fluid film at the interface which causes a resistance to the
mass transfer. It was further assumed that the only way in which
1 t th h th f ·1 . b 1 1 d"ff · (I7 ) sou e can pass roug e i mis y mo ecu ar i usion •
According to this assumption, the rate of mass transfer can
6

b e e xpressed by t h e equation:
where:
dw de
D
=
=
dw de = (D/X)(C - C)A
a
the rate of mass transfer, g.-eq./sec.
~
molecul a r diffusivity, sq. cm./sec.
X = fictitious film thickness, cm.
A
C
C a
=
=
=
interfacial area sq. cm.
concentration of solution g.-eq./cc.
interfacial concentration g.-eq./cc.
(1)
Danckwerts proposed that instead of assuming the existence
of a fictitious film at the interface, the continuous replace
ment of interfacial surface by the fresh fluid be assumed( 4 ).
Thus, a new term, surface-renewal, was introduced. Based on this
concept, the mass transfer rate e quation, 1, can be written as:
where :
dw de = -* DS (C - C)
a
-1 S = the fractional rate of surface renewal, Sec •
It should be noticed t hat both theories adapted the
concentra tion as the deriving force. Therefore, equations 1
and 2 can be written in a single general form such as:
dw de = K(C - C)A
a
With Kasa constant, namely the mass trans fer coefficient,
-* equal to D/X in Whitman's equation and DS in Danckwerts'
(2)
(3)
( 17) . equation o Sh erwood and Gordon , 1n study of the effect of
7

8
the molecular diffusivity on the mass transfer coefficient,
showed that K, is proportional to Dn, and experimentally found that
the value of n is between 0.5 and unity depending on the physical
condition of the apparatus and the process under consideration.
This is in the fair agreement with equations 1 and 2 in which
n is unity and* respectively.
Up to the present time there have been very few data published
concerning the rate of mass transfer across the liquid-liquid
interface for aliphatic compounds and aqueous urea system.
There have been, however, some dimensionless correlations such
(14) as that which Johnson and Hung obtained in studying the
mass transfer coefficient for baffled agitated vessels. They
developed the following equation which was developed and used
by Sherwood and Gilliland( 7 ) previously:
(4)
Assuming the Danckwerts' theory of surface-renewal to be
correct, they found the exponent of Schmidt number, b, was
equal to 0.5. Using equations 2 and 4 the rate of mass transfer
can be calculated, provided that the constant N and the exponent
c, are known for the system under consideration.
Nucleation or Formation of the Initial Adduct Crystals
The complete causes of crystallization consist of the consecu-
tive processes of nuclei generation and subsequent growth of the
nuclei. The initiation of a phase transformation at certain
recognizable centers is known as nucleation and the propagation
(19) of the transformation from these centers is called growth •

9
A process of crystallization would be described, if the rate of
nucleation as well as growth were entirely known.
A number of investigators have developed expressions for
nucle a tion and growth kinetics. Probably the best attempt is
one due to Becker and Doering(!). Becker(!) proposed the follow-
ing equa tion for nucleation rate.
-E/kT -A(T)/kT J = e e (5)
where :
J = nucleation rate, number of nuclei formed per
unit volume per unit time.
E = activation energy for diffusion.
A(T) = work required to form surface of nucleous.
T = absolute temperature.
k = Boltzman constant.
There are several important points that can be deduced from
Becker 0 s equation: the work term A(T) increases with decreasing
of supersaturation and is infinite at saturation point. Therefore,
the term e-A(T)/kT is zero at saturation. The term e-E/kT increases
with increasing temperature. It has been also shown(l) that e-E/kT
decreases with increase in supersaturation. The curve J versus
temperature has a maximum which corresponds to a definite super
saturation(!). Also it is apparent from the curve J versus tempera-
ture that J is low for an appre~iable supersaturation, but increases
"dl h d f" ·t t t· . h d(l?) F" 11 rapi y wen a e ini e supersa ura ion is reac e • ina y
after a period of time nucleation will occur at any supersaturation.

The growth of the nuclei can be described in the same way
.as nucleation with the assumption that growth is actually a two
(19) dimensional nucleation process •
The use of agitated suspensions in crystallization permits
. (23) operation at high rate crystal production • The study of
the rate of growth of crystals in agitated vessel has received
relatively little direct investigation. The reverse process,
however, the dissolution of solids has been studied and the
10
results correlated in terms of dimensionless groups of pertinent
. (14) variables o
Growth Kinetics of Complexes
Consider the reaction between urea and straight-chain
hydrocarbons:
str.-chain organic compound+ m(urea)___...:;;. urea complex
the rate of reaction at any time is given by the following
equation:
.!!icomplex) m d(time) = KR(str.-chain) (urea) - ~(complex)
In the forma tion of urea adducts, chemical equilibrium is
t bl . h d th . d' h · 1 t · ( 5 ) es a is e e same way as in any or inary c emica reac ion •
When the rate of formation of the complex becomes equal to the
rate of decomposition, that is, when the chemical equilibrium is
established, the above equation can be expressed as:
or :
K = e
K e =
(str.-chain) (urea)m (complex)
(astr.-chain) (aurea)m a complex
=

11
in which (a) is the activity of the corresponding compound. Since
the complex is present as a solid the activity of the complex is
equal to unity, and also, since the reactant is present in a
separate liquid phase the activity of the straight chain compound
is equal to one. Therefore K, the equilibrium constant is a 8
f t . 1 f t t · ( 5 ) I th f ff' unc ion on yo urea concen ra ion • n e case o n-para in
hydrocarbons, the value of K decreases as the chain length ine
creases, indicating the grea ter formation of complexes that con
(5) tain longer organic molecules •
·The degree of dissociation of ur&a adducts in contact with
water depends on the concentration of urea in an aqueous solution.
A complex is stable in aqueous solution, if the concentration of
urea exceeds a certain value called the decomposition concentration.
This can be seen easily by remembering the dependence of equilibrium
cons t ant, K, on the activity of urea. 8
The formation of urea adduct is an exothermic process which
exhibits a heat of reaction about the same as or greater than the
heat of vaporization of the reactant molecules. The relationship
between the equilibrium const ant, K, and the temperature and the 8
he a t of formation can be expressed by the following equation:
H R =
d(ln K) 8
d(l/T)
where R is the universal gas constant.

CHAPTER III
EXPERIMENTAL APPARATUS AND PROCEDURE
The original equipment consisted of a Pyrex cylinder with
a capacity of approximately two gallons (Figure 1). Two steel
plates, one as the top and one as the bottom, completed the
extraction vessel. There was a tin funnel soldered to the
bottom plate which facilitated the collection of the crystals
during the experiments. Two electric strip-heaters combined
with two additional baffles assured good agitation. Two con
stant head tanks each with capacity of four gallons were pro
vided. These tanks served as the charge tank for the organic
and aqueous solution. A rotameter was u~ed in the aqueous
solution line for flow control of the aqueous solution.
The equipment was designed for a continuous operation.
It was found that a continuous process would not be feasible,
unless the aqueous urea phase was supersaturated to the point
of becoming a slurry. This supersaturation could not be accom
plished, unless the urea solution was saturated at a temperature
of 170° F. Since extraction was carried out at a temperature of
approximately 80° F, the temperature control problem complicated
the apparatus designed beyond a reasonable limit. As a result,
the experiments, performed at room temperature, were semi-batch
employing a conventional packed column.
12

8
5
1. Aqueous Urea Solution Constant Head Tank ..
2. Rotameters 3. Mixer 4. Organic Head Tank
I I
h I! 6 '
5. Electric Heaters 6. Organic Inlet
D .~ I , ' ') 1··
7. Urea Solution Inlet 8. Organic Outlet 9. Urea Complexes Outlet
13
------ --- -·-- --- ------------·--·····---·--··--- ---- ------------
Figure 1. Schematic Drawing of Agitated Reactor for Urea Complex Formation

14
The column used was 40 centimeters long, 4.20 centimeters
in diameter and was packed with Berl saddles. Hydrocarbon entered
the column from the bottom and passed upward through saturated
urea solution and left the column from the top. A four liter
separatory funnel was used as a constant head tank (Figure 2) • .
A rotameter was placed in the hydrocarbon line for hydrocarbon
flow rate control. Pyrex glass tubing and Tygon tubing connec-
tions were used.
The equipment for determination of the solubility of
n-paraffins in water and equilibrium concentration of n-octane
were as follows:
1. A burette graduated to 0.02 cc.
2. Five Erlenmeyer flasks varying from 125 ml. to 750
ml. in capacity.
3. Two "Sergeant" magnetic stirrers with Teflon coated
magnetic bars.
4. One 10 ~ (10-6 1.) syringe.
5. A "Precision Scientific Company" constant temperature
bath.
In addition to these, a specialcarboard box (Figure 3)
was designed and built for determination of saturation point
of the aqueous solution. The inside of the box was covered
with black paper. There were two openings on the two adjacent
walls with their axes perpendicular to each other. A light
source was placed in the opposite side of one opening. The
behavior of the aqueous solution could be observed through
the other opening.

2
1. Constant Head Tank 4. Berl Saddle Packing 2. Rotameter 5. Hydrocarbon Inlet 3. Extraction Column 6. Hydrocarbon Outlet
Figure 2. Schematic Drawing of Packed Column Used in Studies of Urea Adduct Formation
15

I
/ /
I
I )---
/ I / I
/ I / I
,, I // I j
(l)----7: ,! / n--___ _ ,., /~
/ (2)
/ /
/
1. Light Inlet Opening
2. Observation Opening
16
_ _I
L-~~~~~~~~~~~~~~~~~~~~~~~~~~~~~~-!
Figure 3. Special Box Designed for Solubility Measurements

Experimental Procedure
Measurement of Solubilities of Pure Hydrocarbon
in Water, Additives Solution
17
The first attempt to measure the solubilities of n-paraffins
in water plus additives involved adding a measured volume of pure
hydrocarbon on the top of a measured volume of isobutanol-acetic
acid solution. The original two gallon glass container was to
be used. Three hundred cc of hydrocarbon was added to 7.26 liter
•,of water plus additives (isobutanol and acetic acid) and the
interface level was noted. After agitating the organic-water
mixture for 24 hours and allowing mixture to settle and separate
into two phases, the change in the interface location was noted.
From the change of the interface position, the amount of hydro
carbon dissolved in water could be calculated. Since the solu
bilities of n-paraffins in water are relatively low, there was
not a considerable change in the position of the interface.
Furthermore, the effect of small change in temperature on the
volume of water solution as well as on the volume of hydrocarbon
couid not be neglected. Due to a large volume of water involved
in the experiment, a variation of 0.02° Fin temperature would
cause a serious error in the results. Consequently, the follow
ing method, which is a modification of cloud point method, was
used.
A small volume of heptane (0.001 cc, at a time) was added
to a measured volume of water plus additives, by means of
10 \ syringe. The solution was stirred for one hour and then
placed in a constant temperature bath for about two hours. The
18
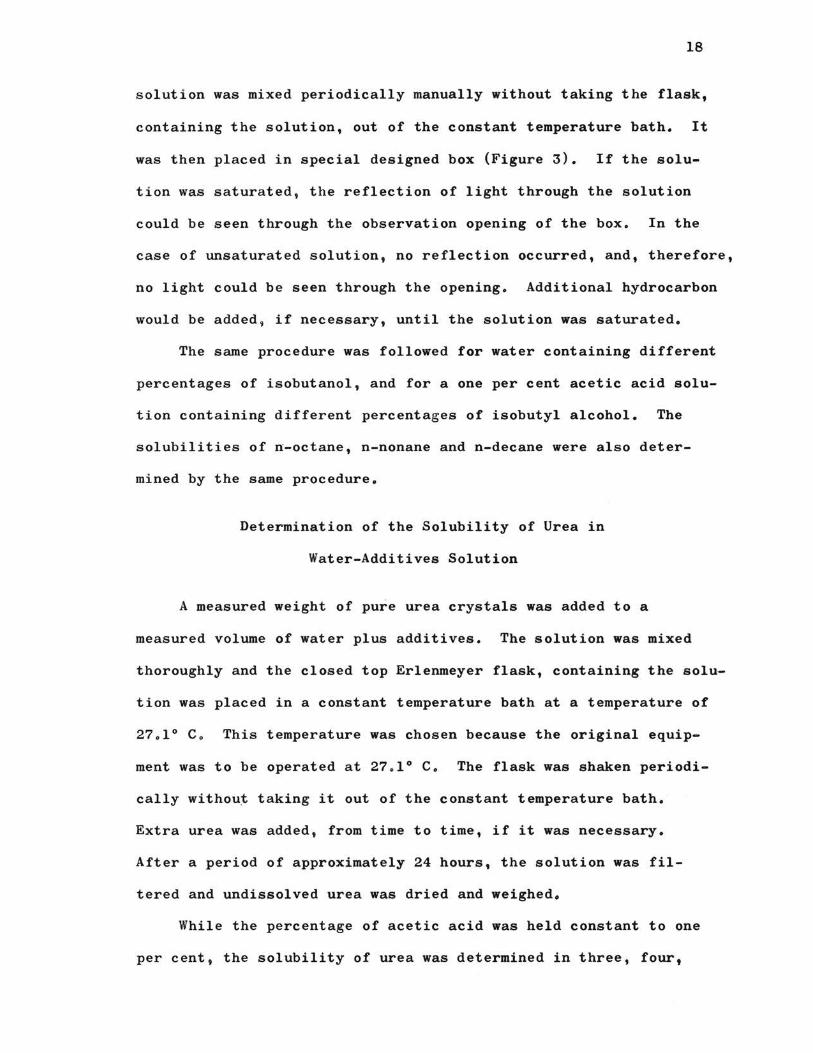
solution was mixed periodically manually without taking the flask,
containing the solution, out of the constant temperature bath. It
was then placed in special designed box (Figure 3). If the solu
tion was saturated, the reflection of light through the solution
could be seen through the observation opening of the box. In the
case of unsaturated solution, no reflection occurred, and, therefore,
no light could be seen through the opening. Additional hydrocarbon
would be added, if necessary, until the solution was saturated.
The same procedure was followed for water containing different
percentages of isobutanol, and for a one per cent acetic acid solu
tion containing different percentages of isobutyl alcohol. The
solubilities of n-octane, n-nonane and n-decane were also deter
mined by the same procedure.
Determination of the Solubility of Urea in
Water-Additives Solution
A measured weight of pure urea crystals was added to a
measured volume of water plus additives. The solution was mixed
thoroughly and the closed top Erlenmeyer flask, containing the solu
tion was placed in a constant temperature bath at a temperature of
27.1° c. This temperature was chosen because the original equip
ment was to be operated at 27.1° C. The flask was shaken periodi
cally withou~ taking it out of the constant temperature bath.
Extra urea was added, from time to time, if it was necessary.
After a period of approximately 24 hours, the solution was fil
tered and undissolved urea was dried and weighed.
While the percentage of acetic acid was held constant to one
per cent, the solubility of urea was determined in three, four,

19
five, six and seven per cent isobutanol solutions. The second
series of the experiments were run without acetic acid in the solu
tions. The percentages of isobutanol ranged from three per cent
to seven per cent in these different runs.
Determination of Equilibrium Concentration
of n-Octane in Aqueous Urea Solution
Pure n-octane was added, by means of 10 ,A,syringe, to a
solution of 10 per cent urea and five per cent isobutanol. The
solution was stirred by a magnetic stirrer for five to ten minutes,
then placed in a constant temperature bath at a temperature of
27.1° C for two hours. The flask containing the solution was
then placed in the special designed box. The light source was
turned on and the solution was slowly stirred by the magnetic
stirrer. The equilibrium point was reached when urea adduct
crystals formed in the solution. If there had not been a trace
of urea adducts in the solution, additional n-octane would have
been added. The same procedure was followed, until small urea
adduct crystals could be observed in the solution.
The same procedure was followed for the determination
of equilibrium concentration of n-octane in 20, 30, 40 and
50 per cent urea solution. The percentage of isobutanol was
kept constant (five per cent) for all cases.
Determination of Over-all Rate Constant
Before each experimental run for the determination of the
over-all rate constant of absorption,)<, of hydrocarbons by satu
rated urea solution, the rotameter had to be calibrated for the
hydrocarbon to be used in the experiment. Fresh Berl saddle

packing was used for each experiment.
The column was filled to the upper two inch section with
saturated urea solution containing five per cent isobutanol
20
and one per cent acetic acid as additives. Above the urea
solution fresh organic phase was added up to the overhead outlet.
The height of hydrocarbon-aqueous urea solution interface was
measured and marked. Then, the hydrocarbon from the constant
head tank was bubbled through the urea solution with approximately
constant inlet flow rate. The hydrocarbon leaving the column was
collected over the interval of five minutes and the average outlet
flow rate was calculated. The height of the interface was also
measured in five minute intervals, and the outlet flow rate was
corrected for the difference in the height of the interface. The
rate of absorption of the hydrocarbon by urea solution was obtained
by subtracting the hydrocarbon outlet flow rate from the hydrocarbon
inlet flow rate.
The above procedure was applied to three runs with normal
octane at different inlet flow rates, one run using n-heptane, and
one run with n-nonane.
Chemicals
Normal paraffin hydrocarbons ranging from heptane to decane
were used in the study of urea adducts formation. The purity of
these hydrocarbons was between 95 to 99 mole per cent and they
were used as received from Phillips Petroleum Company. Pure urea
crystals and once distilled city tap water were used in making up
the urea aqueous solution. Glacial acetic acid and isobutyl
alcohol were used as the additives for urea aqueous solution.

CHAPTER IV
THEORETICAL CHARACTERISTICS OF THE EQUIPMENT
A modification of equation 3 may give an adequate explana-
tion of what takes place in the column. The equa tion:
dw de = KA(C - C)
a (3)
as described earlier, relates the rate of mass transfer to the
difference between the interfacial concentration, C, and the
concentration of the solution, C. a
The amount of hydrocarbon absorbed by the saturated urea
solution in the column per unit time can be related to the con-
c entra tion difference of hydrocarbon in the urea solution as
f ollows :
where :
Fl =
F2 = V =
V =
! dv V de =
inlet hydrocarbon flow rate, cc/min.
outlet hydrocarbon flow rate cc/min.
cc hydroca rbon absorbed by satura ted. urea
solution.
volume of urea solution in the column
(g)
C . = maximum amount of hydrocarbon which can be absorbed 1
by one ml. of sat~rated urea solution plus
the e quilibrium concentration of the hydro-
21

22
carbon in aqueous solution.
Cb= g. hydrocarbon absorbed per unit volume (ml.)
of urea solution in the column at any time.
Y~= over-all coefficient.
The theoretical value of Cb is:
t. )
.O· Fl - F2) Cb= p V
de (10)
P being the density of the hydrocarbon in question. The value
of Cb is of course, equal to the area under the curve (F1 - F2)/V
versus time.
The maximum concentration, C. can be calculated by the 1
following equation developed by Kobe and Damask( 5 ).
where:
therefore:
where :
m = 0.6848(n - 1) + 2.181
m = the molar ratio of urea to hydrocarbon.
n = the number of carbon atoms in the hydrocarbon
N =
M =
molecule.
the moles of
c. = 1
urea
NM mV
in the
+ C*
col urnn.
the molecular weight of the hydrocarbon.
C* = the equilibrium concentration of the hydro-
carbon in urea solution.
V = volume of urea solution in the column.
(11)
(12)

23
Maximum concentration, C., can also be obtained in the same manner l.
that Cb is obtained,that is:
c. l.
- F2 de V
The only difference is that, C. is the area under the curve l.
(F1 - F2 )/V versus time from zero to infinity, but Cb is the
area under the curve from zero to a definite time.
(13)
Equations 9, 10 and 11 were used to calculate the value of){
from experimental results. Substituting the value of Cb from
equation 9, and solving for}( results in the following equation:
){ = 1 (14)
c. l. -
as it appears from the above equation)< is a function of the
difference between the inlet and outlet flow rates as well as
tiµie.
Despite the absorption of hydrocarbon, the volume of
saturated urea solution is approximately constant during the
experiment.
hydrocarbon.
The value of C. is, of course, constant for a given l.
As time increases Cb increases, and, therefore,){
increases with time. During the constant absorption rate period,
which starts about fifteen minutes after the experiment has
started, y(_ is a function of time only and increases with time.
Conversely, when the absorption rate starts decreasing, the term
(F1 - F2 )/V decreases, but the term 1/ ( Ci - (F1 - F2 )de/y j
is still increasing. Apparently the effect of decrease in

(F1 - F 2 )/V on)( is larger than the effect of 1/(Ci - Cb).
Therefore, )< starts decreasing with time, as it is shown from
the graphs of i versus time for heptane, octane and nonane
(Figures 5, 9, 12).
24
As it was pointed out previously, ){ obtained from equation 14
is an over-all rate constant. Therefore, it may not describe any
of the possible mechanisms that take place individually. The
difficulty is that (Ci - Cb) would not be the correct driving force
of any of the possible individual mechanisms that are taking place.
Mass Transfer, for example, would involve the driving force for
the solubility of hydrocarbon in the water additives solutions
minus the actual concentration of hydrocarbon in the aqueous
phase. On the other hand, adducts formation would depend upon
the supersaturation,that is, the difference between the actual
concentration of the hydrocarbon in the aqueous phase and the
equilibrium value for the adducts.
Assuming that there are no urea molecules at the hydro-
carbon-water interface, the rate of mass transfer from the sur-
face of the hydrocarbon droplets to the bulk of aqueous solution
can be expressed by the following equation:
where :
c1 =
C = 0
K = ma
dw de = K (C - C )
ma 1 o
the solubility of hydrocarbon in solution
of water and add itives.
the bulk concentration of hydrocarbon.
the mass transfer coefficient.
(15)

Time Fl F2 L Min. cc/min cc/min Cm
5 13.60 13.10 32.2 10 12.81 12.00 32.2 15 13.80 12.80 32.0 20 13.75 12.81 32.0 25 13.60 12.61 32.0 30 13.60 12.58 32.1 35 13.60 12.56 32.1 40 13.60 12.80 32.1 45 13.80 13.08 32.1 50 14.10 13.10 32.2 55 14.00 13.15 32.2 60 14.10 12.40 32.2 65 13.20 12.60 32.2 70 13.20 12.60 32.2 75 13.20 12.60 32.2 80 12.80 12.30 32.2 85 12.80 12.35 32.2 90 12.80 12.40 32.2
TABLE I
OVERALL COEFFICIENT FOR n - OCTANE AVERAGE FLOW
RATE 13.5 AT TEMPERATURE 25° C
Fl - F2 3
V (F1 - F2 )10 Cb X 103 c• X 103
cc cc/min V
300 0.50 1.67 5.84 185.5 300 0.81 2.70 15.25 185.5 297 1.00 3.33 21.01 185.5 297 0.94 3.15 32.00 185.5 297 0.99 3.34 43.30 185.5 299 1.02 3.41 54.90 185.5 299 1.02 3.41 66.70 185.5 299 1.04 3.46 78.5 185.5 299 1.00 3.33 . 90.1 185.5 300 1.02 3.40 101.6 185.5 300 0.90 3.00 110.5 185.5 300 0.85 2.73 120.0 185.5 300 0.80 2.67 129.4 185.5 300 0.60 2.00 136.3 185.5 300 0.60 2.00 143.2 185.5 300 0.50 1.62 148.0 185.5 300 0.45 1.50 153.2 185.5 300 0.40 1.33 157.9 185.5
(c• - Cb )lo3
179.7 170.2 164.5 153.5 142.2 130.6 118.8 107.0
95.5 83.9 75.0 65.5 56.1 49.2 42.48 37.5 32.3 27.6
}{_ X 103
9.29 15.9 19.4 20.8 23.5 25.6 28.1 31.8 34.9 39.7 40.0 41.7 47.6 46.8 46.7 44.5 46.4 48.2
~ Q1

7 o0
6 00
5.0
I')
4 o0 0 ..... >< ..-..
C\I r.:.
I > 3 o0
I ..... r.:. .._,
2o0
1.0
.,. J
/
10 20 30
ll
40
I'\ I\ ~
50 Time, Minutes
r-- ·
'-
'-
" '-
60 70 80 90
Figure 4. Rate of Absorption of n-Octane in Saturated Urea Solution, F1 = 13.5
100 l\:) 0)

~ 0 P'"i
><
+)
C: Cl) .... u
•.-4 ~ c,..i Cl) 0 u M Cl)
~ Cl.l C: as M
70
60 I I I I I I I I I I I I I I I I I I I I I I I I I I I I I I I I I I I I I I I I I I I I I I I 11 1 lllTlT Hl HTmn ITTI I I I I ITFHlTTII Illl II Ii 111 1111 1
so 11 I 11 I I I I I 11 I 11 I I I ll ll I l I I I I I I I I I I II 11111 111 fl 11 l Fl Tl I l ll lTTTTl l ITT If I l I ll ll I I I l II ll l lfTIT I !Tl ' 11 I I I I It
40 1111111111111111111111111111 11 11111111 11 11 11 111111 i i I tmrn ri 111111111111111111111 111 111111111111 11 1
i:;;
~ :Ii'
p J,
30 I I I I I I I I I I I I I I I I I I I I I I I I I I I I I I I I I I I 1-1fl IF 111 1111111 1111 1 I I I I I I I I I I I i I I I I I I I I I I I I I I I I I I I I I I I I I I I I I I I I l J,
F
:v
j 20 1111111111111 11 ± 1111;m 11111111111111111 111 11111111 111111 11111111111 111 111111111111 1111111111111 111 1 ,-1 ,-1
as I M Cl)
> 0
17 TJ
V
V
10 11 I I I Jdf 11 11 I 11 F ITl FF 111111 11 111 111111 11 11 I I 111 I 1111 I I 111 I I I I I I I I I I I I I I I I I I I I I I II I II II I II 1111111 II II I
10 20 30 40 50 60 70 80 90 100 Time, Minutes
Figure 5. Variation of Over-all Mass Transfer Coefficient for n-Octane, F1 = 13.5 cc/Min.
[IJ -.J

Time Min.
5 10 15 20 25 30 35 40 45 50 55 60 65 70 75 80 85 90 95
100 105
Fl
cc/min
3 . 80 3o80 3o95 3o95 3o95 3.95 3.95 3.95 3.95 3.95 3.95 3.95 3.95 3.95 3.95 3.95 3.95 3.95 3.95 3.95 3.95
F2 cc/min
3.50 3.35 3.35 3.20 3.10 3.03 3.00 3.00 3.00 3.01 3.00 3.01 3.10 3.20 3.30 3.45 3.50 3.60 3.67 3.73 3.73
L Cm
32o5 32.5 3206 32.6 32.6 3206 32o7 32.7 32.7 32.6 32.6 32.7 32.6 32.6 32.6 32.6 32.6 32.6 32.6 32.5 32.5
TABLE II
OVERALL CO EFFICIENT FOR N-OCTANE AVERAGE FLOW
RATE 3. 95 AT TEMPERATURE 25° C
V Fl= F2 cc cc/min
300 0.30 300 0.45 300 0.60 302 0.75 302 0.85 302 0.92 304 0.95 304 0.95 304 0.95 302 0.94 302 0.95 304 0.94 302 0.85 302 0.75 302 0.60 302 0.50 302 0.45 302 0.35 302 0.28 300 0.20 300 0.20
(F - F )lo4 1 2
V
10.0 15.0 20.0 24.9 28.1 30.4 31.2 31.2 31.2 31.l 31.2 31.2 28.1 24.9 19.8 16.6 14.9 11.6
9.33 6.77 6.77
Cb X 103
3.49 8072
14.58 23.29 33.13 43.77 54.63 65.53 76.4 87.23 98.13
108.8 117.4 126.5 133.4 139.2 144.6 148.6 151.9 154.2 156.6
C* X 103
185.5 185.5 185.5 185.5 185.5 185.5 185.5 185.5 185.5 185.5 185.5 185.5 185.5 185.5 185.5 185.5 185.5 185.5 185.5 185.5 185.5
(C* - C )103 }< X 103 b
182.0 176.8 170.4 162.2 152.2 141.8 130.9 120.0 109.l
98.27 87.37 76.70 68.10 59.00 52.1 46.3 40.9 36.9 33.6 31.3 28.9
5.50 8.50
11.70 15.75 18.4 21.4 23.8 26.0 28.6 31.6 35.7 40.3 41.3 42.0 38.0 35.8 36.4 31.4 27.8 21.6 23.4
tv (X)

t".)
0 ,-I
><
C\I I:::.
,-I
I:::.
>
7.001 I I I I I I I I I I I
6.ool I I I I I I 111111111111111 ! I I I I I I I I I I I I I I I I I I I I I I I I I I I I I I I I I I I I I I I I I I I I I I I I I I I I I I I I I I I I I I I 111111111111111
5.00111111 11111111111111111111111111111111111111111111111111111111111111111111111111111111111111111 111111
4.00I I I I I I I I I I I I I I I I I I I I I I I I I I I I I I I I I I I I I I I I I I I I I I I I I I I I I I I 111111111111111 I 111111111 I 111111111111111 I I I I I
3•001111111111111 I I I I I I I I I I ~Q§lllll I l-ltllil 111111 ltl I lilifflHI I I I I I I I I I I I I I I I I 111111111111111
11 I I I I I I I I 11 I I I I 11 I 11 bt1 I I I I I I I I I I I I I I I I l·tEl SI ,'~ l~lil II ii ~I l~ljlJI fl El liillifflliillllifflli~ t= I I I I I I I I I I F'kl I I I I I I I I I I I I I I I I I I I I I I I I I I I I I I I !,Jr
[/ "-V
2 • oo I I I I I I I I I I I I I I l.$1 I I I I I r I I I I I I i I I I I I I I I I I I I I I I I I I I I I I I I I I I I I I I I I I I I I I I I I I I I I d* I I I I I I I I I I I I I I I I I I I I I I I I
V
o"i 171 ~
1. 001 I I 1Jf111 fll l I ff !Tl ff I 111111111111111 I I I I I I I J 111111111 It I l±I I I 111111111111111 W 1111111111 ITI H+H+ 11
0 10 20 30 40 50 60 70 80 90 100 Time, Minutes
Figure 6. Rate of Absorption of n-Octane in Saturated Urea Solution, F1 = 3.95 cc/min.
f'.J t!)

Time Fl F2 L Mino cc/min cc/min Cm
5.00 18.50 18.00 33.0 10.00 27.32 25.30 33.4 15.00 20.25 19.45 33.4 20.00 19.80 18.73 33.4 25.00 19.80 18.70 33.4 30.00 19.80 18.70 33.4 35.00 19.80 18.70 33.4 40.00 19.80 18.71 33.4 45.00 19.80 18.70 33.4 50.00 19.80 18.90 33.4 55.00 19.80 18.95 33.4 60.00 19.80 19.05 33.4 65.00 19.80 19.20 33.4 70.00 19.80 19.30 33.4 75.00 19.80 19.30 33.4 80.00 19.80 19.45 33.4 85.00 19.80 19.55 33.4 90.00 19.80 19.60 33.4 95.00 19.80 19.60 33.4
TABLE III
OVERALL COEFFICIENT FOR OCTANE ~ AVERAGE FLOW
RATE OF 19 08 AT 25° C
3 Cb X 103 C* X 103 (C* = Cb)103 V F1 - F (F1 = F2 )10
I , 2 cc cc min o V
300 0.50 1.67 5.85 185.5 179.6 305 o.so 2.62 14.91 185.5 170.6 305 o.so 2.62 27.21 185.5 158.3 305 1.07 3.51 39.81 185.5 145 .7 305 1.10 3.61 52.41 185.5 133.1 305 1.10 3.61 65.01 185.5 120.5 303 1.07 3.47 77.61 185.5 107.9 305 1.09 3.58 90.21 185.5 95.3 305 1.10 3.61 102.8 185.5 82.7 305 0.90 2.95 113.4 185.5 72.1 305 0.85 2.79 123.2 185.5 62.3 305 0.75 2.46 131.8 185.5 53.7 305 0.60 1.97 138.7 185.5 46.8 305 0.50 1.64 144.4 185.5 41.1 305 0.50 1.64 150.2 185.5 35.3 305 0.35 1.15 154.2 185.5 31.3 305 0.25 0.832 157.2 185.5 28.3 305 0.20 0.656 159.S 185.5 26.0 305 0.20 0.656 161.8 185.5 23.7
)< X 103
9.29 15.4 16.6 24.1 27.1 30.0 33.4 37.8 43.6 40.1 44.8 45.8 42.1 39.9 46.4 36.7 29.4 25.2 27.7
vi 0

7o
6.
5o
"' 0 ~
4o >< ,-..
r:z..N I >
r:z.. .-11 3o
-2o
1.
l
(J
l
r
C
" •J
I ... I
... ~
r.. .....
" C
.
10 20 30 40 50 60 70 80 90 Time, Minutes
Figure 7. Rate of Absorption of n-Octane in Saturated Urea Solution, F1 = 19.8 cc/Min.
100 ~ ....

6
I')
0
2.5
.-t 2
>< x 1,5
9 .
8
4 -
• 1 1-1-: 1
1.-u +
ffl u ?,
i,
·-··-''
7 8 9 10 1,5 2,5
T i me , ~ii nut e s
32
!1 ci:, il:1 IF . ~ §]~§
' u
7 8 9 10

Time Fl F2
Min o cc/min cc/min
o.oo 0 000 5o00 13095 13065
10000 14000 13050 15.00 12080 12.10 20000 12080 llo82 25.00 13000 12000 30000 12010 11.10 35.00 12.10 llolO 40000 12.30 llo30 45.00 12.20 llo21 50.00 11.98 11.12 55.00 12.60 llo95 60.00 12.30 11.80 65.00 14.10 13.70 70.00 14.50 14.24 75.00 14.50 14.28 80.00 14.06 13.86 85.00 14.00 13.86
TABLE IV .
OVERALL CO.ii:FFI CI ENT FOR HEPTANE 9 AVERAGE FLOW
RATE OF 13 o2 AT 25° C
3 C* X 103 (C* = C )103 L V Fl - F2 (F1 - F2 ) 10
Cb X 103
Cm cc/min V b
cc
32o0 300 -c:::::>c:::::>c:::::> ---= -cm>c::>c:::::> ~c:::::>c::::>c:::::>c:::> u:, <= c::::, c:::,o c:::::>
32o0 300 Oo30 1.00 3o40 178.7 17503 32.0 300 0.50 1.67 9.08 178.7 169.6 32o0 300 Oo70 2.33 17.00 178.7 16107 32o0 300 Oo98 3.23 27.9 17807 15008 31.8 297 loOO 3.36 39.5 17807 139.2 3108 297 1.00 3.36 51.1 178.7 12706 3108 297 1.00 3.36 62o7 17807 116.0 32.0 300 loOO 3 . 34 74ol 17807 103.9 32.0 300 Oo99 3.30 85.3 17807 93.4 32o0 300 0086 2.87 95.1 178.7 83.6 32.0 300 Oo65 2.17 102.5 178.7 76.2 32.0 300 0.50 1.67 107.2 178.7 71.5 32.0 300 Oo40 lo33 111.5 178.7 67.2 32.0 300 0.26 0.87 114.0 178.7 64.7 32.0 300 0.22 0.74 116.5 17807 62.2 32.0 300 0.20 0.70 118.9 178.7 59.8 32.0 300 0.20 0.70 121.3 178.7 57.4
)'( X 103
5.60 9.85
14.4 21.4 24.1 26.3 29.0 32.l 35.3 34.3 28.5 23.4 19.8 13.4 11.2 11.7 12.2
vi vi

7
6
5
ti)
0 ..-4
>< 4 ,...._
f;:. C\I
I >
f;:. l'""l l 3
2
1
tEl+-
,,.-~ ~
rs.
I/
rT
17
10 20 30 40 50 60 70 80 90 Time, Minutes
Figure 9. Rate of Absorption ofn-Hepiane in Saturated Urea Solution, F1 = 13.2 cc/Min.
100 "' ~

0 ['-
0 lC
0 '<t'
\
' '
0
"' 0 C\J
,,
Ii
~
"
I
'"
" r-.
0 ....
roe
35
0 0 ....
0 C,
0 a)
0 ['-
0 ~
0 t':)
0 C\J
0 ....
.... .... I'd I s.. QI > 0

Time Fl F 2
Mi n o cc/min cc/min
OoOO o.o OoO 5o00 6010 5o42
lOoOO 5.90 5o00 15.00 5.80 4.60 20.00 5o65 4.60 25.00 5.65 4.60 30.00 5.65 4.60 35000 5o65 4.60 40.00 5.55 4.50 45.00 5.55 4.55 50.00 5o55 4.63 55.00 5.55 4.66 60.00 5.55 4.68 65.00 5.55 4o73 70.00 5.55 4.80 75.00 5.55 4.82 80.00 5.55 4.85 85.00 5.55 4o81 90.00 5.50 5.00 95.00 5.30 4.90
100.00 5.30 4.95
TABLE V
OVERALL COEFFI CIENT FOR NONANEi AVERAGE FLOW
" RATE 5o60 AT 25 C
L V F = F
1 2 (F1 = F2 ) 103 Cb X 102 C* X 102 (C* = C )102
b Cm cc cc/min V
3008 300 e..-.==c:, _,_<=c:::::> <=c=>c:::::>~c:::> c:::::,c.-=>c..;:;,:.:..::c., =~c:::::>~=
3008 300 0.68 2o26 00805 19.85 19.04 30.8 300 Oc90 3.00 L87 19.85 17.98 30.8 300 L20 4.00 3.13 19 085 16.72 30.8 300 L05 3.50 4.37 19085 15.48 30.8 300 1.05 3.50 5.56 19.85 14.29 30.8 300 1.05 3o50 6.82 19.85 13.03 30.8 300 1.05 3.50 8.06 19.85 11.79 3008 300 1.05 3.50 9.34 19.85 10051 30.8 300 1.00 3.33 10.5 19.85 9.35 30.8 300 0.92 3.07 11.5 19.85 8.35 30.9 302 0.89 2.94 12.5 19.85 7.35 31.0 303 0.87 2.87 13.4 19.85 6.45 31.0 303 0.82 2.71 13.9 19.85 5.95 31.0 303 0.75 2.47 14.5 19.85 5.35 31.0 303 0.73 2.40 15.4 19.85 4.45 31.0 303 0.70 2.31 15.7 19.85 4.15 31.0 303 0.74 2.41 16.0 19.85 3.83 31.0 303 0.50 1.65 16.5 19.85 3.35 31.0 303 0.40 1.32 16.80 19.85 3.05 31.0 303 0.35 1.15 17.30 19.85 2.55
}( X 102
Ll7 1.67 1.87 2.26 2.45 2.69 2.97 3.33 3.56 3.68 4.00 4.45 4.55 4.62 5.39 5.57 6.26 5.28 5.25 5.89
<:,,I en

6. {
5. C
"' 0 .... 4. C ' C'II
r:. I
r:. ,...I 3. ( -
2. C
1. (
0
.., -
I
. , I ....
I I/
10 20 30 40 50 60 70 80 90 100 Time, Minutes
Figure 11. Rate of Absorption of n-Nonane in Saturated Urea Solution, F1 = 5.60 cc/min.
vi -..J

C\l 0 P"4
><
·+-> c:: (1) -~ C) -~
'+-I '+-I
(1)
0 u I-, (1)
'+-I flJ
§ I-,
8
Cll Cll ctS
::i;:
..-4
..-4 ctS I I-, (1)
>
7
6
5
4
3
2
O 1
10
V
y v
I;;
V
y
20 30 40 50 60 70 80 Time, Minutes
Figure 12. Over-all Mass Transfer Coefficient for n-Nonane
90 100 ~ (X)

10
9
8
5
2
I I 2 4
figure 13, Variation of Over-all Mass Transfer Coefficient for n-Heptane, n-Octane, and
n-Nonane
6 8 9 10
Time, Minutes
39
4 6 1 8 9 10

As c an be seen from Tables VII and VIII, the difference,
(c1 - C0 ) is approximately equal to c1 • Therefore, equation 15
can be written as :
dw ds
F1 - F p 2 = V = K c1 ma
(15a)
Equation 15a was used to estimate the value of K , the mass ma
transfer coeffic iento During the constant rate period, as is
apparent from t he above equation, K is constant. Figures 15, ma
16 and 17 are the graphs of K versus time for heptane, octane ma
and nonane ~ respectively o
Unfortuna tely, these results do not prove that the mechanism
is one of mass ·transfero They are of primary value in design
calculationso Further work is necessary to determine the actual
rat e controlling mechanism.
40

41
TABLE VI
EQUILIBRIUM CONCENTRATION OF OCTANE IN
UREA SOLUTION AT 27 0 1° C
Weight Volume Per Cent cc. Octane X 105 Per Cent
Urea 100 cc. soln. Isobutyl Alcohol
10 12.2 5
20 5.40 5
30 3.78 5
40 2.84 5
50 2.73 5
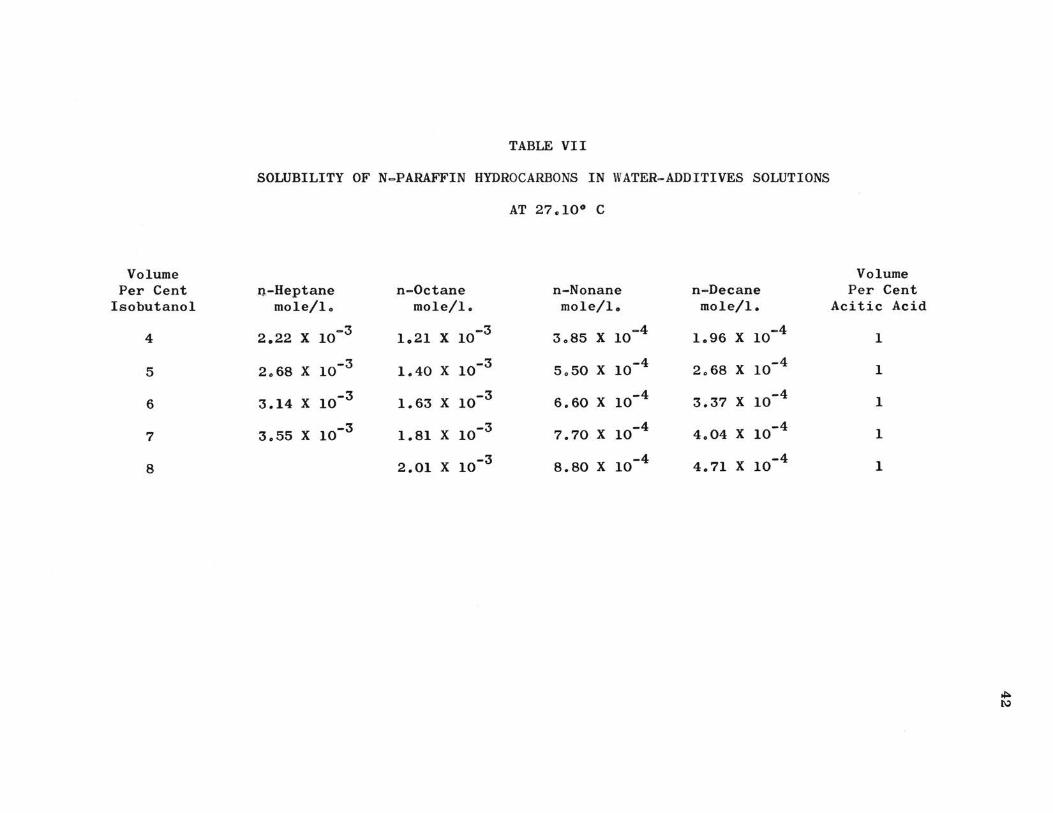
TABLE VII
SOLUBILITY OF N-PARAFFIN HYDROCARBONS IN WATER-ADDITIVES SOLUTIONS
AT 27.10° C
Volume Per Cent n-Heptane n-Octane n-Nonane n-Decane
Isobutanol mole/lo mole/I. mole/I. mole/I.
4 2.22 X 10⁻³ 1.21 X 10⁻³ 3.85 X 10⁻⁴ 1.96 X 10⁻⁴
5 2.68 X 10⁻³ 1.40 X 10⁻³ 5.50 X 10⁻⁴ 2.68 X 10⁻⁴
6 3.14 X 10⁻³ 1. 63 X 10-3 6.60 X 10⁻⁴ 3.37 X 10⁻⁴
7 3.55 X 10⁻³ 1.81 X 10⁻³ 7.70 X 10⁻⁴ 4.04 X 10⁻⁴
8 2.01 X 10⁻³ 8.80 X 10⁻⁴ 4.71 X 10⁻⁴
Volume Per Cent
Acitic Acid
1
1
1
1
1
~ N

4
~ 0 ~
~
,--.
= 0 ·~ ~
= 3 ~ 0 ~
~
~ 0 ~ M rn u 0 M ~ ~ 2 ~
~ ~ 0 ~ ......
1
,~ V
V
,~ I/
V V
/ r
~
/
'
2 4 5 6 7 8 9 Volume Per Cent lsobutanol in Water
Figure 14. Solubility of n-Heptane and n-Octane in Water Containing One Per Cent Acidic Acid and Varying Amounts
of lsobutanol
43

~ 0 ~
....... d 0
•.-4 ~ ~ ~ 0 ~
~
'-d 0 ~ M ro u 0 M ~ ~ = ~ ~ 0 X .......
lOrrrrr'TT",-,-rrr'TT",-,-rrr'TT",-,-l'"T"'l'..,...,..,..,...l'"T"'I'..,...,..,..,...,...,...,...,...,..,..,...,...,...,...,...,...,..,...,...,...,.....,.....,..,...,...,..,....,.....,..,...,...,..,...,..,...,
r,
8 t+-H-il-+-l--+-t-+t++-+++++++++++++-+-+-+-1-H--H--H+++++++++++++++-+-1-4,/~I-Hl-+-I--H++++++~
7 ~
~
,
6
5
~ ,
4
3
2 t-+++t+-t+-l-+-ll-+-l--+-t+-t-++-+++.v>f<+++++++t+-t+-1-+-l--H--H+-t+++++++++++++-+-t+-l+-!--H--H--H~
1 H-t+-t+-I-H--H--H++++-+++++++++++-+-+-+-+-+-1-Hl-+-I--H++-+++++++++++++-+-+-+-1-HI-H--H--H++-4-l
2 3 4 5 6 7 8 9 Volume Per Cent Isobutanol in Water
Figure 150 Solubility of n-Nonane and n-Decane in Water Containing One Per Cent Acetic Acid and Varying Amounts
of Isobutanol
44

Volume Per Cent
Isobutanol
4 o0
5 o0
600
7.0
TABLE VIII
SOLUBILI TY OF N=PARAFFIN HYDROCARBONS IN ISOBUTANOL SOLUTIONS
AT 27 010° C
n - Heptane N=Octane n-Nonane n - Decane mole/l o mole/l o mole/I mole/L
7 o25 X 10=4 3 oll X 10=4 L77 X 10=4 L52 X 10=4
7 o79 X 10-4 3.40 X 10⁻⁴ L98 X 10=4 1. 67 X 10=4
8 058 X 10-4 3 o80 X 10=4 2.20 X 10- 4 L86 X 10=4
9o27 X 10-4 4.10 X 10⁻⁴ 2.53 X 10⁻⁴ 2.02 X 10=4
Volume Per Cent
Ac e tic Acid
o.o
OoO
o.o
o.o
~ (JI

46
10.00 rT'T"TTlT1""1"TTT"rT'T'TTlT1"TTTT"i'T'"T''TT1""1""'1''"T'T'T"'ni'T'"T'"T"T'"T"'T'"T'"T'T'T"'niT"T'~l""T"T..,..,..T"'!""I~.,..,..., ......... ~
~ 0 ~
,...._ ' ~ ~ '-~ 0 ~ M ~ u 0 M ~ ~ = ~ ~ 0 ~
9.00 t+t-t-t-tti-ti"i-t-t+t++tti-++tTil+t++H-t++tt-i-++++t-++++tt-i-++++it-++,/.,j.4-tt-i-++++i~...j....l..l
- /
V
7.00
6.00
5.00
~
' 4.00 ..
3.oot-H-++++t+1-++++t+1-++++t+1-+++++-1-1""1'+++-t+-t-++++-t+-t-++++H-1-++++H-1-++++H-1-++++-1
1.
.
1.00 2.00 3.00 6.00 7.00 a.oo Volume Per Cent Isobutanol in Water
Figure 16. Solubility of n-Heptane, n-Octane, n-Nonane and n=Decane in Isobutanol-Water Solution Varying the
Amounts of Isobutanol

Time Fl
Mino cc/mi n o
5 13c60 10 12081 15 13080 20 13.75 25 13.60 30 13.60 35 13.60 40 13.60 45 13.80 50 14.10 55 14.00 60 14.10 65 13.20 70 13.20 75 13.20 80 12.80 85 12.80 90 12.80
TABLE IX
MASS TRANSFER COEFFICIENT FOR OCTANE AVERAGE INLET FLOW RATE
13 o5 AT TEMPERATURE 25° C
3 F2 L V
Fl - F2 p (F1 - F2 ) 10
c1 X 103 cc/mino Cm cc V
13cl0 32o2 300 Oo50 Ll7 L40 12000 32o2 300 Oo81 L89 L40 12080 32o0 297 LOO 2.33 L40 12081 32o0 297 0.94 2.20 L40 12.61 32.0 297 Oo99 2 . 34 1.40 12058 32.1 299 1.02 2.38 L40 12.58 32.l 299 L02 2.38 L40 12.56 32.l 299 1.04 2.42 1.40 12.80 32.1 299 1.00 2.33 1.40 13.08 32.2 300 1.02 2.38 1 .40 13.10 32.2 300 0.90 2.10 1.40 13.15 32.2 300 0.85 1.91 1.40 12.40 32.2 300 0.80 1.87 1.40 12.60 32.2 300 0.60 1.40 1.40 12.60 32.2 300 0.60 1.40 1.40 12.30 32.2 300 0.50 1.17 1.40 12.35 32.2 300 0.45 1.05 1.40 12.40 32.2 300 0.40 0.93 1.40
K ma
0 .836 L35 L67 L57 1.67 1.70 1.70 1. 73 1.67 1.70 1.50 1.37 1.34 1.00 1.00 0.836 0.750 0.664
,;:. "'1

(U
::,i::E ~
+)
r:: Cl)
•,-I u
•1-1 Ct-4 Ct-4 Cl) 0
C)
M Cl)
Ct-4 fJl r:: (U M ~
CQ CQ (U
X
2o80
2.60
2.40
2.20
2.00
1.80
1.6
1 • 40 FTTT r I lT 11 llJfFTTTT l 11111 l I I I 1 IT 11111 I 11111 I I I I I 1111 111 Tlii-
1.20
1.00
o.s
0.6
0.4
0.2
10 20 30 40 50 60 70 80 90 100 Time, Minutes
Figure 17. Variation of n-Octane Mass Transfer Coefficient with Time, F1 = 13.5 cc/min.
~ CJ)

Time Fl Min. cc/min.
5 3.80 10 3.80 15 3.95 20 3.95 25 3.95 30 3.95 35 3.95 40 3.95 45 3.95 50 3.95 55 3.95 60 3.95 65 3.95 70 3.95 75 3.95 80 3.95 85 3.95 90 3.95 95 3.95
100 3.95 105 3.95
TABLE X
MASS TRANSFER COEFFICIENT FOR N-OCTANE AVERAGE INLET
FLOW RATE= 3.95 AT TEMPERATURE 25° C
3 F2 L V
p (F1 - F2 ) 10 Fl - F2 cc/min. Cm cc V
3.50 32.5 300 0 . 30 0 . 70 3.35 32.5 300 0.45 1.05 3.35 32.6 300 0 . 60 1.50 3.20 32.6 302 0.75 1.74 3 . 10 32 . 6 302 0.85 1.96 3.03 32.6 302 0.92 2 . 13 3.00 32.7 304 0.95 2.18 3.00 32.7 304 0.95 2.18 3.00 32.7 304 0.95 2.18 3.01 32.6 302 0.94 2.18 3.0 32.6 302 0.95 2.18 3.01 32.6 302 0.94 2.17 3.10 32.7 304 0.85 1.96 3.20 32.6 302 0.75 1.74 3.30 32.6 302 0.60 1.38 3.45 32.6 302 0.50 1.16 3.50 32.6 302 0.45 1.04 3.60 32.6 302 0.35 0.81 3.67 32.6 302 0.28 0.65 3.73 32.6 302 0.20 0.47 3.73 32.6 302 0.20 0.47
c1 X 103
1.40 1.40 1.40 1.40 1.40 1.40 1.40 1.40 1.40 1.40 1.40 1.40 1.40 1.40 1.40 1.40 1.40 1.40 1.40 1.40 1.40
K ma
o . 5oo 0 .750 1.07 1.24 1.400 1.520 1.560 1.560 1.560 1.560 1.560 1.560 1.400 1.240 0.985 0.829 0.743 0.579 0.466 0.339 0.339
,i:,.. <O

2.8
2.6
2.4
2.2 (IS
::.c::e .,. 2.00
-+-l c:: -~ 1.80 C.I
•'"4 ~
~ 1.60 0
t.)
s.. 1.40 Cl) II I I I I I I I 111111111111119 ~ tll § 1.20 s..
E-t co 1.00 tll 111111111111 Lfl I I I I I I I I I I I I I I ! I I I I I ! I I I I I I I I ! I I I i 111111 [ 11 1 fl Lil 113 J W El 1111 Ns (IS
::E 0.80
0 • 60 : ~ : : : : : ~ :!I I I I I I I I I I I I I I I I I I I I I I I I I I I I I I I I I I I I I I 111 1111 111 1111.! 111111111111111 I I I I I Nff t 0
• 40
111 ~ 111111111111111 I I I I I I I I ~ 111111111 nl I ff I H 1 I l I I I I I I I I I I I I I I I I I I I II I I I I I I II II I I I t 1111111111 i 0.20
10 20 30 40 50 Time, Minutes
60 70 80 90 100
Figure 18. Variation of n-Octane Mass Transfer Coefficient with Time, F1 = 3.95 cc/min.
en 0

Time Fl F2 Min . cc/min. cc/min .
5 13.95 13 . 65 10 14.00 13 . 50 15 12.80 12 . 10 20 12.80 11.82 25 13.00 12 . 00 30 12.10 11. 10 35 12.10 11.10 40 12.30 11 . 30 45 12.20 11.21 50 11.98 11.12 55 12.60 11.95 60 12.30 11.80 65 14.16 13.70 70 14.50 14.24 75 14.50 14.28 80 14.06 13.86 85 14.00 13.80
TABLE XI
MASS TRANSFER COEFFICIENT FOR HEPTANE AVERAGE INLET
FLOW RATE 13.2 at 25° C
3
L V p (F1 - F2 ) 10
c1 X 103 Cm cc Fl - F2 V
32.0 300 0 . 30 0 . 680 2.68 32.0 300 0.50 1.13 2.68 32.C 300 0.70 1.59 2 . 68 32.C 300 0.98 2.20 2.68 31.8 297 1.00 2.28 2.68 31.8 297 1.00 2 . 28 2 .68 31.8 297 1.00 2.28 2.68 32.0 300 1.00 2.27 2.68 32.0 300 0.99 2.78 2.68 32.0 300 0.86 1.95 2. 68 32.0 300 0.65 1.47 2.68 32.0 300 0.50 1.13 2.68 32.0 300 0.40 0.905 2 . 68 32.0 300 0.26 0.592 2.68 32.0 300 0.22 0.5u 2.68 32.0 300 0.20 0.47 2.68 32.0 300 0.20 0.47 2.68
K ma
0 .254 0 .423 0 .594 0.822 0.851 0 . 851 0.851 0.851 0.851 0.728 0.550 0.422 0.337 0.221 0.187 0.178 0.178
en I-'

14.0
13.0
12.0
11.0
t1S 10.0 ~E
~ c:: 9.0 Cl>
"" u
"" s.o Ct,.! Ct,.!
Cl> 0 u 7.0 M Cl>
Ct,.! 6.0 Ill
c:: t1S M ~ 5.0 Ill flJ t1S 4.0 :=t:
,
3.0
2.0
1.0
"
/
" I/ "' )
I ' ' II
' "
10 20 30 40 50 60 70 80 90 100 Time, Minutes
Figure 19. Variation of n-Heptane Mass Transfer Coefficient with Time, F1 = 13.2 cc/Min.
CJI (lj

Time Fl F2 Mino cc/min o cc/min.
5o00 18.5 18.00 10000 27.32 25o3 15000 20025 19045 20.00 19.80 18.73 25000 19080 18.70 30.00 19.80 18.70 35.00 19.80 18.70 40.00 19.80 18.71 45.00 19.80 18.70 50.00 19.80 18.90 55.00 19.80 18.95 60.00 19.80 19.05 65.00 19.80 19.20 70.00 19.80 19.30 75.00 19.80 19.30 80.00 19.80 19.45 85.00 19.80 19.55 90.00 19.80 19.60 95.00 19.80 19.60
TABLE XII
MASS TRANSFER COEFFICIENT FOR n =OCTANE AVERAGE
INLET FLOW RATE 19080 AT TEMPERATURE OF 25° C
3 L V
Fl - F2 P (F1 = F2 ) 10
c1 X 103 Cm cc V
33o0 300 o.5o 1.17 1.40 33o4 305 Oo80 1.83 1.40 33.4 305 Oo80 1.83 l.40 33.4 305 1.07 2o46 1.40 33.4 305 1.10 2.52 1.40 33.4 305 1.10 2.52 1.40 33.4 305 1.07 2.47 1.40 33.4 305 1.09 2o50 1.40 33.4 305 1.10 2.52 1.40 33.4 305 0.90 2.06 1.40 33.4 305 OoS5 l.95 1.40 33.4 305 0.75 1.72 1.40 33.4 305 0.60 1.38 1.40 33.4 305 0.50 1.15 1.40 33.4 305 0.50 1.15 1.40 33.4 305 0.35 0.805 1.40 33.4 305 0.25 0.582 1.40 33.4 305 0.20 0.460 1.40 33.4 305 0.20 0.460 1.40
K ma
0.836 1.30 1.30 1.76 1.80 1.80 1.77 1.80 1.80 1.47 1.39 1.23 0.985 0.823 0.923 0.575 0.416 0.329 0.329
CJl C,I
-'-2.80
2.6 )
2.4 )
2o2 )
IU E
~ 2o0 D
~ d Cl)
•"4 C)
•"4 CM CM Cl) 0 u ~ Cl)
CM Cl.l d IU ~
E-4
Cl.l r1.I IU X
LS 0
1.6 0
1.4 0
1.2 0
0 LO
3( o.s
)l o.6
r "· ~ 0.4 ~~
0.2 C
-
0
- -
10
,
.,
----.,.
" --, • --+---
: I I -- -' l " -
20 JO 40 50 60 70 80 90 100 Time, Minutes
Figure 20. Variation of n-Octane Mass Transfer Coefficient with Time, F1 = 19.8 cc/Min.
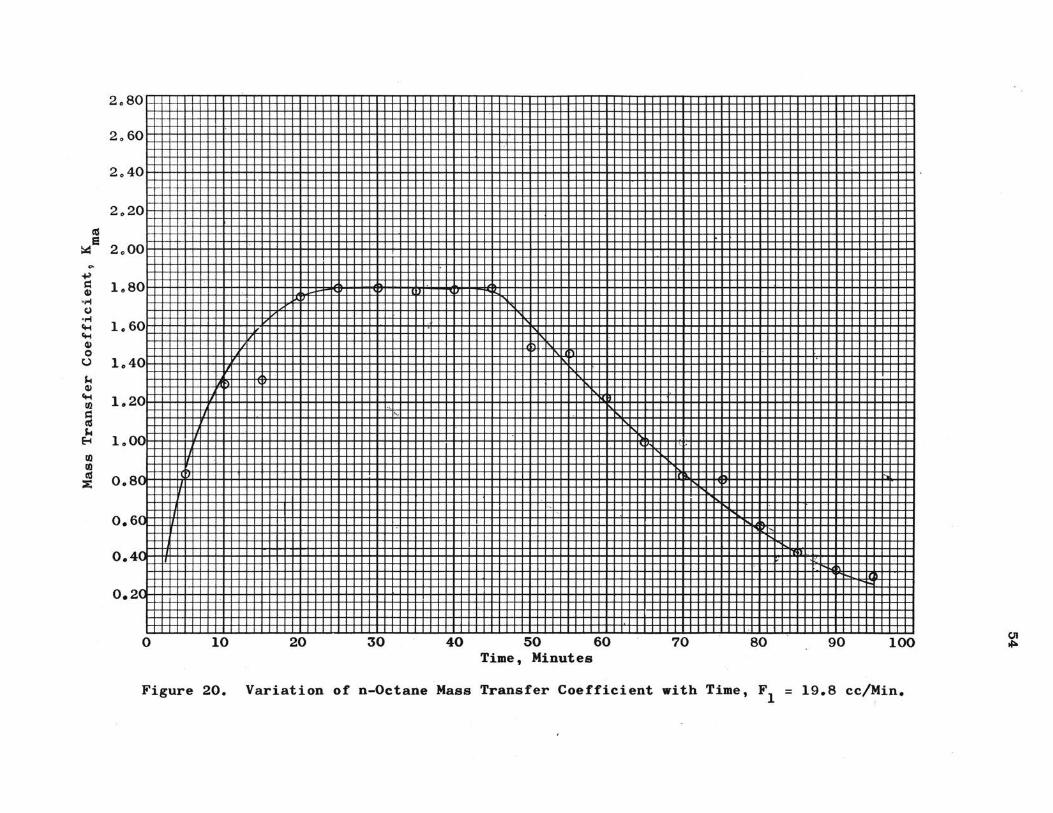
CJ1 ~
Time Fl Mino cc/mi no
5 6.10 10 5.90 15 5.80 20 5.65 25 5.65 30 5.65 35 5.65 40 5.55 45 5.55 50 5.55 55 5.55 60 5.55 65 5.55 70 5.55 75 5.55 80 5.55 85 5.55 90 5.50 95 5.30
100 5.30
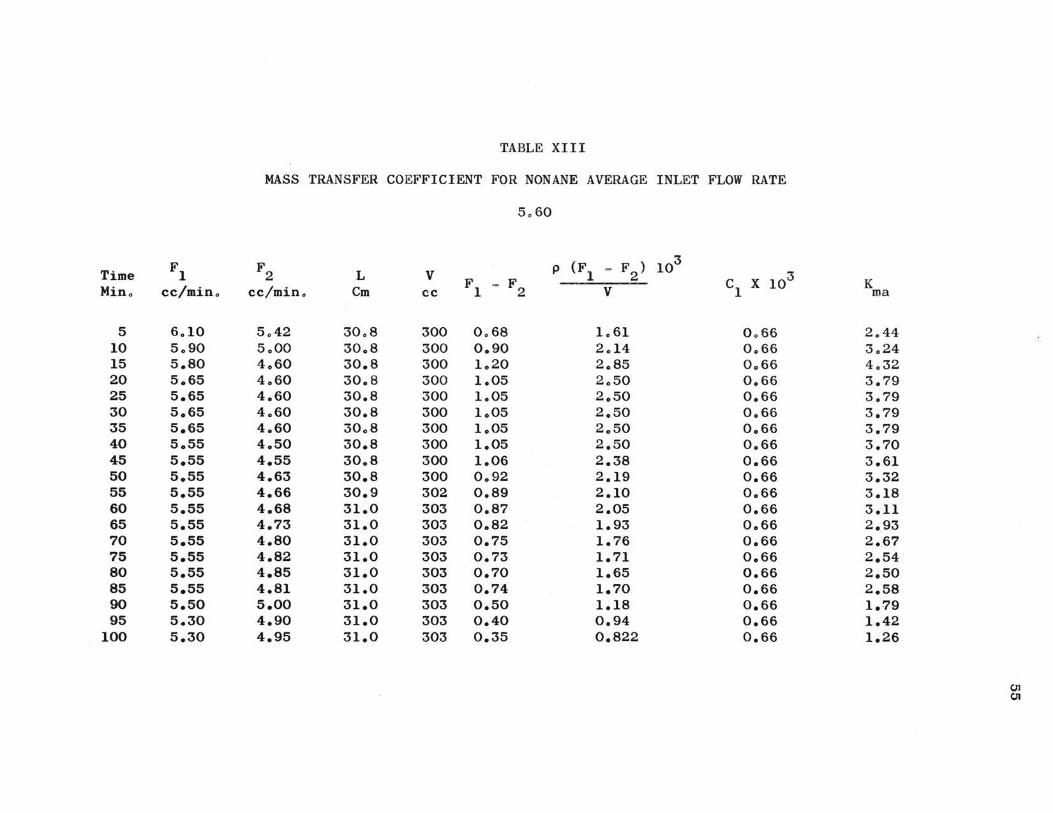
TABLE XIII
MASS TRANSFER COEFFICIENT FOR NONANE AVERAGE INLET FLOW RATE
5o60
F2 3
L V Fl - F2
p (F1 - F2 ) 10 c1 X 103
cc/mino Cm cc V
5.42 3008 300 0068 1.61 0.66 5.00 30.8 300 0.90 2.14 0.66 4o60 30.8 300 lo20 2.85 0.66 4.60 30.8 300 1.05 2.50 0.66 4.60 30.8 300 1.05 2.50 0.66 4.60 30.8 300 lo05 2.50 0.66 4.60 30.8 300 1.05 2o50 0066 4.50 30.8 300 1.05 2.50 0.66 4.55 3008 300 1.06 2.38 0.66 4.63 30.8 300 0.92 2.19 0.66 4.66 30.9 302 0.89 2.10 0.66 4.68 31.0 303 0.87 2.05 0.66 4.73 31.0 303 0.82 1.93 o.66 4.80 31.0 303 0.75 1.76 0.66 4.82 31.0 303 o.73 1.71 0.66 4.85 31.0 303 o.7o 1.65 0.66 4.81 31.0 303 0.74 1.70 0.66 5.00 31.0 303 o.so 1.18 0.66 4.90 31.0 303 0.40 0.94 0.66 4.95 31.0 303 0.35 0.822 0.66
K ma
2.44 3.24 4.32 3.79 3.79 3.79 3.79 3.70 3.61 3.32 3.18 3.11 2.93 2.67 2.54 2.50 2.58 1.79 1.42 1.26
C,J C)l

S.. Q>
fM fll C: aS S..
E--1
Ill fll aS X
6
V
~
3 1111111 ttfl I I I I I I I I I I I I I I I I 111111111111111 l I I I I I I I I I I I ltl llfntHE I I I I I I I I 111111111111111 fftlll 11 7
l"
2 11 I VI 1111111 111 11 I I 111 I I 1111 I i 111 111111 1111111111 l I I 111111 ! 11 ! ! ! ! I ! ! 1 U HJ !Ill! LI 111 NU I 1111 .111111 I I i;;::
I"' r;;;
1 111111111111111 Fl 111111111111 l I I I I I I I I I I ITU l I ITT I I HI l l l I l I 1111 ml 11 [ITT l I 111111111111111111111111 T
10 20 30 40 50 60 70 80 90 100 Time, Minutes
Figure 21. Variation of n-Nonane Mass Transfer Coefficient with Time, F1 = 5.60 cc/Min.
CJl 0)

CHAPTER V
RESULTS AND DISCUSSION
In determina tion of the solubility of then-paraffin
hydrocarbons 9 the hydrocarbon was added to a water, additives
solution and the solution was stirred at room temperature. It
was pl a ced, then 9 in a constant temperature bath. The room
temperature, however 9 was less or around the bath temperature,
27 01° Co Therefore 9 since the solubility of hydrocarbons is
d i rectly proportional to the temperature, the error introduced
by this method was not a serious one. Another error that can
be attributed to the variation in temperature during each run
is as follows o In order to perform the saturation test on the
solution 9 it had to be taken out of the constant temperature
bath e Since the room temperature was lower than the bath tem
perature 9 had the solution been slightly below the saturation
po i nt at the b at h t emperature 9 the test might have been positive.
De s p i t e the above disadvantages of this technique, the results
obtained were consistent o
Th e ma jor error i n determination of the solubility of
hydrocarbons could h a ve b e en due to an error in measurement
of t h e amount of hydrocarbon added to the solution. The
solubility of n - paraffins in water is very low, of the order
of 0.001 cc. per 100 cc. of solution. A small error in volume
57

58
of hydrocarbon added, would cause a large error in the solubility
data. This error was minimized by taking a relatively large
volume of solution, about 500 to 700 cc. The hydrocarbon was
measured with one 10 I'- syringe graduated to O. 2 of a }- •
Determination of Solubility of Urea in Water
Additives Solution
Due to the basic properties of urea, the solubility of
urea in water is relatively high (approximately 50 grams per
100 grams of solution). Therefore, an error of 0.001 grams in
weighing the urea sample, would cause only 0.002 per cent error
in results. Considering this fact, the weight of urea was
measured accurately to 0.001 grams.
The major error in determination of the solubility of
urea was due to the hydrolysis of urea in basic or acidic
solutions. The hydrolysis of urea was found to be negligible
in the presence of isobutanol alone. When acetic acid was
present the effect of hydrolysis was more severe, especially
when the concentration of isobutanol was less than four per
cent . The extrapolated value of urea dissolved in zero per
cent isobutanol (Figure 22) and one per cent acetic acid is
much higher than the value without acetic acid. A part of this
difference is caused by hydrolysis of urea in the presence of
acetic acid. As the percentage of isobutanol increases the
effect of hydrolysis decreases. This can be attributed to the
reaction between acetic acid and isobutanol.

59
TABLE XIV
SOLUBILITY OF UREA IN WATER PLUS ADDITIVES AT 27.1° C.
Volume One Per Cent Acetic Acid Without Acetic Acid Per Cent Weight Weight Isobutyl Weight of Urea Per Cent Weight of Urea Per Cent
Alcohol 100 CCo Solvent Urea 100 cc. Solvent Urea
7 107.4 52025 101.2 50.06
6 11509 54.00 105.0 51.6
5 123.2 55.49 109.0 52.43
4 13002 56.88 113.2 53.40
3 13808 58.24 ..... . .... 0 0 0 0 o 0 ..... . .... 55.9

64rrn1TT-rrrrrnTTTrrrrnTT'"T'TT"r"",..,.,-r-r.,.,.,.,..M"'l..,..,..,.,.,.,..M"'ll""l"I'.,.,..,..,........,,..,.. ................. _. .... I I
..
...
5s lfflfflllliffllllll, ...... tullilffifflilffllll 56
-
(lj
(1) 50 :E
46
44 0 1 2 3 4 5 6 7
Volume Per Cent lso-butanol in Water
Figure 22. Solubility of Urea in Water Containing Acetic Acid and Varying Amounts of Isobutanol.
60

Over-all Coefficient
In determination o f the rate of absorption of straight
chain hydrocarbons by urea solution, using a packed column, , the
following cycle was observedo The rate increased, stayed con
stant for a period of time 9 and then decreased with respect to
time.
As t he hydrocarbon traveled through the packe d column,
more hydro carbon molecules were exposed to the urea molecules.
The time required for the first hydrocarbon molecules to reach
the top of the column was less than two minutes. Consequently,
the area of contact was fairly constant after two minutes. But
the constant rate did not start before 15 minutes after the
experiment was started. Therefore~ the contact area was not
61
the only factor which caused an increasing rate in the beginning
of the experimento The reaction between urea and straight chain
saturated hydrocarbons is not a simultaneous reaction. The
o::"ganic molecules must be in contact with urea molecules for
some time before they could be absorbed. This phenomenon must
be another factor causing an increase in the rate of absorption
for the first fifteen minutes of the experiment. A longer column
may help to determine which one of these two :factors is of primary
importance.
The constant period observed in the experiment indicated
that a dynami. ,:; equilibrium was reached in the column and it was
dominating until most of the urea molecules in the column were
saturated with the hydrocarbon molecules. Again9 as in the
beginning of t he experiment 9 the urea molecules located in the

62
bottom of the column were in contact with more hydrocarbon
molecules than those in the upper part of the column. Conse-
quently, the saturation of the urea molecules started from the
b ottom of t h e columno
In future investiga tions, it would be of great interest
if saturated urea solution is passed downward through a packed
column containing n - paraffin hydrocarbono The solubility of
urea complexes formed is lower in hydrocarbons than watero In
fact, water will break up the urea complexeso As a result,
the rate of urea crystallization is higher when they are crys-
tallized from hydrocarbon solution than from water-urea solutiono
Furthermore , if urea solution is supplied to hydrocarbon, the
abundance of urea molecules will cause a faster reaction. One
mole o f urea,for instance, will absorb less than 0.17 mole of
octane (equa tion ll)o Therefore, having a fixed volume of
octane and forcing a large amount of urea solution through it,
results in more effec tive absorptiono This phase of investi-
gation could not be carri ed out with the present equipment, but
more emph as is should be put on it in future investigations.
Mass Transfer Coe fficient,~ , and Mechanism ma
Th e ma ss transfer coefficient determined by equation 15a
serves to bring out severa l aspects of urea adduction. Experi-
mental values of K are presented in Tables IX through XIII$ ma
The con~tant r a te values of K for the three octane runs, Tables ma
IX ~ X and XII, s how the a v erage o f :

K = 1.56 for Fl = 2.95 cc/min. ma
K = 1.70 for Fl = 13.5 cc/min. ma
K = 1.8 for Fl = 19.8 cc/min. ma
This general increase of K with flow rate is consistent ma
with experimental mass transfer results in other areas.
For t he three hydrocarbons studied, the average constant
rate values of K are: ma
n-heptane ~ K ma
n-octane: K ma
n-nonane: K ma
=
=
=
0.85 for Fl = 13.2
1.70 for Fl = 13.5
3.79 for Fl = 5.60
These results are somewhat different than what might be
expected for a mass transfer mechanism. The Schmidt number
for these three hydrocarbons diffusing through water is very
nearly constant. That is, the diffusivity of n-heptane,
n - octane and n-nonane in water is about the same in each case;
also the density and viscosity remain. essentially the same
for each system. As a result, one would not expect very much
difference in t he mass transfer coefficient in going from one
system to another if all other forces remain constant. As
shown above, n-heptane and n-octane data were taken at nearly
the same flow rate, but the mass transfer coefficients differ
consid erably. Also, since n-nonane and n-octane have about
the same Schmidt number, the low flow rate data for n-nonane
seem inconsistent with then-octane data. For this case the
indication is that K increases as flow rate is decreased. ma
One possible explanation of this difficulty lies in
the fact that the value of C. for n-heptane is greater than 1
63

C . for n-octaneo Tables IV and VII show that during the con-1
stant rate period (F1 - F2 ) for both n-heptane and n-octane
was essentially the same. Also, it can be seen from equation
15a that the factor which contributes to the difference in K ma
for these t,.o systems is C.. Values of C. from Tables VII and ' 1 1
VIII are for n-heptane 0.00268 and for n-octane 0.0014. There
is no apparent reason for concluding that these data have more
than five per cent error. As a consequence, the values of K ma
appear to be significantly inconsistent and indicate that the
64
controlling mechanism for adduction is probably not one of mass
transfer of hydrocarbon into the aqueous solution. Another argu-
ment against a mass transfer is the relatively small increase in
K for n-octane with increased in flow rate. ma
At the present time, it is not possible to establish
whether or not the controlling mechanism is one of the crystal
growth. If the degree of supersaturation were constant when
(F1 ~ F2 ) is constant, this would lend strong support to a
mechanism of this natureo Further work will have to be done
to determine the degr ee of supersaturation.
Another technique which may serve to illustrate the
adduction mechanism is to operate at different temperatures
in order that energies of activation can be calculated from
the experimental data. One would expect that energies of
activation for crystal growth would be much larger than energies
of activation for mass transfer.

CHAPTER VI
CONCLUSIONS AND RECOMMENDATIONS
Restatement of the Problem
The original purpose of this work was to determine the
characteristics of the urea adducts formation. To accomplish
this purpose, some preliminary data such as the solubility of
n-paraffin hydrocarbons in isobutanol, acetic acid solutions
had to be determined.
Conclusions
The over-all coefficient, K, determined by equation 14,
cannot directly describe any of the possible mechanisms that take
place. It is, however, a design coefficient which indicates
the amount of hydrocarbon absorbed by saturated urea solution
at room temperature, approximately 25° C,for very specific
equipment conditions.
The mass transfer coefficients obtained from equation
15a for n - octane at three different inlet flow rates are con
sistent with the theoretical equations and other experimental
mass transfer results in other areas. The results obtained
from the experiments using three different hydrocarbons;
heptane, octane, and nonane, indicate that the controlling
mechanism for urea adduction is probably not the mass transfer
from the hydrocarbon phase to the aqueous phase.
65

66
Recommendations
Future Studies
There exists a possibility that the amount of urea present
in the solution is one of the controlling factors of the
rate of adduction. To investigate this matter, it is recommended
that saturated urea solution is passed downward through the
hydrocarbon phase in a packed column.
Equipment Alteration
Determination of the energy of activation of crystal
growth is the primary factor in study of the mass transfer
from the bulk liquid to the crystals. A new packed column with
a glass jacket should be designed so that water from a constant
temperature bath can be circulated around the column, By changing
the temperature of the bath, the mass transfer coefficient and
the energy of activation may be obtained at different tempera
tures.
Urea adduction can be studied using an agitated vessel, if
the urea solution is saturated at a relatively high temperature
(150° to 170° F.), but the reactor is kept at a temperature
about 90° to 100° F.

A SELECTED BIBLIOGRAPHY
lo Becker, R., Ann. i• Phys. 32, 128 (1938).
2. Bennet, Jo A. Ro and J.B. Lewis, !•!oCh•!• Journal!,
419 (1930)0
3. Colburn, A. P., Ind. Engo ~. 22, 967 (1930).
4o Danckwerts, P. Vo, !•!•Ch•!• Journal!, 456 (1955).
5. Domask, W. Go and K. A. Kobe, Petroleum Refiner~,
No. 4, 128 (1955).
6. Fetterly, L. G., Petroleum Refiner 34, No. 4,
134 (1955).
7o Gilliland, E. F. and T. K. Sherwood,~. Eng.~. 26,
1903 (1934).
8. Gordon, K. F. and T. K. Sherwood, Chem. Eng. Progr.
Symposium Ser. No. 10, 15 (1954).
9o Hatch, L. Fo, Petroleum Refiner 37, No. 8, 123 (1958).
lOo Higbie , R., Trans. Am. Insto Chem. Eng. l!, 365 (1935)0
11. Hixson, A. Wo and So J. Baum, Ind. Eng. Chem. 33, 478
(1941).
12. Hoppe, I. Ao and Ho Franz, Petroleum Refiner 36, No. 5,
221 (1957)0
130 Jenkins, J. D., i• Am. Chem • .§2_£. 47, 903 (1925).
14. Johnson, A. Io and C. J. Hung, !•!•Ch•!• Journal~, 412
(1956).
150 Lamer, v., ~.Eng.Chem. !1, 1267 (1952).
67

16. Lewis, W. K., Ind. Eng.~.~, 825 (1916).
17. Lewis, W. K. and W. G. Whitman, Ind. Eng.~. 16, 1215
(1924).
18. McCabe, W. L., Ind. Chern. 38, 18 (1946).
19. McCabe, w. Land R. P. Stevens, Chern. Eng. Progr. 43,
168 ( 1951L
20. Overcashier, R.H., H. A. Kingsley, and K. B. Onley,
!•!•Ch.~. Journal~, 529 (1956).
21. o. Redlich, et al., i• Am. Chem. Soc. 72, 4153 (1950).
22. Saernan , W. c., !•!•Ch.~. Journal~' 107 (1956).
23. Schiessler, R. W. and D. D. Neiswender, J. Org. Chem.
22, 697 (1957).
24. Searle, R. and K. F. Gordon,!•!•~·~· Journal~' 490
(1957).
25. Svanoe, H., Chern. Eng. Progr. §.2., No. 5, 47 (1959).
26. Swem, D., Ind. Eng. Chern. 47, 216 (1955).
27. Whitman, W. G., Chern.! Met. Eng. 29, 147 (1923).
28. Wilke, C.R., J.M. Prausnitz, and A. Acrivos, Ind.
Eng. Chem. 51, 466 (1959).
29. Zimmerschied, R. A., A. W. Weikanp, and R. F. Marschner,
Ind. Eng. Chem. 42, 1300 (1950).
68

APPENDIX A
DEFINITION OF TERMS
69
70
A - interfacial area
c1 - solubility of hydrocarbon in solution of water and additives
C - interfacial concentration a
Cb - amount by weight of hydrocarbon absorbed by a unit volume
of s a turated urea solution at any given time
C . - the maximum amount by weight of hydrocarbon that can be 1
absorbed by a unit volume of staurated urea solution
c• - equilibrium weight concentration of hydrocarbon in saturated
urea solution .
D - molecular diffusivity
E - act i vation energy, energy/mole
F1 - inlet flow rate to the column
F2 - outlet flow rate from the column
H - heat of formation of the urea adducts, energy/mole
J - nuclea tion r a te, number of nuclei formed per unit volume
K - mass transfer coefficient
K - hydrocarbon-urea solution mass transfer coefficient ma
K - equilibrium constant e
k - Boltzman constant
)( - over- all coefficient
1 - diameter of mixing tank
m - mole urea/mole hydrocarbon
n - number of carbon atoms inn-paraffin hydrocarbon
N - a dimensionless number, or moles of urea in the column
p - density of the solution
P - density of pure hydrocarbons
R - universal gas constant

r rate of mixing
S - fractional rate of surface renewal
T - absolute temperature
e - time
u - viscosity of the solution
V volume of the urea solution in the packed column
v - volume of hydrocarbon absorbed
X - fictitious film thickness
71

72
APPENDIX B
DENSITY OF ISOBUTANOL SOLUTIONS

73
TABLE XV
DENSITY OF ISOBUTYL ALCOHOL SOLUTION AT 27.1° C.
Volume Per Cent Isobutyl
Alcohol Density gram/cc.
8 0.9830
7 0.9842
6 0.9862
5 0.9874
4 0.9889
3 0.9915
0 0.9965
100 0.7980

APPENDIX C
SAMPLE CALCULATIONS
74

SAMPLE CALCULATION
Determination of Over-all Coefficient for n-Octane,
Average Inlet Flow Rate, 13.50
Operating conditions: Same as Table IV
Density of n-Octane = 0.6985 g./cc.
Density of Saturated Urea Solution= 1.215 g./cc.
Volume of the Saturated Urea Solution in the Column= 300 cc.
Per cent Urea in Solution (Weight)= 55.5
Step 1. Determination of C .• ].
Moles Urea In Column =
(55.5. Urea)(l.215. soln.)(mole Urea)(300cc. soln) 100 g. soln. cc. soln. 60 g. Urea
Mole Urea Mole HC
Mole Urea Mole Octa.
= 3.37
= 0.685(n - 1) + 2.181
= 0.685(n - 1) + 2.181
= 6.866
Molen- Octane absorbed= 3.37/6.866
= 0.486
(11)
Gram n - Octane absorbed= (Molen-Octane absorbed)(g n-Octane) Molen-Octane
= 0.486 X 114
= 55.6
C'. = g. n - Octane absorbed 1. Volume of Urea Soln.
75

= 55.6/300
= 185.5 X 10⁻³
C . = c• + c• 1 1
c• = equilibrium
c• = 2.73 X 10⁻⁵
C. = 185.5 X 10⁻³ 1
concentration of n-Octane
Table III
Step 2. Determina tion of Cb (for first five minutes).
Volume n-Octane absorbed _ 1 67 X 10-3 (Volume of Urea Soln.)(Min.) - •
Graphically integration of Fig. 7 = 8.37 X 10⁻³
Cb= grams n-Octane absorbed after five minutes
= cc. n-Octane X (g. n-Octane/ cc. n-Octane)
= 8.32 :X.. 10~3 X 0.6985
= 5.84 X 10-J
Table IV
Determination of Over-all Coefficient.
= 1 (14)
= 1.67 X 10⁻³ 1 3 -3 185.5 X 10- - 5.84 X 10
= 9.29 X 10- 3 cc./(Min.)(g.)
76

VITA
Mohammed Reza Arshadi
Candidate for the Degree of
Master of Science
Thesis : SEPARATION OF n-PARAFFIN HYDROCARBONS BY UREA ADDUCTION PROCESS
Major Field : Chemical Engineering
Biograph ical :
Personal Data : Born in Ahwaz, Iran, July 17, 1935, the son of Hossein and Rehab Arshadi.
Education: Attended elementary and secondary school in Isfahan, Iran, graduated from Adah High School, in May 1954, attended Missouri School of Mines and Metallurgy, 1955 to 1959; received the degree of Bachelor of Science in Chemical Engineering, June 1959, completed the requirements for the Master of Science degree in August, 1961.
Professional Society: Member of Alpha Xi Sigma.