
Particle shape characterisation using Fourier descriptor analysis
Upload
independentCategory
view
1download
0
ORIGINAL PAPER
Separation and direct detection of heavy lanthanides using newion-exchange chromatography: fast Fourier transform continuouscyclic voltammetry system
Mohammad Reza Pourjavid • Parviz Norouzi •
Hamid Rashedi • Mohammad Reza Ganjali
Received: 10 July 2009 / Accepted: 18 April 2010 / Published online: 29 April 2010
� Springer Science+Business Media B.V. 2010
Abstract In this study, possibilities of heavy lanthanides
(Ho3?, Er3?, Tm3?, Yb3?, and Lu3?) separation on
Nucleosil 100-5-SA, an ion-exchange column, was inves-
tigated. Separation of lanthanides was carried out using an
isocratic program of a-hydroxyisobutyric acid (HIBA)
eluent. Fast Fourier transform continuous cyclic voltam-
metry (FFT-CCV) at a gold microelectrode was used as the
detection method. Simplicity, high precision and accuracy,
time efficiency, and being economic are advantages of the
developed technique in comparison with the previous
reported ones. In addition, removal of oxygen from the test
solution is not required, the detection limit is suitable and
the technique is fast enough for determination of com-
pounds in a wide variety of chromatographic methods. The
waveform potential was continuously applied on an Au
disk microelectrode (12.5 lm in radius). The influence of
HIBA concentration as well as pH of eluent was optimized.
The best performance of the method was obtained at pH of
4.0, scan rate of 30 V s-1, accumulation potential of
-300 mV, and accumulation time of 0.3 s. The proposed
method displays a linear dynamic range of 140 and
18,000 lg L-1 and a detection limit of 50 lg L-1. Preci-
sion, inter-day precision, and accuracy of the assay were
reported too. A comparative evaluation of heavy lantha-
nides distributed in a sophisticated monazite and xenotime
minerals solutions was carried out using both FFT-CCV,
and inductively coupled plasma-atomic emission spec-
trometry (ICP-AES).
Keywords Heavy lanthanides �a-Hydroxyisobutyric acid � Flow injection �Fast Fourier transform continuous cyclic voltammetry
1 Introduction
For many years, chemists were involved in separation of
lanthanides. Separation of these elements causes consid-
erable challenges due to the marked similarity in their
chemical and physical properties (especially charge and
ionic radii), and also due to their flexibility in the formation
of coordination compounds. Also, they always find with
each other in the nature at trace concentration levels. It
makes their separation as a group or individuals extremely
difficult. There are many articles about the methods of
lanthanide separation, but among them high performance
liquid chromatography (HPLC), ion chromatography (IC),
and capillary electrophoresis (CE) have the most utilization
[1–11]. Researches explain the use of high performance
liquid chromatography, cation- and/or anion-exchange
chromatography, and capillary electrophoresis for separa-
tion of lanthanide ions with UV–Vis spectrometry, refrac-
tive index (RI), spectrofluorimetry, ICP-AES and diode
array detectors. Many of these attempts have used the
differences between stability constants of lanthanide ions
with a particular complexing agent to achieve a satisfactory
separation. Molecules with a flexible structure can reorient
its coordination site around the lanthanide(III) ions, while
the cation size changes, and, therefore, have similar sta-
bility constants for these trivalent metal ions. A more rigid
coordination structure could decrease the stability constant
M. R. Pourjavid � P. Norouzi � M. R. Ganjali (&)
Center of Excellence in Electrochemistry, Faculty of Chemistry,
University of Tehran, Tehran, Iran
e-mail: [email protected]
H. Rashedi
Department of Biochemistry Engineering, Faculty
of Engineering, University of Tehran, Tehran, Iran
123
J Appl Electrochem (2010) 40:1593–1603
DOI 10.1007/s10800-010-0144-4

of the ligand, but increase the size selectivity of the ligand
to lanthanide(III) ion due to the varied coordination dis-
tances and the different radii of the ions. Such compounds
could provide improved materials for the separation of
these ions [12].
In general, ion chromatography is an attractive
procedure for analysis of lanthanides. In this method, low-
capacity cation-exchange resins are typically used as sta-
tionary phases, and mobile phases are aqueous solutions of
complexing agents. Many eluents, such as a-hydroxyiso-
butyric acid (a-HIBA) [13–15], mandelic acid [16], oxalic
acid [17], glycolic acid [18], lactic acid [19], etc., have
been used for lanthanide separation. Fernandez and Alonso
[20] recently used ethylenediaminetetraacetic acid (EDTA)
as a mobile phase in the separation of lanthanides. A mixed
gradient of two eluents has also been used in some
researches [13, 21]. The most popular eluting agent in these
works is HIBA due to a good degree of separation among
adjacent lanthanides. HIBA forms complexes with lantha-
nide ions, and decreases the affinity of the lanthanide to
cation-exchange resin. In this case, two equilibriums
should be considered: the equilibrium between the eluent
and the resin, and the equilibrium between the lanthanide
and the lanthanide–HIBA complex. Each lanthanide will
spend more or less time in the eluent due to the stability
constant of its complex with HIBA. Therefore, lanthanides
such as Lu (which forms the most stable complex with
HIBA), will spend relatively more time in the eluent and
elute first. Conversely, lanthanides that form a weaker
complex with HIBA (such as Ho) spend relatively less time
in the eluent. These cations spend more time in the resin
and elute later. Also, HIBA was found to be better eluent
for heavy lanthanides and its LOD is a little bit less than
medium or light lanthanides. Stronger complexing agents,
such as oxalic acid, form complexes with negative charges.
Under these conditions, the lanthanide series may be sep-
arated by anion-exchange chromatography. Since the
strongest complexes are the most negatively charged, the
elution order is reversed from that of the cation-exchange
separations. Thus, HIBA was used as an eluting agent in
this study.
One of the general methods for determination of sepa-
rated lanthanides is the post-column derivatization method.
This normally involves the use of UV–Vis detection at
wavelengths ranging from 512 to 658 nm. Arsenazo-III
and PAR are the most commonly used complexing
reagents [7, 22]. In the past years, ICP-AES and ICP-MS
interfaced with ion chromatography have been used in
simultaneous and multi-element analysis of lanthanide
[23, 24]. Occasionally, a large amount of reagent used as
the mobile phase causes spectral interference. In addition,
the high viscosity of concentrated salt solutions tends to
influence the nebulization efficiency. The interferences due
to polyatomic ions cause a serious problem in the case of
ICP-MS [25]. Electrochemical methods can be also useful
tools for lanthanide determination. Potentiometric sensors
can offer an acceptable sensitivity, selectivity, inexpensive,
and convenient method for rare-earth ions analysis in
solution. There are many reports about ion selective elec-
trodes (ISEs) for lanthanide ions in last decade [26–35]. In
this study, fast Fourier transform continuous cyclic vol-
tammetry (FFT-CCV) was investigated as a new method
for determination of holmium, erbium, thulium, ytterbium,
and lutetium. Detection of lanthanide ions with FFT-CCV
is faster than other detection methods, especially UV–Vis
spectrometry, because in these methods, pre- or post-
column derivatization is necessary which is time consum-
ing and expensive. Due to the movement of the analyte
zone in an electrochemical flow cell, the application of
such techniques requires fast accumulation of the analyte
and also fast potential sweeping (which is not appropriate
for large electrodes) [36]. In general, electrochemical
measurements at solid electrodes are not suitable for the
kinetically controlled or irreversible processes because the
surfaces of the solid electrodes are easily deactivated (or
poisoned) by products of the red/ox reactions of the desired
species or by impurities present in the solution. Problems
of such methods, however, can be overcome using ultra-
microelectrodes (UMEs). Use of UMEs with voltammetric
techniques offers advantages of steady-state currents,
higher sensitivity due to increase of mass transport, and
ability to be used in solutions with very high resistances
[37]. For instance, UMEs have been applied as sensors in
various techniques like flow injection analysis [38], car-
diovascular monitoring, and in analysis of some organic
compounds [39]. Another problem with solid electrodes
comes from the changes in the characteristics of the elec-
trode surface during the potential scan. The electrode sig-
nal will have a large background current. If the surface of
the solid electrode is oxidized and reduced during vol-
tammetric measurements (the response of the electrode will
have a large background current), high levels of noise due
to the structural changes of the electrode surface will occur.
Currents like this can interfere with the desirable electrode
processes and may adversely affect the detection limits of
the method used.
The background current in voltammetric measurements
can provide useful pieces of information about the
adsorption processes and changes in the double layer at the
electrode surface [40]. In addition, small amounts of
adsorption of the species present in the solution on the
electrode surface can strongly affect the cathodic and
anodic currents of the red/ox reaction of the electrode. A
special computer-based numerical method was also intro-
duced for the calculation of the signal of the analyte and
noise reduction. Signal calculation was based on the net
1594 J Appl Electrochem (2010) 40:1593–1603
123
partial and total charge exchanges at the electrode surface,
and was done by integrating the currents at the selected
potential range at the cyclic voltammogram (CV). Depend-
ing on conditions applied, the detector (the proposed
method) can be used in the determination of inorganic and
organic species in various chromatographic analysis meth-
ods (e.g., HPLC and IC).
2 Experimental
2.1 Apparatus
Model IC760 (Metrohm) was used during the ion chro-
matographic experiments. Characterization of some useful
cation exchangers is presented in Table 1 [41]. In the case
of separation of heavy lanthanides, ion-exchanger DOW-
EX 50WX8 was used. The operation was completed under
the flow rate 1.5 mL min-1.
The equipment for flow injection analysis included a 10
roller peristaltic pump (UltrateckLabs Co., Iran) and a four-
ways injection valve (Supelco Rheodyne Model 5020) with
a 50 mL sample injection loop. Solutions were introduced
into the sample loop by means of a plastic syringe. The
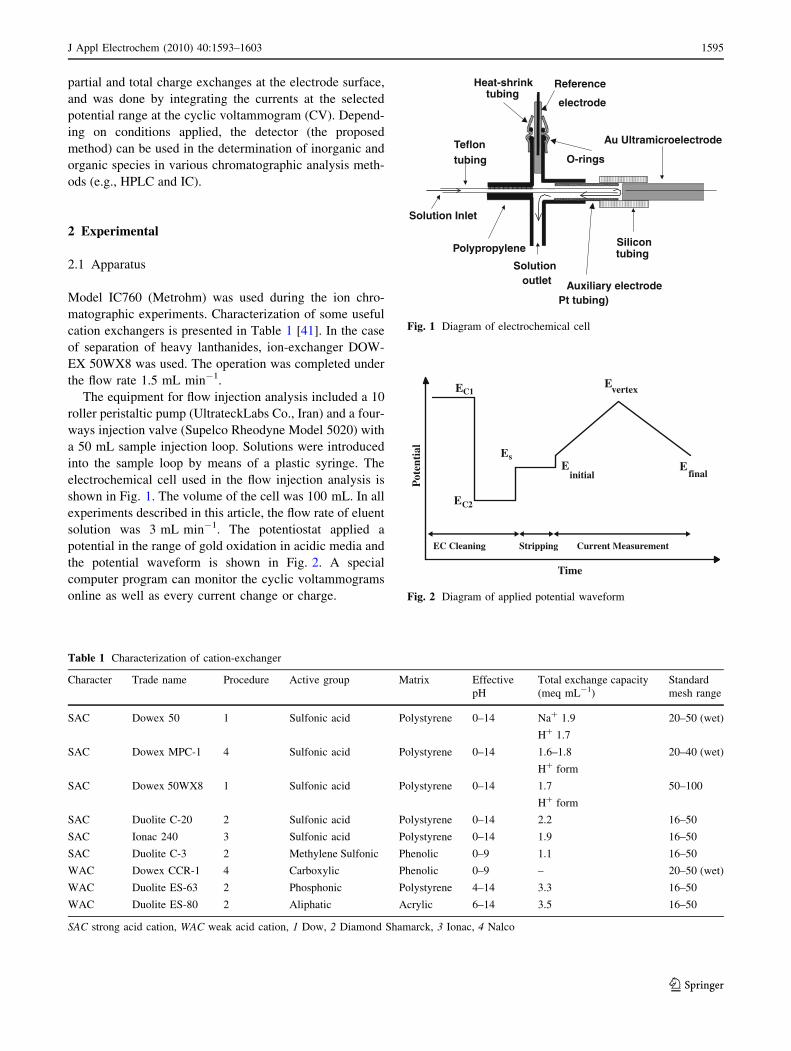
electrochemical cell used in the flow injection analysis is
shown in Fig. 1. The volume of the cell was 100 mL. In all
experiments described in this article, the flow rate of eluent
solution was 3 mL min-1. The potentiostat applied a
potential in the range of gold oxidation in acidic media and
the potential waveform is shown in Fig. 2. A special
computer program can monitor the cyclic voltammograms
online as well as every current change or charge.
Table 1 Characterization of cation-exchanger
Character Trade name Procedure Active group Matrix Effective
pH
Total exchange capacity
(meq mL-1)
Standard
mesh range
SAC Dowex 50 1 Sulfonic acid Polystyrene 0–14 Na? 1.9
H? 1.7
20–50 (wet)
SAC Dowex MPC-1 4 Sulfonic acid Polystyrene 0–14 1.6–1.8
H? form
20–40 (wet)
SAC Dowex 50WX8 1 Sulfonic acid Polystyrene 0–14 1.7
H? form
50–100
SAC Duolite C-20 2 Sulfonic acid Polystyrene 0–14 2.2 16–50
SAC Ionac 240 3 Sulfonic acid Polystyrene 0–14 1.9 16–50
SAC Duolite C-3 2 Methylene Sulfonic Phenolic 0–9 1.1 16–50
WAC Dowex CCR-1 4 Carboxylic Phenolic 0–9 – 20–50 (wet)
WAC Duolite ES-63 2 Phosphonic Polystyrene 4–14 3.3 16–50
WAC Duolite ES-80 2 Aliphatic Acrylic 6–14 3.5 16–50
SAC strong acid cation, WAC weak acid cation, 1 Dow, 2 Diamond Shamarck, 3 Ionac, 4 Nalco
Solutionoutlet
Teflontubing
Polypropylene
Reference
electrode
O-rings
Heat-shrinktubing
Auxiliary electrodePt tubing)
Silicontubing
Au Ultramicroelectrode
Solution Inlet
Fig. 1 Diagram of electrochemical cell
EC1
EC2
Einitial
Evertex
Efinal
Pot
enti
al
Time
Es
EC Cleaning Current Measurement Stripping
Fig. 2 Diagram of applied potential waveform
J Appl Electrochem (2010) 40:1593–1603 1595
123

A Varian Liberty 150 AX Turbo model inductively
coupled plasma-atomic emission spectroscopy (ICP-AES)
was used for the determination of the lanthanide ions
concentration.
2.2 Reagents
For the experimental, the oxide of lanthanides, hydro-
chloric acid, and HIBA were of high purity available from
Merck Chemicals and were used without further purifica-
tion. HIBA 0.2 mol L-1 was buffered at pH 4.0 with
sodium hydroxide. The reagents for preparation of the
eluent solution for flow injection analysis (0.05 mol L-1
H3PO4), and 1 mol L-1 NaOH (for the pH eluent adjust-
ment), were obtained (from Merck). All solutions were
prepared in doubly distilled deionized water, filled with the
background electrolyte solution and were used without
removal of the dissolved oxygen.
2.3 Background electrolyte (BGE) and standard
solutions
The running buffer or BGE was made by addition of
8.7 mL phosphoric acid (85% w/v) in a 1,000 mL volu-
metric flask, and diluted to a constant volume with distilled
water. The pH was adjusted to 4.0 with sodium hydroxide
and all solutions were freshly prepared and filtered using a
Millipore filter (0.45 lm) daily.
A lanthanide standard stock solution was prepared by
dissolving the pure oxide of lanthanides in 0.36 M hydro-
chloric acid. These solutions were diluted with doubly
distilled deionized water to about 10 mg L-1 of metal in
standard solutions. Aliquots of standard stock solution of
lanthanides were dispensed into 10 mL volumetric flasks
and made up to volume with the running buffer to give a
final concentration range of 10–18,000 lg L-1.
2.4 Electrode preparation
Gold UMEs (12.5 mm in diameter) were prepared by
sealing metal micro-wires (Good fellow Metals Ltd.,
Huntingdon, UK) into a soft glass capillary. The capillary
was cut perpendicular to its length to expose the wire.
Electrical contacts were made using silver epoxy (Johnson
Matthey Ltd., London, UK). Before each experiment, the
electrode surface was polished for 1 min using an extra fine
carborundum paper, and then for 10 min with 0.3 mm
alumina. Prior to being placed in the cell, the electrode was
washed with distilled water. During all measurements, an
Ag(s)|AgCl(s)|KCl (aq, 1 mol L-1) reference electrode
was used. The auxiliary electrode was made of Pt wire,
1 cm in length and 0.5 mm in diameter.
3 Results and discussion
3.1 Data acquisition and processing
For the data acquisition, the setup of a PC PIV Pentium
900 MHz microcomputer equipped with a data acquisition
board (PCL-818HG, Advantech. Co.), and a custom made
potentiostat were used. All data acquisition and data pro-
cessing programs were developed in Delphi 6� program
environment. In Fig. 2, the applied waveform potential
diagram during the cyclic voltammetric measurements is
shown. The potential waveform consists of three parts; (a)
Potential steps, Ec1 and Ec2 (which are used for the oxi-
dation and reduction of the electrode surface, respectively),
during which the electrochemical cleaning of the electrode
surface takes place, (b) Ec, where the analyte accumulation
happens, and (c) the potential ramp, where the current
measurements occur.
During the scan, some of the adsorbed analyte mole-
cules are desorbed. Depending on the rate of those pro-
cesses and scan rate, the amount of desorption analyte
molecules can be changed. The important point here is that:
part of the adsorbed analyte molecules still remain on the
electrode surface, inhibiting the red/ox process of the
electrode surface. In this technique, DQ is calculated in
accordance with all current changes at the CVs [42–46].
One of the considerable aspects of this method is
application of a special digital filtration, which is applied
during the measurement. At first, an electrode CV was
recorded and then by applying FFT on the collected data,
the existing high frequency noises were indicated. With the
aid of this information, the cutoff frequency of the analog
filter was set at a certain value (where the noises were
removed from the CV).
Since the crystal structure of a polycrystalline gold
electrode is greatly affected by the condition of the applied
potential waveform [37], different potential waveforms
were examined to obtain a reproducible electrode surface
(or a stable background signal). In fact, the application of
cyclic voltammetry for the determination of electroactive
compounds mainly faces low stability of the background
signal. This is due to the changes taking place in the sur-
face crystal structure during the oxidation and reduction of
the electrode in each potential cycle.
The electrochemical oxidation process of the gold sur-
face starts with the hydroxyl ion electrosorption, which at
more positive potentials results in the gold oxide formation
undergoing structural rearrangement [47].
An example of the recorded CVs is demonstrated in
Fig. 3a and b. Figure 3a shows a CV sequence recorded
during the flow analysis for lanthanide determination. The
injection volume was 50 lL of (1.0 mg L-1) Ho3?, Er3?,
Tm3?, Yb3?, and Lu3? (in 0.05 M H3PO4) into the eluent
1596 J Appl Electrochem (2010) 40:1593–1603
123
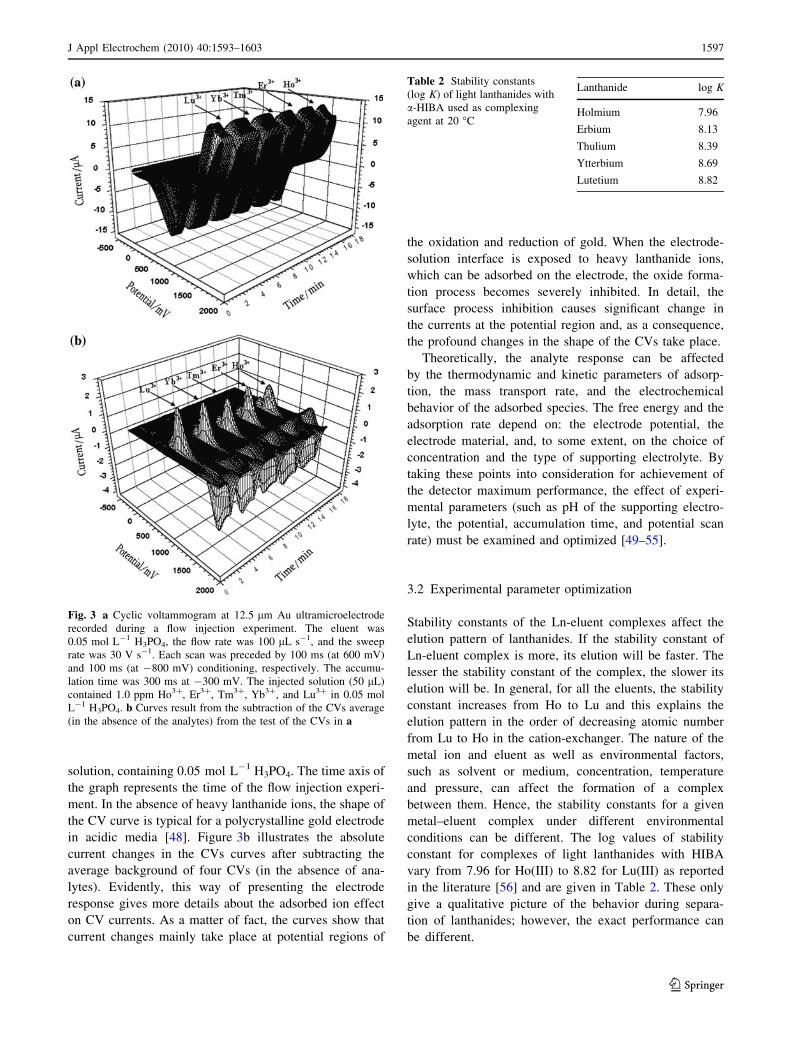
solution, containing 0.05 mol L-1 H3PO4. The time axis of
the graph represents the time of the flow injection experi-
ment. In the absence of heavy lanthanide ions, the shape of
the CV curve is typical for a polycrystalline gold electrode
in acidic media [48]. Figure 3b illustrates the absolute
current changes in the CVs curves after subtracting the
average background of four CVs (in the absence of ana-
lytes). Evidently, this way of presenting the electrode
response gives more details about the adsorbed ion effect
on CV currents. As a matter of fact, the curves show that
current changes mainly take place at potential regions of
the oxidation and reduction of gold. When the electrode-
solution interface is exposed to heavy lanthanide ions,
which can be adsorbed on the electrode, the oxide forma-
tion process becomes severely inhibited. In detail, the
surface process inhibition causes significant change in
the currents at the potential region and, as a consequence,
the profound changes in the shape of the CVs take place.
Theoretically, the analyte response can be affected
by the thermodynamic and kinetic parameters of adsorp-
tion, the mass transport rate, and the electrochemical
behavior of the adsorbed species. The free energy and the
adsorption rate depend on: the electrode potential, the
electrode material, and, to some extent, on the choice of
concentration and the type of supporting electrolyte. By
taking these points into consideration for achievement of
the detector maximum performance, the effect of experi-
mental parameters (such as pH of the supporting electro-
lyte, the potential, accumulation time, and potential scan
rate) must be examined and optimized [49–55].
3.2 Experimental parameter optimization
Stability constants of the Ln-eluent complexes affect the
elution pattern of lanthanides. If the stability constant of
Ln-eluent complex is more, its elution will be faster. The
lesser the stability constant of the complex, the slower its
elution will be. In general, for all the eluents, the stability
constant increases from Ho to Lu and this explains the
elution pattern in the order of decreasing atomic number
from Lu to Ho in the cation-exchanger. The nature of the
metal ion and eluent as well as environmental factors,
such as solvent or medium, concentration, temperature
and pressure, can affect the formation of a complex
between them. Hence, the stability constants for a given
metal–eluent complex under different environmental
conditions can be different. The log values of stability
constant for complexes of light lanthanides with HIBA
vary from 7.96 for Ho(III) to 8.82 for Lu(III) as reported
in the literature [56] and are given in Table 2. These only
give a qualitative picture of the behavior during separa-
tion of lanthanides; however, the exact performance can
be different.
Fig. 3 a Cyclic voltammogram at 12.5 lm Au ultramicroelectrode
recorded during a flow injection experiment. The eluent was
0.05 mol L-1 H3PO4, the flow rate was 100 lL s-1, and the sweep
rate was 30 V s-1. Each scan was preceded by 100 ms (at 600 mV)
and 100 ms (at -800 mV) conditioning, respectively. The accumu-
lation time was 300 ms at -300 mV. The injected solution (50 lL)
contained 1.0 ppm Ho3?, Er3?, Tm3?, Yb3?, and Lu3? in 0.05 mol
L-1 H3PO4. b Curves result from the subtraction of the CVs average
(in the absence of the analytes) from the test of the CVs in a
Table 2 Stability constants
(log K) of light lanthanides with
a-HIBA used as complexing
agent at 20 �C
Lanthanide log K
Holmium 7.96
Erbium 8.13
Thulium 8.39
Ytterbium 8.69
Lutetium 8.82
J Appl Electrochem (2010) 40:1593–1603 1597
123

3.2.1 Effect of pH of eluent on retention of lanthanide
ions
Effect of mobile phase pH on the elution pattern of a
mixture of light lanthanide ions using HIBA is shown in
Fig. 4. This effect was monitored using retention factor
(K). The analytical expression for K is:
K ¼ ðtR � t0Þt0
ð1Þ
In this equation, t0 is retention time of non-retained peak
and tR is retention time of the eluent retained. As it can be
seen, increasing pH from 3.0 to 6.0 caused a decrease of
retention factor (K) for lanthanide ions. Changes in pH
have an effect on the elution efficiency of carboxylic acids.
This factor depends on its strength, which in turn depends
on its pH. The a-hydroxycarboxylic acids tested were all
weak acids and undergo only partial ionization, hence,
show poor eluting strength at low pH [11]. With increasing
pH, the elution efficiency increased due to the greater
ionization of the –COOH group. However, at higher pH,
the retention factors for different lanthanides are quite
close. Therefore, pH = 4.0 was selected as the optimum,
which gives adequate resolution in a shorter time. Fur-
thermore, this pH was chosen because it is near to that of
the maximum buffer capacity for HIBA.
3.2.2 Effect of concentration of eluent on retention
of lanthanide ions
The influence of the concentration of HIBA on retention of
heavy lanthanides is shown in Fig. 5. In high concentra-
tions of eluent, elution of lanthanides is faster. The effect of
concentration of HIBA was studied at pH 4.0. Under this
condition, HIBA is *63% ionized (pKa = 3.77) [57]. With
an increase in concentration of a-HIBA, the concentration
of a-hydroxyisobutyrate ions increases in the mobile phase
and these results in faster elution of lanthanides on the
column.
3.2.3 Influence of sweep rate, accumulation potential,
and accumulation time
For the investigation of the scan rate’s influence and the
eluent flow rate on the sensitivity of the detector response,
solutions having a concentration of 1.0 ppm of Ho3?, Er3?,
Tm3?, Yb3?, and Lu3? were injected. At different scan rates
(from 5 to 100 V s-1) and eluent flow, the detector
responses of the injected sample were recorded. These
results are presented in Fig. 6. As it is clear from Fig. 6a, the
detector exhibits the maximum sensitivity at the scan rate of
30 V s-1, and Fig. 6b shows that flow rate of 3 mL min-1 is
the best. The effects of sweep rate on detection performance
can be considered in three different aspects: first, speed in
data acquisition; second, kinetic factors of lanthanide ions
adsorption, and, finally, the eluent flow rate which controls
the time window of the solution zone in the detector. The
main reason for the application of high scan rates is pre-
vention from desorption of the adsorbed lanthanide ions
during the potential scanning (because under this condition,
the inhibition outcome of the adsorbed lanthanide ions on
the oxidation process can take place).
It is a fact that employment of high scan rates is required
for use of this detection method in conjunction with fast
separation techniques, such as capillary electrophoresis.
From this point of view, it is necessary to check how the
method sensitivity is affected by the sweep rate. Therefore,
high sweep rates must be employed to detect the amount of
the adsorbed analyte on the electrode surface, so that the
potential scanning step is short in comparison with the
accumulation period. An important point to be taken into
Fig. 4 Effect of pH of mobile phase on retention of light lanthanides
DOWEX 50WX8 under isocratic condition: 0.2 M of HIBA. The
injected solution (50 lL) contained 1.0 mg L-1 Ho3?, Er3?, Tm3?,
Yb3?, and Lu3? in 0.05 mol L-1 H3PO4
Fig. 5 Effect of HIBA concentration (pH 4.0) on retention of
lanthanides on DOWEX 50WX8. The injected solution (50 lL)
contained 1.0 mg L-1 Ho3?, Er3?, Tm3?, Yb3?, and Lu3? in
0.05 mol L-1 H3PO4
1598 J Appl Electrochem (2010) 40:1593–1603
123

consideration is the time when the accumulation of lan-
thanide ions occurs at a potential that is greater or smaller
than Ei. However, the sensitivity of the detection system
mainly depends on the potential sweep rate, mostly due to
the adsorption kinetic factors and the instrumental limita-
tions. Notably, any changes in parameters relating to the
adsorption process and affecting the applied potential (time
and potential of accumulation), severely influences the
sensitivity of the measurement. For this reason, the influ-
ence of the accumulation potential and response time of the
method for injection of 1.0 mg L-1 solution of Ho3?, Er3?,
Tm3?, Yb3?, and Lu3? in 0.05 mol L-1 H3PO4, was
studied. Figure 7 shows the detector response over the
accumulation potential ranges of -800 to 600 mV, and the
accumulation time range of 0.05–1.0 s. Figure 7a and b
derives the conclusion that optimum conditions to be
chosen are: accumulation potential of -300 mV and
accumulation time of 300 ms, on the grounds that the
electrode surface becomes saturated with lanthanide ions
within a 1,300 ms time window.
On the electrode, lanthanide ions accumulation takes
place during the accumulation step (assuming that an
appropriate potential is selected). The difference in the
saturation time of various compounds can be related to
existing differences in their kinetics of electron transfer and
mass transport. As mentioned above, the surface of the
gold ultra microelectrode is small and, in a short time, the
surface can be saturated.
3.3 Validation
The method was validated in terms of linearity, limit of
quantitation (LOQ), limit of detection (LOD), precision,
accuracy, ruggedness/robustness, recovery, and selectivity.
The linearity was evaluated by linear regression analy-
sis, which was calculated by the least square regression
method. The calibration curves obtained for heavy lan-
thanide ions were linear over the concentration range of
140–18,000 lg L-1. The peak areas of Ho3?, Er3?, Tm3?,
Yb3?, and Lu3? were plotted versus its concentration and
linear regression analysis was carried out on the resultant
curve. After this analysis, a correlation coefficient of
R = 0.999 and %RSD values, ranging from 0.28 to 3%
across the studied concentration range, were obtained.
Typically, the regression equation for the calibration curve
Fig. 6 a The effect of the sweep rate and b the effect of flow rate on
the response of the Au electrode (with a radius of 12.5 lm) to
injections of 1.0 mg L-1 Ho3?, Er3?, Tm3?, Yb3?, and Lu3? in
0.05 mol L-1 H3PO4
Fig. 7 a The effect of accumulation potential and b the effect of
accumulation time on electrode response to injections of 1.0 mg L-1
Ho3?, Er3?, Tm3?, Yb3?, and Lu3? in 0.05 mol L-1 H3PO4
J Appl Electrochem (2010) 40:1593–1603 1599
123
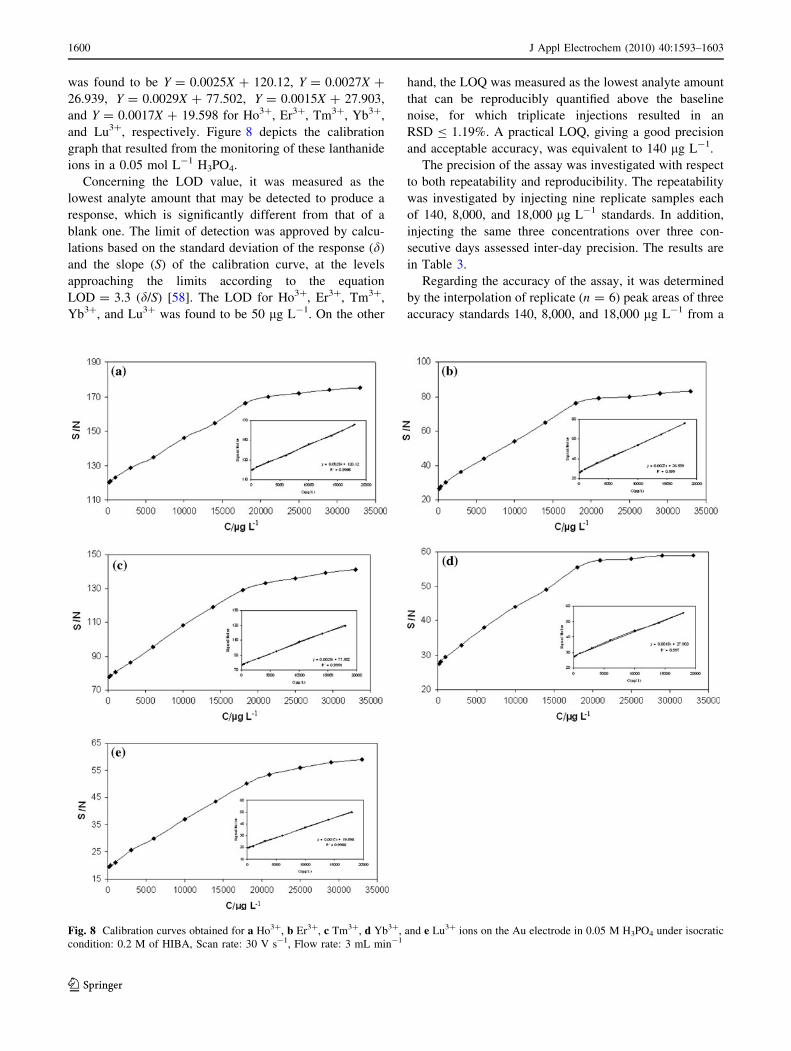
was found to be Y = 0.0025X ? 120.12, Y = 0.0027X ?
26.939, Y = 0.0029X ? 77.502, Y = 0.0015X ? 27.903,
and Y = 0.0017X ? 19.598 for Ho3?, Er3?, Tm3?, Yb3?,
and Lu3?, respectively. Figure 8 depicts the calibration
graph that resulted from the monitoring of these lanthanide
ions in a 0.05 mol L-1 H3PO4.
Concerning the LOD value, it was measured as the
lowest analyte amount that may be detected to produce a
response, which is significantly different from that of a
blank one. The limit of detection was approved by calcu-
lations based on the standard deviation of the response (d)
and the slope (S) of the calibration curve, at the levels
approaching the limits according to the equation
LOD = 3.3 (d/S) [58]. The LOD for Ho3?, Er3?, Tm3?,
Yb3?, and Lu3? was found to be 50 lg L-1. On the other
hand, the LOQ was measured as the lowest analyte amount
that can be reproducibly quantified above the baseline
noise, for which triplicate injections resulted in an
RSD B 1.19%. A practical LOQ, giving a good precision
and acceptable accuracy, was equivalent to 140 lg L-1.
The precision of the assay was investigated with respect
to both repeatability and reproducibility. The repeatability
was investigated by injecting nine replicate samples each
of 140, 8,000, and 18,000 lg L-1 standards. In addition,
injecting the same three concentrations over three con-
secutive days assessed inter-day precision. The results are
in Table 3.
Regarding the accuracy of the assay, it was determined
by the interpolation of replicate (n = 6) peak areas of three
accuracy standards 140, 8,000, and 18,000 lg L-1 from a
Fig. 8 Calibration curves obtained for a Ho3?, b Er3?, c Tm3?, d Yb3?, and e Lu3? ions on the Au electrode in 0.05 M H3PO4 under isocratic
condition: 0.2 M of HIBA, Scan rate: 30 V s-1, Flow rate: 3 mL min-1
1600 J Appl Electrochem (2010) 40:1593–1603
123

calibration curve prepared as previously described. In each
case, the relevant error percentage, and the accuracy were
calculated. Table 4 shows the resultant concentrations with
their relevant error percentage.
The ruggedness of the method was calculated by the
comparison of the intra- and inter-day assay results for
lanthanide ions undertaken by two analysts. The %RSD
values for intra- and inter-day assays of lanthanide ions in
the cited formulations, performed in the same laboratory
by two analysts, did not exceed 4%; thus, indicating the
ruggedness of the method. Also, the robustness of the
method was investigated under a variety of conditions
such as small changes in pH of eluent, flow rate, buffer
composition, and laboratory temperature. As, it can be
seen in Table 5, heavy lanthanide ions recovery percent-
ages were good under most conditions, not demonstrating
any significant change when the critical parameters were
modified.
Monazite [(Ln, Th)PO4] and Xenotime [(Y, Ln)PO4] are
two important lanthanide ores and have large amounts of
these elements. The first one is richer in earlier lanthanides
and the second one is richer in later lanthanides. Ion-
exchange separation is not of real commercial importance
for large-scale production, but historically it was a method
by which fast high-purity separation of the lanthanides first
became feasible [59]. Thus, two solutions were prepared
with the same ingredients of monazite and xenotime, and
diluted 1,000 times to provide sample solutions (of course,
the amounts of holmium, erbium, and ytterbium in xeno-
time are so large; we diluted them 10 times more than the
others). The results obtained for medium lanthanide ions in
monazite and xenotime samples under investigation are
given in Table 6. For these determinations, five replicate
analyses were performed for each sample. The standard
deviation of the whole procedure is also given in Table 6.
From the results, it can be seen that within the precision of
both measuring procedures, the concentration values of
these ions determined by FFT-CCV and ICP-AES are in
fair agreement.
Table 3 Precision and inter-day precision of the assay
Standard
solutions
(lg L-1)
Precision Inter-day precision
Mean
concentration
(lg L-1)
RSD
(%)
Mean
concentration
(lg L-1)
RSD
(%)
Ho3? 140 145 2.44 152 2.89
8,000 8,012 1.86 8,017 2.52
18,000 17,923 0.87 17,911 1.53
Er3? 140 147 2.83 153 3.05
8,000 8,017 2.26 8,023 2.31
18,000 17,947 0.88 17,940 1.15
Tm3? 140 143 2.65 145 3.05
8,000 8,020 2.13 8,033 2.64
18,000 17,909 1.00 17,900 1.53
Yb3? 140 148 3.07 151 2.52
8,000 8,009 1.58 8,014 2.00
18,000 17,953 1.00 17,941 1.15
Lu3? 140 145 3.20 153 3.60
8,000 8,012 2.62 8,013 2.52
18,000 17975 0.78 17,970 1.15
Table 4 Accuracy of the assay
Standard
solutions
(lg L-1)
Resultant
concentration
(lg L-1)
Relevant
error (%)
Ho3? 140 144 ± 2 2.86
8,000 8057 ± 35 0.71
18,000 17905 ± 41 0.53
Er3? 140 145 ± 1 3.57
8,000 8073 ± 41 0.91
18,000 17922 ± 52 0.43
Tm3? 140 143 ± 7 2.14
8,000 8065 ± 26 0.81
18,000 17914 ± 45 0.48
Yb3? 140 174 ± 5 5.00
8,000 8122 ± 50 1.52
18,000 17890 ± 15 0.61
Lu3? 140 145 ± 2 3.57
8,000 8095 ± 71 1.19
18,000 17900 ± 71 0.56
Table 5 Influence of the changes in the experimental conditions on
the performance of the FIA system
Parameter Modification %Recovery
Ho3? Er3? Tm3? Yb3? Lu3?
pH 3.9 99.7 100.3 100.9 99.4 100.4
4.0 99.9 100.4 100.9 99.9 101.2
4.1 100.0 100.0 99.1 100.1 100.8
Flow rate
(mL min-1)
2.6 100.0 99.4 101.1 100.8 99.7
2.8 101.7 100.2 101.1 100.6 100.4
3.0 101.2 100.1 100.7 100.6 99.2
Buffer
composition
(mol L-1)
0.20 100.4 100.2 100.2 100.7 100.6
0.19 100.8 100.3 100.6 101.9 101.2
0.18 99.2 100.4 100.5 101.4 101.0
Lab. temperature
(�C)
20 101.4 101.3 98.2 100.9 100.7
25 101.7 101.0 100.2 101.1 100.7
30 101.1 99.4 100.0 100.4 100.7
J Appl Electrochem (2010) 40:1593–1603 1601
123

3.4 Comparison of the sensitivity of the proposed
method and other previous reported methods
Table 7 compares the detection limit of the proposed
method with UV–Vis spectrometry, spectrofluorimetry, RI,
ICP-AES, and potentiometric methods. As it can be seen,
the sensitivity of FFT-CCV method is better than most of
them.
4 Conclusions
In this study, the cation-exchange separation and determi-
nation of holmium, erbium, thulium, ytterbium, and
lutetium ions was achieved for the first time by coupling of
ion-exchange separation and fast Fourier transform con-
tinuous cyclic voltammetry (FFT-CCV) in a flow injection
system, thereby enabling direct detection. a-Hydroxyiso-
butyricacid (HIBA) has been found to be a successful
eluent. Lanthanide ions form complexes with HIBA that
lowers the affinity of the lanthanide for the cation-
exchange resin. Lanthanide ions, such as Lu3? ion, which
form a stable complex with HIBA, spend more time in the
eluent and elute first. Lanthanide ions, such as Ho3? ion,
which form a weaker complex with HIBA, spend rela-
tively less time in eluent and elute later (the rate
of transport being in this order Lu3? [ Yb3? [Tm3? [ Er3? [ Ho3?). From the results described, it can
Table 6 Comparison between the determination of medium lanthanide ions by FFT-CCV and ICP-AES
Element Real amount of monazite
solution (mg L-1)
Found amount of monazite solution
(mg L-1)
Real amount of xenotime
solution (mg L-1)
Found amount of xenotime solution
(mg L-1)
FFT-CCV ICP-AES FFT-CCV ICP-AES
Ho 0.50 0.52 ± 0.01 0.54 ± 0.04 2.00 2.08 ± 0.04 2.07 ± 0.05
Er 2.00 1.90 ± 0.09 1.98 ± 0.21 5.40 5.55 ± 0.16 5.20 ± 0.11
Tm 0.20 0.20 ± 0.03 0.22 ± 0.07 9.00 9.29 ± 0.27 9.41 ± 0.38
Yb 1.00 0.87 ± 0.02 1.072 ± 0.02 6.20 6.12 ± 0.22 6.04 ± 0.12
Lu 0.20 0.19 ± 0.03 0.18 ± 0.05 4.00 3.94 ± 0.09 3.74 ± 0.14
Table 7 Comparison between
the detection limits of the
proposed method with the other
reported methods
Separation method Detection method Detection limit References
IEC Vis *10 mg L-1 [1]
IEC Vis 5 mg L-1 [2]
HPCIC Vis 4 mg L-1 [3]
IEC Spectrofluorimetry [50 mg L-1 [4]
IEC Spectrofluorimetry [50 mg L-1 [5]
CE UV 240–470 mg L-1 [6]
SPE-RP-ion pair-HPLC UV-RI 10 mg L-1 [7]
CE UV 530–960 lg L-1 [8]
RP-HPLC UV–Vis 50 lg L-1 [9]
RP-HPLC Diode array detector [9 mg L-1 [10]
CE UV 4.8 mg L-1 [11]
IEC ICP-AES 50–220 lg L-1 [15]
– Potentiometry 121 lg L-1 [26]
– Potentiometry 1.3 mg L-1 [29]
– Potentiometry 140 lg L-1 [30]
– Potentiometry 825 lg L-1 [31]
– Potentiometry 80 lg L-1 [32]
– Potentiometry 124 lg L-1 [33]
– Potentiometry 104 lg L-1 [34]
– Potentiometry 105 lg L-1 [35]
IEC FFT-CCV 50 lg L-1 This study
1602 J Appl Electrochem (2010) 40:1593–1603
123

be concluded that good separation of these ions can be
achieved using isocratic elution with 0.20 mol L-1 of
HIBA at pH = 4.0. The best values for accumulation
potential and accumulation time were -300 mV and 0.3 s,
respectively. A 30 V s-1 scan rate was necessary. The
good agreement between the results obtained by FFT-CCV
and ICP-AES indicates that the proposed method has a
good accuracy.
References
1. Knight CH, Cassidy RM, Recoskie BM, Green LW (1984) Anal
Chem 56:474
2. Inoue Y, Kumagai H, Shimimura Y (1996) Anal Chem 68:1517
3. Nesterenko PN, Jones PN (1998) J Chromatogr A 804:223
4. Kutun S, Akseli A (1999) J Chromatogr A 847:261
5. Kutun S, Akseli A (2000) J Chromatogr A 874:311
6. Oztekin N, Erim FB (2000) J Chromatogr A 895:263
7. Buchmeiser MR, Seeber G, Tessadri R (2000) Anal Chem
72:2595
8. Oztekin N, Erim FB (2001) J Chromatogr A 924:541
9. Santoyo E, Verma SP (2003) J Chromatogr A 997:171
10. Raut NM, Jaison PG, Aggarwal SK (2004) J Chromatogr A
1052:131
11. Santoyo E, Garcıa R, Galicia-Alanis KA, Verma SP, Aparicio A,
Santoyo-Castelazo A (2007) J Chromatogr A 1149:12
12. Henderson P (1984) Rare earth element geochemistry. Elsevier,
Amsterdam
13. Barkley DJ, Blanchette M, Cassidy RM, Elchuk S (1986) Anal
Chem 58:2222
14. Dufek P, Vobecky M, Holik J, Valasek J (1988) J Chromatogr
435:249
15. Borai EH, Eid MA, Aly HF (2002) Anal Bioanal Chem 372:537
16. Elchuk S, Burns KI, Cassidy RM, Lucy CA (1991) J Chromatogr
558:197
17. Bruzzoniti MC, Mentasti E, Sarzanini C (1997) Anal Chim Acta
353:239
18. Kuroda R, Wada T, Kishimoto G, Oguma K (1991) Chroma-
tographia 32:65
19. Vera-Avila LE, Camacho E (1992) J Liq Chromatogr 15:835
20. Fernandez RG, Alonso JIG (2008) J Chromatogr A 1180:59
21. Nuryono C, Huber G, Kleboth K (1998) Chromatographia 48:407
22. Verma SP (1991) Lanthan Actin Res 3:237
23. Kawabata K, Kishi Y, Kawaguchi O, Watanabe Y, Inoue Y
(1991) Anal Chem 63:2137
24. Haley BA, Klinkhammer GP (2003) Mar Chem 82:197
25. Tan SH, Horlick G (1986) Appl Spectrosc 40:445
26. Ganjali MR, Norouzi P, Daftari A, Faridbod F, Salavati-Niasari
M (2007) Sens Actuat B 120:673
27. Ganjali MR, Pourjavid MR, Rezapour M, Haghgoo S (2003) Sens
Actuat B 89:21
28. Ganjali MR, Ravanshad J, Hosseini M, Salavati-Niasari M,
Pourjavid MR, Baezzat MR (2004) Electroanalysis 16:1771
29. Ganjali MR, Faridbod F, Norouzi P, Adib M (2006) Sens Actuat
B 120:119
30. Ganjali MR, Tamaddon A, Norouzi P, Adib M (2006) Sens
Actuat B 120:194
31. Ganjali MR, Rasoolipour S, Rezapour M, Norouzi P, Amirnasr
M, Meghdadi S (2006) Sens Actuat B 119:89
32. Zamani HA, Rajabzadeh G, Ganjali MR (2007) Talanta 72:1093
33. Faridbod F, Ganjali MR, Dinarvand R, Norouzi P, Riahi S (2008)
Sensors 8:1645
34. Ganjali MR, Memari Z, Faridbod F, Dinarvand R, Norouzi P
(2008) Electroanalysis 20:2663
35. Faridbod F, Ganjali MR, Larijani B, Norouzi P, Riahi S, Mir-
naghi FS (2007) Sensors 7:3119
36. Kissinger PT, Heineman WR (1984) Laboratory techniques in
electroanalytical chemistry. Marcel Dekker, New York
37. Wightman RM, Wipf DO (1989) In: Bard AJ (ed) Electroana-
lytical chemistry, vol 15. Marcel Dekker, New York
38. Dimitrakopoulos T, Alexander PW, Hibbert DB (1996) Electro-
analysis 8:438
39. Cosofret V, Erdosy M, Johnson TA, Buck RP, Ash RB, Neuman
MR (1995) Anal Chem 67:1647
40. Baranski AS, Norouzi P, Nelsson L (1996) J Proc Electrochem
Soc 96:41
41. Lide DR (1995) CRC handbook of chemistry and physics, 76th
edn. CRC Press, Boca Raton, FL
42. Norouzi P, Ganjali MR, Matloobi P (2005) Electrochem Com-
mun 7:33
43. Norouzi P, Nabi Bidhendi GR, Ganjali MR, Sepehri A, Ghorbani
M (2005) Microchim Acta 152:123
44. Ganjali MR, Norouzi P, Ghorbani M, Sepehri A (2005) Talanta
66:1225
45. Norouzi P, Ganjali MR, Ghorbani M, Sepehri A (2005) Sens
Actuat B 110:239
46. Norouzi P, Ganjali MR, Alizadeh T, Daneshgar P (2006) Elec-
troanalysis 18:947
47. Lipkowski J, Stolberg L (1992) Adsorption of molecules at metal
electrodes. VCH, New York
48. Bockris JOM, Conway BE, Yeager E (1980) Comprehensive
treatise of electrochemistry. Plenum, New York
49. Norouzi P, Ganjali MR, Shirvani-Arani S, Mohammadi A (2007)
J Pharm Sci 96:893
50. Norouzi P, Shirvani-Arani S, Daneshgar P, Ganjali MR (2007)
Biosens Bioelectron 22:1068
51. Norouzi P, Daneshgar P, Ganjali MR, Moosavi-Movahedi AA
(2007) J Brazil Chem Soc 18:231
52. Norouzi P, Ganjali MR, Daneshgar P (2007) Anal Lett 40:547
53. Norouzi P, Ganjali MR, Hajiaghababaei L (2006) Anal Lett
39:1941
54. Norouzi P, Ganjali MR, Labbafi S, Mohammadi A (2007) Anal
Lett 40:747
55. Norouzi P, Ganjali MR, Daneshgar P (2007) J Pharm Toxical
Method 55:289
56. Martell AE, Smith RM (1977) Critical stability constants: other
organic ligands, vol 3. Plenum, New York, p 28
57. Fuping HP, Haddad PR, Jackson PE, Carnevale J (1993) J
Chromatogr 640:187
58. International Conference on Harmonization (ICH) (1996) Topic
Q2 B: validation of analytical procedures—methodology. The
European Agency for the Evaluation of Medicinal Products,
Geneva
59. Cotton S (2006) Lanthanide and actinide chemistry. Wiley,
Chichester
J Appl Electrochem (2010) 40:1593–1603 1603
123
Copyright © 2022 FDOKUMEN