Semantic Reference Model in Medical Time Series
12
J.M. Barreiro et al. (Eds.): ISBMDA 2004, LNCS 3337, pp. 344355, 2004. ' Springer-Verlag Berlin Heidelberg 2004 Semantic Reference Model in Medical Time Series Fernando Alonso, Loc Martnez, CØsar Montes, Aurora PØrez, Agustn Santamara, and Juan Pedro Valente Facultad de InformÆtica. Universidad PolitØcnica de Madrid. Campus de Montegancedo, 28660 Boadilla del Monte. Madrid. Spain {falonso,loic,cmontes,aurora,jpvalente}@fi.upm.es [email protected] Abstract. The analysis of time series databases is very important in the area of medicine. Most of the approaches that address this problem are based on nu- merical algorithms that calculate distances, clusters, index trees, etc. However, a domain-dependent analysis sometimes needs to be conducted to search for the symbolic rather than numerical characteristics of the time series. This paper fo- cuses on our work on the discovery of reference models in time series of isoki- netics data and a technique that transforms the numerical time series into sym- bolic series. We briefly describe the algorithm used to create reference models for population groups and its application in the real world. Then, we describe a method based on extracting semantic information from a numerical series. This symbolic information helps users to efficiently analyze and compare time series in the same or similar way as a domain expert would. Domain: Time series analysis Keywords: Time series characterization, semantic reference model, isokinetics 1 Introduction There are many databases that store temporal information as sequences of data in time, also called temporal sequences. They are to be found in different domains like the stock market, business, medicine, etc. An important domain for the application of data mining (DM) in the medical field is physiotherapy and, more specifically, muscle function assessment based on isokinetics data. Isokinetics data is retrieved by an isokinetics machine (Fig. 1), on which patients perform strength exercises. The machine has the peculiarity of limiting the range of movement and the intensity of effort at constant speed. We decided to focus on knee exercises (extensions and flexions) since most of the data and knowledge gathered by sport physicians is related to this joint. The data takes the form of a strength curve with additional information on the angle of the knee (Fig. 1b). The positive values of the curve represent extensions (knee angle from 90” to 0”) and the negative values represent flexions (knee angle from 0” to 90”). This work is part of the I4 Project (Intelligent Interpretation of Isokinetics Informa- tion) [1], which provides sport physicians with a set of tools to visually analyze pa- tient strength data output by an isokinetics machine. The I4 system cleans and pre- processes the data and provides a set of DM tools for analyzing isokinetics exercises in order to discover new and useful information for monitoring injuries, detecting potential injuries early, discovering fraudulent sickness leaves, etc. However, a lot of expertise in the isokinetics domain is needed to be able to cor- rectly interpret the I4 output. After observing experts at work, we found that they
-
Upload
independent -
Category
Documents
-
view
1 -
download
0
Transcript of Semantic Reference Model in Medical Time Series

J.M. Barreiro et al. (Eds.): ISBMDA 2004, LNCS 3337, pp. 344�355, 2004. © Springer-Verlag Berlin Heidelberg 2004
Semantic Reference Model in Medical Time Series
Fernando Alonso, Loïc Martínez, César Montes, Aurora Pérez, Agustín Santamaría, and Juan Pedro Valente
Facultad de Informática. Universidad Politécnica de Madrid. Campus de Montegancedo, 28660 Boadilla del Monte. Madrid. Spain
{falonso,loic,cmontes,aurora,jpvalente}@fi.upm.es [email protected]
Abstract. The analysis of time series databases is very important in the area of medicine. Most of the approaches that address this problem are based on nu-merical algorithms that calculate distances, clusters, index trees, etc. However, a domain-dependent analysis sometimes needs to be conducted to search for the symbolic rather than numerical characteristics of the time series. This paper fo-cuses on our work on the discovery of reference models in time series of isoki-netics data and a technique that transforms the numerical time series into sym-bolic series. We briefly describe the algorithm used to create reference models for population groups and its application in the real world. Then, we describe a method based on extracting semantic information from a numerical series. This symbolic information helps users to efficiently analyze and compare time series in the same or similar way as a domain expert would.
Domain: Time series analysis Keywords: Time series characterization, semantic reference model, isokinetics
1 Introduction There are many databases that store temporal information as sequences of data in time, also called temporal sequences. They are to be found in different domains like the stock market, business, medicine, etc. An important domain for the application of data mining (DM) in the medical field is physiotherapy and, more specifically, muscle function assessment based on isokinetics data.
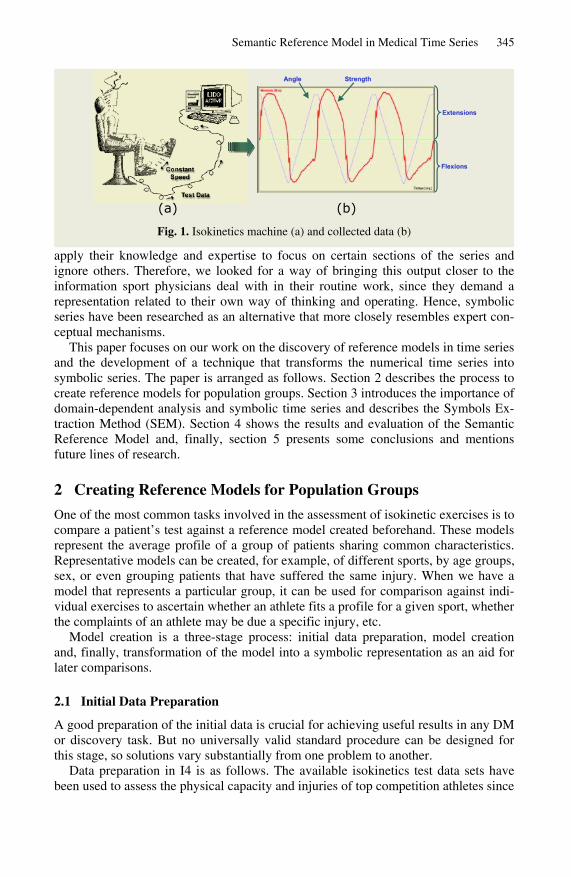
Isokinetics data is retrieved by an isokinetics machine (Fig. 1), on which patients perform strength exercises. The machine has the peculiarity of limiting the range of movement and the intensity of effort at constant speed. We decided to focus on knee exercises (extensions and flexions) since most of the data and knowledge gathered by sport physicians is related to this joint. The data takes the form of a strength curve with additional information on the angle of the knee (Fig. 1b). The positive values of the curve represent extensions (knee angle from 90º to 0º) and the negative values represent flexions (knee angle from 0º to 90º).
This work is part of the I4 Project (Intelligent Interpretation of Isokinetics Informa-tion) [1], which provides sport physicians with a set of tools to visually analyze pa-tient strength data output by an isokinetics machine. The I4 system cleans and pre-processes the data and provides a set of DM tools for analyzing isokinetics exercises in order to discover new and useful information for monitoring injuries, detecting potential injuries early, discovering fraudulent sickness leaves, etc.
However, a lot of expertise in the isokinetics domain is needed to be able to cor-rectly interpret the I4 output. After observing experts at work, we found that they
Semantic Reference Model in Medical Time Series 345
apply their knowledge and expertise to focus on certain sections of the series and ignore others. Therefore, we looked for a way of bringing this output closer to the information sport physicians deal with in their routine work, since they demand a representation related to their own way of thinking and operating. Hence, symbolic series have been researched as an alternative that more closely resembles expert con-ceptual mechanisms.
This paper focuses on our work on the discovery of reference models in time series and the development of a technique that transforms the numerical time series into symbolic series. The paper is arranged as follows. Section 2 describes the process to create reference models for population groups. Section 3 introduces the importance of domain-dependent analysis and symbolic time series and describes the Symbols Ex-traction Method (SEM). Section 4 shows the results and evaluation of the Semantic Reference Model and, finally, section 5 presents some conclusions and mentions future lines of research.
2 Creating Reference Models for Population Groups One of the most common tasks involved in the assessment of isokinetic exercises is to compare a patient�s test against a reference model created beforehand. These models represent the average profile of a group of patients sharing common characteristics. Representative models can be created, for example, of different sports, by age groups, sex, or even grouping patients that have suffered the same injury. When we have a model that represents a particular group, it can be used for comparison against indi-vidual exercises to ascertain whether an athlete fits a profile for a given sport, whether the complaints of an athlete may be due a specific injury, etc.
Model creation is a three-stage process: initial data preparation, model creation and, finally, transformation of the model into a symbolic representation as an aid for later comparisons.
2.1 Initial Data Preparation
A good preparation of the initial data is crucial for achieving useful results in any DM or discovery task. But no universally valid standard procedure can be designed for this stage, so solutions vary substantially from one problem to another.
Data preparation in I4 is as follows. The available isokinetics test data sets have been used to assess the physical capacity and injuries of top competition athletes since
ExtensionsExtensions
FlexionsFlexions
(a) (b)
AngleAngle StrengthStrength
Fig. 1. Isokinetics machine (a) and collected data (b)
346 Fernando Alonso et al.
the early 90s. An extensive collection of tests has been gathered since then, albeit immethodically. Hence, we had a set of heterodox, unclassified data files in different formats, which were, partly, incomplete. However, the quality of the data was unques-tionable: the protocols had been respected in the huge majority of cases, the isokinet-ics system used was of proven quality and the operating personnel had been properly trained.
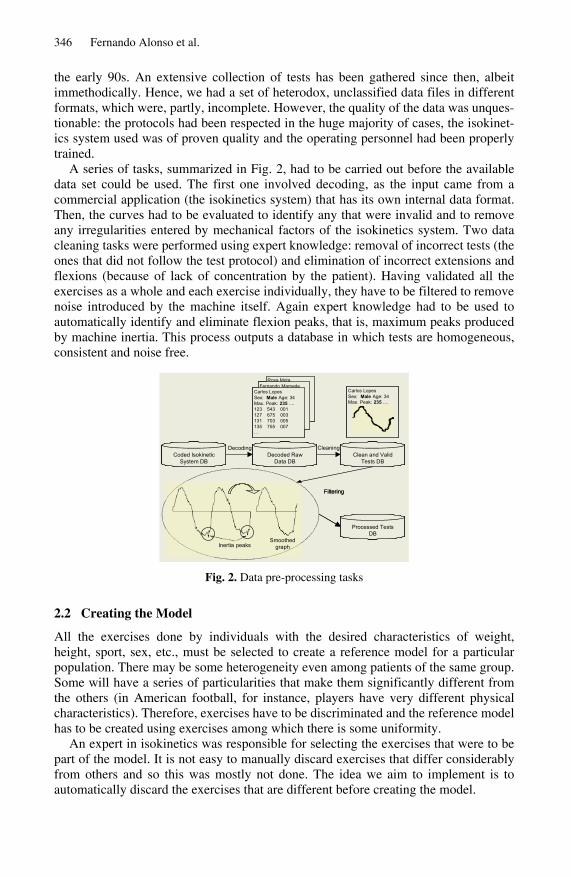
A series of tasks, summarized in Fig. 2, had to be carried out before the available data set could be used. The first one involved decoding, as the input came from a commercial application (the isokinetics system) that has its own internal data format. Then, the curves had to be evaluated to identify any that were invalid and to remove any irregularities entered by mechanical factors of the isokinetics system. Two data cleaning tasks were performed using expert knowledge: removal of incorrect tests (the ones that did not follow the test protocol) and elimination of incorrect extensions and flexions (because of lack of concentration by the patient). Having validated all the exercises as a whole and each exercise individually, they have to be filtered to remove noise introduced by the machine itself. Again expert knowledge had to be used to automatically identify and eliminate flexion peaks, that is, maximum peaks produced by machine inertia. This process outputs a database in which tests are homogeneous, consistent and noise free.
Rosa MotaFernando Mamede
Carlos LopesSex: Male Age: 34Max. Peak: 235 ....
Carlos LopesSex: Male Age: 34Max. Peak: 235 ....123 543 001127 675 003131 703 005135 755 007...
Coded Isokinetic System DB
Decoded RawData DB
Clean and Valid Tests DB
Processed TestsDB
Smoothed graph Inertia peaks
Decoding Cleaning
Filtering
Rosa MotaFernando Mamede
Carlos LopesSex: Male Age: 34Max. Peak: 235 ....
Carlos LopesSex: Male Age: 34Max. Peak: 235 ....123 543 001127 675 003131 703 005135 755 007...
Coded Isokinetic System DB
Coded Isokinetic System DB
Decoded RawData DB
Decoded RawData DB
Clean and Valid Tests DB
Clean and Valid Tests DB
Processed TestsDB
Processed TestsDB
Smoothed graph Inertia peaks
Smoothed graph Inertia peaks
Filtering
Fig. 2. Data pre-processing tasks
2.2 Creating the Model
All the exercises done by individuals with the desired characteristics of weight, height, sport, sex, etc., must be selected to create a reference model for a particular population. There may be some heterogeneity even among patients of the same group. Some will have a series of particularities that make them significantly different from the others (in American football, for instance, players have very different physical characteristics). Therefore, exercises have to be discriminated and the reference model has to be created using exercises among which there is some uniformity.
An expert in isokinetics was responsible for selecting the exercises that were to be part of the model. It is not easy to manually discard exercises that differ considerably from others and so this was mostly not done. The idea we aim to implement is to automatically discard the exercises that are different before creating the model.
Semantic Reference Model in Medical Time Series 347
The problem of comparing exercises can be simplified using the discrete Fourier transform to transfer the exercises from the time domain to the frequency domain. The fact that most of the information is concentrated in the first components of the discrete Fourier transform will be used to discard the remainder and simplify the problem. The advantage of the discrete Fourier transform is that there is an algorithm, known as the fast Fourier transform, that can calculate the required coefficients in a time of the order of O(n log n) when the number of data is a �power of 2�. In our case, we restricted the strength values of the series to 256 values, which is roughly two leg flexions and extensions and, therefore, sufficient to characterize each exer-cise.
The time it takes to make the comparisons is drastically reduced using this tech-nique, a very important factor in this case, since there are a lot of exercises for com-parison in the database and comparison efficiency is important.
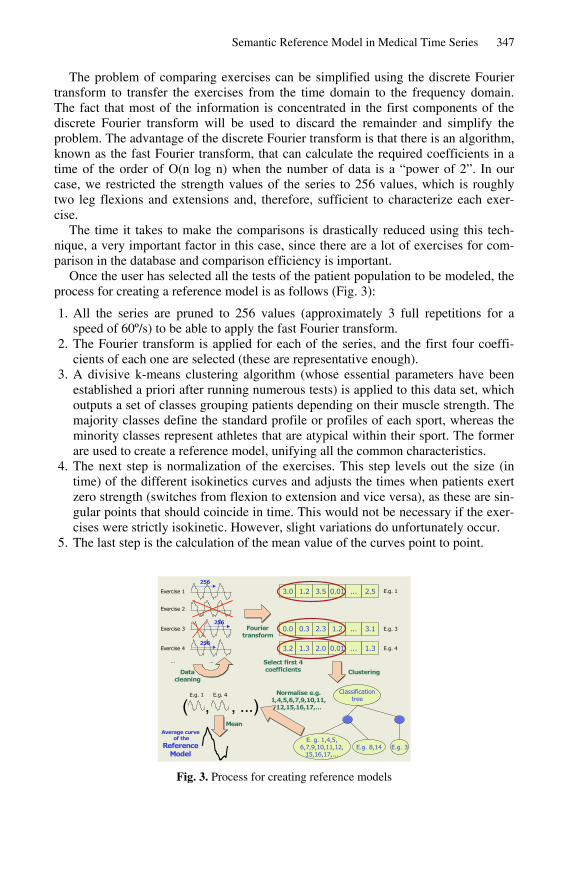
Once the user has selected all the tests of the patient population to be modeled, the process for creating a reference model is as follows (Fig. 3):
1. All the series are pruned to 256 values (approximately 3 full repetitions for a speed of 60º/s) to be able to apply the fast Fourier transform.
2. The Fourier transform is applied for each of the series, and the first four coeffi-cients of each one are selected (these are representative enough).
3. A divisive k-means clustering algorithm (whose essential parameters have been established a priori after running numerous tests) is applied to this data set, which outputs a set of classes grouping patients depending on their muscle strength. The majority classes define the standard profile or profiles of each sport, whereas the minority classes represent athletes that are atypical within their sport. The former are used to create a reference model, unifying all the common characteristics.
4. The next step is normalization of the exercises. This step levels out the size (in time) of the different isokinetics curves and adjusts the times when patients exert zero strength (switches from flexion to extension and vice versa), as these are sin-gular points that should coincide in time. This would not be necessary if the exer-cises were strictly isokinetic. However, slight variations do unfortunately occur.
5. The last step is the calculation of the mean value of the curves point to point.
256
256
256
Exercise 1
Exercise 2
Exercise 3
Exercise 4
� �
Datacleaning
Fouriertransform
3.0 1.2 3.5 0.01 ... 2.5 E.g. 1
0.0 0.3 2.3 1.2 ... 3.1 E.g. 3
3.2 1.3 2.0 0.01 ... 1.3 E.g. 4
Select first 4coefficients Clustering
Classificationtree
E.g. 3E.g. 8,14E. g. 1,4,5,
6,7,9,10,11,12,15,16,17,...
Normalise e.g.1,4,5,6,7,9,10,11,
12,15,16,17,�( , , ...)E.g. 1 E.g. 4
Average curveof the
ReferenceModel
Mean
Fig. 3. Process for creating reference models
348 Fernando Alonso et al.
2.3 Transforming the Model
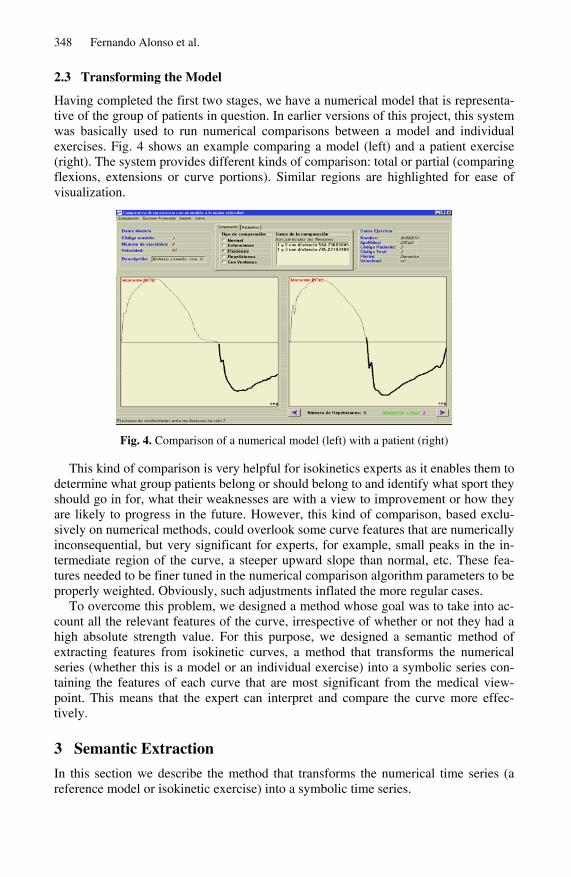
Having completed the first two stages, we have a numerical model that is representa-tive of the group of patients in question. In earlier versions of this project, this system was basically used to run numerical comparisons between a model and individual exercises. Fig. 4 shows an example comparing a model (left) and a patient exercise (right). The system provides different kinds of comparison: total or partial (comparing flexions, extensions or curve portions). Similar regions are highlighted for ease of visualization.
Fig. 4. Comparison of a numerical model (left) with a patient (right)
This kind of comparison is very helpful for isokinetics experts as it enables them to determine what group patients belong or should belong to and identify what sport they should go in for, what their weaknesses are with a view to improvement or how they are likely to progress in the future. However, this kind of comparison, based exclu-sively on numerical methods, could overlook some curve features that are numerically inconsequential, but very significant for experts, for example, small peaks in the in-termediate region of the curve, a steeper upward slope than normal, etc. These fea-tures needed to be finer tuned in the numerical comparison algorithm parameters to be properly weighted. Obviously, such adjustments inflated the more regular cases.
To overcome this problem, we designed a method whose goal was to take into ac-count all the relevant features of the curve, irrespective of whether or not they had a high absolute strength value. For this purpose, we designed a semantic method of extracting features from isokinetic curves, a method that transforms the numerical series (whether this is a model or an individual exercise) into a symbolic series con-taining the features of each curve that are most significant from the medical view-point. This means that the expert can interpret and compare the curve more effec-tively.
3 Semantic Extraction In this section we describe the method that transforms the numerical time series (a reference model or isokinetic exercise) into a symbolic time series.
Semantic Reference Model in Medical Time Series 349
3.1 Time Series Comparison Issues
The problem we face then is to compare time series. There has been a lot of research in this area, introducing concepts like distance (needed to establish whether two series are similar), transformations (designed to convert one time series into another to ease analysis), and patterns (independently meaningful sections of a time series that ex-plain a behavior or characterize a time series). Many papers have been published analyzing which are the best techniques for calculating distances [2,3], what trans-formations have to be used to match series [4] and what techniques should be used to find patterns [5].
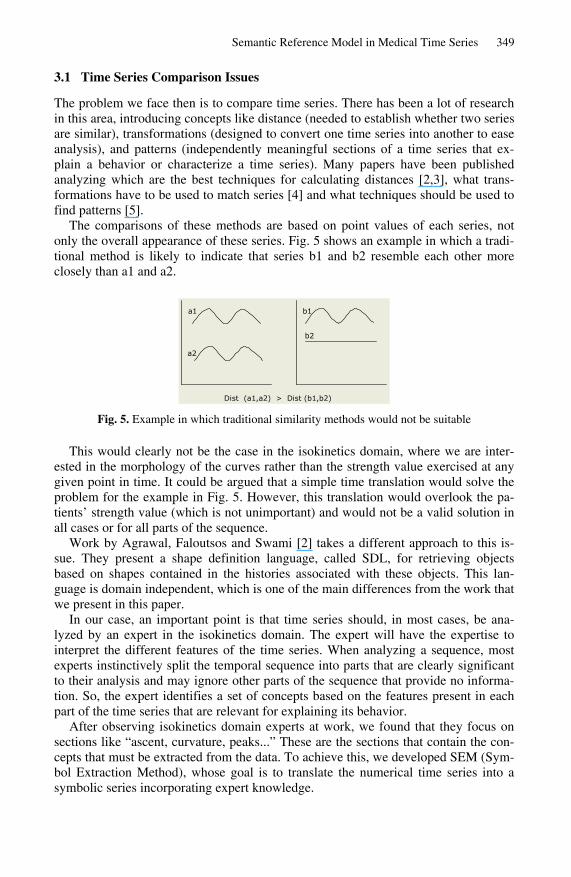
The comparisons of these methods are based on point values of each series, not only the overall appearance of these series. Fig. 5 shows an example in which a tradi-tional method is likely to indicate that series b1 and b2 resemble each other more closely than a1 and a2.
a1
a2
b1
b2
Dist (a1,a2) > Dist (b1,b2)
Fig. 5. Example in which traditional similarity methods would not be suitable
This would clearly not be the case in the isokinetics domain, where we are inter-ested in the morphology of the curves rather than the strength value exercised at any given point in time. It could be argued that a simple time translation would solve the problem for the example in Fig. 5. However, this translation would overlook the pa-tients� strength value (which is not unimportant) and would not be a valid solution in all cases or for all parts of the sequence.
Work by Agrawal, Faloutsos and Swami [2] takes a different approach to this is-sue. They present a shape definition language, called SDL, for retrieving objects based on shapes contained in the histories associated with these objects. This lan-guage is domain independent, which is one of the main differences from the work that we present in this paper.
In our case, an important point is that time series should, in most cases, be ana-lyzed by an expert in the isokinetics domain. The expert will have the expertise to interpret the different features of the time series. When analyzing a sequence, most experts instinctively split the temporal sequence into parts that are clearly significant to their analysis and may ignore other parts of the sequence that provide no informa-tion. So, the expert identifies a set of concepts based on the features present in each part of the time series that are relevant for explaining its behavior.
After observing isokinetics domain experts at work, we found that they focus on sections like �ascent, curvature, peaks...� These are the sections that contain the con-cepts that must be extracted from the data. To achieve this, we developed SEM (Sym-bol Extraction Method), whose goal is to translate the numerical time series into a symbolic series incorporating expert knowledge.
350 Fernando Alonso et al.
3.2 Symbols Extraction Method
We will first describe the Isokinetics Symbols Alphabet (ISA), which includes the symbols used to build the symbolic sequences. Then, we will describe the method used for symbol extraction.
3.2.1 Isokinetics Symbols Alphabet (ISA) It does not make much sense to start to study data depicted in time, if there is no knowledge of the domain that is to be analyzed. Some interviews with the isokinetics expert, who is specialized in analyzing isokinetics temporal sequences of some joints like the knee or the shoulder, had to be planned to elicit expert knowledge as the re-search advanced.
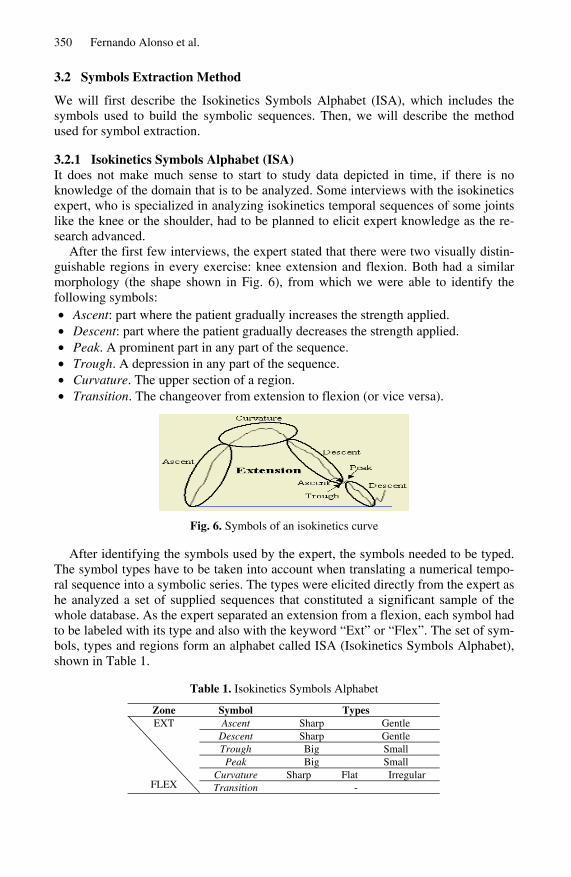
After the first few interviews, the expert stated that there were two visually distin-guishable regions in every exercise: knee extension and flexion. Both had a similar morphology (the shape shown in Fig. 6), from which we were able to identify the following symbols: • Ascent: part where the patient gradually increases the strength applied. • Descent: part where the patient gradually decreases the strength applied. • Peak. A prominent part in any part of the sequence. • Trough. A depression in any part of the sequence. • Curvature. The upper section of a region. • Transition. The changeover from extension to flexion (or vice versa).
Fig. 6. Symbols of an isokinetics curve
After identifying the symbols used by the expert, the symbols needed to be typed. The symbol types have to be taken into account when translating a numerical tempo-ral sequence into a symbolic series. The types were elicited directly from the expert as he analyzed a set of supplied sequences that constituted a significant sample of the whole database. As the expert separated an extension from a flexion, each symbol had to be labeled with its type and also with the keyword �Ext� or �Flex�. The set of sym-bols, types and regions form an alphabet called ISA (Isokinetics Symbols Alphabet), shown in Table 1.
Table 1. Isokinetics Symbols Alphabet
Zone Symbol Types Ascent Sharp Gentle
Descent Sharp Gentle Trough Big Small Peak Big Small
Curvature Sharp Flat Irregular
EXT
FLEX Transition -
Semantic Reference Model in Medical Time Series 351
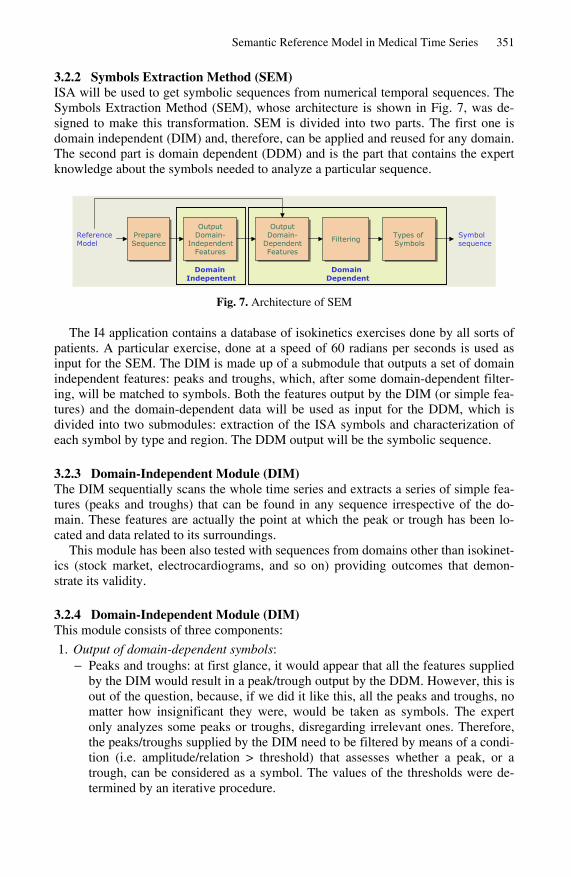
3.2.2 Symbols Extraction Method (SEM) ISA will be used to get symbolic sequences from numerical temporal sequences. The Symbols Extraction Method (SEM), whose architecture is shown in Fig. 7, was de-signed to make this transformation. SEM is divided into two parts. The first one is domain independent (DIM) and, therefore, can be applied and reused for any domain. The second part is domain dependent (DDM) and is the part that contains the expert knowledge about the symbols needed to analyze a particular sequence.
Domain Dependent
Domain Indepentent
ReferenceModel
Prepare SequencePrepare Sequence
OutputDomain-
IndependentFeatures
OutputDomain-
IndependentFeatures
OutputDomain-
DependentFeatures
OutputDomain-
DependentFeatures
FilteringFiltering Types of Symbols
Types of Symbols
Symbol sequence
Fig. 7. Architecture of SEM
The I4 application contains a database of isokinetics exercises done by all sorts of patients. A particular exercise, done at a speed of 60 radians per seconds is used as input for the SEM. The DIM is made up of a submodule that outputs a set of domain independent features: peaks and troughs, which, after some domain-dependent filter-ing, will be matched to symbols. Both the features output by the DIM (or simple fea-tures) and the domain-dependent data will be used as input for the DDM, which is divided into two submodules: extraction of the ISA symbols and characterization of each symbol by type and region. The DDM output will be the symbolic sequence.
3.2.3 Domain-Independent Module (DIM) The DIM sequentially scans the whole time series and extracts a series of simple fea-tures (peaks and troughs) that can be found in any sequence irrespective of the do-main. These features are actually the point at which the peak or trough has been lo-cated and data related to its surroundings.
This module has been also tested with sequences from domains other than isokinet-ics (stock market, electrocardiograms, and so on) providing outcomes that demon-strate its validity.
3.2.4 Domain-Independent Module (DIM) This module consists of three components:
1. Output of domain-dependent symbols: − Peaks and troughs: at first glance, it would appear that all the features supplied
by the DIM would result in a peak/trough output by the DDM. However, this is out of the question, because, if we did it like this, all the peaks and troughs, no matter how insignificant they were, would be taken as symbols. The expert only analyzes some peaks or troughs, disregarding irrelevant ones. Therefore, the peaks/troughs supplied by the DIM need to be filtered by means of a condi-tion (i.e. amplitude/relation > threshold) that assesses whether a peak, or a trough, can be considered as a symbol. The values of the thresholds were de-termined by an iterative procedure.
352 Fernando Alonso et al.
− The ascent and descent symbols were determined similarly to the peaks and troughs extraction. To avoid confusion between ascents/descents and peaks/troughs, ascents or descents must fulfill a condition based on gradient, duration and amplitude (i.e. (gradient >= slope_threshold) and ((duration >= dur_threshold) or (amplitude>= ampl_threshold))).
− Regarding curvatures, the objective was to locate the section of the region where a curvature could be found, irrespective of whether the region was an ex-tension or a flexion. It was estimated that the curvature accounted for around 20% of the upper section of each region.
− The transition symbol indicates the changeover from extension to flexion and vice versa.
2. Filtering. The set of symbols output by the above submodule would be put through a filtering stage (see Fig. 7), which, apart from other filtering processes, checks that no symbols are repeated.
3. Symbol types. The goal of this submodule is to label each symbol with a type. This will provide more precise information about the original temporal sequence. Re-member also that the expert instinctively uses a symbol typology based on his ex-pertise. This classification is done using a set of thresholds that define the symbol type for each case.
4 Results and Evaluation of the Semantic Reference Model
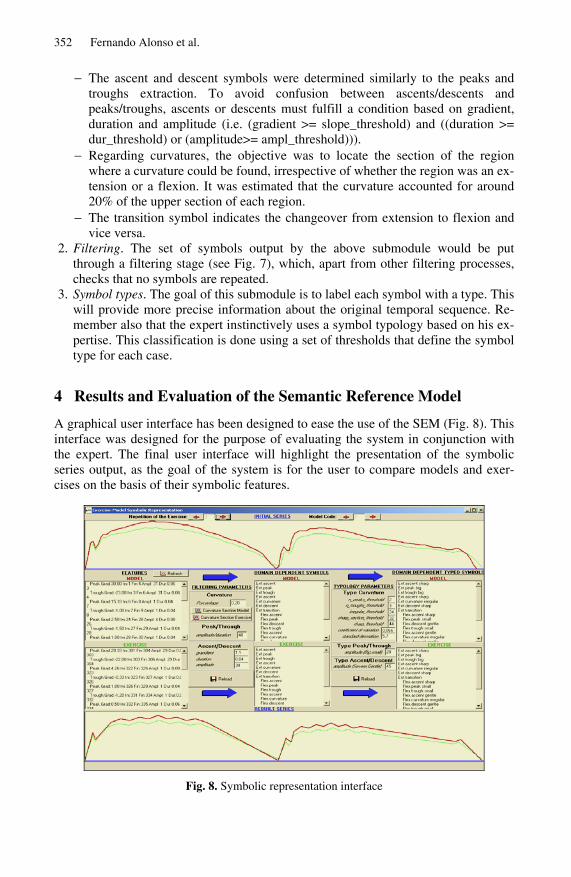
A graphical user interface has been designed to ease the use of the SEM (Fig. 8). This interface was designed for the purpose of evaluating the system in conjunction with the expert. The final user interface will highlight the presentation of the symbolic series output, as the goal of the system is for the user to compare models and exer-cises on the basis of their symbolic features.
Fig. 8. Symbolic representation interface
Semantic Reference Model in Medical Time Series 353
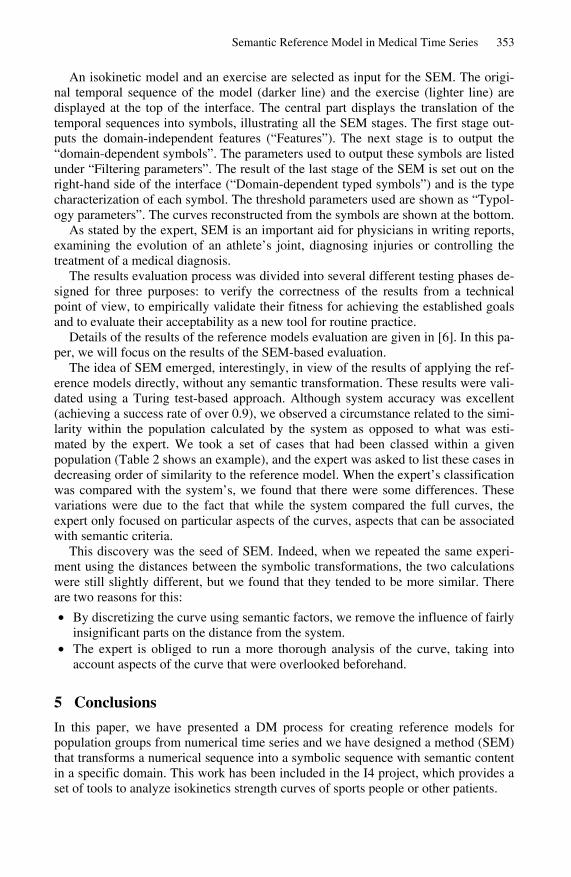
An isokinetic model and an exercise are selected as input for the SEM. The origi-nal temporal sequence of the model (darker line) and the exercise (lighter line) are displayed at the top of the interface. The central part displays the translation of the temporal sequences into symbols, illustrating all the SEM stages. The first stage out-puts the domain-independent features (�Features�). The next stage is to output the �domain-dependent symbols�. The parameters used to output these symbols are listed under �Filtering parameters�. The result of the last stage of the SEM is set out on the right-hand side of the interface (�Domain-dependent typed symbols�) and is the type characterization of each symbol. The threshold parameters used are shown as �Typol-ogy parameters�. The curves reconstructed from the symbols are shown at the bottom.
As stated by the expert, SEM is an important aid for physicians in writing reports, examining the evolution of an athlete�s joint, diagnosing injuries or controlling the treatment of a medical diagnosis.
The results evaluation process was divided into several different testing phases de-signed for three purposes: to verify the correctness of the results from a technical point of view, to empirically validate their fitness for achieving the established goals and to evaluate their acceptability as a new tool for routine practice.
Details of the results of the reference models evaluation are given in [6]. In this pa-per, we will focus on the results of the SEM-based evaluation.
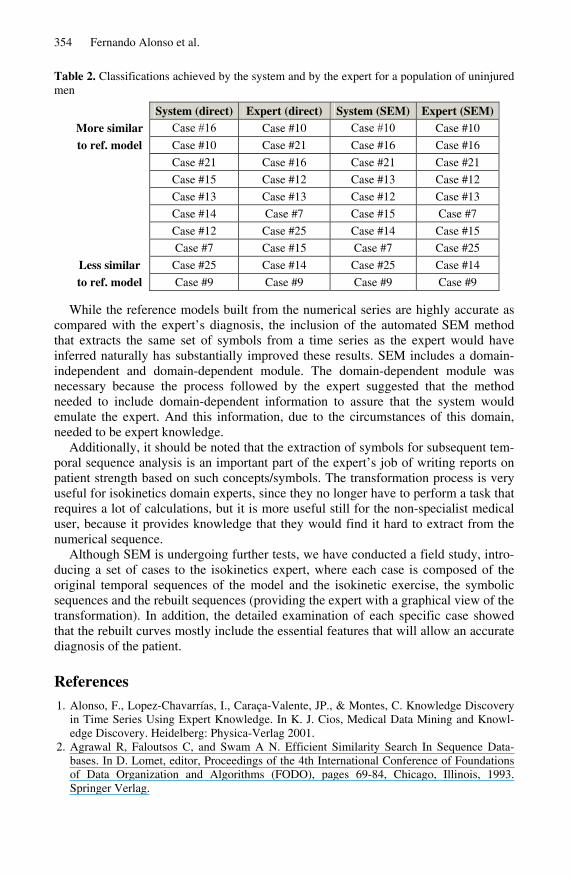
The idea of SEM emerged, interestingly, in view of the results of applying the ref-erence models directly, without any semantic transformation. These results were vali-dated using a Turing test-based approach. Although system accuracy was excellent (achieving a success rate of over 0.9), we observed a circumstance related to the simi-larity within the population calculated by the system as opposed to what was esti-mated by the expert. We took a set of cases that had been classed within a given population (Table 2 shows an example), and the expert was asked to list these cases in decreasing order of similarity to the reference model. When the expert�s classification was compared with the system�s, we found that there were some differences. These variations were due to the fact that while the system compared the full curves, the expert only focused on particular aspects of the curves, aspects that can be associated with semantic criteria.
This discovery was the seed of SEM. Indeed, when we repeated the same experi-ment using the distances between the symbolic transformations, the two calculations were still slightly different, but we found that they tended to be more similar. There are two reasons for this:
• By discretizing the curve using semantic factors, we remove the influence of fairly insignificant parts on the distance from the system.
• The expert is obliged to run a more thorough analysis of the curve, taking into account aspects of the curve that were overlooked beforehand.
5 Conclusions In this paper, we have presented a DM process for creating reference models for population groups from numerical time series and we have designed a method (SEM) that transforms a numerical sequence into a symbolic sequence with semantic content in a specific domain. This work has been included in the I4 project, which provides a set of tools to analyze isokinetics strength curves of sports people or other patients.
354 Fernando Alonso et al.
Table 2. Classifications achieved by the system and by the expert for a population of uninjured men
System (direct) Expert (direct) System (SEM) Expert (SEM) More similar Case #16 Case #10 Case #10 Case #10
to ref. model Case #10 Case #21 Case #16 Case #16
Case #21 Case #16 Case #21 Case #21 Case #15 Case #12 Case #13 Case #12
Case #13 Case #13 Case #12 Case #13 Case #14 Case #7 Case #15 Case #7
Case #12 Case #25 Case #14 Case #15 Case #7 Case #15 Case #7 Case #25
Less similar Case #25 Case #14 Case #25 Case #14
to ref. model Case #9 Case #9 Case #9 Case #9
While the reference models built from the numerical series are highly accurate as compared with the expert�s diagnosis, the inclusion of the automated SEM method that extracts the same set of symbols from a time series as the expert would have inferred naturally has substantially improved these results. SEM includes a domain-independent and domain-dependent module. The domain-dependent module was necessary because the process followed by the expert suggested that the method needed to include domain-dependent information to assure that the system would emulate the expert. And this information, due to the circumstances of this domain, needed to be expert knowledge.
Additionally, it should be noted that the extraction of symbols for subsequent tem-poral sequence analysis is an important part of the expert�s job of writing reports on patient strength based on such concepts/symbols. The transformation process is very useful for isokinetics domain experts, since they no longer have to perform a task that requires a lot of calculations, but it is more useful still for the non-specialist medical user, because it provides knowledge that they would find it hard to extract from the numerical sequence.
Although SEM is undergoing further tests, we have conducted a field study, intro-ducing a set of cases to the isokinetics expert, where each case is composed of the original temporal sequences of the model and the isokinetic exercise, the symbolic sequences and the rebuilt sequences (providing the expert with a graphical view of the transformation). In addition, the detailed examination of each specific case showed that the rebuilt curves mostly include the essential features that will allow an accurate diagnosis of the patient.
References 1. Alonso, F., Lopez-Chavarrías, I., Caraça-Valente, JP., & Montes, C. Knowledge Discovery
in Time Series Using Expert Knowledge. In K. J. Cios, Medical Data Mining and Knowl-edge Discovery. Heidelberg: Physica-Verlag 2001.
2. Agrawal R, Faloutsos C, and Swam A N. Efficient Similarity Search In Sequence Data-bases. In D. Lomet, editor, Proceedings of the 4th International Conference of Foundations of Data Organization and Algorithms (FODO), pages 69-84, Chicago, Illinois, 1993. Springer Verlag.

Semantic Reference Model in Medical Time Series 355
3. Faloutsos C, Ranganathan M, Manolopoulos Y (1994b) Fast subsequence matching in time series databases. In Proceedings of SIGMOD�94, Minneapolis, MN, pp 419-429.
4. Rafei D, Mendelzo A. ·Similarity-Based Queries for Time Series Data. In Proceedings of SIGMOD, Arizona, 1997.
5. Han J, Dong G, Yin Y (1998) Efficient mining of partial periodic patterns in time series da-tabase. In Proceedings of the 4th international conference on knowledge discovery and data mining. AAAI Press, Menlo Park, CA, pp 214-218.
6. Alonso F, Valente J P, Martínez L and Montes C. Discovering Patterns and Reference Mod-els in the Medical Domain of Isokinetics. In: J. M. Zurada, editor, New Generations of Data Mining Applications, IEEE Press/Wiley, 2004 (in press).