
Self-calibrated dynamical optical biochip system using surface plasmon resonance imaging:...
11
Self-calibrated dynamical optical biochip system using surface plasmon resonance imaging: application to genotyping. Jérôme Hottin* a , Julien Moreau a , Jolanda Spadavecchia a , Alain Bellemain a , Laure Lecerf b , Michel Goossens b , Michael Canva a a Laboratoire Charles Fabry de l’Institut d’Optique, Institut d’Optique - Graduate School, Univ Paris- Sud, CNRS, Campus de Polytechnique, RD128, 91127 Palaiseau Cedex, France b Plate-forme de Génomique IFR10, Institut National de la Santé et de la Recherche Médicale (INSERM), Unité 841, Université Paris 12, Faculté de médecine, 94010 Créteil, France * [email protected] ; phone +33 16 453-3419 ; fax +33 16 453-3101 ; www.insitutoptique.fr ABSTRACT The present paper summarizes some of our work in the field of genetic diagnosis using Surface Plasmon Resonance Imaging. The optical setup and its capability are presented, as well as the gold surface functionalization used. Results obtained with oligonucleotides targets, specific to Cystic Fibrosis disease, in high and low concentration are shown. The self-calibration method we have developed to reduce data dispersion in genetic diagnosis applications is described. 1. INSTRUMENTAL METHOD OF ANALYSIS: 1.1 SPR The Surface Plasmon Resonance (SPR) is a physical phenomenon based on the coupling between an incident transverse magnetic optical wave and a surface wave, localized at the interface between a dielectric and a metal. Theoretically predicted by Chen and Chen [1], plasmon waves are collective charge oscillations in the dielectric-metal interface. These surface waves have an exponential decay of the electric field in each media surrounding the interface, with higher energy intensity in the dielectric. The required coupling condition between the photonic waves and the plasmon waves can be easily achieved using a high-index prism [2] in a configuration proposed by Otto [3] and Kretschmann and Reather [4] in 1968. This condition states that, in order to have SPR, a match is needed between the incident wave vector and the surface plasmon wave vector. This can be written as: SPR i i N n = ⋅ ) sin( θ (1) where n i is the refractive index of the adjacent medium, θ i the angle of incidence and where the effective index of refraction of the Plasmon mode at the metal-dielectric interface, noted as N SPR , is defined as: ⎟ ⎟ ⎠ ⎞ ⎜ ⎜ ⎝ ⎛ + ⋅ = d m d m SPR N ε ε ε ε Re (2) where ε m and ε d are respectively the dielectric permittivity of the metal and of the dielectric above the metal surface. This condition cannot be fulfilled for an incident beam in air as the refractive index n i needs to be higher than N SPR . However, by passing first into a glass prism, Eq. 1 can be achieved, leading to the SPR phenomenon. The efficiency of the coupling and therefore the intensity of the reflected beam, is linked to the physical characteristics of the system (metal and dielectric densities, incident beam angle …). The minimum of the reflectivity at the resonance, for Biophotonics: Photonic Solutions for Better Health Care, edited by Jürgen Popp, Wolfgang Drexler, Valery V. Tuchin, Dennis L. Matthews, Proc. of SPIE Vol. 6991, 69910Q, (2008) · 1605-7422/08/$18 · doi: 10.1117/12.781364 Proc. of SPIE Vol. 6991 69910Q-1 2008 SPIE Digital Library -- Subscriber Archive Copy
Transcript of Self-calibrated dynamical optical biochip system using surface plasmon resonance imaging:...

Self-calibrated dynamical optical biochip system using surface plasmon resonance imaging: application to genotyping.
Jérôme Hottin*a, Julien Moreaua, Jolanda Spadavecchiaa, Alain Bellemaina, Laure Lecerfb, Michel Goossensb, Michael Canvaa
aLaboratoire Charles Fabry de l’Institut d’Optique, Institut d’Optique - Graduate School, Univ Paris-Sud, CNRS, Campus de Polytechnique, RD128, 91127 Palaiseau Cedex, France
bPlate-forme de Génomique IFR10, Institut National de la Santé et de la Recherche Médicale (INSERM), Unité 841, Université Paris 12, Faculté de médecine, 94010 Créteil, France
* [email protected]; phone +33 16 453-3419 ; fax +33 16 453-3101 ; www.insitutoptique.fr
ABSTRACT The present paper summarizes some of our work in the field of genetic diagnosis using Surface Plasmon Resonance
Imaging. The optical setup and its capability are presented, as well as the gold surface functionalization used. Results obtained with oligonucleotides targets, specific to Cystic Fibrosis disease, in high and low concentration are shown. The self-calibration method we have developed to reduce data dispersion in genetic diagnosis applications is described.
1. INSTRUMENTAL METHOD OF ANALYSIS:
1.1 SPR The Surface Plasmon Resonance (SPR) is a physical phenomenon based on the coupling between an incident transverse magnetic optical wave and a surface wave, localized at the interface between a dielectric and a metal. Theoretically predicted by Chen and Chen [1], plasmon waves are collective charge oscillations in the dielectric-metal interface. These surface waves have an exponential decay of the electric field in each media surrounding the interface, with higher energy intensity in the dielectric. The required coupling condition between the photonic waves and the plasmon waves can be easily achieved using a high-index prism [2] in a configuration proposed by Otto [3] and Kretschmann and Reather [4] in 1968. This condition states that, in order to have SPR, a match is needed between the incident wave vector and the surface plasmon wave vector. This can be written as:
SPRii Nn =⋅ )sin(θ (1)
where ni is the refractive index of the adjacent medium, θi the angle of incidence and where the effective index of refraction of the Plasmon mode at the metal-dielectric interface, noted as NSPR, is defined as:
⎟⎟⎠
⎞⎜⎜⎝
⎛
+⋅
=dm
dmSPRN
εεεε
Re (2)
where εm and εd are respectively the dielectric permittivity of the metal and of the dielectric above the metal surface. This condition cannot be fulfilled for an incident beam in air as the refractive index ni needs to be higher than NSPR. However, by passing first into a glass prism, Eq. 1 can be achieved, leading to the SPR phenomenon. The efficiency of the coupling and therefore the intensity of the reflected beam, is linked to the physical characteristics of the system (metal and dielectric densities, incident beam angle …). The minimum of the reflectivity at the resonance, for
Biophotonics: Photonic Solutions for Better Health Care, edited byJürgen Popp, Wolfgang Drexler, Valery V. Tuchin, Dennis L. Matthews,
Proc. of SPIE Vol. 6991, 69910Q, (2008) · 1605-7422/08/$18 · doi: 10.1117/12.781364
Proc. of SPIE Vol. 6991 69910Q-12008 SPIE Digital Library -- Subscriber Archive Copy

Diffei ential of reflectix ity curx equantifying the surface absorption
16 18 20 22 24 26 28 30
AngIe (°)
8
-6
-6
-8
a given incident optical wavelength, depends on the thickness of the metal layer [5]. In our system we use a gold metallic layer with a thickness in the order of 50nm which lead to an angular reflectivity minimum of a few percent, for a λ=660 nm incident wavelength. By working at a fixed incident angle, the evolution of the dielectric refractive index can be monitored by measuring at the intensity of the reflected beam. When the dielectric media is a solution containing molecules of biological interest, it is possible to follow the evolution of its index of refraction with the evolution of the reflectivity intensity (∆R/∆n). When these biological molecules interact with the surface, the variation of intensity is proportional to the equivalent thickness of biochemical film formed at the surface of the metallic layer (∆R/∆e). For an incident angle at the optimal SPR sensitivity (Fig 1), a deposition of 2 nm of DNA (n ≈ 1.48 at λ = 660 nm [6]) at the surface induces an increase of 8% of the intensity of the reflected beam (4% / nm at λ = 660 nm).
Fig 1 : Reflectivity of an incident TM polarized optical wave, as a function of its angle of incidence, on a 50 nm gold layer deposit on a high index SF18 prism. The differential of reflectivity is the result of the subtraction between the two curves of reflectivity. The range of optimal sensitivity for SPR instruments is in the quasi-linear part of the initial reflectivity curve. A maximum variation of
reflectivity of 8 % for 2 nm of DNA deposed is measured for the sensitivity optimal angle.
1.2 SPRI To follow changes in the dielectric media at the close vicinity of the metallic layer, a CCD camera is positioned into the reflected beam thus allowing monitoring of the whole surface absorption. With an adequate surface functionalization (described below), different families of probes can be immobilized on the surface in a grid-type spatial organisation and the variations of reflectivity of every spot can be monitored in parallel. Variations are recorded in ‘real time’ (live recording) at the video camera rate. This is a major advantage of such system compare to fluorescent based biochips, allowing dynamic monitoring of hundreds of interactions simultaneously without any prior labelling. This dynamical capability of the system allows the monitoring of the kinetic of the interactions between targets flowing in the cell and immobilized probes rather than waiting for a quasi-equilibrium state. Our optical detection system (Fig. 2) is composed of a high-index prism (SF18, n = 1.72 at 660 nm) which couples the incident beam coming from a LED (λ = 660 nm, FWHM = 20 nm) to the plasmon wave. The metal media used is a 50nm-thick gold layer deposed on a glass coverslip (BK7, n = 1.51 at 660 nm) placed on the prism with an index-matching oil with the same index of the prism. The angle of the incident beam is computer-controlled by a rotating mirror and the biochip is imaged onto a 12-bit CCD camera (1,360x1,024 pixels from Pixelfly) via an afocal two-doublet optical system. This configuration of the system allows a surface imaging of the biochip (Fig. 3) and allows the following of its evolution with a sub-nanometre precision [7-8-9]. An industrial system based on this SRPI principle is commercialized by GenOptics (www.genoptics-spr.com).
Proc. of SPIE Vol. 6991 69910Q-2

Fig 2: Scheme of the experimental SPRI setup. LS light source (λ = 660 nm), Po polarizer, M rotating mirror, Pr SF18
prism, C camera
Fig.3: 18x18 probes array on air on the functionalized surface of the biochip. The solution flows in a metallic cell which is temperature-controlled using a Pelletier device with a 0.1°C stability precision in a 10-to-40°C range. The minimum of this temperature range is defined by the limit of the cooling power of the system and the maximum by the degassing of the solution. The intensity of the reflected beam is normalized within a 0-to-100% range. The maximum (100%) is obtained under TE polarization illumination where only total reflection occurred and no resonance is observed, and the minimum (0%) is obtained by switching off the light source.
2. SURFACE CHEMISTRY The surface functionalization is one of the major steps in the elaboration of an efficient biochip. Its characteristics will define the stability of the chip, the quality of the results and the sensitivity of the system. In this work, a proper functionalization chemistry has been done based on the coupling of biotinylated probes to a streptavidin coated sensor surface which is covalently bound to a dextran layer [10,11] (fig.4).
Pr
M
C
LS (660 nm)
Cell
Gold layer (50 nm)
Target Solution
Po
Proc. of SPIE Vol. 6991 69910Q-3

- — -EpicMorohy&rn
&omocdic acidDelin
bMS
ftflfl7fl)
SIrcptvidin
- -,
Bictinylged- -
probe
Fig. 4 : Gold surface functionalization based on the thiol-gold bound and which final coverage consists in Streptavidin fixed onto a Dextran slide to permit biotinylated DNA to be immobilized on the biochip.
The surface modification sequence that we have developed is based on the concept of molecular self-assembly of sulphur containing molecules on gold surfaces. This spontaneous monolayer formation is mainly driven by the coordination of alkane-thiols or disulphides to gold accompanied with interchain Van der Waals interactions. The hydroxyl group was intentionally introduced as a reactive handle for further modification as well as a means for the creation of a neutral hydrophilic interface. A densely packed monolayer is formed within minutes from dilute ethanol solutions of the alkanethiol resulting in an interface which is completely water wetting [12]. This layer is then reacted with epichlorohydrin which introduces epoxy groups on the surface as electrophilic coupling sites. For an application in bio-interaction analysis, further modification with Dextran was found to be very suitable. Dextran, which is an hydrophilic linear and non charged natural polymer based on 1,6- linked glucose units, was randomly linked to the epoxy groups under basic conditions; this negatively charged hydrogel-covered surface can be used for covalent coupling of various ligands. Further reaction with bromoacetic acid introduces carboxylic groups under basic conditions. Dextran is soluble in water in any proportion and form highly hydrated hydrogels. Owing to the high concentration of hydroxyl groups in the dextran molecule, chemical modification of these polymers is possible without significantly affecting their hydrophilicity. The non covalent interaction of avidin with biotin is characterized by an affinity constant of 1015M-1. This is among the highest formations constants reported in biology, this high affinity ensures that, once formed, the complex is not disturbed by change in pH, the presence of chaotropes or manipulation such as multiple washings when the complex is immobilized. Streptavidin binding to biotin is specific enough to ensure that the binding is directed only to the target of interest. The gold on the quartz was modified with thiol and carboxylated dextran to immobilize streptavidine and then a biotinylated oligonucleotide. Before the immobilization on the probe, the gold surface needs to be cleaned with a boiling solution consisting of H2O2 (33%), NH3 (33%), and milliQ water in a 1:1:5 ratio. The gold substrates are immersed in the solution for 10 min. They are then thoroughly washed with distillated water and used immediately afterwards. The freshly cleaned gold surface, is immersed in an unstirred 1mM ethanolic solution of 11-mercaptoundecanol at room temperature, in the dark, for 48h. The solution of 11-mercaptoundecanol is freshly prepared before use (2mg of the thiol
Proc. of SPIE Vol. 6991 69910Q-4

Specificsequence
DNAmono-strand
Calibrationsequence
Poly-Tspacer
idin
caIsuacefunctionnalisation
in 10ml of ethanol).The gold substrate is then washed with ethanol and milliQ water and sonicated for 10min in ethanol to remove the excess of thiol. The hydroxylic surface is treated with a 600mM solution of epichlorohydrin in a 1:1 mixture of 400mM NaOH and bis-2-methoxyethyl ether(Diglyme) for 4h. After washing with water and ethanol, the gold substrate is immersed for 20h in a basic dextran solution (3g of dextran in 10ml of NaOH 100mM). The surface is further functionalized with a carboxymethyl group using bromoacetic acid (1M solution in 2M NaOH for 16h). All the reactions are performed at room temperature. The god surface is then washed with milliQ water and activated prior to covalent coupling with 200µl of a solution of a NHS(N-Hydroxisuccinimmide) 50mM and EDAC(N-ethyl-N-metilamminopropylcarbodiimide) 200mM in water for 5-8min; after what, the activating solution is replaced by streptavidine 200µg/ml in acetate buffer 10mM, pH 5 for 20min. The residual reacting sites are blocked with 200µl of a solution of ethanolamine hydrochloride (pH 8.6, 1M water solution). After washing with the immobilization buffer, the biothinylated probe is added (200µl of a solution 5µM of the probe in immobilization buffer). The immobilization is allowed to proceed for 20min. At this final stage the gold biochip is ready for cycle of hybridisation. In all experiments, the single stranded probe is regenerated by two consecutive treatments of 30s with 1mM HCl allowing a further use of the sensor. All the experiments are performed at room temperature (22°C).
Fig.5: Schematic composition of the upper part of the functionalized surface. Steptavidin is fixed to the Dextran layer and biotinylated single DNA strand are immobilized with the biotin-avidin interaction onto the surface.
The probes used in the biochip are single short DNA strands. They are divided into three sequences. The first sequence is a 10 T-bases spacer to isolate the rest of the probe from the functionalized surface. The second part is a common 12 bases calibration sequence (5’ GACCGGTATGCG 3’), chosen among zip sequences. The third part of the probe is a 11-15 bases long DNA sequence which targets a specific complementary single DNA strand target. Probes are 5’functionalized with a biotin and strongly linked to the surface with the Avidin-Biotin interaction. Each spot of this matrix is 200µm diameter, made with a plain needle using the SPRi-Arrayer from GenOptics or the QArray from Genetix. The pattern of the spotted matrix is based on a 6x6 elementary matrix divided in 2x2 matrices called ‘Balances’ (Fig.6). Each of these Balance is related to a specific mutation and contains 2 spots with a Wild Type probe sequence (WT) and 2 spots with a Mutated Type probe sequences (MT). The central Balance of the 6x6 elementary matrix is made of 2 spots with a Non-Relevant probes sequence (NR), and 2 spots of Non-Relevant-Non-Calibrated probes sequence (NRNC) with another zip sequence instead of the calibration. This central Balance is used as a negative control during the experiment. This 6x6 elementary matrix is duplicated on the biochip in a 24x24 matrix.
Proc. of SPIE Vol. 6991 69910Q-5

Elementary sub-matrix (6x6)Balance of interest
Balance ofreference
Fig.6 : Example of a simple spotting pattern of a 24x24 matrix. The elementary sub-matrix containing 8 balances of interest and one balance of reference is duplicated for statistical studies. Each number corresponds to a given probe sequence.
3. APPLICATION A promising application for these dynamical biochips is the field of genetic diagnosis. We have chosen Cystic Fibrosis (CF) as a model to demonstrate the advantages of this kind of system. CF is due to mutations in the Cystic Fibrosis Transmembrane conductance Regulator (CFTR) gene and is the most common autosomal recessive disease in the Caucasians population. For each possible mutation, the genetic diagnosis system has to identify three possible genotypes for the patient: Wild Type, Mutated Type or Heterozygote Type (HT). A first step is to validate the accuracy of the diagnosis realised with our system using synthetic probes, oligonucleotides, corresponding to a fragment of the sequence of the CFTR gene. These oligonucleotides are 25 bases single DNA strands, injected in the biochip in high concentration (5µM) or low concentration (0.1µM). The high concentration injection allows to rapidly reach quasi-equilibrium state of every targets-probes interaction and to validate the static discrimination of the system. The low concentration injection allows following the dynamics of each interaction on the biochip and is similar to the case of PCR products injection.
3.1 Global injection cycles The buffer solution of reference for the refractive index is a Phosphate Buffer Saline (PBS) solution at 1X concentration ([Na+] = 0.1379 M, n=1.334 at 660 nm). A measurement cycle (Fig.7) consists in the typical following steps: PBS 1X injection (5 min) PBS 1.25X injection (5 min) PBS 1X injection (5 min) Calibration target injection (15 min) PBS 1X injection (5 min) HCl injection (1 min) PBS 1X injection (5 min) Target of interest injection (15 min) PBS 1X injection (5 min) HCl injection (1 min) PBS 1X injection (for another measurement cycle)
Proc. of SPIE Vol. 6991 69910Q-6

CalibrationBuffer
Target of interest
Time
U U
U6I I
Ref
lect
ivil
n=13
n=1.
3
n=1.
3
0.2
00
8.8
0610. C) • —. C)I C2 12O.4 1 I-) —I ii I III
Fig.7: Variation of the reflectivity for one spot versus time during an entire measurement cycle. Where PBS 1.25X is the same PBS reference buffer but at a 1.25X concentration (n=1.335 at 660 nm). The calibration target is a single DNA strand of 20 bases, 5’ CGCGCGCATACCGGTCAAAA 3’ complementary to the calibration sequence of every probe immobilized on the chip. To regenerate the biochip, a solution of HCl at 11 mM is injected during 1 minute. The level of reflectivity observed after the injection of PBS following this regeneration is the same as before the calibration target injection, showing the regeneration capability of the surface chemistry. Both the step of index and the calibration target injection are included in the self-calibration method used to correct the data dispersion. The final step of the cycle consists in the injection of the target of interest.
3.2 Self-Calibration correction method A major limitation in the accuracy of biochip measurement in general and of genetic diagnosis in particular, is data dispersion. Even with spots containing identical probe sequences, variations of reflectivity resulting from the interaction with a flowing target will differ. This dispersion in the results comes from the non homogeneous surface functionalization and from probe concentration difference between spots. To be able to correct this dispersion, we have developed a Self-Calibration correction method divided into 3 steps. The first one corrects the inhomogeneities of the transduction factor (∆R/∆n). After the first injection of the PBS buffer, the same PBS buffer, but at a higher concentration, is injected. Theoretically, the reflectivity variations should be identical for the whole surface but imperfections in gold and biofilm density and thickness cause dispersion in reflectivity variations. We calculate the mean value of the variation of reflectivity for the whole matrix and this value is used to normalize the response of all the spots (Fig.8).
Fig.8: Variation of the reflectivity of all spots versus time during the step of index. Uncorrected data (left) and corrected data (right) by our self-calibration correction method are shown.
Proc. of SPIE Vol. 6991 69910Q-7
2.5 —
2.0 —
:: dirV ____PBS 1X — Target j I
S 10 20 30 40 50 60
Time (mm)
1.4—
1.2—
1.0—
0.8 —
0.6 —
Non Relevant orobe
PBS1X Target —
0.4-
0.2 -
0 10 20 30 40 50 60Time (mm)
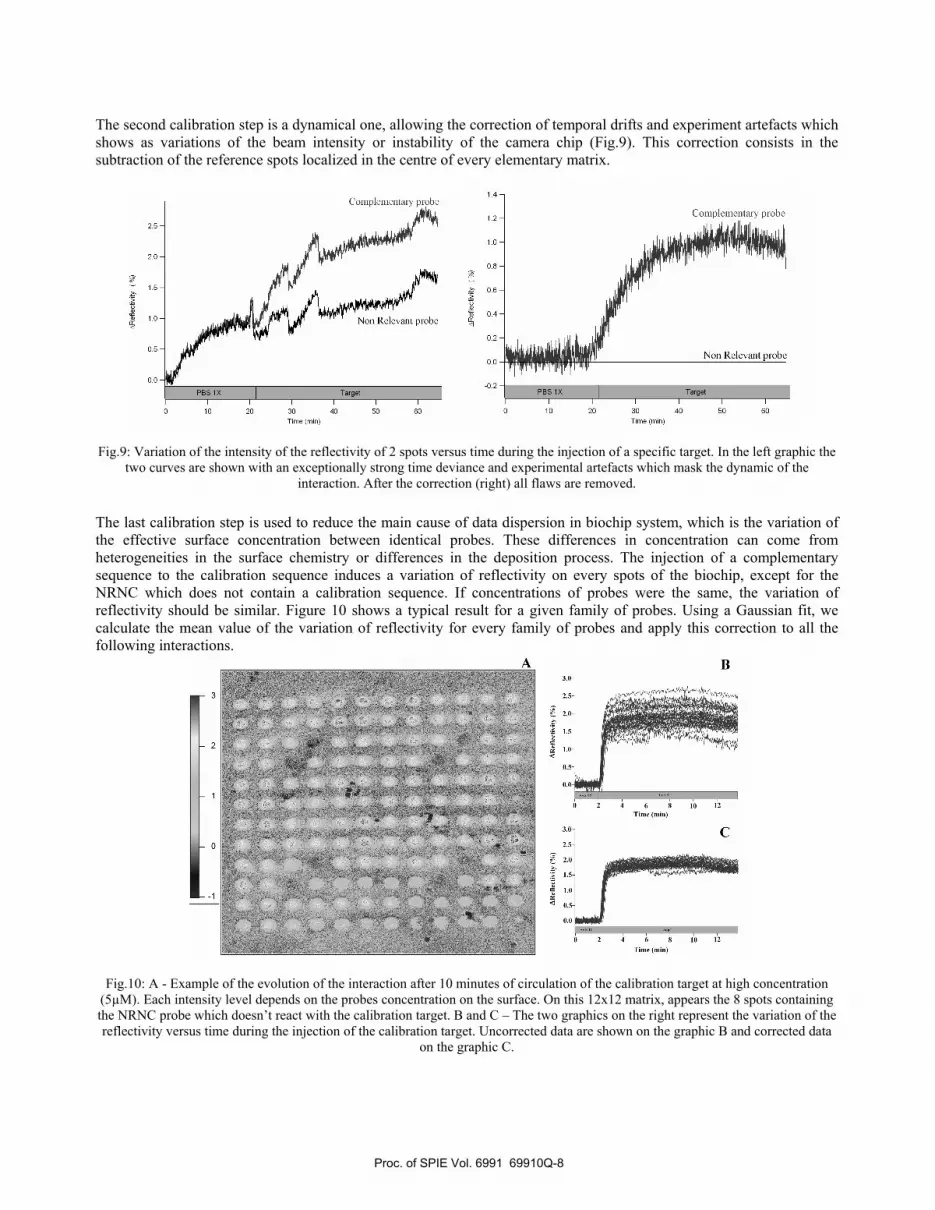
The second calibration step is a dynamical one, allowing the correction of temporal drifts and experiment artefacts which shows as variations of the beam intensity or instability of the camera chip (Fig.9). This correction consists in the subtraction of the reference spots localized in the centre of every elementary matrix.
Fig.9: Variation of the intensity of the reflectivity of 2 spots versus time during the injection of a specific target. In the left graphic the two curves are shown with an exceptionally strong time deviance and experimental artefacts which mask the dynamic of the
interaction. After the correction (right) all flaws are removed. The last calibration step is used to reduce the main cause of data dispersion in biochip system, which is the variation of the effective surface concentration between identical probes. These differences in concentration can come from heterogeneities in the surface chemistry or differences in the deposition process. The injection of a complementary sequence to the calibration sequence induces a variation of reflectivity on every spots of the biochip, except for the NRNC which does not contain a calibration sequence. If concentrations of probes were the same, the variation of reflectivity should be similar. Figure 10 shows a typical result for a given family of probes. Using a Gaussian fit, we calculate the mean value of the variation of reflectivity for every family of probes and apply this correction to all the following interactions.
Fig.10: A - Example of the evolution of the interaction after 10 minutes of circulation of the calibration target at high concentration (5µM). Each intensity level depends on the probes concentration on the surface. On this 12x12 matrix, appears the 8 spots containing the NRNC probe which doesn’t react with the calibration target. B and C – The two graphics on the right represent the variation of the reflectivity versus time during the injection of the calibration target. Uncorrected data are shown on the graphic B and corrected data
on the graphic C.
Proc. of SPIE Vol. 6991 69910Q-8
Wild Type probes1.5—
1.0-
0Mutated Type probes
0 5 10 15 20
Time (mm)
Nor
mal
ized
qua
ntity
of d
oubl
e DN
A st
rand
(0
0 __
—
Ii
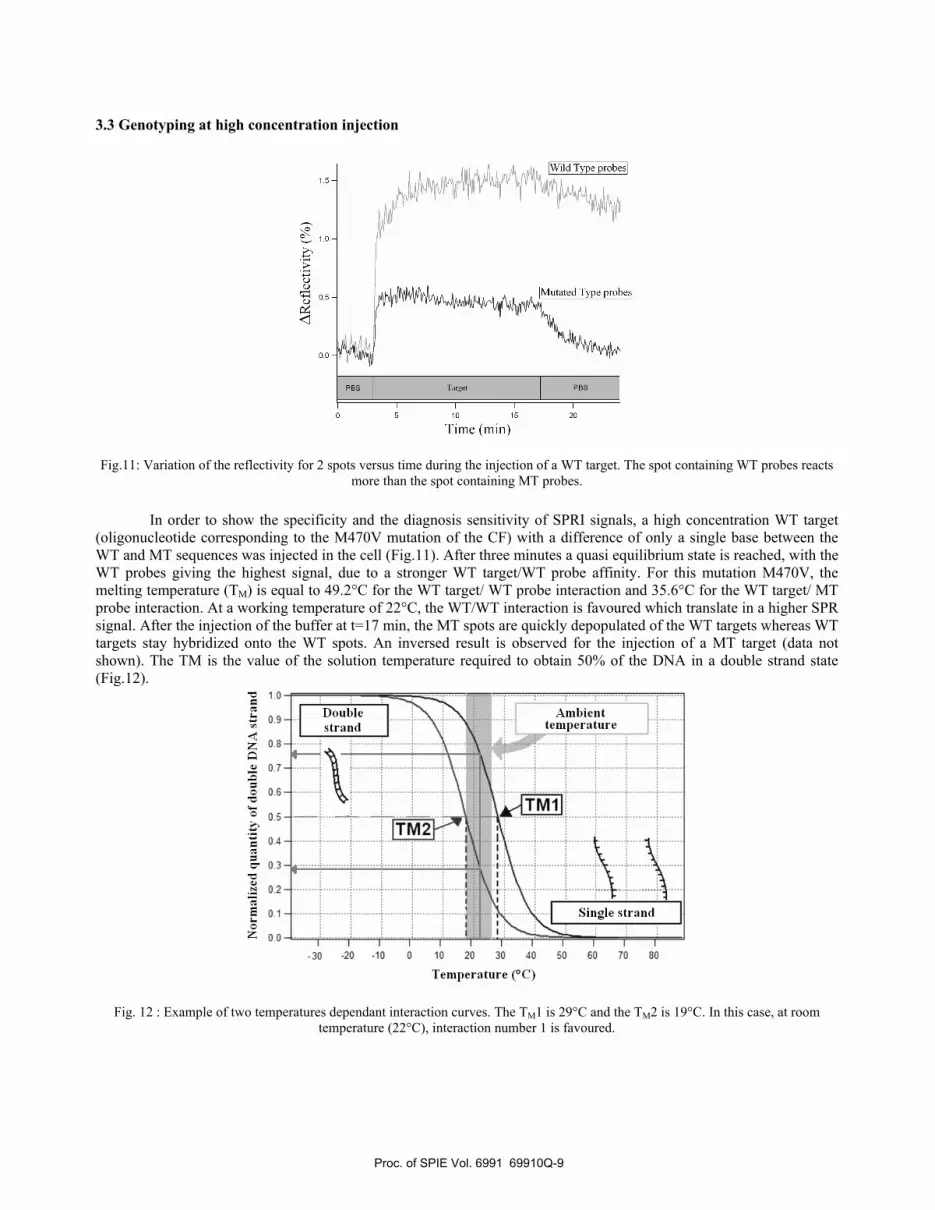
3.3 Genotyping at high concentration injection
Fig.11: Variation of the reflectivity for 2 spots versus time during the injection of a WT target. The spot containing WT probes reacts more than the spot containing MT probes.
In order to show the specificity and the diagnosis sensitivity of SPRI signals, a high concentration WT target (oligonucleotide corresponding to the M470V mutation of the CF) with a difference of only a single base between the WT and MT sequences was injected in the cell (Fig.11). After three minutes a quasi equilibrium state is reached, with the WT probes giving the highest signal, due to a stronger WT target/WT probe affinity. For this mutation M470V, the melting temperature (TM) is equal to 49.2°C for the WT target/ WT probe interaction and 35.6°C for the WT target/ MT probe interaction. At a working temperature of 22°C, the WT/WT interaction is favoured which translate in a higher SPR signal. After the injection of the buffer at t=17 min, the MT spots are quickly depopulated of the WT targets whereas WT targets stay hybridized onto the WT spots. An inversed result is observed for the injection of a MT target (data not shown). The TM is the value of the solution temperature required to obtain 50% of the DNA in a double strand state (Fig.12).
Fig. 12 : Example of two temperatures dependant interaction curves. The TM1 is 29°C and the TM2 is 19°C. In this case, at room temperature (22°C), interaction number 1 is favoured.
Proc. of SPIE Vol. 6991 69910Q-9

0.10—
.—' 0.05—
Heterozygotery Type
A AA
VU
Mutated1Type
0.00
-0.10
0 2.5 5 7.5 10 12.5 15
Time (mm)
3.4 Genotyping at low concentration injection
Fig. 13: Differential of the variation of the reflectivity between WT spots and MT spots of the same balance and during 3 injections. The first (in rose) with the positive slope is the result of a WT injection, the second (in yellow) with the negative slope is the result of
a MT injection and the third (in black) with a quasi null slope is the result of a mix of WT and MT injection. When working with DNA strands amplified by PCR, as in genetic diagnosis applications, concentrations are of the order of 10 ng per ml. With such low concentrations, a quasi equilibrium state between targets flowing into the cell and probes, can only be reached after a very long interaction time, typically 1 hour. However a fast and accurate diagnosis can still be done using SPRI, by looking at the dynamical response of each Balance. To illustrate this, we have injected low concentration (0.1µM) M470V targets. Figure 13 shows three successive responses, of a single Balance, when injecting respectively WT, MT and HT target. The diagnosis is done this time, not by looking at the end point signal, but by subtracting the real time response from the WT probe to the MT one. The slope of the resulting signal enable the identification of the target in less than 10 minutes.
4. CONCLUSION: These dynamical biochip optical system could be a possible answer to the increasing need for cheap and quick molecular identifications and diagnosis systems. The dynamical response of the biochip coupled with regeneration capability of the surface fonctionalization, reduces the time and therefore the cost of the intended test without using any prior labelling. By using the self-calibration method for data correction, we have shown that the SPRI signal induces on the biochip is sensitive enough to detect single nucleotide permutation in DNA DNA interaction.
Proc. of SPIE Vol. 6991 69910Q-10

ACKNOWLEDGMENTS
The authors are thankful to GenOptics (www.genoptics-spr.com) for material and financial aids. Jerome Hottin is currently funded as a PhD. student at the LCFIO by GenOptics Company localized in Orsay, France. The authors acknowledge past and actual PhD students and postdoctorates as Ilaria Mannelli, Pierre Lecaruyer, Aurelien Duval and to Marie-Claude Millot and her colleagues from ICMPE (Institut de Chimie et des Matériaux Paris Est). They also acknowledge INSERM, Centre National de la Recherche Scientifique, Vaincre la mucoviscidose [French association (Defeat CF)] and French Ministere de la recherche for external support through funding of the research program.
REFERENCES
[1] Chen W., Chen J., “Use of surface plasma waves for determination of the thickness and optical constants of thin metallic films”. J Opt Soc Am, 71, 189–191 (1981) [2] Homola J., Koudela I., Yee SS. “Surface plasmon resonance sensors based on diffraction gratings and prism couplers: sensitivity comparison” Sens Actuators B Chem B54, 16–24 (1999) [3] Otto A., “Excitation of nonradiative surface plasma waves in silver by the method of frustrated total reflection”, Z Phys, A 216, 398–410 (1968) [4] Kretschmann E., Raether H. “ Radiative decay of non radiative surface plasmons excited by light” Z Naturforsch T, A 23a, 2135–2136 (1968) [5] Lecaruyer P., Canva M., Rolland J. “Metallic film optimisation in a surface plasmon resonance biosensor by the extended Rouard method” Appl Opt, 46, 2361–2369 (2007) [6] Elhadj S., Singh G., Saraf R.F. “Optical properties of an immobilized DNA monolayer from 255 to 700nm” Langmuir, 20, 5539-5543 (2004) [7] Maillart E. et al. “Versatile analysis of multiple macromolecular interactions by SPR imaging application to p53 and DNAinteractions”, Oncogene, 23, 5543-5550 (2004) [8] Mannelli I. et al. “Surface plasmon resonance imaging (SPRI) system and real-time monitoring of DNA biochip for human genetic mutation diagnosis of DNA amplified samples”, Actuators B Chem, B41, 189-197 (2003) [9] Hottin J. et al. “Plasmonic DNA : Towards genetic diagnosis chips” , Plasmonics, 2, 1557-1955 (2007) [10] Mannelli I. et al., “DNA immobilisation procedures for surface plasmon resonance imaging (SPRI) based microarray systems”, Biosens. Bioelectron. 22 , 803-809 (2007) [11] Lofas S., Johnsson B., “A novel food hydrogel matrix on gold surface plasmon resonance sensors for fast and efficient covalent immobilization of ligands”, J. Chem. Soc., Chem. Commun, 21, 1526–1528 (1990) [12] Bain C.D., Evall J. and Whitesides G. M., J. Am. Chem. SOC. 111,7155 (1989)
Proc. of SPIE Vol. 6991 69910Q-11