Role of dietary fatty acids and acute hyperglycemia in modulating cardiac cell death
Upload
khangminh22Category
view
0download
0
IN DEGREE PROJECT TECHNOLOGY,FIRST CYCLE, 15 CREDITS
, STOCKHOLM SWEDEN 2020
Self-assembly of Fatty Acids of Hair at the water-air interface
MARINE BATISTA
KTH ROYAL INSTITUTE OF TECHNOLOGYSCHOOL OF INDUSTRIAL ENGINEERING AND MANAGEMENT

Abstract
18-methyl eicosanoic acid (18-MEA), which is a branched fatty acid, is found at
the outermost surface of mammalian hair with other straight-chain fatty acids
such as palmitic acid and stearic acid. However, the precise role of 18-MEA is
not yet completely understood. 18-MEA on Cadmium chloride subphase forms
curvature at the water/air interface, leading to the formation of 3D-domains
that can be easily transferred into solid support allowing to create complex and
multi-functional structures. This project investigates if a non-toxic subphase
would also lead to the formation of 3D-domains or if it is an intrinsic property
of Cadmium chloride; and to investigate if the domain properties were tuneable.
A combination of the Langmuir trough and the Atomic Force Microscopy is
used. It is shown that a toxic subphase is not necessary and a more benign
sodium subphase can be used to obtain 3D-domains. It is also shown that
different chains length interact dissimilarly with the branched fatty acid. This
results in the formation of very various structures. It is also shown that the
subphase, the surface pressure of deposition and the composition of the fatty acid
in the monolayer affect the properties of the domain, leading to different size of
domain but also different morphology in the domain. Circular domains, elongated
domains, continuous labyrinthine structures, dendritic centipede-like structures
and no domains are obtained.
Keywords
18-MEA, 18-methyl eicosanoic acid, Langmuir films, Langmuir-Blodgett films,
AFM, Self-assembly, Branched fatty acid, Curvature

Sammanfattning
På den yttersta ytan av däggdjurshår återfinns den grenade fettsyran 18-
methyleikosansyra tillsammans en mindre mängd av de raka fettsyrorna
palmitinsyra och stearinsyra. Den exakta rollen av 18-MEA är dock ännu inte helt
klarlagd. Ett monoskikt av 18-MEA på en subfas innehållande kadmiumklorid
påtvingar en krökning av vatten–luftgränsytan. Det leder till bildandet av 3D-
domäner som lätt kan överföras från vattenytan till fasta ytor vilket möjliggör
att dekorera dessa ytor med komplexa och multifunktionella strukturer. Detta
projekt undersöker om andra, miljövänliga motjoner i subfasen också skulle
leda till bildandet av 3D-domäner eller om det är en inneboende egenskap hos
kadmiumklorid. Det här ger även insikt om hur motjoner kan användas för att
påverka och kontrollera domänbildningen. En kombination av Langmuirtråg och
atomkraftsmikroskopi används för att karakterisera monoskikten. Det visas att
en subfas innehållande kadmium inte är nödvändig och att en mer miljövänlig
natriumsubfas kan användas för att bilda 3D-domäner. Det visas också att
olika kedjors längd interagerar olika med den grenade fettsyran 18-MEA, vilket
resulterar i bildandet av olika strukturer i deponerade monoskikt. Det visas också
att yttrycket vid deponering och sammansättningen av fettsyror i monoskiktet
påverkar egenskaperna hos monoskiktet, vilket leder till varierande storlek och
struktur på de bildade domänerna, där cirkulära och långsträckta domäner,
kontinuerliga labyrintstrukturer och dendritiska tusenfotingsliknande strukturer
observeras.
Nyckelord
18-MEA, 18-methyleikosansyra, Langmuir monoskikt, Langmuir-Blodgett, AFM,
Självassociering, Förgrenad fettsyra, Krökning
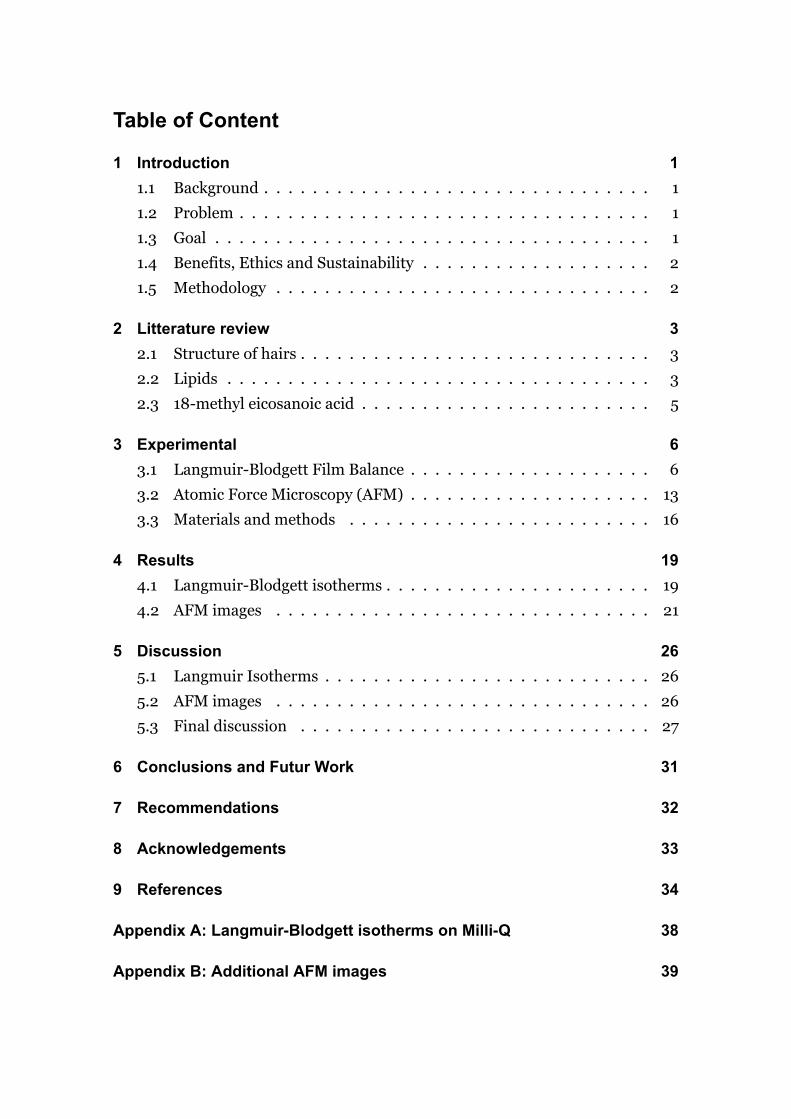
Table of Content
1 Introduction 11.1 Background . . . . . . . . . . . . . . . . . . . . . . . . . . . . . . . . 1
1.2 Problem . . . . . . . . . . . . . . . . . . . . . . . . . . . . . . . . . . 1
1.3 Goal . . . . . . . . . . . . . . . . . . . . . . . . . . . . . . . . . . . . 1
1.4 Benefits, Ethics and Sustainability . . . . . . . . . . . . . . . . . . . 2
1.5 Methodology . . . . . . . . . . . . . . . . . . . . . . . . . . . . . . . 2
2 Litterature review 32.1 Structure of hairs . . . . . . . . . . . . . . . . . . . . . . . . . . . . . 3
2.2 Lipids . . . . . . . . . . . . . . . . . . . . . . . . . . . . . . . . . . . 3
2.3 18-methyl eicosanoic acid . . . . . . . . . . . . . . . . . . . . . . . . 5
3 Experimental 63.1 Langmuir-Blodgett Film Balance . . . . . . . . . . . . . . . . . . . . 6
3.2 Atomic Force Microscopy (AFM) . . . . . . . . . . . . . . . . . . . . 13
3.3 Materials and methods . . . . . . . . . . . . . . . . . . . . . . . . . 16
4 Results 194.1 Langmuir-Blodgett isotherms . . . . . . . . . . . . . . . . . . . . . . 19
4.2 AFM images . . . . . . . . . . . . . . . . . . . . . . . . . . . . . . . 21
5 Discussion 265.1 Langmuir Isotherms . . . . . . . . . . . . . . . . . . . . . . . . . . . 26
5.2 AFM images . . . . . . . . . . . . . . . . . . . . . . . . . . . . . . . 26
5.3 Final discussion . . . . . . . . . . . . . . . . . . . . . . . . . . . . . 27
6 Conclusions and Futur Work 31
7 Recommendations 32
8 Acknowledgements 33
9 References 34
Appendix A: Langmuir-Blodgett isotherms on Milli-Q 38
Appendix B: Additional AFM images 39

1 Introduction
1.1 Background
Fatty acids are covalently bonded to the outermost surface of mammalian air
among which is found a branched fatty acid, i.e. 18-methyl eicosanoic acid (18-
MEA) comprising around 40% of the total fatty acid [1]. As high energy is required
for the synthesis of 18-MEA, it is expected to have a specific role in the biological
system. Recent studies have shown a formation of domains of 19-MEA, 18-
MEA and mixtures with the straight-chain eicosanoic acid (EA), at the water/air
interface. The presence of the branch in 18-MEA interferes with the packing of
the molecules and leads to the formation of curvature of the monolayer. A self-
assembled structure is created, forming 3D domains [2, 3].
1.2 Problem
The different experiments of the previous studies were performed
on Cadmium(II) chloride because the interaction of Cadmium chloride with the
fatty acids results in favourable properties such as stability and better order of the
monolayer, or an easier transfer of the film into a solid substrate [4]. However,
the use of cadmium chloride requires careful consideration due to its hazardous
nature.
1.3 Goal
The goals of this project are the following. First, to search if similar 3D
domains, i.e. self-assembly curvature, can be obtained using a more harmless and
friendly Na+ subphase. Second, to investigate different parameters, i.e. different
deposition pressure and different mixture of 18-MEA and shorter chain fatty acid,
in order to understand how it affects the properties of the domains (forms, size of
the domains, etc.).
1

1.4 Benefits, Ethics and Sustainability
Finding a way to produce tuneable structured domains using simple fatty acids
would lead to possible application of friendly and cheap surface texturing.
Surface texturing can be made using various methods such as laser surface
texturing, ion beam etching/milling, lithography, hot embossing, micro-milling,
electrochemical machining, and mechanical texturing [5]. Surface texturing by
solution deposition is used for example to coat photovoltaic to get omnidirectional
antireflection [6].
1.5 Methodology
Atomic Force Microscope (AFM) [7] and Langmuir-Blodgett Film [8] will be used
in this project.
LB Films will allow looking at some properties of the monolayers and will be used
to depose monolayers onto a solid substrate for further imaging of the surface
using AFM.
2

2 Litterature review
This section introduces the context and some background for the project. It
presents the structure of hair as well as the definition of lipids and fatty acids.
The structure of the most common fatty acids that are found on hair is described
and finally some possible application for branched fatty acids is presented.
2.1 Structure of hairs
Hair has several roles in the biological system. It helps to keep head warm and to
cushion skull in case of a shock. Eyelash protects eyes from light and dust, and
eyebrows prevent liquids such as sweat or rain and matter from coming into the
eyes. Hairs are also a sensory receptor and are used in human communication for
the expression.
Mammalian hairs are composed of three distinct parts that can be seen in Figure
2.1. The Medulla is the innermost layer of the hair. The Cuticle is an outside
protective layer at the surface of the hair. And the Cortex is the thickest component
located between the cuticle and the medulla.
The Cell Membrane Complex (CMC), rich in proteins and lipids, binds all the cells
together. It is present at the interface of the three previous parts [9]. The hair
lipids of the CMC are estimated to play a role in the water holding property, the
cell cohesion and the chemical diffusion barrier [10].
Figure 2.1: Structure of human hair
2.2 Lipids
Lipids are molecules that are soluble in organic solvents such as chloroform,
and not soluble in aqueous solution, i.e. in polar solvents such as water. They
3

are hydrophobic or amphiphile. An amphiphile molecule is composed of a
hydrophobic tail (that is not water-soluble) and a hydrophilic head (that is water-
soluble). This particularity explains why lipids spontaneously form aggregates
(i.e. micelles and liposomes) in a solution. Due to these particularities, lipids
have very important roles in the biological system. They provide the structure cell
membrane, allow storage energy and are signalling molecules.
Lipids can be divided into eight groups among which are fatty acids. Fatty
acids are generally composed of a straight-chain with Carbon-Carbon bonds and
Hydrogen atoms along the chain and a Carboxylic group (-COOH) at the head.
Fatty acids can be saturated or unsaturated. Saturated fatty acids are composed of
only single Carbon-Carbon bonds whereas unsaturated have at least one multiple
bonds in the chain (double or triple bond). Some fatty acids can be branched or
have a ring [11].
The uppermost layer of the cuticle in hair, called the epicuticle, contains various
fatty acid. For human hair, the lipids composition has been found to be 41%
18-MEA, 18% palmitic acid (HA), 7% stearic acid (OA), 4% oleic acid and the
remaining uncharacterised [1]. The composition varies within a hair to another
and between the characterisation techniques. But this gives a good approximation
of the hair lipid’s composition. It should be emphasised that 18-MEA represents
the majority of the composition. Figure 2.2 shows a graph of the composition of
the hair lipids, for a better overview of the total hair’s composition.
Figure 2.2: Composition of the hair lipids
This study will only focus on 18-MEA, OA and HA since there represent most of the
hair lipid’s composition (66%). These molecules are illustrated in Figure 2.3. 18-
MEA is a 10 carbon length chain with a methyl branch at the 18th carbon. HA and
4

OA are both straight chains with respectively 16 and 18 carbon in the chain.
Figure 2.3: Molecular structure of 18-MEA, OA and HA
2.3 18-methyl eicosanoic acid
18-methyl eicosanoic acid (18-MEA) is a fatty acid present in the uppermost layer,
called epiticule, at the surface of the hair. This fatty acid is expected to have a
specific role because of its high and unusual amount present at the surface of
the hair, as well as the high required energy for the synthesis of this branched-
chain fatty acid in comparison to straight-chain fatty acid such as palmitic acid
(Hexadecanoic acid (HA)) or Stearic acid (Octadecanoic acid (OA)) [9].
Studies have shown that 18-MEA is covalently bonded to the epicuticle via a
thioester linkage. The branched methyl is expected to have influence the packing
of the monolayer. However, the precise role of this lipid still needs to be
determined. Some possibilities have been considered. The branched-chain could
inhibit the formation of bilayer. It could also increase the hydrophobicity at the
surface and make the hydrophobic layer more resistant to biological degradation
(shampoo, UV, mechanical wear…) [12].
Branched Chain Fatty Acids (BCFA) are known to have important applications
in other fields. For example, they are present in the gastrointestinal of healthy
newborn and reduce the risk of necrotizing enterocolitis which is a disease of the
intestine of premature that can lead to death [13]. BCFA can improve biofuel
properties, such as lowering the freezing point and increasing the fluidity without
affecting the oxidation stability. These properties are also desirable in lipid-
containing liquids such as detergents, cosmetics, lubricants and pharmaceutical
applications [14].
5

3 Experimental
This section is an introduction about the experimental methods that were used,
i.e. AFM and Langmuir-Blodgett Films. This presents also the materials and
devices.
3.1 Langmuir-Blodgett Film Balance
3.1.1 Important notions
Surface tension
Molecules in a fluid feel attractive and repulsive forces in all directions due to
the surrounding molecules. However, attractive forces are predominant due to
the shorter range of the repulsive forces. The interaction between neighbours
molecule (called intermolecular forces) results in a decrease of the potential
energy and therefore to the stability of the system. Molecules in bulk attract
their neighbours. There is a zero-net force inside the liquid because there are
neighbours on all sides. Molecules at the surface have, however, less neighbouring
molecules leading to fewer intermolecular forces, and consequently to higher
potential energy when compared to a molecule in the bulk fluid. A molecule at
the surface is in an unfavourable energy state and a net force towards the bulk is
exerted.
As every system drifts to a state of minimum potential energy when possible,
liquids try to minimise their surfaces. This explains the formation of droplets
of rain because any other shapes than spherical would lead to an increase in the
surface area and thus give higher potential energy which is unfavourable for the
system.
This resistance against the extension of a surface shows that surfaces have a
surface tension. The surface tension, γ, can be defined in two different ways. First,
as the applied normal force per unit of length.
γ =∂F
∂L[N.m−1] (1)
And second, as the work required to create new surface area per unit of area:
6

γ =∂W
∂A[J.m−2] (2)
Let us remark that N.m−1 = J.m−2 in international system of units [15, 16].
Wilhelmy plate method
Many different methods can be used to measure surface tension. The most
commons are the Du Noüy method, the Wilhelmy plate method, the capillary rise
method and the pendant drop method. Those methods can be seen in Figure 3.1.
The Du Noüy method consists in submerging a platinum ring, the force required
to pull the ring through the surface is of the basis for measuring the surface
tension. Instead of a ring, a plate can be used (Wilhelmy method). The capillary
rise method estimates the surface tension by measuring the capillarity rise, h,
according to the following equation:
γ =r.hρ.g
2(3)
where r is the capillarity radius, ρ the density of the liquid and g the gravitation
constant. The contact angle of the liquid toward the capillarity surface must be
zero so that this equation is valid.
The shape of the drop is a measure for the surface tension. Elongated drops
are formed from liquids with a low surface tension whereas spherical drops are
formed from liquids with a high surface tension [16].
Figure 3.1: Method for surface tension measurement [16]
7

Surfactants
Surface active agents, abbreviated with surfactants, tend to absorb at surfaces
or interfaces, i.e. between two immiscible phases. There exist five different
interfaces (solid-vapour, solid-liquid, solid-solid, liquid-vapour and liquid-
liquid). When a surfactant absorbs at an interface, it lowers the free energy at
the boundary, i.e. the interfacial tension is reduced. In a water-air interface, this
corresponds to the surface tension. The more surfactants are absorbed the more
the surface tension is reduced.
The tendency of surfactants to accumulate at interfaces is due to their structure.
Surfactants are amphiphilic. They consist of two parts, a lyophilic part which is
soluble in a specific fluid and a lyophobic part that is insoluble in this fluid. When
considering water, one says respectively hydrophilic and hydrophobic parts. The
hydrophilic part is often referred to as the head group and hydrophobic part as
the tail. This can be seen in Figure 3.2 [17].
Figure 3.2: A typical surfactant molecule
Insoluble monolayer
Soluble monolayers have molecules that are in exchange equilibrium with other
excess molecules present in a bulk reservoir (the solution). Insoluble monolayers
are layer where the molecules remain at the surface when the monolayer is
compressed or expanded. Insoluble monolayers have a surface tension dependant
on the area, the pressure depends on the volume. Insoluble monolayer can be
described by the following 2D Van der Waals equation, showing that the surface
pressure, Π in [N.m−1], is dependent on the area:
(Π+
a
A2
)(A− b) = kT (4)
where A is the area, and a and b are constants.
8

The surface pressure is defined as the difference between the surface tension of
pure water γ0 and that of the subphase with the monolayer γ, Π = γ0 − γ [18].
With the help of a volatile and water-insoluble solvent, amphiphilic substances
can be spread on a water surface and form an insoluble monolayer at the water/air
interface. These monolayers are called Langmuir films. Due to the amphiphilic
nature, the surfactants will orient their head group so that it is immersed in the
water, and the hydrocarbon chain (the tail) will point toward the air. This is
illustrated in Figure 3.3 [19].
Figure 3.3: Insoluble monolayer on the water/air interface [20]
3.1.2 Langmuir Film Balance
Langmuir Film Balance is constituted of a hydrophobic trough, called bath, and
hydrophilic movable barriers to prevent leakage of the subphase. Amphiphile
molecules are spread at the surface of the subphase using a hydrophobic and
volatile solvent (usually chloroform or hexane). When the solvent evaporates an
insoluble monolayer is left at the surface. This monolayer is called Langmuir Film.
The bath is usually placed in a big room on shock absorbers to minimise
vibrations and to have more constant atmosphere parameters (relative humidity,
temperature, etc). The most common subphase used in Langmuir Film Balance is
water. The pH and ionic content can be adjusted to the need of the experiments.
The amphiphiles molecules need to have a high purity so that no contaminant
incorporate in the monolayer.
Langmuir Film Balance is a good method to prepare thin films as it enables
to have precise control of the thickness of the monolayer and a possibility
to vary the layer composition in multilayer. However, the spatial structures
during phase transition remain unknown by measuring the surface pressure.
Further measurement such as Atomic Force Microscopy, grazing incidence
9

scattering, ellipsometry, spectroscopy or neutron reflectometry can be performed
as complementary analyses of monolayers [3].
Surface Pressure Against Mean Molecular Area Isotherms
One of the most important indicators of monolayer properties is given by
measuring the surface pressure in mN.m−1 as a function of the area per molecule
in Å2 (the surface available for each molecule). This is called surface pressure
vs. area per molecule isotherm or just isotherm. The measurement is done
at constant temperature and usually, it is recorded by compressing the film
(reducing the area) at a constant rate while measuring the surface pressure. Those
isotherms give a lot of information such as the stability of the monolayer, the
reorientation of the molecules in the two-dimensional system, phase transition
and conformational transformation [21].
A typical isotherm is shown in Figure 3.4.
Figure 3.4: Phase transition in an LB isotherm [22]
In the gas state, the area per molecule is very large and no interaction is
present between the molecules. As the area is reduced by moving the barriers,
the molecules come closer, intermolecular interactions increase and the surface
10

pressure increases. A phase transition can be observed. This is a transition
from the gas to the liquid state (also called liquid-expanded, LE, state). Further
compression of the monolayer leads to a transition from the LE phase to a liquid-
condensed phase, LC (also called the tilted phase) and then a solid phase (also
called the untilted phase). There can be a plateau indicating the transition. In
both phases (tilted and untilted phase), the monolayer has a good ordering and
the chains are parallel to each other. The difference is that in the tilted phase,
the chain orientation is tilted in comparison with the water surface whereas in
the untilted phase the chains are perpendicular to the water surface. The tilted
monolayer can be more easily compressed than the untilted monolayer because a
reduction of the area can be achieved by decreasing the tilt angle. If the barriers
are further compressed, a collapse occurs [23, 24].
Increasing the pH of the water subphase leads to the dissociation of the head
group of the monolayer, and thus the tilted to untilted phase transition pressure
decreases. For most of the ions in the subphase (except Mg and Ba ions),
the collapse pressure increases with increasing the pH. The collapse behaviour
changes from a constant area collapse to a constant pressure collapse when the
head group dissociation is nearly complete. In a constant area collapse, the
collapse occurs at a constant area and a sudden drop in the pressure is observed.
This happens because the molecules form multilayers faster than the barrier are
moving, resulting in a sudden drop of pressure. This sudden drop of pressure is
reduced as the dissociation of the head group increases. With a high dissociation,
the formation of multilayers is slowed resulting in a smaller decrease in surface
pressure [25].
Deposition
Monolayers can be transferred from the water/air interface into a solid substrate
using deposition. The more common method is vertical deposition.
In the vertical deposition, a substrate is moved through the monolayer.
The monolayer can be transferred during emersion (retraction) or immersion
(dipping). When the substrate surface is hydrophilic, the monolayer is usually
transferred during retraction because the hydrophilic head groups will interact
11

with the hydrophilic surface. Similarly, if the substrate is hydrophobic, the
monolayer is usually transferred during dipping because the hydrophobic chains
will interact with the hydrophobic surface [23]. This is illustrated in Figure 3.5.
Different types of deposition can be performed and are illustrated in Figure 3.6.
Figure 3.5: Langmuir-Blodgett deposition [26]
Figure 3.6: X, Y, Z-type of Langmuir-Blodgett deposition [27]
These types of deposition are the X-type, Y-type and Z-type deposition. The
most common deposition occurring is the Y-type, where alternative dipping
and retraction is performed, the layer orientates in head-to-head and tail-to-tail
12

interactions. In deposition X and Z type, there are head-to-tail or tail-to-head
interactions. In the X-type deposition, the films are made by repeating dipping
on a hydrophobic substrate. The Z-type deposition is performed by repeating a
retraction on a hydrophilic substrate [28].
Applications of Langmuir-Blodgett films
Langmuir-Blodgett (LB) films can be used in many applications such as in
nonlinear optics, in piezoelectric devices, in biosensors or resist applications.
Piezoelectric devices can measure small changes in mass. They have
importance in detecting infrared radiation. Piezoelectric materials need to
have a noncentrosymmetric structure (a structure that has a unique polar
axis). LB film and self-assembled films provide a simple method to produces
noncentrosymmetric structures in ultrathin films. Piezoelectric devices have also
a promising application in biological sensors.
The continuous miniaturisation of electronic circuits makes submicron resolution
lithography an important element in computer. Conventional coating materials
have a large density and variations in the thickness, whereas LB films provide a
high control in the thickness and can be excellent resist material.
More information about possible applications of Langmuir-Blodgett Films can be
read in ”An Introduction to Ultrathin Organic Films: From Langmuir-Blodgett to
Self-Assembly” by Abraham Ulman [23].
3.2 Atomic Force Microscopy (AFM)
Atomic Force Microscopy (AFM) enables very high-resolution imaging of surfaces
to observe their topography. Morphology, size, surface roughness and texture can
be characterised via AFM.
AFM was first described in 1986 and available on the market a few years later. This
has revolutionised studies of surfaces at a nanometre scale. However, Scanning
Tunnelling Microscopy (STM), is only capable of imaging conductive sample in
vacuum. On the other hand, AFM can image surfaces at high resolution in both
13

air and liquids, which correspond more to reality because some surfaces are meant
to stay under liquids.
3.2.1 Principle of AFM
In AFM, the sample lies on a movable piezoelectric scanner. Piezoelectric
materials can be polarized when mechanical stress is applied or can be deformed
(dimensional change) when an electric field is applied. Thus, the scanner position
is controlled by adjusting the applied voltage. A flexible cantilever on which a
sharp tip is attached, passes through the surface and directly interacts with it.
Attractive and repulsive (Van der Waals) interactions between the surface exist.
Depending on the surface, the cantilever will be deflected. A beam of laser light is
pointing toward the uppermost side of the cantilever and reflected into a position-
sensitive photodetector. The monitoring of deflection of the cantilever allows
getting imaging of the surface. AFM structure can be seen in Figure 3.7.
Figure 3.7: Structure of an Atomic Force Microscopy [29]
Different mode can be used to image the surface: the contact mode, the tapping
mode and the non-contact mode.
In the contact mode, the sample remains in constant contact with the surface.
14

Repulsion forces occur due to the overlapping of electron orbital of atoms surface.
The operation is simple but the movement induces lateral and frictional forces
between the sample and the tip. This can reduce the resolution. Moreover,
the high force exerted on the sample can deform it which will lead to an
underestimation of the height. Usually, this mode is used for imaging hard flat
surfaces.
In the tapping mode, the cantilever oscillates. There is an intermittence
between contact and non-contact. The cantilever oscillates close to its resonance
frequency. The oscillation amplitude will change as it meets different topography.
The mode is a difficult process, extraction of quantitative information is
complicated as it depends on many parameters, e.g. the adhesion, scan speed,
load force, topography and the material.
In the non-contact mode, the cantilever also oscillates but at a smaller amplitude.
Long range attractive interactions are present (Van der Waals and electrostatic
forces). This mode exerts the less force on the sample and can be used for fragile
samples. However, due to the low amplitude of oscillation and the low exerted
forces, the tip is unable to detach easily when water or droplet is present. This
degrades the image resolution.
Figure 3.8 illustrates the Van der Waals force curve and shows the range of force
at which each mode is used.
Figure 3.8: Range of force for the different AFM mode [30]
It is important to clean the probe (the tip), i.e. to have a contaminant free probe.
15

Contaminants have a significant effect on imaging resolution. Various methods
to clean the probe can be performed, i.e. chemical cleaning by immersing the
probe in an acid solution for a short period or Ultraviolet (UV) light (UV light
converts small amounts of oxygen into ozone which are then further broken
down to produce highly reactive singlet oxygen that will finally react with organic
contaminant materials on the surface of the probe tip [31].
3.2.2 Analysis of images
Different parameters can be analysed with the AFM. Two common are the height
and the phase.
An example of two-dimensional AFM height images and the corresponding three-
dimensional images is shown in Figure 3.9. The brighter a point is, the higher
is the height. Phase images work similarly, this allows not to see the height
but to see if different types of materials are present, i.e. to see materials with
different nature. Material with different stiffness will appear with a contrast in
the image.
Figure 3.9: Example of height and phase AFM images from the same area
3.3 Materials and methods
3.3.1 Langmuir-Blodgett Films
Depositions and isotherms were performed using a KSV Nima 5000 Langmuir
polytetrafluoroethylene (PTFE) trough from Biolin Scientific. The effective water
area is 755.25cm2. The movable barriers are made of polyoxymethylene (POM)
and the compression rate is 9 cm2.min−1. The through and barriers were rinsed
16

using absolute ethanol (purity > 99.8%), followed by several rinsing (at least 20
times) with Milli-Q water (> 18.2 MΩ and < 2 ppm total organic compounds).
Paper Wilhelmy plates are used to measure the surface pressure with an accuracy
of 0.01 mN.m−1. The bath temperature of the subphase is set to 22.0±0.1 C
and controlled via a circulation bath. The used subphases are Milli-Q Water
(pH 5.6) and NaCl solution. The Na+ subphase was made with 0.18mM of NaCl
and 0.1mM of NaHCO3 with an adjusted pH of 10.0 that has been buffered with
NaOH. The total Na+ concentration is 0.4mM. All depositions were performed
using silicon wafers with low roughness (< 2 Å). The pull-out speed is 1 mm.min−1.
The depositions are single-layered of Y-type. Before deposition, the silicon wafers
were sonicated in absolute ethanol for 15 minutes, then rinsed several times.
Afterwards, the wafers were immersed in chromosulfuric acid (Merck, ≥ 92%
H2SO4, ≥ 1.3% CrO3) during 5 minutes and then rinsed several times with Milli-Q
water. A systematic error in the area per molecule for isotherms of the same fatty
acids is estimated to 0.5 Å2 from a microsyringe of precision of ± 1 µL.
3.3.2 AFM
A Multimode Microscope 8 (Bruker) was used for the AFM measurements. The
cantilevers were made of Silicon. Cantilevers were first subjected to UV-radiation
for 10 minutes to remove from organic contaminants. WSXM software.65 was
used to analyses the AFM images.
3.3.3 Mixture
Analysis of different mixture at different percentages of the three most common
fatty acid present at the hair cuticle (18-MEA, OA and HA) was performed.
Hexadecanoic acid (99%, GC, Larodan), 18-methyleicosanoic acid (> 99 %, GC,
Larodan) and Octadecanoic acid (99.8%, GC, Larodan) were used as received. The
fatty acid solutions were all prepared at 1 mg.mL−1 in Chloroform (99.0–99.4 %
GC, with approximately 1 % ethanol as stabiliser, Merck).
https://www.overleaf.com/project/5e42eed963770a0001ce0c98 The different
composition of the mixture, as well as the different experimental conditions, can
be seen in Table 3.1. The percentage is given in mole fraction. For example 18-
17

MEA:HA:OA 45:29:26 has 45% of 18-MEA, 29% of HA and 26% of OA.
Some experiments (those that are not written in blue) have been performed by
Erik Bergendal1. Some others experiments were not considered as being very
relevant for the current work also due to time issues because the end of the
experiments was performed during the start of the Covid-19 leading to some
restrictions in the laboratory work. The experiments that were not performed are
represented by lines in the table.
Table 3.1: Composition of the mixture and subphase
Isotherm Deposition AFM
Milli-Q Na+ Milli-Q18-MEA:HA
Na+ Na+ Na+
18-MEA:HA 84-16
Na+ Na+ Na+
Milli-Q18-MEA:HA 70-30
Na+ Na+ Na+
Milli-Q18-MEA:HA 56-44
Na+ Na+ Na+
Milli-Q Milli-Q Milli-Q18-MEA:HA 44-56
Na+ Na+ Na+
Milli-Q Milli-Q Milli-Q18-MEA:HA:OA 45-29-26
Na+ Na+ Na+
Milli-QOA
Na+
Milli-QHA
Na+
1Department of Chemistry, School of Engineering Sciences in Chemistry, Biotechnology andHealth, KTH Royal Institute of Technology, Drottning Kristinas väg 51, SE-100 44 StockholmSweden
18

4 Results
4.1 Langmuir-Blodgett isotherms
The surface pressure against the area isotherms of different mixtures of fatty acids
were collected on Milli-Q water as well as on 0.4mN Na+ subphase at pH 10.0.
Figure 4.1 illustrates the isotherms of the straight-chains fatty acid OA and HA on
both Milli-Q and Na+ subphases. Typical behaviour of straight-chains fatty acid is
observed, as other examples seen in literature [23]. On Milli-Q, first, a gas phase
is observed, then a tilted phase with the lift-off area at 28 Å2 for HA and 25 Å2
for OA. An untilted phase starts at 23 Å2 for HA and around 19 Å2 for OA. This is
followed by a constant area collapse. On Na+, there the tilted phase occurs at a
lower area, i.e. at 18 Å2 for HA and 24.5 Å2 for OA. The collapse behaviour of OA
is clearly a constant pressure collapse. However, the collapse behaviour of HA, as
well as the untilted phase are not very well defined and the isotherm experiment
should have been performed again but due to a lack of time because of the Covid-
19 situation and since the project focuses on mixtures with 18-MEA to investigate
the domain formation, this isotherm has not been performed again.
8 9 10 11 12 13 14 15 16 17 18 19 20 21 22 23 24 25 26 27 28 29 30 31 32 33 34 35 36 37 38
Area per molecule [Ų/molecules]
0
10
20
30
40
50
60
Sur
face
Pre
ssur
e [m
N/m
]
HA on Milli-Q
HA on 0.4mM Na+ at pH 10.0
OA on 0.4mM Na+ at pH 10.0OA on Milli-Q
Figure 4.1: Langmuir Isotherms of HA and OA on Milli-Q and 0.4mM of Na+ atpH 10.0
19

The isotherms of different percentage of 18-MEA and HA are presented in Figure
4.2. Again a similar behaviour as for the straight-chain is observed for 56 and 44%
of HA. The tilted phase starts around 25 Å2 and the untilted phase at 19 Å2 which
correspond to the cross-sectional area of an hydrocarbon showing a maximum
packing density of the monolayer [32]. A constant pressure collapse is discerned.
On the other hand, there is a very different behaviour for the isotherms with a
lower ratio of HA (0, 16 and 30% of HA. The tilted phase starts at 31 Å2 for 18-MEA,
27 Å 2 for 18-MEA:HA 54:16 and at 25.1 Å2 for 18-MEA:HA 70:30 %. No untilted
phase is observed and the collapse occurs after the tilted phase. A constant area
collapse is observed although this is less pronounced for the 18-MEA:HA 70:30.
The isotherms of the different percentage of 18-MEA and HA on Milli-Q can be
seen in Appendix A.
9 10 11 12 13 14 15 16 17 18 19 20 21 22 23 24 25 26 27 28 29 30 31 32 33 34 35 36 37 38 39 40
Area per molecule [Ų/molecules]
0
10
20
30
40
50
60
70
Sur
face
Pre
ssur
e [m
N/m
]
18-MEA:HA 44:56 on 0.4mM Na+ at pH 10.0 18-MEA:HA 56:44 " 18-MEA:HA 70:30 " 18-MEA:HA 84:16 " 18-MEA "
Figure 4.2: Langmuir Isotherms of 18-MEA and HA at different percentage on0.4mM of Na+ at pH 10.0
In order to study a more hair-like fatty acid composition, isotherms of 18-
20

MEA:HA:OA 45:29:26 (Figure 4.3) have been performed since both long and short
chains fatty acid are present in the hair’s fatty acid composition (as shown in
Figure 2.2). The behaviour is typical for straight-chain fatty acid with a tilted,
an untilted phase and a constant area collapse on Milli-Q and constant pressure
collapse on Na+ subphase. The area at which the tilted phases start for Milli-Q
and Na+ is similar for both around 31 Å2. Although the area at the lift-off on
Na+ should be lower due to the reduction of the head group interaction in the
ion subphase. However, this is in accordance with the systematic error in the
measurements. On Na+ subphase, the tilted phase is achieved at 32 Å2 which
is a higher area than for 18-MEA and for all percentage of 18-MEA:HA on Na+.
8 9 10 11 12 13 14 15 16 17 18 19 20 21 22 23 24 25 26 27 28 29 30 31 32 33 34 35 36 37 38
Area per molecule [Ų/molecules]
0
10
20
30
40
50
60
Sur
face
Pre
ssur
e [m
N/m
]
18-MEA:HA:OA 45-29-26 On Milli-Q
18-MEA:HA:OA 45-29-26 on 0.4mM Na+ at pH 10.0
Figure 4.3: Langmuir Isotherms of 18-MEA:HA:OA 45:29:26 on 0.4mM of Na+
at pH 10.0 and Milli-Q subphases
4.2 AFM images
Deposition on 0.4 mM Na+ at pH 10.0 at different surface pressure (0, 5, 20 and
35 mN.m−1) followed by AFM analysis of 18-MEA and of 18-MEA:HA at different
ratio have been performed. The figures are labelled on the bottom by the ratio of
18-MEA and HA. So, the label 84:16 correspond to a deposition of 18-MEA:HA
21

with 84% of 18-MEA and 16% of HA. The scale of each images is put on the right
of each image. Phases images have a scale in degree and height images have a
scale in nanometre. Most of the presented images are phase images because the
structure was not always visible in the height images. Supplementary images with
the corresponding height images are presented in Appendix B.
At 0 mN.m−1 (Figure 4.4), no domain formation is observed for 18-MEA 100%.
The two images of 18-MEA:HA 84:16 have two different scales (one presents
a zoom in the structure). The ratio 84:16 displays a continuous labyrinthine
structure with some holes in the monolayer, corresponding to the dark area. The
white spot on the dark area could represent islands or aggregate of fatty acids.
A dendritic centipede-like structure is observed for 18-MEA:HA 70:30. This
structure also has some holes in the monolayer as can be seen in Appendix B.
But the holes represent a smaller proportion as for 84:16.
Figure 4.4: AFM phase images of 18-MEA:HA deposed at 0 mN.m−1 on a 0.4 mMof Na+ subphase at pH 10.0
Figure 4.5 presents the depositions at 5 mN.m−1. For 18-MEA 100%, domains
starts to appear but they are not well defined. 18-MEA:HA 84:16 and 18-MEA:HA
70:30 reveal both a formation of a continuous labyrinthine structure where 70:30
ratio has larger boundary characteristics. The two images of 18-MEA:HA 56:44
present the same area where one image is the phase image (on the left) and the
22

other is the height image (on the right).
Figure 4.5: AFM phase images of 18-MEA:HA deposed at 5 mN.m−1 on a 0.4 mMof Na+ subphase at pH 10.0
In Figure 4.6 deposition at 20 mN.m−1 are presented. Structured monodispersed
circular domains are formed with 18-MEA 100%. For 18-MEA:HA 84:16 a
small enlargement and slight elongation of the domains is observed. For 18-
MEA:HA 70:30, domains are still present but they are very elongated. No domains
formation is visible for 18-MEA:HA 56:44 and 18-MEA:HA 44:56, where 56:44
ratio shows irregular grain boundaries and 44:56 a very flat monolayer.
Figure 4.6: AFM phase images of 18-MEA:HA deposed at 20 mN.m−1 on a 0.4mM of Na+ subphase at pH 10.0
23

In order to evaluate the evolution of the domain formation, Figure 4.7 displays
the AFM images of 18-MEA:HA 70:30 at 0, 5, 20 and 35 mN.m−1. At 0 mN.m−1,
a dendritic centipede-like structure is observed. At 5 mN.m−1, a continuous
labyrinthine structure is discerned. At 20 mN.m−1, domains formation appears.
However, the domains are very elongated. Finally, slightly elongated regular
domains are visible at 35 mN.m−1.
Figure 4.7: AFM phase images of 18-MEA:HA 70:30 deposed on a 0.4 mM of Na+
subphase at pH 10.0
A more hair-like composition (18-MEA:HA:OA 45:29:26) was studied. The AFM
images are presented in Figure 4.8. at 0 mN.m−1, a very flat monolayer is observed
with holes. At 5 mN.m−1, the holes disappear and just a flat monolayer is seen.
At 20 mN.m−1, some irregular size domains are partially covering the surface are
seen, where the rest remains a flat monolayer.
24
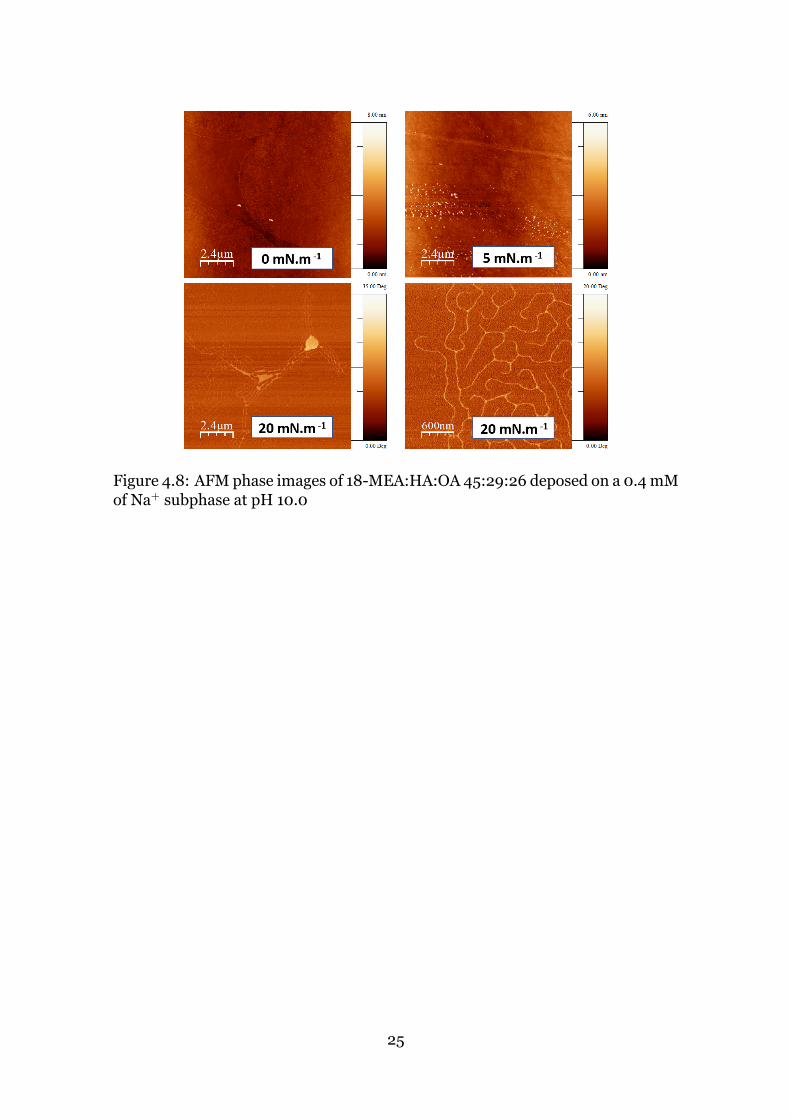
Figure 4.8: AFM phase images of 18-MEA:HA:OA 45:29:26 deposed on a 0.4 mMof Na+ subphase at pH 10.0
25

5 Discussion
5.1 Langmuir Isotherms
The isotherms of the straight-chain OA and HA (Figure 4.1) show a typical and
expected behaviour.
The isotherms of different percentage of 18-MEA and HA display two very distinct
behaviour between low content of 18-MEA (18-MEA:HA 44:56 and 18-MEA:HA
56:44) and a high content of 18-MEA (18-MEA:HA 70:30, 18-MEA:HA 84:16 and
18-MEA 100:0). Typical curves similar to straight-chain fatty acid isotherms are
observed for a low content of 18-MEA (Figure 4.2). With a high content of 18-
MEA, similar curves of domain-forming fatty acid (18-MEA, 19-MEA), performed
on cadmium chloride (CdCl2), have been reported in Bergendal et al. [2, 3].
Isotherms of 18-MEA:HA:OA 45:29:26 are also typical to straight-chain fatty acid.
However, the high area per molecule at the lift-off can be attributed to the presence
of OA that alter the packing of the monolayer as will be discussed in subsection
5.3.
Because isotherms of high content of 18-MEA are similar to domain forming
isotherms and isotherms of low content of 18-MEA to straight-chain isotherms,
it could be expected that domains will form for a high content of 18-MEA whereas
no domain will be formed for a low content of 18-MEA (44 and 56%). Isotherms of
the hair-like structure (18-MEA:HA:OA 45:29:26) display also similar behaviour
as for straight-chain isotherms. Thus, it could be expected to see no domain
formation. However, AFM images need to be analysed to look at the topography
and confirm or not the isotherms behaviour.
5.2 AFM images
For 18-MEA deposed at 20 mN.m−1 on Na+, the size domains are measured to be
60 nm with the FT inset. In a previous study from Erik Bergendal et al. [2], the
size domain of 18-MEA deposed at 20 mN.m−1 on a Cd2+ subphase was found to
be 30 nm. Thus, the subphase affects the size of the domains.
In 18-MEA, no domains were formed at 0 mN.m−1, whereas domains appeared at
26
5 mN.m−1 ad 20 mN.m−1 with less well-defined domains at the lower pressure.
For 18-MEA:HA 84:16, at 0 mN.m−1 surface pressure, a continuous labyrinthine
structure is visible with some holes in the monolayer. For 5 mN.m−1, the
labyrinthine structure is covering the whole monolayer and is better defined with
smaller boundary characteristics. At 20 mN.m−1, circular, slightly elongated
domains are formed. For 18-MEA:HA 70:30, at 0 mN.m−1 a dendritic centipede-
like structure is seen. A continuous labyrinthine structure appears at a higher
surface pressure (5 mN.m−1). Domains start forming at 20 mN.m−1, but they are
very elongated and not regular, whereas at 35 mN.m−1, more circular domains,
but still slightly elongated, are present. Thus, changing the surface pressure
is another parameter that affects the size of the domain as well as the domain
formation.
Finally, when comparing the AFM images at the same surface pressure with the
composition varying, it is found that the composition also affects the domain
formation. At 20 mN.m−1, the circular well-defined monodisperse domain of 18-
MEA becomes larger and more elongated when increasing the HA content (84:16
and 70:30) until large irregular grain boundaries are seen (56:44) and a very
flat monolayer (44:56). At 5 mN.m−1, Circular domains with 18-MEA become
continuous labyrinthine structure with the boundary increasing as the HA content
increases (84:16 and 70:30) and finally flat monolayer with holes (56:44) and
without holes (44:56).
When considering the isotherms of 18-MEA:HA:OA 45:29:26 and the typical
behaviour similar to a straight-chain isotherm, one could expect not to see
domains forming. However, some irregular-sized domains, partially covering
the surface are visible. Possible reasons for this will be discussed in the next
subsection 5.3.
5.3 Final discussion
As explained in other literature papers [2, 3], a reason why domains are forming
is as follows. The branch located at the 18th of the 18-MEA adds constraint in
the packing and avoid a close packing at the ends of the chains. When deposed
on Milli-Q, the head repulsion of the carboxylate prevent from a close packing
of the head group. Thus, a flat monolayer appears. When the head repulsion is
27

reduced or annihilated, the head group can approach each other and the branches
will prevent from a close packing at the end of the chain, forming a curvature,
which leads to the formation of domains.
An illustration of the formation of a flat monolayer when the head repulsion is
present is shown in Figure 5.1a. An illustration of the formation of domains
when the head repulsion is decreased or annihilated is presented in Figure 5.1b.
The 18-MEA fatty acids are represented by a cone with the large base at the end
corresponding to the branch that is taking extra place.
(a) Formation of a flat monolayer when the headrepulsion is present
(b) Formation of domains in the monolayer whenthe head repulsion is reduced or annihilated
Figure 5.1: Illustration of adsorbate monolayers with an intrinsic curvatureforming flat and curved domains at the interface [2]
The domain formation is also illustrated in Figure 5.2. A lower curvature implies
larger domains.
Figure 5.2: Domain formation of 18-MEA at the water/air interface [3]
The larger domains in 18-MEA on Na+ compared to 18-MEA on Cd2+ indicate a
lower curvature when using a sodium subphase (Na+). The ions in the subphase
lead to a dissociation of the carboxylate head group. However, all ions have not the
same strength for the dissociation, and thus in reducing the head group repulsion.
The cadmium ions have higher interactions with the monolayer due to the covalent
28
character. This results in a better neutralisation of the charges, and thus a closer
packing of the head groups. On the other hand, Na+ has mostly electrostatic
interactions, leading to fewer interactions and a less close packing of the head
groups [4, 25].
Increasing the HA content leads to an enlargement of the domains and further
addition of HA leads to the formation of a flat monolayer. This is attributed to the
beneficial packing of 18-MEA and HA. The branch in 18-MEA, that is hindering
the packing is located at the 18th Carbon, whereas HA has 16 carbons in the chain.
The HA will thus lie below the branches, allowing a better packing. When the
ratio of 18-MEA:HA is around 50%, one can consider that each 18-MEA will
have four HA neighbour, the branches will not have any interaction with other
branches anymore. This lead to a close packing without curvature, and thus to a
flat monolayer. Flat monolayer was indeed observed for ratio close to 50% (56:44
and 44:56), shown in Figures 9 and 9
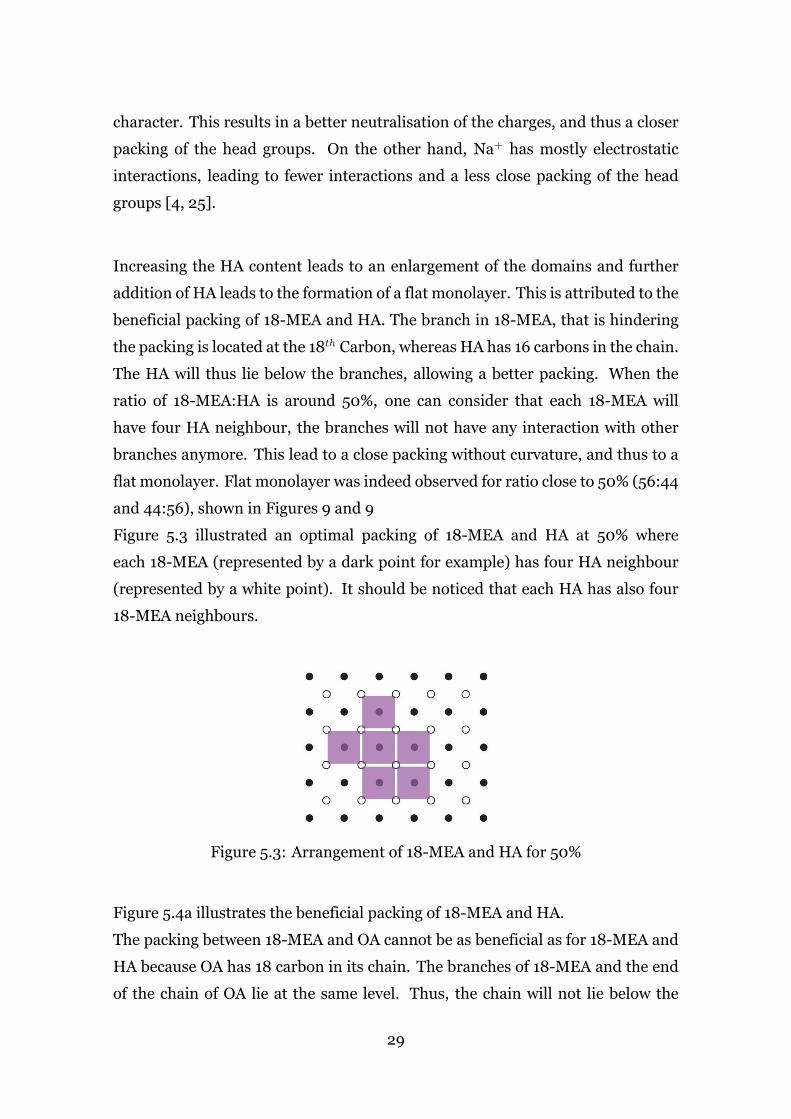
Figure 5.3 illustrated an optimal packing of 18-MEA and HA at 50% where
each 18-MEA (represented by a dark point for example) has four HA neighbour
(represented by a white point). It should be noticed that each HA has also four
18-MEA neighbours.
Figure 5.3: Arrangement of 18-MEA and HA for 50%
Figure 5.4a illustrates the beneficial packing of 18-MEA and HA.
The packing between 18-MEA and OA cannot be as beneficial as for 18-MEA and
HA because OA has 18 carbon in its chain. The branches of 18-MEA and the end
of the chain of OA lie at the same level. Thus, the chain will not lie below the
29
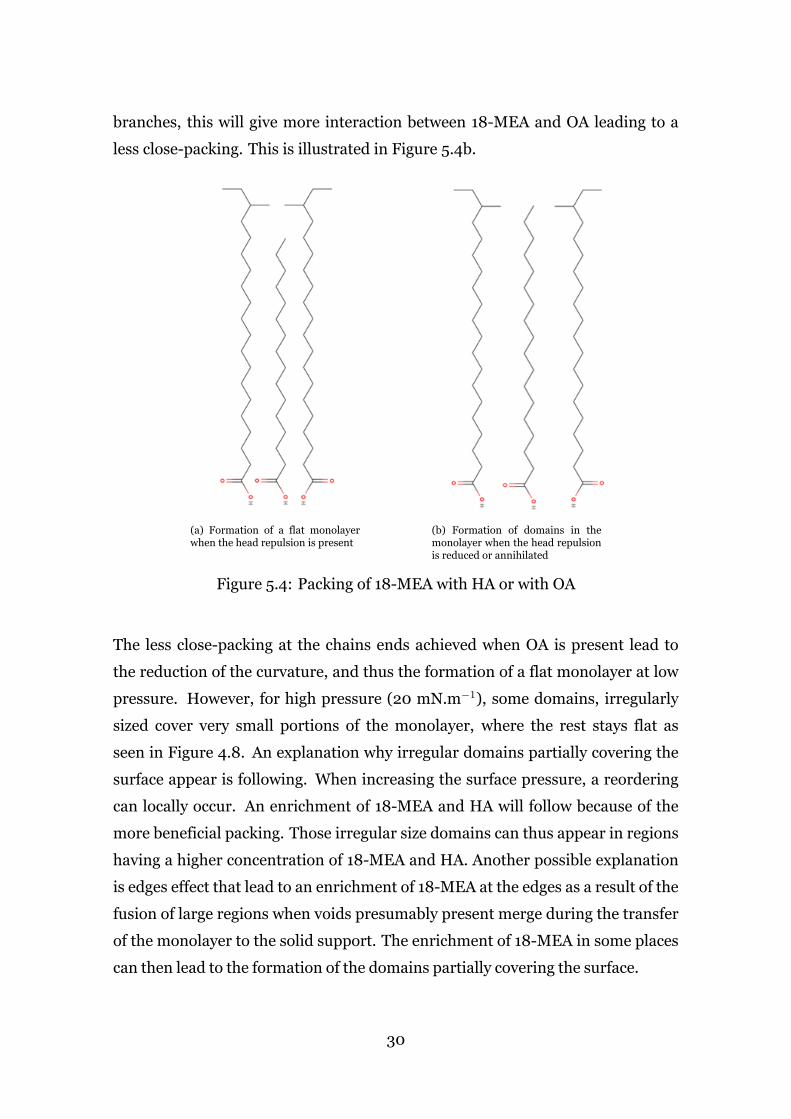
branches, this will give more interaction between 18-MEA and OA leading to a
less close-packing. This is illustrated in Figure 5.4b.
(a) Formation of a flat monolayerwhen the head repulsion is present
(b) Formation of domains in themonolayer when the head repulsionis reduced or annihilated
Figure 5.4: Packing of 18-MEA with HA or with OA
The less close-packing at the chains ends achieved when OA is present lead to
the reduction of the curvature, and thus the formation of a flat monolayer at low
pressure. However, for high pressure (20 mN.m−1), some domains, irregularly
sized cover very small portions of the monolayer, where the rest stays flat as
seen in Figure 4.8. An explanation why irregular domains partially covering the
surface appear is following. When increasing the surface pressure, a reordering
can locally occur. An enrichment of 18-MEA and HA will follow because of the
more beneficial packing. Those irregular size domains can thus appear in regions
having a higher concentration of 18-MEA and HA. Another possible explanation
is edges effect that lead to an enrichment of 18-MEA at the edges as a result of the
fusion of large regions when voids presumably present merge during the transfer
of the monolayer to the solid support. The enrichment of 18-MEA in some places
can then lead to the formation of the domains partially covering the surface.
30

6 Conclusions and Futur Work
3D domains were successfully performed using mixtures of 18-MEA and HA on
a harmless Na+ subphase. The domains appeared for a percentage of 18-MEA
higher or equal to 70%.
The addition of small straight-chain fatty acid HA leads to a lower curvature in the
monolayer, and thus an enlargement of the domains.
The structure is found to be tuneable. The subphase, the deposition surface
pressure and the 18-MEA:HA ratio affect the formation of domains, where circular
domains, elongated domains, continuous labyrinthine structure, dendritic
centipede-like structure and no domains were obtained.
The presence of the longer straight chains fatty acid OA affects the packing leading
to lowering so much the curvature that a flat monolayer is seen at low pressure.
At a higher pressure, irregular size domains partially covering the surface appear.
An interesting future work could be to further analyse the hair-like structure by:
• Investigating different composition of 18-MEA, HA and OA.
• Making deposition (and then AFM images) at higher surface pressure to see
if more regular domains could appear
• Performing deposition after stabilisation time (after 1 hour, 5 hours and the
whole night) to see if the irregular size domain are still present after some
stabilization time.
31

7 Recommendations
I recommend reading the PhD thesis from Erik Bergendal [33] that is precisely
dealing on Fatty acid self-assembly at the water/air interface but considering also
others problematic, aspects and additional experiments. This work gives a more
complete overview of the subject if it is of interest of the reader.
32
8 Acknowledgements
I would like to sincerely thank Erik Bergendal1 that helped and supported me
during my project and for the helpful discussions. I would also like to thank my
supervisor, Prof. Mark Rutland1, for giving me the opportunity and trusting me
to participate in this project. I would like to thank all Surface Corrosion people for
the great welcoming in your division, for the Fikas on Fridays and the interesting
discussions. I would also thank Per Claesson1 and Nikolay Kotov1 for coming
respectively to the office and laboratory allowing me to finish my experiment
during the Covid-19 Pandemie. Finally, I would like to thank Anders Tilliander2
and Anders Eliasson2, respectively the course responsible and examiner of this
project.
1Department of Chemistry, School of Engineering Sciences in Chemistry, Biotechnology andHealth, KTH Royal Institute of Technology, Drottning Kristinas väg 51, SE-100 44 StockholmSweden
2KTH Royal Institute of Technology, Department of Materials Science and Engineering (MSE)
33

9 References[1] P. W. Wertz and D. T. Downing, “Integral lipids of human hair,” Lipids,
vol. 23, no. 9, pp. 878–881, 1988.
[2] J. F. D. Liljeblad, E. Tyrode, E. Thormann, A.-C. Dublanchet, G. Luengo,
C. Magnus Johnson, and M. W. Rutland, “Self-assembly of long chain
fatty acids: effect of a methyl branch,” Phys. Chem. Chem. Phys., vol. 16,
pp. 17869–17882, 2014.
[3] E. Bergendal, R. A. Campbell, G. A. Pilkington, P. Müller-Buschbaum, and
M. W. Rutland, “3d texturing of the air–water interface by biomimetic self-
assembly,” Nanoscale Horiz., vol. 5, pp. 839–846, 2020.
[4] J. Kmetko, A. Datta, G. Evmenenko, and P. Dutta, “The effects of divalent
ions on langmuir monolayer and subphase structure: a grazing-incidence
diffraction and bragg rod study,” The Journal of Physical Chemistry B,
vol. 105, no. 44, pp. 10818–10825, 2001.
[5] B. Mao, A. Siddaiah, Y. Liao, and P. L. Menezes, “Laser surface texturing and
related techniques for enhancing tribological performance of engineering
materials: A review,” Journal of Manufacturing Processes, vol. 53, pp. 153
– 173, 2020.
[6] M. Tao, W. Zhou, H. Yang, and L. Chen, “Surface texturing by solution
deposition for omnidirectional antireflection,” Applied Physics Letters,
vol. 91, no. 8, p. 081118, 2007.
[7] D. Johnson, N. Hilal, and W. R. Bowen, “Chapter 1 - basic principles
of atomic force microscopy,” in Atomic Force Microscopy in Process
Engineering (W. R. Bowen and N. Hilal, eds.), pp. 1 – 30, Oxford:
Butterworth-Heinemann, 2009.
[8] M. C. Petty, Langmuir-Blodgett films : an introduction. Cambridge :
Cambridge university press, 1996.
[9] C. Robbins, Chemical and Physical Behavior of Human Hair. Springer
Berlin Heidelberg, 2016.
34

[10] Y. Masukawa, H. Tsujimura, and G. Imokawa, “A systematic method for
the sensitive and specific determination of hair lipids in combination with
chromatography,” Journal of Chromatography B, vol. 823, no. 2, pp. 131 –
142, 2005.
[11] H. . I. Jakubowski, Biochemistry Online: An Approach Based on Chemical
Logic. Wilmington, N.C., 2002.
[12] L. N. Jones and D. E. Rivett, “The role of 18-methyleicosanoic acid in the
structure and formation of mammalian hair fibres,” Micron, vol. 28, no. 6,
pp. 469 – 485, 1997.
[13] L. Liu, Z. Wang, H. G. Park, C. Xu, P. Lawrence, X. Su, V. Wijendran, W. A.
Walker, K. S. Kothapalli, and J. T. Brenna, “Human fetal intestinal epithelial
cells metabolize and incorporate branched chain fatty acids in a structure
specific manner,” Prostaglandins, Leukotrienes and Essential Fatty Acids,
vol. 116, pp. 32 – 39, 2017.
[14] N. Singh and B. Choudhury, “Valorization of food-waste hydrolysate by
lentibacillus salarius ns12iitr for the production of branched chain fatty
acid enriched lipid with potential application as a feedstock for improved
biodiesel,” Waste Management, vol. 94, pp. 1 – 9, 2019.
[15] T. Peters, “Physics of continuous matter: Exotic and everyday phenomena
in the macroscopic world, 2nd ed., by b. lautrup,” Contemporary Physics,
vol. 54, no. 1, pp. 60–60, 2013.
[16] Surface Tension and Adsorption at the Air–Water Interface, ch. 16,
pp. 337–355. John Wiley Sons, Ltd, 2003.
[17] Introduction to Surfactants, ch. 1, pp. 1–37. John Wiley Sons, Ltd, 2003.
[18] J. N. Israelachvili, “19 - thermodynamic principles of self-assembly,” in
Intermolecular and Surface Forces (Third Edition) (J. N. Israelachvili, ed.),
pp. 503 – 534, Boston: Academic Press, third edition ed., 2011.
[19] N. instrument, “Langmuir films.”
[20] H. Li, “Design of amphiphilic anti-caking systems for solid particles,” 2010.
35

[21] R. A. Hann, Molecular Structure and Monolayer Properties, pp. 17–92.
Boston, MA: Springer US, 1990.
[22] F. Ndeye Rokhaya, I. Gammoudi, F. Moroté, C. Grauby-Heywang, and
T. Cohen-Bouhacina, “Phase behavior and structure properties of supported
lipid monolayers and bilayers in interaction with silica nanoparticles,” 06
2013.
[23] A. Ulman, An Introduction to Ultrathin Organic Films: From Langmuir–
Blodgett to Self–Assembly. Academic Press, 2013.
[24] V. Kaganer, H. Möhwald, and P. Dutta, “Structure and phase transitions in
langmuir monolayers,”Reviews ofModern Physics, vol. 71, pp. 779–819, jan
1999.
[25] S. Kundu and D. Langevin, “Fatty acid monolayer dissociation and collapse:
Effect of ph and cations,” Colloids and Surfaces A: Physicochemical and
Engineering Aspects, vol. 325, no. 1, pp. 81 – 85, 2008.
[26] D. Correa, E. Medeiros, J. Oliveira, L. Paterno, and L. Mattoso,
“Nanostructured conjugated polymers in chemical sensors: Synthesis,
properties and applications,” Journal of Nanoscience and Nanotechnology,
vol. 14, 09 2014.
[27] J. Bhattacharjee, Chapter-1 General Introduction. PhD thesis.
[28] G. A. Edwards, A. J. Bergren, and M. D. Porter, “8 - chemically modified
electrodes,” in Handbook of Electrochemistry (C. G. Zoski, ed.), pp. 295 –
327, Amsterdam: Elsevier, 2007.
[29] G. Zeng, Y. Duan, F. Besenbacher, and M. Dong,Nanomechanics of Amyloid
Materials Studied by Atomic Force Microscopy. 03 2012.
[30] “Nanotechnologies, afm.”
[31] D. Johnson, N. Hilal, and W. R. Bowen, “Chapter 1 - basic principles
of atomic force microscopy,” in Atomic Force Microscopy in Process
Engineering (W. R. Bowen and N. Hilal, eds.), pp. 1 – 30, Oxford:
Butterworth-Heinemann, 2009.
36

[32] E. Bergendal, M. Batista, G. S. Luengo, and M. W. Rutland, “Self-assembly
induced patterning in biomimetic fatty acid monolayers.”.
[33] E. Bergendal, Fatty Acid Self-Assembly at the Air–Water Interface
: Curvature, Patterning, and Biomimetics: A Study by Neutron
Reflectometry and Atomic ForceMicroscopy. PhD thesis, KTH, Surface and
Corrosion Science, 2020. QC 2020-05-15.
37

Appendix A: Langmuir-Blodgett isotherms on
Milli-Q
In this Appendix, the isotherms of different percentage of 18-MEA and HA
performed on Milli-Q are presented.
9 10 11 12 13 14 15 16 17 18 19 20 21 22 23 24 25 26 27 28 29 30 31 32 33 34 35 36 37 38 39 40
Area per molecule [Ų/molecules]
0
10
20
30
40
50
60
70
Sur
face
Pre
ssur
e [m
N/m
]
18-MEA:HA 44:56 on Milli-Q18-MEA:HA 56:44 "18-MEA:HA 70:30 "18-MEA:HA 84:16 "18-MEA "
Figure 9.1: Langmuir Isotherms of 18-MEA and HA at different percentage on aMilli-Q subphase
38
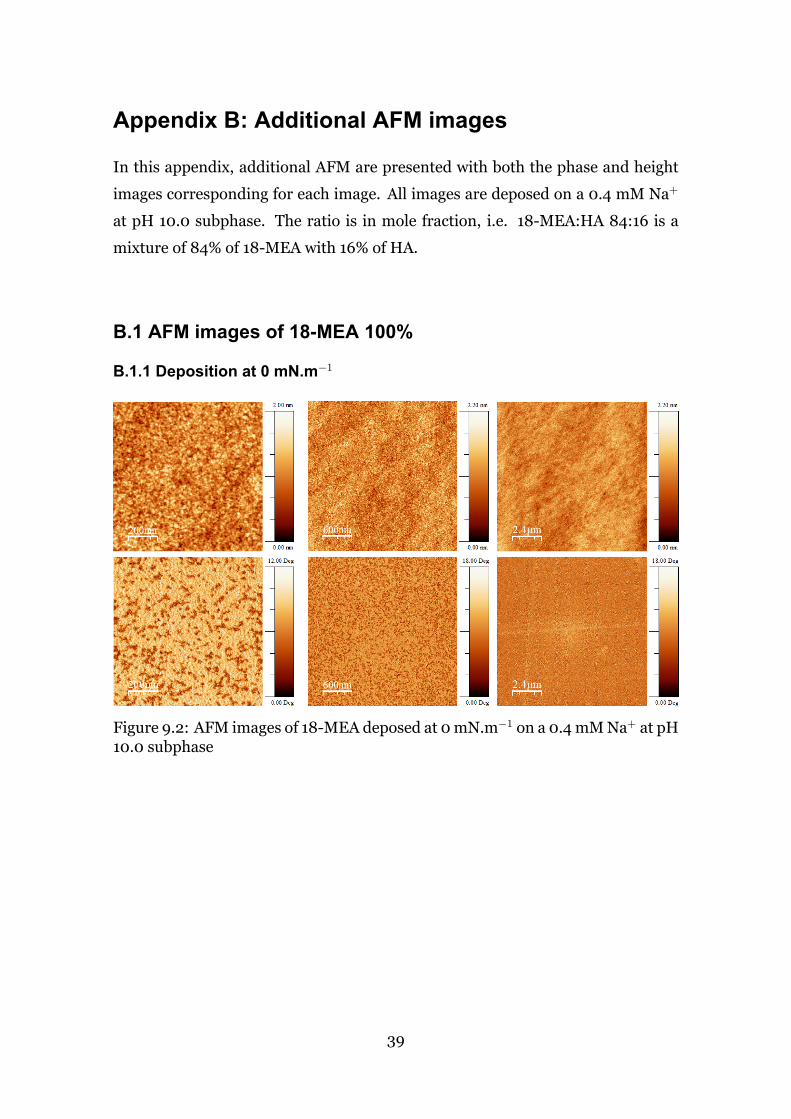
Appendix B: Additional AFM images
In this appendix, additional AFM are presented with both the phase and height
images corresponding for each image. All images are deposed on a 0.4 mM Na+
at pH 10.0 subphase. The ratio is in mole fraction, i.e. 18-MEA:HA 84:16 is a
mixture of 84% of 18-MEA with 16% of HA.
B.1 AFM images of 18-MEA 100%
B.1.1 Deposition at 0 mN.m−1
Figure 9.2: AFM images of 18-MEA deposed at 0 mN.m−1 on a 0.4 mM Na+ at pH10.0 subphase
39

B.1.2 Deposition at 5 mN.m−1
Figure 9.3: AFM images of 18-MEA deposed at 5 mN.m−1 on a 0.4 mM Na+ at pH10.0 subphase
B.1.3 Deposition at 20 mN.m−1
Figure 9.4: AFM images of 18-MEA deposed at 20 mN.m−1 on a 0.4 mM Na+ atpH 10.0 subphase
40

B.2 AFM images of 18-MEA:HA 84:16
B.2.1 Deposition at 0 mN.m−1
Figure 9.5: AFM images of 18-MEA:HA 84:16 deposed at 0 mN.m−1 on a 0.4 mMNa+ at pH 10.0 subphase
Figure 9.6: AFM images of 18-MEA:HA 84:16 deposed at 0 mN.m−1 on a 0.4 mMNa+ at pH 10.0 subphase
41

B.2.2 Deposition at 5 mN.m−1
Figure 9.7: AFM images of 18-MEA:HA 84:16 deposed at 5 mN.m−1 on a 0.4 mMNa+ at pH 10.0 subphase
B.2.3 Deposition at 20 mN.m−1
Figure 9.8: AFM images of 18-MEA:HA 84:16 deposed at 20 mN.m−1 on a 0.4mM Na+ at pH 10.0 subphase
42

B.3 AFM images of 18-MEA:HA 70:30
B.3.1 Deposition at 0 mN.m−1
Figure 9.9: AFM images of 18-MEA:HA 70:30 deposed at 0 mN.m−1 on a 0.4 mMNa+ at pH 10.0 subphase
Figure 9.10: AFM images of 18-MEA:HA 70:30 deposed at 0 mN.m−1 on a 0.4mM Na+ at pH 10.0 subphase
43

B.3.2 Deposition at 5 mN.m−1
Figure 9.11: AFM images of 18-MEA:HA 70:30 deposed at 5 mN.m−1 on a 0.4 mMNa+ at pH 10.0 subphase
B.3.3 Deposition at 20 mN.m−1
Figure 9.12: AFM images of 18-MEA:HA 70:30 deposed at 20 mN.m−1 on a 0.4mM Na+ at pH 10.0 subphase
44

B.3.4 Deposition at 35 mN.m−1
Figure 9.13: AFM images of 18-MEA:HA 70:30 deposed at 35 mN.m−1 on a 0.4mM Na+ at pH 10.0 subphase
B.4 AFM images of 18-MEA:HA 56:44
B.4.1 Deposition at 0 mN.m−1
Figure 9.14: AFM images of 18-MEA:HA 56:44 deposed at 0 mN.m−1 on a 0.4mM Na+ at pH 10.0 subphase
45
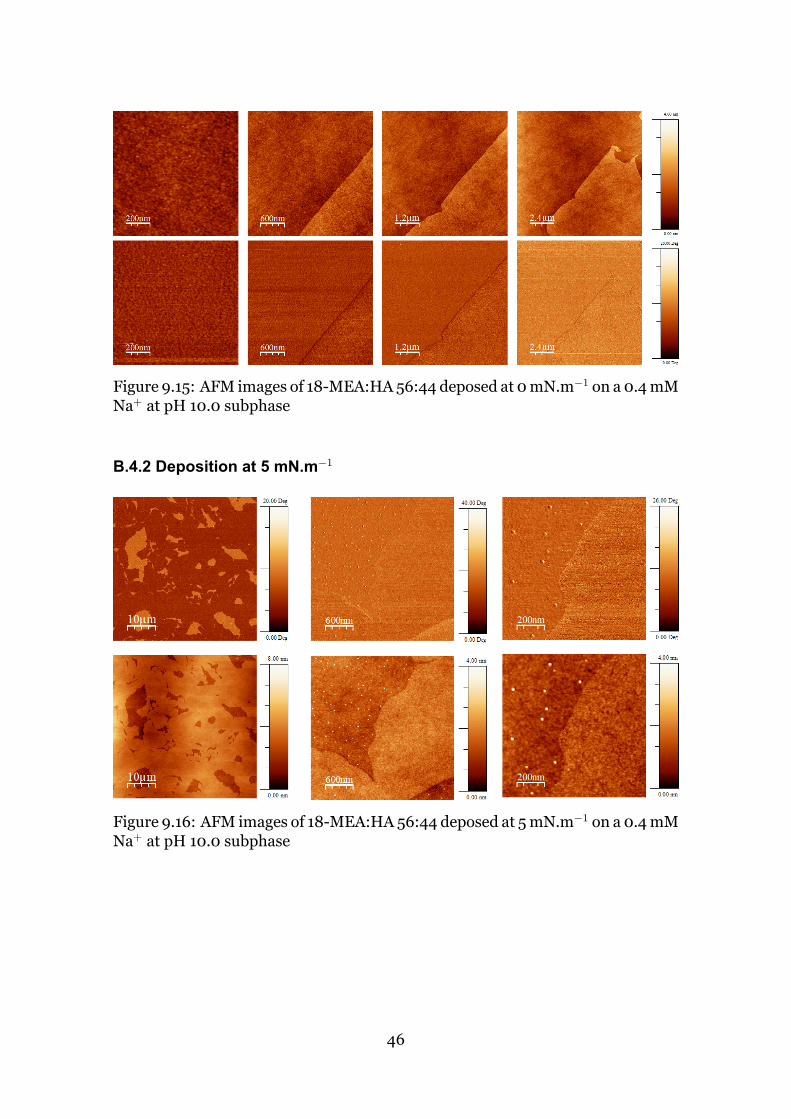
Figure 9.15: AFM images of 18-MEA:HA 56:44 deposed at 0 mN.m−1 on a 0.4 mMNa+ at pH 10.0 subphase
B.4.2 Deposition at 5 mN.m−1
Figure 9.16: AFM images of 18-MEA:HA 56:44 deposed at 5 mN.m−1 on a 0.4 mMNa+ at pH 10.0 subphase
46

B.4.3 Deposition at 20 mN.m−1
Figure 9.17: AFM images of 18-MEA:HA 56:44 deposed at 20 mN.m−1 on a 0.4mM Na+ at pH 10.0 subphase
B.5 AFM images of 18-MEA:HA 44:56
B.5.1 Deposition at 0 mN.m−1
Figure 9.18: AFM images of 18-MEA:HA 44:56 deposed at 0 mN.m−1 on a 0.4mM Na+ at pH 10.0 subphase
47

B.5.2 Deposition at 5 mN.m−1
Figure 9.19: AFM images of 18-MEA:HA 44:56 deposed at 5 mN.m−1 on a 0.4 mMNa+ at pH 10.0 subphase
B.5.3 Deposition at 20 mN.m−1
Figure 9.20: AFM images of 18-MEA:HA 44:56 deposed at 20 mN.m−1 on a 0.4mM Na+ at pH 10.0 subphase
48

B.6 AFM images of 18-MEA:HA:OA 45:29:26
B.6.1 Deposition at 0 mN.m−1
Figure 9.21: AFM images of 18-MEA:HA:OA 45:29:26 deposed at 0 mN.m−1 on a0.4 mM Na+ at pH 10.0 subphase
B.6.2 Deposition at 5 mN.m−1
Figure 9.22: AFM images of 18-MEA:HA:OA 45:29:26 deposed at 5 mN.m−1 on a0.4 mM Na+ at pH 10.0 subphase
49

B.6.3 Deposition at 20 mN.m−1
Figure 9.23: AFM images of 18-MEA:HA:OA 45:29:26 deposed at 20 mN.m−1 ona 0.4 mM Na+ at pH 10.0 subphase
Figure 9.24: AFM images of 18-MEA:HA:OA 45:29:26 deposed at 20 mN.m−1 ona 0.4 mM Na+ at pH 10.0 subphase
50

TRITA ITM-EX 2020:318
www.kth.se
Copyright © 2022 FDOKUMEN