Seismogenic Basin and Range and Intra‐arc Normal Faulting In the Central Mexican Volcanic Belt,...
29
GEOLOGICAL JOURNAL Geol. J. 40: 215–243 (2005) Published online in Wiley InterScience (www.interscience.wiley.com). DOI: 10.1002/gj.1004 Seismogenic Basin and Range and intra-arc normal faulting in the central Mexican Volcanic Belt, Quere ´ taro, Me ´ xico GERARDO J. AGUIRRE-DI ¤ AZ*, JORGE NIETO-OBREGO ¤ N and F. RAMO ¤ N ZU ¤ ¶IGA Centro de Geociencias, Universidad Nacional Auto ´ noma de Me ´ xico, Campus Juriquilla, Quere ´ taro, Me ´ xico North-northwest normal faults intersect ENE normal faults in the vicinity of Quere ´taro City, in central Me ´xico, affecting the Miocene–Pliocene northern-central sector of the Mexican Volcanic Belt province. This intersection produced an orthogonal arrangement of grabens, half-grabens and horsts that include the Quere ´taro graben. The NNW faults are part of the Taxco– San Miguel de Allende fault system, which is proposed here as part of the southernmost Basin and Range province in Me ´xico. The ENE to E–W faults are part of the E–W oriented Chapala–Tula fault zone, which has been interpreted as an active intra-arc fault system of the Mexican Volcanic Belt. Seventy-four normal faults were mapped, of which the NNW faults are the largest and have the best morphological expression in the region. More numerous, although shorter, are the ENE faults. Total length of the ENE faults is greater than the total length of the NNW faults. Both sets are dominantly normal faults, indicating ENE exten- sion for the NNW set and NNW extension for the ENE set. Field data indicate that displacement on the two fault sets has over- lapped in time, as some NNW faults are younger than some ENE faults, which are supposed to be the younger ones. Seismicity in 1998 on a NNW fault indicates ENE active extension on the NNW faults. These observations support our interpretation that the northern Mexican Volcanic Belt lies on the boundary between the Basin and Range province, which is undergoing ENE extension, and the central Mexican Volcanic Belt province, which is undergoing northerly extension. The apparent overlap in space and time of displacements on the two fault sets reflects the difference in stress regime between the two provinces. Copyright # 2005 John Wiley & Sons, Ltd. Received 11 August 2003; revised version received 1 July 2004; accepted 8 July 2004 KEY WORDS Basin and Range province; Mexican Volcanic Belt; normal faulting; seismicity; central Mexico; tectonics 1. INTRODUCTION Three regional fault systems affect the central sector of the Mexican Volcanic Belt. One is oriented NNW and named the Taxco–San Miguel de Allende fault system, first described by Demant (1978; Figure 1); the second is oriented E–W to ENE and named the Chapala–Tula fault system by Johnson and Harrison (1990). This latter system runs parallel to the Mexican Volcanic Belt and is thus considered as an intra-arc fault system (Suter et al. 1995a, 2001). A third fault system, named the Tenochtitla ´n shear zone by De-Cserna et al. (1989), is oriented NE and runs from the southern coast of Me ´xico close to Zihuatanejo (Figure 1), to the southern part of Puebla state, after passing through Me ´xico City (Garcı ´a-Palomo et al. 2002a,b). In the Quere ´taro City region, at the northern-central Miocene–Pliocene sector of the Mexican Volcanic Belt, two of these systems intersect, the NNW and the ENE (Figure 1). The intersection caused an orthogonal arrangement of normal faults, producing a mosaic of horsts, grabens and half-grabens. One of these is the Quere ´taro graben Copyright # 2005 John Wiley & Sons, Ltd. * Correspondence to: G. J. Aguirre-Dı ´az, Centro de Geociencias, UNAM, Campus Juriquilla, Apdo. Postal 1-742, Quere ´taro, Quere ´taro, 76001, Me ´xico. E-mail: [email protected]
Transcript of Seismogenic Basin and Range and Intra‐arc Normal Faulting In the Central Mexican Volcanic Belt,...
GEOLOGICAL JOURNAL
Geol. J. 40: 215–243 (2005)
Published online in Wiley InterScience (www.interscience.wiley.com). DOI: 10.1002/gj.1004
Seismogenic Basin and Range and intra-arc normal faultingin the central Mexican Volcanic Belt, Queretaro, Mexico
GERARDOJ. AGUIRRE-DI¤AZ*, JORGENIETO-OBREGO¤ Nand F. RAMO¤ N ZU¤ ¶IGACentro de Geociencias, Universidad Nacional Autonoma de Mexico, Campus Juriquilla, Queretaro, Mexico
North-northwest normal faults intersect ENE normal faults in the vicinity of Queretaro City, in central Mexico, affecting theMiocene–Pliocene northern-central sector of the Mexican Volcanic Belt province. This intersection produced an orthogonalarrangement of grabens, half-grabens and horsts that include the Queretaro graben. The NNW faults are part of the Taxco–San Miguel de Allende fault system, which is proposed here as part of the southernmost Basin and Range province in Mexico.The ENE to E–W faults are part of the E–Woriented Chapala–Tula fault zone, which has been interpreted as an active intra-arcfault system of the Mexican Volcanic Belt. Seventy-four normal faults were mapped, of which the NNW faults are the largestand have the best morphological expression in the region. More numerous, although shorter, are the ENE faults. Total length ofthe ENE faults is greater than the total length of the NNW faults. Both sets are dominantly normal faults, indicating ENE exten-sion for the NNW set and NNWextension for the ENE set. Field data indicate that displacement on the two fault sets has over-lapped in time, as some NNW faults are younger than some ENE faults, which are supposed to be the younger ones. Seismicityin 1998 on a NNW fault indicates ENE active extension on the NNW faults. These observations support our interpretationthat the northern Mexican Volcanic Belt lies on the boundary between the Basin and Range province, which is undergoingENE extension, and the central Mexican Volcanic Belt province, which is undergoing northerly extension. The apparent overlapin space and time of displacements on the two fault sets reflects the difference in stress regime between the two provinces.Copyright # 2005 John Wiley & Sons, Ltd.
Received 11 August 2003; revised version received 1 July 2004; accepted 8 July 2004
KEY WORDS Basin and Range province; Mexican Volcanic Belt; normal faulting; seismicity; central Mexico; tectonics
1. INTRODUCTION
Three regional fault systems affect the central sector of the Mexican Volcanic Belt. One is oriented NNW and
named the Taxco–San Miguel de Allende fault system, first described by Demant (1978; Figure 1); the second
is oriented E–W to ENE and named the Chapala–Tula fault system by Johnson and Harrison (1990). This latter
system runs parallel to the Mexican Volcanic Belt and is thus considered as an intra-arc fault system (Suter et al.
1995a, 2001). A third fault system, named the Tenochtitlan shear zone by De-Cserna et al. (1989), is oriented NE
and runs from the southern coast of Mexico close to Zihuatanejo (Figure 1), to the southern part of Puebla state,
after passing through Mexico City (Garcıa-Palomo et al. 2002a,b).
In the Queretaro City region, at the northern-central Miocene–Pliocene sector of the Mexican Volcanic Belt, two
of these systems intersect, the NNWand the ENE (Figure 1). The intersection caused an orthogonal arrangement of
normal faults, producing a mosaic of horsts, grabens and half-grabens. One of these is the Queretaro graben
Copyright # 2005 John Wiley & Sons, Ltd.
*Correspondence to: G. J. Aguirre-Dıaz, Centro de Geociencias, UNAM, Campus Juriquilla, Apdo. Postal 1-742, Queretaro, Queretaro, 76001,Mexico. E-mail: [email protected]
(Aguirre-Dıaz et al. 2000, 2003), which is bounded both by NNW faults of the Taxco–San Miguel de Allende fault
system and by ENE faults of the Chapala–Tula fault system (Figure 1). Nearby grabens of the Chapala–Tula fault
system, such as Aljibes, Mezquital and Acambay, are reported to have active seismicity (Suter et al. 1992, 1995a,
b; Langridge et al. 2000; Figure 1).
This paper describes the normal faults that occur in the vicinity of Queretaro City (Figure 2). We focus on the
structural nature of the faults based on geological and seismological observations, and discuss the relationship of
these faults with the regional extensional provinces in Mexico, particularly the Basin and Range province.
2. GEOLOGIC FRAMEWORK
The Mexican Volcanic Belt has been divided into a northern Miocene–Pliocene part and a southern Pliocene–
Recent part (Nixon et al. 1987; Aguirre-Dıaz 1996; Figure 1). Volcanism of the Queretaro region belongs to
the northern older portion, and is dominated by widespread 12–5Ma andesitic lavas interbedded with lacustrine
deposits of regional extent (Aguirre-Dıaz and Carranza-Castaneda 2000, 2001). Three large andesitic–dacitic
stratovolcanoes with ages around 10Ma were emplaced to the north of Queretaro City (Carrasco-Nunez et al.
1989; Perez-Venzor et al. 1997; Valdez-Moreno et al. 1998); these are El Zamorano, La Joya and Palo Huerfano
(Figure 1). They are deeply eroded stratovolcanoes of the Mexican Volcanic Belt that overlie andesitic plateau-
forming lavas and lava domes representing the early phases of the Mexican Volcanic Belt, which in turn cover
Oligocene volcanic rocks of the southern Sierra Madre Occidental (Cerca-Martınez et al. 2000; Aguirre-Dıaz
and Lopez-Martınez 2001). The La Joya stratovolcano is particularly important because it marks the northern
end of the Taxco–San Miguel de Allende fault system. Valdez-Moreno et al. (1998) argue that this
Figure 1. Index map of the central part of the Mexican Volcanic Belt showing the main fault systems of this region: CTFS, Chapala–Tula FaultSystem; TSMA, Taxco–San Miguel de Allende Fault System; TSZ, Tenochtitlan Shear Zone. Towns: M, Mexico City; SJI, San Jose Iturbide;SJR, San Juan del Rıo; Ta, Taxco; SMA, SanMiguel de Allende; Zi, Zihuatanejo. Volcanoes: EZ, El Zamorano; LJ, La Joya; PH, Palo Huerfano.
Queretaro City is within the Queretaro graben. Location of Figure 2 is shown with outline square.
216 g. j. aguirre-dıaz ET AL.
Copyright # 2005 John Wiley & Sons, Ltd. Geol. J. 40: 215–243 (2005)

9.9� 0.4Ma volcano is not cut by this fault system in spite of being located along the trace of the NNW faults
(Figures 3 and 4), whereas 6.2� 0.6Ma basaltic–andesite lava plateaus that buried the southern flank of the La
Joya volcano are displaced by this faulting (Figure 4). That is, the 6.2Ma andesites are affected by this faulting, but
the older 9.9Ma stratovolcano is not. Based on these observations Valdez-Moreno et al. (1998) concluded that the
Taxco–San Miguel de Allende fault system ends before reaching this stratovolcano. In this respect, it would be
better named the Taxco–Queretaro fault system as Garcıa-Palomo et al. (2002a,b) have suggested, since this fault
system ends just to the north of the city of Queretaro, but because Taxco–San Miguel de Allende is a widely known
term, we prefer to retain it.
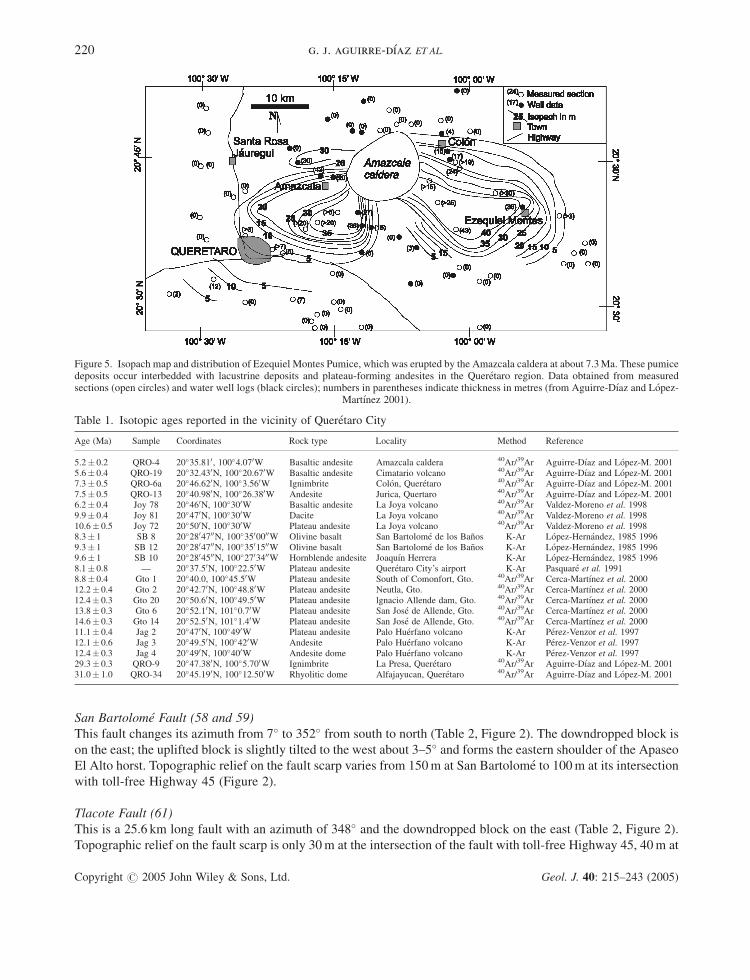
A stratigraphic marker of the region is the Ezequiel Montes Pumice, a plinian fallout deposit dated at about
7.3Ma (Aguirre–Dıaz and Lopez-Martınez 2001) that was erupted from the Amazcala caldera, which is 30 km
to the NE of Queretaro City (Figure 5). Other products of this caldera are ignimbrites and rhyolitic lava domes
with a more local distribution. To the south of Queretaro City volcanism is more diverse and includes several
ignimbrites and associated calderas with a 6–4Ma age range, Miocene andesitic volcanic complexes, and rela-
tively large rhyolitic lava domes (Aguirre-Dıaz 1996, 2001, 2004).
The sequence in the Queretaro area and vicinity is mostly characterized by a succession of plateau-forming lavas
with a basaltic andesite and andesitic composition, which commonly occur interbedded with the Ezequiel Montes
Pumice and fluvio-lacustrine deposits. The range in age of this sequence is from about 12Ma to 5Ma based on
reported radiometric dating of the lavas and pumice deposits (Table 1). The fluvio-lacustrine deposits are rather
Figure 2. Index map of the normal faults of Queretaro City and vicinity, showing the area of the Queretaro graben and the site of the Sanfandilaearthquakes of January–February 1998. Fault numbering corresponds to data of Table 2.
normal faulting in the mexican volcanic belt 217
Copyright # 2005 John Wiley & Sons, Ltd. Geol. J. 40: 215–243 (2005)

common and widespread, indicating the development of several palaeo-lakes during the Miocene–Pliocene in this
region that probably occurred individually at different times (Aguirre-Dıaz and Carranza-Castaneda 2000, 2001).
The origin of these basins and lakes was mostly controlled by normal faulting, as the lakes were formed within the
grabens associated with this faulting.
3. DESCRIPTION OF THE FAULTS OF QUERETARO CITYAND VICINITY
Mapping of the normal faults in the study area indicates two major sets with an orthogonal arrangement, NNW to
N and ENE to E (Figure 2). Both sets produced scarps that are visible in satellite images (Figure 3). The general
azimuth and length of each of the mapped faults are listed in Table 2, referring to the faults by the names and/or
numbers indicated in Figure 2. Fault traces were mapped on aerial photographs and then transferred to 1:50 000
topographic quadrangles that were used as base maps. The general azimuth and length were measured on these
topographic quadrangles. We made a final confirmation of most of the major faults by direct observation in the
field. We followed the right-hand rule in all fault measurements and descriptions. Therefore, fault azimuths are
given so that the dip direction of the fault is clockwise to the fault scarp.
Figure 3. Thematic Mapper satellite image of the Queretaro–San Juan del Rıo region (courtesy of C. Johnson). The main geological featuresmentioned in the text are indicated. Note the clear morphology of the NNWand ENE fault scarps north and south of Queretaro City. Figure 2 is
approximately the same scale as this image.
218 g. j. aguirre-dıaz ET AL.
Copyright # 2005 John Wiley & Sons, Ltd. Geol. J. 40: 215–243 (2005)
Alaniz-Alvarez et al. (2001, 2002) describe the faulting in this region using different fault names. To be con-
sistent with our systematic work and data-base of the area that date back to the early 1990s, and to avoid semantic
confusion, we prefer to use the nomenclature of Aguirre-Dıaz et al. (2000, 2003). Similarly, we follow the strati-
graphic nomenclature of earlier studies in the area by Aguirre-Dıaz (1996), Valdez-Moreno et al. (1998), Aguirre-
Dıaz and Lopez-Martınez (2000, 2001), and Cerca-Martınez et al. (2000).
3.1. The NNW set
From Figure 2 it can be observed that the NNW set includes the longest faults. From west to east these are the San
Bartolome Fault (24 km, fault no. 58–59), the Tlacote Fault (25.6 km, fault no. 61), the El Batan Fault (13.6 km,
fault no. 62–63), the Cinco de Febrero Fault (26.3 km, fault no. 65–66), and the Queretaro Fault (22.1 km, fault no.
67–68), which continues after a short gap to the south for another 19.5 km as the Huimilpan Fault (fault no. 69–70)
and therefore will be named the Queretaro–Huimilpan Fault. The Queretaro graben is bounded to the west by the
San Bartolome Fault and the northern part of the Tlacote Fault, and to the east by the Queretaro–Huimilpan Fault
that extends for 41.6 km (Figure 2).
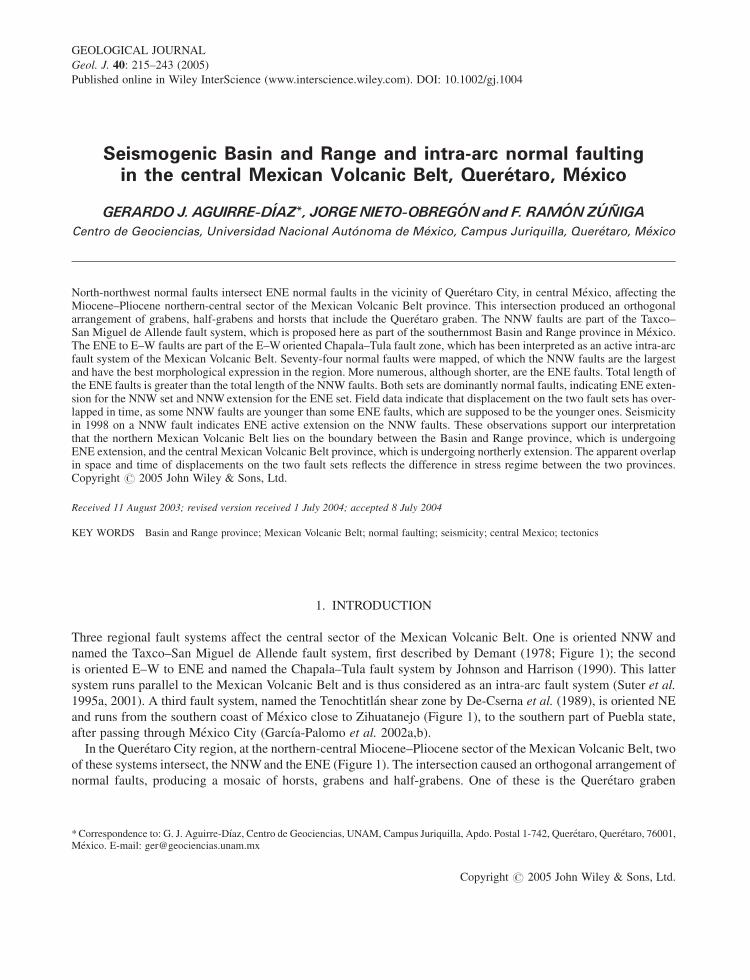
Figure 4. Simplified geological map of the Queretaro area showing the main volcanoes (Palo Huerfano, La Joya and San Pedro) and plateau-forming lava flows (mostly andesites) with ages from 12 to 5Ma according to Table 1 (modified fromValdez-Moreno et al. 1998). The line A–A0
indicates the location of the cross-section shown in Figure 6. SLP, San Luis Potosı.
normal faulting in the mexican volcanic belt 219
Copyright # 2005 John Wiley & Sons, Ltd. Geol. J. 40: 215–243 (2005)
San Bartolome Fault (58 and 59)
This fault changes its azimuth from 7� to 352� from south to north (Table 2, Figure 2). The downdropped block is
on the east; the uplifted block is slightly tilted to the west about 3–5� and forms the eastern shoulder of the Apaseo
El Alto horst. Topographic relief on the fault scarp varies from 150m at San Bartolome to 100m at its intersection
with toll-free Highway 45 (Figure 2).
Tlacote Fault (61)
This is a 25.6 km long fault with an azimuth of 348� and the downdropped block on the east (Table 2, Figure 2).
Topographic relief on the fault scarp is only 30m at the intersection of the fault with toll-free Highway 45, 40m at
Figure 5. Isopach map and distribution of Ezequiel Montes Pumice, which was erupted by the Amazcala caldera at about 7.3Ma. These pumicedeposits occur interbedded with lacustrine deposits and plateau-forming andesites in the Queretaro region. Data obtained from measuredsections (open circles) and water well logs (black circles); numbers in parentheses indicate thickness in metres (from Aguirre-Dıaz and Lopez-
Martınez 2001).
Table 1. Isotopic ages reported in the vicinity of Queretaro City
Age (Ma) Sample Coordinates Rock type Locality Method Reference
5.2� 0.2 QRO-4 20�35.810, 100�4.070W Basaltic andesite Amazcala caldera 40Ar/39Ar Aguirre-Dıaz and Lopez-M. 20015.6� 0.4 QRO-19 20�32.430N, 100�20.670W Basaltic andesite Cimatario volcano 40Ar/39Ar Aguirre-Dıaz and Lopez-M. 20017.3� 0.5 QRO-6a 20�46.620N, 100�3.560W Ignimbrite Colon, Queretaro 40Ar/39Ar Aguirre-Dıaz and Lopez-M. 20017.5� 0.5 QRO-13 20�40.980N, 100�26.380W Andesite Jurica, Quertaro 40Ar/39Ar Aguirre-Dıaz and Lopez-M. 20016.2� 0.4 Joy 78 20�460N, 100�300W Basaltic andesite La Joya volcano 40Ar/39Ar Valdez-Moreno et al. 19989.9� 0.4 Joy 81 20�470N, 100�300W Dacite La Joya volcano 40Ar/39Ar Valdez-Moreno et al. 199810.6� 0.5 Joy 72 20�500N, 100�300W Plateau andesite La Joya volcano 40Ar/39Ar Valdez-Moreno et al. 19988.3� 1 SB 8 20�2804700N, 100�3500000W Olivine basalt San Bartolome de los Banos K-Ar Lopez-Hernandez, 1985 19969.3� 1 SB 12 20�2804700N, 100�3501500W Olivine basalt San Bartolome de los Banos K-Ar Lopez-Hernandez, 1985 19969.6� 1 SB 10 20�2804500N, 100�2703400W Hornblende andesite Joaquın Herrera K-Ar Lopez-Hernandez, 1985 19968.1� 0.8 — 20�37.50N, 100�22.50W Plateau andesite Queretaro City’s airport K-Ar Pasquare et al. 19918.8� 0.4 Gto 1 20�40.0, 100�45.50W Plateau andesite South of Comonfort, Gto. 40Ar/39Ar Cerca-Martınez et al. 200012.2� 0.4 Gto 2 20�42.70N, 100�48.80W Plateau andesite Neutla, Gto. 40Ar/39Ar Cerca-Martınez et al. 200012.4� 0.3 Gto 20 20�50.60N, 100�49.50W Plateau andesite lgnacio Allende dam, Gto. 40Ar/39Ar Cerca-Martınez et al. 200013.8� 0.3 Gto 6 20�52.10N, 101�0.70W Plateau andesite San Jose de Allende, Gto. 40Ar/39Ar Cerca-Martınez et al. 200014.6� 0.3 Gto 14 20�52.50N, 101�1.40W Plateau andesite San Jose de Allende, Gto. 40Ar/39Ar Cerca-Martınez et al. 200011.1� 0.4 Jag 2 20�470N, 100�490W Plateau andesite Palo Huerfano volcano K-Ar Perez-Venzor et al. 199712.1� 0.6 Jag 3 20�49.50N, 100�420W Andesite Palo Huerfano volcano K-Ar Perez-Venzor et al. 199712.4� 0.3 Jag 4 20�490N, 100�400W Andesite dome Palo Huerfano volcano K-Ar Perez-Venzor et al. 199729.3� 0.3 QRO-9 20�47.380N, 100�5.700W Ignimbrite La Presa, Queretaro 40Ar/39Ar Aguirre-Dıaz and Lopez-M. 200131.0� 1.0 QRO-34 20�45.190N, 100�12.500W Rhyolitic dome Alfajayucan, Queretaro 40Ar/39Ar Aguirre-Dıaz and Lopez-M. 2001
220 g. j. aguirre-dıaz ET AL.
Copyright # 2005 John Wiley & Sons, Ltd. Geol. J. 40: 215–243 (2005)

Table 2. Azimuth and length of mapped faults
Fault number Fault name Azimuth (degree) Length (km)
1 lxtia 71 11.22 Ojo Zarco 75 4.33 La Estacada 77 1.44 San lgnacio 67 6.55 Jurica 86 7.26 El Salitre 86 8.97 90 2.38 San Jose El Alto 82 89 90 1.510 69 311 88 412 90 7.513 Menchaca 79 614 77 615 Sandarriaga 77 616 76 4.517 256 3.418 245 7.419 Escolasticas 255 22.420 248 221 255 3.422 248 2.123 San Cirilo 257 13.324 251 5.825 Dolores Ajuchitlancito 253 18.426 242 227 253 628 249 7.429 248 2.830 260 3.231 261 332 256 433 254 3.234 254 235 San Rafael 250 8.236 256 2.137 253 2.338 250 4.139 246 12.140 254 3.141 255 4.342 256 6.843 252 4.644 Lourdes 246 9.245 256 346 72 3.547 249 4.148 Cimacuatico 77 1349 Los Cues 76 10.850 Boliche 249 1.851 258 2.552 261 1.653 261 2.1
Continues
normal faulting in the mexican volcanic belt 221
Copyright # 2005 John Wiley & Sons, Ltd. Geol. J. 40: 215–243 (2005)

Balvanera, and 120m just to the south of Tlacote (Figure 2). The Tlacote Fault displaced two ENE-trending ande-
sitic dykes and an andesitic lava dome that are exposed on the fault scarp near Tlacote.
El Batan Fault (62 and 63)
This fault is 13.6 km long, with an azimuth between 339� and 348�, and the downdropped block on the east
(Table 2, Figure 2). The fault tilted the affected units of the uplifted block about 5� to the west. The topographic
relief of the fault scarp reaches 110m near Las Taponas (Figure 2). The best exposure of the fault can be observed
between San Rafael and El Batan (Figure 2). It is cross-cut by four ENE faults; two of them (44 and 64a, Figure 2)
apparently displaced the El Batan Fault. The other two ENE faults (40 and 35) were displaced by the El Batan Fault,
as they diminish their topographic fault scarp from the uplifted block of the El Batan Fault (west) to the down-
dropped block (east).
The Cinco de Febrero Fault (65 and 66)
This fault is 26.2 km long, with an azimuth of 162–171� (Figure 2, Table 2). The downdropped block lies to the
west. The fault displaced several faults of the ENE set and tilted blocks either to the south or to the north, but it was
also displaced by other ENE faults (14 and 50). For instance, faults 6, 72, and 52 end at their intersection with the
Cinco de Febrero Fault, and fault 5 decreases its topographic fault scarp passing from the eastern uplifted block of
the Cinco de Febrero Fault to the western dropped block (Figure 2). Just north of Queretaro City, at a sand quarry
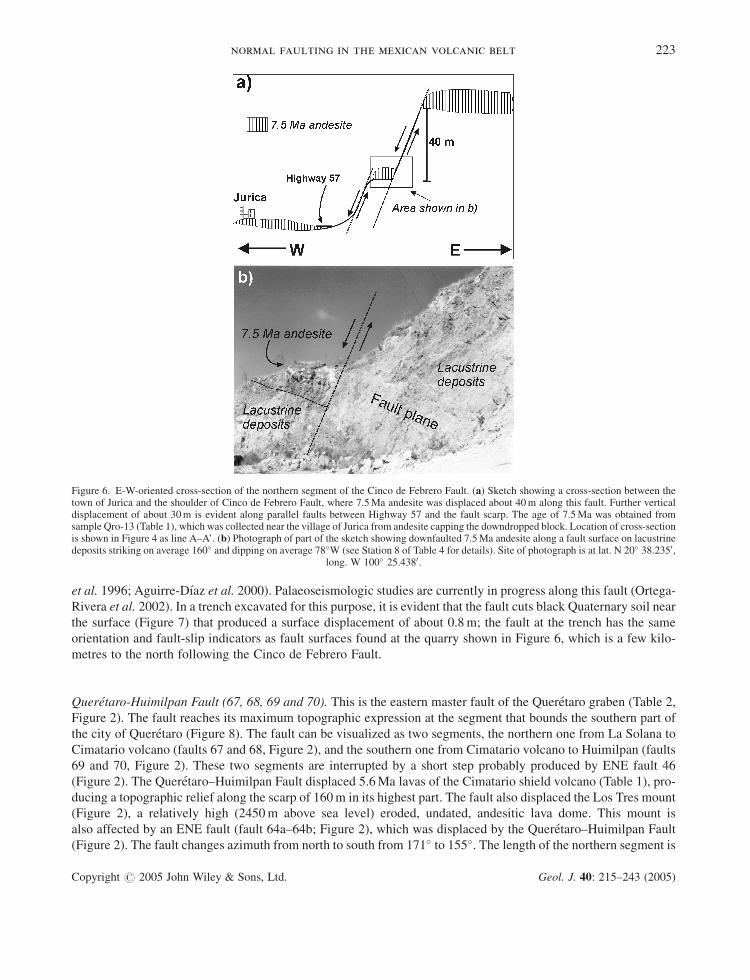
next to Highway 57, it is possible to measure a minimum vertical offset of about 40m in the Cinco de Febrero
Fault, based on a displaced andesite that caps the sequence (Figure 6). The Cinco de Febrero Fault affects the
western part of Queretaro City and has resulted in damage in the city’s constructions, including fractures and sub-
sidence on the pavement of Cinco de Febrero Avenue, which overlaps and runs parallel to the fault for several
kilometres. It is uncertain if this ground subsidence is due to slip along the fault, since there is no seismicity
reported on it. It is possible that the ground settling is due to differential compaction of the sediments accumulated
over the fault due to extraction of groundwater, similar to that reported in the other cities of central Mexico (Lermo
Table 2. Continued
Fault number Fault name Azimuth (degree) Length (Km)
54 Amazcala 261 5.455 San Vicente Ferrer 276 1056 346 4.857 Bravo 347 8.358 San Bartolome, north 352 1359 San Bartolome, south 7 1160 6 3.661 Tlacote 348 25.662 El Batan, north 339 7.663 El Batan, south 348 664a El Milagro, west 256 22.964b El Milagro, east 165 4.165 Cinco de Febrero, north 171 16.466 Cinco de Febrero, south 162 9.867 Queretaro, north 171 12.168 Queretaro, south 156 1069 Huimilpan, north 155 1470 Huimilpan, south 155 5.671 170 2.972 270 1.773 270 4.874 270 3.9
222 g. j. aguirre-dıaz ET AL.
Copyright # 2005 John Wiley & Sons, Ltd. Geol. J. 40: 215–243 (2005)
et al. 1996; Aguirre-Dıaz et al. 2000). Palaeoseismologic studies are currently in progress along this fault (Ortega-
Rivera et al. 2002). In a trench excavated for this purpose, it is evident that the fault cuts black Quaternary soil near
the surface (Figure 7) that produced a surface displacement of about 0.8m; the fault at the trench has the same
orientation and fault-slip indicators as fault surfaces found at the quarry shown in Figure 6, which is a few kilo-
metres to the north following the Cinco de Febrero Fault.
Queretaro-Huimilpan Fault (67, 68, 69 and 70). This is the eastern master fault of the Queretaro graben (Table 2,
Figure 2). The fault reaches its maximum topographic expression at the segment that bounds the southern part of
the city of Queretaro (Figure 8). The fault can be visualized as two segments, the northern one from La Solana to
Cimatario volcano (faults 67 and 68, Figure 2), and the southern one from Cimatario volcano to Huimilpan (faults
69 and 70, Figure 2). These two segments are interrupted by a short step probably produced by ENE fault 46
(Figure 2). The Queretaro–Huimilpan Fault displaced 5.6Ma lavas of the Cimatario shield volcano (Table 1), pro-
ducing a topographic relief along the scarp of 160m in its highest part. The fault also displaced the Los Tres mount
(Figure 2), a relatively high (2450m above sea level) eroded, undated, andesitic lava dome. This mount is
also affected by an ENE fault (fault 64a–64b; Figure 2), which was displaced by the Queretaro–Huimilpan Fault
(Figure 2). The fault changes azimuth from north to south from 171� to 155�. The length of the northern segment is
Figure 6. E-W-oriented cross-section of the northern segment of the Cinco de Febrero Fault. (a) Sketch showing a cross-section between thetown of Jurica and the shoulder of Cinco de Febrero Fault, where 7.5Ma andesite was displaced about 40m along this fault. Further verticaldisplacement of about 30m is evident along parallel faults between Highway 57 and the fault scarp. The age of 7.5Ma was obtained fromsample Qro-13 (Table 1), which was collected near the village of Jurica from andesite capping the downdropped block. Location of cross-sectionis shown in Figure 4 as line A–A’. (b) Photograph of part of the sketch showing downfaulted 7.5Ma andesite along a fault surface on lacustrinedeposits striking on average 160� and dipping on average 78�W (see Station 8 of Table 4 for details). Site of photograph is at lat. N 20� 38.2350,
long. W 100� 25.4380.
normal faulting in the mexican volcanic belt 223
Copyright # 2005 John Wiley & Sons, Ltd. Geol. J. 40: 215–243 (2005)

22.1 km, and the southern segment is 19.5 km, for a total of 41.6 km, making the Queretaro–Huimilpan Fault the
largest fault in the area. It has the downdropped block on the west, and is parallel to the Cinco de Febrero Fault. The
Queretaro–Huimilpan Fault displaced several smaller ENE faults, resulting in a complex mosaic of fault-bounded
blocks that formed a rough relief, particularly in the southern segment of the fault, between Huimilpan and
Cimatario volcano (Figures 2 and 3).
3.2. The ENE set
In number, the ENE faults are more abundant than NNW faults, in a proportion of 3.6 to 1. However, most of the
ENE faults are shorter, generally less than 3 km long, although some reach 22 km (e.g. fault 19), and many occur as
small faults between two large NNW faults, or as clusters (Figure 2). For practical reasons only the largest faults
and fault clusters are described here.
San Jose El Alto-Amazcala fault cluster
This cluster is located to the northeast of Queretaro City (Figure 2). It includes several faults that face either north
or south that formed small horsts and grabens. They are bounded to the north by two large faults that face north
Figure 7. Trench for palaeoseismologic studies on the Cinco de Febrero Fault, within the urban area of Queretaro City. Photograph of thesouthern wall of an east-west oriented trench, showing a Quaternary black soil overlying lake deposits (light colour), probably Pliocene in age,that were displaced by the Cinco de Febrero Fault, which strikes 160� and dips 85�W in this site. The fault makes a sharp tectonic contactbetween the lake deposits (white unit) and the black soil. Closer to the surface the fault branches upward into the Quaternary soil (Qt). The
surface is displaced about 80 cm along the fault. Site of photograph is located at lat. N 20� 36.1’, long. W 100� 24.90.
Figure 8. Panoramic view to the southwest of the Queretaro–Huimilpan Fault at Queretaro City. Note the relatively fresh fault scarp, which hasnot been eroded severely or cut by ravines, indicating that this fault scarp is relatively young. The uppermost unit on both sides of the fault isandesitic lava erupted by the Cimatario volcano at about 5.6Ma (samples Qro-19 and Qro-20, Table 1). Queretaro City has developed over this
fault and this may pose a serious risk to the population of this city.
224 g. j. aguirre-dıaz ET AL.
Copyright # 2005 John Wiley & Sons, Ltd. Geol. J. 40: 215–243 (2005)

(faults 55 and 73; Figure 2), and bounded to the south by three faults that face south (faults 6, 8 and 12; Figure 2),
both with a stepped arrangement from east to west. The San Jose El Alto shield volcano erupted a sequence of
basaltic andesites exposed along these faults. The lavas overlie the 7.3Ma Colon ignimbrite, which was derived
from the Amazcala caldera (Aguirre-Dıaz and Lopez-Martınez 2001). The westernmost fault of this cluster (fault
6; Figure 2) intersects the Queretaro–Huimilpan Fault. The height of the topographic scarp of fault 6 decreases
from east to west after intersecting the Queretaro–Huimilpan Fault, indicating that this fault displaced fault 6.
Similarly, at other intersections, other east-west faults are displaced by the NNW faults.
ENE faults in the vicinity of Obrajuelos, Tlacote and Jurica (1–6, 14, 50–53)
Several ENE faults occur near Obrajuelos, Tlacote and Jurica (Figure 2). Most of them are relatively short faults
(<3 km), and all those that intersect a NNW fault were displaced by it. For instance, faults 2–3 (Figure 2) are cut by
the NNW fault of San Bartolome (58), ENE fault 4 is cut by NNW fault 56, and many other ENE faults (5, 6, 14,
50–53) are cut by the NNW Cinco de Febrero fault (65). This is evident in the morphological expression of most of
the ENE faults at their intersection with the NNW faults, where the ENE faults either abruptly end, or change their
topographic fault scarp passing from one side to the other of the NNW fault. For instance, the topographic fault
scarp of the Jurica Fault decreases from about 150m to only 20m, passing from the uplifted block of the Cinco de
Febrero Fault to the downdropped block. This indicates that the Cinco de Febrero Fault displaced this, as well as
several other ENE faults that it cuts (Figure 2).
Sandarriaga Fault
This is an ENE fault, 6 km long with an average azimuth of 77�. The fault is downdropped to the south. The fault
cuts what appears to be Quaternary alluvium and soil. Several fault surfaces are exposed in a quarry near Sandar-
riaga (Figure 2) that mines the Ezequiel Montes Pumice. In the northern wall of this quarry, a fault surface of about
6� 10m is exposed (Figure 9a), with an azimuth of 77–84�, and dips of 80–85� to the SE. The striations indicate atleast three normal, superimposed displacements on the same fault surface, with pitches that vary from 85� to 110�.As we followed the right-hand rule, the rake or direction of these striations range from east (pitch¼ 0–90�) to west(pitch¼ 90–180�). The total measured displacement is 6m, based on the offset of layered pumice deposits of the
Ezequiel Montes Pumice (Figure 9b). Other minor ENE faults were observed at this site, with vertical displace-
ments of up to 1.5m. Also at this site, a SE-oriented fault, with a vertical offset of 4m, was displaced by the
Sandarriaga Fault, but the SE fault also displaced the minor ENE faults, suggesting that the ENE and SSE sets
moved alternately in different episodes but closely spaced in time.
The Sierra de Los Cues cluster
This is the largest cluster of the ENE set in the area. It affects the area to the south of Queretaro City, between
El Sauz and Huimilpan (Figure 2). The faults of this cluster are closely spaced and produced a range with rugged
relief with ENE-striking scarps visible in the satellite image (Figure 3). Most of the faults face to the north, produ-
cing a series of half-grabens with the downfaulted block toward Queretaro City. However, between these north-
facing faults there are some facing to the south, such as faults 48 and 49 (Figure 2), which produced the small
graben of Los Cues. Fault surfaces of fault 49 show strikes of 78–86� and a dips of 47–56�, with pitches of striae
indicating several movements along the fault; one group has pitches of 60�, others 68–71�, and another 95�.Recently formed fractures up to 50 cm wide (open) and parallel to this fault were observed on the downdropped
block, suggesting recent activation or land instability because of fault 49. The largest faults are the El Milagro Fault
(fault 64a–64b, Figure 2) with a length of 23 km, and the Escolasticas Fault (fault 19; Figure 2), 22.4 km long
(Table 2). There are many other faults with lengths over 10 km (faults 48, 49, 25, 23; Figure 2, Table 2). Many
ENE faults are cut by the NNW Huimilpan Fault (Figure 2). The ENE faults decrease their scarp height passing
from the uplifted block of the NNW fault to the downdropped block. The Sierra Los Cues cluster is abruptly inter-
rupted to the east by the NNW Sanfandila Fault (Figure 2), which is mostly buried by alluvium, but is clearly
normal faulting in the mexican volcanic belt 225
Copyright # 2005 John Wiley & Sons, Ltd. Geol. J. 40: 215–243 (2005)

marked by a lineament at the eastern end of Sierra Los Cues (Figure 3). This lineament coincides with the trace of
epicentres of several earthquakes that occurred in January and February of 1998 with magnitudes (Mw) up to 3.4
(Zuniga et al. 2003), shown in Figure 2. This confirms that a NNW-striking fault limits the Sierra Los Cues to the
east.
4. STRUCTURAL ANALYSIS
Structural analysis of the faults in the Queretaro City region was carried out on the basis of azimuth measurements
of the faults shown in Figure 2, as plotted in rose diagrams, and analysing the palaeostress directions from
Figure 9. Fault surface of the Sandarriaga Fault (fault no. 15; Figure 2). (a) Front view to the north of the fault surface showing well-preservedstriae with nearly vertical dip-slip and a small right-lateral component (see Station 9 of Table 4 for details). (b) Side view to the east of the samefault showing the main fault plane and secondary fault planes. The layered sequence is the Ezequiel Montes Pumice and interbedded deposits ofreworked pumice; based on these layered units, a vertical offset of 6m was measured. The uppermost layer, which is cut by the fault, is
unconsolidated alluvial deposits, probably Quaternary in age. Photograph was taken at lat. N 20� 38.50, long. W 100� 17.00.
226 g. j. aguirre-dıaz ET AL.
Copyright # 2005 John Wiley & Sons, Ltd. Geol. J. 40: 215–243 (2005)

fault-slip data. Two types of rose plots were used, namely the conventional plot that only takes into account the
frequency of faults with a particular orientation, and the DL plot, proposed here by us, which considers the fault
length factor as well as the fault orientation. Although this idea is not new, we emphasize the importance of the
fault length because it is clear from Figure 2 that the relatively few NNW- and SSE-oriented faults are very long,
and the relatively abundant ENE- and WSW-oriented faults are mostly very short.
The DL plot shows the concentration and orientation of the faults analyzed considering the length of the faults.
This is done by using theDL factor. TheDL factor is defined as the sum of the density (frequency) percentage (D%)
and length percentage (L%) of the faults. For each 90� quadrant:
DL ¼ ðD%þ L%ÞThe sum of all four 90� quadrants must be 200% because it includes two percentage ratios (D% and L%):
DLtotal ¼P4
n¼1 DLnð%Þ
where n is the number of quadrants.
The percentage of density–length for each quadrant is obtained by a simple proportion computation:
DLtotal
DLn¼ 100%
X%
where X% is the percentage of density–length.
Table 3 shows how DL was computed. For example, faults oriented to the SWare the most abundant in the area,
with an average strike of 255� (Table 3), and with a density D¼ 42, which is the number of faults bearing to the
SW, and a cumulative length L¼ 249.7 (km). D% equals D normalized to the total number of faults, where
Dtotal¼ 75, and therefore, D%¼ 42/75(100)¼ 56%. On the other hand, L% equals L normalized to the total
length of all faults, Ltotal¼ 502.8 (km); therefore, L%¼ 249.7/502.8 (100)¼ 50%. DL is the sum of D% and
L%; thus, for our example, DL¼ 106 (200%). Finally, our DL% equals DL multiplied by 100% and divided by
200%, because it is the sum of two percentages; that is, DL(100/200) expressed as a percentage and
DL%¼ 53%. Thus, 53% of all faults have a SW orientation, with an average azimuth of 255�.The conventional, unidirectional rose plot for frequency indicates a predominance of faults with strikes of 250–
260�, and a very restricted percentage of faults with strikes of 340–350� and 70–80� (Figure 10a). Based on this
diagram it is evident that there is a larger percentage of the ENE set with respect to the NNW set. In the DL rose
plot things do not change very much. The dominant fault orientation with an average azimuth of 250–260� repre-sents 53% of the total, followed by those with an average azimuth of 70–80� (NE-oriented) representing 19%; of
the remainder, 12% have an azimuth of 340–350� (NW-oriented) and 13% have an azimuth of 160–170� (SE-
oriented) (Figure 10b).
Due to the large differences of fault lengths between the NNW and the ENE sets, we originally expected that
these differences should be reflected in the DL plot. However, comparing the conventional frequency rose plot and
Table 3. DL data of Queretaro faults
Average Average strike D L (km) D% L% DL DL%azimuth (degree)
78 NE 78�SW 18 102.9 24 20 44 22163 SE 17�NW 8 74.9 11 15 26 13255 SW 75�NE 42 249.7 56 50 106 53343 NW 17�SE 7 75.3 9 15 24 12
Sum 75 502.8 100 100 200 100
D, Density, number of faults per quadrangle (NE, SE, SW, NW); L, length of faults (in km), sum per quadrangle; D%, L%, percentage of D, Lwith respective sum; DL, DL%, sum of Dþ L, and corresponding percentage with respective total.
normal faulting in the mexican volcanic belt 227
Copyright # 2005 John Wiley & Sons, Ltd. Geol. J. 40: 215–243 (2005)

Figure 10. Rose plots of the normal faults shown in Figure 2. (A) Conventional rose plot (unidirectional) showing the frequency of individualfaults on the basis of their orientation. (B) DL rose plot, where DL is the factor involving both the strike frequency (D) and the length (L) of the
fault. Each petal represents the mean strike of the faults per quadrant. See text for details.
228 g. j. aguirre-dıaz ET AL.
Copyright # 2005 John Wiley & Sons, Ltd. Geol. J. 40: 215–243 (2005)

theDL rose plot it can be noted that the dominant fault orientation does not change, even if the fault length factor is
considered. Both plots show that the predominant faults are those striking SW, and the least abundant are those
striking NWand SE, even if the latter are much longer than the NE–SW faults. The only observed changes are the
relative percentages of the fault orientations, which increase from the conventional plot to theDL plot; for instance,
the SW-striking faults change from 32% to 53%, the NW-striking faults from 5% to 12%, the NE-striking faults
from 9% to 22%, and the SE-oriented faults from 4% to 13%. These differences occur for two reasons. (1) The
petals of the DL plot represent the average orientation (unidirectional) of the faults in each quadrant. This means
that each of the four petals shown in the DL plot (Figure 10b) represent the sum of all the faults included in the
corresponding quadrant as shown in Table 3, whereas the petals in the conventional rose plot (Figure 10a) represent
individual faults, each with a particular orientation. This explains why the number of petals shown in the DL plot
(only four) does not match with the number of petals shown in Figure 10a (more than four). (2) The longer faults
striking NW and SE are few, whereas the shorter faults striking NE or SW are much more numerous. Thus, the
accumulated length of the NE and SW faults is much larger than that of the NW–SE faults (Table 3), and the ENE
set is proportionally larger in both frequency and total length than the NNW set.
The fault-slip data indicate that both the NNW and ENE sets have nearly 90� dip-slips, but the ENE faults, in
particular, consistently include a small horizontal component that can be either left- or right-lateral (see Table 4).
At most stations both NNW and ENE faults were observed, and in several cases the cross-cutting relationships
between the NNWand ENE sets indicate different faulting episodes. The NNW faults generally cut the ENE faults,
but the opposite also occurs, although less commonly (Figure 2). In some faults (e.g. Sandarriaga Fault, no. 15,
Table 2) surfaces are evident with up to three sets of striae, each with a different rake, but superimposed one over
another, indicating episodic displacements along the same fault.
The fault-slip data are summarized in equal-area stereonet projections (Table 4). Phi-values were calculated for
each data set following Charlesworth et al. (1988); phi ð½�2� �3�=½�1� �3�Þ, represents the tensor shape, and in
general has low to medium values (i.e. the difference �2� �3 is close to zero). This indicates that this area is
within an extensional tectonic regime (i.e. �1 ¼ �v, where �v¼ vertical stress), although with a low to moderate
extension, as has been mentioned by Suter et al. (2001) for the Mexican Volcanic Belt. These phi-values imply that
s2 and s3 may have permutated their directions, allowing reactivation of both sets of faults (NNW and ENE) at
different times, thus forming complex combinations of striae, with normal to oblique displacements.
Figure 11 shows the location of the measurement stations and the palaeostress orientations of each site. The case
of Station 1 (S1) does not show a plane with an orientation parallel to the major fault (NNW), since this particular
location is at a site where the fault makes a turn to the west, and thus the fault plane strikes SE (105–135�). Ingeneral, two main palaeostress directions are evident, ENE for the NNW set and NNW for the ENE set. Sites with
data of both sets, such as Station 3 (Table 4), show that NNW cut ENE, but the opposite also occurs at other sites.
Phi-values are relatively higher in the NNW faults, indicating near-vertical slip vectors, whereas the ENE faults
have generally lower phi-values, suggesting a more oblique slip direction.
Alaniz-Alvarez et al. (1998) have proposed that theoretically both the NNW faults of the Taxco–San Miguel de
Allende fault system and the E–W faults of the Chapala–Tula fault system can be active simultaneously if the
extension is perpendicular to both systems at the same time. However, other authors have interpreted these argu-
ments differently (Suter 1999; Contreras and Gomez-Tuena 1999; Siebe et al. 1999). The Aljibes half-graben
(Figure 1) is probably the only other place in the central Mexican Volcanic Belt where two orthogonal sets of inter-
secting normal faults have been studied in some detail (Suter et al. 1995b; Suter 1999). As in the case of Queretaro,
one set is oriented N–S and the other is oriented E–W. Suter et al. (1995b) conclude that these two sets apparently
were active in the Quaternary and explain that their activity may have been controlled by intermittent permutations
between the intermediate and least principal stresses, an interpretation that is supported by the low stress ratios
estimated in the central Mexican Volcanic Belt (Suter et al. 1995a,b; Suter 1999). For the particular case of Quer-
etaro, but possibly also for a wider region along the northern-central Mexican Volcanic Belt (including the Aljibes
half-graben), we propose that the least horizontal principal stress (Figure 11) was intermittently NNW or ENE,
because this area lies at the boundaries of two active stress provinces, the Basin and Range stress province and
the Mexican Volcanic Belt stress province (Suter 1991; Figure 12). Thus, NNW faults formed when the Basin and
normal faulting in the mexican volcanic belt 229
Copyright # 2005 John Wiley & Sons, Ltd. Geol. J. 40: 215–243 (2005)

Table
4.Summaryofkinem
atic
dataobtained
from
faultsurfaces
andstriae
Station
Faultno.a
Fault
Dip
Pitch
�1c
�2c
�3c
Phi(N
)dComments
Stereonet
strikeb
range
range
projectione
1.Lomas
del
Marques.
20� 36.6290 N
100� 22.3850 W
67(65–66)
105–135
81–90
——
——
This
locality
lies
within
thegeneral
trend
of
the
major
fault
65–66
between
La
SolanaandsouthernQueretaro,withthe
downdropped
block
tothewest.Although
few
datawereobtained,andnostriations
observed,fieldrelationsindicateatthissite
several
metres(atleast20m)ofnorm
aldisplacementoftheunitsaffected
bythis
fault.Thissiteislocatedontheroad
tothe
airport,on
theoutskirts
oftheelevated
mesato
theeast
ofthetraceofthemain
fault,wherethetraceofthefault
has
acurvature
totheNW.
2.Boliche
20� 37.1610 N
100� 24.7030 W
50
50–300
38–60
——
——
Fault50is
anorm
alfault,withan
almost
E–W
strike,
displacestheSSE
ElBatan
Fault.
Most
of
the
fault
planes
dip
predominantly
tothe
NE
atmoderate
anglesfrom
40�to
60� .Nostriationswere
observed
ontheseplanes.Thefew
mea-
surements
that
runparallelto
thegeneral
strikeoffault50,displace
faultsthat
are
parallelto
theSSE
trend.A
fault
gouge
30cm
inthicknesswas
observed
atthis
site.
3.Cim
acuatico
quarry
20� 30.7110 N
100�19.6120 W
69and48
245–275,
65–70,
165–187
72–87,
72–73,
65–88
65–100
047/47
296/18
191/38
0.71
(3)
Thesite
isneartheintersectionoftheSSE
Huim
ilpan
FaultandtheESEfaultandthe
ESEfault48.SeveralWSW
andESEfaults
arecutbySSEfaultsin
acomplexpattern
relatedtotheintersectionofbothsets.T
hese
dataallow
usto
postulate
that
extensionis
horizontal,orientedalmostN–S.Theinter-
mediateprincipalstressisinclined
insuch
away
asto
produce
obliqueslip
onthefault
planes:NW
faultplanes
dippingto
theNE
would
haveanorm
alleft-lateral
sense
of
motion,whileE–W
faultplanes
would
have
norm
alright-lateralsense
ofmotion.
230 g. j. aguirre-dıaz ET AL.
Copyright # 2005 John Wiley & Sons, Ltd. Geol. J. 40: 215–243 (2005)

4.ArroyoCerca
Grande.
20� 30.4810 N
100� 19.4280 W
49
35–246
47–84
60–95
180/84
279/01
010/06
0.7
(9)
Here
aclean
fault
surface
was
found,
several
metreswideonthesouthernslope
ofan
E–W
trendingridge.
Downdropped
block
isto
the
south.�1
isessentially
vertical,
while
�3
ishorizontalwith
aNNW
orientation,and�2is
almost
hor-
izontal.
These
data
clearly
allow
the
interpretationofanearlyN–S
extension
andanorm
alfault
pattern
withaslight
obliquecomponent.
5.Escolasticas
20� 25.5380 N
100� 13.3230 W
21
240–264
60–70
65–100
203/78
070/08
339/09
0.37
(12)
The
fault
affects
recentcolluvium
and
pumicedepositsoftheHuim
ilpan
tuff.�1
isalmostvertical,while�3ishorizontalin
aNNW
direction.Althoughseveral
direc-
tionsofmotionaresuggestedbythesedata,
they
very
consistently
pointtowards
aWSW
norm
alfaultplane,
dippingto
the
NNW
about60� ,
with
adowndropped
block
tothenorth.
6.San
Bartolome
20� 30.6430 N
100� 33.5660 W
59
346–351
48–76
Nostriationswerefoundonthisfault,but
measured
fault
surfaces
have
strikes
of
346–351�and
dipsof48–76� ,
with
the
downwardblock
totheeast.Hotsprings
are
common
along
the
fault
trace,
and
propilite
alteration
iscommon
inthe
surroundings.
Continues
normal faulting in the mexican volcanic belt 231
Copyright # 2005 John Wiley & Sons, Ltd. Geol. J. 40: 215–243 (2005)

Table
4.Continued
Station
Faultno.a
Fault
Dip
Pitch
�1c
�2c
�3c
Phi(N
)dComments
Stereonet
strikeb
range
range
projectione
7a.
Tlacote
quarry
inandesitedome
anddykes
20� 36.4680 N
100� 29.5370 W
61
320–353
60–83
60–120
298/70
165/14
071/14
0.6
(35)
The
faults
form
three
main
groups.
ANNW–SSEfaultsystem
show
aslip
striae
vectorplungingto
theNE,withvariable
pitch
orientations,
indicative
ofvarious
motions.
Asecond
group
of
faults
isoriented
totheNE
with
almost
vertical
dips,
these
have
slip
striae
vectorwith
variable
pitches
which
also
indicate
acomplexarrayofmotion.Thethirdgroup
offaultshave
anE–W
orENE–WSW
strike,
dippingN
andS,somewithalmost
horizontalstriae.This
coincides
withthe
orientationofdykes
ofandesitic
composi-
tion,whicharealmostperpendicularto
the
traceoftheTlacote
Fault.A
SEextension
isconsistentwithanorm
alobliquesense
of
motionalongtheTlacoteFault,whichruns
parallelto
thefirstgroup.Theother
group
probably
correspondsto
secondaryandor
conjugatefaultsystem
sreactivated
during
theform
ationofthegraben
orreactivated
bytheregional
E–W
system
described
inthetext.
7b.Tlacote
quarry
inandesitedome
20� 36.2980 N
100� 29.5190 W
61
236–353
60–66
74–115
111/80
345/06
254/08
0.44
(3)
Selectingonly
theNNW–SSEfaultgroup
dipping
northeasterly,
and
considering
only
those
faultswithslip
striae,aTaxis
oriented254� ,08�isobtained.Thedown-
dropped
block
totheNEis
evidentanda
norm
alfaultmechanism
isobtained.This
result
iscongruent
with
the
results
obtained
for
the
quarry
inlacustrine
sedim
entsforthesamefault(site7c).
232 g. j. aguirre-dıaz ET AL.
Copyright # 2005 John Wiley & Sons, Ltd. Geol. J. 40: 215–243 (2005)

7c.
Tlacote
quarry
inlacustrine
sedim
ents
20� 38.9310 N
100� 30.1220 W
61
153–353
76–84
74–77
249/70
145/05
081/19
0.31
(2)
Thearea
islocatedafew
kilometresto
the
northofsite
7a,in
aquarry
excavated
inlacustrineandtuffaceousdeposits.These
areaffected
byagroupofNNW
faultswith
strongdipstotheNE.Stresstensorindicates
aNEextensionwithadow
ndropped
block
totheNE.
8.Tremec
quarry
inpre-7.5Ma
lacustrine
sedim
ents
20� 38.2350 N
100� 25.4380 W
65
105–135,
145–146,
207
81–90,
71–73,
60
87,
90–107,
140–156
179/80
323/08
054/06
0.54
(14)
SE
faultsdipping
SW
predominate
with
slickensidestriationsindicativeofnorm
alfaultingandasm
allright-lateralcomponent,
withdow
ndropped
block
totheSW,con-
gruentwithgeomorphicfeaturesobserved
inthefieldandairphotographs.Obliquefaults
striking207�arecutbytheSEfaults.Tensor
fitsperfectly
wellwiththepostulatedE–W
extension.
9.Sandarriaga
quarry
inEzequiel
MontesPumice
20� 38.5100 N
100� 16.9910 W
15
68–84,
90–55,
68–50,
135
80–85,
66–70,
73–71
85–90,
99,
105
257/59
074/31
165/01
0.2
(7)
AnENEfaultcropsoutinaquarryexcavated
inthe
pyroclastic
products
of
Ezequiel
MontesPumice.
HereasetofNEto
ENE
faultplanes
iswellexposedonthewallsof
thequarry.Thefaultsdip
strongly
totheSE,
andhavewell-preserved
faultstriationswith
distinctpitches
indicatingseveralmotionson
thesamefault
surface.
Theseconsistently
indicate
adominantly
norm
alsense
of
motion
with
asm
allright-
orleft-lateral
component.T
axis
isorientedalmost
due
south
withasm
allplunge(173� /22� ).Paxis
(�1),is
nearlyvertical,while�2is
nearly
horizontal.Againan
almostN–Sdirectionof
extension
isdeduced
by
the
kinem
atic
indicators.
aRefersto
thenumberingshownin
Figure
2.
bMeasuredonthefaultplane.Eachlineofdatacorrespondsto
samelinein
dip
andpitch.
cStresstensoraxes
obtained
followingAngelier(1990).
dTensorshape:
phi¼
(�2��3)/(�1��3),N¼number
offaultplanes.CalculatedfollowingCharlesw
orthet
al.(1988).
eLower
hem
ispherestereonet
projection.Symbols*,Paxis¼�1;^
,N
axis¼�2;&,Taxis¼�3.
normal faulting in the mexican volcanic belt 233
Copyright # 2005 John Wiley & Sons, Ltd. Geol. J. 40: 215–243 (2005)

Range stress regime was activated, and ENE faults formed when the Mexican Volcanic Belt intra-arc stress regime
was activated. These two stress provinces overlap at the Queretaro area, so there are NNW faults cutting the ENE
faults and vice versa.
5. SEISMICITYAT SANFANDILA DURING JANUARY–FEBRUARY 1998
An earthquake sequence occurred during January–February 1998 at the small community of Sanfandila, located
about 20 km southeast of the city of Queretaro (Figure 2). The sequence started abruptly and lasted for several days
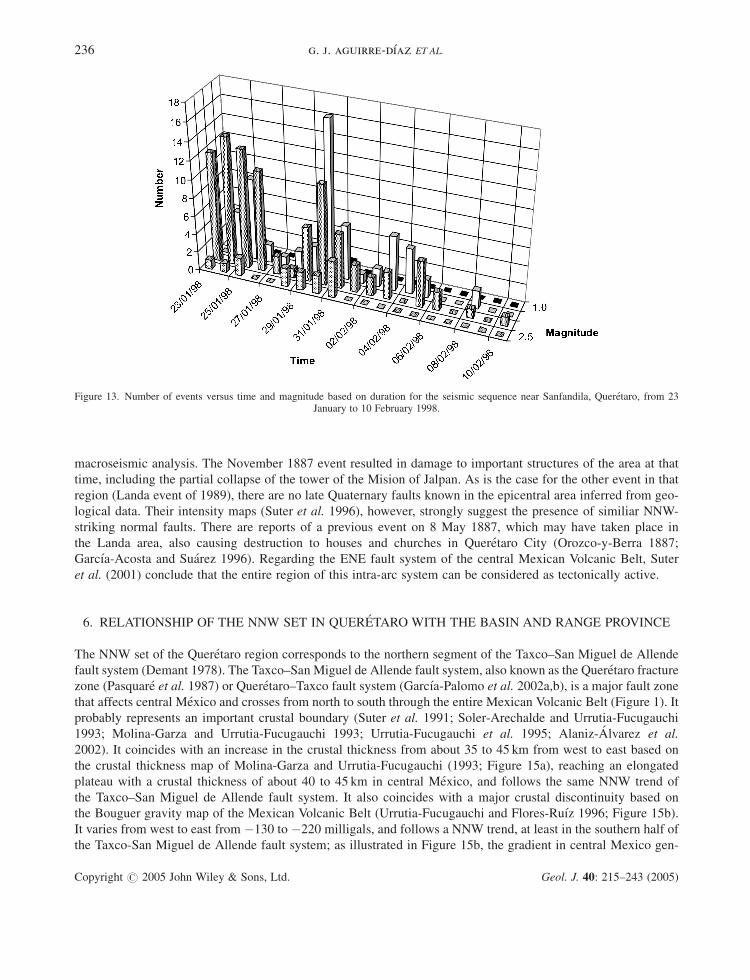
without a typical mainshock–aftershock pattern (Figure 13). The largest event took place on 29 January, reaching a
magnitude of Mw¼ 3.4 (J. Lermo, personal communication). At least four other events exceeded magnitudes of
2.9 (Figure 13). To our knowledge this is the only seismic activity reported in the area during historical times.
Between 18 January and 10 February over 200 small events were registered by a local network installed by the
National Seismological Survey of Mexico, 179 of which were suitable for locating as well as assigning a magni-
tude based on duration. Seismological details of this earthquake swarm and a description of the method of analysis
Figure 11. Index map of the stations (S1, S2, S3 . . . ), where fault-slip data were measured, which correspond to data summarized in Table 4.Each station with striae data shows the corresponding stress tensor model plotted on an equal-area projection (black circle, �1; black diamond,�2; black square; �3). Also shown for comparison is the focal mechanism of the Sanfandila 1998 earthquake indicating active ENE extension.
Black arrows indicate the minimum horizontal stress direction for each station (sigma 3 of Table 4).
234 g. j. aguirre-dıaz ET AL.
Copyright # 2005 John Wiley & Sons, Ltd. Geol. J. 40: 215–243 (2005)

are presented by Zuniga et al. (2003). Here, we discuss the major implications of the swarm with respect to the
structural data.
The epicentres of these events are shown in Figure 14a and b. Most epicentres follow a line trending approxi-
mately 340�. Depths of the events range between 3.5 and 5.5 km, and define a plane dipping approximately 75�E(Figure 14c). Inversion analyses were carried out on five of the largest earthquakes suitable for waveform model-
ling by a grid search inversion giving basically the same focal pattern for each one (Table 5). Focal parameters of
the five events give a mean azimuth of 334� 3� for the fault plane and a mean dip of 82� 6�. The event of 29
January 1998 could not be modelled because of the complexity of the waveforms, but many smaller events showed
a remarkable similarity in their signal with respect to those which could be inverted, indicating that their mechan-
ism was also similar. As seen in Figure 14c, the hypocentre locations and fault geometry of the events analysed
indicate a seismically active segment of a NNW fault, which follows the same trend of other faults of the NNW set.
Other events that have been reported to take place in fault systems of similar characteristics to those of
Sanfandila, and that occurred near Queretaro City, are the Pinal de Amoles earthquake of 26 November 1887,
for which a magnitude of Mb¼ 5.3 has been estimated based on reported intensities; the Ixmiquilpan event of
10 March 1950 (Mb¼ 4.9); the Cardonal event of 25 March 1976 (Mb¼ 5.3); the Actopan event of 27 January
1987 (Mb¼ 4.1); and the Landa event of 10 September 1989 (Mb¼ 4.6), for which Suter et al. (1996) provided a
Figure 12. Regional stress province map of Mexico (after Suter 1991). Note that the study area lies on the boundary of the stress provinces ofthe southern Basin and Range and of the Mexican Volcanic Belt (TMVB), which is the cause of the overlapping stess regimes, with extensionoriented NNW (ENE faults) and ENE (NNW faults) in the Queretaro area. G, Gulf of California stress province; GC, Gulf Coast stress province;GVA, stress province of the Guatemalan volcanic arc; IP, Ipala stress province; SGP, Southern Great Plains stress province; TMVB, stress
province of the Trans-Mexican Volcanic Belt.
normal faulting in the mexican volcanic belt 235
Copyright # 2005 John Wiley & Sons, Ltd. Geol. J. 40: 215–243 (2005)
macroseismic analysis. The November 1887 event resulted in damage to important structures of the area at that
time, including the partial collapse of the tower of the Mision of Jalpan. As is the case for the other event in that
region (Landa event of 1989), there are no late Quaternary faults known in the epicentral area inferred from geo-
logical data. Their intensity maps (Suter et al. 1996), however, strongly suggest the presence of similiar NNW-
striking normal faults. There are reports of a previous event on 8 May 1887, which may have taken place in
the Landa area, also causing destruction to houses and churches in Queretaro City (Orozco-y-Berra 1887;
Garcıa-Acosta and Suarez 1996). Regarding the ENE fault system of the central Mexican Volcanic Belt, Suter
et al. (2001) conclude that the entire region of this intra-arc system can be considered as tectonically active.
6. RELATIONSHIP OF THE NNW SET IN QUERETARO WITH THE BASIN AND RANGE PROVINCE
The NNW set of the Queretaro region corresponds to the northern segment of the Taxco–San Miguel de Allende
fault system (Demant 1978). The Taxco–San Miguel de Allende fault system, also known as the Queretaro fracture
zone (Pasquare et al. 1987) or Queretaro–Taxco fault system (Garcıa-Palomo et al. 2002a,b), is a major fault zone
that affects central Mexico and crosses from north to south through the entire Mexican Volcanic Belt (Figure 1). It
probably represents an important crustal boundary (Suter et al. 1991; Soler-Arechalde and Urrutia-Fucugauchi
1993; Molina-Garza and Urrutia-Fucugauchi 1993; Urrutia-Fucugauchi et al. 1995; Alaniz-Alvarez et al.
2002). It coincides with an increase in the crustal thickness from about 35 to 45 km from west to east based on
the crustal thickness map of Molina-Garza and Urrutia-Fucugauchi (1993; Figure 15a), reaching an elongated
plateau with a crustal thickness of about 40 to 45 km in central Mexico, and follows the same NNW trend of
the Taxco–San Miguel de Allende fault system. It also coincides with a major crustal discontinuity based on
the Bouguer gravity map of the Mexican Volcanic Belt (Urrutia-Fucugauchi and Flores-Ruız 1996; Figure 15b).
It varies from west to east from �130 to �220 milligals, and follows a NNW trend, at least in the southern half of
the Taxco-San Miguel de Allende fault system; as illustrated in Figure 15b, the gradient in central Mexico gen-
Figure 13. Number of events versus time and magnitude based on duration for the seismic sequence near Sanfandila, Queretaro, from 23January to 10 February 1998.
236 g. j. aguirre-dıaz ET AL.
Copyright # 2005 John Wiley & Sons, Ltd. Geol. J. 40: 215–243 (2005)

erally has a N–S variation with contour lines oriented E–W, but at the zone of the Taxco–San Miguel de Allende
line, the gradient shows a NE–SW trend, with contour lines oriented NNW. Finally, it also coincides with an
increase in the average elevation in the topography, from about 1800–2000m above sea level (m a.s.l.) in the west
to about 2300–2500 m a.s.l. in the east (Figure 15c). These observations suggest that the Taxco–San Miguel de
Allende fault system is a major fault zone that affects great depths in the crust (>30 km), and that it may indeed
represent an important crustal discontinuity zone in central Mexico. Suter et al. (1991) mentioned that an east–west
Figure 14. Epicentre and hypocentre location of the events registered from January and February 1998 near Sanfandila (a) Location map ofepicentres. Focal mechanisms determined from waveform inversion analyses (Table 5) are shown for five of the most representative events. Forreference, the traces of faults 49 and 69 are indicated by a dashed line. Line A–B shows the location of the depth profile. Triangles areseismograph stations. (b) Enlarged view of the focal mechanisms in order to visualize better the data used (dots) (c) Profile along line A–B (no
vertical exaggeration).
normal faulting in the mexican volcanic belt 237
Copyright # 2005 John Wiley & Sons, Ltd. Geol. J. 40: 215–243 (2005)

change in faulting style along the Acambay graben (Figure 1) may be due to a major discontinuity in the crust with
a NNW orientation that crosses the Acambay graben and coincides with the NNW-striking Perales Fault that lies
to the south of the Acambay graben (Figure 1), and that it forms part of the Taxco–San Miguel de Allende fault
system.
The Taxco–San Miguel de Allende fault system has been related to the Basin and Range extensional province by
Pasquare et al. (1988, p. 362), who mention that the central Mexican Volcanic Belt could be interpreted as ‘the
southern protraction of the Basin and Range Province of the western United States’. We support this idea and there-
fore consider that the NNW set at Queretaro City and vicinity is also part of this province. However, neither Henry
and Aranda-Gomez (1992) nor Stewart (1998) included the Taxco–San Miguel de Allende fault system in the
Mexican portion of the Basin and Range province, but included the Oaxaca Fault, which is farther to the south
of the Mexican Volcanic Belt. Henry and Aranda-Gomez (1992, p. 702) state that the faulting observed within
the central Mexican Volcanic Belt ‘is no longer part of the (Basin and Range) extensional province’. They excluded
the Mexican Volcanic Belt because they considered that the ENE extension that occurred between 15 and 5Ma
in the central Mexican Volcanic Belt was preceded by E–W shortening and was followed by Pliocene strike-slip
faulting related to the plate tectonics offshore Mexico, concluding that extending the Basin and Range province
south of the Mexican Volcanic Belt was speculative.
Stewart (1998) included in the Basin and Range province only the western part of the Mexican Volcanic Belt, in
what he named ‘the Western Mexican Volcanic Belt’, which includes the states of Nayarit, Jalisco, northern
Michoacan and southern Guanajuato, but excludes Queretaro state. In another study, Stewart et al. (1998) compiled
a map showing in detail the Cenozoic faults and associated tilting of the Basin and Range province that includes
some of the major NNW faults of Queretaro. Aguirre-Dıaz and McDowell (1993) show a sketch map of the Basin
and Range province that includes the Taxco–San Miguel de Allende fault system, and Luhr et al. (2001) present a
Basin and Range province affecting the central-northern portion of the Mexican Volcanic Belt, that apparently
corresponds with the NNW set of Queretaro.
As shown above, there are discrepancies on where to draw the southern limit of the Basin and Range extensional
province. However, this is only considering the spatial limits of this province. The problem becomes more complex
in attempting to define its temporal limits. When did the Basin and Range extensional deformation initiate and
when did it stop? Apparently there is no agreement on this. Faults associated with the Mexican Basin and Range
province occurred as early as 32–29Ma (Gross 1975; Lang et al. 1978; Aguirre-Dıaz and McDowell 1993;
Aranda-Gomez et al. 2000), or probably even earlier, at 49Ma (Aranda-Gomez and McDowell 1998). Aranda-
Gomez et al. (2000) summarized the most noticeable Cenozoic faulting episodes that affected NW Mexico,
and they mention four major extensional deformation pulses, 32–27Ma, 24–20Ma, 12–10Ma and<5Ma; because
these pulses were accompanied by important volcanic manifestations, they called them tectono-magmatic pulses.
Aguirre-Dıaz and Labarthe-Hernandez (2003) concluded that Basin and Range faulting and large-volume silicic
ignimbrite eruptions coincided in space and time, from at least 38Ma to 23Ma, but Basin and Range faulting could
be as old as Eocene (Aranda-Gomez and McDowell 1998), and as young as Quaternary (Suter 2000a,b; Zuniga
et al. 2003; Aranda-Gomez et al. 2003). Thus, normal faulting has been occurring in NWMexico, Basin and Range
province included, from at least 32Ma until the Pliocene or even later, as episodic events, whose intensity system-
atically changed from place to place and from time to time (Aranda-Gomez et al. 2000).
Table 5. Earthquake source parameters of best fit solutions from the Sanfandila sequence
Date Time Lat. N Long. W h Mw ’ � �
Jan. 23, 1998 4:56 �100.190 20.525 4.8 2.9 333 89 �108Jan. 23, 1998 5:16 �100.190 20.526 4.8 2.2 338 76 �91Jan. 23, 1998 6:53 �100.192 20.526 4.8 2.0 331 87 �98Jan. 25, 1998 9:57 �100.188 20.515 5.2 3.0 332 79 �89Feb. 5, 1998 22:33 �100.187 20.515 5.6 2.5 334 80 �87
Mw¼moment magnitude; ’¼ strike; �¼ dip; �¼ rake; h¼ depth (km).
238 g. j. aguirre-dıaz ET AL.
Copyright # 2005 John Wiley & Sons, Ltd. Geol. J. 40: 215–243 (2005)

Figure 15. Three effects of the Taxco–San Miguel de Allende fault system in the crust of central Mexico. (a) Crustal thickness map of Mexico(after Molina-Garza and Urrutia-Fucugauchi 1993) showing a crustal thickness change of 35 to about 45 km along the Taxco–San Miguel faultsystem. Inset rectangle represents the area shown in b and c. (b) Bouguer gravity anomaly map of the central sector of the Mexican Volcanic Belt(from Urrutia-Fucugauchi and Flores-Ruız 1996), showing a gradient along the Taxco–San Miguel de Allende fault system. Outlined is the areaaffected by this system. See text for details. Q, Queretaro-City; T, Taxco. (c) Average topography in central Mexico (after Urrutia-Fucugauchiand Flores-Ruız 1996) showing that average elevations are higher to the east of the Taxco–San Miguel de Allende fault system than to the west.
normal faulting in the mexican volcanic belt 239
Copyright # 2005 John Wiley & Sons, Ltd. Geol. J. 40: 215–243 (2005)

There is evidence that some Basin and Range faults of central-eastern and northern Mexico were active during
the Quaternary (Suter 1991, 2000a,b; Suter et al. 1996; Aranda-Gomez et al. 2003). A compilation of faults with
evidence of Quaternary activity can be found in the tectonic map on active normal faulting (Ferrari et al. 2005).
The fault information on these studies suggests that at least the northern half of Mexico (i.e. north of the Mexican
Volcanic Belt) is still under an extensional stress regime. In other words, following the presumed initiation of Basin
and Range extension at about 32–29Ma, when the East Pacific Rise collided with North America (Atwater 1989),
the stress regime in northern Mexico has been practically the same (Suter 1991), including the opening of the
proto-Gulf of California, which can be considered as an especially intense case of the Basin and Range extensional
regime (Henry and Aranda-Gomez 2000). There has not been another important orogeny, either extensional or
compressional, affecting northern Mexico besides that of the Basin and Range, and the particular case of the cur-
rent Pacific–North America plate boundary occurring at the Gulf of California (Stock and Hodges 1989; Atwater
and Stock 1998).
Suter (1991) has already noted that some Basin and Range faults in northern Mexico can be related to impor-
tant seismicity. Examples include the 1887 earthquake in Sonora, with Mw¼ 7.4 (Natali and Sbar 1982) and,
closer to Queretaro City, the 1887 earthquake of Pinal de Amoles, Queretaro, with MI¼ 5.3 (Suter et al. 1996).
These events can be attributed to older Basin and Range faults that were recently reactivated (Suter 2000a,b).
As mentioned earlier, the NNW set of the Queretaro City region has evidence of recent fault activity, such as
fresh-looking fault scarps, the seismicity in January–February 1998 along the Sanfandila Fault, Quaternary soil
or alluvium displaced by faulting, and the cross-cutting relationships with the ENE set, which is part of an
undoubtedly active fault system (Suter et al. 1995a,b, 2001; Langridge et al. 2000). Similarly, the seismically
active faults of Sonora and of Pinal de Amoles in the state of Queretaro, the NNW set of Queretaro City and
vicinity, are also regarded here as old faults of the Basin and Range province that were recently reactivated.
Apparently this reactivation occurred only in the northernmost portion of the Taxco–San Miguel de Allende
fault system, as there are no known reports of seismicity in the southern part of it. Faulting was concentrated on
the Taxco–San Miguel de Allende fault system because it probably is a crustal weakness zone or a crustal dis-
continuity, as discussed above (Figure 15).
Palaeoseismicity studies similar to those carried out at Acambay graben (Langridge et al. 2000) are currently in
progress on some of the NNW faults that affect Queretaro City (Ortega-Rivera et al. 2002), and monitoring for
microseismic activity on some of these faults has just started in the Queretaro City area and vicinity (Gomez et al.
2002a,b). These new studies will help our understanding of the recent seismological history of these faults.
7. CONCLUSIONS
Two regional fault systems intersect at Queretaro City and vicinity, the NNW Taxco–San Miguel de Allende fault
system and the ENE to E–W Chapala–Tula fault system. Both systems consist of normal faults. The NNW system
is considered part of the southern Basin and Range extensional province, and the ENE fault system is interpreted as
an intra-arc fault system of the Mexican Volcanic Belt. The intersection of these fault systems at the Queretaro
City region has produced an orthogonal arrangement of horsts, grabens and half-grabens, including the Queretaro
graben.
Seventy-four normal faults were mapped. The structural data indicate a predominance of ENE faults (75%), and
relatively minor NNW faults (25%) However, the longest faults strike NNW, with individual lengths of up to
26 km. The fault-slip data show vertical slips in the NNW system, and mostly vertical slips, but with a minor right-
or left-lateral component, in the ENE faults.
From 18 January to 10 February 1998 over 200 earthquakes occurred near Sanfandila, about 20 km SE of
Queretaro City. The earthquakes had a maximum magnitude of Mw< 3.4, and occurred at depths between
3.5 and 5.5 km. The focal analysis of these earthquakes indicates that the seismicity was related to movement along
a NNW fault striking 334� and dipping on average 82.2� to the east. Similar events have occurred in a region east of
the studied area in the historic past, but this sequence is the only activity reported for the area.
240 g. j. aguirre-dıaz ET AL.
Copyright # 2005 John Wiley & Sons, Ltd. Geol. J. 40: 215–243 (2005)

The NNW faults of the Queretaro region displaced the relatively young ENE faults, which are active in nearby
grabens within the Mexican Volcanic Belt. The NNW Sanfandila Fault showed incipient but tectonic seismicity in
1998. Therefore, the NNW-SSE faults of this area are interpreted as reactivated older Basin and Range faults. This
indicates that extension is still active in the southern Basin and Range province.
ACKNOWLEDGEMENTS
We appreciate the in-depth reviews and comments of Christopher D. Henry and Joann M. Stock that helped to
substantially improve the final version of the manuscript, and to R.K. Pickerill for taking the time to edit this work.
We also thank Roberto Molina-Garza, Luis Delgado-Argote, Rafael Barboza, Francis Albarede, R. Keller, and
Robert Langridge for their comments on earlier versions of this work. We are grateful to Jose Rosas Elguera
for helping us with the calculation of phi-values. We also thank Vicente Avila-Duran and Javier Carrasco-
Hernandez for their help during the field work. Marco Guzman-Speziale and Emilio Nava assisted us in plotting
some of the figures and with the seismological field work. This work was supported by the Direccion General de
Asuntos del Personal Academico of the Universidad Nacional Autonoma de Mexico (UNAM), grants IN120999
and IN115302 to the first author, and by the Consejo Nacional de Ciencia y Tecnologıa (CONACYT), grant No.
33084-T to the first author.
REFERENCES
Aguirre-Dıaz GJ. 1996. Volcanic stratigraphy of the Amealco caldera and vicinity, Central Mexican Volcanic Belt. Revista Mexicana deCiencias Geologicas 13: 10–51.
Aguirre-Dıaz GJ. 2001. Calderas of the central Mexican Volcanic Belt. Eos Transactions American Geophysical Union 82: F1350.Aguirre-Dıaz GJ. 2004. Ignimbrites and calderas of the central sector of the Mexican Volcanic Belt. In Neogene-Quaternary Continental
Margin Volcanism—Proceedings of the GSA Penrose Conference at Mepetec, Puebla, Mexico 2004, Aguirre-Dıaz G, Macıas JL, Siebe, C(eds). Publicacion Especial 2. Universidad Nacional Autonoma de Mexico, Instituto de Geologıa.
Aguirre-Dıaz GJ, Carranza-Castaneda O. 2000. Oligo-Miocene basins of central-northern Mexico and the misinterpretation of theirsedimentary fill as Quaternary alluvium. 60the Annual Meeting of the Society of Vertebrate Paleontology. Abstracts of Papers 25A.
Aguirre-Dıaz GJ, Carranza-Castaneda O. 2001. Los grandes lagos del Mioceno-Plioceno contemporaneos al desarrollo del CinturonVolcanico Mexicano. VI Reunion Nacional de Geomorfologıa. Sociedad Mexicana de Geomorfologıa A.C., Instituto de Geografia, UNAM.Resumenes 1.
Aguirre-Dıaz GJ, Labarthe-Hernandez G. 2003. Fissure ignimbrites: Fissure-source origin for voluminous ignimbrites of the Sierra MadreOccidental and its relationship with Basin and Range faulting. Geology 31: 773–776.
Aguirre-Dıaz GJ, Lopez-Martınez M. 2000. La caldera de Apaseo, Guanajuato. Geologıa y geocronologıa de una nueva caldera en el sectorcentral del Cinturon Volcanico Mexicano. Union Geofisica Mexicana Geos 20: 308–309.
Aguirre-Dıaz GJ, Lopez-Martınez M. 2001. The Amazcala caldera, Queretaro, central Mexican Volcanic Belt, Mexico. Geology andgeochronology. Journal of Volcanology and Geothermal Research 111: 203–218.
Aguirre-Dıaz GJ, McDowell FW. 1993. Nature and Timing of faulting and syn-extensional magmatism in the southern Basin and Range,central-eastern Durango, Mexico. Geological Society of American Bulletin 105: 1435–1444.
Aguirre-Dıaz GJ, Zuniga FR, Pacheco FJ, Guzman-Spezialle M, Nieto-Obregon J. 2000. El graben de Queretaro, Mexico. Observacionesde fallamiento activo. Union Geofisica Mexicana Geos 20: 2–7.
Aguirre-Dıaz GJ, Nieto-Obregon J, Zuniga R. 2003. The Queretaro graben: Basin and Range faulting in the central-northern portion of theMexican Volcanic Belt. Cordilleran Section Annual Meeting. The Geological Society of America. Abstracts with Programs 35: 57.
Alaniz-Alvarez SA, Nieto-Samaniego AF, Ferrari L. 1998. Effect of strain rate in the distribution of monogenetic and polygenetic volcanismin the Trans-mexican Volcanic Belt. Geology 26: 591–594.
Alaniz-Alvarez SA, Nieto-Samaniego A, Reyez-Zaragoza MA, Orozco-Esquivel T, Ojeda-Garcıa AC, Vassallo LF. 2001. Estratigrafia ydeformacion extensional en la region de San Miguel de Allende-Queretaro, Mexico. Revista Mexicana de Ciencias Geologicas 18: 129–148.
Alaniz-Alvarez SA, Nieto-Samaniego A, Reyez-ZaragozaMA, Orozco-Esquivel T, Ojeda-Garcıa AC, Vassallo LF, Shunshan X. 2002. Elsistema de fallas Taxo-San Miguel de Allende: implicaciones en la deformacion post-eocenica del centro de Mexico. Boletın de la SociedadGeologica Mexicana 55: 12–29.
Angelier J. 1990. Inversion of field in fault tectonics to obtain the regional stress- III. A new rapid direct inversion method by analytical means.Geophysical Journal International 103: 363–376.
normal faulting in the mexican volcanic belt 241
Copyright # 2005 John Wiley & Sons, Ltd. Geol. J. 40: 215–243 (2005)

Aranda-Gomez JJ, McDowell FW. 1998. Paleogene extension in the southern Basin and Range province of Mexico: Syndepositional tilting ofEocene red beds and Oligocene volcanic rocks in the Guanajuato Mining District. International Geology Review 40: 116–134.
Aranda-Gomez JJ, Henry CD, Luhr JF. 2000. Evolucion tectonomagmatica post-paleocenica de la Sierra Madre Occidental y de la porcionmeridional de la provincia tectonica de Cuencas y Sierras, Mexico. Boletın de la Sociedad Geologica Mexicana 53: 59–71.
Aranda-Gomez JJ, Luhr JF, Housh TB, Connor CB, Becker T, Henry CD. 2003. Synextensional Pliocene-Pleistocene eruptive activity inthe Camargo volcanic field, Chihuahua, Mexico. Geological Society of America Bulletin 115: 298–313.
Atwater T. 1989. Plate tectonic history of the Northeast Pacific and western North America. In The Eastern Pacific Ocean and Hawaii,WintererEL, Hussong DM, Decker RW (eds). The Geology of North Americ. Geological Society of America; 21–72.
Atwater T, Stock J, 1998. Pacific-North America plate tectonics of the Neogene southwestern United States—an update. InternationalGeology Review 40: 375–402.
Carrasco-Nunez G, Milan M, Verma SP. 1989. Geologıa del volcan El Zamorano, Estado de Queretaro. Universidad Nacional Autonoma deMexico. Revista Instituto de Geologıa 8: 194–201.
Cerca-Martınez M, Aguirre-Dıaz GJ, Lopez-Martınez M. 2000. The geologic evolution of southern Sierra de Guanajuato, Mexico: Adocumented example of the transition from the Sierra Madre Occidental to the Mexican Volcanic Belt. International Geology Review 42:131–151.
Charlesworth H, Cruden D, Ramsden J, Huang QX, 1988. Orient: an interactive Fortran 77 Program for processing orientations on amicrocomputer. Computer and Geoscience 15: 275–293.
Contreras J, Gomez-Tuena A. 1999. Effect of strain rate in the distribution of monogenetic and polygenetic volcanism in the Trans-mexicanVolcanic Belt. Comment. Geology 27: 571–572.
De-Cserna Z, Fuente De-La-Dutch M, Palacios-Nieto M, Triay L, Mitre-Salazar LM, Mota-Palomino R. 1989. Estructura geologica,gravimetrica, sismicidad y relaciones neotectonicas regionales de la Cuenca de Mexico. Universidad Nacional Autonoma de Mexico. BoletınInstituto de Geologıa 104: 1–71.
Demant A. 1978. Caracterısticas del Eje Neovolcanico Transmexicano y sus problemas de interpretacion. Universidad Nacional Autonoma deMexico. Revista Instituto de Geologıa 2: 172–187.
Ferrari L, SuterM, Aranda-Gomez JJ, Perez-Venzor JA, Ortega-Gutierrez F, Roldan-Quintana J, Centeno-Garcıa E, Calmus T, BandyW, Delgado-Granados H, Quintero-Legorreta O, Machette MN, Pearthree PA, Mayer L, Mueller K, Schug D, Hatch M, Dart RL,Bradley LA. 2005. Map and database of Quaternary faults and folds in Mexico and its offshore region. A project of the InternationalLithosphere Program’s Task Group II-2 ‘Major Active Faults of the World’. USGS Open File Report (in press).
Garcıa-Acosta V, Suarez G. 1996. Los Sismos en la Historia de Mexico. Vol. I UNAM/CIESAS/Fondo de Cultura Economica: Mexico City.Garcıa-Palomo A, Macıas JL, Arce JL, Capra L, Garduno VH, Espıdola JM. 2002a. Geology of Nevado de Toluca volcano and
surrounding areas, central Mexico. Map and Chart Series MCH089. Geological Society of America.Garcıa-Palomo A,Macıas JL, Tolson G, Valdez G,Mora JC. 2002b. Volcanic stratigraphy and geological evolution of the Apan region, east-
central sector of the Trans-mexican Volcanic Belt. Geofisica Internacional 41: 1–18.Gomez JM, Nieto A, Alanız S. 2002a. Analisis sismotectonico en Huimilpan, Qro. Union Geofisica Mexicana Geos 22: 370.Gomez JM, Zuniga R, GuzmanM, Aguirre G, Barboza R, Nava E. 2002b. Estudios de sismicidad en el centro y altiplano central de Mexico.
Union Geofisica Mexicana Geos 22: 369–370.Gross WH. 1975. New ore discovery and source of silver-gold veins, Guanajuato, Mexico. Economic Geology 70: 1175–1189.Henry CD, Aranda-Gomez JJ. 1992. The real southern Basin and Range: Mid- to late Cenozoic extension in Mexico. Geology 20: 701–704.Henry CD, Aranda-Gomez JJ, 2000. Plate interactions control middle-late Miocene, proto-Gulf and Basin and Range extension in the
southern Basin and Range. Tectonophysics 318: 1–26.Johnson CA, Harrison CGA. 1990. Neotectonics in central Mexico. Physics of the Earth Interior 64: 187–210.Lang B, Steinitz SF, Sawkins FJ, Simmons SF. 1978. K-Ar studies in the Fresnillo Silver district, Zacatecas, Mexico. Economic Geology 83:
1642–1646.Langridge RM, Weldon RJ II, Moya JC, Suarez G. 2000. Paleoseismology of the 1912 Acambay earthquake and the Acambay-Tixmadeje
fault, Transmexican volcanic belt. Journal of Geophysical Research 105: 3019–3017.Lermo J, Nieto-Obregon J, Zermeno M. 1996. Faults and fractures in the valley of Aguascalientes. Preliminary microzonification XI World
Conference on Earthquake Engineering, Aguascalientes, Ags., 1996. Paper No. 1651.Lopez-Hernandez A. 1985. Geologıa de la zona geotermica de San Bartolome de Los Banos, Gto., Revision. informe Interno 29/95. Mexico
DF, Comision Federal de Electricidad, Gerencia de Proyectos Geotermoelectricos.Lopez-Hernandez A. 1996. Modelo geologico de un sistema hidrotermal no volcanico: San Bartolome de Los Banos, Gto., Mexico.
Geotermia, Revista Mexicana de Geoenergıa 12: 19–32.Luhr JF, Henry CD, Housh, TB, Aranda-Gomez JJ, McIntosh WC. 2001. Early extension and associated mafic alkalic volcanism from the
southern Basin and Range province: Geology and petrology of the Rodeo and Nazas volcanic fields, Durango, Mexico. Geological Society ofAmerica Bulletin 113: 760–773.
Molina-Garza R, Urrutia-Fucugauchi J. 1993. Deep crustal structure of central Mıxico derived from interpretation of Bouguer gravityanomaly data. Journal of Geodynamics 17: 181–201.
Natali SG, Sbar ML. 1982. Seismicity in the epicentral region of the 1887 northeastern Sonoran earthquake, Mexico. Bulletin of theSeismological Society of America 72: 181–196.
Nixon GT, Demant A, Armstrong RL, Harakal JE. 1987. K-Ar and geologic data bearing on the age and evolution of the Trans-MexicanVolcanic Belt. Geofisica Internacional 26: 109–158.
Orozco-y-Berra JD. 1887. Efemerides seismicas Mexicanas. Memorias Sociedad Cientifica ‘Antonio Alzate’ (Mexico) 1: 303–541.Ortega-Rivera A, Vargas-Cabrera C, Villamor P, Langridge RM, Schaaf P, Zuniga R. 2002. Estudio paleosısmico en la ciudad de
Queretaro: un proyecto piloto. Union Geofisica Mexicana Geos 22: 382.Pasquare G, Ferrari L, Perazzoli V, Tiberi M, Turchetti F. 1987. Morphological and structural analysis of the central sector of the
Transmexican Volcanic Belt. Geofisica Internacional 26: 177–194.
242 g. j. aguirre-dıaz ET AL.
Copyright # 2005 John Wiley & Sons, Ltd. Geol. J. 40: 215–243 (2005)

Pasquare G, Garduno VH, Tibaldi A, Ferrari L. 1988. Stress pattern evolution in the central sector of the Mexican Volcanic Belt.Tectonophysics 146: 353–364.
Pasquare G, Ferrari L, Garduno VH, Tibaldi A, Vezzoli L. 1991. Geologic map of the central sector of the Mexican Volcanic Belt, states ofGuanajuato and Michoacan, Mexico. Scale 1:300,000. Map and Chart Series. Geological Society of America.
Perez-Venzor JA, Aranda-Gomez JJ, McDowell FW, Solorio-Munguıa JG. 1997. Geologıa del Volcan Palo Huerfano, Guanajuato, Mexico.Revista Mexicana de Ciencias Geologicas 13: 174–183.
Siebe C, Quintero-Legorreta O, Garcıa-Palomo A, Macıas JL. 1999. Effect of strain rate in the distribution of monogenetic and polygeneticvolcanism in the Trans-mexican Volcanic Belt. Comment. Geology 27: 571–572.
Soler-Arechalde AM, Urrutia-Fucugauchi J. 1993. The Queretaro-Taxco fracture system. A major NW-SE fault and crustal discontinuity incentral Mexico. Union Geofisica Mexicana Eos 74: 577.
Stewart JH. 1998. Regional characteristics, tilt domains, and extensional history of the late Cenozoic Basin and Range province, western NorthAmerica. In Accommodation Zones and Transfer Zones: The Regional Segmentation of the Basin and Range Province, Faulds JE, Stewart JH(eds). Special Paper 323. Geological Society of America: Boulder, Colorado; 47–74.
Stewart JH, Anderson RE, Aranda-Gomez JJ, Beard LS, Billingsley GH, Cather SM, Dilles, JH, Dokka RK, Faulds JE, Ferrari L,Grose LT, Henry CD, Janecke SU, Miller DM, Richard SM, Rowley PD, Roldan-Quintana J, Scott RB, Sears JW,Williams VS. 1998.Map showing Cenozoic tilt domains and associated structural features, western North America. In Accommodation Zones and TransferZones: The Regional Segmentation of the Basin and Range Province, Faulds JE, Stewart JH (eds). Special Paper 323. Geological Society ofAmerica: Boulder, Colorado.
Stock J, Hodges KV, 1989. Pre-Pleistocene extension around the Gulf of California and the transfer of Baja California to the Pacific plate.Tectonics 8: 99–115.
SuterM. 1991. State of stress and active deformation in Mexico and western Central America In Neotectonics of North America, Slemmons DBet al. (eds). Decade Map 1. Geological Society of America: Boulder, Colorado; 401–1421.
Suter M. 1999. Effect of strain rate in the distribution of monogenetic and polygenetic volcanism in the Trans-mexican Volcanic Belt,Comment. Geology 27: 571.
Suter M. 2000a. Seismotectonics of northeastern Sonora.Universidad Nacional Autonoma de Mexico, Instituto de Geologıa, Estacion Regonaldel Noroeste, Publicaciones Ocasionales 2: 132–133.
Suter M. 2000b. Surface rupture of the 3 May 1887 Mw¼ 7.4 Sonora earthquake and structure of the underlying Basin and Range faults.Universidad Nacional Autonoma de Mexico, Instituto de Geologıa, Estacion Regional del Noroeste, Publicaciones Ocasionales 2: 133–135.
Suter M, Aguirre-Dıaz GJ, Siebe C, Quintero O, Komorowski JC. 1991. Volcanism and active faulting in the central part of the Trans-Mexican Volcanic Belt, Mexico. InGeological Excursions in Southern California and Mexico, Walawender MJ, Hanan BB (eds) Guidebook,1991 Annual Meeting Geological Society of America. Department of Geological Sciences, San Diego State University: 224–243.
SuterM, Quintero O, Johnson CA. 1992. Active faults and state of stress in the central part of the Trans-mexican Volcanic Bel, Mexico. 1. TheVenta de Bravo fault. Journal of Geophysical Research 97: 11,983–11,994.
Suter M, Quintero O, Lopez M, Aguirre-Dıaz GJ, Farrar E. 1995a. The Acambay graben: Active intra-arc extension in the trans-Mexicanvolcanic belt, Mexico. Tectonics 14: 1245–1262.
Suter M, Carrillo M, Lopez M, Farrar E. 1995b. The Aljibes half-graben-active extension in the transition zone between the Trans-Mexicanvolcanic belt and the southern Basin and Range, Mexico. Geological Society of America Bulletin 107: 627–641.
Suter M, Carrillo-Martınez M, Quintero-Legorreta O. 1996. Macrosesimic study of shallow earthquakes in the central and eastern parts ofthe Trans-mexican volcanic belt, Mexico. Bulletin of the Seismological Society of America 86: 1952–1963.
Suter M, Lopez-Martınez M, Quintero-Legorreta O, Carrillo-Martınez M. 2001. Quaternary intra-arc extension in the central Trans-Mexican Volcanic Belt. Geological Society of America Bulletin 113: 693–703.
Urrutia-Fucugauchi J, Flores-Ruız JH. 1996. Bouguer gravity anomalies and regional crustal structure in central Mexico. InternationalGeology Review 38: 176–194.
Urrutia-Fucugauchi J, Soler-Arechalde AM, Flores-Ruız JH. 1995. Tectonics and volcanism in central Mexico-influence of pre-Neogenetectonics in the plate subduction-magmatic arc system. Geological Society of America, Abstracts with Programs 27: A189.
Valdez-Moreno G, Aguirre-Dıaz GJ, Lopez-Martınez M. 1998. El Volcan La Joya, edos. de Queretaro y Guanajuato. Un estratovolcanantiguo del Cinturon Volcanico Mexicano. In Tectonic and Magmatic Evolution of Mexico during the Cenozoic, Aguirre-Dıaz GJ (ed.).Revista Mexicana de Ciencias Geologicas 15: 181–197.
Zuniga FR, Pacheco JF, Guzman-Speziale M, Aguirre-Dıaz GJ, Espındola VH, Nava E. 2003. The Sanfandila earthquake sequence of1998, Queretaro, Mexico: activation of an undocumented fault in the northern edge of central Trans-Mexican Volcanic Belt. Tectonophysics361: 229–238.
normal faulting in the mexican volcanic belt 243
Copyright # 2005 John Wiley & Sons, Ltd. Geol. J. 40: 215–243 (2005)