Intraplate termination of transform faulting within the Antarctic continent
Upload
independentCategory
view
0download
0
Geophys. J. Int. (1994) 118, 31-46
Faulting process of the 1990 June 20 Iran earthquake from broad- band records
J. Campos,' R. Madariaga,' J. Nibi51ek,2 B. G. Bukchin3 and A. Deschamps4 ' Laboratoire de Sismologie, Institut de Physique du Globe de Paris et Universitt' Paris 7 , 4 Piace Jussieu Tour 24, 75252 Paris Cedex 05, France
' International Institute of Earthquake Prediction Theory and Mathematical Geophysics, Russian Academy of Science, Moscow, Russia College of Oceanography, Oregon State University, Corvallis, O R 97331, USA
Institut de Gt'odynamique, CNRS-Sophia Antipolis, 06560 Valbonne, France
Accepted 1993 December 13. Received 1993 December 7; in original form 1993 July 28
S U M M A R Y We study the rupture process of the Iranian earthquake of 1990 June 20 from broad-band data. We redetermined its moment tensor and source mechanism from long-period surface waves. Then we studied the P and SH broad-band recordings from the GEOSCOPE and IRIS seismic networks. We inverted the body waves using a full waveform modelling. For the inversion we used the gradient method of NBbdek, mixed with a limited exploration of the parameter space. In order to control the resolution of inversion, we proceeded by a stepwise procedure increasing the model complexity with every new inversion. We used the reduction of cost functional as a criterion for the validity of the inverted model. We first inverted the body waves considering a single-point source model. We found that body waves are dominated by a large energy release about 20 s from the onset of the signals. In the next step, fixing fault-plane solution, we inverted for the directivity of the source. We found clear evidence of propagation towards the east of the epicentre. We determined a rupture velocity of -2.5 km s-'. The preceding source inversion reduced the variance of the residuals by about 30 per cent. Further improvement of the fit of the body-wave signals was obtained using an extended line source with constant fault-plane solution. We obtained a very good fit with an asymmetrical model. Initially rupture is bilateral but north-western propagation stops after 10 s. Later rupture continues unilaterally in the south-eastern direction with a rupture velocity of the order of 2.5 km s-'. Finally an inversion was attempted with a line source with varying fault mechanism. The final solution obtained by this procedure reduces the variance of the body-wave residuals by 60 per cent with respect to the variance of the observed body-wave signals. Variations in fault-plane solution along the fault are considered to be well resolved.
Key words: earthquakes, faulting, focal model, Iran, waveform modelling.
1 INTRODUCTION
The 1990 June 20 earthquake, with a seismic moment of 1.4 x 10²"N m (Dziewonski et al. 1991), is the largest seismic event that has occurred in the Rudbar region of north-western Iran at least since the beginning of the nineteenth century. Studies of the historical acitivity of Iran by Ambraseys (1968), Jackson & Fitch (1981) and Berberian et af. (1992), showed that this region has been subjected to significant and destructive earthquakes in historical times. Berberian et al. (1992) found two historical events that were comparable to that of 1990 June 20; those of 958 February 23 in the Rey-Taleqan region (M, - 7.7) and 1608 April 20
in the Rudbarat-Taleqan region (M, - 7.6). The 1990 earthquake produced heavy damage spread over a large area and killed over 40000 people, injuring more than 60000 (Niazi & Bozorgnia 1992). Its source region lies in the Alborz Mountains, at the south-west corner of the Caspian Sea, in a convergent environment with a shortening axis approximately N4OoE, as deduced from the source mechanisms determined for previous earthquakes in the area (Jackson & McKenzie 1988). Field observation of left-lateral strike-slip faulting are consistent with the regional structural trend WNW-ESE (Berberian et al. 1992).
Several authors have reported that the body-wave signals
31
at EN
S BIO
LO
GIE
on September 2, 2014
http://gji.oxfordjournals.org/D
ownloaded from

32 J . Campos et al.
for this event indicated that rupture was very complex. For instance, Berberian et al. (1992) quote an unpublished work by Gao et al. who proposed that the rupture consisted of at least three subevents in the first 20s. The study by Thio et al. (1990) of the teleseismic body and surface waves also indicates that the source was quite complex. They identified at least three subevents, all with strike-slip mechanisms corresponding to right-lateral movement along a fault strike pf 215" (left-lateral sense of movement along a WNW-ESE strike direction). In the latest refinement of the source model (Thio et al. 1990, and private communication cited in Niazi & Bozorgnia 1992), four subevents were identified within a 25s time-window with a total moment of 8.5 x 10" N m. The fault planes strike between 283" and 303" and have northward dips ranging from 54" to 82". The distribution of the subevent sequence tends to suggest unilateral rupture from west to east.
The good azimuthal coverage by broad-band seismic stations of the 1990 June 20 Iranian earthquake provides an opportunity to study the spatial resolution of seismic source inversions in order to improve our understanding of the complexity of the rupture process of large earthquakes. In this paper we examine this event in detail, using all available broad-band recordings obtained by the GEOSCOPE and IRIS seismic networks, in order to better understand the faulting process of a complex strike-slip earthquake in a continental environment. From these recordings we selected those in the range 30"-90" in which body waves are not affected by multipathing.
2 EPICENTRE LOCATION A N D SURFACE FAULTING
The hypocentral parameters of the mainshock determined by several organizations are listed in Table 1. The epicentral area of the 1990 June 20 earthquake lies within a complex fault system in the Alborz Mountains and Manjil Basin. This basin separates the Talesh Mountains to the north and east from the Tarom Mountains to the south and west. Jackson & McKenzie (1988) found that the direction of maximum shortening in this region is N40"E and that the average seismic slip rate in this direction lies between 6 and 16mmyr-'. The same authors proposed that 50-100 per cent of the deformation within the upper crust is accommodated seismically. Farther south, in the lower elevations of north-central Iran about 120 km south-east of the 1990 earthquake epicentre, occurred the 1962 September 1 Buyin Zara earthquake (M, = 7.2). This earthquake produced 80 km of oblique left-lateral and reverse surface traces (Ambraseys 1963; Ambraseys &
Table 1. Focal parameters of the 1990 Iran earthquake. From Berberian er al. (1992).
Source T.O. Latitude Longitude Depth (km)
ISC 21:00:10.9 36.99'N 49.35'E 19
NEIC 21:00:09.9 36.96'N 49.41'E 19
HRVD 21:00:31.1 36.95'N 49.52'E 15
Berberiant 21:OO:lO.O 36.96'N 49.41"E 14
Melville 1982), indicating a left-lateral component slip in the Alborz Mountains (Berberian et af. 1992).
Moinfar & Naderzadeh (1990), cited by Niazi & Bozorgnia (1992), discovered a fresh fault trace of approximately 80 km length, which they identified as the main rupture associated with the 1990 June 20 event. This fault trace strikes N75"W and follows in part the north-eastern boundary of the Manjil Basin (Niazi & Bozorgnia 1992). However, Berberian et al. (1992) provided another field interpretation. They mapped a pattern of discontinuous surface ruptures over a length of -85 km that did not follow any previously identified active geological fault. Three main strands of faulting were reported (the Baklor, Kabateh and Zard Goli segments) with slightly different strikes (from 95" to 120") and distinctly different surface displacements. The main rupture they found is located above 2000 m of elevation, several kilometres north of the trace identified by Moinfar & Naderzadeh (1990).
The observations of surface traces suggest complex faulting. Berberian et al. (1992) found that the three main fault segments were arranged in a right-stepping en-echelon pattern and were separated by gaps in the observed surface ruptures. Maximum left-lateral displacements of 60 cm and 95 cm of reverse motion were observed along the south-east (Zard Goli) and the central (Kabateh) segments, while only left-lateral strike-slip motion was observed along the north-west (Baklor) segment. These fault segments are identified in Fig. 1 by letters ZG, K and B, respectively.
The Iran earthquake had a foreshock about 10s before the beginning of the main shock. From the Harvard CMT solution, Dziewonski et al. (1991) found that the dominant episode of moment release occurred -20s after the origin time. Epicentral determinations, listed in Table 1, located this foreshock about 20 km to the north from the main surface rupture recognized by Berberian et al. (1992). The ISC location differs by -7.5 km with respect the NEIC location, and up to 20 km with respect to the Harvard CMT solution (Dziewonski et al. 1991). The latter can be explained by the fact that, as we will show later, the centroid of moment release for this event was located well to the east of its epicentre. It is very likely that the differences in epicentral locations, as well as the -20km distance between the epicentral location and the surface trace of the fault identified by Berberian et af. (1992), are due to the uncertainties associated with the epicentres determined mostly from teleseismic data. For this reason, in the following we will assume that the actual fault trace is that identified by Berberian and coworkers.
The aftershocks located by NEIS are also plotted in Fig. 1. Their distribution does not help in identifying the earthquake fault because they were spread over a large area that extends well to the north of the fault traces identified by Berberian et al. (1992). This may of course be an artefact of the poor quality of epicentre locations already discussed above. As reported by Berberian et af. (1992), the correspondence between these aftershock epicentres and the mainshock isoseismals was very poor also.
3 SOURCE MODELS
Given the poor knowledge we have about the fault geometry for this earthquake we decided to proceed in the
at EN
S BIO
LO
GIE
on September 2, 2014
http://gji.oxfordjournals.org/D
ownloaded from

Rupture process of an Iranian earthquake 33
38"
37"
36"
48 49" 50' 51"
' i i
38'
37"
36"
Reported
Main Shock Epicentre
\ B K
ZG
HRVD
NEIC
ISC
Fault traces
Baklor Ka bate h
Zard-Goli
m ,,= 4.0
m b= 6.0
48" 49' 50" 51 Figure 1. Epicentral area of the Iran earthquake of 1990 June 20. The fault traces identified by Berberian et al. (1992) are indicated as well of the aftershocks located by NEIC.
foilowing way: first of all, we restudied the surface waves generated by the earthquake. From the long-period surface waves we determined the best double-couple fault model and the corresponding fault parameters.
Starting from the parameters determined from surface waves we made a detailed analysis of all available broad-band P and S waves for this earthquake. In order to model the source complexity-while trying at the same time to keep the number of parameters to a minimum-a stepwise inversion strategy was adopted. We started from the simplest point-source model and then introduced an increasingly more complex extended fault model. At every step we verified that the residuals of the inversion were actually reduced by a significant amount.
As a first approximation we modelled the source as a single point in order to retrieve the best-fitting centroid solution. Then we introduced a simple unilateral propagat- ing point source and studied the directivity of the source model. We demonstrated that the unilaterally propagating model significantly reduced the variance of the residuals.
Once we were convinced that the data contained enough information about the details of rupture propagation, we attempted a finite source inversion. Our data cannot resolve details of the slip distribution with depth, so we adopted a rectangular source model with the fault depth fixed at 20 km. The fault was divided into rectangular segments of 10km length. As we will show from the reduction of variance, we could determine the spatial distribution of moment release and in our final model-a bilateral fault of
almost 90 km length-we could retrieve some spatial variation of the fault mechanism along the fault.
4 SURFACE-WAVE INVERSION
The moment tensor and focal mechanism of the 1990 June 20 earthquake were determined by several agencies and by Dziewonski et al. (1991). Estimates of moment tensor and the fault plane of the main double couple are collected in Table 2. Giardini (1992) and Giardini, Boschi & Palombo (1993) made a rapid determination of the moment tensor
Table 2. Source parameters of the 1990 Iran earthquake.
Source Strike I Dip I Slip I Mo [Nm] I Depth km] 17 311" 76' 54' 1.1 . l o z o
288' 88' -11' 2 .0~1020 19
Berberian(d) 292' -9' 8.8. 1019
This study(') 300' 75' 1.2.lOZO 5 - 10
This study(j) 301" 81.6' 4.8' 1.05. lozo 11.7
Best double couple; (') fault-plane solution, P waves; (') centroid moment solution; (d) Berberian et al. (1992); (') from long-period surface waves; from body waves for a point source model (m6 model).
at EN
S BIO
LO
GIE
on September 2, 2014
http://gji.oxfordjournals.org/D
ownloaded from

34 J . Campos et al.
Figure 2. Azimuthal coverage of the source by the broad-band digital stations used in this study.
using the MedNet regional network. They found a seismic moment Mo = 1.1 X lo2' N m that is slightly lower than those listed in Table 1. Since there is a significant variablity in the fault-plane solutions listed in Table 2, we redetermined the moment tensor using surface-wave data.
We used all available long-period and broad-band recordings from the IRIS and GEOSCOPE networks. The distribution of these stations around the epicentre is shown in Fig. 2 and listed in Table 3. Love and Rayleigh fundamental modes were extracted from seismograms using time-variable filtering and polarization analysis. Only those surface-wave trains that we considered of sufficiently good quality were used in this study. Observed records were corrected for attenuation (using the PREM model) and for instrument response.
We calculated the best double-couple source model from long-period surface waves in the period band from 120s to 300 s. Comparing observed and calculated spectra, we obtained the following focal mechanism: strike 300", dip 75" and rake 15", which can be compared with solutions obtained by other authors in Table 2. The result of the CMT inversion is summarized in Table 4. The scalar seismic moment was estimated as 1.2 X 10²"N m. The best point-source depth was found to be between 5 to 10 km. The CMT solution reported by Dziewonski et al. (1991) is also shown in Table 4. Our solution is similar to theirs except for the M,, component, which is very difficult to determine for shallow earthquakes. Using the usual definition of the CLVD part of the moment tensor for the Harvard CMT solution, we find
where A, , A2 and A3 are the largest, intermediate and least
principal values of the moment tensor, respectively. Since we assumed a double-couple source model, E is zero in our solution. Our result and that of CMT are compared in Table 2; given the uncertainties in the determination of focal depth of shallow events from long-period surface-wave data (Ekstrom 1989; Ekstrom & Dziewonski 1985), we consider that differences between our solution and that of Harvard (Dziewonski ef al. 1991) are not significant.
5 INVERSION OF B R O A D - B A N D BODY WAVES
We used broad-band data from the IRIS and GEOSCOPE networks in order to invert the rupture history of the earthquake. Only mantle body waves from stations at distances of 30" 5 A p 5 90" and 34" 5 ASH 5 87" were included in our data set, in order to avoid upper mantle and core arrivals. Table 3 lists the teleseismic stations used in the inversion and Fig. 2 shows their azimuthal coverage.
Because we did not have information about the local crustal structure, the velocity model in the source region and beneath recording stations was approximated by a half-space with a compressional wave velocity of 6 km s-', a Poisson ratio of 0.25, and density of 2.75gcmP3. Anelastic attenuation along the propagation path was parametrized using an effective attenuation t* of 1 s for P waves and a t* of 4 s for SH waves. There are undoubtedly lateral heterogeneities in the source region that are not included in our model and which may affect some of our results.
Since some of the more recently installed GEOSCOPE and IRIS stations had a much broader-band instrument response (VBB) than those of the older BRB stations, we brought all the data to a common frequency band. We equalized all the observed records to displacement
at EN
S BIO
LO
GIE
on September 2, 2014
http://gji.oxfordjournals.org/D
ownloaded from

Rupture process of an Iranian earthquake 35
TOL
VSL
WFM
Table 3. Seismic stations used in the inversion of body waves and surface waves.
291.0' 41.5' P, SH IRIS (GSN)
287.0° 31.4' Ra, L MEDNET
320.5' 84.2" P GEOSCOPE
I HRV I 311' I 76" I P. SH. Ra. L I IRIS I
seismograms with the same gain at distance of 40" from the epicentre. In order to avoid problems with low- and high-frequency noise due to the integration procedure, we filtered the displacement records with a bandpass filter (Butterworth of order 3) between 0.01 and 0.2 Hz (periods from 100 s to 5 s).
Figure 3 presents some seismic traces chosen in order to show the azimuthal variability of P waves in the selected frequency band of 0.01-0.2Hz. Simple inspection of the waveforms in this figure indicates that the Iran earthquake was a multiple event: we can clearly see a gradual change of polarity near station HRV for the first phase modelled in this study (PI, indicated by arrows in the figure). This phase arrives about 10s after the P onset determined by ISC. In the same figure, we see that the most energetic pulse arrived about 20s after the ISC time for the P onset (Pz in the figure). For this pulse the nodal plane is clearly located near station TAM, indicating that a single focal mechanism may not explain all the rupture.
For the inversion of body waves, we chose a time window of 70 s after the theoretical arrivals of P and SH waves. The
records were initially aligned with the theoretical P and SH waves' arrival calculated from the Herrin traveltime tables. Once the point-source model was inverted we tried to correct the onset time by calculating the cross-correlation between the observed and synthetic signals. Since most teleseismic stations lie near nodes of the P-wave radiation pattern, it was impossible to determine accurately the onset of the first arrival in all the stations. For this reason we allowed the reference time to change by a small amount if the cross-correlation between the observed and synthetic seismograms could be improved. For P waves this time shift varied between 1 s for stations with well-determined short-period arrivals, to a maximum of 5 s for emergent or nodal arrivals. For the SH waves the time shifts were larger, about 10 s, but this is less crucial since the S waves are much longer period than the P waves.
5.1 Inversion method
For the inversion of the body-wave data we used the procedure proposed by NAbElek (1984), which has already
at EN
S BIO
LO
GIE
on September 2, 2014
http://gji.oxfordjournals.org/D
ownloaded from

36 J . Campos et al.
6.99
-9.4
Table 4. Centroid moment tensor solution.
8.55
-10.11
~~~
This paper 10'' Nm
~~
Harvard CMT 1 iO19 N m
Moment Tensor Elements
-8.73
-1.22
I Strike,deg
3.84
-1.25
2.42 I 1.55
6.40
Best Double Couple
14. 1019 N m
300, 200
6 28
12.1O" N m
300, 206
Dip,deg
Slip,deg
73,59 75, 76
32, 160 15, 164
Value (pl,az) Value (pl,az)
T axis
P axis
15.13 (34,163)
-11.87 (9,67)
12.02 (21,163)
-12.03 (0,73)
N axis -3.25 (54,325) -0.01 (69,344)
ERM, Azimuth: 53.0
INU, Azimuth: 62.0
BJI, Azimuth:64.8
HYB, Azimuth: 1193
TAM, Azimuth: 262.0
TOL, Azimuth: 291.0
SSB, Azimuth: 2983
HRV, Azimuth: 320.4
KEV, Azimuth: 346.6
ALE, Azimuth: 352.0
COL, Azimuth: 7.4
Butterworth Filter: 0.01-0.2 Hz Trace-normalized amplitudes
Figure 3. Ground displacement, broad-band P waves for the Iran earthquake bandpass filtered in the frequency band 0.01-0.2 Hz.
been applied successfully to other large strike-slip earthquakes (NfibElek 1985; NfibElek, Chen & Ye 1987; Sufirez & NfibElek 1990; Hwang & Kanamori 1992). Inversion is based on the maximum likelihood principle discussed by Jackson (1979), Tarantola & Valette (1982) and NfibElek (1984, 1985). This method can invert for multiple sources and solves simultaneously for focal mechanism, centroid depth, and source-time function for each source. In order to get the best estimate of the source parameters, we minimized the residuals between the observed and theoretical seismograms and the difference between the parameters of the a priori and the best-fit model. The objective functional for the inversion was
s2 = (d - m(P))TC&'(d - m ( ~ ) ) + (P - PdTC;,,YP - Po), (1)
where d is the vector of observed seismograms, m are the corresponding synthetic seismograms, p are the estimated model parameters, po is an a priori estimate of the model, and C,, and C,, are the a priori estimates of the variances of the data and model parameters, respectively. The number of parameters in p vaned according to the type of inversion we performed and will be detailed at each step in the inversion procedure. In order to estimate the goodness of fit of the models we will use the following normalized residual
X = (2) (d - m(P))Tci; (d - m(p))
dTCz, d
Because SH-wave amplitudes are much larger than P-wave amplitudes and the sensitivity of the least-squares inversion is directly proportional to the power of the signal, we applied a weighting to give the same significance to both types of waves. The total RMS misfit was defined as the total residual to minimize divided by the root square of the total normalized variance of the data.
5.2 Point-source inversion
The first step in our inversion procedure was to determine the best point-source model consistent with the P and SH waves observed in the distance range 30"-90". As seen in the seismograms shown in Fig. 3, the Iran earthquake started with a low moment release subevent, so that we could not resolve the moment release for the first 10s after the onset of the first arrival. For this reason, we only tried to invert the main episode of moment release at the source, which corresponds very roughly with the moment release modelled by the surface waves studied in a previous section.
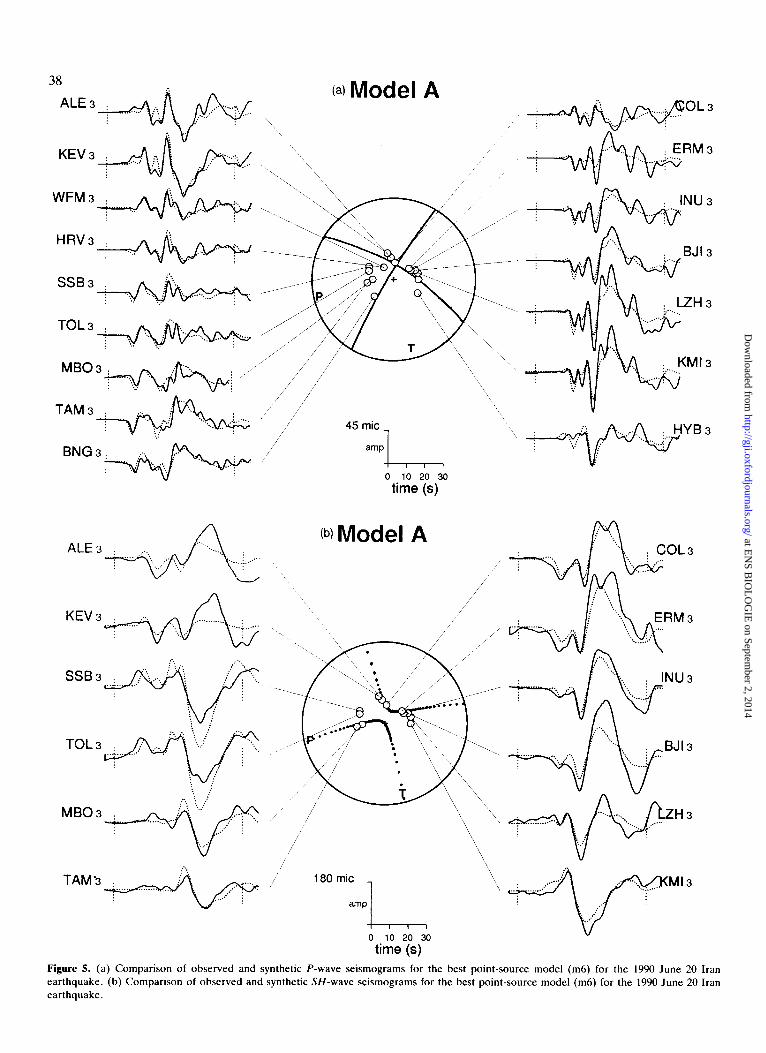
We started the inversion process using as an a priori model the one obtained by long-period surface-wave inversion and listed in Table 2 (+ = 300", 6 = 75", I = 15", depth = 10 km). From linearized inversion we obtained a strike of 301", a dip of 81.6", and a rake of 4.8". We also found that the mainshock occurred about 24 s from the ISC first arrival. The depth of the source centroid was 11.7 km and the seismic moment M o = 1.05 X 10ZoN m. A com- parison of observed and modelled seismograms is shown in Fig. 5 and the corresponding source-time function is shown in Fig. 4(d). The seismogram fit in Fig. 5 is quite good for
at EN
S BIO
LO
GIE
on September 2, 2014
http://gji.oxfordjournals.org/D
ownloaded from

Rupture process of an Iranian earthquake 3 7
-1
0.050 1
7 0.200- E 8 0.150 2
. Y
4 O-lo0
0.001 I---~ 0 5
-
Point source model PDE solution
10 15 20 25 30 35 40 45 50
(sec)
, --T , Point source model
CMT solution
0.050 I
0.001 L--- 0 5 10 15 20 25 30 35 40 45 50
(sec)
o.300r-----, T I T 1 - 7 - 1 -
Point source model surface-wave solution
0.300
0.250
7 0.200 E
P 0.150 s
. Y
-3 OJo0 0.050
0.001
A 'I
/ I
~ CLd 40 45 50
1
5 .L
35
r 7 - - - - - 1 1 ~ _. 1-- I
Point source model (d) body-wave solution
I
0 5 10 15 20 25 30 35 40 45 50 (SeC)
Figure 4. Source-time functions determined for all the point-source inversions carried out in this paper. Each of these inversions was performed assuming a different fault-plane solution for the earthquake.
the initial part of the P-wave signals and deteriorates near the end, where probable crustal reverberations appear. Our model is generally less successful in reproducing the S waves. In Fig. 6 we show relative residual for this inversion (model m6) and for all the other inversions we did. We observe that our result reduces the variance of the P and S waves by about 30 per cent.
In order to estimate the quality of our point-source solution we repeated the inversion for the source-time function using the focal mechanism proposed by other authors and listed in Table 2. During these inversions the fault-plane solutions were fixed at the values given in Table 2 and we looked for the source-time function that minimized the error x. In Fig. 4 we show the source-time functions determined by inversion using these focal mechanisms as well as that determined from surface waves. Fig. 6 compares the relative residuals obtained for these inversions. Not surprisingly the fit of the waveforms using the preliminary fault-plane solutions by P D E and NEIC is quite poor. Much better results are obtained using the Harvard C M T solution (model m3) or using our surface-wave moment tensor (model m4 in Fig. 6).
Except for the PDE solution, all the source-time functions in Fig. 4 show similar features: within a time-window of about 50s from the onset of the body waves, the average rupture process of the Iran earthquake is represented by two principal shocks. In these models, the main subevent of about 10 s duration occurs roughly 20 s after the ISC arrival
time. The total source duration is -22s for all the inversions. The beginning is not well resolved, but the centroid mechanism shows a time delay of - 10 s between the first subevent and the mainshock. Source complexities between both shocks could not be resolved with a single point-source model because of the limitations in the assumptions made about the model (point double-couple source).
Finally, we tried to determine the sensitivity of the data to focal depth for our best point-source model, m6. Instead of doing a linearized inversion we explored the residual space as a function of the point-source depth, keeping all other source parameters fixed. Fig. 7 shows that body waves are not very sensitive to focal depth as shown by the broad minimum in relative residual between 5 and 16 km.
5.3 Unilaterally propagating extended source model
In the next step of the inversion procedure we tried to find the direction of rupture propagation. For this purpose we modelled the directivity effect of a propagating point source along the strike of the fault with a rupture velocity of 2.7 km sC1 (v, = 0.8 x @) and we estimated the average source depth, mechanism and scalar moment of this moving source model. Fig. 6 shows again the relative residuals x for each of these inversions. We observe that the westward propagation model (m5) produces a worst fit to the observations than both the eastward propagation model
at EN
S BIO
LO
GIE
on September 2, 2014
http://gji.oxfordjournals.org/D
ownloaded from
(a)Model A 38
0 10 20 30 time (s)
................. \ .. : ............ .. :..... \ TAMS- ;r -..., 180mic , ~ , "1/"" l 3
. . .... amp
0 10 20 30 time (s)
Figure 5. (a) Comparison of observed and synthetic P-wave seismograms for the best point-source model (m6) for the 1990 June 20 Iran earthquake. (b) Comparison of observed and synthetic SH-wave seismograms for the best point-source model (m6) for the 1990 June 20 Iran earthquake.
at EN
S BIO
LO
GIE
on September 2, 2014
http://gji.oxfordjournals.org/D
ownloaded from

Rupture process of an Iranian earthquake 39
0.60
0.58
0.56
a
-
-
-
0.5 ‘I
0.66
0.64-
0.62
0.60
0.58
rt 0.56
0.54
0.52
0.50
a
1 I I I I 1 I I I
0 - 0
-
- 0
- O O 0
- 0 0 0 0
-
0
0 - 0
0 0-
0 0 0
0 0 0
o o o o o o o ~ o o o
I I I I I I I I I
m l m2 m3 m4 mC 14 m7 m8 m9 m10 m l l
Flure 6. Relative residuals obtained after inversion for each of the models studied in this paper. ml: PDE, point source; m2: NEIC, point-source best DC; m3: Harvard, CMT solution; m4: from surface wave in this study; m5: point source with westward propagation from body waves in this study; m6: point source in this study; m7: point source with eastward propagation from body waves in this study; m8: line-source model, bilateral propagation with fixed parameters; m9: line-source model, bilateral propagation with r, = 6s; m10: line-source model, bilateral propagation with rT = 4 s; m l l : line-source model, bilateral propagation with Ty = 10 s.
(m7) and the fixed-point-source model, m6. The fit to the data of the model with eastward propagation is better by about 13 per cent than that of the fixed-point-source model (m6). Thus we conclude that there is a significant amount of directivity in our data which points to an eastward direction of rupture propagation. Once we were convinced that rupture propagated mainly to the east we explored the effect of changing rupture velocity on the fit of the observations. As shown in Fig. 8, we found that a rupture velocity of -2.5 km s-’ yields the best fit to the data.
We can determine the robustness of our results to changes in the source parameters. For that purpose we explored the residual change as a function of preferred rupture azimuth. We studied a model with unilateral rupture propagation in an eastward direction with the rupture velocity of 2.5 km s-’
0.67
0.66
0.60 I I I , I , o.61 I-
2 4 6 8 10 12 14 16 18 20 22 24
Figure 7. Determination of source depth from a propagating point-source model of the 1990 June 20 Iran earthquake.
0.66 :::r--j 0.64
3 “ I 0.62
* *
* * * * * * * * * * * * * * * * * -
-t I I 0.0 0.4 0.8 1.2 1.6 2.0 2.4 2.8 3.2
Eastward Rupture Velocity [km/s]
Figure 8. Determination of rupture velocity from a propagating point-source model of the 1990 June 20 Iran earthquake.
determined from Fig. 8. For this purpose we inverted for moment release as a function of distance with line segments of 10 km length. All other source parameters were those of our best point-source model, m6. Fig. 9 shows the relative residuals plotted with respect to rupture azimuth. The preferred rupture direction is about 120°, roughly along the average strike of the fault reported by the field observations of Berberian et af. (1992) and also in agreement with the azimuth of the mechanism obtained from inversion of the point-source function. Errors in rupture direction, while not formally determined, are likely to be less than 20”.
5.4 Bilateral rupture propagation with a fixed source mechanism
The above models do not yet explain all the features in the seismograms. The simple unilaterally propagating source model did not produce a completely satisfactory fit between the observed and synthetic seismograms at all stations. The extended source model with unilateral propagation to the east reduced the variance by less than 13 per cent with respect to the best point-source model, indicating that a more complicated source model may be needed. The complex nature of the rupture process is clearly evident in
at EN
S BIO
LO
GIE
on September 2, 2014
http://gji.oxfordjournals.org/D
ownloaded from

40 J. Campos et al.
the source-time functions obtained for the fixed point-source model (Fig. 4d), which shows at least two major moment release events separated by about 10 s. Based on these facts, we explored the possibility of bilateral rupture propagation.
We inverted for a bilateral rupture model using a rough subdivision of the earthquake into identical rectangular subevents of length equal to one-half their depth. We fixed the rupture azimuth at 120" and the rupture velocity was at 2.5 km s-l; the values determined by the unilateral source inversion of the previous section. Since there are obvious trade-offs between the time histories cf the different subevents, we determine in this step the distribution of moment release along the fault with a fixed mechanism (that of model m6 obtained from the inversion of the point-source model). and with a short time duration for each point source.
In order to simulate the effect of the average moment release with the fixed fault geometry on the body waves, the source was modelled by 12 subevents distributed along a 120 km fault length (a 120 km X 20 km section of the fault was divided into 10 km X 20 km subfaults). After some trial and error, we chose four point sources to the west, seven to the east plus the point at the hypocentre. The subevents were constrained to be located on a line along the strike of the fault. The distance between each subevent and the rupture velocity were fixed to 10 km and 2.5 kms- l respectively. These values were chosen because the rupture time for one of these rectangular subfaults is 4s, which is roughly the shortest period present in the filtered body-wave data. The source-time function for each point source (subfault) was assumed to have the shape of two simple isosceles triangules with total duration of Ty = 6 s and a rise time of 2 s . These values are in rough agreement with the usual way of modelling the spatial expansion of the area
source of the total rupture time for a rectangular subfault of surface S = 10 X 20km2, and rupture velocity u, = 2.5 k m s - l . A reasonable estimate of rupture time is
Because the time interval between the occurrence of moment release for successive subevents is short (6s) and depth phases of the first one could interfere with source phases of the second event, we could not invert for depth. Fig. 10 shows the details of the source distribution of moment release for this model and Fig. 6 shows again the residual for this model (m8) compared to other inversions. From Fig. 10 we observe that most of the moment release occurs about 30km to the east of the epicentre. The inverted source model indicates bilateral rupture, extending about 60 km to the east and about 30 km to the west of the epicentre, for a total fault length of about YO km. Fig. 6 shows that the extended model yields a residual that is slightly less than the best unilaterally propagating point-source model m7. Thus we feel confident that we can resolve some interesting details about the distribution of slip as a function of position along the source.
Ty = f i l v , = 5.7 s .
6 FINAL INVERSION OF A BILATERAL RUPTURE MODEL A N D RESULTS
A single depth and a fixed focal mechanism are very rigid conditions. In order to invert possible variations of the focal parameters, in the next step of the inversion process we allowed the fault mechanism and depth of individual subevents to vary. We assumed the same fault azimuth (120" E) as in the previous model and we assumed bilateral rupture propagation with rupture velocity u, = 2.5 km sC'. The number of subevents located at intervals of 10 km along the fault was limited to those nine obtained from the
Figure 10. Moment release distribution along the fault for a bilateral model with fixed mechanism and rupture velocity (the filled dot indicates the epicentral location).
at EN
S BIO
LO
GIE
on September 2, 2014
http://gji.oxfordjournals.org/D
ownloaded from
Rupture process of an Iranian earthquake 41
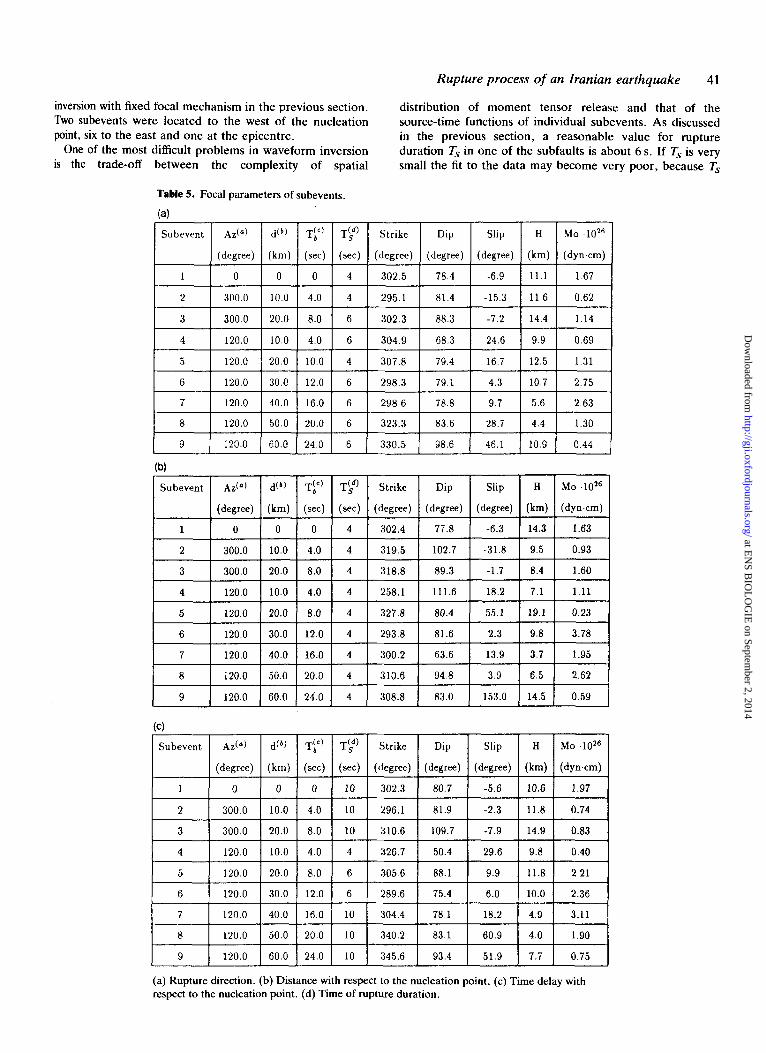
inversion with fixed focal mechanism in the previous section. distribution of moment tensor release and that of the Two subevents were located to the west of the nucleation source-time functions of individual subevents. As discussed point, six to the east and one at the epicentre. in the previous section, a reasonable value for rupture
One of the most difficult problems in waveform inversion duration Ts in one of the subfaults is about 6 s. If T, is very is the trade-off between the complexity of spatial small the fit to the data may become very poor, because T,
8
9
Table 5. Focal parameters of subevents.
(4
120.0 50.0 20.0 6 323.3 83.6 28.7 4.4 1.30
120.0 60.0 24.0 6 330.5 98.6 46.1 10.9 0.44
5
6
7
8
9
1-1
120.0 20.0
120.0 30.0
120.0 40.0
120.0 50.0
120.0 60.0
8.0
12.0
16.0
20.0
Tf) I T(,d) I Strike I Dip I Slip
4 327.8 80.4 55.1
4 293.8 81.6 2.3
4 300.2 63.6 13.9
4 310.6 94.8 3.9
8.0 I 4 I 318.8 1 89.3 I -1.7
Subevent I A d o ) I d(*J I T t ) T(,d) Strike Dip Slip H Mo
24.0 1 4 I 308.8 1 83.0 I 153.0
(degree)
80.7
(km) ( d y n a n )
8.4 1.60
7.1 1.11
(degree) (km) ( d y n a n )
-5.6 10.6 1.97
19.1 I 0.23
81.9
109.7
q-2F 6.5 2.62
-2.3 11.8 0.74
-7.9 14.9 0.83
14.5 I 0.59
4
5
120.0 10.0 4.0 4 326.7
120.0 20.0 8.0 6 305.6
50.4
88.1
29.6 9.8 0.40
9.9 11.8 2.21 I I I I I
120.0
340.2 83.1 60.9 1.90
93.4
(a) Rupture direction. (b) Distance with respect to the nucleation point. (c) Time delay with respect to the nucleation point. (d) Time of rupture duration.
at EN
S BIO
LO
GIE
on September 2, 2014
http://gji.oxfordjournals.org/D
ownloaded from
42 J . Carnpos et al.
becomes less than the minimum period contained in the data (-5s in our case). If on the other hand T, is chosen to be too long, there will be a strong trade-off between the space and time distribution of moment release. Since the Iran earthquake had a rather elongated fault of the Haskell type, rupture duration is controlled by the depth of the fault (Madariaga 1979) and should be of the order of T, = 2W/v,, where W = 20 km is the width of the fault and us = 3.5 km s-' is the shear-wave velocity. We consider then that T, = 10 s is a reasonable upper limit for the duration of fault slip for the Iran earthquake.
In order to test the effect of changing T, on the inversion we inverted rupture models with free fault mechanisms and depth for three values of Ty. The first was model m9 for which we chose 7;. = 6 s, i.e. the same value that we used for the inversion with fixed fault-plane solution reported in the previous section. The next model with a duration 7'' = 4 s was called m10; and the last model, m l l , had a Ts = 10 s. The source-time function for each subfault was modelled by a series of isosceles triangles of 2 s rise time. Depending on the assumed value of Ty, the number of triangles was fixed to 1 for Ty = 4 s , two for T, = 6 s , and four for the longer 1 0 s source duration. For each of the nine subevents we determined three fault-plane parameters, the depth, and the heights of one, two or four triangular source-time functions.
As shown in Fig. 6, the fit of the seismograms that was obtained for the three values of T7, as measured by the reduction of variance, was very similar.
Tables 5(a), (b) and (c) show the values of the parameters inverted for each point source for models m9, m10 and m l l , respectively. The normalized residuals for these models are also presented in Fig. 6 where they can be compared to those of the other models tested in this paper. The three models have practically the same fit to the data: about 46 per cent of the variance of the observed signals. Thus, these
three models are better than any of the previous ones, including model m8, the extended source with a constant fault-plane solution. Our data definitely seem to indicate that the fault mechanism changed along the fault. O n the other hand, the data cannot resolve the value of Ty; a careful analysis of Tables 5(a)-(c) shows that as Ts gets longer, the source-time functions get more complicated, a clear indication of trade-off between source duration and source complexity. The total seismic moment for these three models is also very similar, varying from M,, = 1.25 x lo2" N m for model m9 to M,, = 1.44 X lo2" N m for m10 and M,, = 1.43 x 10²"N m for m l l . These values are very close to that of the Harvard C M T solution or our own estimate from surface waves listed on Table 2. We have thus found three models that fit the data equally well, and it is clear that without other a priori information we cannot decide which one to prefer.
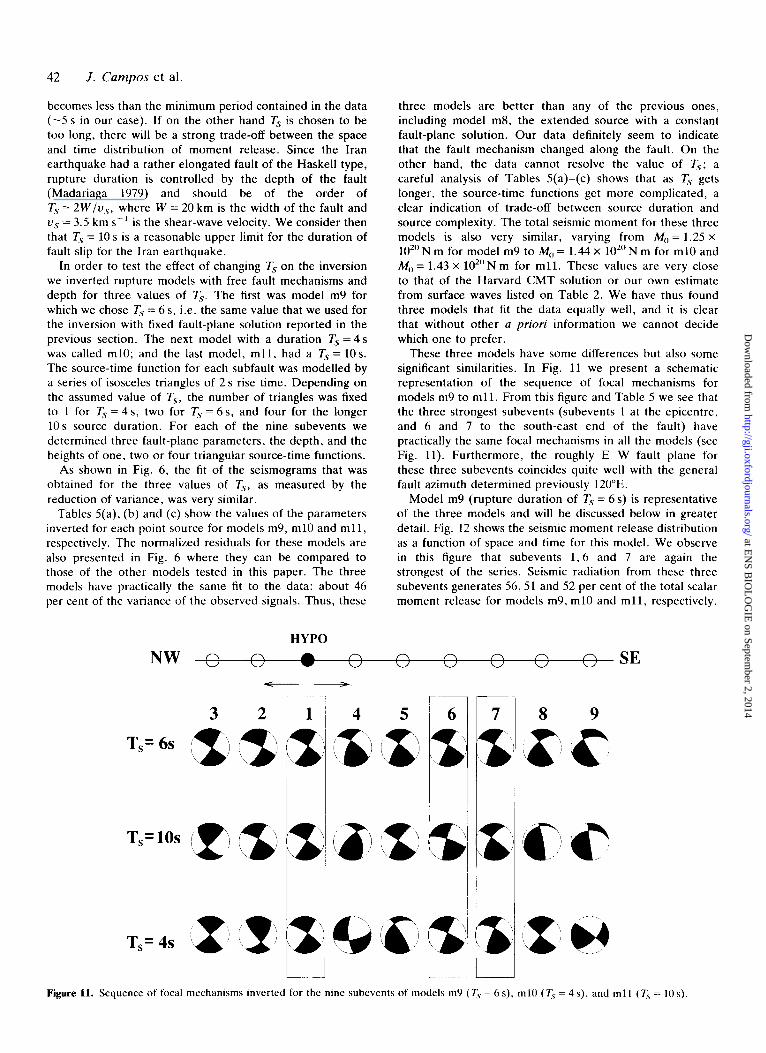
These three models have some differences but also some significant similarities. In Fig. 11 we present a schematic representation of the sequence of focal mechanisms for models mY to m l l . From this figure and Table 5 we see that the three strongest subevents (subevents I at the epicentre, and 6 and 7 to the south-east end of the fault) have practically the same focal mechanisms in all the models (see Fig. 11). Furthermore, the roughly E-W fault plane for these three subevents coincides quite well with the general fault azimuth determined previously 12073.
Model m9 (rupture duration of Ty = 6 s) is representative of the three models and will be discussed below in greater detail. Fig. 12 shows the seismic moment release distribution as a function of space and time for this model. We observe in this figure that subevents 1 , 6 and 7 are again the strongest of the series. Seismic radiation from these three subevents generates 56,51 and 52 per cent of the total scalar moment release for models my, m10 and m l l , respectively.
HYPO n n n n n n n NW 0 SE
3 2
?',=6s ,s \
8 9
Figure 11. Sequence o f focal mechanisms inverted for the nine subevents of models m9 (Ts = 6 s ) , m10 (Ts = 4s), and m l l (Ts = 1 0 s ) .
at EN
S BIO
LO
GIE
on September 2, 2014
http://gji.oxfordjournals.org/D
ownloaded from

Rupture process of an Iranian earthquake
4 5 1 I
43
1 .o 0.5 0.1 0
* L 10 km
Figure 12. Moment release distribution along the fault for the bilateral model m9 (Ts = 6 s) with free source mechanism, source depth, but rupture velocity fixed to 2.5 km s- ' .
The stability of the results for these three subevents strengthens our conclusion that the rupture started at the hypocentre, propagated initially bilaterally but that the main moment release occurred to the east of the epicentre.
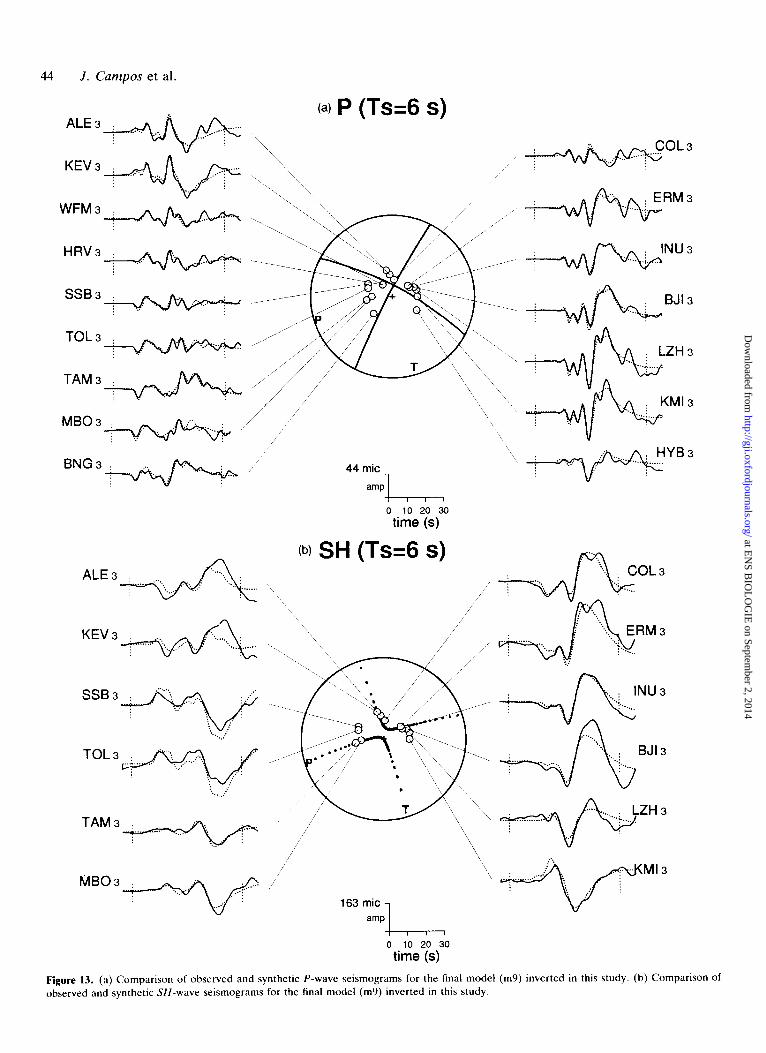
The synthetic seismograms calculated with model m9 are compared in Fig. 13 against the observed data. Comparing the fit in Fig. 13 with that of the point-source model shown in Fig. 5 , we observe a better agreement between synthetics and observed records for the second large impulse. This is quite clear for the Chinese stations BJI and L Z H , and for the Algerian station TAM. The fit of the S waves has also improved, although less significantly than that of P waves. As shown in Fig. 6, the relative residual for model m9 was reduced by 32 per cent with respect t o our best fixed-point-source model (m6), and by about 14 per cent with respect to the bilateral rupture model with constant mechanism (model m8). We consider that this improvement of the fit is significant and justifies the relatively complex model m9.
Finally, it is interesting t o remark that subevent 1 located at the nucleation point had roughly the same normal slip component as the western subevents (2 and 3). These mechanisms are quite different from those of the eastern subevents, all of which presented a reverse component of slip in agreement with fault slips observed along the south-east (Zard Goli) and the central (Kabateh) segments of the ruptures reported by Berberian et al. (1992).
7 DISCUSSION
The Iran earthquake of 1990 June 20 is the largest event to have occurred recently in the western part of the Alborz
mountain belt of northern Iran. This mountain range stretches in an E-W direction along the southern shores of the Caspian Sea.
The results of our inversion of far-field body waves are in agreement with several of the field observations made by Berberian et al. (1992). Although from the seismic data we cannot relocate the earthquake, the strike of the fault that we determined from point-source and extended-source inversions is consistent with the strike of the fault strands mapped by them. The three best-fitting source models (m9, m10 and m l l ) that we found have bilateral rupture along a fault with a strike of about 120"E. The average focal mechanism was predominantly left-lateral strike slip in good agreement with the C M T solution and the surface-wave inversion done in this study. All our successful models contain three major subevents: subevent 1, located in the epicentre of the earthquake, probably lies at the eastern segment (Baklor Fault shown in Fig. l), while subevents 6 and 7 are located between 30 km and 40 km to the east of the nucleation point assumed in our model. They are in good agreement with the Kabateh and Zard Goli fault segments observed by Berberian et al. (1992) and shown in Fig. 1.
As discussed in the previous section, the duration of slip Ty cannot be resolved from the observed data because models with different values of T, fit the data equally well as measured by the RMS criterion defined in eq. (2). The results of inversion using different values of Ty reveal a significant trade-off between the space and time distribution of slip on the fault. This trade-off has already been reported in previous studies by Kikuchi & Kanamori (1982, 1986, 1991) and Hwang & Kanamori (1992).
at EN
S BIO
LO
GIE
on September 2, 2014
http://gji.oxfordjournals.org/D
ownloaded from
44 J . Campos et al.
/
(a) P (Ts=6 S)
\
0 10 20 30 time (s)
A (b) SH (Ts=6 S)
...... . . . . . . . . ALE 3 &-.,.\ "\
K E V . 4 .... ........ .........
SSB 3 I .
. . . . . . . . . . . . ... :
TOL 3 .. . . . . . .
.̂.. . . . . . : . . . . . . . . ......
)/'
/
M B 0 3 W .. .:. ....... .... 163 mic
amp1
MI3 .... :... .
-....
+ l--r l
time (s) 0 10 20 30
Figure 13. (a) Comparison of observed and synthetic P-wave seismograms for the final model (m9) inverted in this study. (b) Comparison of observed and synthetic SH-wave seismograms for the final model (mu) inverted in this study.
at EN
S BIO
LO
GIE
on September 2, 2014
http://gji.oxfordjournals.org/D
ownloaded from
Rupture process of an Iranian earthquake 45
1
[1d9 1 .o
0.1
” . ”
‘ 8 I ” .
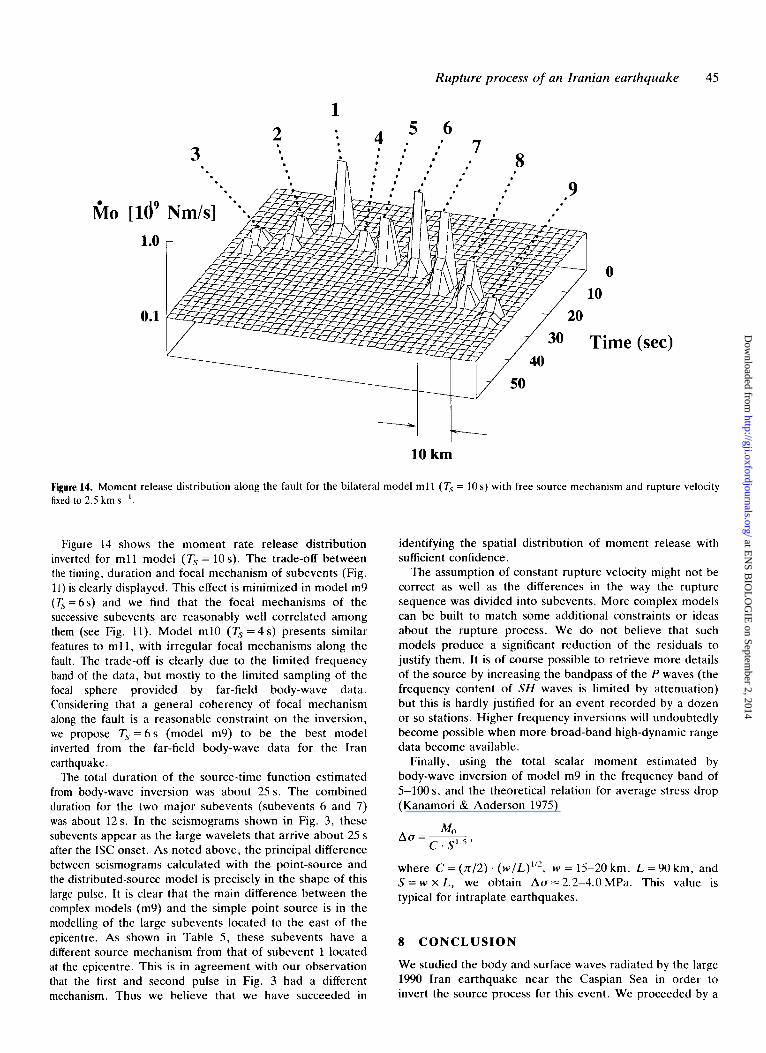
Figure 14. Moment release distribution along the fault for the bilateral model m l l (TI = 10 s) with free source mechanism and rupture velocity fixed to 2.5 km s- I .
Figure 14 shows the moment rate release distribution inverted for m l l model (7‘’ = 10 s). The trade-off between the timing, duration and focal mechanism of subevents (Fig. 11) is clearly displayed. This effect is minimized in model mY (ry = 6 s) and we find that the focal mechanisms of the successive subevents are reasonably well correlated among them (see Fig. 11). Model m10 (7‘’ = 4 s) presents similar features to m l l , with irregular focal mechanisms along the fault. The trade-off is clearly due to the limited frequency band of the data, but mostly to the limited sampling of the focal sphere provided by far-field body-wave data. Considering that a general coherency of focal mechanism along the fault is a reasonable constraint on the inversion, we propose T y = 6 s (model my) t o be the best model inverted from the far-field body-wave data for the Iran earthquake.
The total duration of the source-time function estimated from body-wave inversion was about 25s. The combined duration for the two major subevents (subevents 6 and 7) was about 12s. In the seismograms shown in Fig. 3 , these subevents appear as the large wavelets that arrive about 25 s after the ISC onset. A s noted above, the principal difference between seismograms calculated with the point-source and the distributed-source model is precisely in the shape of this large pulse. It is clear that the main difference between the complex models (my) and the simple point source is in the modelling of the large subevents located to the east of the epicentre. As shown in Table 5 , these subevents have a different source mechanism from that of subevent 1 located at the epicentre. This is in agreement with our observation that the first and second pulse in Fig. 3 had a different mechanism. Thus we believe that we have succeeded in
identifying the spatial distribution of moment release with sufficient confidence.
The assumption of constant rupture velocity might not be correct as well as the differences in the way the rupture sequence was divided into subevents. More complex models can be built to match some additional constraints or ideas about the rupture process. We d o not believe that such models produce a significant reduction of the residuals to justify them. It is of course possible to retrieve more details of the source by increasing the bandpass of the P waves (the frequency content of SH waves is limited by attenuation) but this is hardly justified for an event recorded by a dozen or so stations. Higher frequency inversions will undoubtedly become possible when more broad-band high-dynamic range data become available.
Finally, using the total scalar moment estimated by body-wave inversion of model mY in the frequency band of 5-100 s, and the theoretical relation for average stress drop (Kanamori & Anderson 1975)
where C = ( n / 2 ) . ( w / L ) ’ ” , w = 15-20 km, L = Y O km, and S = w x L , we obtain Aa=2.2-4.0 MPa. This value is typical for intraplate earthquakes.
8 CONCLUSION
We studied the body and surface waves radiated by the large 1990 Iran earthquake near the Caspian Sea in order to invert the source process for this event. We proceeded by a
at EN
S BIO
LO
GIE
on September 2, 2014
http://gji.oxfordjournals.org/D
ownloaded from

46 J. Carnpos et al.
careful step-by-step inversion, increasing a t every step in the inversion the complexity of the model and checking from the quality of waveform fitting that the more complex models were justified.
An extended source model was finally determined once we were sure that such a model could significantly reduce the residuals. Our best model fits the data a t least 32 per cent better than a point-source model. Thus we have enough parallax in the data to determine the distribution of moment rate release along the fault of the earthquake as traced by geologists. Our result indicates that the event started with a small foreshock that cannot be resolved from broad-band data. The main rupture started about 10 s later with a large energy release near the epicentre and then proceeded bilaterally for about 10s in each direction around the epicentre. Rupture to the west stopped, but it continued to the east and about 10s later it was followed by the main source radiation that occurred about 40 km t o the east of the epicentre along the strike of the fault.
ACKNOWLEDGMENTS
This work was partially supported by the twinning of the Seismological Laboratories of the Universities of Trieste, Madrid, Institut d e Physique du Globe d e Paris and Instituto Geogrfifico Nacional d e EspaAa, under the Science Programme of the European Commission. While visiting Paris, Professor J. Nfibdek was supported by a grant from University of Paris 7. Professor B. Bukchin visited Paris invited by the French Ministry of Education under a n agreement with MITPAN. J. Campos is on leave from Departamento de Geofisica of Universidad d e Chile in Santiago. Publication IPGP 1313.
REFERENCES
Ambraseys, N.N., 1963. The Buyin-Zara September, 1962: a field report., Bull.
Ambraseys, N.N., 1968. Early earthquakes Bull. seism. SOC. A m . , 58, 458-496.
705-740.
(Iran) earthquake of seism. SOC. Am. , 53,
in north-central Iran,
Ambraseys, N.N. & Melville, C.P., 1982. A History of Persian Earthquakes, Cambridge University Press, Cambridge.
Berberian, M., Qorashi, M., Jackson, J.A., Priestley, K. & Wallace, T., 1992. The Rudbar-Tarom earthquake of 20 June 1990 in NW Persia: Preliminary field and seismological observations, and its tectonic significance, Bull. sekm. SOC. Am., 82, 1726-1755.
Dziewonski, A.M., Ekstrom, G., Woodhouse, J.H. & Zwart, G., 1991. Centroid-moment tensor solutions for April-June 1990, Phys. Earth planer. Inrer., 66, 133-143.
Ekstrom, G., 1989. A very broad band inversion method for the recovery of earthquake source parameters, Tecronophysics,
Ekstrom. G. & Dziewonski, A.M., 1985. Centroid-moment tensor solutions for 35 earthquakes in Western North America
166,73-100.
(1977-1983), Bull. seism. SOC. Am. , 75, 23-39. Giardini, D., 1992. Moment tensor inversion from Mednet data (1):
Large worldwide earthquakes of 1990, Geophys. Res. Lerr., 19,
Giardini, D., Boschi, E. & Palombo, B., 1993. Moment tensor inversion from Mednet data (2): Regional earthquakes of the Mediterranean, Geophys. Res. Lett., 20, 273-276.
Hwang, L.J. & Kanamori, H., 1992. Rupture processes of the 1987-1988 Gulf of Alaska earthquake sequence, J. geophys. Res., 97, 19 881-19 908.
Jackson, D.D., 1979. The use of a priori data to resolve non-uniqueness in linear inversion, Geophys. J. R. astr. SOC.,
Jackson, J. & Fitch, T., 1981. Basement faulting and the focal depths of the larger earthquakes in the Zagros mountains (Iran), Geophys. J . R. mrr. SOC., 64, 561-586.
Jackson, J . & McKenzie, D., 1988. The relationship between plate motions and seismic moment tensors, and the rates of active deformation in the Mediterrranean and Middle East. Geophys. J. R. astr. SOC., 93, 45-73.
Kanamori, H. & Anderson, D.L., 1975. Theoretical basis of some empirical relations in seismology, Bull. seism. SOC. Am. , 65,
Kikuchi, M. & Kanamori, H., 1982. Inversion of complex body waves, Bull. seism. SOC. A m . , 72, 491-506.
Kikuchi, M. & Kanamori, H., 1986. Inversion of complex body waves-11, Phys. Earth planer. Inter., 43, 205-222.
Kikuchi, M. & Kanamori, H., 1991. Inversion of complex body waves-111, Bull. seism. SOC. A m . , 81, 2335-2350.
Madariaga, R., 1979. On the relation between seismic moment and stress drop in the presence of stress and strength heterogeneity, J. geophys. Res., 84, 2243-2250.
Moinfar, A.A. & Naderzadeh, A., 1990. An immediate and preliminary report on the Manjil, Iran earthquake of 20 June 1990, Building and Housing Research Center, Ministry of Housing and Urban Development, 119.
Ndbtlek, J.L., 1984. Determination of earthquake source parameters from inversion of body waves, PhD thesis, MIT, Cambridge, MA.
NAbElek, J., 1985. Geometry and mechanism of faulting of the 1980 el Asnam, Algeria, earthquake from inversion of teleseismic body waves and comparison with field observations, J. geophys. Res., 90, 12 713-12 728.
Ndbtlek, J., Chen, W.-P. & Ye, H., 1987. The Tangshan earthquake sequence and its implications for the evolution of North China Basin, J. geophys. Res., 92, 12615-12628.
Niazi, M. & Bozorgnia, Y., 1992. The 1990 Manjil, Iran, earthquake: geology and seismology overview, PGA attenua- tion, and observed damage, Bull. seism. SOC. A m . , 82, 774-799.
SuArez, G. & NdbElek, J., 1990. The 1967 Caracas earthquake: fault geometry, direction of rupture propagation and seismotectonic implications, 1. geophys. Res., 95, 17 459- 17 414.
Tarantola, A. & Valette, B., 1992. Generalized non-linear inverse problems solved using the least-squares criterion, Rev. Geophys., 20, 219-232.
Thio, H.K., Satake, K., Kikuchi, M. & Kanamori, H., 1990. On the Sudan, Iran and Phillipines earthquakes of 1990 (abstract), EOS, Trans. Am. geophys. Un., 71, 1438.
713-716.
57, 137-157.
1073- 1095.
at EN
S BIO
LO
GIE
on September 2, 2014
http://gji.oxfordjournals.org/D
ownloaded from
Copyright © 2022 FDOKUMEN