
Username = NO UPCM • Password = NO SLIP PEMBAYARAN NO UPCM NO SLIP
1
Seismic slip deficit in the Kashmir Himalaya from GPS observations Celia Schiffman1, Bikram Singh Bali2, Walter Szeliga3, and Roger Bilham1
1. CIRES and Geol. Sciences, University of Colorado, Boulder 80309-0399, 2. Department of Earth Sciences, University of Kashmir, Srinagar India, 190006 3. Central Washington University, Ellensburg, WA 98926 1. Key Points
• Kashmir convergence (12.5±1 mm/yr) includes 50% sinistral range parallel shear). • The slip deficit in the 270-km-long Kashmir Seismic Gap accumulates at rate equivalent to one Mw=8.1 each century. • Locked décollement is 170-200 km wide and terminates in a ~23 km wide and 25±4 km deep partially locked zone. • Cumulative slip deficit since 1100AD may now be equivalent to a single Mw≈8.7 earthquake. • Mapped reverse faults could absorb the slip deficit in smaller earthquakes, but their known geological slip in the past 1000
years refutes this. 2. Abstract
GPS measurements in the Kashmir Himalaya reveal range-normal convergence of 11±1 mm/yr with sinistral shear of 5±1 mm/yr. The transition from a fully locked 170-km-wide décollement to the unrestrained descending Indian plate occurs at ~25 km depth over a ~23 km wide transition zone. The observed convergence rate is consistent with the lower bounds of geological estimates for the Main Frontal Thrust (MFT), Riasi, and Balapora fault systems on which no surface slip has been reported in the past millennium. Of the 14 damaging Kashmir earthquakes since 1123, none may have exceeded Mw=7.6. Therefore either a seismic moment deficit equivalent to a Mw≈8.7 earthquake currently exists, or the magnitudes of historical earthquakes have been underestimated. An alternative conclusion is that these earthquakes have occurred on reverse faults in the Kashmir Valley and the décollement has recently been inactive. Although this can reconcile the inferred and theoretical moment release, it is quantitatively inconsistent with observed fault slip in Kashmir. 3. Introduction
Between longitudes 75-77°E the Tibetan Plateau narrows to 500 km and the convergence rate between the Tarim Basin and the Indian craton falls to ~16 mm/yr [Zhang et al., 2004] (Fig. 1). GPS measurements between the Indian plate, Pir Pinjal, and Zanskar regions of Indian Kashmir following the 2005 Kashmir earthquake reveal that 75% of this
convergence (~12 mm/yr) is manifest in the southernmost 250 km of the mountains (Fig. 1). Thus the convergence rate in Kashmir is ~30% lower than the 16-18 mm/yr found in the central Himalaya and the contiguous Kangra region to the east [Avouac, 2003; Banerjee and Bürgmann, 2002; Jade et al., 2004].
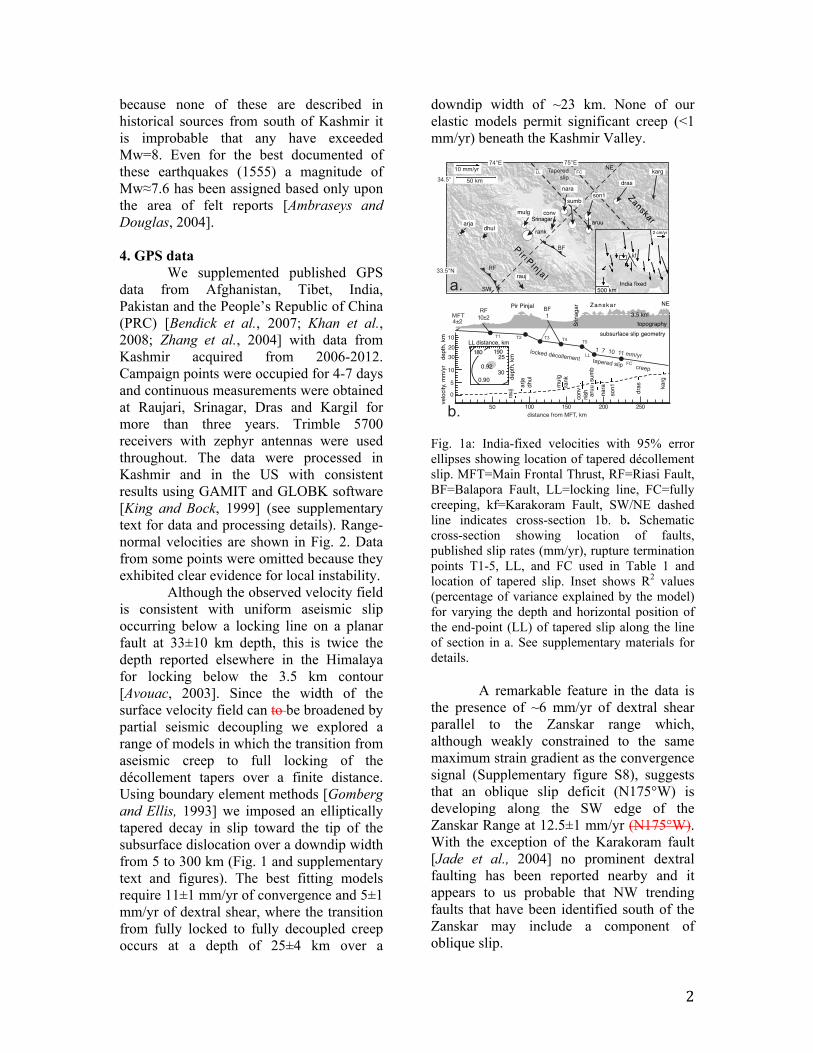
Hitherto it has been assumed that the northern edge of the Himalayan décollement west of the 1905 Kangra rupture follows the discontinuous 3.5 km elevation contour in the Pir Pinjal, however, the locus of maximum strain revealed by GPS measurements in Kashmir requires that this assumption be discarded. Instead we find that interseismic locking occurs beneath the 3.5 km elevation contour at the SW edge of the Zanskar range, and we infer that a locked décollement underlies the Kashmir Valley and the Pir Pinjal with a total down-dip width of 200 km in the west, narrowing eastward.
The 270 km along-arc distance between the 1905 Kangra earthquake and the 2005 Kashmir earthquake has been termed the "Kashmir seismic gap" [Khattri, 1999], due to the historical absence of great décollement ruptures here. Although several damaging earthquakes have occurred since 1132 AD the absence of quantitative data prevents accurate conclusions concerning magnitudes or rupture areas [Bilham et al., 2010; Bilham and Bali, 2013]. Four of the 13 known historical earthquakes before 1885 have been associated with several weeks of aftershocks suggesting their magnitudes may have exceeded Mw=7, but
2
because none of these are described in historical sources from south of Kashmir it is improbable that any have exceeded Mw=8. Even for the best documented of these earthquakes (1555) a magnitude of Mw≈7.6 has been assigned based only upon the area of felt reports [Ambraseys and Douglas, 2004]. 4. GPS data
We supplemented published GPS data from Afghanistan, Tibet, India, Pakistan and the People’s Republic of China (PRC) [Bendick et al., 2007; Khan et al., 2008; Zhang et al., 2004] with data from Kashmir acquired from 2006-2012. Campaign points were occupied for 4-7 days and continuous measurements were obtained at Raujari, Srinagar, Dras and Kargil for more than three years. Trimble 5700 receivers with zephyr antennas were used throughout. The data were processed in Kashmir and in the US with consistent results using GAMIT and GLOBK software [King and Bock, 1999] (see supplementary text for data and processing details). Range-normal velocities are shown in Fig. 2. Data from some points were omitted because they exhibited clear evidence for local instability.
Although the observed velocity field is consistent with uniform aseismic slip occurring below a locking line on a planar fault at 33±10 km depth, this is twice the depth reported elsewhere in the Himalaya for locking below the 3.5 km contour [Avouac, 2003]. Since the width of the surface velocity field can to be broadened by partial seismic decoupling we explored a range of models in which the transition from aseismic creep to full locking of the décollement tapers over a finite distance. Using boundary element methods [Gomberg and Ellis, 1993] we imposed an elliptically tapered decay in slip toward the tip of the subsurface dislocation over a downdip width from 5 to 300 km (Fig. 1 and supplementary text and figures). The best fitting models require 11±1 mm/yr of convergence and 5±1 mm/yr of dextral shear, where the transition from fully locked to fully decoupled creep occurs at a depth of 25±4 km over a
downdip width of ~23 km. None of our elastic models permit significant creep (<1 mm/yr) beneath the Kashmir Valley.
Fig. 1a: India-fixed velocities with 95% error ellipses showing location of tapered décollement slip. MFT=Main Frontal Thrust, RF=Riasi Fault, BF=Balapora Fault, LL=locking line, FC=fully creeping, kf=Karakoram Fault, SW/NE dashed line indicates cross-section 1b. b. Schematic cross-section showing location of faults, published slip rates (mm/yr), rupture termination points T1-5, LL, and FC used in Table 1 and location of tapered slip. Inset shows R2 values (percentage of variance explained by the model) for varying the depth and horizontal position of the end-point (LL) of tapered slip along the line of section in a. See supplementary materials for details. A remarkable feature in the data is the presence of ~6 mm/yr of dextral shear parallel to the Zanskar range which, although weakly constrained to the same maximum strain gradient as the convergence signal (Supplementary figure S8), suggests that an oblique slip deficit (N175°W) is developing along the SW edge of the Zanskar Range at 12.5±1 mm/yr (N175°W). With the exception of the Karakoram fault [Jade et al., 2004] no prominent dextral faulting has been reported nearby and it appears to us probable that NW trending faults that have been identified south of the Zanskar may include a component of oblique slip.
10 mm/yr
50 km
50 100 150 200 250distance from MFT, km
kf
T2 T3
locked décollement tapered slip creep
1 7 10 11 mm/yr
RF10±2MFT
4±2
500 km
T4 T5T1
LL
FC
5
0
10
velo
city,
mm
/yr
25
30
180 190
0.92
0.90 dept
h, k
m
LL distance, km
dept
h, k
m 10
3020
3.5 kmZanskarPir Pinjal NE
SW
2 cm/yr
subsurface slip geometry
nara
mulg
rank
sumb
aruu
RF
NE karg
topography
dras
son1
rauj
dhularja
Pi r P in ja l
Zanskar
BF1
BF
33.5°N
34.5°
India fixed
74°E 75°ELL FC
a.
b.
karg
dras
son1
nara
aruu
sum
b
conv
nish
mul
gra
nk
arja
dhul
Srin
agar
Srinagarconv
Tapered slip
rauj
3
5. Structure and faulting
Three significant fault systems accommodate convergence between the Zanskar range and the Indian craton (Fig. 2). No surface faulting has been reported from the Main Frontal Thrust (MFT) at the foot of the Pir Pinjal. Anticlinal structures here suggest that convergence in the past 15 ka at 2-6 mm/yr has been accommodated by folding of surface sediments [Vignon, 2011]. A 70-km-long strand of the Riasi fault dips 45° NE on the SE flank of the Pir Pinjal (Fig. 2) and has been interpreted to represent the southeast extension of the Balakot-Bagh fault [Shah, 2013; Thakur et al., 2010; Vignon, 2011]. Vignon [2011] reports a N/S shortening rate of 10±2 mm/yr near Riasi assuming an ~E/W strike and a 45° dip. The ~40-km-long Balapora reverse fault dips ~60°NE near the surface and forms one of three conspicuous scarps that offset Karewa sediments in the SE Kashmir Valley [Ahmad et al., 2013; Shah, 2013]. Paleoseismic investigations of the Balapora fault reveal a shortening rate of 0.3-1.3 mm/yr. The date of most recent slip on the Balapora fault is probably >1 ka [Meigs et al., 2012]. Vignon [2011] interprets the Balapora fault as a wedge thrust overlying a SE dipping antithetic fault (dashed in Fig. 1b). It is possible that slip of the Balapora fault primarily records flexure of the Kashmir Basin [Burbank and Johnson, 1983] and thus provides a misleading measure of the convergence between the Zanskar range and the descending Indian plate.
The lower range of these combined shortening rates (15±5 mm/yr) is consistent with our observed oblique convergence rate of 12.5±1 mm/yr (Fig. 1), but since none of these faults are reported to have slipped in the past 900 years a current slip deficit of >11 m may exist. 6. Discussion: Rupture scenarios
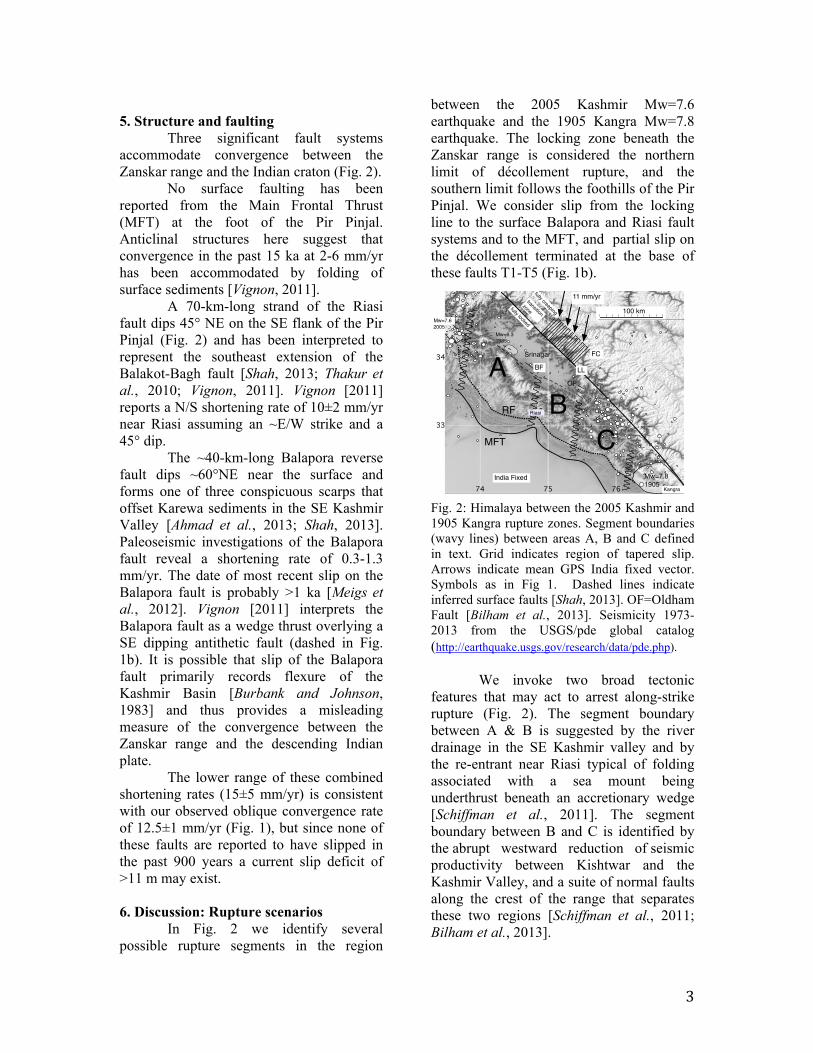
In Fig. 2 we identify several possible rupture segments in the region
between the 2005 Kashmir Mw=7.6 earthquake and the 1905 Kangra Mw=7.8 earthquake. The locking zone beneath the Zanskar range is considered the northern limit of décollement rupture, and the southern limit follows the foothills of the Pir Pinjal. We consider slip from the locking line to the surface Balapora and Riasi fault systems and to the MFT, and partial slip on the décollement terminated at the base of these faults T1-T5 (Fig. 1b).
Fig. 2: Himalaya between the 2005 Kashmir and 1905 Kangra rupture zones. Segment boundaries (wavy lines) between areas A, B and C defined in text. Grid indicates region of tapered slip. Arrows indicate mean GPS India fixed vector. Symbols as in Fig 1. Dashed lines indicate inferred surface faults [Shah, 2013]. OF=Oldham Fault [Bilham et al., 2013]. Seismicity 1973-2013 from the USGS/pde global catalog (http://earthquake.usgs.gov/research/data/pde.php).
We invoke two broad tectonic features that may act to arrest along-strike rupture (Fig. 2). The segment boundary between A & B is suggested by the river drainage in the SE Kashmir valley and by the re-entrant near Riasi typical of folding associated with a sea mount being underthrust beneath an accretionary wedge [Schiffman et al., 2011]. The segment boundary between B and C is identified by the abrupt westward reduction of seismic productivity between Kishtwar and the Kashmir Valley, and a suite of normal faults along the crest of the range that separates these two regions [Schiffman et al., 2011; Bilham et al., 2013].
MFT
767574
100 km
Srinagar34
33
BF
RF
Mw=7.62005
Mw=6.31885
OF
Mw=7.81905
AB
C
11 mm/yr
India FixedKangra
transition
zonefully locked
fully creeping
LL
FC
Riasi
4
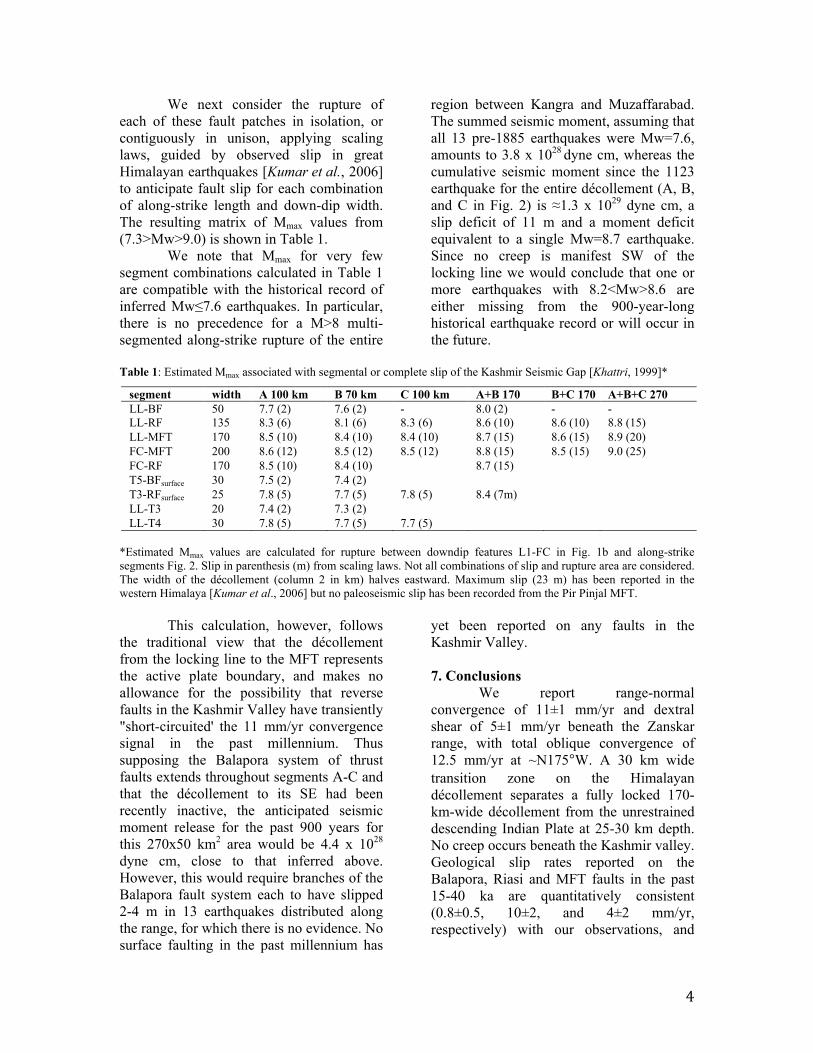
We next consider the rupture of each of these fault patches in isolation, or contiguously in unison, applying scaling laws, guided by observed slip in great Himalayan earthquakes [Kumar et al., 2006] to anticipate fault slip for each combination of along-strike length and down-dip width. The resulting matrix of Mmax values from (7.3>Mw>9.0) is shown in Table 1. We note that Mmax for very few segment combinations calculated in Table 1 are compatible with the historical record of inferred Mw≤7.6 earthquakes. In particular, there is no precedence for a M>8 multi-segmented along-strike rupture of the entire
region between Kangra and Muzaffarabad. The summed seismic moment, assuming that all 13 pre-1885 earthquakes were Mw=7.6, amounts to 3.8 x 1028 dyne cm, whereas the cumulative seismic moment since the 1123 earthquake for the entire décollement (A, B, and C in Fig. 2) is ≈1.3 x 1029 dyne cm, a slip deficit of 11 m and a moment deficit equivalent to a single Mw=8.7 earthquake. Since no creep is manifest SW of the locking line we would conclude that one or more earthquakes with 8.2<Mw>8.6 are either missing from the 900-year-long historical earthquake record or will occur in the future.
Table 1: Estimated Mmax associated with segmental or complete slip of the Kashmir Seismic Gap [Khattri, 1999]*
*Estimated Mmax values are calculated for rupture between downdip features L1-FC in Fig. 1b and along-strike segments Fig. 2. Slip in parenthesis (m) from scaling laws. Not all combinations of slip and rupture area are considered. The width of the décollement (column 2 in km) halves eastward. Maximum slip (23 m) has been reported in the western Himalaya [Kumar et al., 2006] but no paleoseismic slip has been recorded from the Pir Pinjal MFT.
This calculation, however, follows the traditional view that the décollement from the locking line to the MFT represents the active plate boundary, and makes no allowance for the possibility that reverse faults in the Kashmir Valley have transiently "short-circuited' the 11 mm/yr convergence signal in the past millennium. Thus supposing the Balapora system of thrust faults extends throughout segments A-C and that the décollement to its SE had been recently inactive, the anticipated seismic moment release for the past 900 years for this 270x50 km2 area would be 4.4 x 1028 dyne cm, close to that inferred above. However, this would require branches of the Balapora fault system each to have slipped 2-4 m in 13 earthquakes distributed along the range, for which there is no evidence. No surface faulting in the past millennium has
yet been reported on any faults in the Kashmir Valley. 7. Conclusions
We report range-normal convergence of 11±1 mm/yr and dextral shear of 5±1 mm/yr beneath the Zanskar range, with total oblique convergence of 12.5 mm/yr at ~N175°W. A 30 km wide transition zone on the Himalayan décollement separates a fully locked 170-km-wide décollement from the unrestrained descending Indian Plate at 25-30 km depth. No creep occurs beneath the Kashmir valley. Geological slip rates reported on the Balapora, Riasi and MFT faults in the past 15-40 ka are quantitatively consistent (0.8±0.5, 10±2, and 4±2 mm/yr, respectively) with our observations, and
segment width \length
A 100 km B 70 km C 100 km A+B 170 B+C 170 A+B+C 270 LL-BF 50 7.7 (2) 7.6 (2) - 8.0 (2) - -
LL-RF 135 8.3 (6) 8.1 (6) 8.3 (6) 8.6 (10) 8.6 (10) 8.8 (15) LL-MFT 170 8.5 (10) 8.4 (10) 8.4 (10) 8.7 (15) 8.6 (15) 8.9 (20) FC-MFT 200 8.6 (12) 8.5 (12) 8.5 (12) 8.8 (15) 8.5 (15) 9.0 (25) FC-RF 170 8.5 (10) 8.4 (10) 8.7 (15) T5-BFsurface 30 7.5 (2) 7.4 (2) T3-RFsurface 25 7.8 (5) 7.7 (5) 7.8 (5) 8.4 (7m) LL-T3 20 7.4 (2) 7.3 (2) LL-T4 30 7.8 (5) 7.7 (5) 7.7 (5)
5
therefore it is probable these faults absorb the entire long-term convergence signal. Since no surface slip is reported to have occurred in the past millennium we may conclude that a slip deficit of ~11 m exists, which were the entire décollement, or ~250 km of the Riasi fault, to slip between 74° and 76°E could do so now in a 8.5<Mw<8.7 earthquake. The maximum slip recorded on the MFT to the east is ~23 m [Kumar et al., 2010] hence Mmax for a Kashmir gap-filling earthquake could be 8.8<Mw<9.0. Although the recurrence interval for such earthquakes would be 1200 years on the Riasi fault and >1800 years on the MFT, no quantitative evidence for such a large earthquake is currently known in Kashmir's history. However, if we consider that the plate boundary has been recently short-circuited by reverse faults in the Kashmir Valley, and that the Riasi fault and the frontal fold system has been inactive in recent history, then fourteen Mw≈7.6 earthquakes would be sufficient to satisfy the lower anticipated cumulative moment release. Arguing against this alternative interpretation, of the fourteen damaging earthquakes that have occurred in the period 1123-1885, only the 1555 earthquake is believed to have been Mw~7.6, none have resulted in observed surface slip, and it is possible that the faults in the Kashmir Valley are secondary features that do not actively participate in underthrusting of the Indian plate. Since 1132, damaging earthquakes have been reported in the Kashmir Valley with a mean recurrence interval of 54±97 years, and it is now 108 years since the most recent (Mw<6.5 in Baramula). The absence of a recent damaging earthquake suggests that a 6.5<Mw<7.6 earthquake in the valley should be anticipated, and a much larger earthquake, though of low probability, cannot yet be excluded. 8. Acknowledgments
The measurements were made possible by a collaborative project between the Universities of Colorado and Kashmir. Funding was awarded by the
National Science Foundation EAR 0739081 and by the Ministry of Earth Sciences, India.
9. References
Ahmad, S., M. I. Bhat, C. Madden, and B. S. Bali (2013), Geomorphic analysis reveals active tectonic deformation on the eastern flank of the Pir Panjal Range, Kashmir Valley, India, Arabian Journal of Geosciences, doi:10.1007/s12517-013-0900-y
Ambraseys, N., and J. Douglas (2004), Magnitude calibration of north Indian earthquakes, Geophysical Journal International, 159(1), 165-206, doi:10.111/j.1365-246X.2004.02323.x.
Avouac, J. P. (2003), Mountain building, erosion, and the seismic cycle in the Nepal Himalaya, in Advances in Geophysics, Vol 46, edited by R. Dmowska, pp. 1-80, doi:10.1016/S0065-2687(03)46001-9.
Banerjee, P., and R. Bürgmann (2002), Convergence across the northwest Himalaya from GPS measurements, Geophysical Research Letters, 29(13), 30-31-30-34, doi: 10.1029/2002GL015184.
Bilham, R., B. S. Bali, M. I. Bhat, and S. Hough (2010), Historical earthquakes in Srinagar, Kashmir: Clues from the Shiva Temple at Pandrethan, in Ancient Earthquakes, edited by M. Sintubin, I. S. Stewart, T. M. Niemi and E. Altunel, pp. 107-117, GSA, doi:10.1130/2010.2471(10).
Bilham, R. & B. S. Bali, A Ninth Century Earthquake-Induced Landslide and Flood in the Kashmir Valley, and Earthquake Damage to Kashmir's Medieval Temples, Bull. Earthquake Eng (2013)
Bilham, R., B. S. Bali, S. Ahmad, and C. R. Schiffman (2013), Oldham's Lost Fault, Seismological Research Letters, 84(4), 702-710, doi:10.1785/0220130036.
Burbank, D. W., and G. D. Johnson (1983), The late Cenozoic chronologic and stratigraphic development of the Kashmir intermontane basin, northwestern Himalaya, Palaeogeography, Palaeoclimatology, Palaeoecology, 43(3), 205-235.
Gomberg, J. S., and M. Ellis (1993), 3D-DEF: a User's Manual: A Three-dimensional, Boundary Element Modeling Program, 15 pp., US Geological Survey.
Jade, S., B. Bhatt, Z. Yang, R. Bendick, V. Gaur, P. Molnar, M. Anand, and D. Kumar (2004), GPS measurements from the Ladakh Himalaya, India: Preliminary tests of plate-like or continuous deformation in Tibet, Geological Society of America Bulletin, 116(11-12), 1385-1391.
Jones, E. (1885), Notes on the Kashmir earthquake of 30th May 1885, Records Geol. Surv. India, 18, 153-156.
Khan, M. A., R. Bendick, M. I. Bhat, R. Bilham, D. M. Kakar, S. F. Khan, S. H. Lodi, M. S. Qazi, B. Singh, and W. Szeliga (2008), Preliminary geodetic constraints on plate boundary deformation on the western edge of the Indian plate from TriGGnet (Tri-University GPS Geodesy Network), Journal of Himalayan Earth Sciences, 41, 71-87.
Khattri, K. (1999), Probabilities of occurrence of great earthquakes in the Himalaya, Proceedings of the Indian Academy of Sciences-Earth and Planetary Sciences, 108(2), 87-92.
6
King, R. W., and Y. Bock (1999), Documentation for the GAMIT GPS analysis softwareRep., Cambridge, Massachusetts
Kumar, S., S.G. Wesnousky, TK Rockwell, RW Briggs, VC Thakur, R Jayangondaperumal, (2006), Paleoseismic evidence of great surface rupture earthquakes along the Indian Himalaya. J. Geophys. Res., 111,B3, 1978–2012, doi:10.1029/2004JB003309.
Meigs, A., C. Madden, J. Yule, Y. Gavillot, A. Hebeler, A. Hussain, M. Bhat, A. Kausar, M. Malik, and S. Ramzan (2012), Pattern, rate, and timing of surface rupturing earthquakes across the northwest Himalaya, Journal of Himalayan Earth Sciences, 45(2), 111-114.
Schiffman, C. R., B. S. Bali, and R. Bilham (2011), Seismic Hazard Implications of a Vanished Punjab Mountain Rammed 100 km Beneath the Southeast End of the Kashmir Valley, paper presented at AGU Fall Meeting, San Francisco, CA.
Shah, A. A. (2013), Earthquake geology of Kashmir Basin and its implications for future large earthquakes, International Journal of Earth Sciences, 1-10, doi:10.1007/s00531-013-0874-8.
Thakur, V. C., R. Jayangondaperumal, and M. A. Malik (2010), Redefining Medlicott-Wadia's main boundary fault from Jhelum to Yamuna: An active fault strand of the main boundary thrust in northwest Himalaya, Tectonophysics, 489(1-4), 29-42, doi:10.1016/j.tecto.2010.03.014.
Vignon, V. (2011), Activité hors séquence des chevauchements dans la syntaxe nord-ouest himalayenne: apports de la modélisation analogique et quantification quaternaire par analyse morphotectonique, PhD thesis, Université de Grenoble, France.
Zhang, P.-Z., Z. Shen, M. Wang, W. Gan, R. Burgmann, P. Molnar, Q. Wang, Z. Niu, J. Sun, and J. Wu (2004), Continuous deformation of the Tibetan Plateau from global positioning system data, Geology, 32(9), 809-812, doi:10.1130/G20554.1.
1
7
1 Supplementary Materials (Schiffman et al., 2013) 1. Subsurface geometry
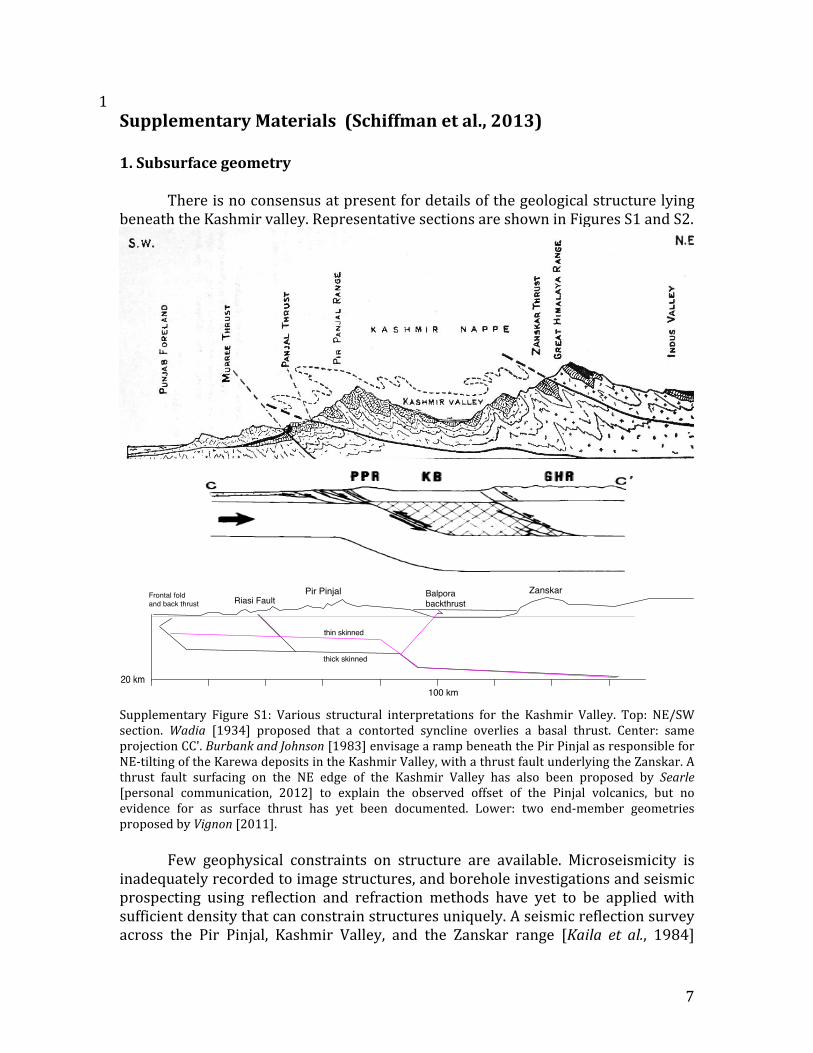
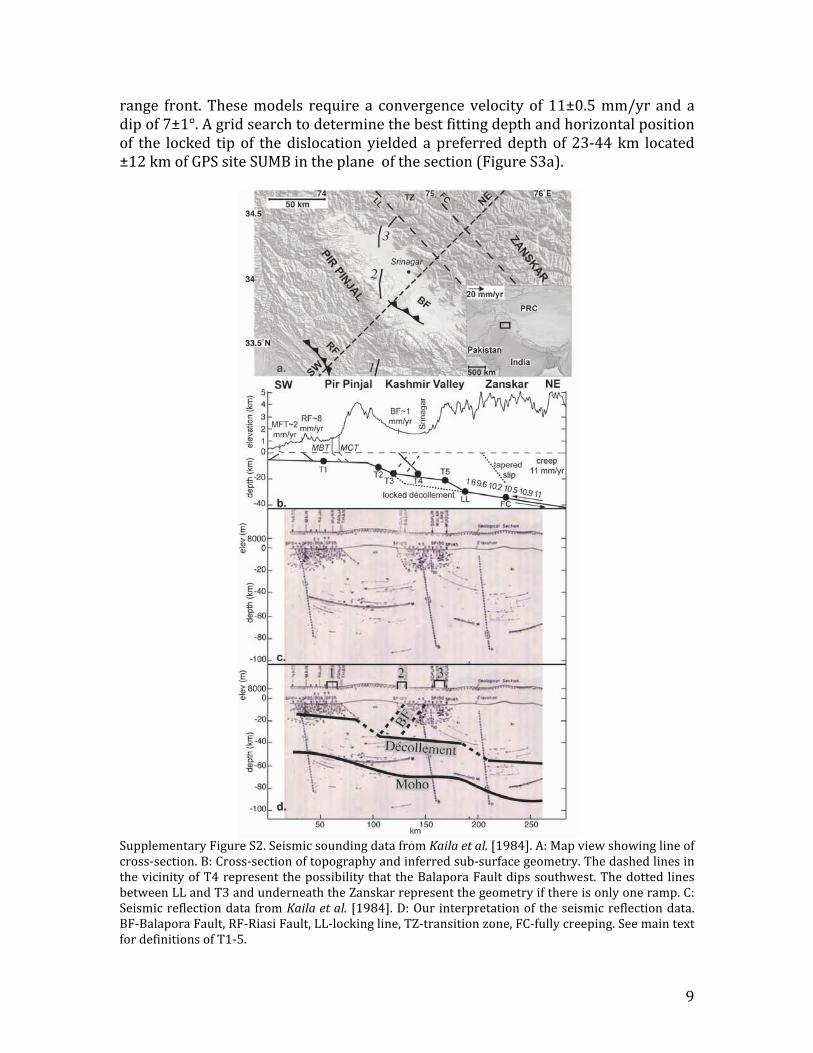
There is no consensus at present for details of the geological structure lying beneath the Kashmir valley. Representative sections are shown in Figures S1 and S2.
Supplementary Figure S1: Various structural interpretations for the Kashmir Valley. Top: NE/SW section. Wadia [1934] proposed that a contorted syncline overlies a basal thrust. Center: same projection CC'. Burbank and Johnson [1983] envisage a ramp beneath the Pir Pinjal as responsible for NE-‐tilting of the Karewa deposits in the Kashmir Valley, with a thrust fault underlying the Zanskar. A thrust fault surfacing on the NE edge of the Kashmir Valley has also been proposed by Searle [personal communication, 2012] to explain the observed offset of the Pinjal volcanics, but no evidence for as surface thrust has yet been documented. Lower: two end-‐member geometries proposed by Vignon [2011].
Few geophysical constraints on structure are available. Microseismicity is inadequately recorded to image structures, and borehole investigations and seismic prospecting using reflection and refraction methods have yet to be applied with sufficient density that can constrain structures uniquely. A seismic reflection survey across the Pir Pinjal, Kashmir Valley, and the Zanskar range [Kaila et al., 1984]
100 km
Riasi Fault
20 km
thin skinned
thick skinned
Balporabackthrust
Frontal foldand back thrust
Pir Pinjal Zanskar
8
(Figure S2) provides imagery of the subsurface geometry below part of our GPS velocity profile. The line includes several gaps and is ~20° oblique to our profile, and as a result provides ambiguous constraints on the interpretations of possible fault and ramp locations. For example, Kaila et al. [1984] interpreted an offset in the reflections beneath the Zanskar as a normal fault that would result in uplift of the Kashmir Valley relative to the Zanskar. We interpret this same feature as a fold, thrust, or a ramp beneath the Zanskar.
The surface projection of the Balapora Fault coincides with SW end of Kaila et al.’s [1984] Kashmir Valley seismic line, and provides no estimate of its dip. Madden et al. [2010] describe the Balapora Fault as a NE dipping reverse fault with a surface length of 40 km. In contrast, Vignon [2011] interprets the Balapora fault as the surface expression of a SW dipping antithetic fault (backthrust). The geodetic data are unable to distinguish between these possibilities. We note that the dip of the Balapora Fault does not affect our interseismic modeling results, and our suspicion that it is a minor secondary feature that most likely represents deformation only within the Kashmir Valley.
The geometry adopted in Figure S2b borrows from the above interpretations but provides no unique structure that can be used to unambiguously interpret the geodetic data. We note that the interseismic deformation field depends only on the depth and geometry of structures beneath the NE part of the Kashmir Valley (NE of the locking line), whereas the interpretation of seismic rupture is critically dependent on structures SW of the locking line. 2. Modeling Procedure
We describe here the stepwise approach we adopted in identifying a preferred subsurface geometry and slip distribution causal to the observed GPS velocity field in Kashmir. We assumed a subsurface dislocation in a uniform elastic half-‐space (ignoring the effects of surface topography) with a Poisson’s ratio of 0.25 and Young’s Modulus of 107 N/m2, and computed surface deformation using boundary element methods [Crouch and Starfield, 1983] as coded by Gomberg and Ellis [1993]. We tested models discussed below by comparing synthetic predictions against observed data using their weighted root mean square error (RMSE) as a discriminant:
RMSEweighted = (residual2
cov2)(n !1)!1
1
n
"
where the residual is the difference between the GPS and modeled velocity, cov is the covariance of each point, and n is the number of points.
2.1 Planar dislocation with uniform slip We first imposed slip on a buried planar dislocation dipping gently N225°E
with uniform slip embedded in an elastic half-‐space. N225°E is perpendicular to the range front azimuth from the mean strike of the 3.5 m contour and the Zanskar
9
range front. These models require a convergence velocity of 11±0.5 mm/yr and a dip of 7±1°. A grid search to determine the best fitting depth and horizontal position of the locked tip of the dislocation yielded a preferred depth of 23-‐44 km located ±12 km of GPS site SUMB in the plane of the section (Figure S3a).
Supplementary Figure S2. Seismic sounding data from Kaila et al. [1984]. A: Map view showing line of cross-‐section. B: Cross-‐section of topography and inferred sub-‐surface geometry. The dashed lines in the vicinity of T4 represent the possibility that the Balapora Fault dips southwest. The dotted lines between LL and T3 and underneath the Zanskar represent the geometry if there is only one ramp. C: Seismic reflection data from Kaila et al. [1984]. D: Our interpretation of the seismic reflection data. BF-‐Balapora Fault, RF-‐Riasi Fault, LL-‐locking line, TZ-‐transition zone, FC-‐fully creeping. See main text for definitions of T1-‐5.
10
We identify several outliers in the above fits, whose stability may be questioned for the following reasons: ARJA and DHUL lie south of the 2005 Kashmir earthquake and may include post seismic adjustments, RANK is installed in unstable sediments, and the local stability of RAUJ on a newly constructed building on a hillside south of the crest of the Pir Pinjal range is uncertain.
The preferred depth (33±10 km) is twice that reported elsewhere in the
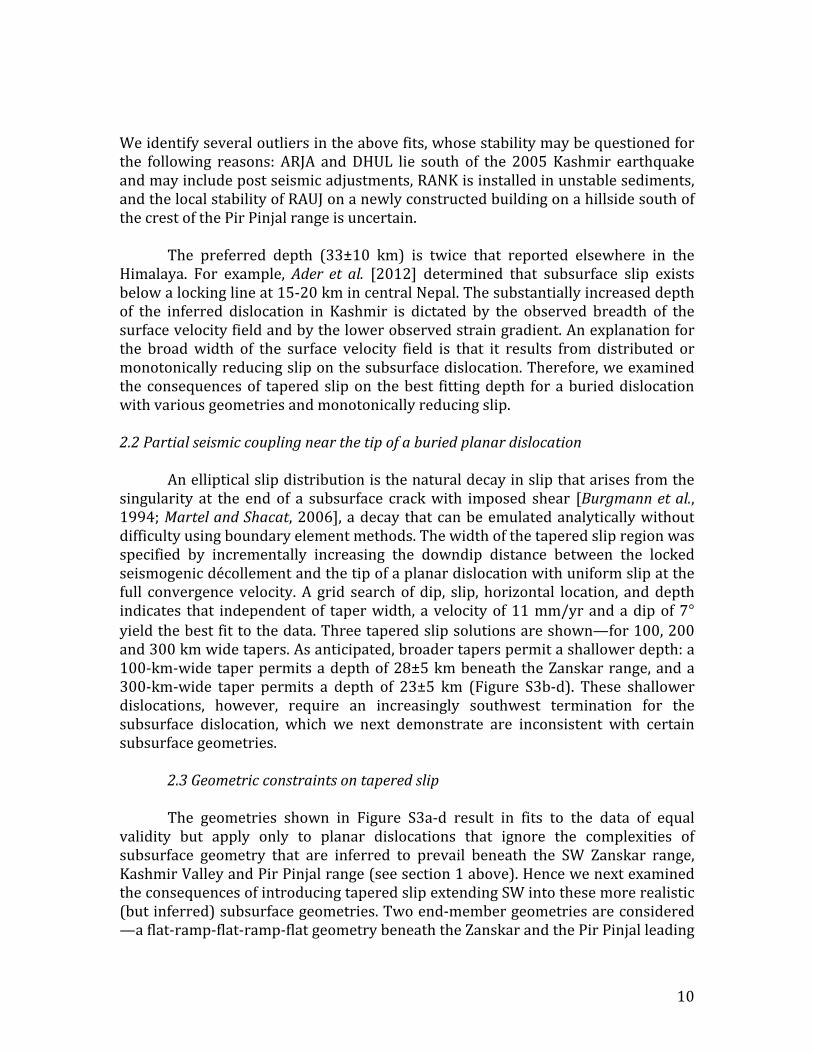
Himalaya. For example, Ader et al. [2012] determined that subsurface slip exists below a locking line at 15-‐20 km in central Nepal. The substantially increased depth of the inferred dislocation in Kashmir is dictated by the observed breadth of the surface velocity field and by the lower observed strain gradient. An explanation for the broad width of the surface velocity field is that it results from distributed or monotonically reducing slip on the subsurface dislocation. Therefore, we examined the consequences of tapered slip on the best fitting depth for a buried dislocation with various geometries and monotonically reducing slip. 2.2 Partial seismic coupling near the tip of a buried planar dislocation
An elliptical slip distribution is the natural decay in slip that arises from the
singularity at the end of a subsurface crack with imposed shear [Burgmann et al., 1994; Martel and Shacat, 2006], a decay that can be emulated analytically without difficulty using boundary element methods. The width of the tapered slip region was specified by incrementally increasing the downdip distance between the locked seismogenic décollement and the tip of a planar dislocation with uniform slip at the full convergence velocity. A grid search of dip, slip, horizontal location, and depth indicates that independent of taper width, a velocity of 11 mm/yr and a dip of 7° yield the best fit to the data. Three tapered slip solutions are shown—for 100, 200 and 300 km wide tapers. As anticipated, broader tapers permit a shallower depth: a 100-‐km-‐wide taper permits a depth of 28±5 km beneath the Zanskar range, and a 300-‐km-‐wide taper permits a depth of 23±5 km (Figure S3b-‐d). These shallower dislocations, however, require an increasingly southwest termination for the subsurface dislocation, which we next demonstrate are inconsistent with certain subsurface geometries.
2.3 Geometric constraints on tapered slip The geometries shown in Figure S3a-‐d result in fits to the data of equal
validity but apply only to planar dislocations that ignore the complexities of subsurface geometry that are inferred to prevail beneath the SW Zanskar range, Kashmir Valley and Pir Pinjal range (see section 1 above). Hence we next examined the consequences of introducing tapered slip extending SW into these more realistic (but inferred) subsurface geometries. Two end-‐member geometries are considered —a flat-‐ramp-‐flat-‐ramp-‐flat geometry beneath the Zanskar and the Pir Pinjal leading
11
to the frontal thrust in the Punjab, or a flat-‐ramp-‐flat beneath the Pir Pinjal, with an interseismically inactive thrust beneath the Zanskar Range (Figure S2b).
Supplementary Figure S3. Model best fits of varying taper widths for planar dislocations with
subsurface velocity distributions in mm/year. RMSE is root mean square error, and is defined in the text. Upper panels show subsurface velocities and geometry: lower panels show observed surface velocities with their uncertainties, with synthetic best-‐fitting model. Coordinates of station NARA are 34.29°N, 75.32°E. Horizontal position on the RMSE plots is the distance with respect to NARA on a N225°E line, which can be seen in Figure S2a.
12
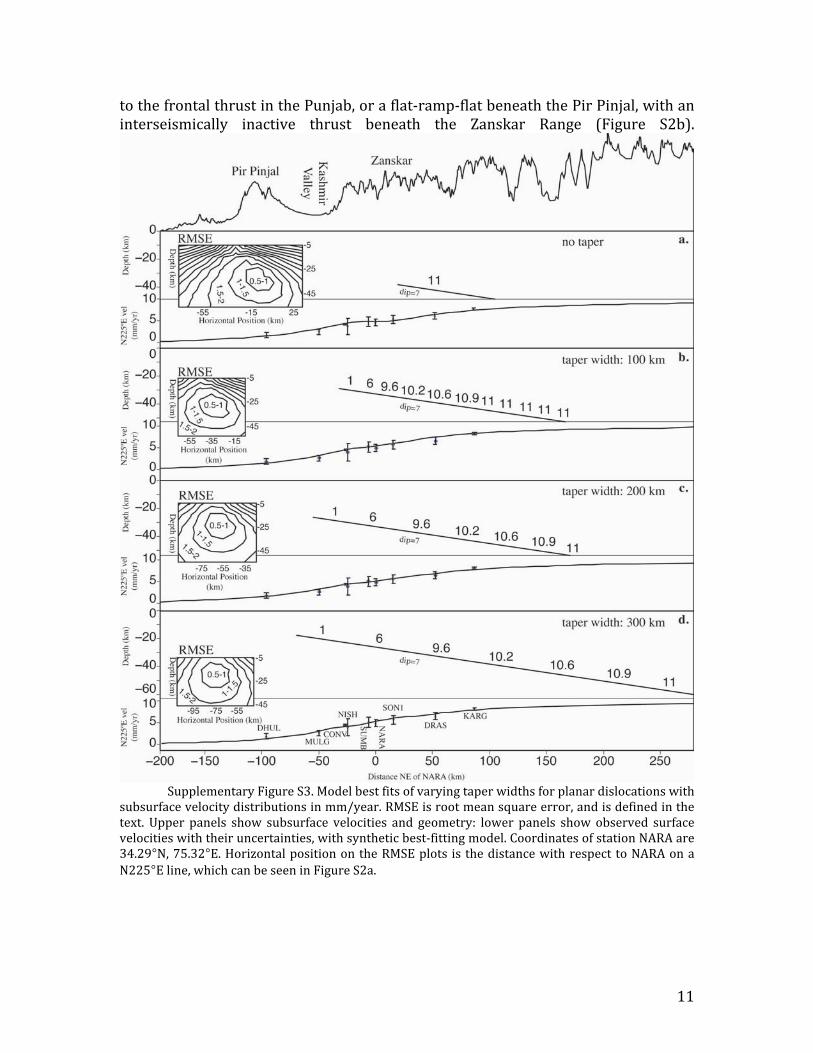
Figure S4. Model best fits of varying taper widths on a double-‐ramp subsurface geometry.
RMSE is root mean square error, and is defined in the text. Upper panels show subsurface planes and velocities in mm/yr. In the lower panels, GPS points are plotted with their uncertainties, and the solid line is the synthetic surface velocity field derived from the subsurface slip distribution shown in the top panel. Horizontal position on the RMSE plots is the distance with respect to NARA on a N225°E line, which can be seen in Figure S2a.
13
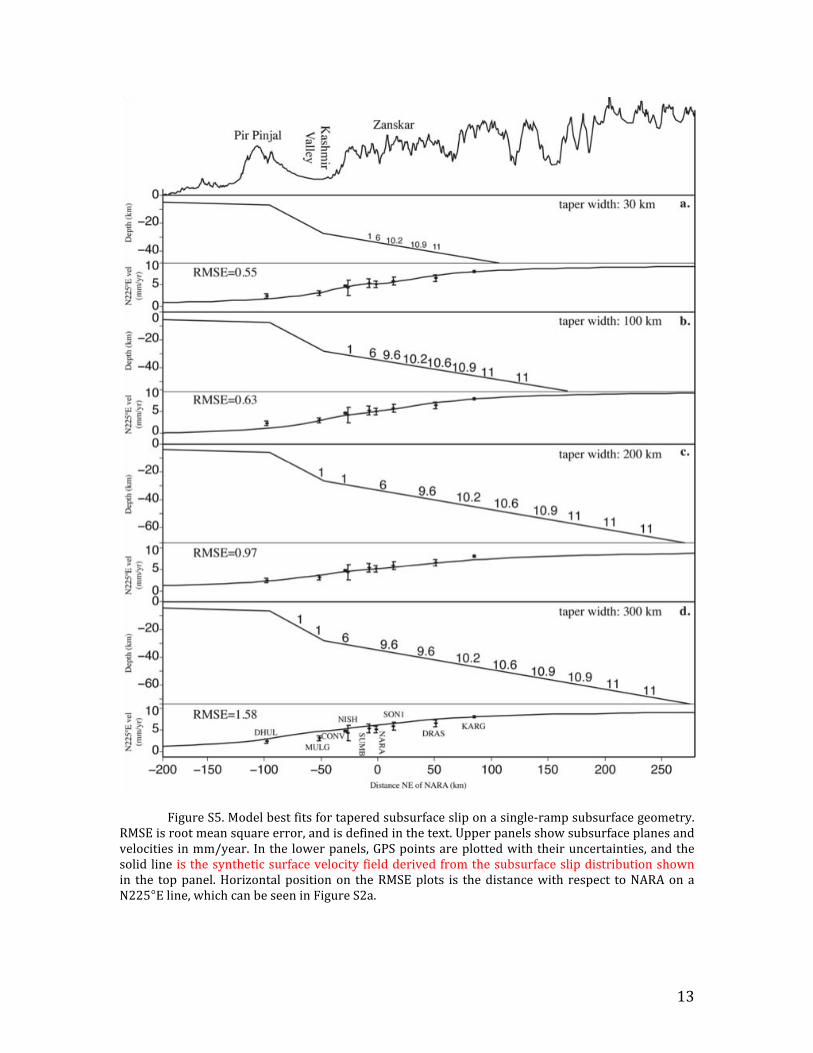
Figure S5. Model best fits for tapered subsurface slip on a single-‐ramp subsurface geometry.
RMSE is root mean square error, and is defined in the text. Upper panels show subsurface planes and velocities in mm/year. In the lower panels, GPS points are plotted with their uncertainties, and the solid line is the synthetic surface velocity field derived from the subsurface slip distribution shown in the top panel. Horizontal position on the RMSE plots is the distance with respect to NARA on a N225°E line, which can be seen in Figure S2a.
14
The preferred depths of the active dislocation are in part limited in these
models by the adopted geometry of the flat-‐ramp. Using a double ramp geometry, the fit worsens as the taper broadens and the tip of the dislocation moves under the Kashmir Valley (Figure S4). Based on these results, the broadest acceptable taper is 35 km for a flat-‐ramp bend beneath the Zanskar at ~30 km depth, giving a RMSE of 0.52 (versus 0.53 for no taper). For a single ramp geometry with its base at a depth of ~25km, a longer taper (~100 km) extending to the southwest edge of the Kashmir Valley (RMSE of 0.63) is possible. With a broader zone of tapered slip in the single ramp geometry, the SW tip of the dislocation moves up the ramp and the fit worsens significantly (Figure S5).
In summary, surface GPS data provide good constraints of convergence velocity (11±1 mm/yr) and dip (7±1°) for a planar dislocation, and a reasonably strong constraint on the locus of the transition from locking to creeping dislocation beneath the SW Zanskar range and NE of the Kashmir valley. Less well constrained is the depth of the dislocation, particularly if the dislocation tapers from full slip velocities to zero slip over a wide transition zone. If a transition zone is present, it permits slip to occur at a shallower depth (~23 km) and to extend a short distance (15 km) beneath the Kashmir Valley. Although some geometries for tapered slip on realistic subsurface geometries can be excluded, currently available structural constraints are unable to distinguish between a range of viable models.
Our preferred model adopts a double ramp geometry with tapered slip amounting to a width of no more than 35 km terminating beneath the NW edge of the Kashmir Valley at 25 km depth. This preferred solution requires a depth that is deeper than is typical along the central Himalaya, but a shallower transition to creep is quantitatively incompatible with the inferred geometry. A convergence velocity of 11±1 mm/yr is required by all models using 2005-‐2011 GPS data.
3. Range normal GPS velocities and strain partitioning In general the GPS vectors trend approximately 30° oblique to the Zanskar range front, suggesting approximately 6 mm/yr of sinistral shear (Figures S7 and S8). We compared synthetic models for oblique slip on the inferred 25 km deep transition zone, and although the solution is consistent with 6 mm/yr of shear the data are too noisy to uniquely assign sinistral slip to the transition zone (Figure S8). No surface sinistral faulting has been reported in the SW Zanskar or the Kashmir Valley, and none is evident in Google Earth imagery. 4. GPS processing
Our GPS data analysis methodology is as follows: first, we use daily GPS phase observations to estimate station position and atmospheric delay while holding IGS final orbits fixed to produce loosely constrained estimates of station positions and covariances using GAMIT version 10.40 [Herring et al., 2010a]. These loosely constrained estimates of station positions and covariances are then used as input to GLOBK version 5.19 [Herring et al., 2010b] to estimate a consistent set of station coordinates and velocities. We tie our regional measurements to an external
15
global reference frame by simultaneously processing phase data from 23 IGS stations, evenly distributed in azimuth relative to our network.
To account for correlated noise in our measurements, we estimate parameters for a first-‐order Gauss Markov process noise from each time series using the “real sigma” method [Herring, 2003; Reilinger et al., 2006]. These first-‐order Gauss-‐Markov parameters can then be used to formulate an equivalent random walk process noise model to be used in a final run of the GLOBK Kalman filter. This final GLOBK run produces a station velocity solution with realistic uncertainty estimates.
Comparison of the uncertainty estimates from GLOBK using the above procedures with the results of analysis of select time series using CATS [Williams, 2008] yields similar results.
We realize the ITRF2008 reference frame by minimizing the difference between the positions and velocities of our 23 processed IGS stations with those published in [Altamimi et al., 2011b], resulting in a post-‐fit RMS of 1.29 mm in position and 0.54 mm/yr in velocity. We then rotate our station velocities into an India-‐plate fixed reference frame using the pole-‐of-‐rotation parameters published in [Altamimi et al., 2011a].
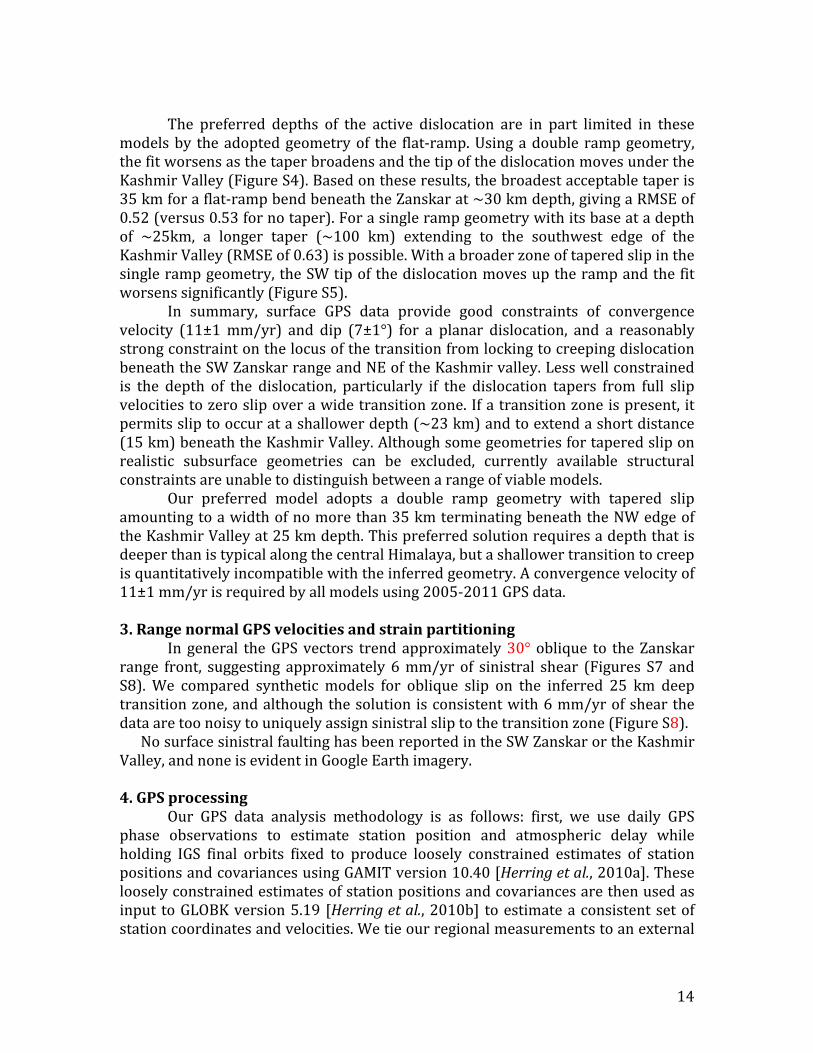
Figure S6. Smoothed contours of range-‐normal convergence velocities (i.e. the S55°W component of indicated observed GPS velocity vectors). KF-‐Karakoram Fault, MMT-‐Main Mantle Thrust, MCT-‐Main Central Thrust, MBT-‐Main Boundary Thrust, and MFT-‐Main Frontal Thrust. GPS data included from Jade et al. (2004).
16
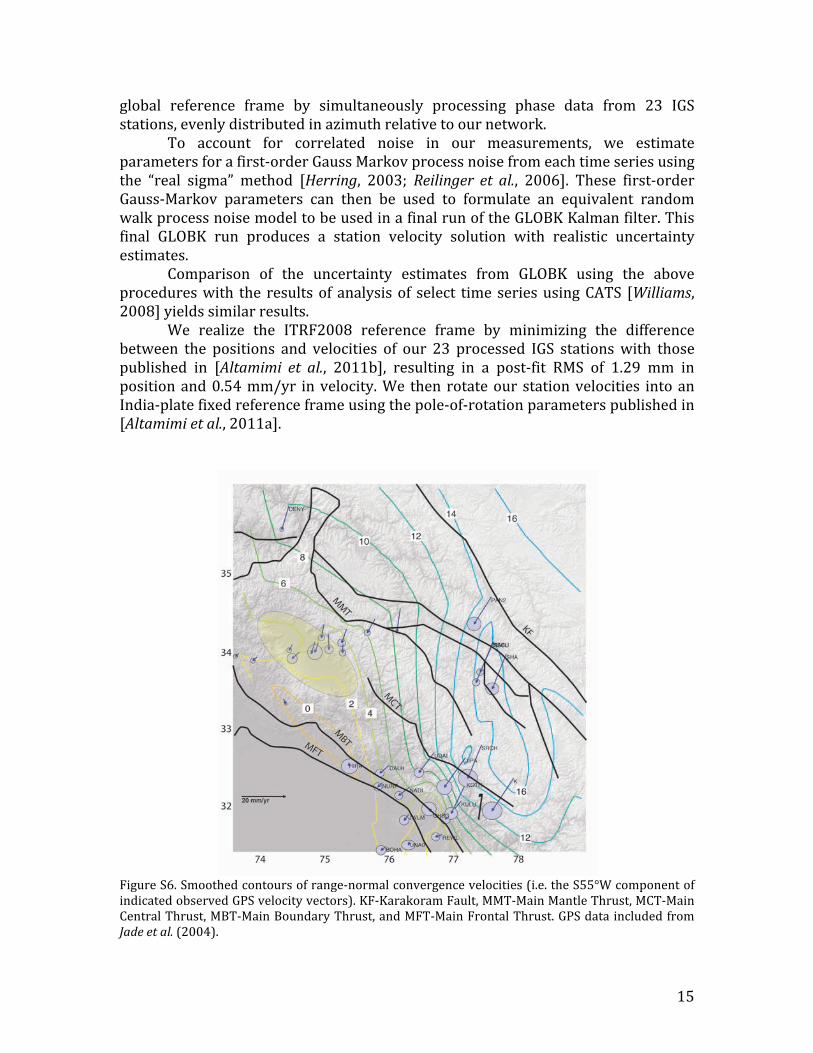
Figure S7. Smoothed contours of range-‐parallel shear velocities (i.e. the N145°E component of indicated observed GPS velocity vectors). KF-‐Karakoram Fault, MMT-‐Main Mantle Thrust, MCT-‐Main Central Thrust, MBT-‐Main Boundary Thrust, and MFT-‐Main Frontal Thrust. GPS data included from Jade et al. (2004).
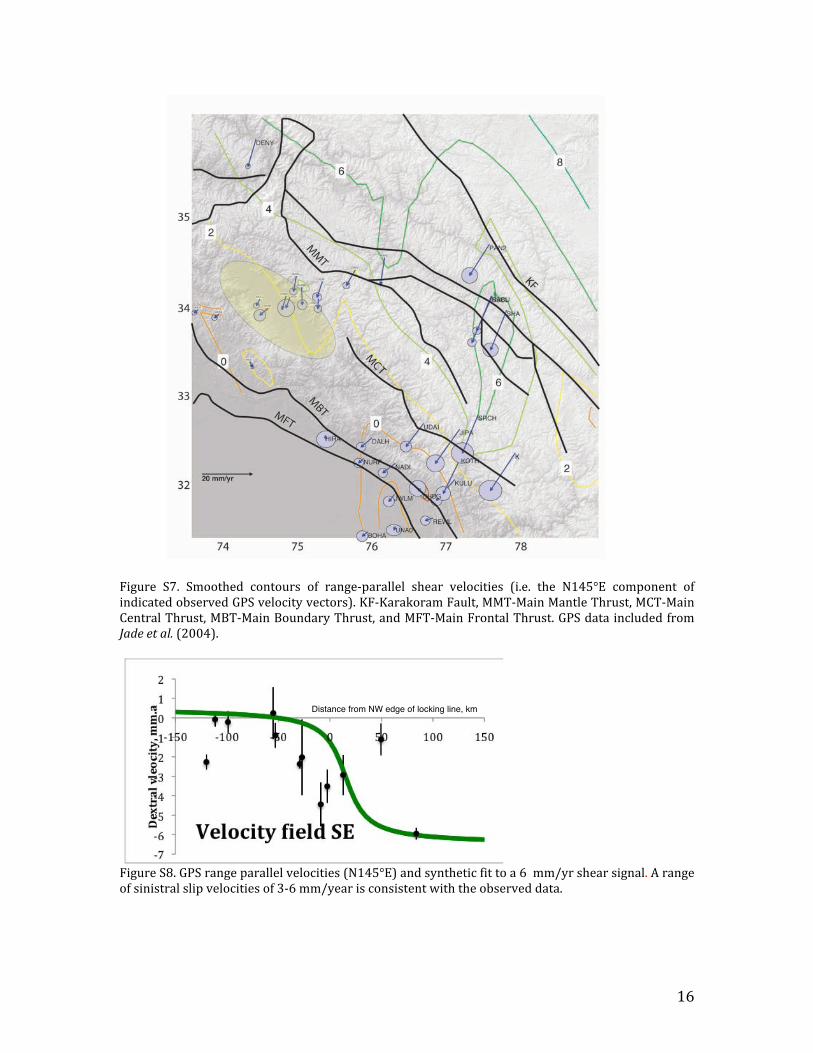
Figure S8. GPS range parallel velocities (N145°E) and synthetic fit to a 6 mm/yr shear signal. A range of sinistral slip velocities of 3-‐6 mm/year is consistent with the observed data.
Distance from NW edge of locking line, km
17
5. Etymology Various spellings are used for the faults we discuss. Balapora Fault: alternatives Balapor, Balapur, Balpura (From 8th century Bala Pura) Reasi Fault :alternative Riasi (From 8th century Rasyal, Bhimgarh, state) 6. References Ader, T., J.-‐P. Avouac, J. Liu-‐Zeng, H. Lyon-‐Caen, L. Bollinger, J. Galetzka, J. Genrich, M. Thomas, K.
Chanard, and S. N. Sapkota (2012), Convergence rate across the Nepal Himalaya and interseismic coupling on the Main Himalayan Thrust: Implications for seismic hazard, Journal of Geophysical Research, 117(B4).
Altamimi, Z., L. Métivier, and X. Collilieux (2011a), ITRF2008 plate motion model, Geophysical Research Abstracts, 13, AGU2011-‐4750.
Altamimi, Z., X. Collilieux, and L. Métivier (2011b), ITRF2008: An improved solution of the international terrestrial reference frame, Journal of Geodesy, 85, 457-‐473.
Burbank, D. W., and G. D. Johnson (1983), The late Cenozoic chronologic and stratigraphic development of the Kashmir intermontane basin, northwestern Himalaya, Palaeogeography, Palaeoclimatology, Palaeoecology, 43(3), 205-‐235.
Burgmann, R., D. D. Pollard, and S. J. Martel (1994), Slip distributions on faults-‐effects of stress gradients, inelastic deformation, heterogeneous host-‐rock stiffness, and fault interaction, Journal of Structural Geology, 16(12), 1675-‐1690.
Crouch, S., and A. Starfield (1983), Boundary element methods in solid mechanics: With applications in rock mechanics and geological engineering, Allen and Unwin, London and Boston.
Gomberg, J. S., and M. Ellis (1993), 3D-‐DEF: a User's Manual: A Three-‐dimensional, Boundary Element Modeling Program, 15 pp., US Geological Survey.
Herring, T. (2003), MATLAB tools for viewing GPS velocities and time series, GPS Solutions, 7, 194-‐199.
Herring, T., R. W. King, and S. McClusky (2010a), GAMIT reference manual, GPS analysis at MIT release 10.4, Rep., 171 pp, Dep. of Earth Atmos. and Planet. Sci., Mass. Inst. of Technol., Cambridge.
Herring, T., R. W. King, and S. McClusky (2010b), GLOBK: Global Kalman filter VLBI and GPS analysis program, release 10.4, Rep., 95 pp, Dep. of Earth Atmos. and Planet. Sci., Mass. Inst. of Technol., Cambridge.
Jade, S., B. Bhatt, Z. Yang, R. Bendick, V. Gaur, P. Molnar, M. Anand, and D. Kumar (2004), GPS measurements from the Ladakh Himalaya, India: Preliminary tests of plate-‐like or continuous deformation in Tibet, Geological Society of America Bulletin, 116(11-‐12), 1385-‐1391.
Kaila, K., K. Tripathi, and M. Dixit (1984), Structure along Wular Lake-‐Gulmarg-‐Naoshera profile across Pir Panjal Range of the Himalayas from deep seismic soundings, J. Geol. Soc. India, 25(11).
Madden, C., D. Trench, A. Meigs, S. Ahmad, M. Bhat, and J. Yule (2010), Late quaternary shortening and earthquake chronology of an active fault in the Kashmir Basin, Northwest Himalaya, Seismological Research Letters, 81(2), 346.
Martel, S. J., and C. Shacat (2006), Mechanics and interpretations of fault slip, Earthquakes: Radiated Energy and the Physics of Faulting, 207-‐215.
Reilinger, R., et al. (2006), GPS constraints on continental deformation in the Africa-‐Arabia-‐Eurasia continental collision zone and implications for the dynamics of plate interactions, Journal of Geophysical Research, 111(B05411).
Vignon, V. (2011), Activité hors séquence des chevauchements dans la syntaxe nord-‐ouest himalayenne: apports de la modélisation analogique et quantification quaternaire par analyse morphotectonique, Université de Grenoble.
Wadia, D. (1934), The Cambrian-‐Trias sequence of North-‐Western Kashmir (Parts of Muzaffarabad and Baramula district). Rec. Geol. Surv. Ind, 68, 121-‐176.
Williams, S. (2008), CATS: GPS coordinate time series analysis software, GPS Solutions, 12, 147-‐153.
Copyright © 2022 FDOKUMEN